the Creative Commons Attribution 4.0 License.
the Creative Commons Attribution 4.0 License.
 | 20 May 2020
Consistency and structural uncertainty of multi-mission GPS radio occultation records
Andrea K. Steiner
Florian Ladstädter
Chi O. Ao
Hans Gleisner
Shu-Peng Ho
Doug Hunt
Torsten Schmidt
Ulrich Foelsche
Gottfried Kirchengast
Ying-Hwa Kuo
Kent B. Lauritsen
Anthony J. Mannucci
Johannes K. Nielsen
William Schreiner
Marc Schwärz
Sergey Sokolovskiy
Stig Syndergaard
Jens Wickert
Atmospheric climate monitoring requires observations of high quality that conform to the criteria of the Global Climate Observing System (GCOS). Radio occultation (RO) data based on Global Positioning System (GPS) signals are available since 2001 from several satellite missions with global coverage, high accuracy, and high vertical resolution in the troposphere and lower stratosphere. We assess the consistency and long-term stability of multi-satellite RO observations for use as climate data records. As a measure of long-term stability, we quantify the structural uncertainty of RO data products arising from different processing schemes. We analyze atmospheric variables from bending angle to temperature for four RO missions, CHAMP, Formosat-3/COSMIC, GRACE, and Metop, provided by five data centers. The comparisons are based on profile-to-profile differences aggregated to monthly medians. Structural uncertainty in trends is found to be lowest from 8 to 25 km of altitude globally for all inspected RO variables and missions. For temperature, it is < 0.05 K per decade in the global mean and < 0.1 K per decade at all latitudes. Above 25 km, the uncertainty increases for CHAMP, while data from the other missions – based on advanced receivers – are usable to higher altitudes for climate trend studies: dry temperature to 35 km, refractivity to 40 km, and bending angle to 50 km. Larger differences in RO data at high altitudes and latitudes are mainly due to different implementation choices in the retrievals. The intercomparison helped to further enhance the maturity of the RO record and confirms the climate quality of multi-satellite RO observations towards establishing a GCOS climate data record.
- Article
(11395 KB) - Full-text XML
- BibTeX
- EndNote


Consistent and long-term stable observations are critically important for monitoring the Earth's changing climate. In the free atmosphere above the boundary layer, uncertainties across data sets can be substantial, and observations of thermodynamic variables are sparse, especially when considering measurements capable of detecting changes in the climate state. This was identified as a key issue in the Fifth Assessment Report of the Intergovernmental Panel on Climate Change (IPCC), stating the need for data with better accuracy for monitoring and detecting atmospheric climate change, particularly in the upper troposphere and in the stratosphere (Hartmann et al., 2013).
In order to ensure global homogenous and accurate measurements, the Global Climate Observing System (GCOS) program defined basic monitoring principles for climate data generation (GCOS, 2010a, b), and requirements for climate data records (CDRs) of essential climate variables (ECVs), such as air temperature (GCOS, 2016). A CDR is based on a series of instruments with sufficient calibration and quality control for the generation of homogeneous products. This means that separate data sets from different platforms must be directly comparable to give reliable long-term records, as well as accurate and stable enough for climate monitoring (GCOS, 2010a), which requires that the observations are traceable to standards of the international system of units (SI) (Ohring, 2007).
For climate observations, the accuracy requirement is much more stringent than for weather observations (Trenberth et al., 2013). However, the key attribute is long-term stability, defined as the extent to which the uncertainty of measurement remains constant with time (GCOS, 2016). The uncertainty of the measurement must be smaller than the signal expected for decadal change (Ohring et al., 2005; Bojinski et al., 2014). Accordingly, ECV product requirements for air temperature include global coverage, a vertical resolution of 1–2 km in the troposphere and the stratosphere, a horizontal resolution of 100 km, a measurement uncertainty of 0.5 K, and a stability of 0.05 K per decade (GCOS, 2016). For a definition of the metrological quantities we refer to Annex B of GCOS (2016) and to JCGM (2012).
Global Navigation Satellite System (GNSS) radio occultation (RO) has been identified as a key component for the GCOS due to its potential as a climate benchmark record (GCOS, 2011). Efforts of the RO community have been ongoing since the pioneering GPS/MET proof-of-concept mission in 1995 (Ware et al., 1996; Kursinski et al., 1997; Rocken et al., 1997; Steiner et al., 1999, 2001) to establish GNSS RO as an observing system for Earth's atmosphere and climate. Since 2001, continuous observations are available from several RO satellite missions with beneficial properties for climate use. Most missions have used only GPS signals so far, including the ones analyzed in this study; multi-GNSS use started with the Chinese FY-3C RO mission that also exploits BeiDou system (BDS) signals (Bai et al., 2018; Sun et al., 2018).
RO is a limb-sounding technique based on GNSS radio signals, which are refracted and retarded by the atmospheric refractivity field during their propagation to a receiver on a low-Earth orbit (LEO) satellite. An occultation event occurs when a GNSS satellite sets behind (or rises from behind) the horizon. Its signals are then occulted by the Earth's limb from the viewpoint of the receiver. The atmosphere is scanned vertically through the relative movements of the satellites, providing a good vertical resolution. RO accurately measures the Doppler shifts of the refracted signals by relying on precise atomic clocks, which enables traceability to the SI unit of the second (Leroy et al., 2006), long-term stability, and small uncertainties. Therefore, a seamless observation record can be formed using data from different missions without the need for intercalibration or temporal overlap (Foelsche et al., 2011; Angerer et al., 2017). Observations are available in nearly all weather conditions as signals in the L-band microwave range are not affected by clouds.
GNSS RO provides high-vertical-resolution profiles of atmospheric bending angle and refractive index that relate directly to temperature under dry atmospheric conditions, in which water vapor influence is negligible. For moist atmospheric conditions, in the troposphere, a priori information is needed in the retrieval. The vertical resolution is typically about 100 m in the lower troposphere to about 1 km in the stratosphere (Kursinski et al., 1997; Gorbunov et al., 2004). Zeng et al. (2019) established the vertical resolution as 100–200 m near the tropopause, about 500 m in the lower stratosphere at low to midlatitudes, and about 1.4 km at 22–27 km at high latitudes.
Data products comprise profiles and gridded fields of bending angle, refractivity, pressure, geopotential height, temperature, and specific humidity for use in atmosphere and climate studies (see the reviews of Anthes et al., 2011; Steiner et al., 2011; Ho et al., 2019a). Various derived quantities include planetary boundary layer height (e.g., Sokolovskiy et al., 2006; Xie et al., 2006; Guo et al., 2011; Ao et al., 2012; Ho et al., 2015), tropopause parameters (e.g., Randel et al., 2003; Schmidt et al., 2005, 2008; Rieckh et al., 2014), and geostrophic wind (e.g., Verkhoglyadova et al., 2014; Scherllin-Pirscher et al., 2014). RO provides atmospheric profiles with essentially independent information on altitude and pressure. This unique property ensures equivalent data quality on different vertical coordinates, i.e., mean sea level (m.s.l.) altitude, geopotential height, pressure levels, or potential temperature coordinates (Scherllin-Pirscher et al., 2017).
RO observations improve weather prediction (Healy et al., 2005; Aparicio and Deblonde, 2008; Cardinali, 2009; Cucurull, 2010; Cardinali and Healy, 2014) and hurricane forecasts (e.g., Huang et al., 2005; Kuo et al., 2008; Liu et al., 2012; Chen et al., 2015; Ho et al., 2019b). The RO data anchor atmospheric (re)analyses (Poli et al., 2010; Bauer et al., 2014; Simmons et al., 2017) and are useful for validating other types of observations (e.g., Steiner et al., 2007; He et al., 2009; Ladstädter et al., 2011, 2015; Ho et al., 2009a, 2010, 2017, 2018) and climate models (Ao et al., 2015; Pincus et al., 2017; Steiner et al., 2018). The importance of the RO record for climate monitoring grows with its increasing length (e.g., Steiner et al., 2009; Schmidt et al., 2010; Lackner et al., 2011; Steiner et al., 2011; Gleisner et al., 2015; Khaykin et al., 2017; Leroy et al., 2018).
An important prerequisite for CDRs is information on the uncertainties of the provided variables. For individual RO temperature profiles, the observational uncertainty estimate is 0.7 K in the tropopause region, slightly decreasing into the troposphere and gradually increasing into the stratosphere (Scherllin-Pirscher et al., 2011a, 2017). For monthly zonal-averaged temperature fields, the total uncertainty estimate is smaller than 0.15 K in the upper troposphere–lower stratosphere (UTLS) and up to 0.6 K at higher latitudes in wintertime (Scherllin-Pirscher et al., 2011b). Overall, the uncertainties of RO climatological fields are small compared to any other UTLS observing system for thermodynamic atmospheric variables. An overview of the main properties of RO is given in Steiner et al. (2011).
The systematic assessment of the accuracy and quality of RO records is the focus of joint studies by the RO Trends intercomparison working group, an international collaboration of RO processing centers since 2006 (http://irowg.org/projects/rotrends/, last access: 14 May 2020). The aim is to validate RO as a climate benchmark by comparing trends in RO products determined by different retrieval centers. This is assessed by quantifying the structural uncertainty in RO products arising from different processing schemes.
Structural uncertainty in an observational record arises due to different choices in processing and methodological approaches for constructing a data set from the same raw data (Thorne, 2005). The challenge is thus to quantify the true spread of physically possible solutions from a limited number of data sets. At least three independently processed data sets are regarded as necessary for an estimate of the structural uncertainty, but the more data sets the better. Thus, multiple independent efforts should be undertaken to create climate records.
In the first intercomparison studies, we have so far quantified the structural uncertainty of RO data from the CHAMP mission (CHAllenging Minisatellite Payload for geoscientific research) provided by different RO data centers. Profile-to-profile intercomparisons (Ho et al., 2009b, 2012) were based on exactly the same set of profiles from each data center. Complementarily, we compared RO gridded climate records based on the full set of profiles provided by each center and accounted for the different sampling (Steiner et al., 2013). The results for gridded CHAMP records were consistent with those for individual profiles. The structural uncertainty in the CHAMP RO record was found to be lowest in the tropics and midlatitudes at 8–25 km and to increase above and at high latitudes due to different choices in the retrievals.
Here we present an advanced assessment of the consistency of multiyear RO records for multiple satellite missions and for the full set of dry and moist atmospheric variables. We systematically intercompare RO data products provided by five international RO centers that are processing several or all available RO missions and that provide RO data for long-term records (from CHAMP to current RO missions). We quantify the structural uncertainty for nine RO climate variables from bending angle to temperature and specific humidity. The comparisons are based on profile-to-profile differences aggregated to monthly medians. We discuss the results with respect to GCOS stability requirements for climate variables. The quantification of structural uncertainty as one property of a climate benchmark data type is regarded as an essential advance towards a multiyear RO climate record.
In this respect, our study contributes to enhancing the maturity of RO data (Bates and Privette, 2012; Merchant et al., 2017), which is a goal of the RO-CLIM project (http://www.scope-cm.org/projects/scm-08/, last access: 14 May 2020) within the initiative on Sustained and COordinated Processing of Environmental satellite data for Climate Monitoring (SCOPE-CM). SCOPE-CM supports the coordination of international activities to generate CDRs. It is also a recommendation of the WMO/CGMS International RO Working Group (IROWG; http://www.irowg.org, last access: 14 May 2020) to establish RO-based CDRs at the quality standards of the GCOS climate monitoring principles (IROWG, 2018).
In the following, we give a concise description of the RO data sets and the data processing in Sect. 2. In Sect. 3 we describe the study setup and analysis method. We present and discuss results on the consistency and structural uncertainty of multi-satellite RO products in Sect. 3. Section 4 closes with a summary and conclusions.
2.1 RO missions and data
The first continuous RO measurements were provided by the German mission CHAMP from May 2001 to October 2008, tracking about 250 RO events per day with a BlackJack GPS receiver (Wickert et al., 2004, 2009). The US–German GRACE (Gravity Recovery and Climate Experiment) twin satellites (GRACE-A and GRACE-B) were launched in 2002 (Wickert et al., 2005; Beyerle et al., 2005). RO measurements have been provided since 2006, when the BlackJack receivers onboard GRACE were switched on. As the first constellation mission, the Taiwan–US Formosat-3/COSMIC (Constellation Observing System for Meteorology, Ionosphere, and Climate/Formosa Satellite Mission 3; denoted F3C hereafter) mission consists of six satellites for RO observations (Anthes et al., 2008). Launched in 2006, the Integrated GPS Occultation Receiver (IGOR) tracked both setting and rising occultations, resulting in about 500 RO events per day. The Metop series (Luntama et al., 2008) is operated by the European Organisation for the Exploitation of Meteorological Satellites (EUMETSAT). Metop-A has delivered data since the end of 2007 and Metop-B since spring 2013; Metop-C only started data delivery in early 2019. All three Metop satellites carry a GNSS receiver for Atmospheric Sounding (GRAS) with four dual-frequency channels for the simultaneous tracking of two rising and two setting events, yielding about 700 observed RO events per day.
Data from these four satellite missions have been delivered for the assessment of the consistency of multi-satellite RO records. The following processing centers provided reprocessed RO data products from bending angle to temperature for this study: Danish Meteorological Institute (DMI), Copenhagen, Denmark; German Research Centre for Geosciences (GFZ), Potsdam, Germany; Jet Propulsion Laboratory (JPL), Pasadena, CA, USA; University Corporation for Atmospheric Research (UCAR), Boulder, CO USA; and Wegener Center/University of Graz (WEGC), Graz, Austria. Each center has implemented an independently developed processing system for the retrieval of RO data products. While the basic steps in the retrieval (Kursinski et al., 1997) are essentially the same, different implementation options are chosen by the centers for specific processing steps.
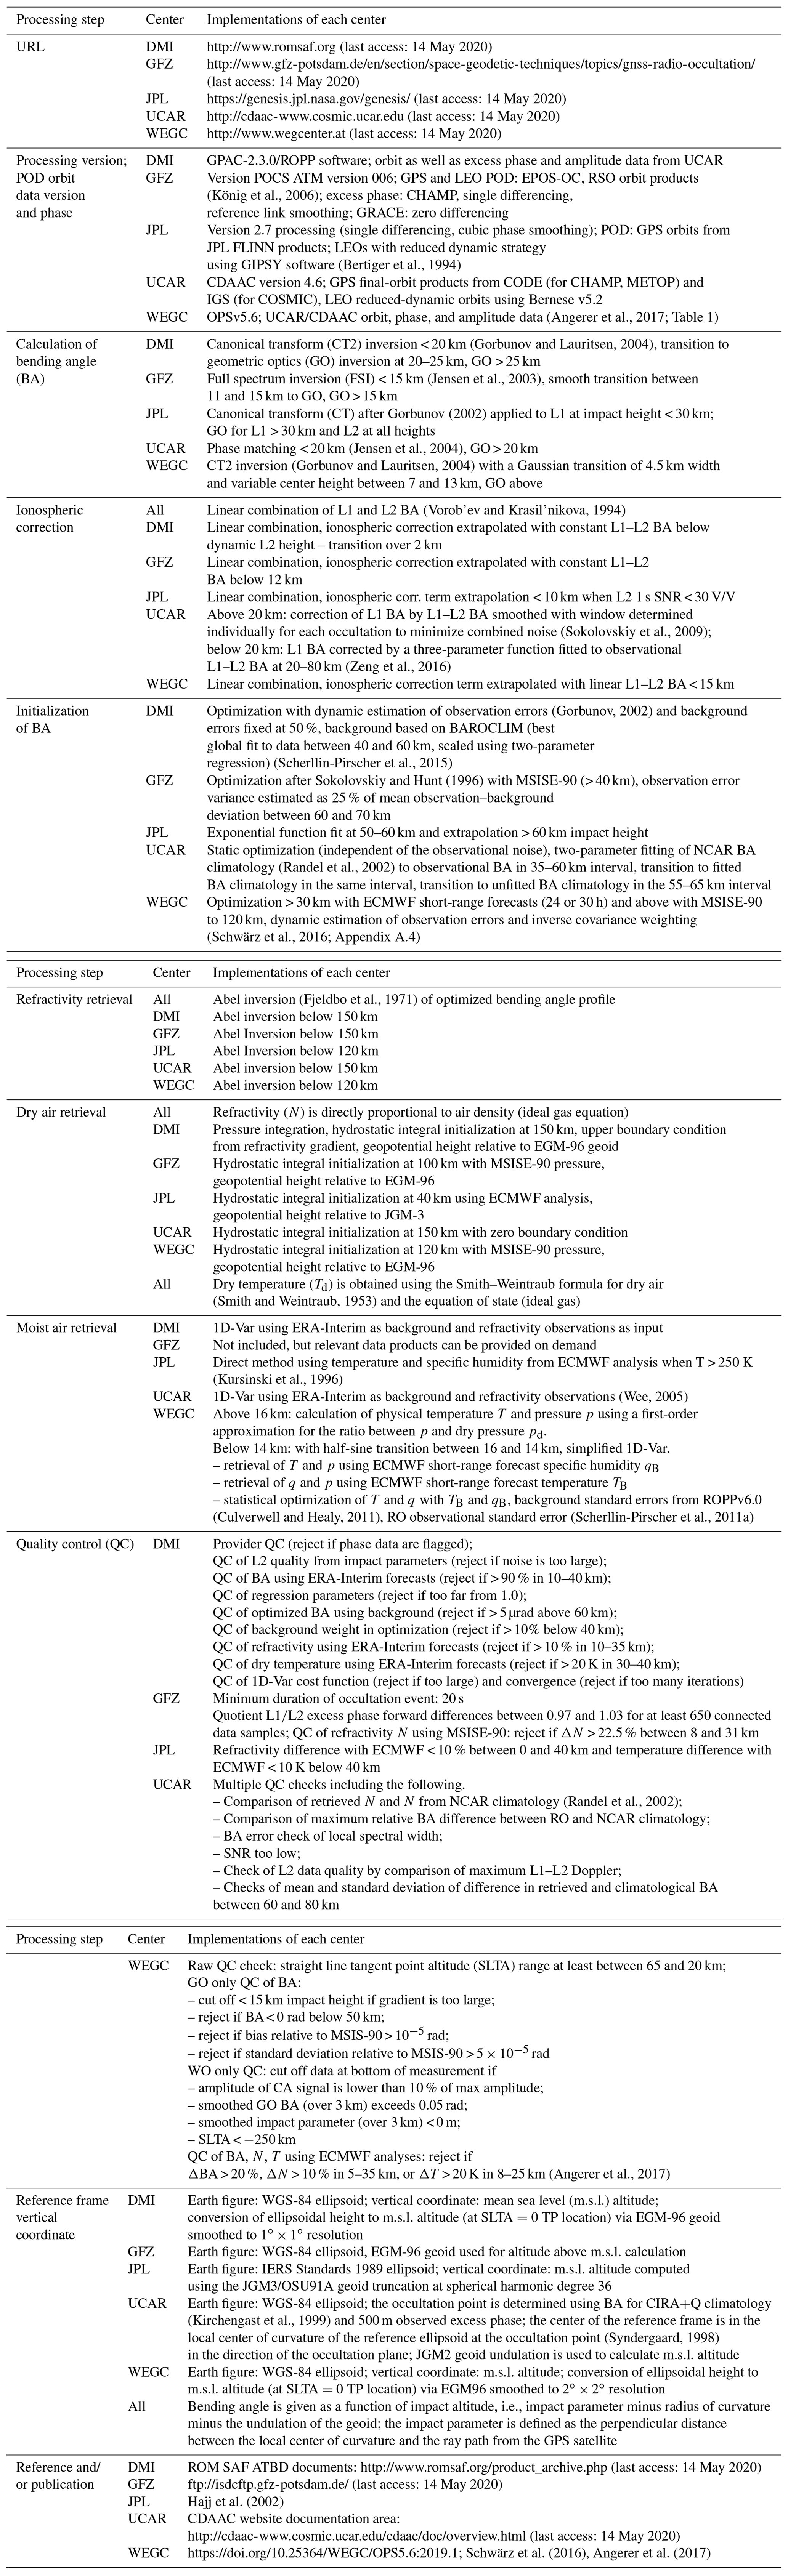
Table 1Overview of processing steps for RO dry and moist air retrieval at DMI, GFZ, JPL, UCAR, and WEGC.
2.2 General RO data processing description
Here, we briefly describe the basic retrieval steps from the phase measurements to atmospheric variables for dry and moist atmospheric conditions. Table 1 gives a concise overview of the retrieval steps and the implementation at each center.
The fundamental measurement is the GNSS signal phase change as a function of time, which varies according to the optical path length between the transmitter satellite and the LEO receiver satellite. Highly accurate atomic clocks are the heart of the system, ensuring long-term frequency stability. Two coherent carrier signals are transmitted, in the case of the US Global Positioning System (GPS) at wavelengths of 0.19 m (L1 signal) and 0.24 m (L2 signal) (Hofmann-Wellenhof et al., 2008; Teunissen and Montenbruck, 2017), which enables removing contributions due to Earth's ionosphere in a later retrieval step.
In the retrieval, the Doppler shift, i.e., the time derivative of the phase, is propagated further (e.g., Melbourne et al., 1994; Kursinski et al., 1997). The kinematic contribution to the Doppler shift due to the relative motion of the GNSS and LEO satellites is determined from precise position and velocity information, i.e., precise orbit determination (POD) (Bertiger et al., 1994; König et al., 2006). Removing it yields the Doppler shift due to the Earth's refractivity field. Errors in the receiver clock are removed by single differencing with a second reference satellite link or with double differencing by using additional ground clock information (Wickert et al., 2002). No differencing is needed, i.e., zero differencing, if there are ultra-stable clocks aboard the LEO satellites and clock errors are very small, such as for GRACE or Metop (e.g., Wickert et al., 2002; Schreiner et al., 2010, 2011; Bai et al., 2018). Geodetic processing systems are used to estimate errors in the GNSS transmitter clocks.
For microwave refraction, geometric optics retrieval is applied to convert Doppler shift to bending angle profiles, assuming local spherical symmetry of the atmosphere. In the lower troposphere, multipath and diffraction effects become important due to atmospheric humidity. Here, wave optics methods are applied for the retrieval of bending angle using phase and amplitude information (e.g., Gorbunov, 2002; Jensen et al., 2003, 2004; Gorbunov et al., 2004; Sokolovskiy et al., 2007). The ionospheric contribution to the signal is largely removed by differencing the dual-frequency GNSS signals, typically at bending angle level (Vorob'ev and Krasil'nikova, 1994). Current research aims at further minimization of the residual ionospheric error (Danzer et al., 2015). The ionosphere-corrected bending angle represents the cumulative signal refraction due to atmospheric density gradients.
The next retrieval step is the computation of refractivity from bending angle by an Abel transform (Fjeldbo et al., 1971). This involves an integral with an upper bound of infinity. Also, the signal-to-noise ratio of the bending angle decreases with increasing altitude (above about 50 km depending on the thermal noise of the receiver). Therefore, an initialization of bending angle profiles with background information is performed at high altitudes. The optimized bending angle profiles are then converted to refractivity profiles.
Refractivity at microwave wavelengths in the neutral atmosphere mainly depends on the thermodynamic conditions of the dry and the moist atmosphere and is given by the Smith–Weintraub formula (Smith and Weintraub, 1953) or updated formulations (Aparicio and Laroche, 2011; Healy, 2011; Cucurull et al., 2013). Dry density profiles are calculated from atmospheric refractivity by neglecting the wet term in the formula. Dry pressure profiles are retrieved using the hydrostatic equation and dry temperature profiles using the equation of state for dry air conditions in the upper troposphere and lower stratosphere. In the lower to middle troposphere, the retrieval of (physical) atmospheric temperature or humidity requires additional background information in order to resolve the wet–dry ambiguity information inherent in refractivity (e.g., Kursinski et al., 1996; Healy and Eyre, 2000; Kursinski and Gebhard, 2014). Different methods are applied for moist air retrievals, including a priori knowledge of the state of the atmosphere. Finally, quality control (QC) is implemented at several processing steps.
Atmospheric profiles are provided as a function of mean sea level (m.s.l.) altitude due to accurate knowledge of transmitter and receiver positions (and the assumption of local spherical symmetry), referred to a reference coordinate system and the Earth's geoid (see Table 1). The vertical integration of density also provides pressure as a function of altitude. Geopotential height can be computed without the need for information on surface pressure or any other information except gravity potential. Further details on vertical coordinates and the geolocation of RO are given in Scherllin-Pirscher et al. (2017).
2.3 Center-specific RO processing steps and comparison
Table 1 provides an overview of current state-of-the-art retrieval versions and the processing steps implemented at each center as well as information on data description and availability (Steiner et al., 2013; Table 1 updated for current processing versions and extended for moist air processing steps). Three of the RO centers (GFZ, JPL, UCAR) have the full processing chain implemented, going from the raw data level to atmospheric variables. Two centers (DMI and WEGC) start their processing at the phase data level in this study by using phase data and orbit data from UCAR/CDAAC (COSMIC Data Analysis and Archive Center). Thus, as some centers start with the same phase and orbit data (from UCAR), the products from raw data to atmospheric parameters are not strictly independent for these centers.
The main differences between the centers' processing steps include the initialization of the Abel integral that transforms bending angles to refractivity, moist air retrieval, and quality control. For the bending angle vertical profiles, JPL performs an extrapolation of the bending angle to higher altitudes, while the other centers apply statistical optimization methods that combine the bending angle measurements with a background bending angle. Each center uses different background information: atmosphere model climatologies (GFZ, UCAR), observation-based climatologies (DMI), or short-range forecasts (WEGC). Handling of observational and background errors affects the amount of information from observations and from the background included in the retrieved optimized bending angle. Observational error is typically smaller in data from RO systems with improved performance, i.e., lower thermal noise or higher-gain antennas enabling a higher signal-to-noise ratio up to higher altitudes. In the different moist air retrieval implementations, a priori information is also included, stemming either from atmospheric analyses or forecasts (JPL, WEGC), model forecasts produced with reanalysis (DMI), or reanalyses (UCAR).
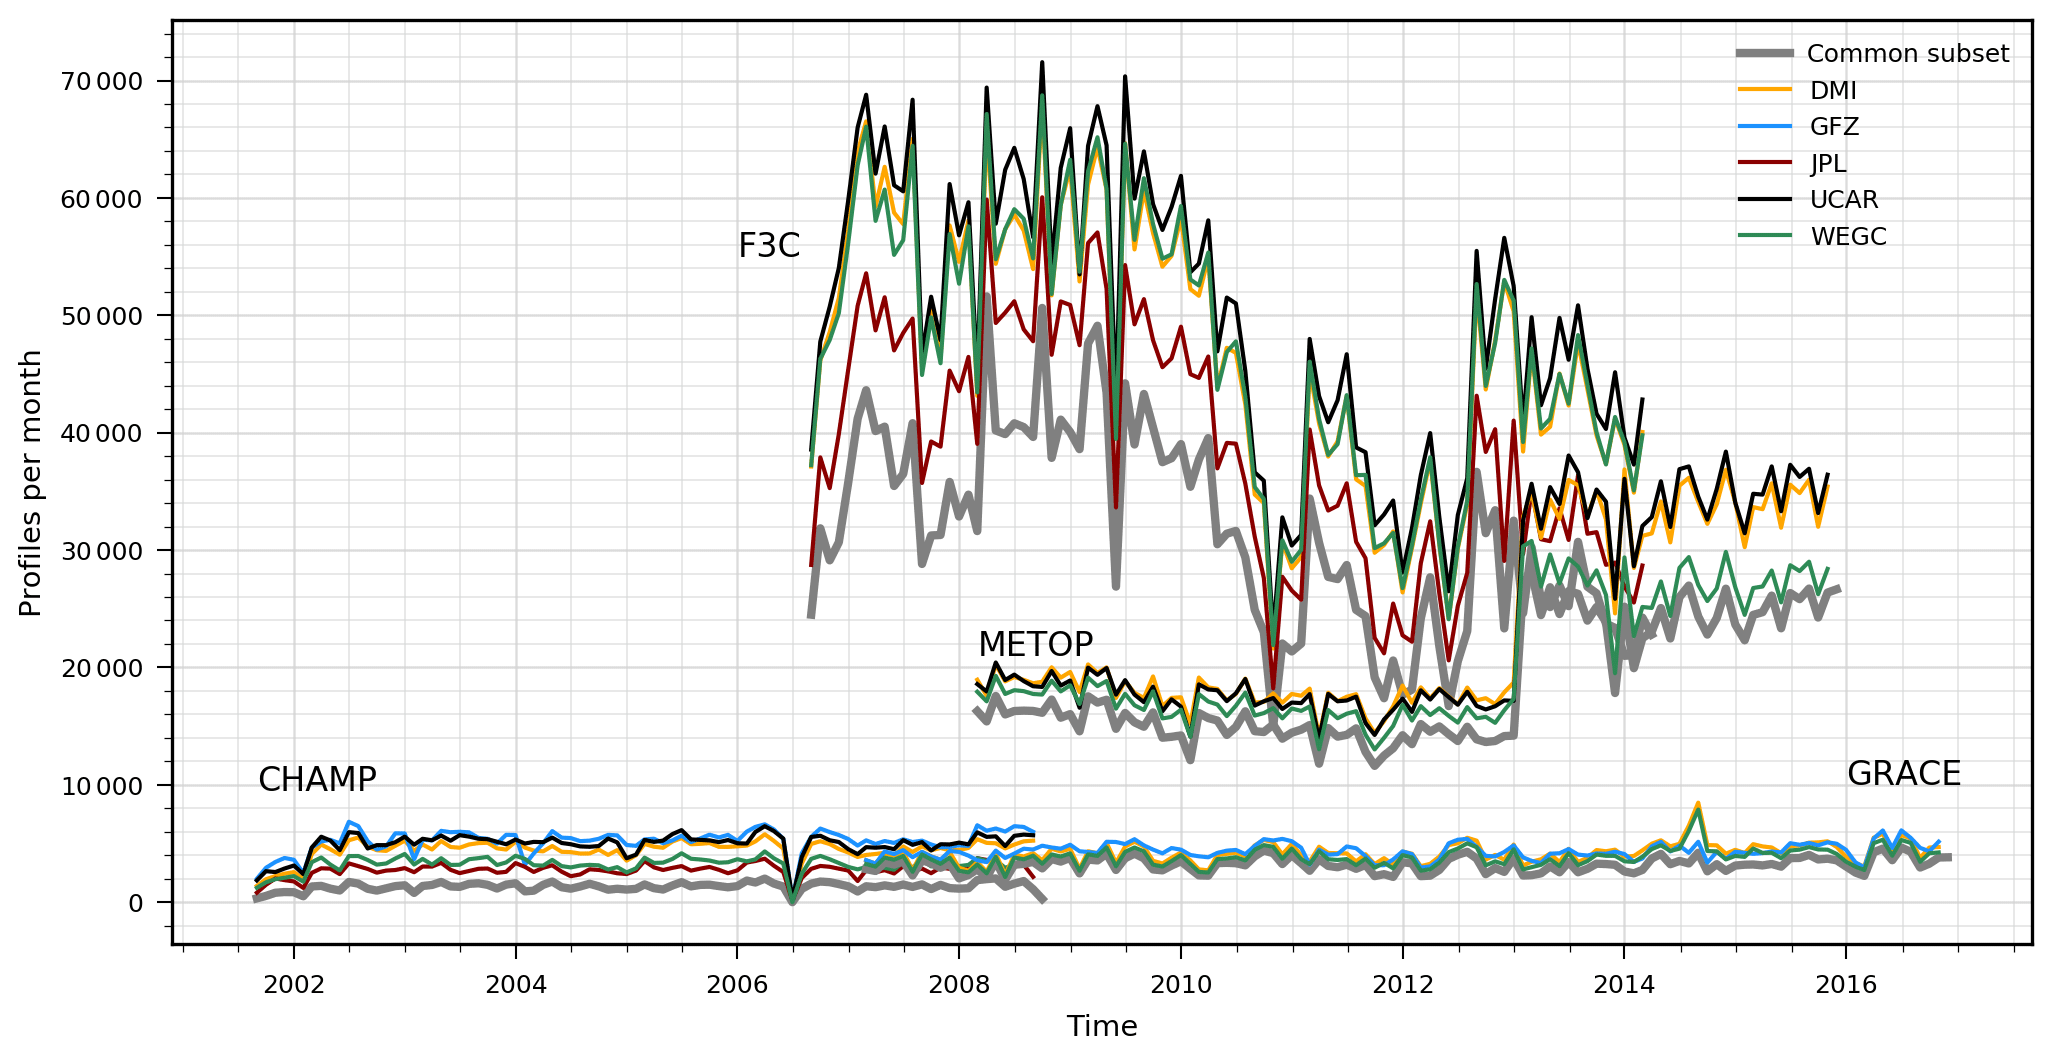
Figure 1Number of RO profiles per month delivered by each processing center, DMI (yellow), GFZ (blue), JPL (red), UCAR (black), and WEGC (green), and the maximum subset of profiles (gray), shown for the respective time periods of the four missions CHAMP, F3C, GRACE, and Metop.
Figure 1 shows the number of profiles per month delivered by each center for each RO mission. Also indicated is the number of profiles in the common subsets, which we used in the profile-to-profile intercomparison for quantifying structural uncertainty. For CHAMP, GFZ delivered the largest number of data, followed by UCAR, DMI, WEGC, and JPL. There is a data gap in July 2006 when CHAMP had very few measurements. The common subset of profiles for CHAMP summed up on average to about 1500 profiles per month.
For F3C, DMI, UCAR, and WEGC delivered nearly the same number of data, and only JPL provided a smaller amount. GFZ did not process F3C data. The number of F3C measurements was highest from 2007 to 2010, with more than 70 000 profiles per month, and decreased over time as the satellites successively ceased achieving full function. The mission design life was 2 years. Only two of the six F3C satellites still produced data in 2018. For this study, UCAR provided a reprocessed F3C data set until April 2014. The common subset of F3C data ranged from 20 000 up to 50 000 profiles per month over time.
Data for GRACE were provided by three centers, DMI, GFZ, WEGC, delivering nearly the same number of profiles with a common subset of about 3000 profiles per month. Metop data were provided by DMI, UCAR, and WEGC, with a common subset of about 15 000 profiles increasing to 25 000 per month when the second Metop satellite started measuring.
The number of common profiles is noticeably smaller than the number of profiles delivered by any of the centers, which is mainly due to the different quality control handling. This means that each center does not deliver the same set of profiles.
We investigated the structural uncertainty of the following RO variables: bending angle (α), optimized bending angle (αopt), refractivity (N), dry pressure (pdry), dry temperature (Tdry), dry geopotential height (Zdry), pressure (p), temperature (T), and specific humidity (q). The atmospheric profiles were provided on a 100 m m.s.l. altitude grid except bending angle, which was given on impact altitude, and geopotential height, which was related to dry pressure levels, i.e., “dry pressure altitude” defined as zp (m) = (7000 m)⋅ ln(1013.25 hPa ∕ pdry; hPa).
Table 2Overview of RO data delivered by the different processing centers and the common time periods used in this study: processing center, satellite mission, time period, and variables.
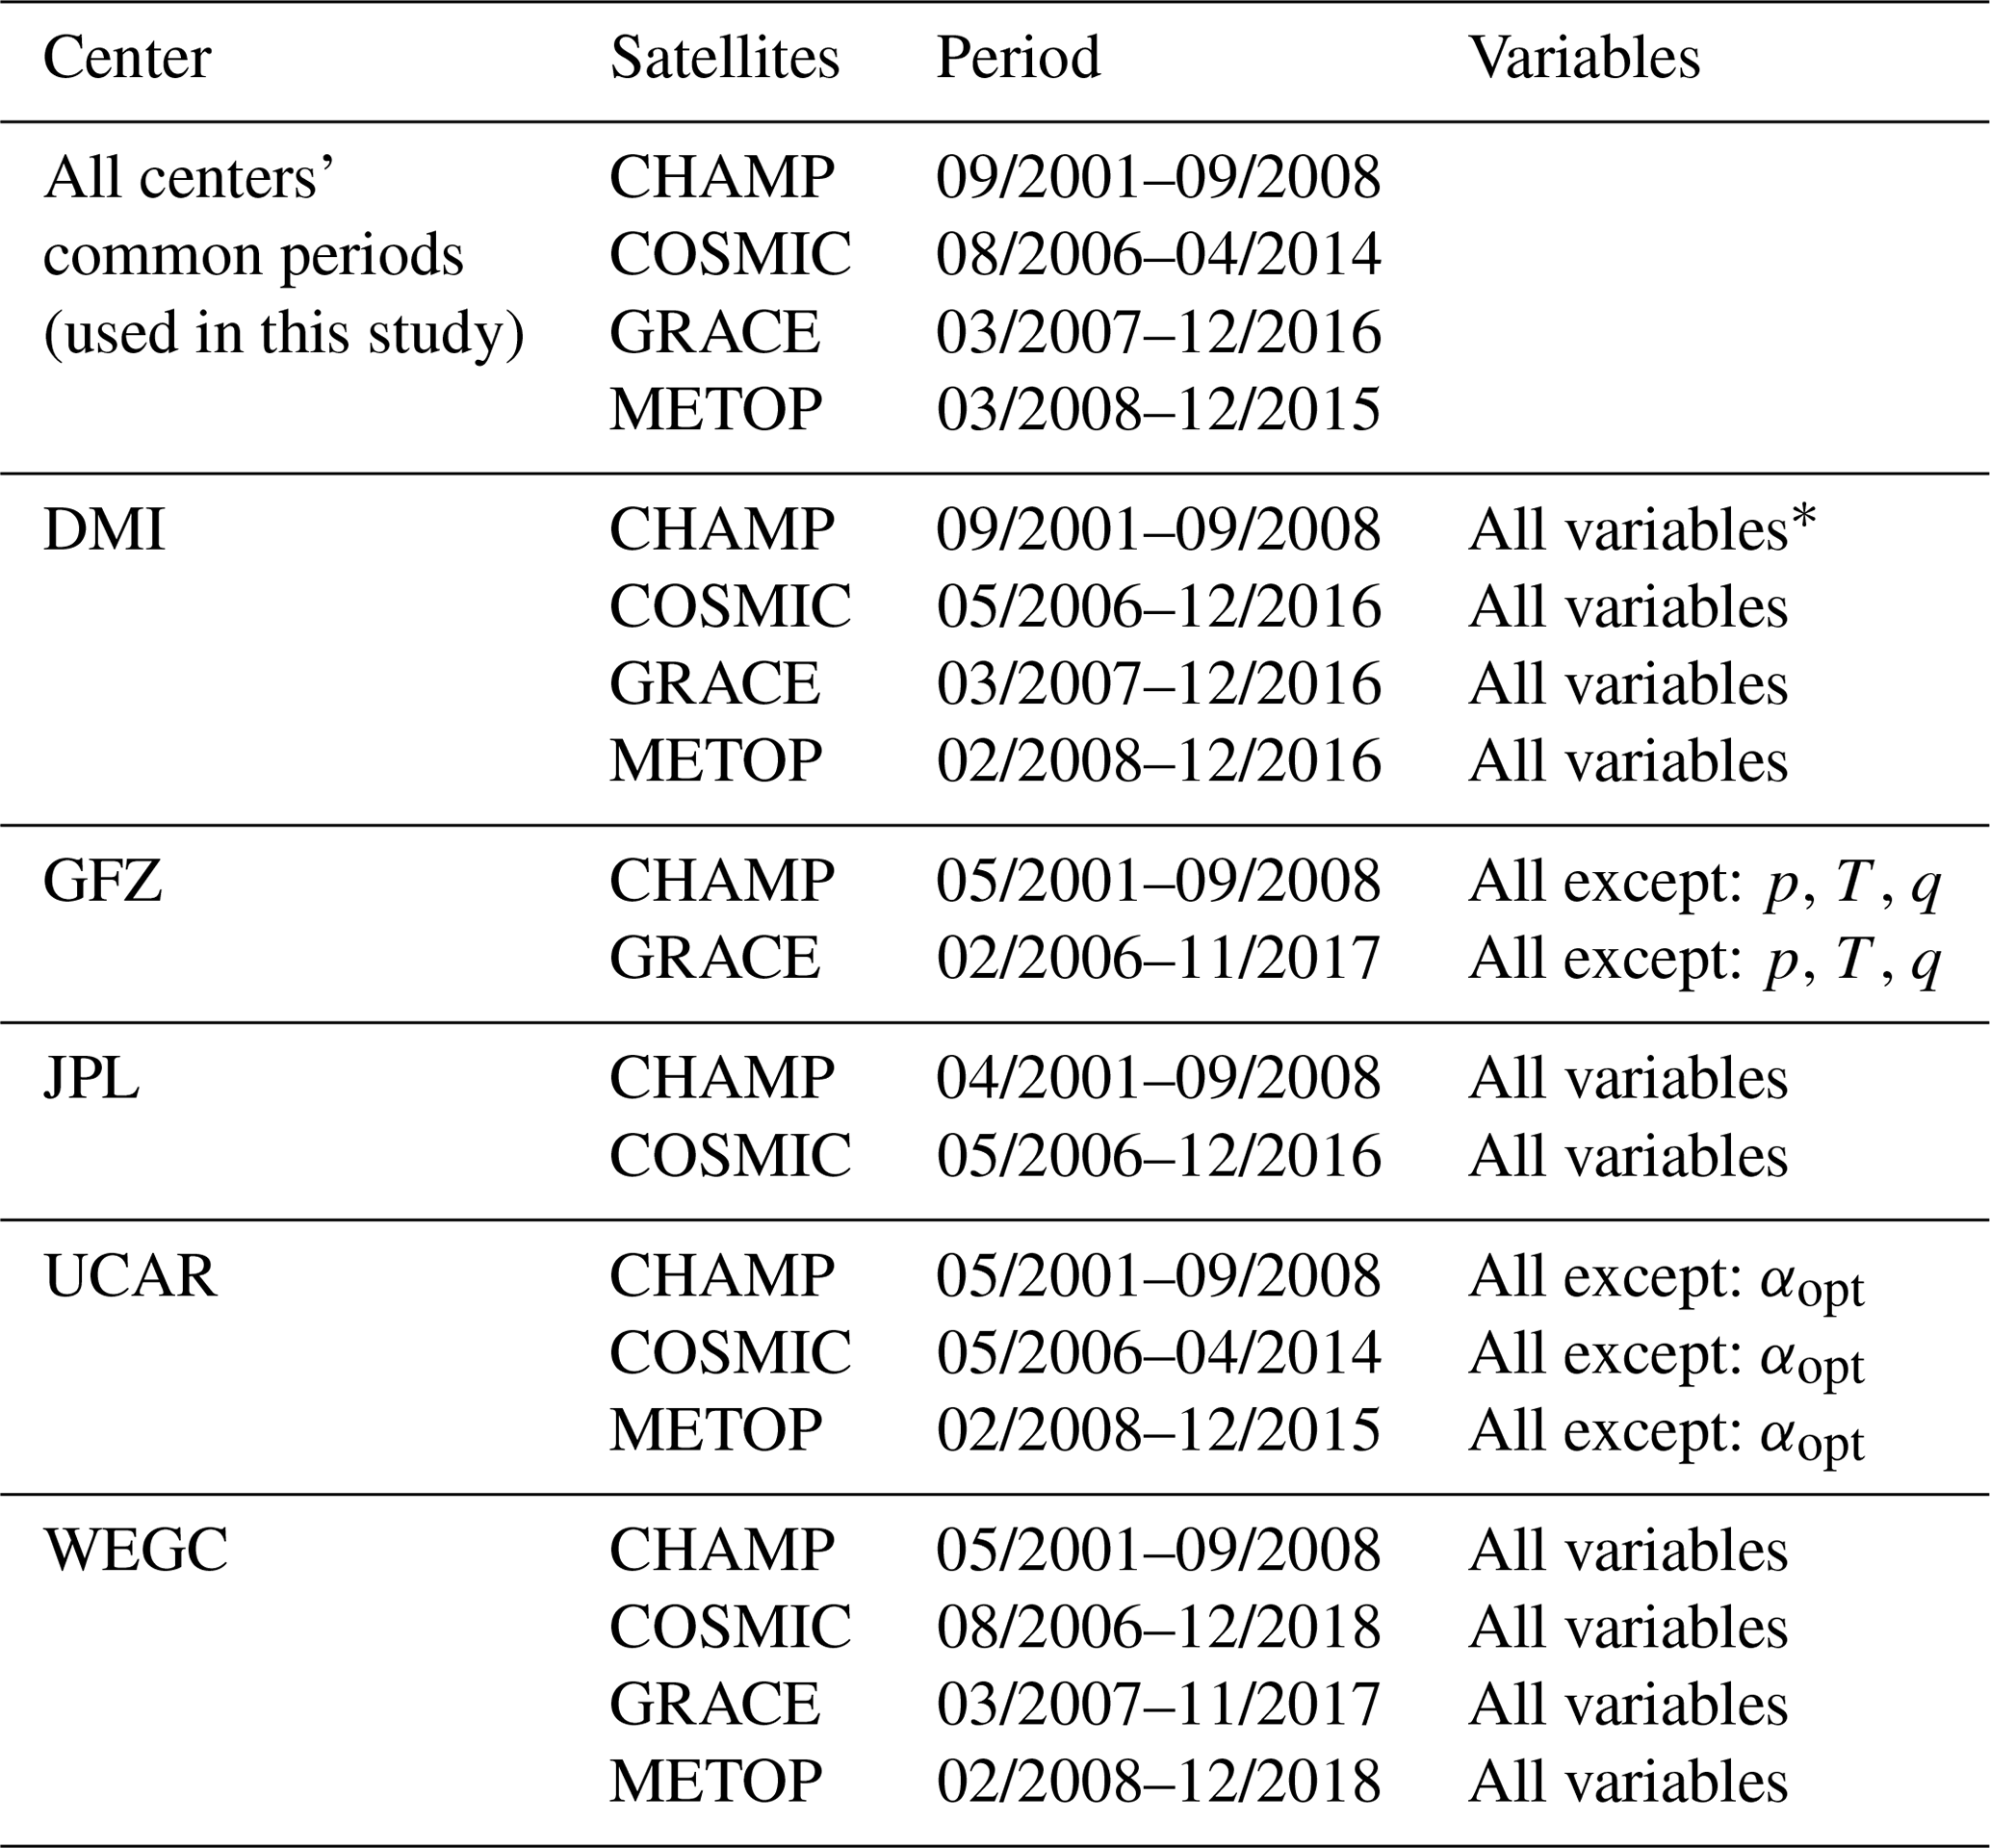
* All variables include α, αopt, N, pdry, Tdry, Zdry, p, T, and q.
Table 2 summarizes the data delivered for this study by each center and gives information on satellite missions, time periods, and atmospheric variables. Not all of the centers provided data for each satellite and each variable. UCAR did not provide optimized bending angle profiles. GFZ did not provide moist air variables. This was adequately considered in the computations.
The study was based on the intercomparison of collocated profiles between the centers for each satellite mission and atmospheric variable. The profiles were collocated based on a unique event identifier (ID) including information on receiver ID, GPS satellite ID, date, and time of the observation. The common subset of data was analyzed further. This means that only the common time periods can be intercompared for which each center provided data continuously. The investigated periods are September 2001–September 2008 for CHAMP (five centers), March 2007–December 2016 for GRACE (three centers), August 2006–April 2014 for F3C (four centers), and March 2008–December 2015 for Metop (three centers).
We first calculated the differences (ΔXi) of each center (c) to the all-center mean (i.e., mean of all centers) () over time based on individual profiles of atmospheric parameters (Xi), with i denoting the index of matched profiles and ncenter denoting the number of centers, using Eqs. (1) and (2):
The profiles (Xi, ΔXi, ) were then binned into 10∘ zonal bands and averaged to monthly medians (X, ΔX, Xall). By using difference time series we remove the climate variability that is common in the data sets. Anomaly difference time series were then computed by subtracting the mean annual cycle for the respective time period (see Table 2) to reduce the natural variability in the differences. Percentage anomaly difference time series were computed for variables that decrease exponentially with altitude.
The spread of the anomaly difference trends and the spread of the center trends were used for estimating the structural uncertainty (Wigley, 2006) of RO records. For each atmospheric variable and satellite mission, we computed the linear trend over the respective time period for the all-center mean and for each center. The standard deviation of the center trends was finally used as a measure of the spread.
We performed the calculations for each atmospheric parameter (X) for each satellite mission (s) of each center (c) given at monthly resolution (t) for latitude bands (ϕ) and altitude levels (z), i.e., nine parameters, four satellite missions, and five centers, for 18 latitude bands and up to 600 altitude levels as well as for six large latitude bands and up to eight altitude layers (after Steiner et al., 2013; Mochart, 2018).
The mean difference of each center to the all-center mean was computed by averaging over the satellite-dependent period, with ntime as the number of time steps (months), using Eq. (3):
Results from these computations are discussed in Sect. 4.1.
The annual cycle for the differences to the all-center mean was computed using Eq. (4). The number of years over which the annual cycle was calculated is denoted nyr, the index l′ takes the values 1 to 12, and denotes one of the 12 months of a year:
Subtracting the annual cycle provided the de-seasonalized anomaly differences for each center c and satellite mission s, obtained according to Eq. (5):
Fractional (percentage) de-seasonalized anomaly differences were computed analogously.
Linear trends were then computed with standard linear regression for the de-seasonalized anomaly difference time series and, analogously, for the de-seasonalized time series of each center. Results from these computations are discussed in Sect. 4.2 and 4.3. For better comparison, the trends are stated per 10 years. However, we do not discuss climatological trends here as the time periods are different for each RO mission. We are interested in the structural uncertainty of trends represented by the standard deviation of the ncenter individual center trends. This measure gives us an indication of the stability of the multi-satellite RO records.
We performed the computations for 10∘ zonal medians, averaging the collocated individual RO profiles on the given vertical grid on a monthly median basis. We then averaged to larger latitudinal domains and altitude layers, in which RO data show similar behavior and similar structural uncertainty. We defined six latitude bands: the tropics (TRO; 20∘ N–20∘ S), northern and southern midlatitudes (NML and SML; 20–60∘ N and 20–60∘ S), northern and southern high latitudes (NHL and SHL; 60–90∘ N and 60–90∘ S), and a global band (GLOB; 90∘ N–90∘ S). We defined (up to) eight altitude layers. The uppermost altitude levels are 60 km for bending angle, 50 km for refractivity, and 40 km for the other variables except humidity (15 km). The inspected vertical layers include 8–18, 18–25, 25–30, 30–35, 35–40, 40–50, and 50–60 km. Structural uncertainty in trends is finally presented at the full 100 m altitude grid.
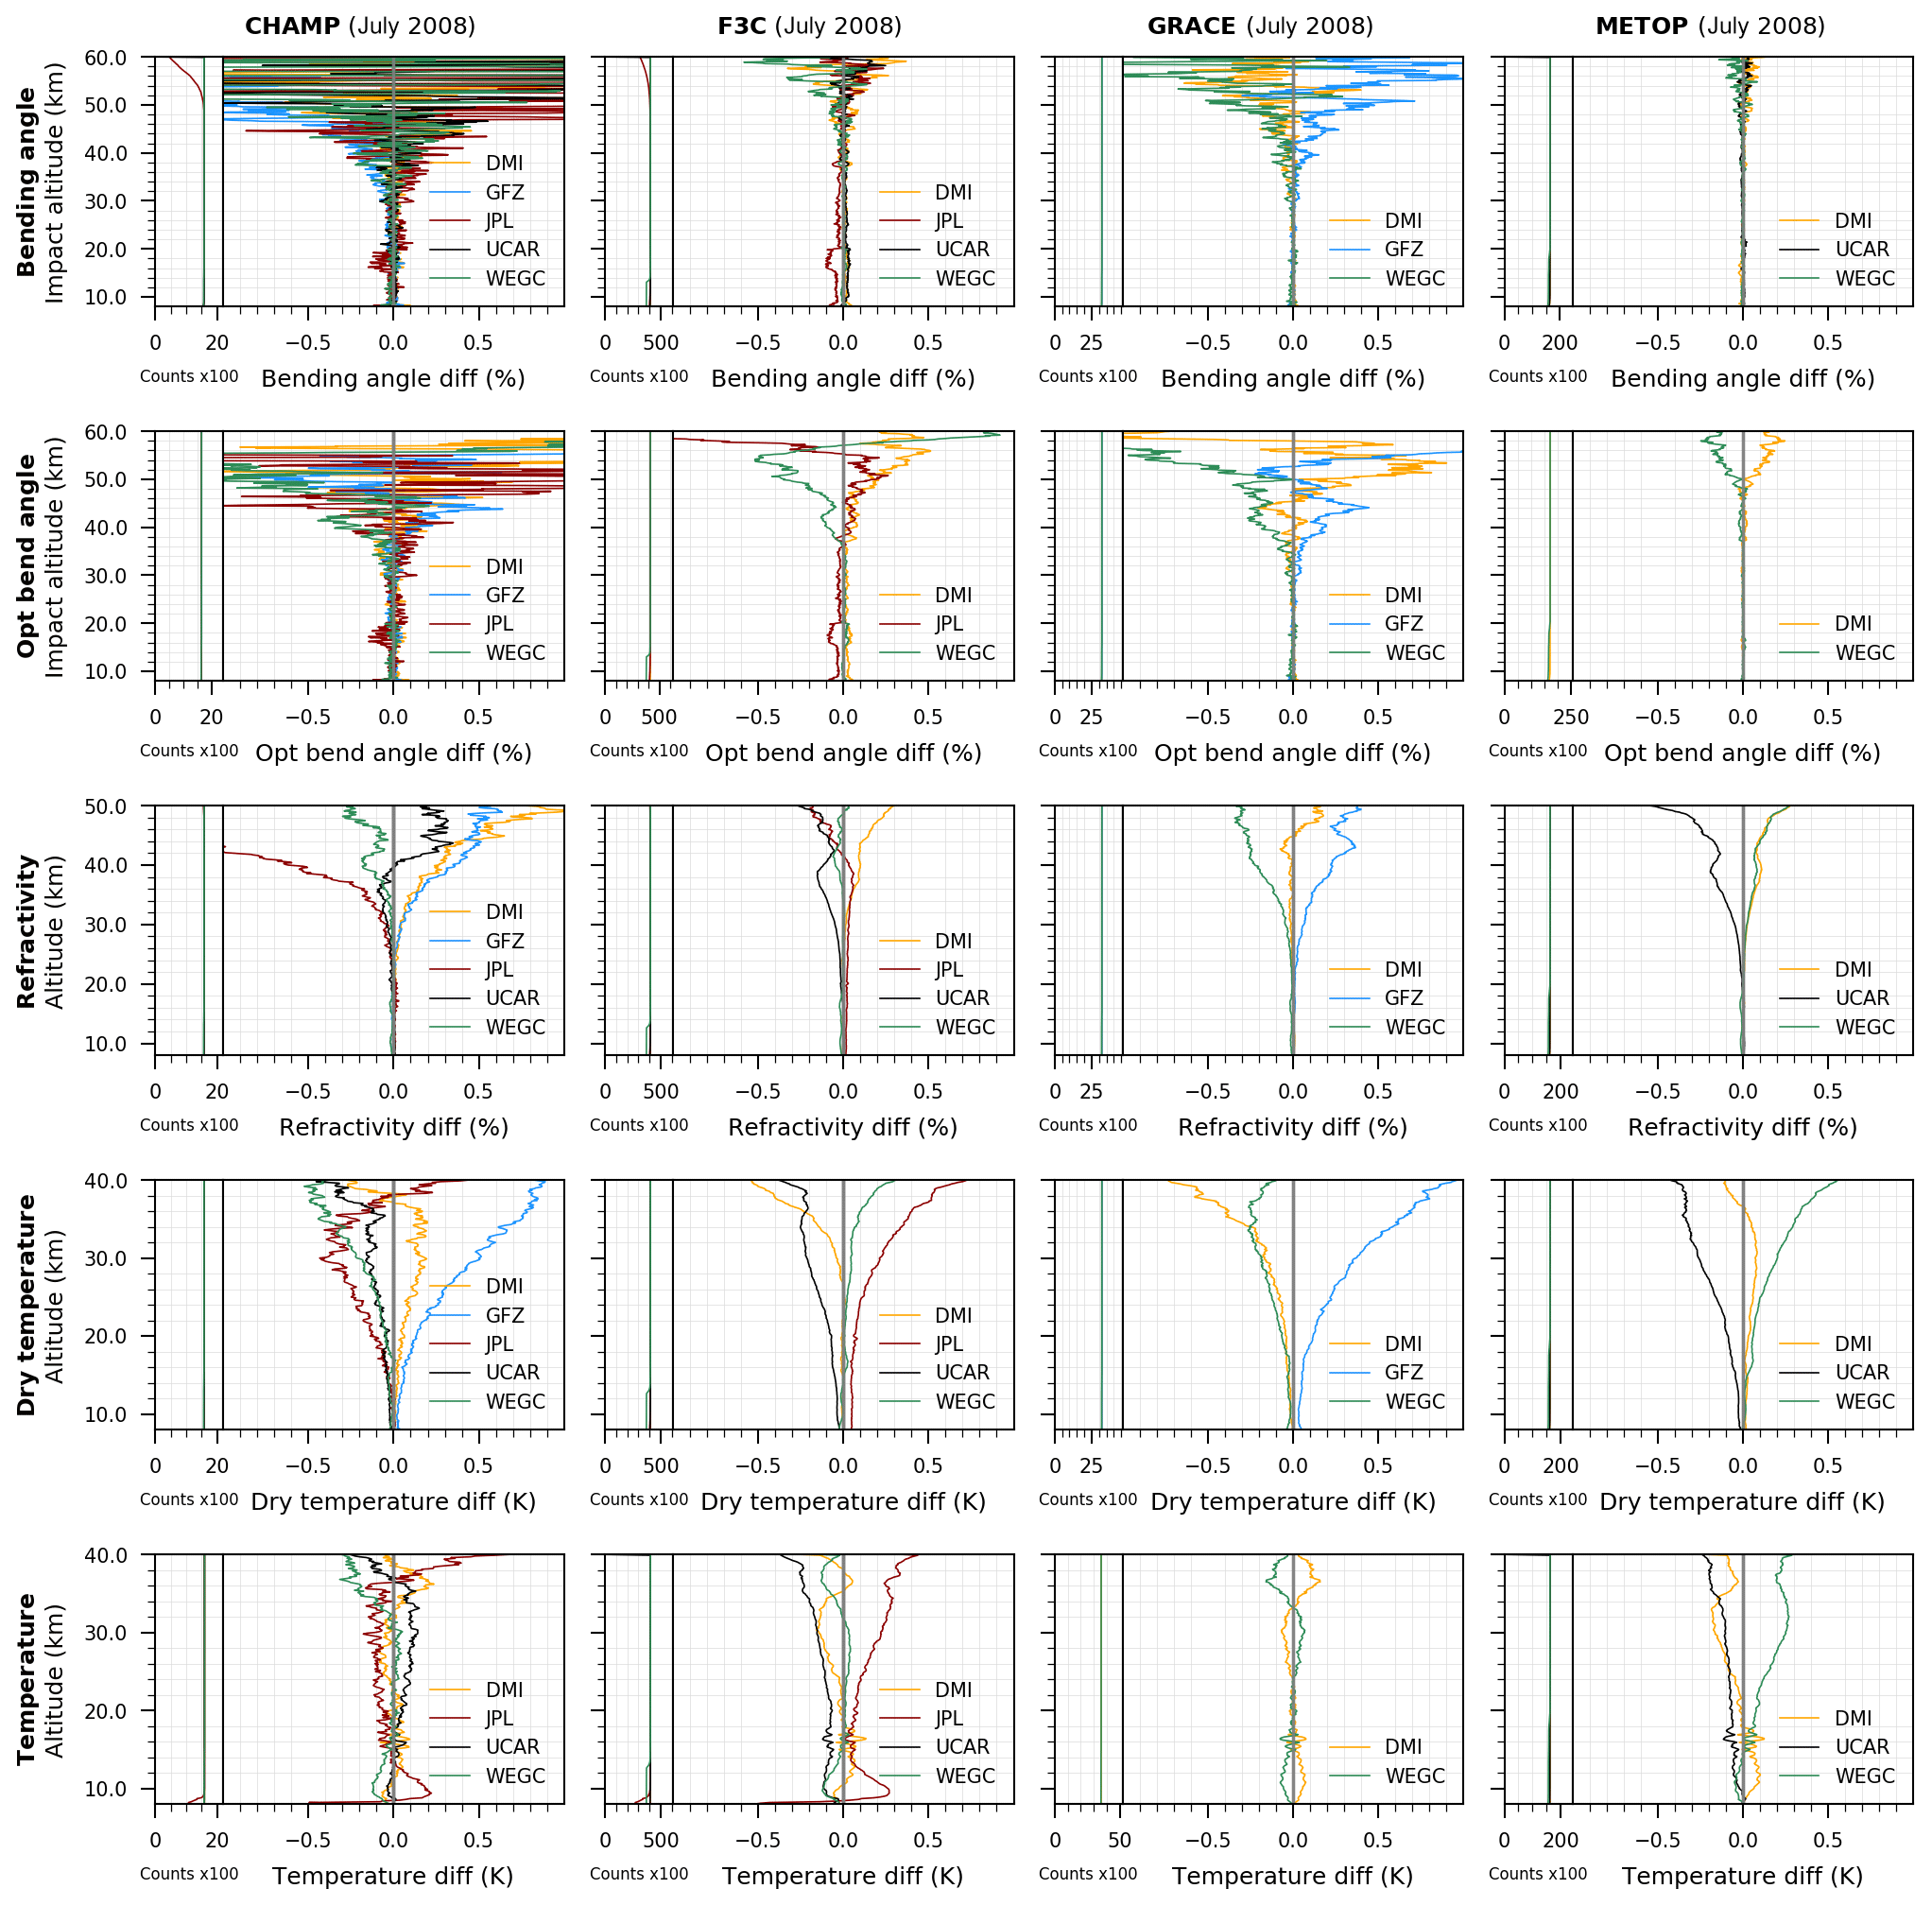
Figure 2Global mean difference of atmospheric profiles from each center to the all-center mean for one exemplary month (July 2008) based on 10∘ zonal medians and shown for the satellite missions CHAMP, F3C, GRACE, and Metop (left to right) for bending angle, optimized bending angle, refractivity, dry temperature, and temperature (top to bottom). The number of data points is shown in the left sub-panels.
4.1 Comparison of differences in multi-satellite RO profiles for one exemplary month and for the total mean
As a first overview, we present comparison results for one exemplary month, July 2008, for selected atmospheric RO variables in order to introduce several characteristic features. Figure 2 shows the global mean difference of profiles from each center with respect to the all-center mean for the missions CHAMP, F3C, GRACE, and Metop. Differences for the variables bending angle, optimized bending angle, refractivity, dry temperature, and physical temperature are presented. Note that deviations of one center are counterbalanced by other centers due to referencing to the all-center mean.
The mean difference profiles for non-optimized bending angle and bending angle are smaller at upper altitudes for F3C, GRACE, and Metop compared to CHAMP due to enhanced receiver quality and smoother due to the larger number of data available. For CHAMP, the bending angle becomes noisy near 35–40 and above 40–50 km for the other RO missions. The optimization of the bending angle reduces the noise and stabilizes the retrieval at high altitudes above 50 km. The noise reduction is visible in the optimized bending angle differences, specifically for F3C, GRACE, and Metop. The bending angle differences are < 0.1 % from a 10–40 to 50 km impact altitude, depending on the mission.
In the RO retrieval chain of further derived parameters, such as refractivity, pressure, or dry temperature, the impact of background information propagates further downward in altitude for each retrieved parameter. Refractivity, which is proportional to atmospheric density, shows differences of < 0.05 % at 10–30 km for all satellites in July 2008. Dry temperature differences are small from 8–25 to 30 km depending on the mission. Physical temperatures, usually derived with a priori information, show similar differences, with JPL showing larger deviations due to cutoff artifacts below 15 km (see below).
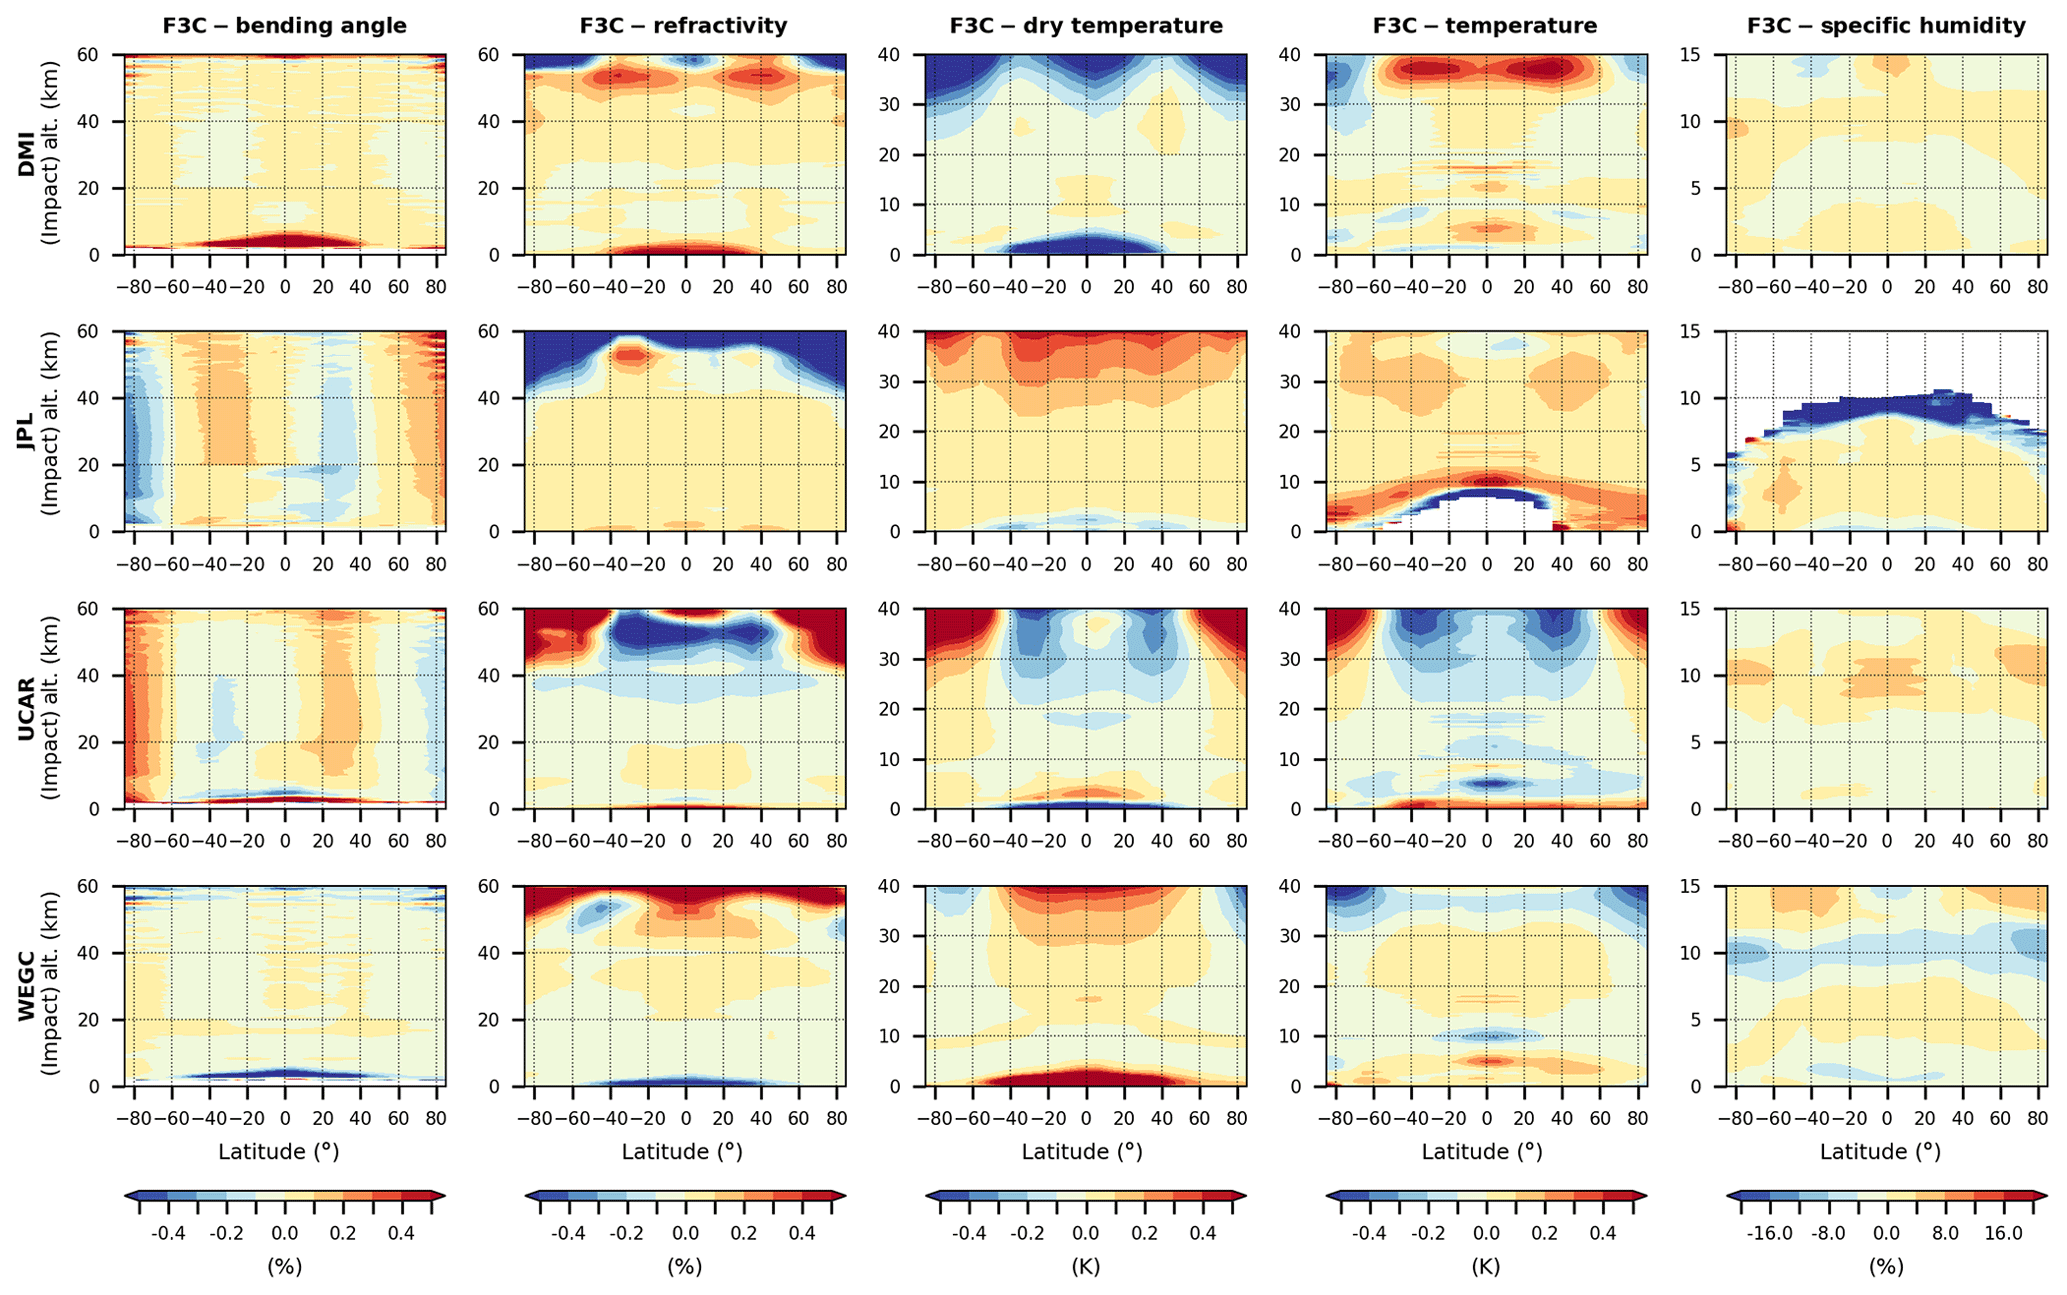
Figure 3Mean difference of each center, DMI, JPL, UCAR, and WEGC (top to bottom), to the all-center mean for F3C data averaged over August 2006–April 2014 based on 10∘ zonal medians and shown for bending angle, refractivity, dry temperature, temperature, and specific humidity (left to right).
Next, we give an overview of mean differences with respect to the all-center mean, averaged over the full time period of a mission, which we exemplarily show for the F3C mission. Figure 3 presents averaged anomaly differences for bending angle, refractivity, dry temperature, temperature, and specific humidity for 10∘ zonal means at a 100 m vertical grid. The mean differences for bending angle are found to be very small (0.1 %–0.2 %) at all latitudes, except at high latitudes where differences are larger for JPL and UCAR bending angles. Different choices for the bending angle initialization by the centers are reflected in larger refractivity differences above about 40 km, while below the mean differences are very small (< 0.1 %). For subsequent derived variables, the differences become larger above 30 km as seen for dry temperature. There, some latitude-dependent features appear that might stem from high-altitude initialization in the retrieval, specifically at high latitudes. At 5–30 km, mean differences for dry temperature are found to be < 0.2 K for all latitude bands. Physical temperature shows similar differences of < 0.2 K at 2–30 km of altitude. JPL provides physical temperature products only down to a certain altitude. RO temperature is cut off when it rises above 240 K in their moist air retrieval, for which background temperature information from ECMWF (European Centre for Medium-Range Weather Forecasts) analyses is used to derive specific humidity. DMI and UCAR use a one-dimensional variational (1D-Var) method to derive temperature with ERA-Interim (ECMWF Reanalysis-Interim) products as background. WEGC applies a simplified 1D-Var retrieval method using ECMWF forecasts as background below about 16 km of altitude. Above this altitude, WEGC dry and physical temperatures are the same. However, in Fig. 3, differences are shown with respect to the all-center mean, and the latter is different for dry and physical temperature. For specific humidity we find mean differences of each center to the all-center mean of < 15 %. JPL provides specific humidity data up to 10 km of altitude only in synergy with the temperature cutoff, and the number of data decreases above 8 km. The larger differences at this altitude are artifacts and can be removed with a more rigid cutoff. Only a few centers delivered humidity and the data have different height availability, which hampers a rigorous statistical intercomparison of humidity in this study. We thus do not show further comparisons here.
Comparison of mean differences with data from the other satellite missions CHAMP, GRACE, and Metop shows good consistency over the same regions; however, differences are found to be smaller at higher altitudes, specifically for Metop. Commonalities and differences are further investigated in the full difference time series and revealed in the structural uncertainty estimates.
4.2 Comparison of anomaly difference time series
Here, we investigate anomaly difference time series (see Eq. 5) for each satellite mission (CHAMP, F3C, GRACE, Metop) over the respective time periods as presented in Figs. 4 to 7. We show monthly median differences to the all-center mean for two selected variables, bending angle and dry temperature. Bending angle is at the beginning of the processing chain (after phase data processing), while dry temperature is one of the final RO products commonly used in climate studies. We present results for the global mean (GLO) and for selected zonal means, the tropics (TRO), and high latitudes (SHL, NHL). We do not show results for the midlatitude bands (NML, SML) as the results are similar to those in the tropics. We investigate consistencies and deviations in the anomaly difference time series of individual centers from the all-center mean.

Figure 4CHAMP bending angle (a) and dry temperature (b) de-seasonalized anomaly difference time series based on 10∘ zonal medians of each center to the all-center mean for latitude bands 90 to 60∘ S, 20∘ S to 20∘ N, 60 to 90∘ N, and globally 90∘ S to 90∘ N (left to right) for altitude layers 8–18, 18–25, and 25–30 km (bottom to top). Time series from DMI (orange), GFZ (blue), JPL (red), UCAR (black), and WEGC (green) are shown.
For all satellite missions we find that bending angle differences are overall very small and consistent below 30 km at all latitudes. However, there are some differences that we discuss in the following. For CHAMP, the spread of mean anomaly difference trends in bending angle (Fig. 4a) is larger than for the other missions. For the zonal means, it is about ±0.05 % per decade below 25 km, increasing to about ±0.1 % per decade above. At SHL, a larger difference trend is seen for GFZ at 25–30 km. Larger variability in bending angle is found for JPL over the investigated period. The difference time series in CHAMP bending angle show similar behavior at high latitudes and in the tropics. The global mean difference trends (90∘ S–90∘ N) for CHAMP are ±0.04 % per decade at 8–18 km and ±0.02 % per decade above.
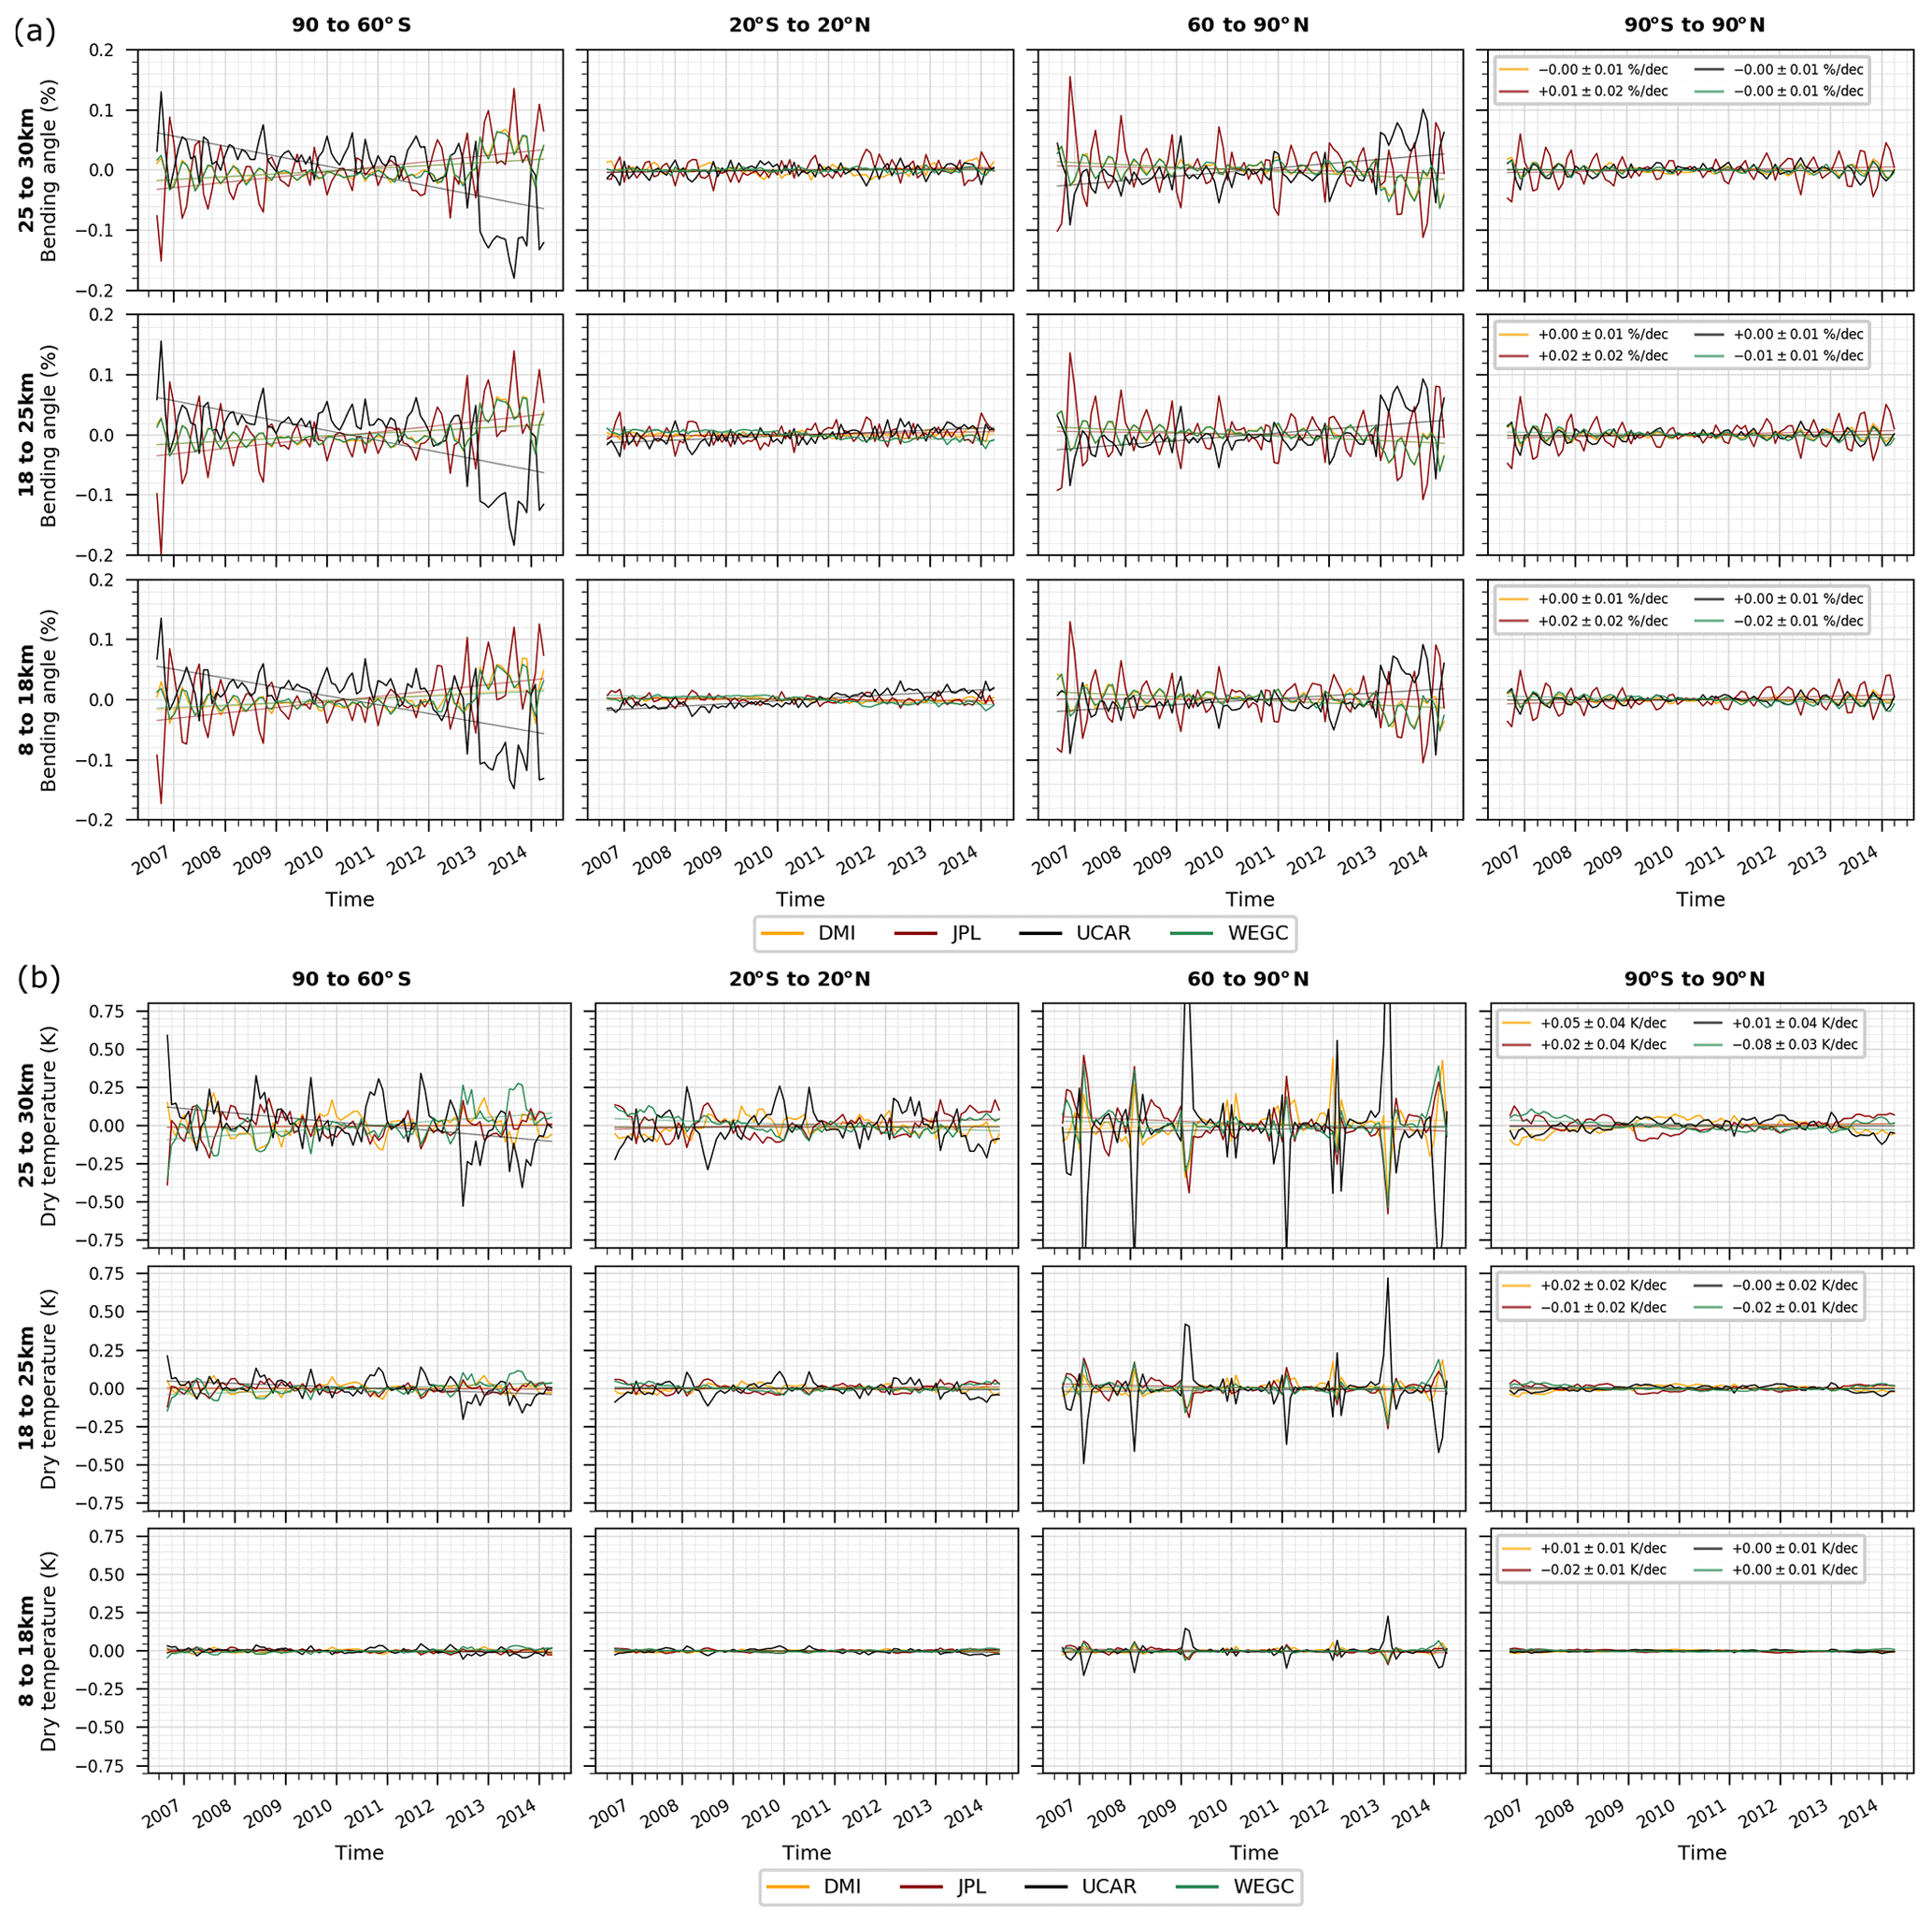
Figure 5F3C bending angle (a) and dry temperature (b) de-seasonalized anomaly difference time series based on 10∘ zonal medians of each center to the all-center mean for latitude bands 90 to 60∘ S, 20∘ S to 20∘ N, 60 to 90∘ N, and globally 90∘ S to 90∘ N (left to right) for altitude layers 8–18, 18–25, and 25–30 km (bottom to top). Time series from DMI (orange), JPL (red), UCAR (black), and WEGC (green) are shown.
For F3C, the spread of mean anomaly difference trends (Fig. 5a) is found to be larger at high latitudes than in the tropics. The largest difference trends are found at SHL, with a spread of −0.17 % to 0.1 % per decade in all altitude layers. This is due to a small shift in UCAR bending angle in 2013, which is currently under investigation. In the tropics, the differences are small. In the global mean, the spread in difference trends is ±0.02 % per decade at 18–25 km and ±0.01 % per decade at 25–30 km, which is smaller than for CHAMP.
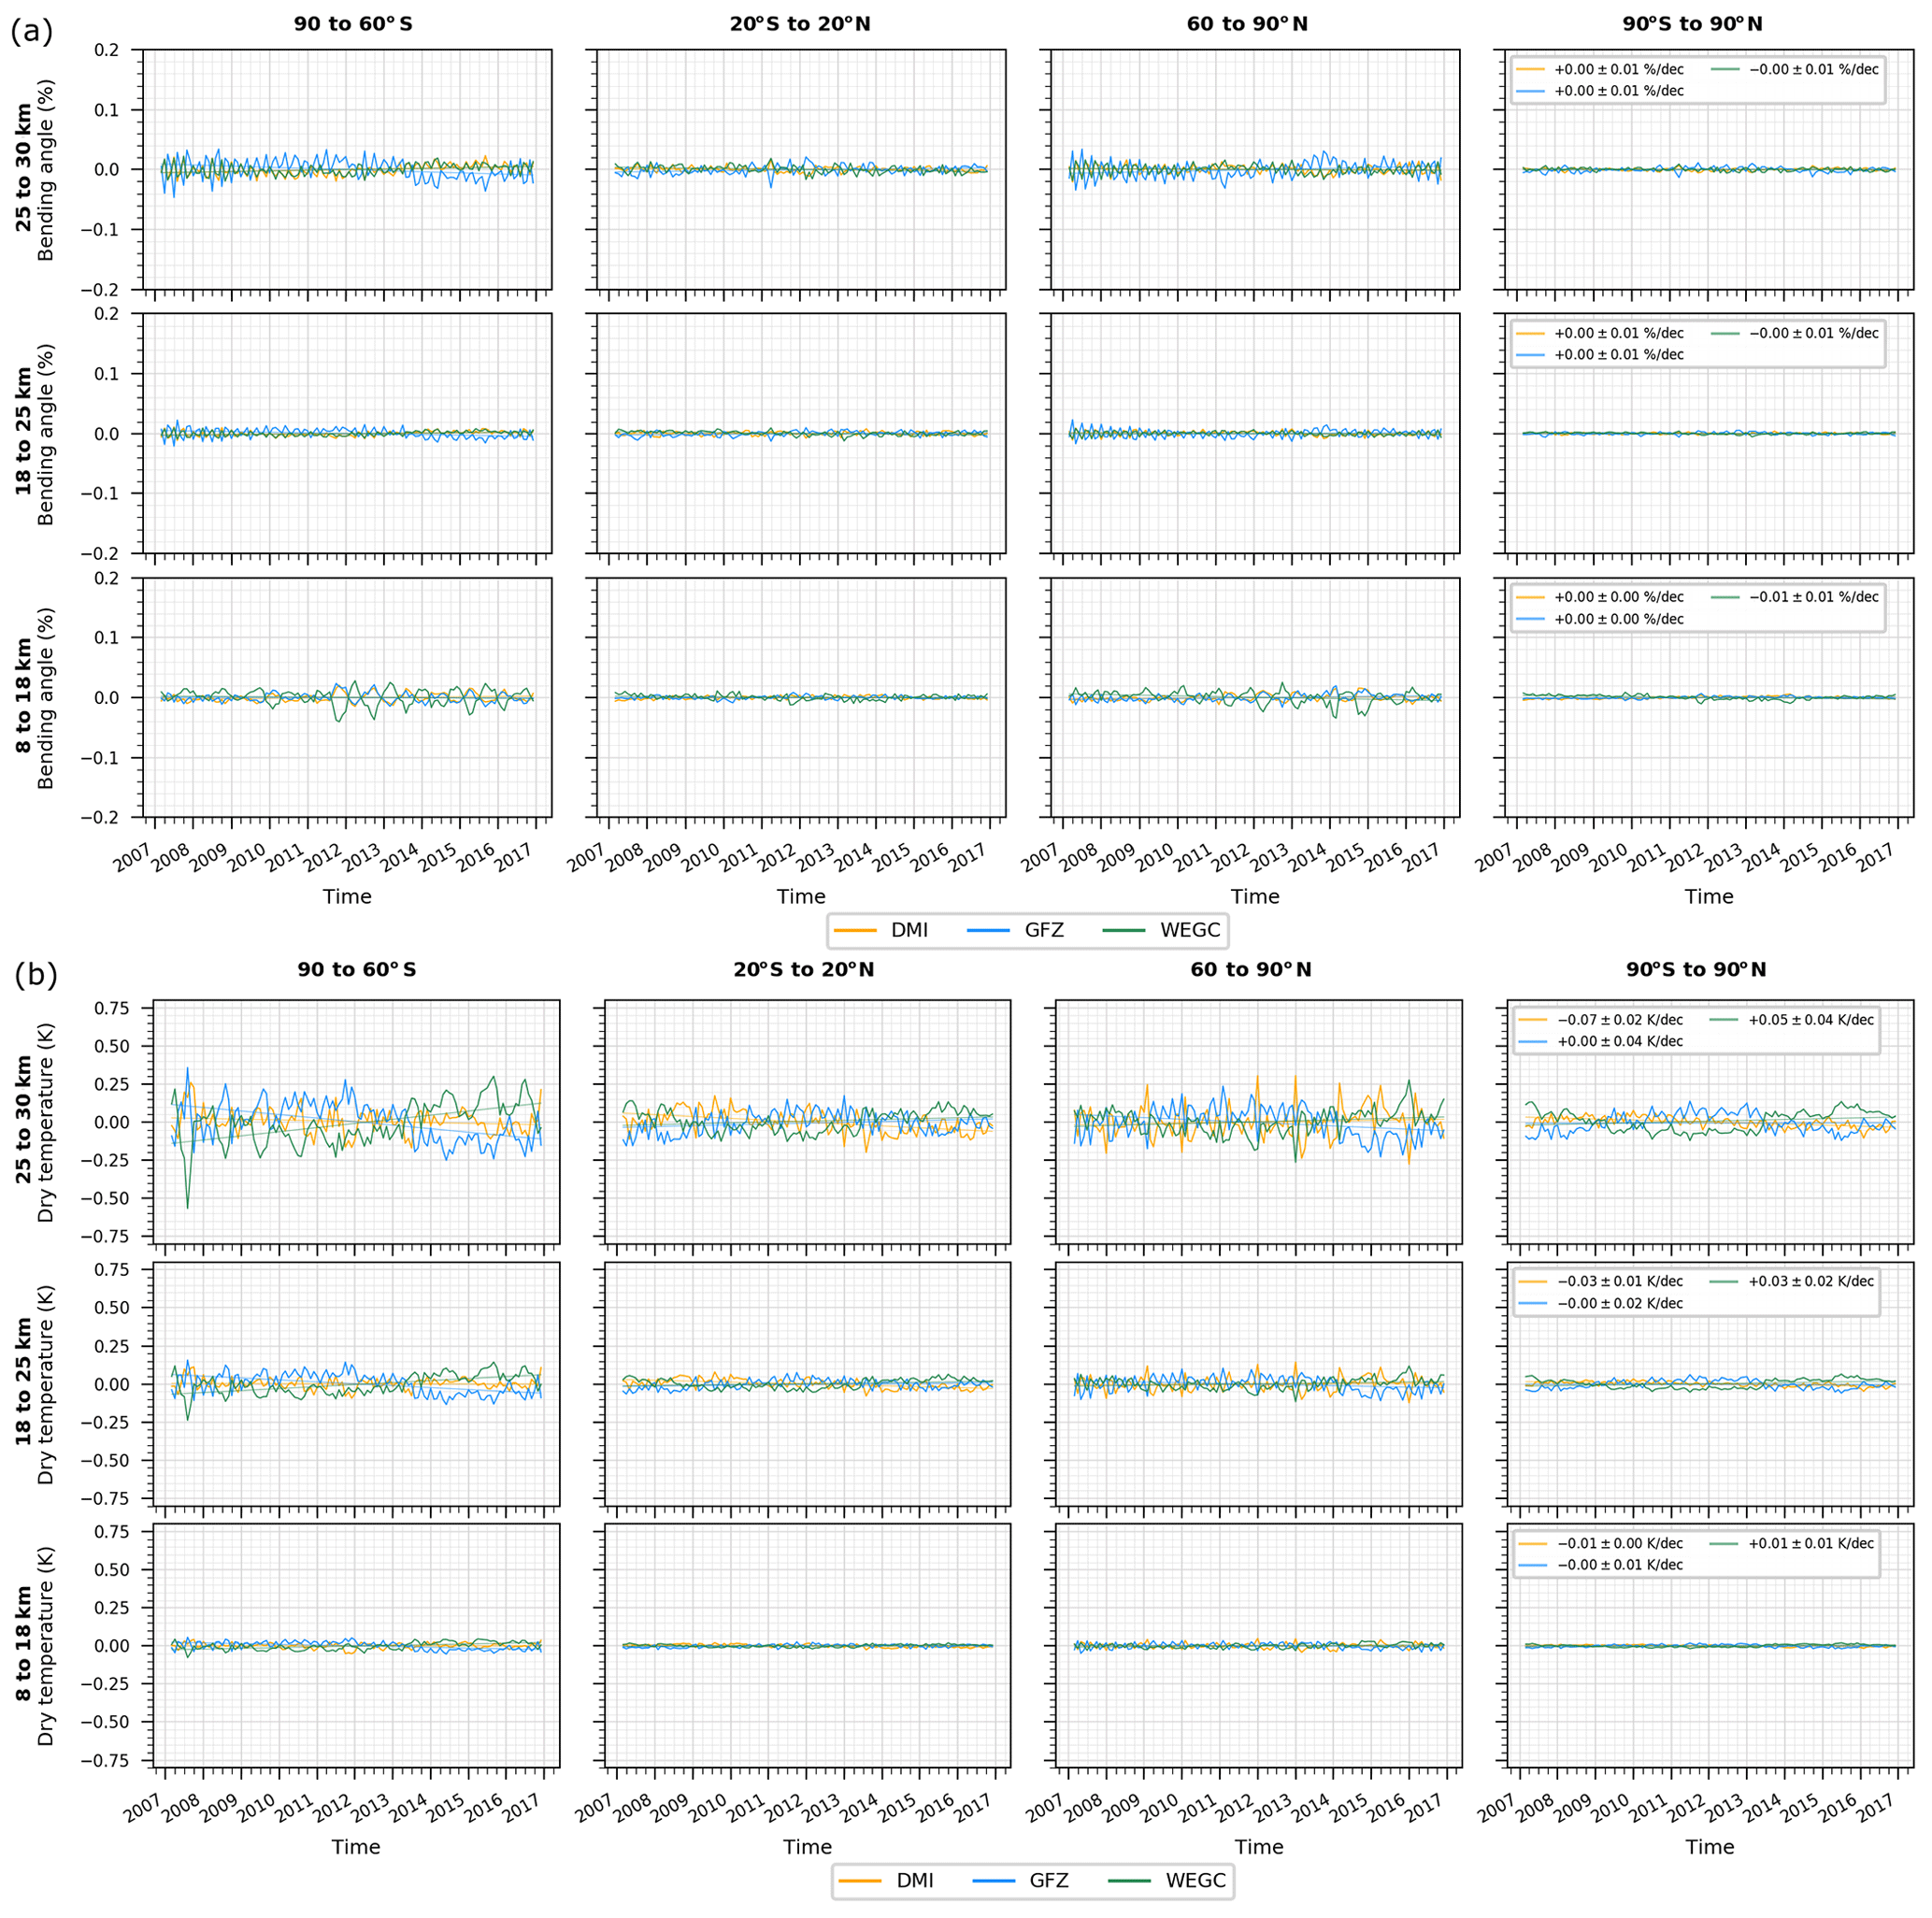
Figure 6GRACE bending angle (a) and dry temperature (b) de-seasonalized anomaly difference time series based on 10∘ zonal medians of each center to the all-center mean for latitude bands 90 to 60∘ S, 20∘ S to 20∘ N, 60 to 90∘ N, and globally 90∘ S to 90∘ N (left to right) for altitude layers 8–18, 18–25, and 25–30 km (bottom to top). Time series from DMI (orange), GFZ (blue), and WEGC (green) are shown.
GRACE shows highly consistent anomaly differences (Fig. 6a) and similar behavior at all latitudes. An interesting feature in GFZ bending angle is an oscillating variability over time for GRACE data. However, the spread in difference trends is very small at ±0.01 % in all altitude layers. Globally it is zero. Also, for Metop we find high consistency in anomaly differences (Fig. 7a), with a spread in difference trends of ±0.02 % per decade for bending angle except in the tropical band. There, differences are slightly larger at ±0.05 % per decade at 18–25 km.
For refractivity, we find high consistency in the difference trends (not shown here for the time series but shown later in Sect. 4.3). The spread of the difference trends is about ±0.01 % to ±0.02 % per decade at all latitudes at 8–30 km for F3C, GRACE, and Metop and near zero globally. For CHAMP, it is within ±0.02 % to ±0.03 % per decade, and larger differences only occur for GFZ time series at high latitudes.
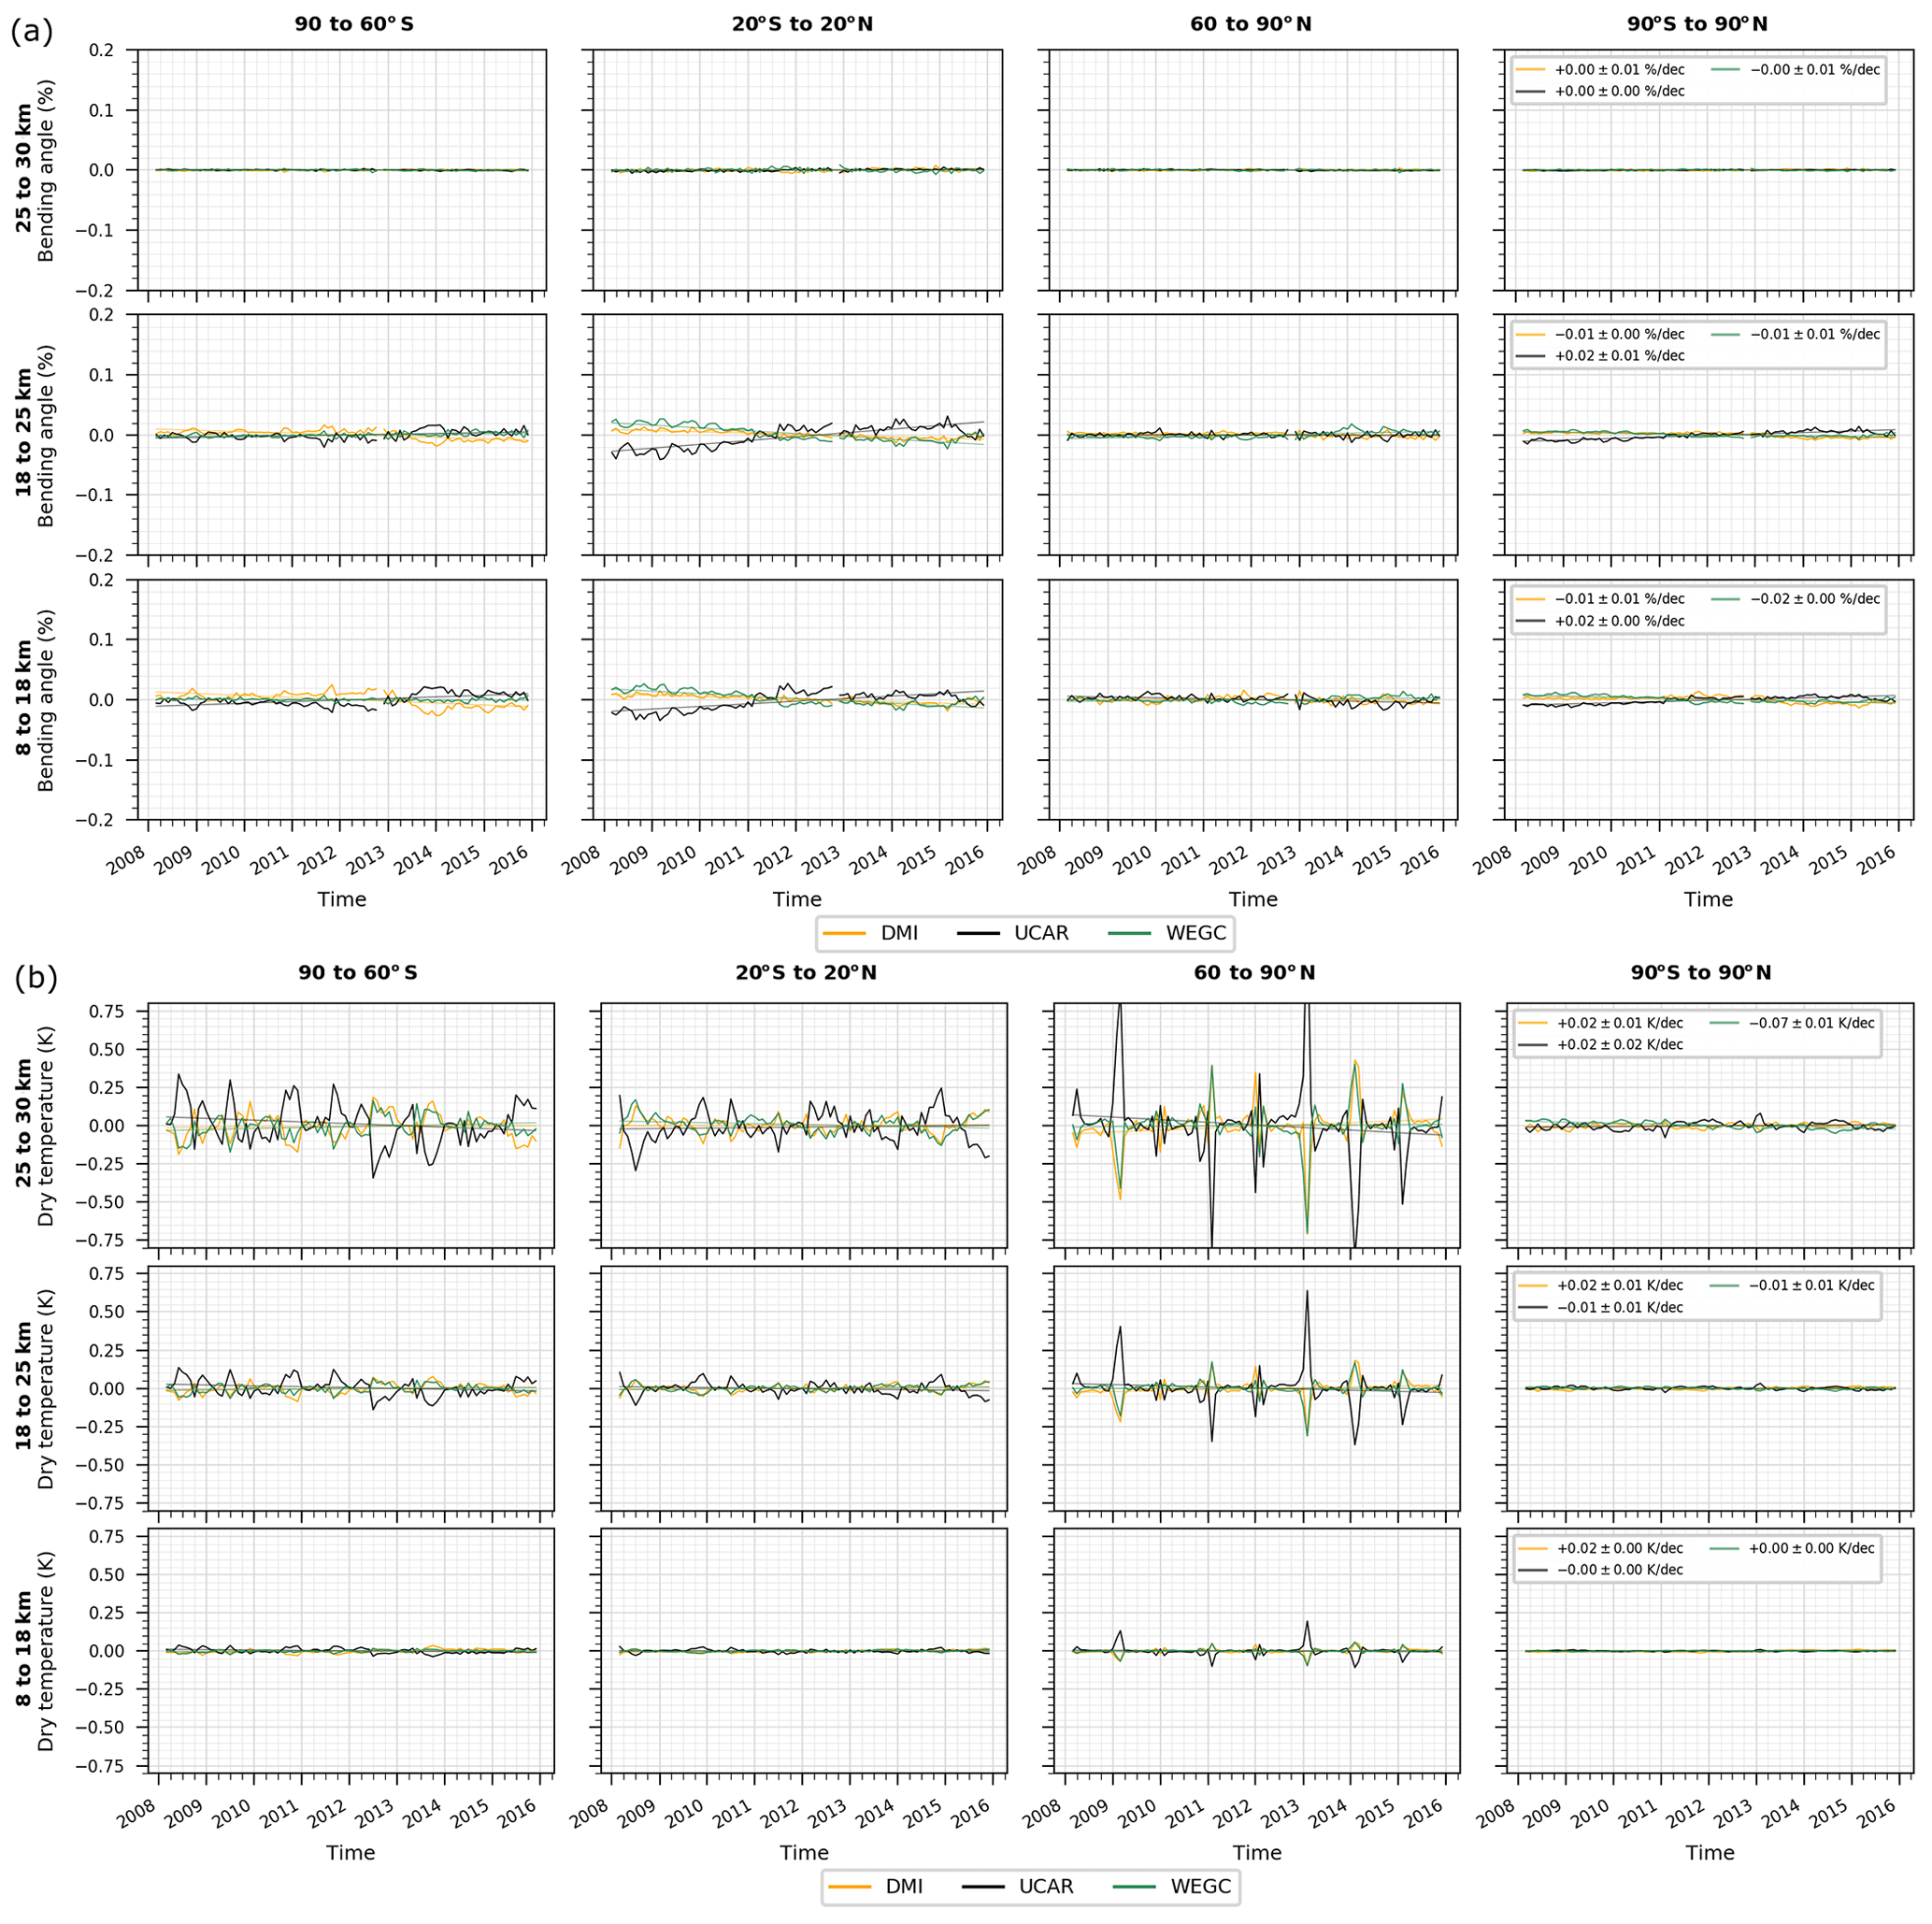
Figure 7Metop bending angle (a) and dry temperature (b) de-seasonalized anomaly difference time series based on 10∘ zonal medians of each center to the all-center mean for latitude bands 90 to 60∘ S, 20∘ S to 20∘ N, 60 to 90∘ N, and globally 90∘ S to 90∘ N (left to right) for altitude layers 8–18, 18–25, and 25–30 km (bottom to top). Time series from DMI (orange), UCAR (black), and WEGC (green) are shown.
For dry temperature, the difference time series show some common features for all satellites. We find that the spread in anomaly difference trends for dry temperature is smallest in the troposphere layer (8–18 km), larger in the lower stratosphere layer (18–25 km), and further increases above. The spread in difference trends is found to be largest for CHAMP (Fig. 4b), followed by F3C (Fig. 5b), GRACE (Fig. 6b), and Metop (Fig. 7b).
The global mean difference trends for CHAMP range from about ±0.06 K per decade at 8–18 km to ±0.15 K per decade at 18–25 km and to about ±0.4 K per decade at 25–30 km. For F3C, the global spread is only ±0.02 K per decade at 8–25 km to ±0.08 K per decade at 25–30 km. For GRACE, it is even smaller at ±0.01 K per decade at lower altitudes, increasing to ±0.06 K per decade at 25–30 km. For Metop, it is near zero in the troposphere, ±0.02 K per decade in the lower stratosphere, and −0.07 to +0.02 K per decade above.
For CHAMP dry temperature, some larger differences occur in the tropics. There, the JPL time series show a slight shift, which is most prominent at upper altitude levels. Some deviations occur in the UCAR time series for some winter months at NHL. These peaks are only visible for a few months when sudden stratospheric warmings occurred. The peaks can be explained by high-altitude initialization with the NCAR climatology, which does not capture the extraordinary large temperature changes at high latitudes during sudden stratospheric warmings. For GRACE, a peak in WEGC data is seen at the beginning of the time series at upper height levels. However, in the global average, the anomaly differences are found to be very small despite some larger deviations in some NHL winter months. Also, the results for physical temperature are in very good agreement. They are consistent with dry temperature, and UCAR data peaks are reduced to about 50 %.
Comparing results of the four RO missions, we find the highest consistency for GRACE and Metop between the centers. CHAMP and F3C show slightly larger differences above 25 km (CHAMP) and at high latitudes (F3C). Apart from small features, the results are very consistent at 8–30 km. One potential reason for the higher consistency of GRACE and Metop records is considered to be technological advances on the newer satellite generations. Partly, it might also be due to the fact that only three centers delivered data for these missions, while five centers provided data for CHAMP and four centers provided data for F3C.
4.3 Structural uncertainty for RO multi-satellite records
Finally, we analyzed the consistency of trends for multi-satellite records from five different processing centers. We calculated trends for all variables based on the anomaly time series of the individual centers. We also computed the all-center mean trend. The spread of the center trends, i.e., the standard deviation of the individual center trends, is taken as a measure for the structural uncertainty of the RO records. We stress at this point that we do not investigate or interpret climatological trends because this is not the focus of this study. Here, we are interested in the structural uncertainty of the RO records.
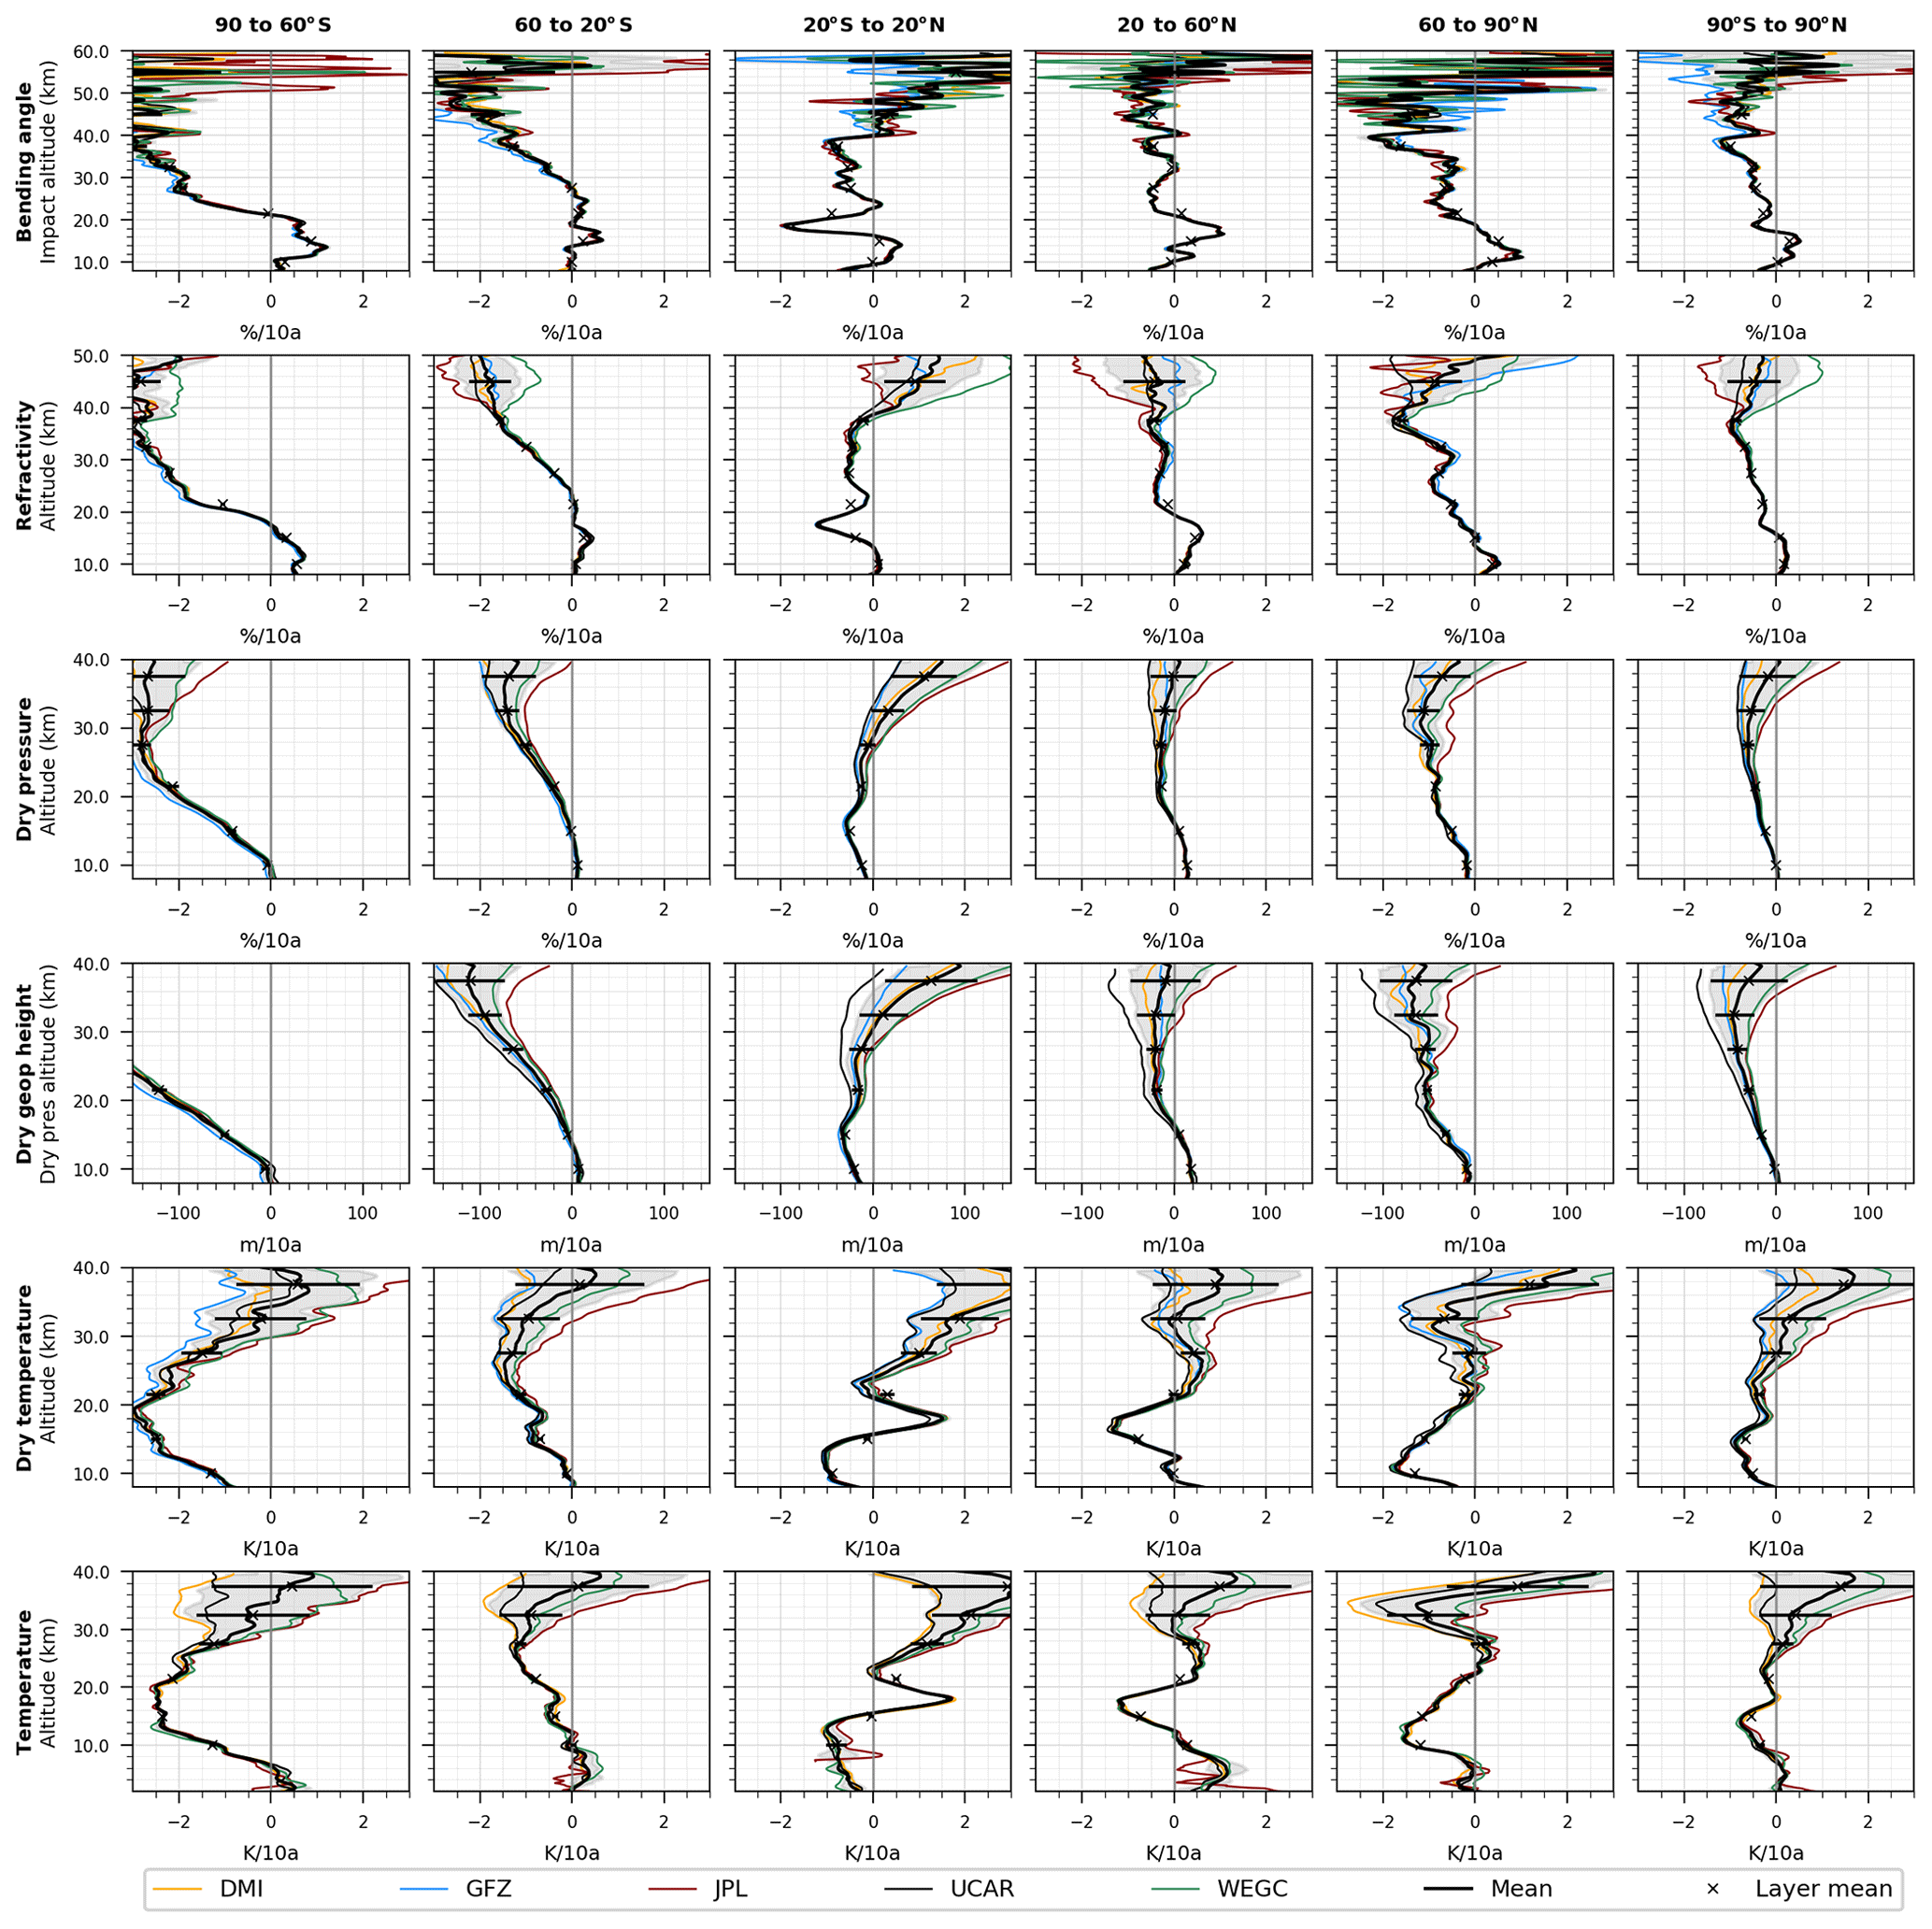
Figure 8CHAMP structural uncertainty indicated as the standard deviation (gray) of the individual center trends per decade based on 10∘ zonal medians for DMI (orange), GFZ (blue), JPL (red), UCAR (black), and WEGC (green); shown for bending angle, refractivity, dry pressure, dry geopotential height, dry temperature, and temperature (top to bottom). The all-center mean trend profile (bold black line) and the altitude-layer mean trends (crosses, with horizontal bars showing the uncertainty) are indicated. Profiles are smoothed with a 1 km running average.
We present trends and standard deviations for each RO mission separately: for CHAMP (Fig. 8), F3C (Fig. 9), GRACE (Fig. 10), and Metop (Fig. 11) for bending angle, refractivity, dry pressure, dry geopotential height, dry temperature, and temperature. We show the results for five latitude zones and for the global mean at the vertically resolved grid for bending angle up to 60 km of altitude, for refractivity up to 50 km, and for the other variables up to 40 km. At lower altitudes, we cut at 8 km for dry parameters and at 2 km for temperature.
For CHAMP (Fig. 8), the structural uncertainty of the trends from different processing centers is found to be small below 40 km for bending angle, below 30 km for refractivity and dry pressure, and below 25–28 km for (dry) temperature at all latitudes. Structural uncertainty increases above 25 km and at high latitudes, mainly due to increased sensitivity to the different bending angle initialization approaches implemented at each center, including different high-altitude background information. Compared to the results of Steiner et al. (2013) for CHAMP, we find in this study better agreement between the centers because improved data versions have been delivered. At high latitudes the uncertainty is smaller here, which is most probably due to a new data version provided by GFZ.
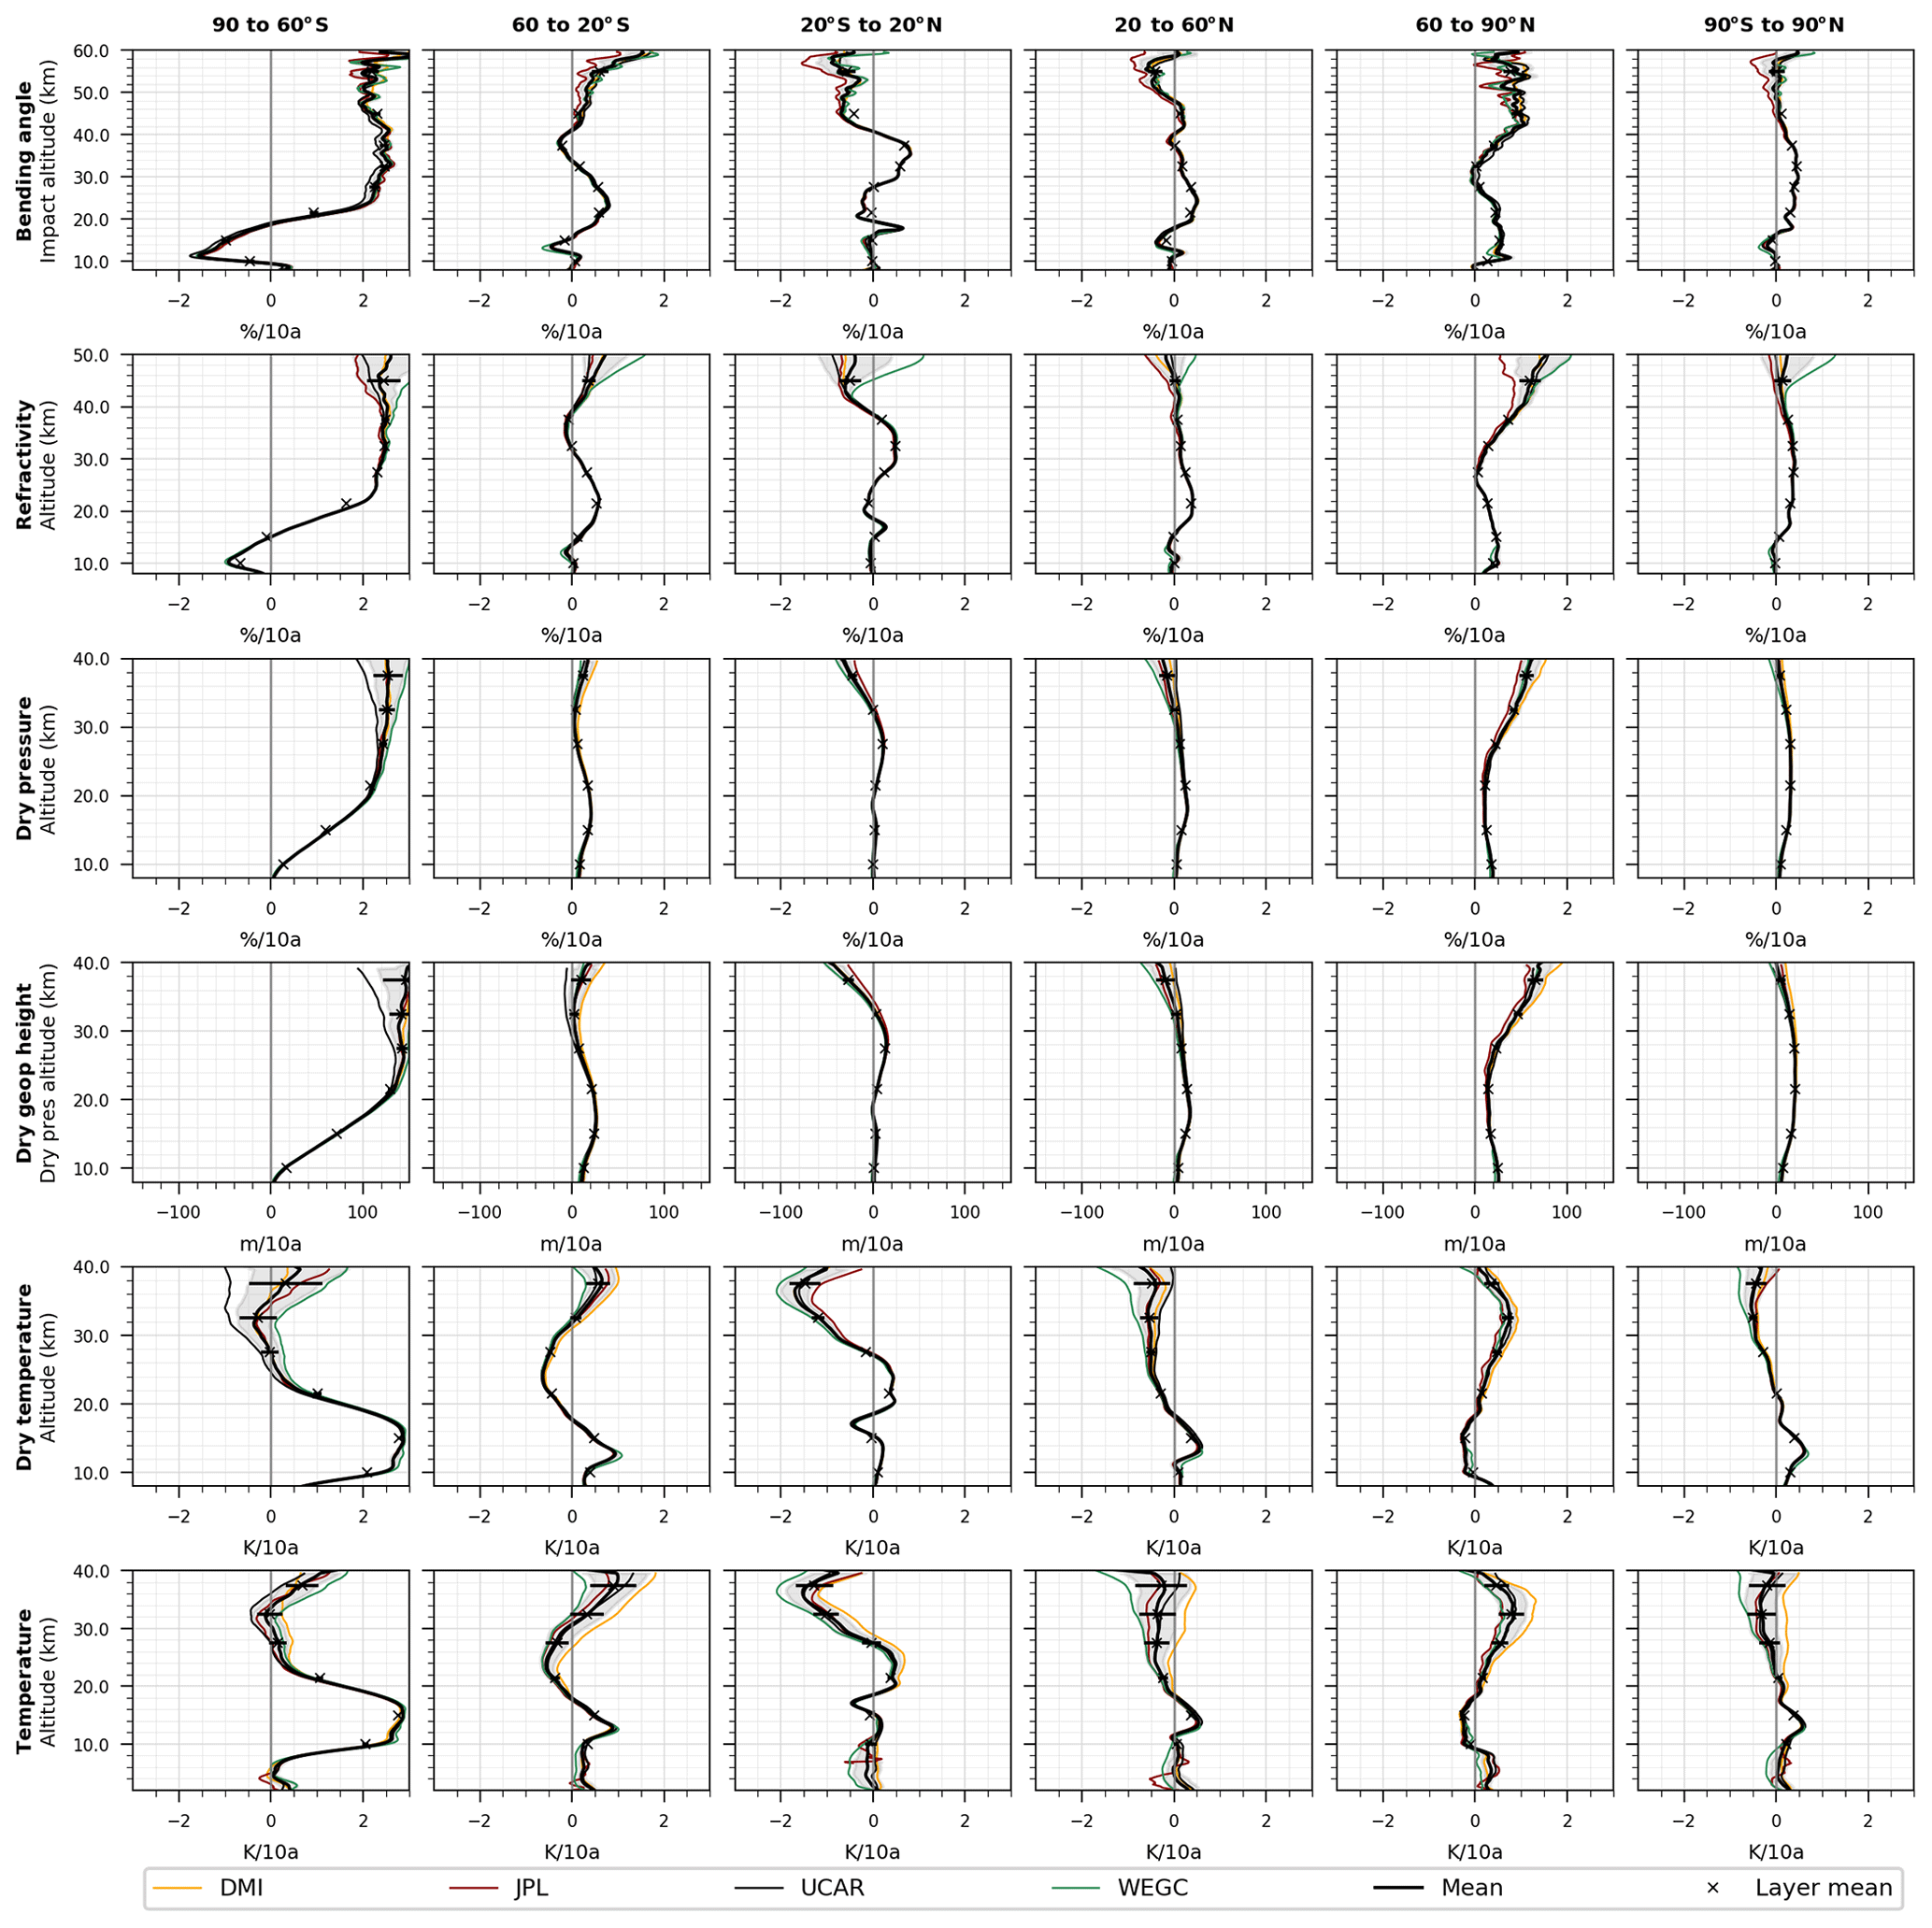
Figure 9F3C structural uncertainty indicated as the standard deviation (gray) of the individual center trends per decade based on 10∘ zonal medians for DMI (orange), JPL (red), UCAR (black), and WEGC (green); shown for bending angle, refractivity, dry pressure, dry geopotential height, dry temperature, and temperature (top to bottom). The all-center mean trend profile (bold black line) and the altitude-layer mean trends (crosses, with horizontal bars showing the uncertainty) are indicated. Profiles are smoothed with a 1 km running average.
For F3C (Fig. 9), the structural uncertainty is much smaller compared to CHAMP. It is low for bending angle up to 50 km, for refractivity up to 45 km, for dry pressure up to 40 km, and for (dry) temperature up to 30 km. At SHL, the structural uncertainty becomes larger for dry pressure and dry temperature above about 25 km of altitude.
For GRACE (Fig. 10), the structural uncertainty is very small at all altitude levels and at all latitudes, except for SHL. Larger structural uncertainty is only found at upper altitudes for bending angle and refractivity and at SHL for all variables.
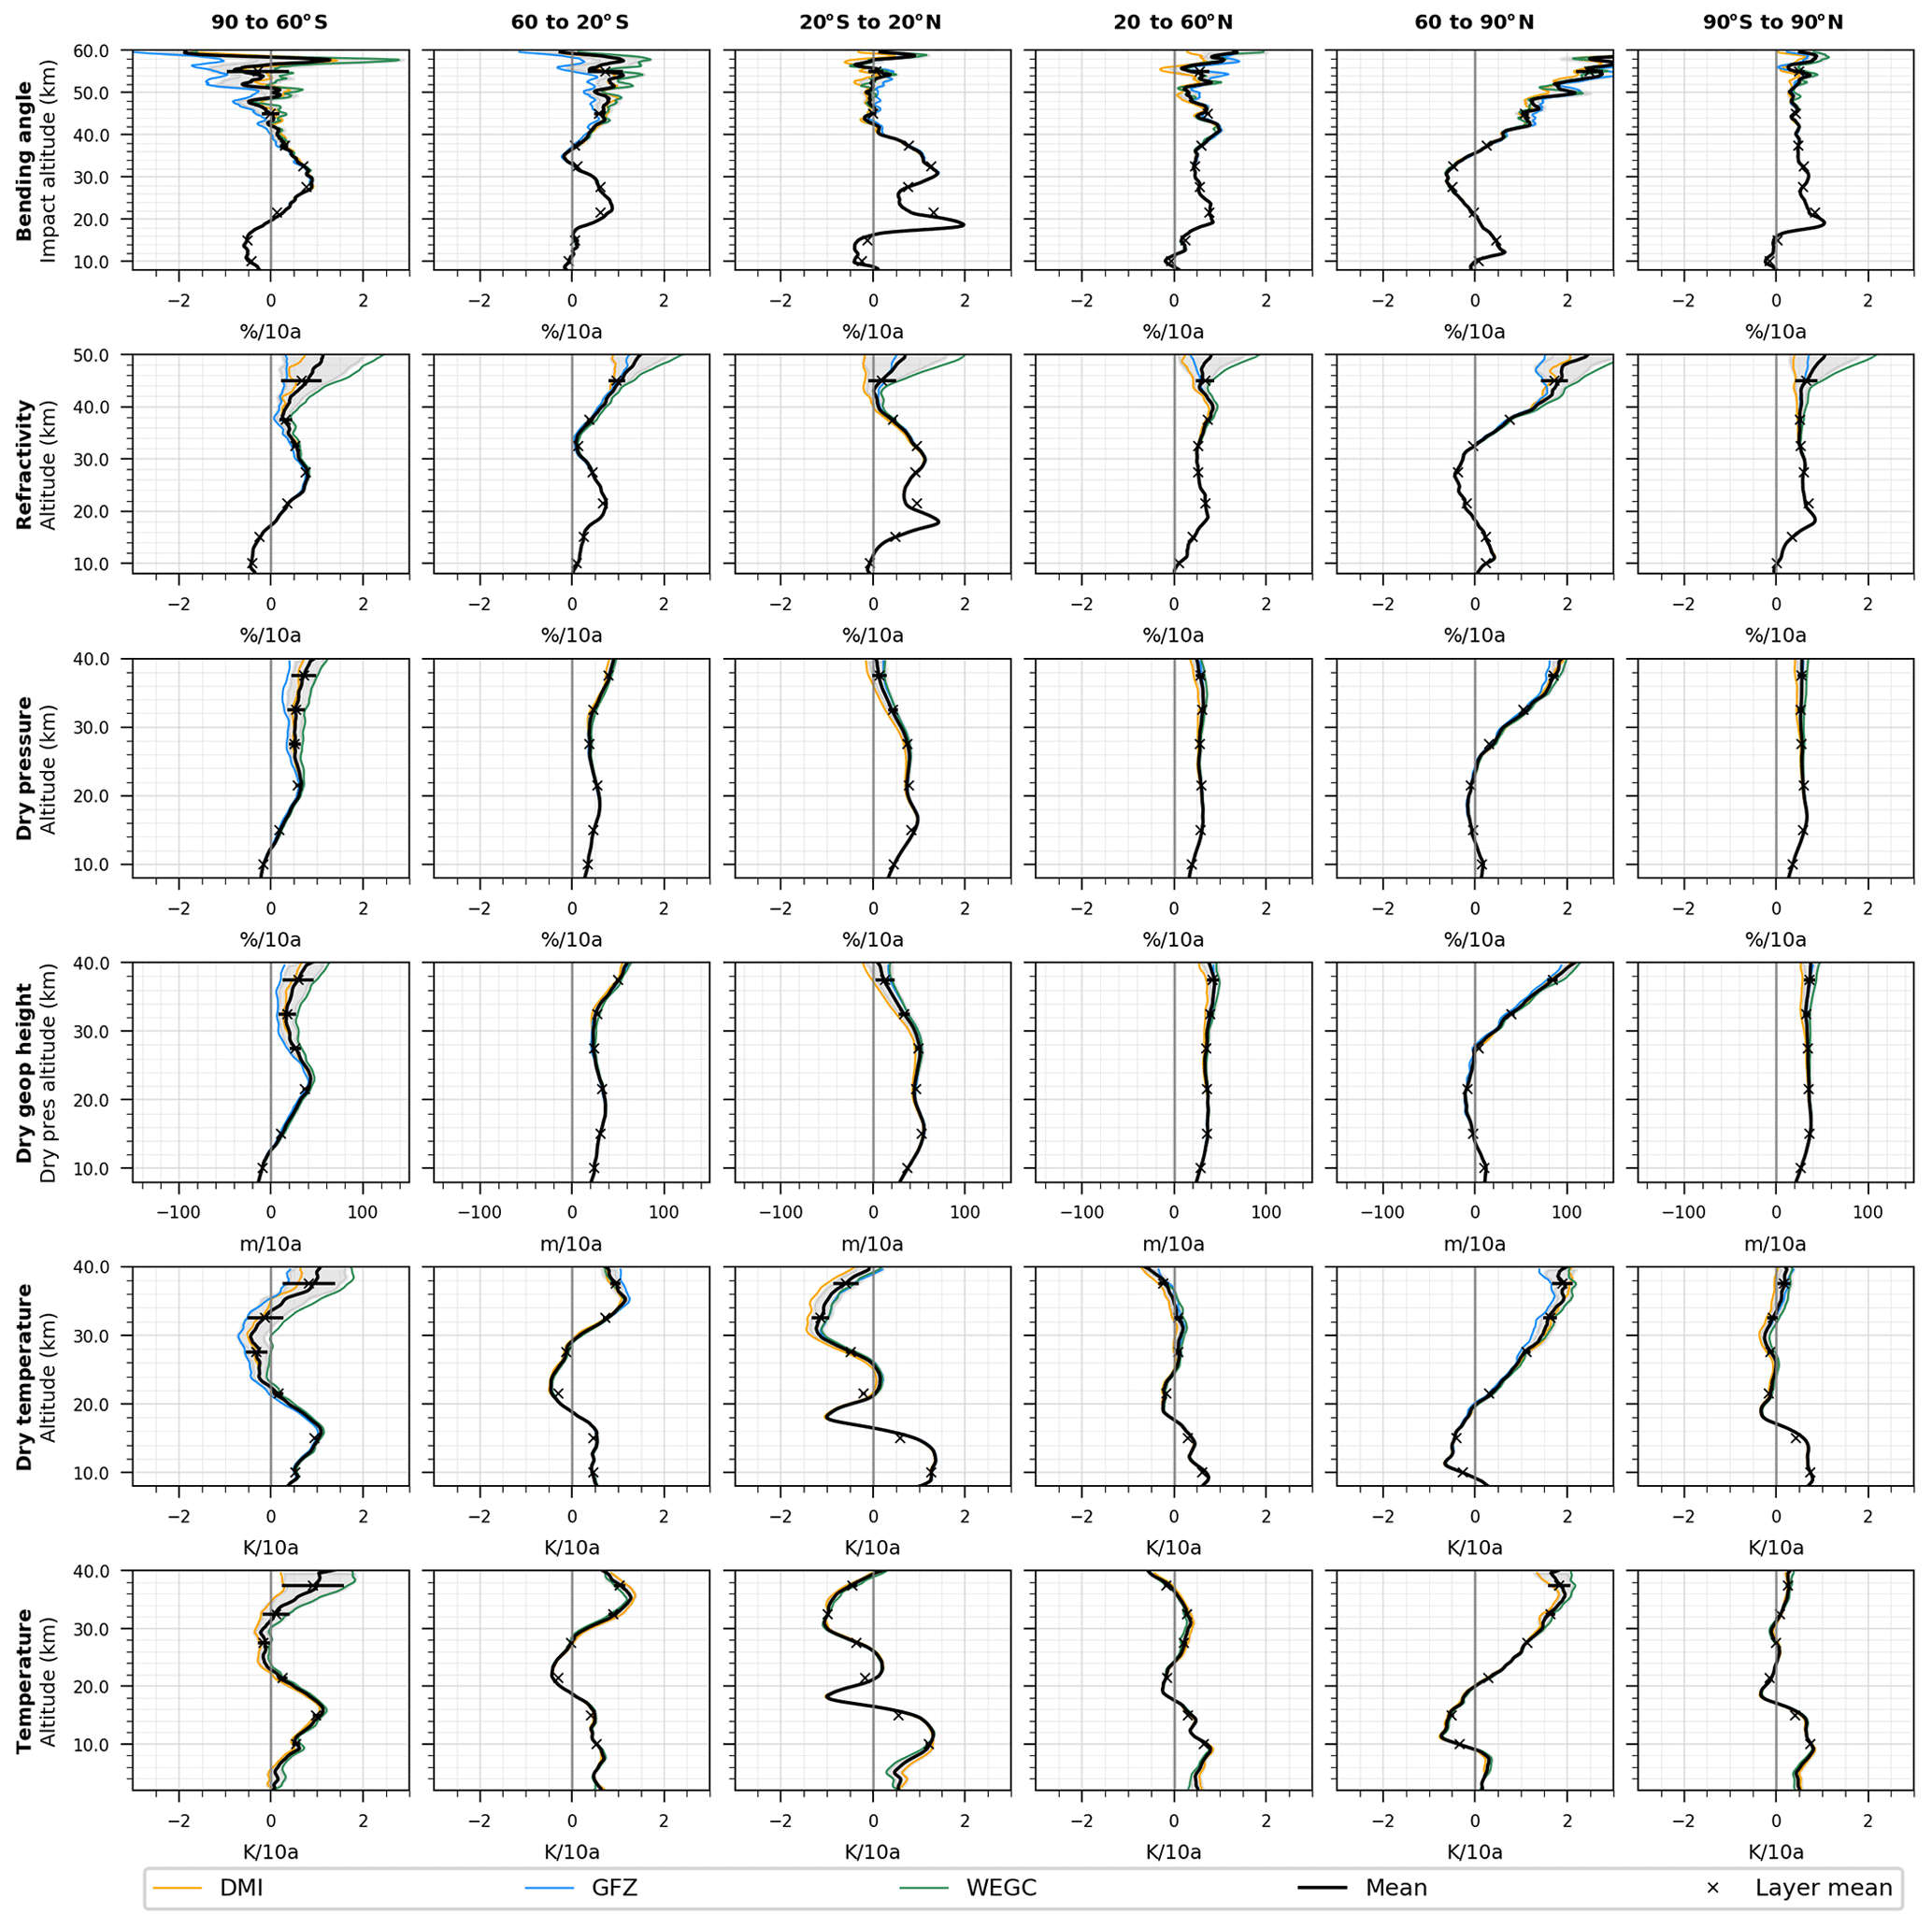
Figure 10GRACE structural uncertainty indicated as the standard deviation (gray) of the individual center trends per decade based on 10∘ zonal medians for DMI (orange), GFZ (blue), and WEGC (green); shown for bending angle, refractivity, dry pressure, dry geopotential height, dry temperature, and temperature (top to bottom). The all-center mean trend profile (bold black line) and the altitude-layer mean trends (crosses, with horizontal bars showing the uncertainty) are indicated. Profiles are smoothed with a 1 km running average.
For Metop (Fig. 11), the structural uncertainty is found to be smallest compared to the other missions. High consistency is found at all latitudes and over all altitudes. A small difference in the trend near 20 km is visible for WEGC data. This is due to the handling of Metop data, whereby due to a tracking update in 2013 rising occultations are tracked only from about 20 km upwards.
A summary of the resulting standard deviation numbers is given in Fig. 12 for all parameters and all satellites. We set these results into context with the GCOS stability requirements for ECVs, defined by 0.05 K per decade air temperature in the troposphere and stratosphere (GCOS, 2016), formerly by 0.1 K per decade in the stratosphere (GCOS, 2011). For the other RO variables no dedicated GCOS requirements exist, but they can be estimated from physical relations between these variables with reasonable scaling. The corresponding estimates for 0.1 K per decade in temperature are 0.05 % per decade for refractivity (factor 0.5), 0.12 % per decade for bending angle (factor ∼2.4), 0.06 % per decade for pressure, and about 4 m per decade for geopotential height. The relation between geopotential height and pressure changes is given via an atmospheric scale height of about 70 m geopotential height change per 1 % pressure change (see Steiner et al., 2013).
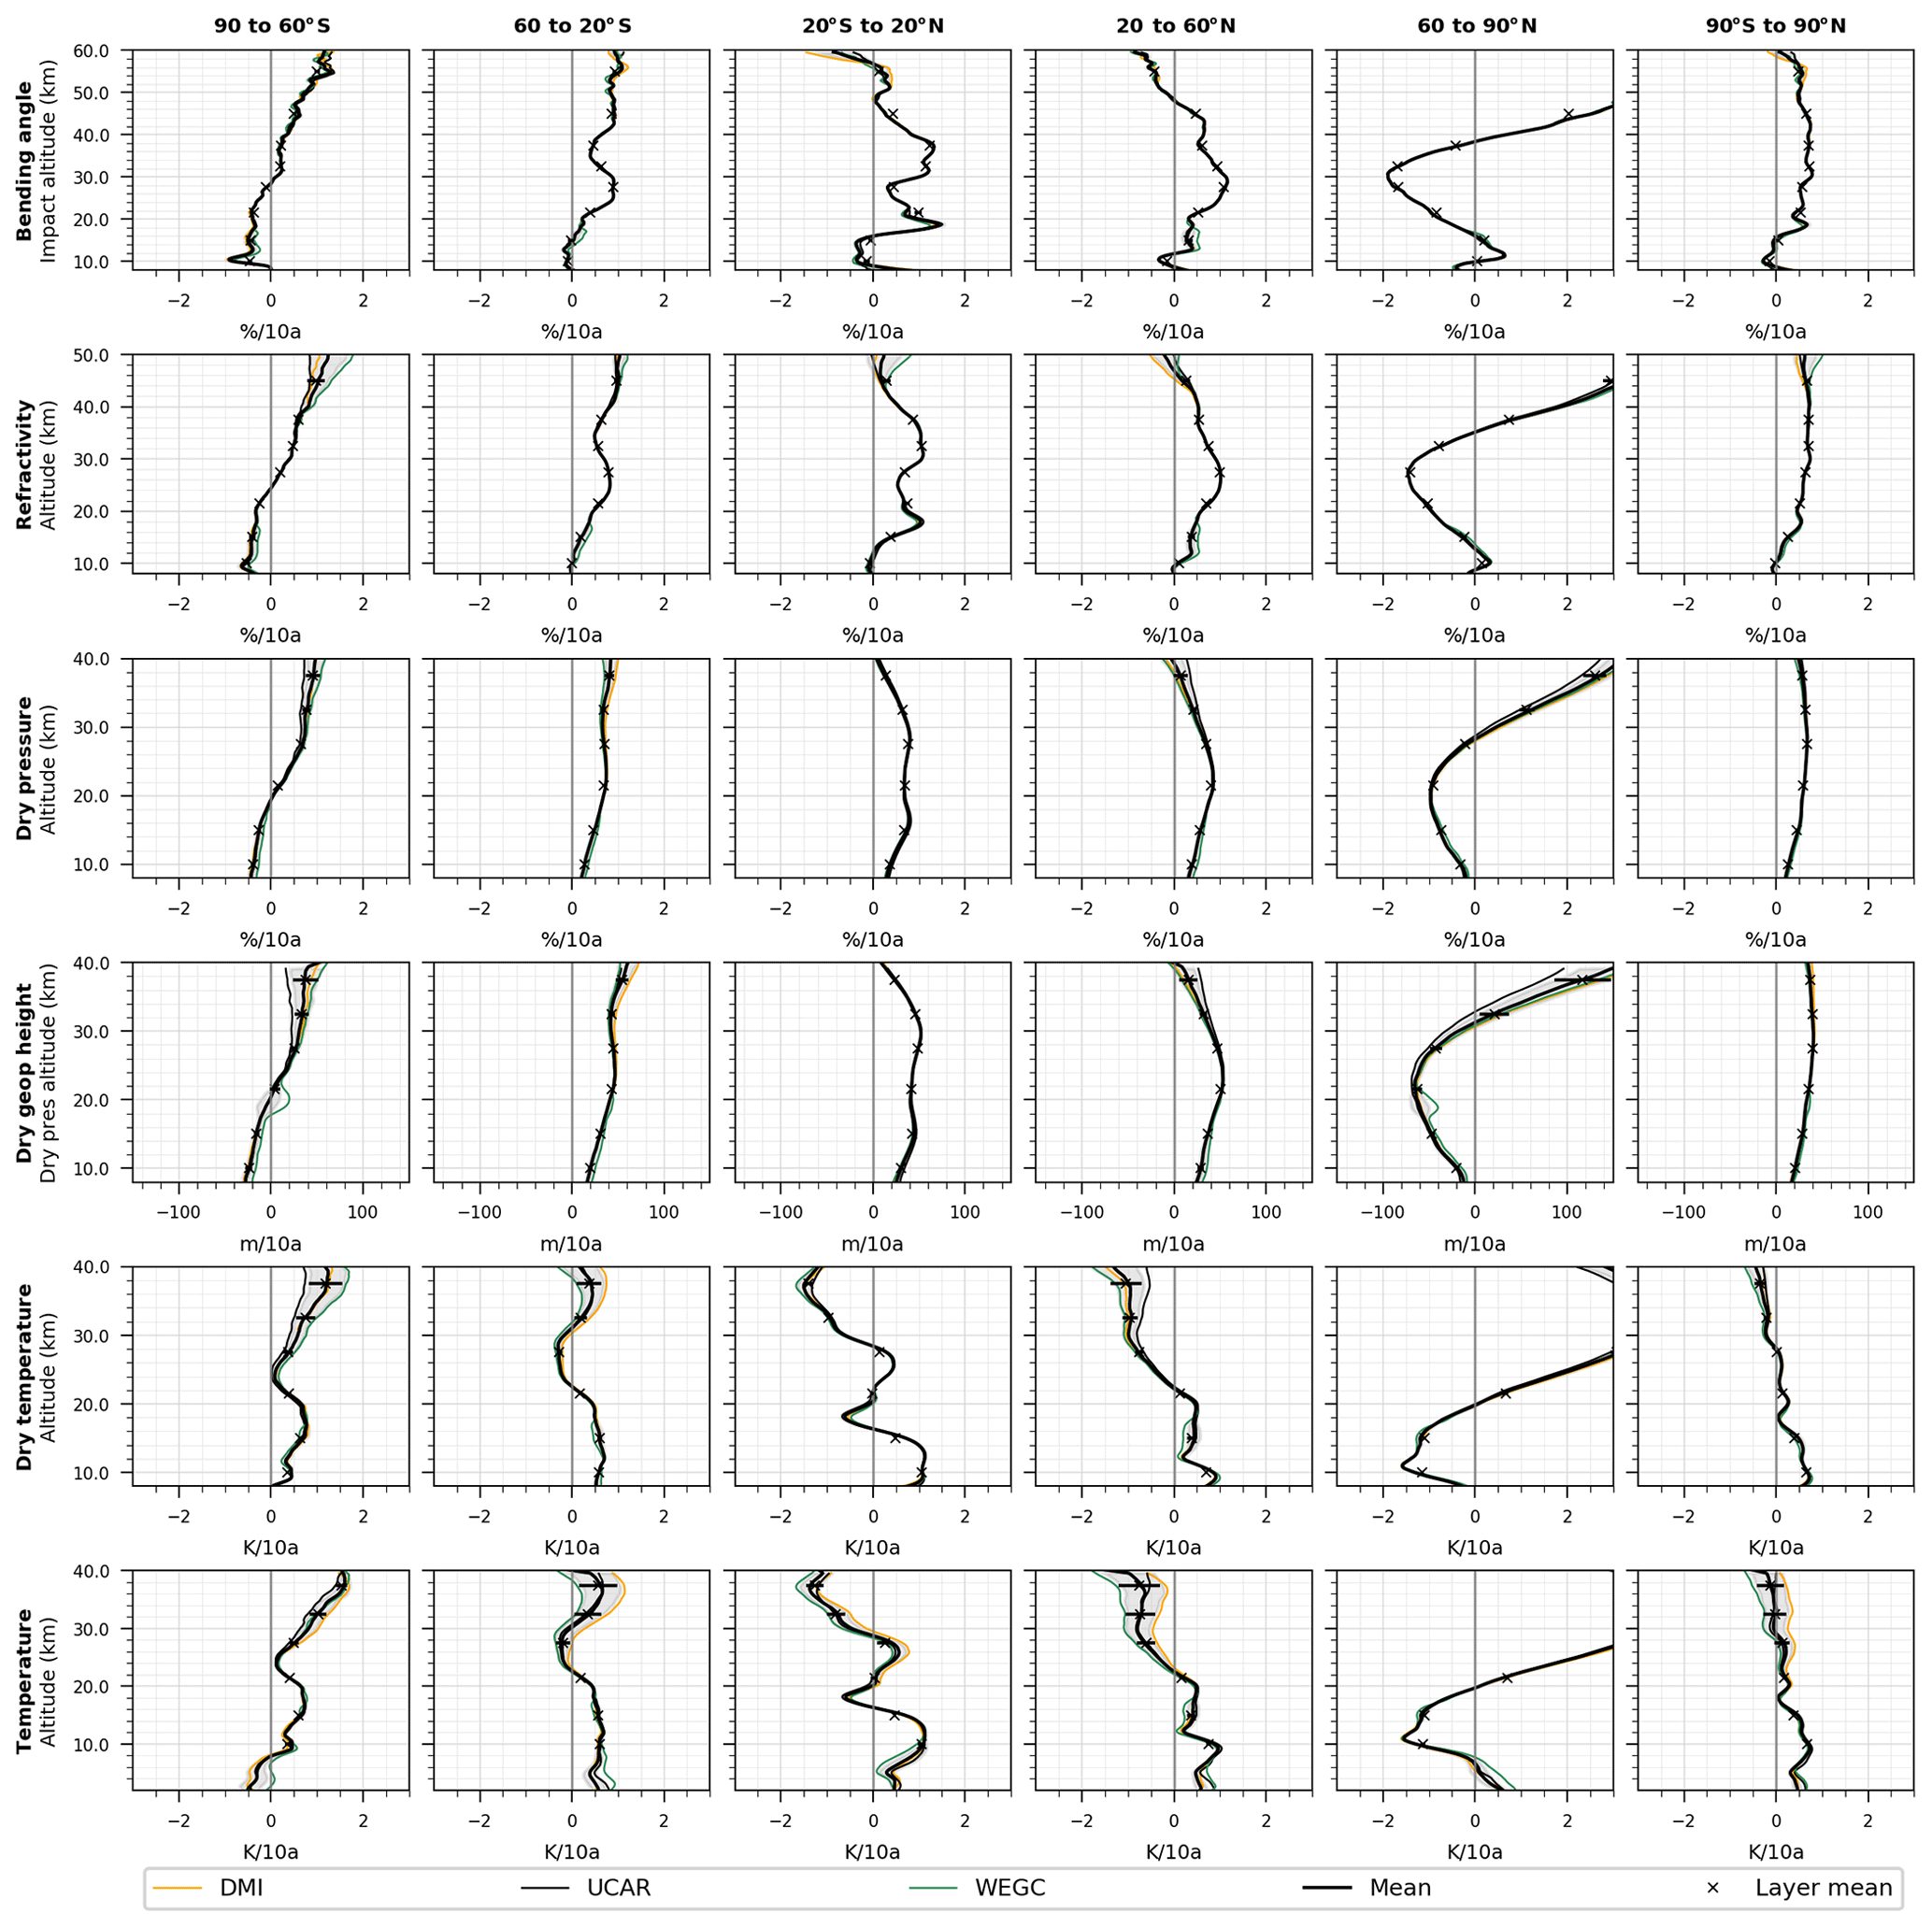
Figure 11Metop structural uncertainty indicated as the standard deviation (gray) of the individual center trends per decade based on 10∘ zonal medians for DMI (orange), UCAR (black), and WEGC (green); shown for bending angle, refractivity, dry pressure, dry geopotential height, dry temperature, and temperature (top to bottom). The all-center mean trend profile (bold black line) and the altitude-layer mean trends (crosses, with horizontal bars showing the uncertainty) are indicated. Profiles are smoothed with a 1 km running average.
In Fig. 12, we visually relate the standard deviation to the GCOS stability criteria via color coding, whereby light orange indicates that the criteria are met for temperature with 0.05–0.1 K per decade and the corresponding criteria for the other RO variables.
For the global average, the standard deviation of bending angle trends is < 0.06 % per decade for the altitude layers 8–50 km for all satellite missions and < 0.12 % for latitudinal averages. For CHAMP it is larger above 30 km. For refractivity trends, the standard deviation is < 0.03 % per decade at 8–35 km for all satellites globally. Only for CHAMP is it again larger above 30 km and for Metop and GRACE at NHL and SHL (∼0.05 %) for some layers. For (dry) pressure trends, the standard deviation is < 0.03 % per decade at 8–30 km globally and < 0.06 % per decade at all latitudes, except for CHAMP. Dry geopotential height shows a standard deviation of < 2–4 m for all satellites below 35 km globally and below 30 km for tropics and midlatitudes. For CHAMP it is about 10–20 m per decade at 25–35 km of altitude.
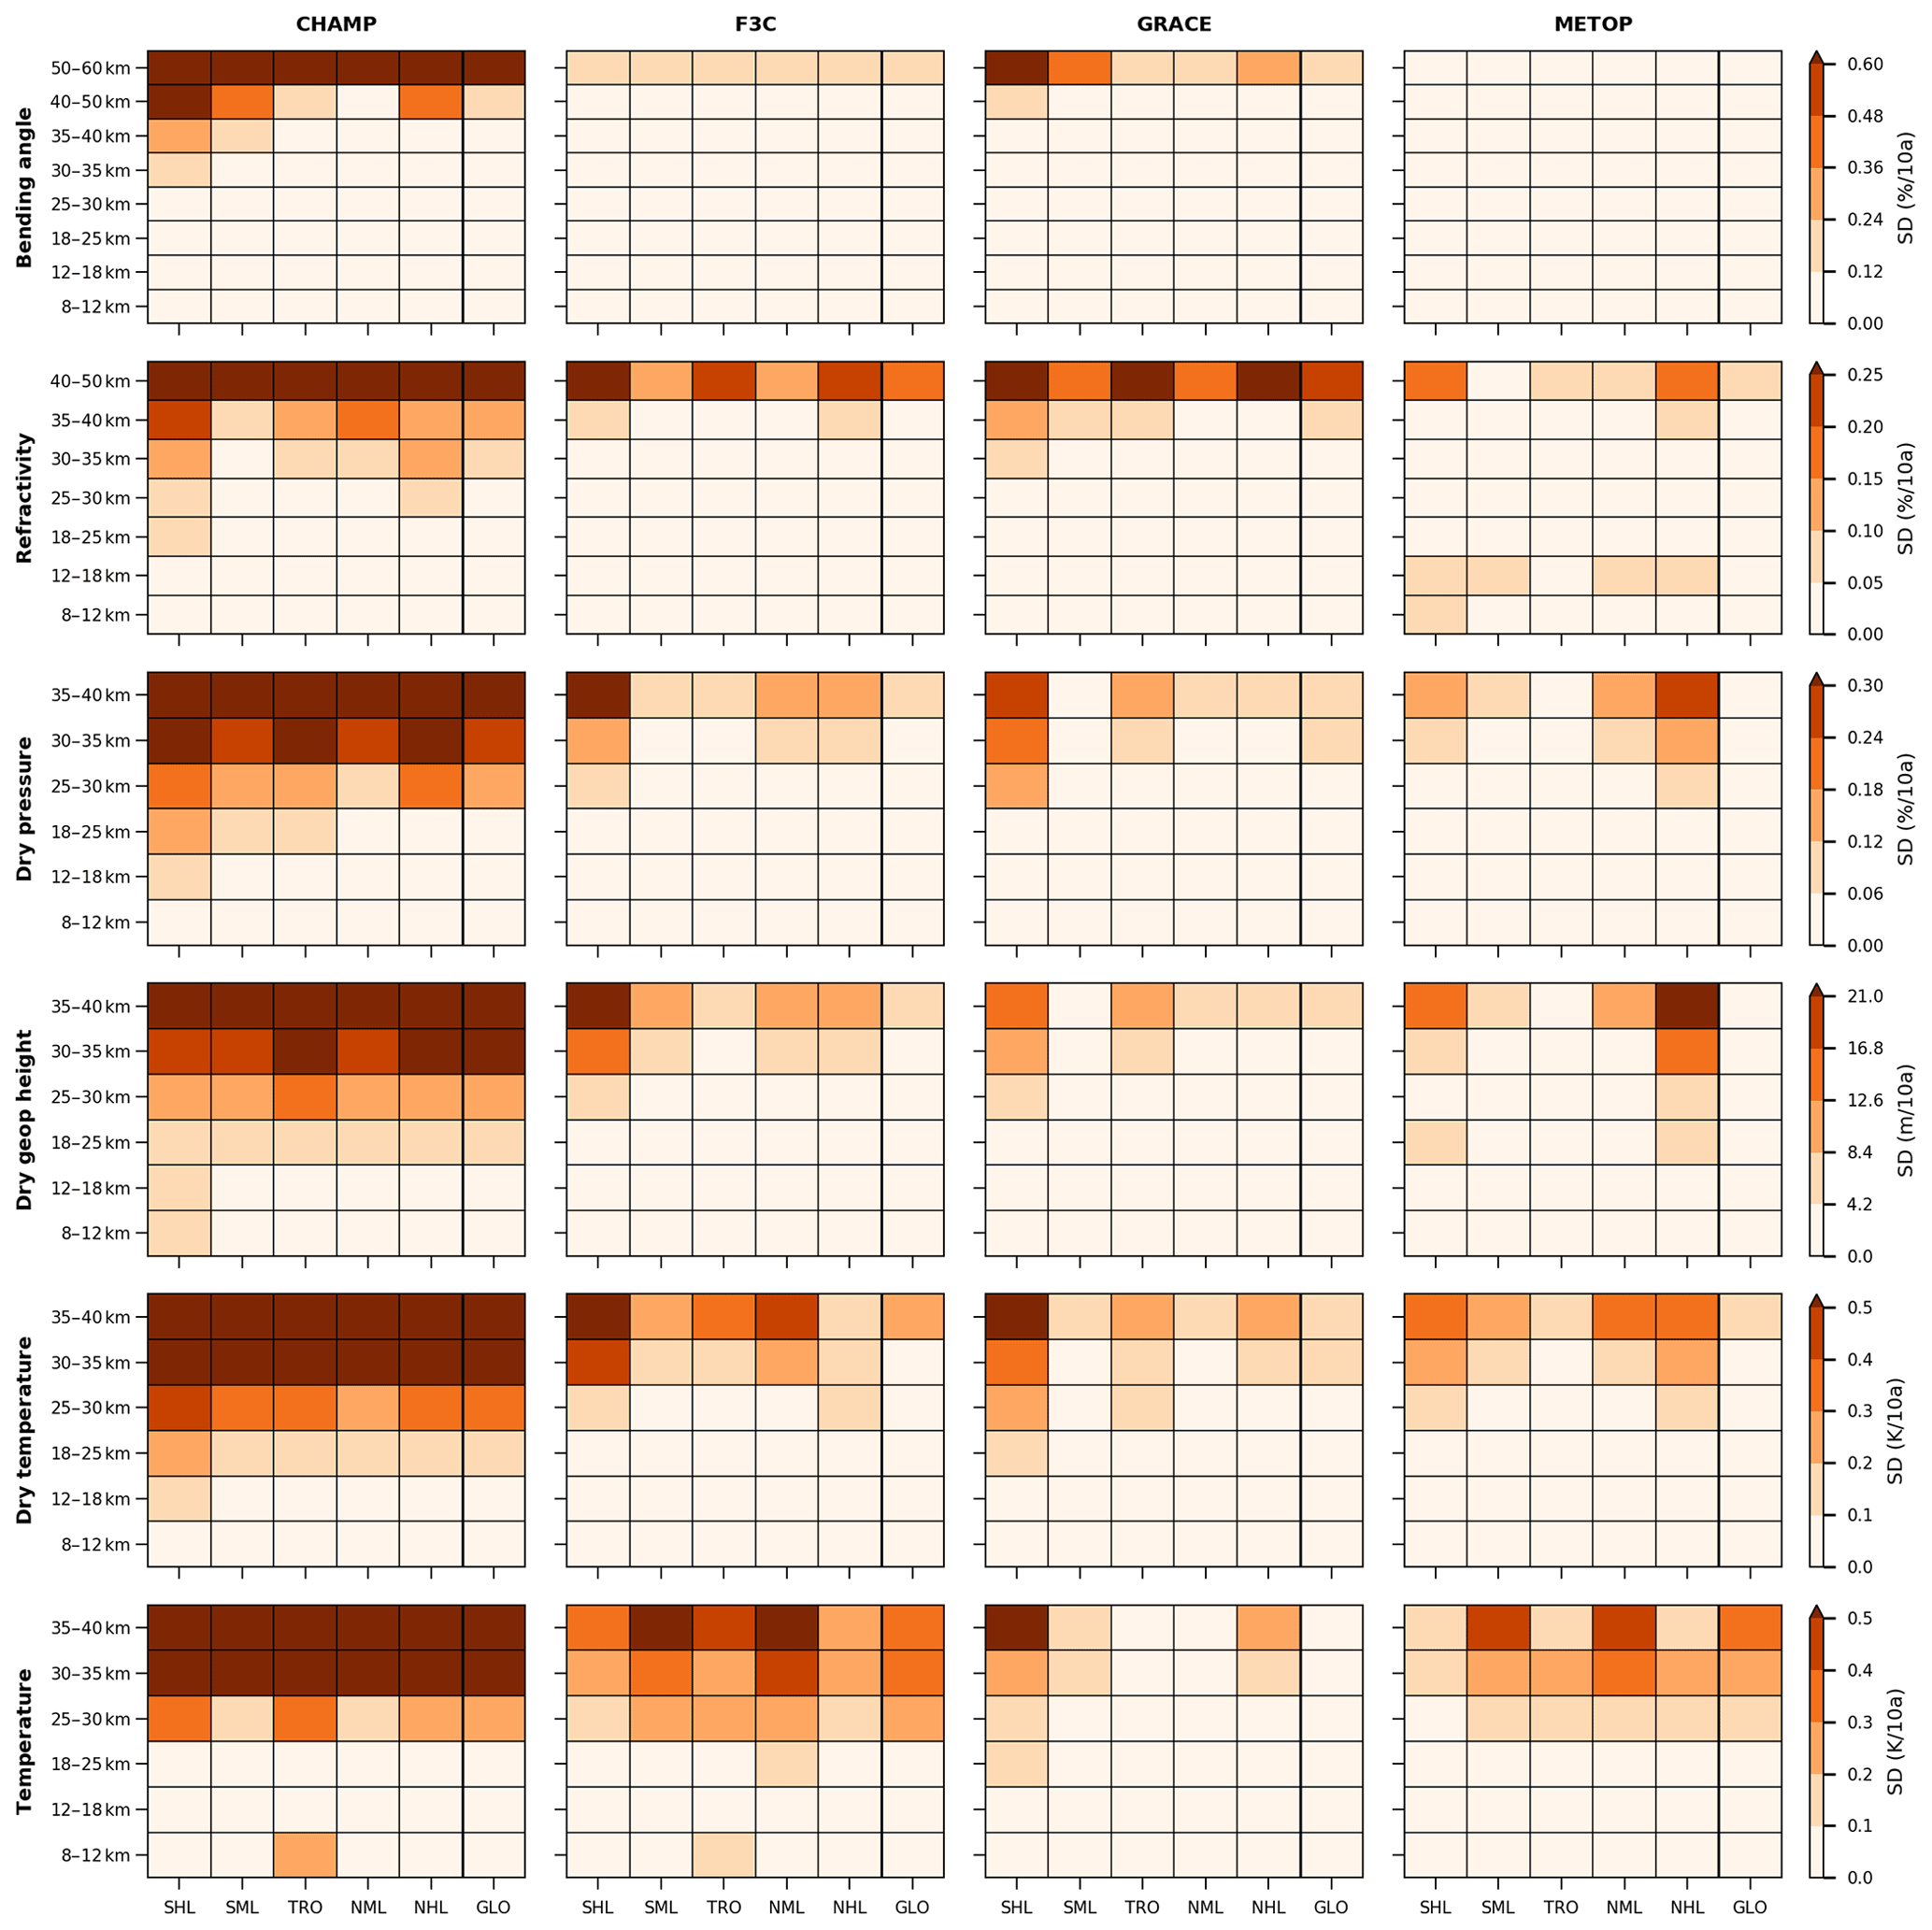
Figure 12Overview of structural uncertainty for different RO missions: CHAMP, F3C, GRACE, and Metop (left to right). Shown is the standard deviation of individual center trends per decade based on 10∘ zonal medians for RO bending angle, refractivity, dry pressure, dry geopotential height, dry temperature, and temperature (top to bottom) for all latitude zones and altitude layers in the sub-panels.
For dry temperature trends, the standard deviation is < 0.05 K per decade at 8–25 km for all satellites, except for CHAMP for which it is about 0.1 K at 18–25 km. Even at 25–35 km, the standard deviation for dry temperature is globally < 0.05–0.11 K per decade for F3C, GRACE, and Metop, whereas for CHAMP it increases to about 0.5 K per decade globally. Physical temperature shows similar uncertainty at lower altitudes; however, above about 30 km it can be larger than for dry temperature due to different a priori information in moist air retrievals.
We find that RO multi-satellite data products from different centers are highly consistent at 8–25 km for all RO missions over all latitudes. Figure 12 reveals that F3C, GRACE, and Metop are usable for climate studies up to higher altitudes of 30–35 km for temperature, geopotential height, and pressure and 40 km for refractivity. Bending angles are found to be consistent up to 50 km because they are less sensitive to a priori information and thus useful for climate monitoring (Ringer and Healy, 2008). These results underline the value of RO as a climate data record along the GCOS stability requirements for air temperature, and correspondingly for the other RO variables in the specified regions.
The aim of this study was to assess the consistency and long-term stability of RO observations for use as climate data records of essential climate variables in a global climate observing system. We therefore performed a rigorous intercomparison study of a full set of RO data products from multiple satellites provided by different RO processing centers. We analyzed all available RO data products from dry and moist air retrievals. The atmospheric variables included bending angle, optimized bending angle, refractivity, dry pressure, dry temperature, dry geopotential height, pressure, temperature, and specific humidity. Data products were delivered by five RO processing centers for the RO missions CHAMP, Formosat-3/COSMIC, GRACE, and Metop.
As a measure for consistency and stability, we investigated the structural uncertainty of RO multi-satellite records that arises from different processing schemes. Based on the common subsets of delivered RO profiles, we computed de-seasonalized time series and difference time series of individual centers with respect to the all-center mean, as well as respective linear trends of the time series. The spread of the difference time series was investigated as one indication of structural uncertainty. We finally quantified the structural uncertainty of trends based on the standard deviation of the individual center trends. This uncertainty measure gives a representation of the stability of the multi-satellite RO records, enabling assessment against GCOS stability requirements and of the consistency of products from different processing centers.
Globally, the standard deviation of bending angle trends is found to be < 0.06 % per decade in the altitude layers 8–50 km for all satellite missions except for CHAMP (up to 30 km). For refractivity trends, the standard deviation is < 0.03 % per decade at 8–35 km in these altitude layers for all satellites except CHAMP. For (dry) pressure trends, the standard deviation is < 0.03 % per decade at 8–30 km globally. Dry geopotential height shows a standard deviation of < 2–4 m per decade below 35 km for all satellites except CHAMP. For global dry temperature trends, the standard deviation is < 0.05 K per decade at 8–25 km and < 0.1 K per decade at 25–35 km for all satellites, except for CHAMP for which it is about 0.1 K per decade and about 0.5 K per decade, respectively.
Our results show that RO multi-satellite data products from different centers are highly consistent between 8 and 25 km for all RO missions over all latitudes. Furthermore, data products from the newer satellite missions F3C, and specifically GRACE and Metop, are usable to higher altitudes due to advanced receivers (better onboard clocks) and lower bending angle noise at higher altitudes. For these missions, (dry) temperature, dry geopotential height, and (dry) pressure are found to be consistent up to 30–35 km; refractivity is found to be consistent up to 40 km and bending angle up to 50 km.
In conclusion, we find that the RO record can be used for reliable climate trend assessments globally within 90∘ S to 90∘ N in these altitude regions, meeting the stringent GCOS stability requirements for air temperature and corresponding requirements for the other RO variables. Data users should be aware of the larger uncertainty of the CHAMP record at higher altitudes. Also, temperature derived with a moist air retrieval can have a larger uncertainty above 25 km due to a priori information. Knowledge of the differences in the quality of the various satellite data is essential, especially when data from several missions are combined into a multi-satellite record. Figure 12 gives an instructive overview of the structural uncertainties for all RO variables over latitude and altitude.
This intercomparison study helped to further improve the maturity and quality of the RO records. During the course of work, we reported small issues and gave feedback to the processing centers, which was incorporated into the product development and resulted in improved reprocessed data sets for this study. We regard the quantification of the structural uncertainty of multi-satellite RO records from different RO processing centers as an essential advance towards the establishment of a global climate benchmark record as a key component of GCOS.
Efforts at RO centers are ongoing toward further improving and advancing RO data processing, such as the new WEGC RO processing system with integrated uncertainty propagation and traceability to the fundamental time standard (Li et al., 2015; Kirchengast et al., 2016; Schwarz et al., 2017, 2018; Gorbunov and Kirchengast, 2018; Innerkofler et al., 2018). Also, new RO missions with advanced receivers will provide RO data with better quality. RO receivers are established on the Chinese FY-3 meteorological satellite series (Sun et al., 2018), Metop-C has been in orbit since November 2018, and the six-satellite FORMOSAT-7/COSMIC-2 constellation was successfully launched in June 2019 (Schreiner et al., 2016; Ho et al., 2019a).
New receivers are capable of tracking different GNSS signals from the US GPS, the Russian GLONASS, the European Galileo system, and the Chinese BeiDou system; they will provide a larger number of observations. These recently launched and further planned RO missions will ensure the continuation of the RO record into the future for long-term climate monitoring and trend detection.
Information on the availability of the analyzed data sets is given in Table 1.
AKS designed the study, organized the data collection, discussed with the coauthor team, analyzed the results, and wrote the paper text. FL performed the computations and analysis, created all figures, and contributed to the paper text. COA, HG, S-PH, DH, and TS delivered the data products and provided information on data and processing description. AJM influenced JPL's strategy on data products. All authors engaged in discussions on data characteristics and issues, as well as on the the interpretation of results, and contributed to the finalization of the paper text.
The authors declare that they have no conflict of interest.
The paper contents are solely the opinions of the author(s) and do not constitute a statement of policy, decision, or position on behalf of NOAA or the US Government.
We thank Barbara Angerer (WEGC, AT), Byron A. Iijima (JPL), and Olga P. Verkhoglyadova (JPL) for valuable support on data processing and quality control of the provided data sets. We acknowledge Michael Mochart (WEGC, AT) for his Master thesis work on a first analysis of the intercomparison study.
This work was funded by the Austrian Science Fund (FWF) under research grant P27724-NBL (VERTICLIM). Further support was received from the European Space Agency (ESA) project MMValRO and the Austrian Research Promotion Agency (FFG-ALR) projects OPSCLIMVALUE (ASAP-11 848013) and ATROMSAF1 (ASAP-13 859771). Further portions of this research were carried out at the Jet Propulsion Laboratory, California Institute of Technology, under a contract with the National Aeronautics and Space Administration. Support of the NASA Earth Science Division is gratefully acknowledged. Hans Gleisner (DMI), Johannes K. Nielsen (DMI), Kent B. Lauritsen (DMI), and Stig Syndergaard (DMI) were supported by the Radio Occultation Meteorology Satellite Application Facility (ROM SAF), which is a decentralized operational RO processing center under EUMETSAT. The radio occultation data from DMI were provided by the ROM SAF (http://www.romsaf.org, last access: 14 May 2020).
This research has been supported by the Austrian Science Fund (grant no. P27724-NBL), the European Space Agency (ESA) under project MMValRO, and the Austrian Research Promotion Agency (FFG-ALR) under projects OPSCLIMVALUE (ASAP-11 848013) and ATROMSAF1 (ASAP-13 859771).
This paper was edited by Joanna Joiner and reviewed by Sean Healy and one anonymous referee.
Angerer, B., Ladstädter, F., Scherllin-Pirscher, B., Schwärz, M., Steiner, A. K., Foelsche, U., and Kirchengast, G.: Quality aspects of the Wegener Center multi-satellite GPS radio occultation record OPSv5.6, Atmos. Meas. Tech., 10, 4845–4863, https://doi.org/10.5194/amt-10-4845-2017, 2017.
Anthes, R. A.: Exploring Earth's atmosphere with radio occultation: contributions to weather, climate and space weather, Atmos. Meas. Tech., 4, 1077–1103, https://doi.org/10.5194/amt-4-1077-2011, 2011.
Anthes, R. A., Ector, D., Hunt, D. C., Kuo, Y.-H., Rocken, C., Schreiner, W. S., Sokolovskiy, S. V., Syndergaard, S., Wee, T.-K., Zeng, Z., Bernhardt, P. A., Dymond, K. F., Chen, Y., Liu, H., Manning, K., Randel, W. J., Trenberth, K. E., Cucurull, L., Healy, S. B., Ho, S.-P., McCormick, C., Meehan, T. K., Thompson, D. C., and Yen, N. L.: The COSMIC/FORMOSAT-3 Mission: Early Results, B. Am. Meteorol. Soc., 89, 313–333, https://doi.org/10.1175/BAMS-89-3-313, 2008.
Ao, C. O., Waliser, D. E., Chan, S. K., Li, J.-L., Tian, B., Xie, F., and Mannucci, A. J.: Planetary boundary layer heights from GPS radio occultation refractivity and humidity profiles, J. Geophys. Res.-Atmos., 117, 1–18, https://doi.org/10.1029/2012JD017598, 2012.
Ao, C. O., Jiang, J. H., Mannucci, A. J., Su, H., Verkhoglyadova, O., Zhai, C., Cole, J., Donner, L., Iversen, T., Morcrette, C., Rotstayn, L., Watanabe, M., and Yukimoto, S.: Evaluation of CMIP5 upper troposphere and lower stratosphere geopotential height with GPS radio occultation observations, J. Geophys. Res.-Atmos., 120, 1678–1689, https://doi.org/10.1002/2014JD022239, 2015.
Aparicio, J. M. and Deblonde, G.: Impact of the Assimilation of CHAMP Refractivity Profiles on Environment Canada Global Forecasts, Mon. Weather Rev., 136, 257–275, https://doi.org/10.1175/2007MWR1951.1, 2008.
Aparicio, J. M. and Laroche, S.: An evaluation of the expression of the atmospheric refractivity for GPS signals, J. Geophys. Res., 116, D11104, https://doi.org/10.1029/2010JD015214, 2011.
Bai, W., Liu, C., Meng, X., Sun, Y., Kirchengast, G., Du, Q., Wang, X., Yang, G., Liao, M., Yang, Z., Zhao, D., Xia, J., Cai, Y., Liu, L., and Wang, D.: Evaluation of atmospheric profiles derived from single- and zero-difference excess phase processing of BeiDou radio occultation data from the FY-3C GNOS mission, Atmos. Meas. Tech., 11, 819–833, https://doi.org/10.5194/amt-11-819-2018, 2018.
Bates, J. J. and Privette, J. L.: A maturity model for assessing the completeness of climate data records, Eos Trans. AGU, 93, 441–441, https://doi.org/10.1029/2012EO440006, 2012.
Bauer, P., Radnóti, G., Healy, S., and Cardinali, C.: GNSS Radio Occultation Constellation Observing System Experiments, Mon. Weather Rev., 142, 555–572, https://doi.org/10.1175/MWR-D-13-00130.1, 2014.
Bertiger, W. I., Bar-Sever, Y. E., Christensen, E. J., Davis, E. S., Guinn, J. R., Haines, B. J., Ibanez-Meier, R. W., Jee, J. R., Lichten, S. M., Melbourne, W. G., Muellerschoen, R. J., Munson, T. N., Vigue, Y., Wu, S. C., Yunck, T. P., Schutz, B. E., Abusali, P. A. M., Rim, H. J., Watkins, M. M., and Willis, P.: GPS precise tracking of TOPEX/POSEIDON: Results and implications, J. Geophys. Res, 99, 24449–24464, https://doi.org/10.1029/94JC01171, 1994.
Beyerle G., Schmidt T., Michalak G., Heise S., Wickert J., and Reigber C.: GPS radio occultation with GRACE: Atmospheric profiling utilizing the zero difference technique, Geophys. Res. Lett., 32, L13806, https://doi.org/10.1029/2005GL023109, 2005.
Bojinski, S., Verstraete, M., Peterson, T. C., Richter, C., Simmons, A., and Zemp, M.: The Concept of Essential Climate Variables in Support of Climate Research, Applications, and Policy, B. Am. Meteorol. Soc., 95, 1431–1443, https://doi.org/10.1175/BAMS-D-13-00047.1, 2014.
Cardinali, C.: Monitoring the observation impact on the short-range forecast, Q. J. Roy. Meteor. Soc, 135, 239–250, https://doi.org/10.1002/qj.366, 2009.
Cardinali, C. and Healy, S.: Impact of GPS radio occultation measurements in the ECMWF system using adjoint-based diagnostics, Q. J. Roy. Meteor. Soc., 140, 2315–2320, https://doi.org/10.1002/qj.2300, 2014.
Chen, Y.-C., Hsieh, M.-E., Hsiao, L.-F., Kuo, Y.-H., Yang, M.-J., Huang, C.-Y., and Lee, C.-S.: Systematic evaluation of the impacts of GPSRO data on the prediction of typhoons over the northwestern Pacific in 2008–2010, Atmos. Meas. Tech., 8, 2531–2542, https://doi.org/10.5194/amt-8-2531-2015, 2015.
Cucurull, L.: Improvement in the Use of an Operational Constellation of GPS Radio Occultation Receivers in Weather Forecasting, Weather Forecast., 25, 749–767, https://doi.org/10.1175/2009WAF2222302.1, 2010.
Cucurull, L., Derber, J. C., and Purser, R. J.: A bending angle forward operator for global positioning system radio occultation measurements, J. Geophys. Res.-Atmos., 118, 14–28, https://doi.org/10.1029/2012JD017782, 2013.
Culverwell, I. D. and Healy, S. B.: The Radio Occultation Processing Package (ROPP) User Guide Part II: Forward model and 1D–Var modules Version 6.0, GRASSAF Rep. SAF/GRAS/METO/UG/ROPP/003, 2011.
Danzer, J., Healy, S. B., and Culverwell, I. D.: A simulation study with a new residual ionospheric error model for GPS radio occultation climatologies, Atmos. Meas. Tech., 8, 3395–3404, https://doi.org/10.5194/amt-8-3395-2015, 2015.
Fjeldbo, G., Kliore, A. J., and Eshleman, V. R.: The neutral atmosphere of Venus as studied with the Mariner V radio occultation experiments, Astron. J., 76, 123–140, https://doi.org/10.1086/111096, 1971.
Foelsche, U., Scherllin-Pirscher, B., Ladstädter, F., Steiner, A. K., and Kirchengast, G.: Refractivity and temperature climate records from multiple radio occultation satellites consistent within 0.05 %, Atmos. Meas. Tech., 4, 2007–2018, https://doi.org/10.5194/amt-4-2007-2011, 2011.
GCOS: Guideline for the generation of datasets and products meeting GCOS requirements, GCOS-143, WMO/TD No. 1530, World Meteorological Organization, available at: https://library.wmo.int/doc_num.php?explnum_id=3854 (last access: 3 September 2019), 2010a.
GCOS: Implementation plan for the global observing system for climate in support of the UNFCC, GCOS-138, WMO/TD No. 1523, World Meteorological Organization, available at: https://library.wmo.int/doc_num.php?explnum_id=3851 (last access: 3 September 2019), 2010b.
GCOS: Systematic observation requirements for satellite-based data products for climate, GCOS-154, World Meteorological Organization, available at: https://library.wmo.int/doc_num.php?explnum_id=3710 (last access: 3 September 2019), 2011.
GCOS: The global observing system for climate: implementation needs, GCOS-200, World Meteorological Organization, available at: https://library.wmo.int/doc_num.php?explnum_id=3417 (last access: 3 September 2019), 2016.
Gleisner, H., Thejll, P., Christiansen, B., and Nielsen, J. K.: Recent global warming hiatus dominated by low-latitude temperature trends in surface and troposphere data, Geophys. Res. Lett., 42, 510–517, https://doi.org/10.1002/2014GL062596, 2015.
Gorbunov, M. E.: Canonical transform method for processing radio occultation data in the lower troposphere, Radio Sci., 37, 9-1–9-10, https://doi.org/10.1029/2000RS002592, 2002.
Gorbunov, M. E. and Kirchengast, G.: Wave-optics uncertainty propagation and regression-based bias model in GNSS radio occultation bending angle retrievals, Atmos. Meas. Tech., 11, 111–125, https://doi.org/10.5194/amt-11-111-2018, 2018.
Gorbunov, M. E. and Lauritsen, K. B.: Analysis of wave fields by Fourier integral operators and their application for radio occultations, Radio Sci., 39, RS4010, https://doi.org/10.1029/2003RS002971, 2004.
Gorbunov, M. E., Benzon, H.-H., Jensen, A. S., Lohmann, M. S., and Nielsen, A. S.: Comparative analysis of radio occultation processing approaches based on Fourier integral operators, Radio Sci., 39, RS6004, https://doi.org/10.1029/2003RS002916, 2004.
Guo, P., Kuo, Y.-H., Sokolovskiy, S. V., and Lenschow, D. H.: Estimating Atmospheric Boundary Layer Depth Using COSMIC Radio Occultation Data, J. Atmos. Sci., 68, 1703–1713, https://doi.org/10.1175/2011JAS3612.1, 2011.
Hajj, G. A., Kursinski, E. R., Romans, L. J., Bertiger, W. I., and Leroy, S. S.: A technical description of atmospheric sounding by GPS occultation, J. Atmos. Sol. Terr. Phys., 64, 451–469, https://doi.org/10.1016/S1364-6826(01)00114-6, 2002.
Hartmann, D. L., Klein Tank, A. M. G., Rusticucci, M., Alexander, L. V., Brönnimann, S., Charabi, Y., Dentener, F. J., Dlugokencky, E. J., Easterling, D. R., Kaplan, A., Soden, B. J., Thorne, P. W., Wild, M., and Zhai, P. M.: Observations: Atmosphere and Surface, in: Climate Change 2013: The Physical Science Basis. Contribution of Working Group I to the Fifth Assessment Report of the Intergovernmental Panel on Climate Change, edited by: Stocker, T. F., Qin, D., Plattner, G.-K., Tignor, M., Allen, S. K., Boschung, J., Nauels, A., Xia, Y., Bex, V., and Midgley, P. M., Cambridge University Press, Cambridge, United Kingdom and New York, NY, USA, available at: https://www.ipcc.ch/site/assets/uploads/2017/09/WG1AR5_Chapter02_FINAL.pdf (last access: 14 May 2020), 2013.
He, W., Ho, S., Chen, H., Zhou, X., Hunt, D., and Kuo, Y.-H.: Assessment of radiosonde temperature measurements in the upper troposphere and lower stratosphere using COSMIC radio occultation data, Geophys. Res. Lett., 36, L17807, https://doi.org/10.1029/2009GL038712, 2009.
Healy, S. B.: Refractivity coefficients used in the assimilation of GPS radio occultation measurements, J. Geophys. Res., 116, D01106, https://doi.org/10.1029/2010JD014013, 2011.
Healy, S. B. and Eyre, J. R.: Retrieving temperature, water vapour and surface pressure information from refractive-index profiles derived by radio occultation: A simulation study, Q. J. Roy. Meteor. Soc, 126, 1661–1683, https://doi.org/10.1002/qj.49712656606, 2000.
Healy, S. B., Jupp, A. M., and Marquardt, C.: Forecast impact experiment with GPS radio occultation measurements, Geophys. Res. Lett, 32, L03804, https://doi.org/10.1029/2004GL020806, 2005.
Ho, S.-P., Goldberg, M., Kuo, Y.-H., Zou, C.-Z., and Schreiner, W.: Calibration of temperature in the lower stratosphere from microwave measurements using COSMIC radio occultation data: Preliminary results, Terr. Atmos. Ocean. Sci., 20, 87–100, https://doi.org/10.3319/TAO.2007.12.06.01(F3C), 2009a.
Ho, S.-P., Kirchengast, G., Leroy, S., Wickert, J., Mannucci, A. J., Steiner, A., Hunt, D., Schreiner, W., Sokolovskiy, S., Ao, C., Borsche, M., Engeln, A., Foelsche, U., Heise, S., Iijima, B., Kuo, Y.-H., Kursinski, R., Pirscher, B., Ringer, M., Rocken, C., and Schmidt, T.: Estimating the uncertainty of using GPS radio occultation data for climate monitoring: Intercomparison of CHAMP refractivity climate records from 2002 to 2006 from different data centers, J. Geophys. Res, 114, D23107, https://doi.org/10.1029/2009JD011969, 2009b.
Ho, S.-P., Zhou, X., Kuo, Y.-H., Hunt, D., and Wang, J.: Global Evaluation of Radiosonde Water Vapor Systematic Biases using GPS Radio Occultation from COSMIC and ECMWF Analysis, Remote Sensing, 2, 1320–1330, https://doi.org/10.3390/rs2051320, 2010.
Ho, S.-P., Hunt, D., Steiner, A. K., Mannucci, A. J., Kirchengast, G., Gleisner, H., Heise, S., von Engeln, A., Marquardt, C., Sokolovskiy, S., Schreiner, W., Scherllin-Pirscher, B., Ao, C., Wickert, J., Syndergaard, S., Lauritsen, K. B., Leroy, S., Kursinski, E. R., Kuo, Y.-H., Foelsche, U., Schmidt, T., and Gorbunov, M.: Reproducibility of GPS radio occultation data for climate monitoring: Profile-to-profile inter-comparison of CHAMP climate records 2002 to 2008 from six data centers, J. Geophys. Res., 117, D18111, https://doi.org/10.1029/2012JD017665, 2012.
Ho, S.-P., Peng, L., Anthes, R. A., Kuo, Y.-H., and Lin, H.-C.: Marine Boundary Layer Heights and Their Longitudinal, Diurnal, and Interseasonal Variability in the Southeastern Pacific Using COSMIC, CALIOP, and Radiosonde Data, J. Climate, 28, 2856–2872, https://doi.org/10.1175/JCLI-D-14-00238.1, 2015.
Ho, S.-P., Peng, L., and Vömel, H.: Characterization of the long-term radiosonde temperature biases in the upper troposphere and lower stratosphere using COSMIC and Metop-A/GRAS data from 2006 to 2014, Atmos. Chem. Phys., 17, 4493–4511, https://doi.org/10.5194/acp-17-4493-2017, 2017.
Ho, S.-P., Peng, L., Mears, C., and Anthes, R. A.: Comparison of global observations and trends of total precipitable water derived from microwave radiometers and COSMIC radio occultation from 2006 to 2013, Atmos. Chem. Phys., 18, 259–274, https://doi.org/10.5194/acp-18-259-2018, 2018.
Ho, S.-P., Anthes, R. A., Ao, C. O., Healy, S., Horanyi, A., Hunt, D., Mannucci, A. J., Pedatella, N., Randel, W., Simmons, A., Steiner, A. K., Xie, F., Yue, X., and Zeng, Z.: The COSMIC/FORMOSAT-3 radio occultation mission after 12 years: accomplishments, remaining challenges, and potential impacts of COSMIC-2, B. Am. Meteorol. Soc., https://doi.org/10.1175/BAMS-D-18-0290.1, 2019a.
Ho, S.-P., Anthes, R. A., Zhang, H., and Chen, S.-Y.: Improving the impact of radio occultation observations on numerical forecasts of tropical cyclones, JCSDA quarterly. No. 62, Winter 2019, 11–17, https://doi.org/10.25923/w2dh-ep66, 2019b.
Hofmann-Wellenhof, B., Lichtenegger, H., and Wasle, E.: GNSS – Global Navigation Satellite Systems, Springer Vienna, Vienna, 2008.
Huang, C.-Y., Kuo, Y.-H., Chen, S.-H., and Vandenberghe, F.: Improvements in Typhoon Forecasts with Assimilated GPS Occultation Refractivity, Weather Forecast., 20, 931–953, https://doi.org/10.1175/WAF874.1, 2005.
Innerkofler, J., Pock, C., Kirchengast, G., Schwärz, M., Jäggi, A., Andres, Y., Marquardt, C., Hunt, D., Schreiner, W., and Schwarz, J.: GNSS Radio Occultation Excess Phase Data including Integrated Uncertainty Estimation and Intercomparison between Processing Centers, Austin, TX, USA, available at: https://ams.confex.com/ams/98Annual/meetingapp.cgi/Paper/336035 (last access: 14 May 2020), 2018.
IROWG: Summary of the Sixth International Radio Occultation Workshop, Estes Park, CO, USA, 21–27 September 2018, available at: http://irowg.org/wpcms/wp-content/uploads/2018/06/IROWG6_Minutes_Summary.pdf (last access: 14 May 2020), 2018.
JCGM: International vocabulary of metrology–Basic and general concepts and associated terms (VIM 3rd edition), Tech. Rep. JCGM 200:2012, Joint Committee for Guides in Metrology, Office BIPM, Paris, available at: https://www.bipm.org/utils/common/documents/jcgm/JCGM_200_2012.pdf (last access: 14 May 2020), 2012.
Jensen, A. S., Lohmann, M. S., Benzon, H.-H., and Nielsen, A. S.: Full Spectrum Inversion of radio occultation signals, Radio Sci., 38, 6-1–6-15, https://doi.org/10.1029/2002RS002763, 2003.
Jensen, A. S., Lohmann, M. S., Nielsen, A. S., and Benzon, H.-H.: Geometrical optics phase matching of radio occultation signals, Radio Sci., 39, RS3009, https://doi.org/10.1029/2003RS002899, 2004.
Khaykin, S. M., Funatsu, B. M., Hauchecorne, A., Godin-Beekmann, S., Claud, C., Keckhut, P., Pazmino, A., Gleisner, H., Nielsen, J. K., Syndergaard, S., and Lauritsen, K. B.: Postmillennium changes in stratospheric temperature consistently resolved by GPS radio occultation and AMSU observations, Geophys. Res. Lett., 44, 2017GL074353, https://doi.org/10.1002/2017GL074353, 2017.
Kirchengast, G., Hafner, J., and Poetzi, W.: The CIRA86aQ_UoG model: An extension of the CIRA-86 monthly tables including humidity tables and a Fortran95 global moist air climatology model, Techn. Rep. for ESA/ESTEC No. 8/1999, Inst. Meteorol. Geophys., Univ. of Graz, Austria, 1999.
Kirchengast, G., Schwärz, M., Schwarz, J., Scherllin-Pirscher, B., Pock, C., Innerkofler, J., Proschek, V., Steiner, A. K., Danzer, J., Ladstädter, F., and Foelsche, U.: The reference occultation processing system approach to interpret GNSS radio occultation as SI-traceable planetary system refractometer, Seggau Castle, Austria, 2016.
König, R., Michalak, G., Neumayer, K., and Zhu, S.: Remarks on CHAMP orbit products, in: Observation of the Earth From Space, edited by: Flury, J., Rummel, R., Reigber, C., Rothacher, M., Boedecker, G., and Schreiber, U., Springer, Berlin, 2006.
Kuo, Y.-H., Liu, H., Guo, Y.-R., Terng, C.-T., and Lin, Y.-T.: Impact of FORMOSAT-3/COSMIC Data on Typhoon and Mei-yu Prediction, in: Recent Progress in Atmospheric Sciences, 458–483, World Scientific, 2008.
Kursinski, E. R. and Gebhardt, T.: A Method to Deconvolve Errors in GPS RO-Derived Water Vapor Histograms, J. Atmos. Ocean. Tech., 31, 2606–2628, https://doi.org/10.1175/JTECH-D-13-00233.1, 2014.
Kursinski, E. R., Hajj, G. A., Bertiger, W. I., Leroy, S. S., Meehan, T. K., Romans, L. J., Schofield, J. T., McCleese, D. J., Melbourne, W. G., Thornton, C. L., Yunck, T. P., Eyre, J. R., and Nagatani, R. N.: Initial Results of Radio Occultation Observations of Earth's Atmosphere Using the Global Positioning System, Science, 271, 1107–1110, 1996.
Kursinski, E. R., Hajj, G. A., Schofield, J. T., Linfield, R. P., and Hardy, K. R.: Observing Earth's atmosphere with radio occultation measurements using the Global Positioning System, J. Geophys. Res, 102, 23429–23465, https://doi.org/10.1029/97JD01569, 1997.
Lackner, B. C., Steiner, A. K., Kirchengast, G., and Hegerl, G. C.: Atmospheric Climate Change Detection by Radio Occultation Data Using a Fingerprinting Method, J. Climate, 24, 5275–5291, https://doi.org/10.1175/2011JCLI3966.1, 2011.
Ladstädter, F., Steiner, A. K., Foelsche, U., Haimberger, L., Tavolato, C., and Kirchengast, G.: An assessment of differences in lower stratospheric temperature records from (A)MSU, radiosondes, and GPS radio occultation, Atmos. Meas. Tech., 4, 1965–1977, https://doi.org/10.5194/amt-4-1965-2011, 2011.
Ladstädter, F., Steiner, A. K., Schwärz, M., and Kirchengast, G.: Climate intercomparison of GPS radio occultation, RS90/92 radiosondes and GRUAN from 2002 to 2013, Atmos. Meas. Tech., 8, 1819–1834, https://doi.org/10.5194/amt-8-1819-2015, 2015.
Leroy, S. S., Anderson, J. G., and Dykema, J. A.: Climate benchmarking using GNSS occultation, in: Atmosphere and Climate: Studies by Occultation Methods, edited by: Foelsche, U., Kirchengast, G., and Steiner, A., 287–301, Springer-Verlag Berlin Heidelberg, 2006.
Leroy, S. S., Ao, C. O., and Verkhoglyadova, O. P.: Temperature Trends and Anomalies in Modern Satellite Data: Infrared Sounding and GPS Radio Occultation, J. Geophys. Res.-Atmos., 123, 11431–11444, https://doi.org/10.1029/2018JD028990, 2018.
Li, Y., Kirchengast, G., Scherllin-Pirscher, B., Norman, R., Yuan, Y. B., Fritzer, J., Schwaerz, M., and Zhang, K.: Dynamic statistical optimization of GNSS radio occultation bending angles: advanced algorithm and performance analysis, Atmos. Meas. Tech., 8, 3447–3465, https://doi.org/10.5194/amt-8-3447-2015, 2015.
Liu, H., Anderson, J., and Kuo, Y.-H.: Improved Analyses and Forecasts of Hurricane Ernesto's Genesis Using Radio Occultation Data in an Ensemble Filter Assimilation System, Mon. Weather Rev., 140, 151–166, https://doi.org/10.1175/MWR-D-11-00024.1, 2012.
Luntama, J.-P., Kirchengast, G., Borsche, M., Foelsche, U., Steiner, A., Healy, S., Engeln, A., O'Clerigh, E., and Marquardt, C.: Prospects of the EPS GRAS Mission For Operational Atmospheric Applications, B. Am. Meteorol. Soc, 89, 1863–1875, https://doi.org/10.1175/2008BAMS2399.1, 2008.
Melbourne, W. G., Davis, E. S., Duncan, C. B., Hajj, G. A., Hardy, K. R., Kursinski, E. R., Meehan, T. K., Young, L. E., and Yunck, T. P.: The application of spaceborne GPS to atmospheric limb sounding and global change monitoring, JPL Publication 94-18, Jet Propulsion Lab, Pasadena, CA, USA, 147, 1994.
Merchant, C. J., Paul, F., Popp, T., Ablain, M., Bontemps, S., Defourny, P., Hollmann, R., Lavergne, T., Laeng, A., de Leeuw, G., Mittaz, J., Poulsen, C., Povey, A. C., Reuter, M., Sathyendranath, S., Sandven, S., Sofieva, V. F., and Wagner, W.: Uncertainty information in climate data records from Earth observation, Earth Syst. Sci. Data, 9, 511–527, https://doi.org/10.5194/essd-9-511-2017, 2017.
Mochart, M.: Multi-mission GPS radio occultation observations from different processing centers – consistency and structural uncertainty, Master Thesis, Wegener Center, University of Graz, Graz, Austria, March, 2018.
Ohring, G. (Ed): Achieving satellite instrument calibration for climate change, ASIC3 Workshop Report, NOAA/NESDIS, 2007.
Ohring, G., Wielicki, B., Spencer, R., Emery, B., and Datla, R.: Satellite Instrument Calibration for Measuring Global Climate Change: Report of a Workshop, B. Am. Meteorol. Soc., 86, 1303–1313, https://doi.org/10.1175/BAMS-86-9-1303, 2005.
Pincus, R., Beljaars, A., Buehler, S. A., Kirchengast, G., Ladstaedter, F., and Whitaker, J. S.: The Representation of Tropospheric Water Vapor Over Low-Latitude Oceans in (Re-)analysis: Errors, Impacts, and the Ability to Exploit Current and Prospective Observations, Surv. Geophys., 38, 1399–1423, https://doi.org/10.1007/s10712-017-9437-z, 2017.
Poli, P., Healy, S. B., and Dee, D. P.: Assimilation of Global Positioning System radio occultation data in the ECMWF ERA–Interim reanalysis, Q. J. Roy. Meteor. Soc., 136, 1972–1990, https://doi.org/10.1002/qj.722, 2010.
Randel, W. J., Chanin, M.-L., and Michaut, C.: SPARC Intercomparison of Middle Atmosphere Climatologies, WCRP-116, WMO/TD-No. 1142, SPARC Report No. 3, available at: https://www.sparc-climate.org/wp-content/uploads/sites/5/2017/12/SPARC_Report_No3_Dec2002_Climatologies.pdf (last access: 14 May 2020), 2002.
Randel, W. J., Wu, F., and Rivera Ríos, W.: Thermal variability of the tropical tropopause region derived from GPS/MET observations, J. Geophys. Res., 108, 4024, https://doi.org/10.1029/2002JD002595, 2003.
Rieckh, T., Scherllin-Pirscher, B., Ladstädter, F., and Foelsche, U.: Characteristics of tropopause parameters as observed with GPS radio occultation, Atmos. Meas. Tech., 7, 3947–3958, https://doi.org/10.5194/amt-7-3947-2014, 2014.
Ringer, M. A. and Healy, S. B.: Monitoring twenty-first century climate using GPS radio occultation bending angles, Geophys. Res. Lett., 35, L05708, https://doi.org/10.1029/2007GL032462, 2008.
Rocken, C., Anthes, R., Exner, M., Hunt, D., Sokolovskiy, S., Ware, R., Gorbunov, M., Schreiner, W., Feng, D., Herman, B., Kuo, Y.-H., and Zou, X.: Analysis and validation of GPS/MET data in the neutral atmosphere, J. Geophys. Res, 102, 29849–29866, https://doi.org/10.1029/97JD02400, 1997.
Scherllin-Pirscher, B., Steiner, A. K., Kirchengast, G., Kuo, Y.-H., and Foelsche, U.: Empirical analysis and modeling of errors of atmospheric profiles from GPS radio occultation, Atmos. Meas. Tech., 4, 1875–1890, https://doi.org/10.5194/amt-4-1875-2011, 2011a.
Scherllin-Pirscher, B., Kirchengast, G., Steiner, A. K., Kuo, Y.-H., and Foelsche, U.: Quantifying uncertainty in climatological fields from GPS radio occultation: an empirical-analytical error model, Atmos. Meas. Tech., 4, 2019–2034, https://doi.org/10.5194/amt-4-2019-2011, 2011b.
Scherllin-Pirscher, B., Steiner, A. K., and Kirchengast, G.: Deriving dynamics from GPS radio occultation: Three-dimensional wind fields for monitoring the climate, Geophys. Res. Lett., 41, 7367–7374, https://doi.org/10.1002/2014GL061524, 2014.
Scherllin-Pirscher, B., Syndergaard, S., Foelsche, U., and Lauritsen, K. B.: Generation of a bending angle radio occultation climatology (BAROCLIM) and its use in radio occultation retrievals, Atmos. Meas. Tech., 8, 109–124, https://doi.org/10.5194/amt-8-109-2015, 2015.
Scherllin-Pirscher, B., Steiner, A. K., Kirchengast, G., Schwärz, M., and Leroy, S. S.: The power of vertical geolocation of atmospheric profiles from GNSS radio occultation, J. Geophys. Res.-Atmos., 122, 1595–1616, https://doi.org/10.1002/2016JD025902, 2017.
Schmidt, T., Heise, S., Wickert, J., Beyerle, G., and Reigber, C.: GPS radio occultation with CHAMP and SAC-C: global monitoring of thermal tropopause parameters, Atmos. Chem. Phys., 5, 1473–1488, https://doi.org/10.5194/acp-5-1473-2005, 2005.
Schmidt, T., Wickert, J., Beyerle, G., and Heise, S.: Global tropopause height trends estimated from GPS radio occultation data, Geophys. Res. Lett, 35, L11806, https://doi.org/10.1029/2008GL034012, 2008.
Schmidt, T., Wickert, J., and Haser, A.: Variability of the upper troposphere and lower stratosphere observed with GPS radio occultation bending angles and temperatures, Adv. Space Res., 46, 150–161, https://doi.org/10.1016/j.asr.2010.01.021, 2010.
Schreiner, W., Rocken, C., Sokolovskiy, S., and Hunt, D.: Quality assessment of COSMIC/FORMOSAT-3 GPS radio occultation data derived from single- and double-difference atmospheric excess phase processing, GPS Solut., 14, 13–22, https://doi.org/10.1007/s10291-009-0132-5, 2010.
Schreiner, W., Sokolovskiy, S., Hunt, D., Rocken, C., and Kuo, Y.-H.: Analysis of GPS radio occultation data from the FORMOSAT-3/COSMIC and Metop/GRAS missions at CDAAC, Atmos. Meas. Tech., 4, 2255–2272, https://doi.org/10.5194/amt-4-2255-2011, 2011.
Schreiner, W. S., Anthes, R., Braun, J., Ho, B., Hunt, D., Kuo, Y.-H., Liu, H., Pedatella, N., Sokolovskiy, S., Vanhove, T., Wee, T.-K., Weiss, J., Yue, X., and Zeng, J.: GNSS RO retrieval science and science applications with FORMOSAT-7/COSMIC-2, Taipei, TW, available at: https://opensky.ucar.edu/islandora/object/conference:3185/datastream/PDF/view (last access: 14 May 2020), 2016.
Schwarz, J., Kirchengast, G., and Schwaerz, M.: Integrating uncertainty propagation in GNSS radio occultation retrieval: From bending angle to dry-air atmospheric profiles, Earth Space Sci., 4, 200–228, https://doi.org/10.1002/2016EA000234, 2017.
Schwarz, J., Kirchengast, G., and Schwaerz, M.: Integrating uncertainty propagation in GNSS radio occultation retrieval: from excess phase to atmospheric bending angle profiles, Atmos. Meas. Tech., 11, 2601–2631, https://doi.org/10.5194/amt-11-2601-2018, 2018.
Schwärz, M., Kirchengast, G., Scherllin-Pirscher, B., Schwarz, J., Ladstädter, F., and Angerer, B.: Multi-mission validation by satellite radio occultation extension project–Final report, Tech. Rep. for ESA/ESRIN No. 01/2016, Wegener Center, University of Graz, Graz, Austria, available at: https://wegcwww.uni-graz.at/publ/wegcpubl/arsclisys/2016/Schwaerz-etal_MMValRO-FinRep_Dec2016.pdf (last access: 14 May 2020), 2016.
Simmons, A. J., Berrisford, P., Dee, D. P., Hersbach, H., Hirahara, S., and Thépaut, J.-N.: A reassessment of temperature variations and trends from global reanalyses and monthly surface climatological datasets, Q. J. Roy. Meteor. Soc., 143, 101–119, https://doi.org/10.1002/qj.2949, 2017.
Smith, E. K. and Weintraub, S.: The Constants in the Equation for Atmospheric Refractive Index at Radio Frequencies, P. IRE, 41, 1035–1037, https://doi.org/10.1109/JRPROC.1953.274297, 1953.
Sokolovskiy, S. and Hunt, D.: Statistical optimization approach for GPS/MET data inversion, University of Arizona, Tucson, 1996.
Sokolovskiy, S., Kuo, Y.-H., Rocken, C., Schreiner, W. S., Hunt, D., and Anthes, R. A.: Monitoring the atmospheric boundary layer by GPS radio occultation signals recorded in the open-loop mode, Geophys. Res. Lett., 33, L12813, https://doi.org/10.1029/2006GL025955, 2006.
Sokolovskiy, S. V., Rocken, C., Lenschow, D. H., Kuo, Y.-H., Anthes, R. A., Schreiner, W. S., and Hunt, D. C.: Observing the moist troposphere with radio occultation signals from COSMIC, Geophys. Res. Lett, 34, L18802, https://doi.org/10.1029/2007GL030458, 2007.
Sokolovskiy, S. V., Schreiner, W., Rocken, C., and Hunt, D.: Optimal Noise Filtering for the Ionospheric Correction of GPS Radio Occultation Signals, J. Atmos. Ocean. Tech., 26, 1398–1403, https://doi.org/10.1175/2009JTECHA1192.1, 2009.
Steiner, A. K., Kirchengast, G., and Ladreiter, H. P.: Inversion, error analysis, and validation of GPS/MET occultation data, Ann. Geophys., 17, 122–138, https://doi.org/10.1007/s00585-999-0122-5, 1999.
Steiner, A. K., Kirchengast, G., Foelsche, U., Kornblueh, L., Manzini, E., and Bengtsson, L.: GNSS occultation sounding for climate monitoring, Phys. Chem. Earth A, 26, 113–124, https://doi.org/10.1016/S1464-1895(01)00034-5, 2001.
Steiner, A. K., Kirchengast, G., Borsche, M., Foelsche, U., and Schoengassner, T.: A multi-year comparison of lower stratospheric temperatures from CHAMP radio occultation data with MSU/AMSU records, J. Geophys. Res, 112, D22110, https://doi.org/10.1029/2006JD008283, 2007.
Steiner, A. K., Kirchengast, G., Lackner, B. C., Pirscher, B., Borsche, M., and Foelsche, U.: Atmospheric temperature change detection with GPS radio occultation 1995 to 2008, Geophys. Res. Lett, 36, L18702, https://doi.org/10.1029/2009GL039777, 2009.
Steiner, A. K., Lackner, B. C., Ladstädter, F., Scherllin-Pirscher, B., Foelsche, U., and Kirchengast, G.: GPS radio occultation for climate monitoring and change detection, Radio Sci., 46, RS0D24, https://doi.org/10.1029/2010RS004614, 2011.
Steiner, A. K., Hunt, D., Ho, S.-P., Kirchengast, G., Mannucci, A. J., Scherllin-Pirscher, B., Gleisner, H., von Engeln, A., Schmidt, T., Ao, C., Leroy, S. S., Kursinski, E. R., Foelsche, U., Gorbunov, M., Heise, S., Kuo, Y.-H., Lauritsen, K. B., Marquardt, C., Rocken, C., Schreiner, W., Sokolovskiy, S., Syndergaard, S., and Wickert, J.: Quantification of structural uncertainty in climate data records from GPS radio occultation, Atmos. Chem. Phys., 13, 1469–1484, https://doi.org/10.5194/acp-13-1469-2013, 2013.
Steiner, A. K., Lackner, B. C., and Ringer, M. A.: Tropical convection regimes in climate models: evaluation with satellite observations, Atmos. Chem. Phys., 18, 4657–4672, https://doi.org/10.5194/acp-18-4657-2018, 2018.
Sun, Y., Bai, W., Liu, C., Liu, Y., Du, Q., Wang, X., Yang, G., Liao, M., Yang, Z., Zhang, X., Meng, X., Zhao, D., Xia, J., Cai, Y., and Kirchengast, G.: The FengYun-3C radio occultation sounder GNOS: a review of the mission and its early results and science applications, Atmos. Meas. Tech., 11, 5797–5811, https://doi.org/10.5194/amt-11-5797-2018, 2018.
Syndergaard, S.: Modeling the impact of the Earth's oblateness on the retrieval of temperature and pressure profiles from limb sounding, J. Atmos. Sol. Terr. Phys., 60, 171–180, https://doi.org/10.1016/S1364-6826(97)00056-4, 1998.
Teunissen, P. J. G. and Montenbruck, O. (Eds.): Springer Handbook of Global Navigation Satellite Systems, Springer International Publishing, Cham, Switzerland, 2017.
Thorne, P. W.: Revisiting radiosonde upper air temperatures from 1958 to 2002, J. Geophys. Res, 110, D18105, https://doi.org/10.1029/2004JD005753, 2005.
Trenberth, K. E., Anthes, R. A., Belward, A., Brown, O. B., Habermann, T., Karl, T. R., Running, S., Ryan, B., Tanner, M., and Wielicki, B.: Challenges of a Sustained Climate Observing System, in: Climate Science for Serving Society, edited by: Asrar, G. R. and Hurrell, J. W., 13–50, Springer Netherlands, https://doi.org/10.1007/978-94-007-6692-1_2, 2013.
Verkhoglyadova, O. P., Leroy, S. S., and Ao, C. O.: Estimation of Winds from GPS Radio Occultations, J. Atmos. Ocean. Tech., 31, 2451–2461, https://doi.org/10.1175/JTECH-D-14-00061.1, 2014.
Vorob'ev, V. V. and Krasil'nikova, T. G.: Estimation of the accuracy of the atmospheric refractive index recovery from Doppler shift measurements at frequencies used in the NAVSTAR system, Phys. Atmos. Ocean., 29, 602–609, 1994.
Ware, R., Rocken, C., Solheim, F., Exner, M., Schreiner, W., Anthes, R., Feng, D., Herman, B., Gorbunov, M., Sokolovskiy, S., Hardy, K., Kuo, Y., Zou, X., Trenberth, K., Meehan, T., Melbourne, W., and Businger, S.: GPS Sounding of the Atmosphere from Low Earth Orbit: Preliminary Results, B. Am. Meteorol. Soc, 77, 19–40, https://doi.org/10.1175/1520-0477(1996)077<0019:GSOTAF>2.0.CO;2, 1996.
Wee, T.-K.: Variational Atmospheric Retrieval Scheme (VARS) for GPS Radio Occultation Data Version 1.1, COSMIC Project Office, UCAR, available at: http://cdaac-www.cosmic.ucar.edu/cdaac/doc/documents/1dvar.pdf (last access: 3 September 2019), 2005.
Wickert, J., Beyerle, G., Hajj, G. A., Schwieger, V., and Reigber, C.: GPS radio occultation with CHAMP: Atmospheric profiling utilizing the space-based single difference technique, Geophys. Res. Lett., 29, 28-1–28-4, https://doi.org/10.1029/2001GL013982, 2002.
Wickert, J., Schmidt, T., Beyerle, G., König, R., Reigber, C., and Jakowski, N.: The Radio Occultation Experiment aboard CHAMP: Operational Data Analysis and Validation of Vertical Atmospheric Profiles, J. Meteorol. Soc. Jpn., 82, 381–395, https://doi.org/10.2151/jmsj.2004.381, 2004.
Wickert, J., Beyerle, G., König, R., Heise, S., Grunwaldt, L., Michalak, G., Reigber, Ch., and Schmidt, T.: GPS radio occultation with CHAMP and GRACE: A first look at a new and promising satellite configuration for global atmospheric sounding, Ann. Geophys., 23, 653–658, https://doi.org/10.5194/angeo-23-653-2005, 2005.
Wickert, J., Michalak, G., Schmidt, T., Beyerle, G., Cheng, C.-Z., Healy, S. B., Heise, S., Huang, C.-Y., Jakowski, N., Köhler, W., Mayer, C., Offiler, D., Ozawa, E., Pavelyev, A. G., Rothacher, M., Tapley, B., and Köhler, C.: GPS Radio Occultation: Results from CHAMP, GRACE and FORMOSAT-3/COSMIC, Terr. Atmos. Ocean. Sci., 20, 35–50, https://doi.org/10.3319/TAO.2007.12.26.01(F3C), 2009.
Wigley, T. M. L.: Statistical Issues Regarding Trends, in: Temperature Trends in the Lower Atmosphere: Steps for Understanding and Reconciling Differences, edited by: Karl, T. R., Hassol, S. J., Miller, C. D., and Murray, W. L., Washington, D.C., 2006.
Xie, F., Syndergaard, S., Kursinski, E. R., and Herman, B. M.: An Approach for Retrieving Marine Boundary Layer Refractivity from GPS Occultation Data in the Presence of Superrefraction, J. Atmos. Ocean. Tech., 23, 1629–1644, https://doi.org/10.1175/JTECH1996.1, 2006.
Zeng, Z., Sokolovskiy, S., Schreiner, W., Hunt, D., Lin, J., and Kuo, Y.-H.: Ionospheric correction of GPS radio occultation data in the troposphere, Atmos. Meas. Tech., 9, 335–346, https://doi.org/10.5194/amt-9-335-2016, 2016.
Zeng, Z., Sokolovskiy, S., Schreiner, W. S., and Hunt, D.: Representation of vertical atmospheric structures by radio occultation observations in the UTLS: comparison to high resolution radiosonde profiles, J. Atmos. Ocean. Tech., 36, 655–670, https://doi.org/10.1175/JTECH-D-18-0105.1, 2019.