the Creative Commons Attribution 4.0 License.
the Creative Commons Attribution 4.0 License.
 | 20 Jan 2020
Photoacoustic measurement with infrared band-pass filters significantly overestimates NH3 emissions from cattle houses due to volatile organic compound (VOC) interferences
Dezhao Liu
Li Rong
Jesper Kamp
Xianwang Kong
Anders Peter S. Adamsen
Albarune Chowdhury
Anders Feilberg
Infrared (IR) photoacoustic spectroscopy (PAS) using band-pass filters is a widely used method for measurement of NH3 and greenhouse gas emissions (CH4, N2O and CO2) especially in agriculture, but non-targeted gases such as volatile organic compounds (VOCs) from cattle barns may interfere with target gases, causing inaccurate results. This study made an estimation of NH3 interference in PAS caused by selected non-targeted VOCs which were simultaneously measured by a PAS and a PTR-MS (proton-transfer-reaction mass spectrometry). Laboratory calibrations were performed for NH3 measurement, and VOCs were selected based on a headspace test of the feeding material (maize silage). Strong interferences of VOCs were observed on NH3 and greenhouse emissions measured by PAS. Particularly, ethanol, methanol, 1-butanol, 1-propanol and acetic acid were found to have the highest interferences on NH3, giving empirical relationships in the range of 0.7 to 3.3 ppmv NH3 per ppmv VOC. A linear response was typically obtained, except for a nonlinear relation for VOCs on N2O concentration. The corrected online NH3 concentrations measured by PAS in a dairy farm (with empirical relationships 2.1±0.8 and 2.9±1.9 for Location 1 and Location 2, respectively) were confirmed to be correlated (R2=0.73 and 0.79) to the NH3 concentration measured simultaneously by the PTR-MS when the empirical corrections obtained from single VOC tests were applied.
- Article
(1461 KB) - Full-text XML
-
Supplement
(284 KB) - BibTeX
- EndNote


Measurements of ammonia and greenhouse gas (CH4, N2O and CO2) emissions are gaining increasing attention due to stronger interest in global change and air pollution. Ammonia not only causes serious environmental problems such as soil acidification and pollution of underground water and surface water (van Breemen et al., 1983; Pearson and Stewart, 1993; Erisman et al., 2007), but it is also important for fine particle formation (Bouwman et al., 1997; Seinfeld and Pandis, 1997; Pinder et al., 2007). Greenhouse gas emissions, on the other hand, cause climate change (Thomas et al., 2004; Chadwick et al., 2011). Livestock husbandry was estimated to be responsible for more than 80 % of the ammonia emission in western Europe (Hutchings et al., 2001; EMEP, 2013) and more than 60 % in China (Paulot et al., 2014). In the USA, agriculture accounts for ∼90 % of the total ammonia emissions (Aneja et al., 2009). Meanwhile, agriculture accounts for 52 % and 84 % of global anthropogenic methane and nitrous oxide emissions (Smith et al., 2008). Accurate measurements of ammonia and greenhouse emissions are therefore vital for reliable emission estimation and thereby also for the possible reduction of these emissions through various efforts, such as air cleaning with biotrickling filters and air scrubbers (Melse and Van der Werf, 2005; De Vries and Melse, 2017). For ammonia measurements, more than a 30 % difference between different methods has been reported (Scholtens et al., 2004).
Infrared (IR) photoacoustic spectroscopy (PAS) is a widely used technique for studies of air emissions especially within agriculture (Osada et al., 1998; Osada and Fukumoto, 2001; Emmenegger et al., 2004; Schilt et al., 2004; Heber et al., 2006; Angela et al., 2006; Blanes-Vidal et al., 2007; Hassouna et al., 2008; Rong et al., 2009; Ngwabie et al., 2011; Cortus et al., 2012; Joo et al., 2013; Wang-Li et al., 2013; Iqbal et al., 2013; Zhao et al., 2016; Ni et al., 2017; Lin et al., 2017). The PAS technique determines the gas concentrations through measuring acoustic signals caused by cell pressure changes when gas absorbs energy from infrared light at a specific wavelength range using an optical filter and a chopper (Iqbal et al., 2013). For example, the Innova 1312 and later versions (Lumasense Technologies, Ballerup, Denmark) use the PAS principle and were previously verified by the US EPA and recommended by the Air Resources Board in California (CARB, 2000). In principle, this instrument “is capable of measuring almost any gas that absorbs infrared light” (Innova, Lumasense Technology A/S, Denmark). The method is based on nondispersive broadband spectroscopy, and selectivity is achieved by using the appropriate wavelength filter, with one filter for each targeted trace gas. Innova 1312 and 1412 instruments have been used in a large number of tests to measure NH3, CH4, CO2 and N2O for agricultural applications. Water vapor is also measured to account for the strong absorption of water throughout the infrared spectrum (Christensen, 1990a). Nevertheless, since the infrared spectroscopic method is applied for measuring gas concentrations in PAS, the overlapping of infrared spectra with non-targeted gases can introduce significant interferences due to the absorption of infrared light at similar wavelengths. The specificity is limited by the bandwidth of the optical filters. The interferences can be corrected by the instrument software through cross compensation for all target gases when the instrument is calibrated (Christensen, 1990a; Lumasense, 2012), but understanding and estimation of interferences from non-targeted gases need to be considered in each specific measurement situation. This is especially important for agricultural applications, where the manure and the animal feed may emit various types of gases depending on the management and operations in the animal houses (Hassouna et al., 2013; Moset et al., 2012). Therefore, two key questions exist: (a) what is the magnitude of interferences that can be expected in agricultural environments, and (b) is it possible to quantify and correct interferences in a reasonable way? Until now, the PAS interference has not been well estimated and corrected for, although interferences were previously suspected in livestock facilities (Phillips et al., 2001; Mathot et al., 2007; Ni and Heber, 2008). Flechard et al. (2005) suspected that the N2O concentration from soil measured by PAS (Innova 1312) was heavily influenced by CO2 and temperature even when cross-interference compensation was applied; they developed an alternative correction algorithm based on controlled ratios under selected temperatures. Zhao et al. (2012) claimed that the internal cross compensation could eliminate the interferences between target gases and quantified interferences of non-targeted gas of NH3 on targeted gases of ethanol, methanol, N2O, CO2 and CH4; however, no specific relationships were given. Iqbal et al. (2013) also demonstrated that a careful calibration could eliminate the internal cross interferences of high water vapor and CO2 concentrations on low concentrations of N2O at the soil surface by comparison to gas chromatography (GC) measurements. Nevertheless, tests of interferences by non-targeted volatile organic compounds (VOCs) were not included in their study, likely due to the typical low concentrations of VOC in soil (Insam and Seewald, 2010). Hassouna et al. (2013) presented a field study on dairy cow farms, where interferences on NH3, CH4 and N2O were observed. The interferences were suspected to be caused by VOCs (acetic acid, ethanol and 1-propanol) that they measured simultaneously. In their study, two PAS instruments were applied, with one of them allocated with optical filters of these VOCs (NH3 optical filter was included for both PAS). Still, no empirical relationships were given in terms of tested volatile organic compounds, which were typically emitted from feeding materials such as maize silage (Howard et al., 2010; Malkina et al., 2011). The correction of interferences of non-targeted VOCs on NH3 emission is also essential for the evaluation of emission abatement technologies such as air scrubbers, especially when the inlet VOC concentrations are relatively high. An overestimation of ammonia removal efficiency could easily be obtained, since less interference would be expected for the outlet VOCs, especially for water-soluble compounds such as the VOCs investigated in this study.
In this work, an evaluation of interferences by non-targeted VOCs on targeted NH3 and greenhouse gas measurements by PAS is presented. The interference on NH3 was tested by simultaneous application of proton-transfer-reaction mass spectrometry (PTR-MS), cavity ring-down spectroscopy (CRDS) and PAS. The experiments were as follows: (1) ammonia laboratory calibration by PAS, PTR-MS and CRDS; (2) VOC selection for testing of interference on ammonia measured by PAS; (3) effect of VOCs on ammonia and greenhouse emissions measured by the PAS; and (4) field confirmation of interferences of non-targeted VOCs on ammonia measurement and test of potential for data correction.
2.1 Instrumentation for gas concentrations measurement
In this study, a PTR-MS, a CRDS NH3 analyzer and a PAS gas analyzer were used to measure trace gas concentrations in air. PTR-MS is a state-of-the-art and widely used technique for highly sensitive online measurements of VOCs (De Gouw and Warneke, 2007; Blake et al., 2009; Yuan et al., 2017). PTR-MS can also measure a few inorganic compounds such as ammonia (at m∕z 18), since the proton affinity (204.0 kcal mol−1) of ammonia is higher than that of water (165.0 kcal mol−1). Since the intrinsic ion at m∕z 18 is always formed in the plasma ion source (Norman et al., 2007), ammonia measurements by PTR-MS are routinely corrected for instrumental background contribution. The typical m∕z 18 background signal corresponds to a few hundred parts per billion by volume (ppbv) of NH3. The background signal is relatively stable and still allows for NH3 detection limits of 20–50 ppb. For agricultural measurement conditions, concentrations are typically from a few hundred parts per billion to > 10 ppmv (e.g., Rong et al., 2009). When total gas concentration measured by PTR-MS is higher than approximately 10 ppmv, dilution is needed to keep the primary ion signals stable. A high-sensitivity PTR-MS (Ionicon Analytik GmbH, Innsbruck, Austria) was applied for the test of ammonia calibration in the laboratory, effects of non-targeted VOCs on ammonia measurement and field confirmation of interferences of non-targeted VOCs on ammonia measurement. Standard conditions with a total voltage of 600 V in the drift tube were utilized for the PTR-MS. Pressure and temperature in the drift tube were maintained in the range of 2.1–2.2 mbar and at 60 ∘C, respectively, which gives an E∕N ratio of ca. 135 Td (Townsend). The inlet of the PTR-MS is PEEK tubing with a 1.2 m length, 0.64 mm inner diameter (ID) and 1.6 mm outer diameter (OD). The inlet flow to the PTR-MS during the calibration test and measurements was kept at ∼150 mL min−1. The inlet temperature was maintained at 60 ∘C. The instrument calibration was performed based on specific reaction rate constants and mass discrimination factors (accuracy better than 12 %), as described in our previous study (Liu et al., 2018). Mass calibration was performed before each test, while mass discrimination calibration was performed every 2 weeks.
CRDS determines the gas concentration (e.g., NH3) by measuring the ring-down time of light in the cavity due to absorption by a targeted gas species, which is compared to the ring-down time without any additional absorption due to a targeted gas species. The light source is a laser with a tunable wavelength (von Bobrutzki et al., 2010; Picarro, 2017). The very long effective path length of the light in the cavity (e.g., over 20 km for 25 cm cavity; Picarro, 2017) enables a significantly higher sensitivity compared to conventional absorption spectroscopy (Berden et al., 2000; von Bobrutzki et al., 2010). There is negligible interference from VOCs on CRDS measurements, which makes CRDS ideal for measuring NH3 concentrations in this setting (Kamp et al., 2019). A G2103 Analyzer (Picarro Inc., Sunnyvale, CA, USA) using the CRDS technique was applied in this study for the test of ammonia laboratory calibration and the effect of non-targeted VOCs on ammonia measurement. The accuracy of the CRDS instrument is routinely checked against a certified reference gas as described by Kamp et al. (2019). The CRDS analyzer was equipped with two in-line, sub-micron polytetrafluoroethylene (PTFE) particulate matter filters: one at the gas inlet at the back of the analyzer and one at the inlet of the cavity to protect the highly reflective mirrors. The inlet of the CRDS is a PTFE tubing with a 1.5 m length and 6.4 mm outer diameter. The optical cavities incorporate precise temperature (±0.005 ∘C) and pressure (±0.0002 atm) control systems. In this study, both the temperature and pressure of the air sample continuously flowing through the optical cavity are tightly controlled at all times to constant values of 45 ∘C and 140 Torr, respectively. The measurement interval is around 2 s. The CRDS analyzer measured the water vapor simultaneously.
A photoacoustic multi-gas monitor 1312 (Innova, Lumasense Technology A/S, Denmark) was compared with the PTR-MS and the CRDS for ammonia calibration and non-targeted VOCs on ammonia measurement. An infrared light source was used for the PAS instrument, and the principle for the measurement is as follows. The infrared radiation can interact with a molecule and transfer energy to it if the frequency of the radiation is the same as the frequency of vibration within the molecule. When the molecule absorbs IR light, it vibrates with greater amplitude. This increased activity is short-lived, however, and the excited molecule very quickly transfers its extra energy to other molecules in the vicinity by collision. The increased kinetic energy leads to an increase in the measurement chamber temperature and pressure. A microphone is used to detect the consequently fluctuating pressure. The sample integration time to measure ammonia by PAS was 20 s. The instrument used six optical filters for NH3, CH4, CO2, H2O, N2O and SF6. The specifications of the optical filters are shown in Table S1 in the Supplement. Water vapor must be included for PAS measurement, since the absorbance spectrum of water overlaps with other gases such as N2O and CO2, thus causing interferences. According to the manufacturer, the Innova 1312 has a linear response over a wide dynamic range, with the possibility of self-calibration (Lumasense, 2012). Before the measurements presented in this study, the supplier calibrated the instrument. During the study the instrument was calibrated based on a certified gas cylinder containing 99.7 ppmv (±10 %) ammonia (AGA A/S, Copenhagen, Denmark). The interferences between the target gases were therefore supposed to be eliminated through internal cross compensation (Christensen, 1990b; Zhao et al., 2012).
2.2 Experiment 1: laboratory test on ammonia calibration
Instrumental background signals, ammonia calibrations and instrumental response times were characterized for the PAS, PTR-MS and CRDS instruments. For the background measurement, zero air controlled by a mass flow controller (Bronkhorst, Ruurlo, the Netherlands) was supplied, and measurement was performed individually for each instrument. The zero air was supplied from a HiQ zero air station (Linde AG, Munich, Germany). The selected ion measurement mode was used for the PTR-MS, with m∕z 18 being used for ammonia detection. For the calibration test, a factory-calibrated gas cylinder (AGA A/S, Copenhagen, Denmark) containing 99.7 ppmv (±10 %) ammonia was used. Mass flow controllers (Bronkhorst, Ruurlo, the Netherlands) were used to dilute the gas from the cylinder with zero air to achieve the desired NH3 concentration levels (0–11 ppmv). For the test of response decay time, zero air flow was supplied to the instruments at first, then switched to a diluted flow (via two levels of mass flow controllers), with ammonia concentration around 5.2 ppmv supplied to all three instruments simultaneously. Subsequently, the ammonia supply was set to zero to test the decay time. Four individual decay time tests were performed for the PAS to confirm the long decay time of the instrument with low ammonia concentrations (5.2–8.8 ppmv) or high ammonia concentration (99.7 ppmv). For the test of response time for the PAS, two different levels of ammonia concentration were introduced individually to the instrument to test the dependence of the response time on ammonia concentration.
2.3 Experiment 2: VOC selection test
A headspace test was performed, and VOCs were selected through a PTR-MS measurement as preparation to the interference tests of VOCs on ammonia measured by the PAS. Maize silage is typical feeding material to the cows, and silage is generally considered an important source of gaseous VOC in cattle barns. A sample of maize silage was collected from the farm where the field experiment was performed (Skjern, Jutland, Denmark; latitude: 55∘59′36.6′′, longitude: 8∘29′53.52′′). The silage was then transferred to the laboratory immediately for the headspace test. A clean PTFE container (58 cm×38 cm×43 cm) with two oval holding holes (6 cm×8 cm) on the sides was used for the headspace test. The container was partly open, and the silage filled half of the container. A 1 m 1∕4 in. OD PTFE tube was used for the test, with one end placed around 5 cm above the silage and the other side connected to a T piece. One side of the T piece was connected to a 1∕8 in. OD PTFE tube (around a half meter) which was connected to the inlet of the PTR-MS. The flow rate of the PTR-MS was kept at 150 mL min−1. A zero-air dilution flow (75 mL min−1) was supplied to the T piece to make 1:1 dilution to keep the total concentration below 10 ppmv. The headspace measurement was performed by the PTR-MS in scan mode, and masses were measured from m∕z 21 to m∕z 250, with 200 ms for each mass. The selection of VOCs was based on the scan results and relevant literature data on silage VOC, with the following VOCs being selected: ethanol, methanol, acetaldehyde, acetic acid, 2-butanone, acetone, 1-propanol and 1-butanol (Howard et al., 2010; Malkina et al., 2011; Hafner et al., 2013). These eight selected VOCs were tested for empirical relationships () with respect to their contribution to measured NH3 concentration (). All chemicals were purchased from Sigma-Aldrich with at least analytical-grade purity.
2.4 Experiment 3: laboratory test for empirical relationships
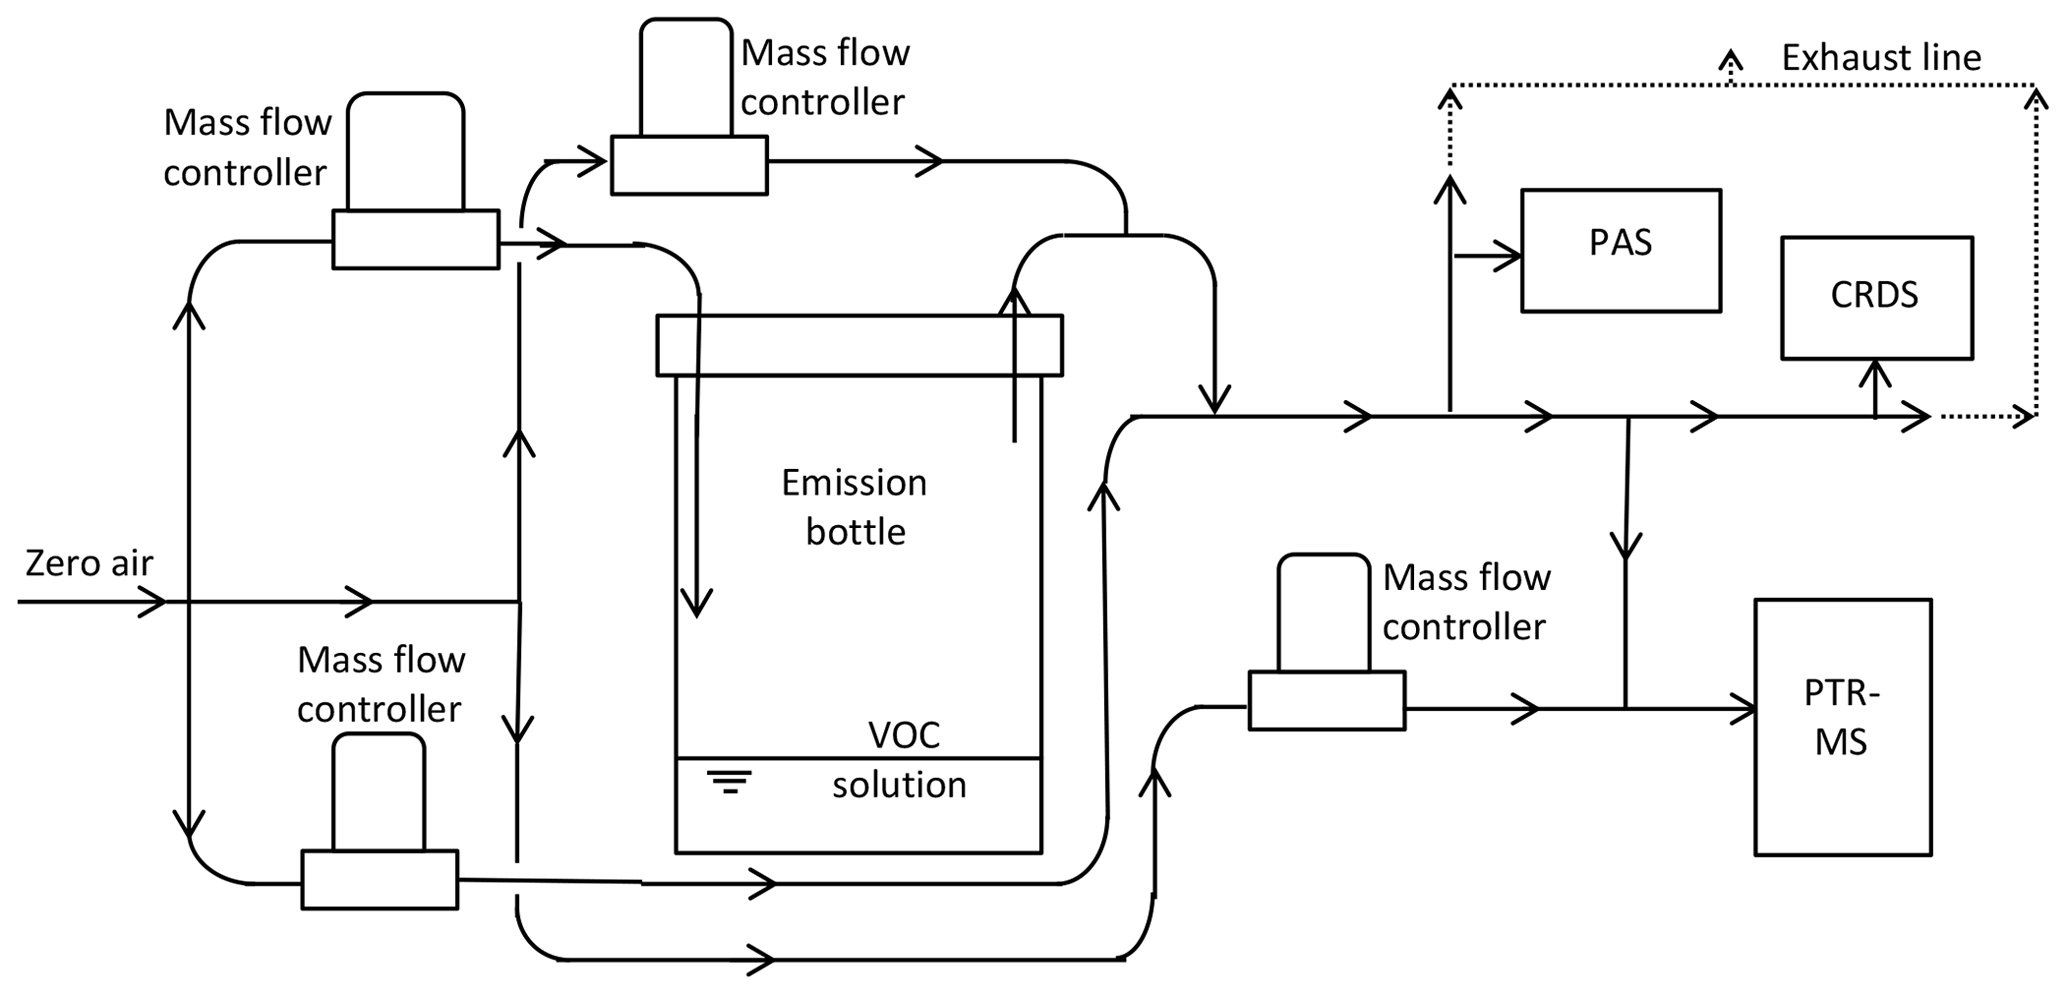
The diagram of the setup for the laboratory calibration test is shown in Fig. 1. In the setup, a water solution containing the single VOC was purged from the headspace by dry and clean air (or nitrogen for one test on methanol), with flow controlled by a mass flow controller. The air or nitrogen was supplied through a charcoal or silica gel filter; 1 L airtight glass bottles were used for the water solution containing the VOC, and a 1∕4 in. OD PTFE tube was used in the setup. The purged air flow was diluted with air through a two-step dilution. The flows were adjusted according to the purged VOC concentration and the desired final VOC concentration. The water solution was prepared by using a volume ratio of VOC : water of 1:5, with purging by clean air controlled by two mass flow controllers in order to reach a desired concentration range. For the laboratory test, the diluted air containing VOC was connected to the PAS, the CRDS and the PTR-MS for simultaneous measurements. The overall flow was maintained at a level above the total maximum sampling flow of all three instruments, and excess flow was vented through a T piece. For the PTR-MS measurement, a further dilution by zero air was typically used to keep the total VOC concentrations below 10 ppmv to avoid depletion of the primary ion, H3O+. The selected ion measurement mode was applied for the PTR-MS, with an integration time of 2 s for the tested VOC mass. During the experiments, the humidity was kept relatively low and stable, with dry clean air used for dilution for all cases, except for one test on methanol, which was also tested under nitrogen condition.
2.5 Experiment 4: field test for validation of empirical relationships
The field demonstration test for non-targeted VOCs on ammonia measurement by the PAS was performed in the dairy farm mentioned above (Skjern, Jutland, Denmark), where both the PTR-MS and the PAS measured continuously over 20 d. The dairy farm housed 360 cows with an average weight of 650 kg. The ventilation system consisted of a natural and mechanical partial pit ventilation system (Rong et al., 2015).
For the field test, the PAS was combined with a Multiplexer 1309 (Lumasense Technology A/S, Denmark) to measure from several sampling points. The PAS and the PTR-MS were placed in a trailer next to the dairy farm. The PAS sample integration time was 5 s, and the flushing time was 20 s. The air concentrations were measured by the PAS sequentially between two selected locations inside the farm: one location in the pit ventilation and one location outside of the farm. PTFE tubes of 20 m and 8 mm OD were used for the sampling of air. The sampling lines were connected with the channels of the PAS multi-point sampler via continuously running PTFE membrane pumps to ensure constant flushing. VOCs (all VOCs showed in Sect. 2.3 were included together with VOCs reported in previous studies – Malkina et al., 2011; Hafner et al., 2013) and NH3 were measured simultaneously by PTR-MS. Measurements were switched between the four measurement sampling lines (connecting to the four locations mentioned above) and the background (outside air beside the trailer) at 8 min intervals via a custom-built switching box. PTFE tubes were used for the PTR-MS sampling lines, which were connected to PTFE sampling lines before the PTFE membranes pumps. The switching box was equipped with a five-port channel selector (Bio-Chem Valve Inc., USA) controlled automatically by 24 V outputs from the PTR-MS. A PTFE tube (ID of 1 mm) was used to connect the switching box to the inlet sampling line (1 m PEEK tube with ID of 0.64 mm) of the PTR-MS. For selected compounds, calibration was performed for the PTR-MS before the field measurements using permeation tubes and reference gas mixtures. Permeation tubes (VICI Metronics, Inc., Houston, TX, USA) included acetic acid, propanoic acid, butanoic acid, pentanoic acid and 4-methylphenol. Gas mixtures (all 5 ppmv in nitrogen) included hydrogen sulfide (AGA, Copenhagen, Denmark), methanethiol (AGA, Copenhagen, Denmark) and dimethyl sulfide (Air Liquide, Horsens, Denmark). Details regarding the calibration procedures could be found in our previous study, with errors within 12 % and in most cases within 8 % (Liu et al., 2018). VOC concentrations were determined directly by the PTR-MS based on estimated reaction rate constants as described by Liu et al. (2018). Standard conditions as described previously was applied and maintained for the PTR-MS (Feilberg et al., 2010). The mass discrimination was calibrated and adjusted weekly by using a mixture of 14 aromatic compounds between m∕z (mass-to-charge ratio) 79 and 181 (P/N 34423-PI, Restek, Bellefonte, PA, USA). Selected ions were monitored with a dwell time between 200 and 2000 ms during each measurement cycle. Masses and dwell time selection were based on ion abundance in full scan mode, relevant literature, and experience regarding odorant compounds from dairy farms as well as from pig houses and pig slurry applications (Shaw et al., 2007; Chung et al., 2009; Liu et al., 2014, 2018).
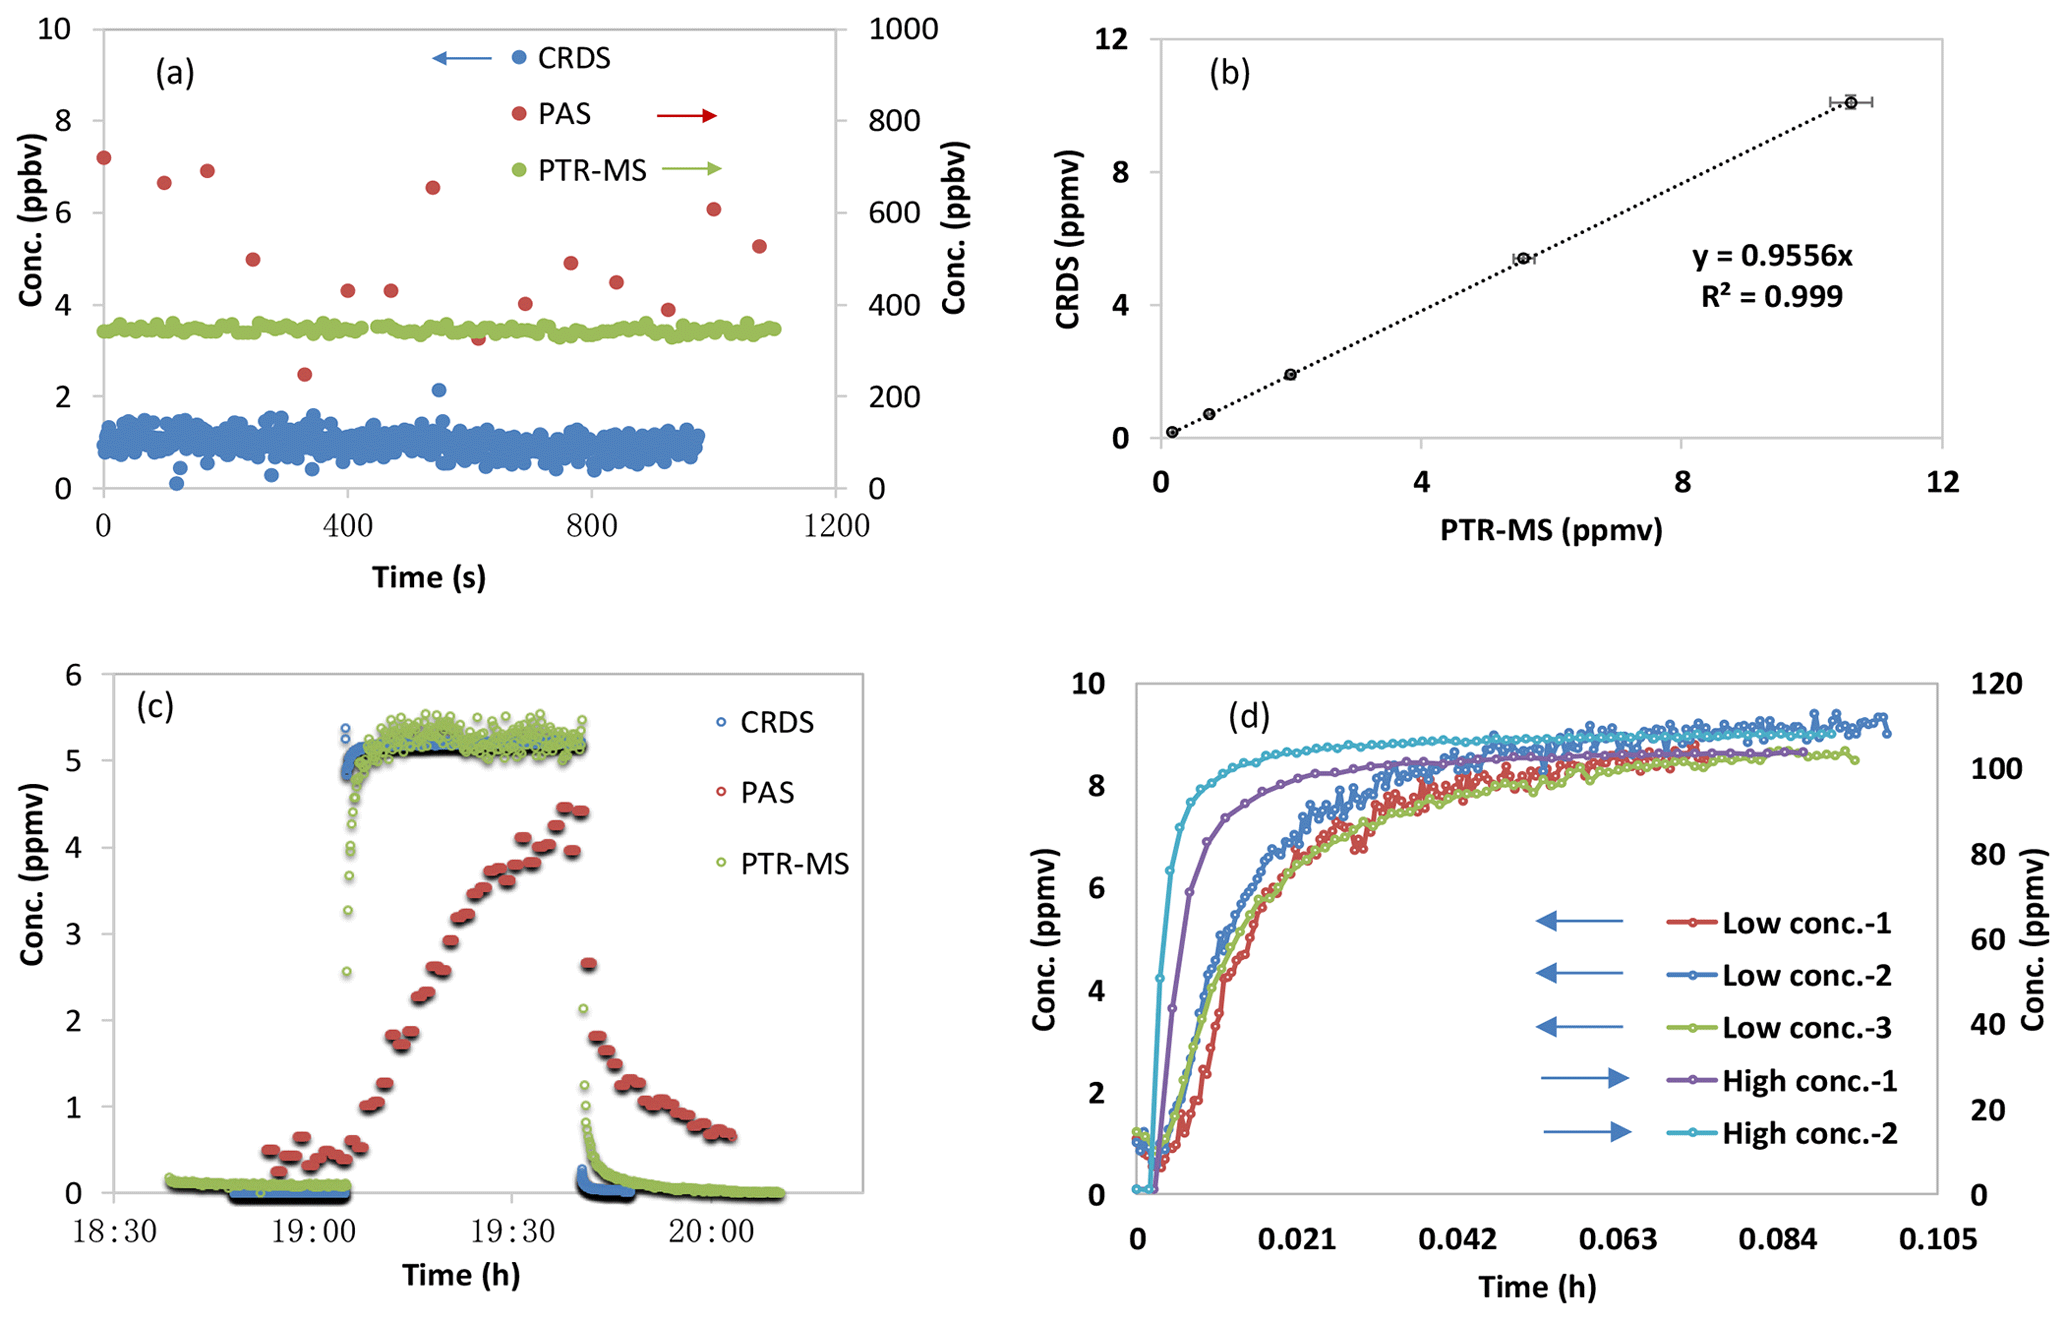
Figure 2Ammonia test measurements by PAS, PTR-MS and CRDS. (a) Background signals measured in ammonia-free air. (b) Intercomparison of ammonia concentrations measured by PTR-MS and CRDS. (c) Instrumental response of PTR-MS, PAS and CRDS instruments to a rectangular ammonia concentration pulse. (d) Instrumental response of PAS instrument to a stepwise increase in ammonia concentration (low concentration; three tests; ∼8.9 ppmv) and high concentration (two tests; 99.7 ppmv); Low Conc.-1, Low Conc.-2 and Low Conc.-3 point to the vertical axis on the left and to the upper horizontal axis, and High Conc.-1 and High Conc.-2 point to the vertical axis on the right and to the lower horizontal axis. High Conc.-2 was tested without the multiplexer. Data in (b) have been background subtracted, and the linear fits were least-square fits without error weighting.
3.1 Experiment 1: laboratory test on ammonia calibration
The instrumental baseline concentrations of ammonia-free zero air measured by PAS, CRDS and PTR-MS, respectively, are shown in Fig. 2a, in which a very low background signal was observed for the CRDS instrument (around 1 ppbv) with a detection limit of 0.7 ppbv (3 times the standard deviation of the background). The higher background for ammonia measured from the PTR-MS is caused by the intrinsic formation of (m∕z 18) in the ion source (Norman et al., 2007). Nevertheless, the measured background signals for ammonia by the PTR-MS were very stable and could be subtracted to give a detection limit of 21 ppbv (3 times the standard deviation of the background). Among the three instruments, the PAS gave the highest background signal for ammonia (corresponding to 502±140 ppb), with a detection limit of 421 ppbv (3 times the standard deviation of the background).
For the calibration test of ammonia, the ammonia concentrations simultaneously measured by the CRDS and the PTR-MS are shown in Fig. 2b, in which the linearity () and high correlation (R2=0.999) are generally very satisfactory for both instruments. The measured ammonia concentrations also agreed with expected ammonia concentrations from the ammonia reference gas within the uncertainty of 10 % provided by the gas supplier.
Table 1Instrument comparison regarding the specifications for ammonia measurements (LOD is limit of detection; SD is standard deviation).

a Accuracy propagated from uncertainty of the calibration standard gas of ammonia (10 %), uncertainty of mass flow controller (2 %) used for gas dilution systems and uncertainty of instrumental quantities of ammonia (12.8 %, 1.6 % and 0.2 % for Innova, PTR-MS and Picarro, respectively). It should be noted that the uncertainty associated with the comparison to the standard gas did not take into account the interferences by other livestock gases on the Innova. b Not specified by the producer. c According to the concentration calculation assumption and producer suggestion, total gas concentration should be lower than 10 ppmv; otherwise dilution is needed. d According to Kamp et al. (2019).
For the signal decay test, the instrument decay times for ammonia measurements by PAS, CRDS and PTR-MS were measured simultaneously under a static ammonia concentration of 5.2 ppmv. As shown in Fig. 2c, ammonia measured by the CRDS showed the shortest decay time, while the PAS gave by far the longest decay time. The estimated decay time is shown in Table 1, in which the 90 % decay time (time for the concentration to decrease by 90 %) for ammonia measured by the CRDS is around 4.5–4.7 s, with the 90 % decay time from the PTR-MS estimated to be 70 to 80 s. The decay time for ammonia measured by the PAS was remarkably longer, with an estimated 90 % decay time of around 30 min to more than an hour (for four individual tests with ammonia concentration ranging from 5.2 to 8.8 ppmv). When a much higher ammonia concentration was used (99.7 ppmv), the 90 % decay time measured by the PAS was shorter (450 to 550 s). This result is consistent with the response time tests under two levels of input ammonia concentrations (∼8.9 and 99.7 ppmv, respectively), with the response time being much shorter when the ammonia concentration is higher, as shown in Fig. 2d. Besides this, the multiplexer attached to the PAS seemed to increase the response time, as also shown in Fig. 2d. However, a very high concentration of about 100 ppmv is not expected in agricultural applications.
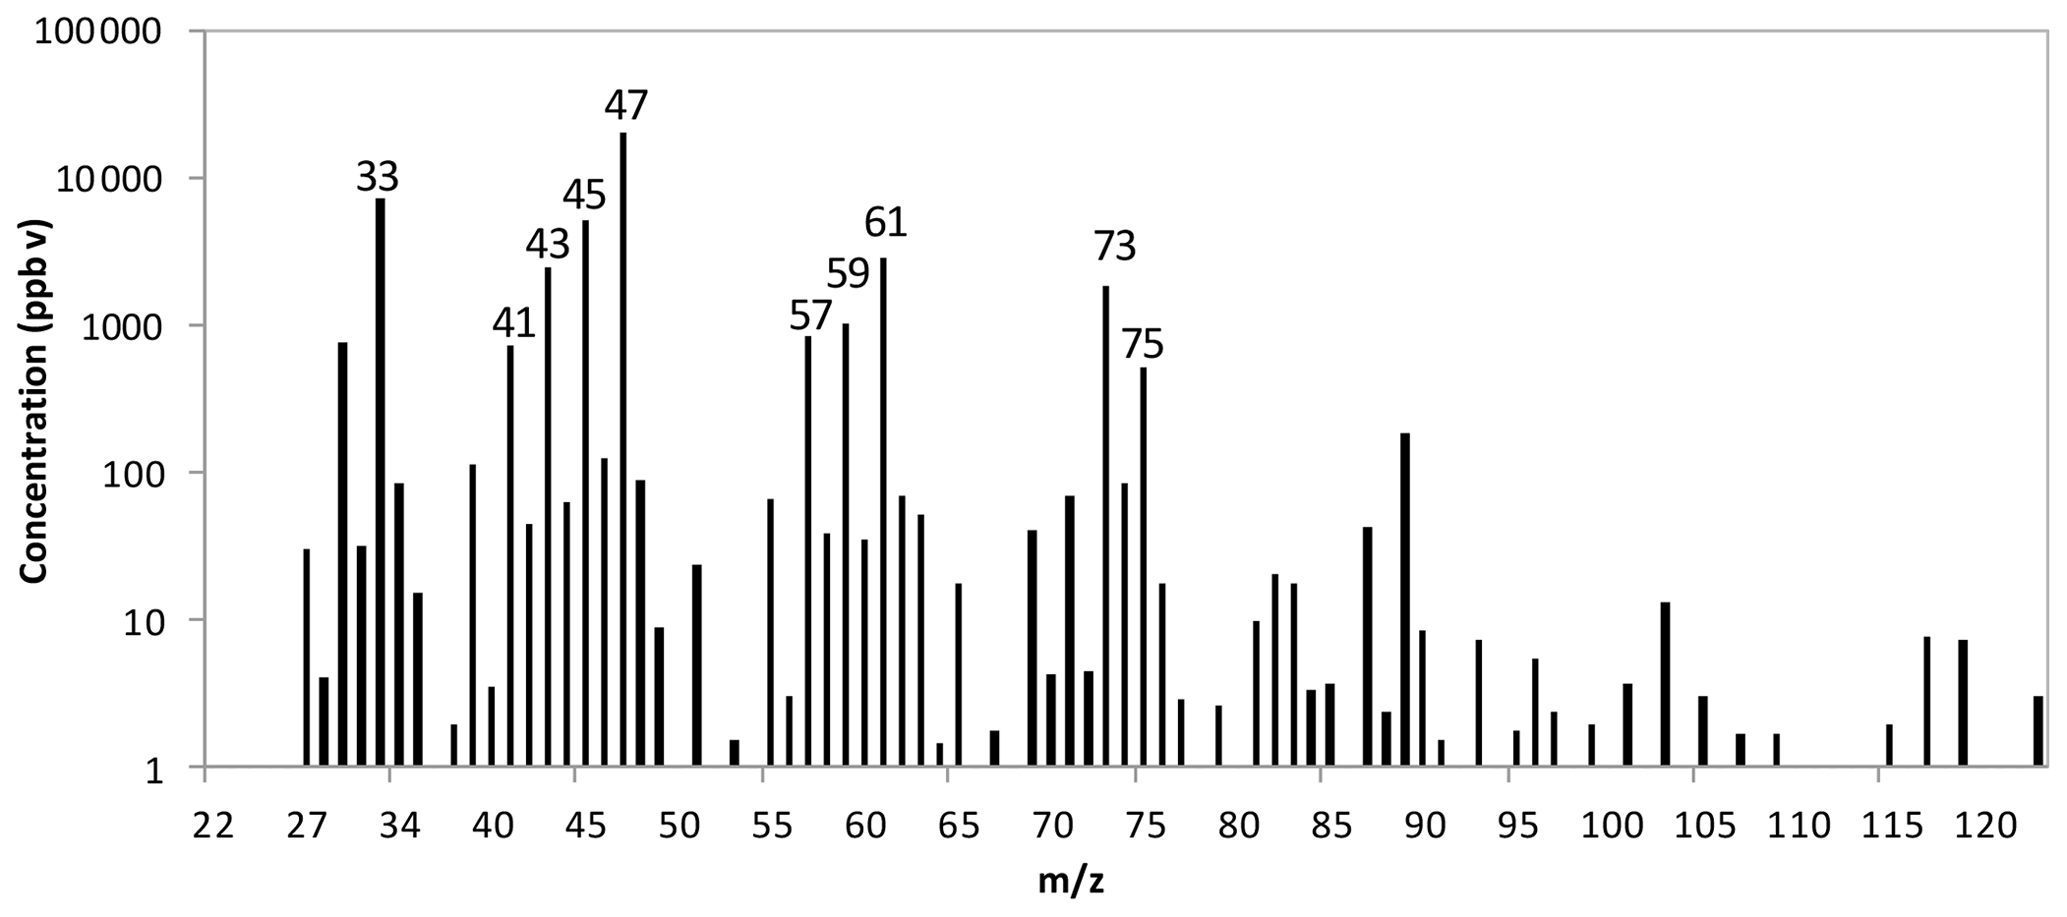
Figure 3A scan example of the feeding material of silage by using headspace technique measured by the PTR-MS. The m∕z 47 is corrected for ethanol fragmentation formed in the PTR-MS through calibration. Selected VOCs for the test in this study were ethanol, methanol, acetaldehyde, acetic acid, 2-butanone, acetone, propanol and butanol.
3.2 Experiment 2: VOC selection test
The tested VOCs were selected according to a scan test of the headspace from the feeding material of maize silage performed by the PTR-MS, as shown in Fig. 3. Due to the fragmentation of ethanol in the PTR-MS measurement (around 10 %; Inomata and Tanimoto, 2009), the concentration corresponding to mass 47 was corrected based on direct calibration under the assumption that mass 47 is solely due to ethanol. The highest peaks of the scan were at the following masses (m∕z): 47, 33, 45, 61, 43, 73, 59, 75, 57 and 41. From the VOCs typically found in the highest concentrations in barns and feeding material (Shaw et al., 2007; Chung et al., 2009; Howard et al., 2010; Malkina et al., 2011; Hafner et al., 2013) and the scan results, a list of VOCs were selected. The following VOCs were selected for the interference tests of non-targeted VOCs on ammonia measurement by the PAS: ethanol, methanol, acetaldehyde, acetic acid, 2-butanone, acetone, 1-propanol and 1-butanol. Compounds such as ethanol, methanol, acetic acid and 1-propanol are typically measured in cattle barns and feeding materials in high concentrations (Shaw et al., 2007; Ngwabie et al., 2008; Howard et al., 2010; Hafner et al., 2013).
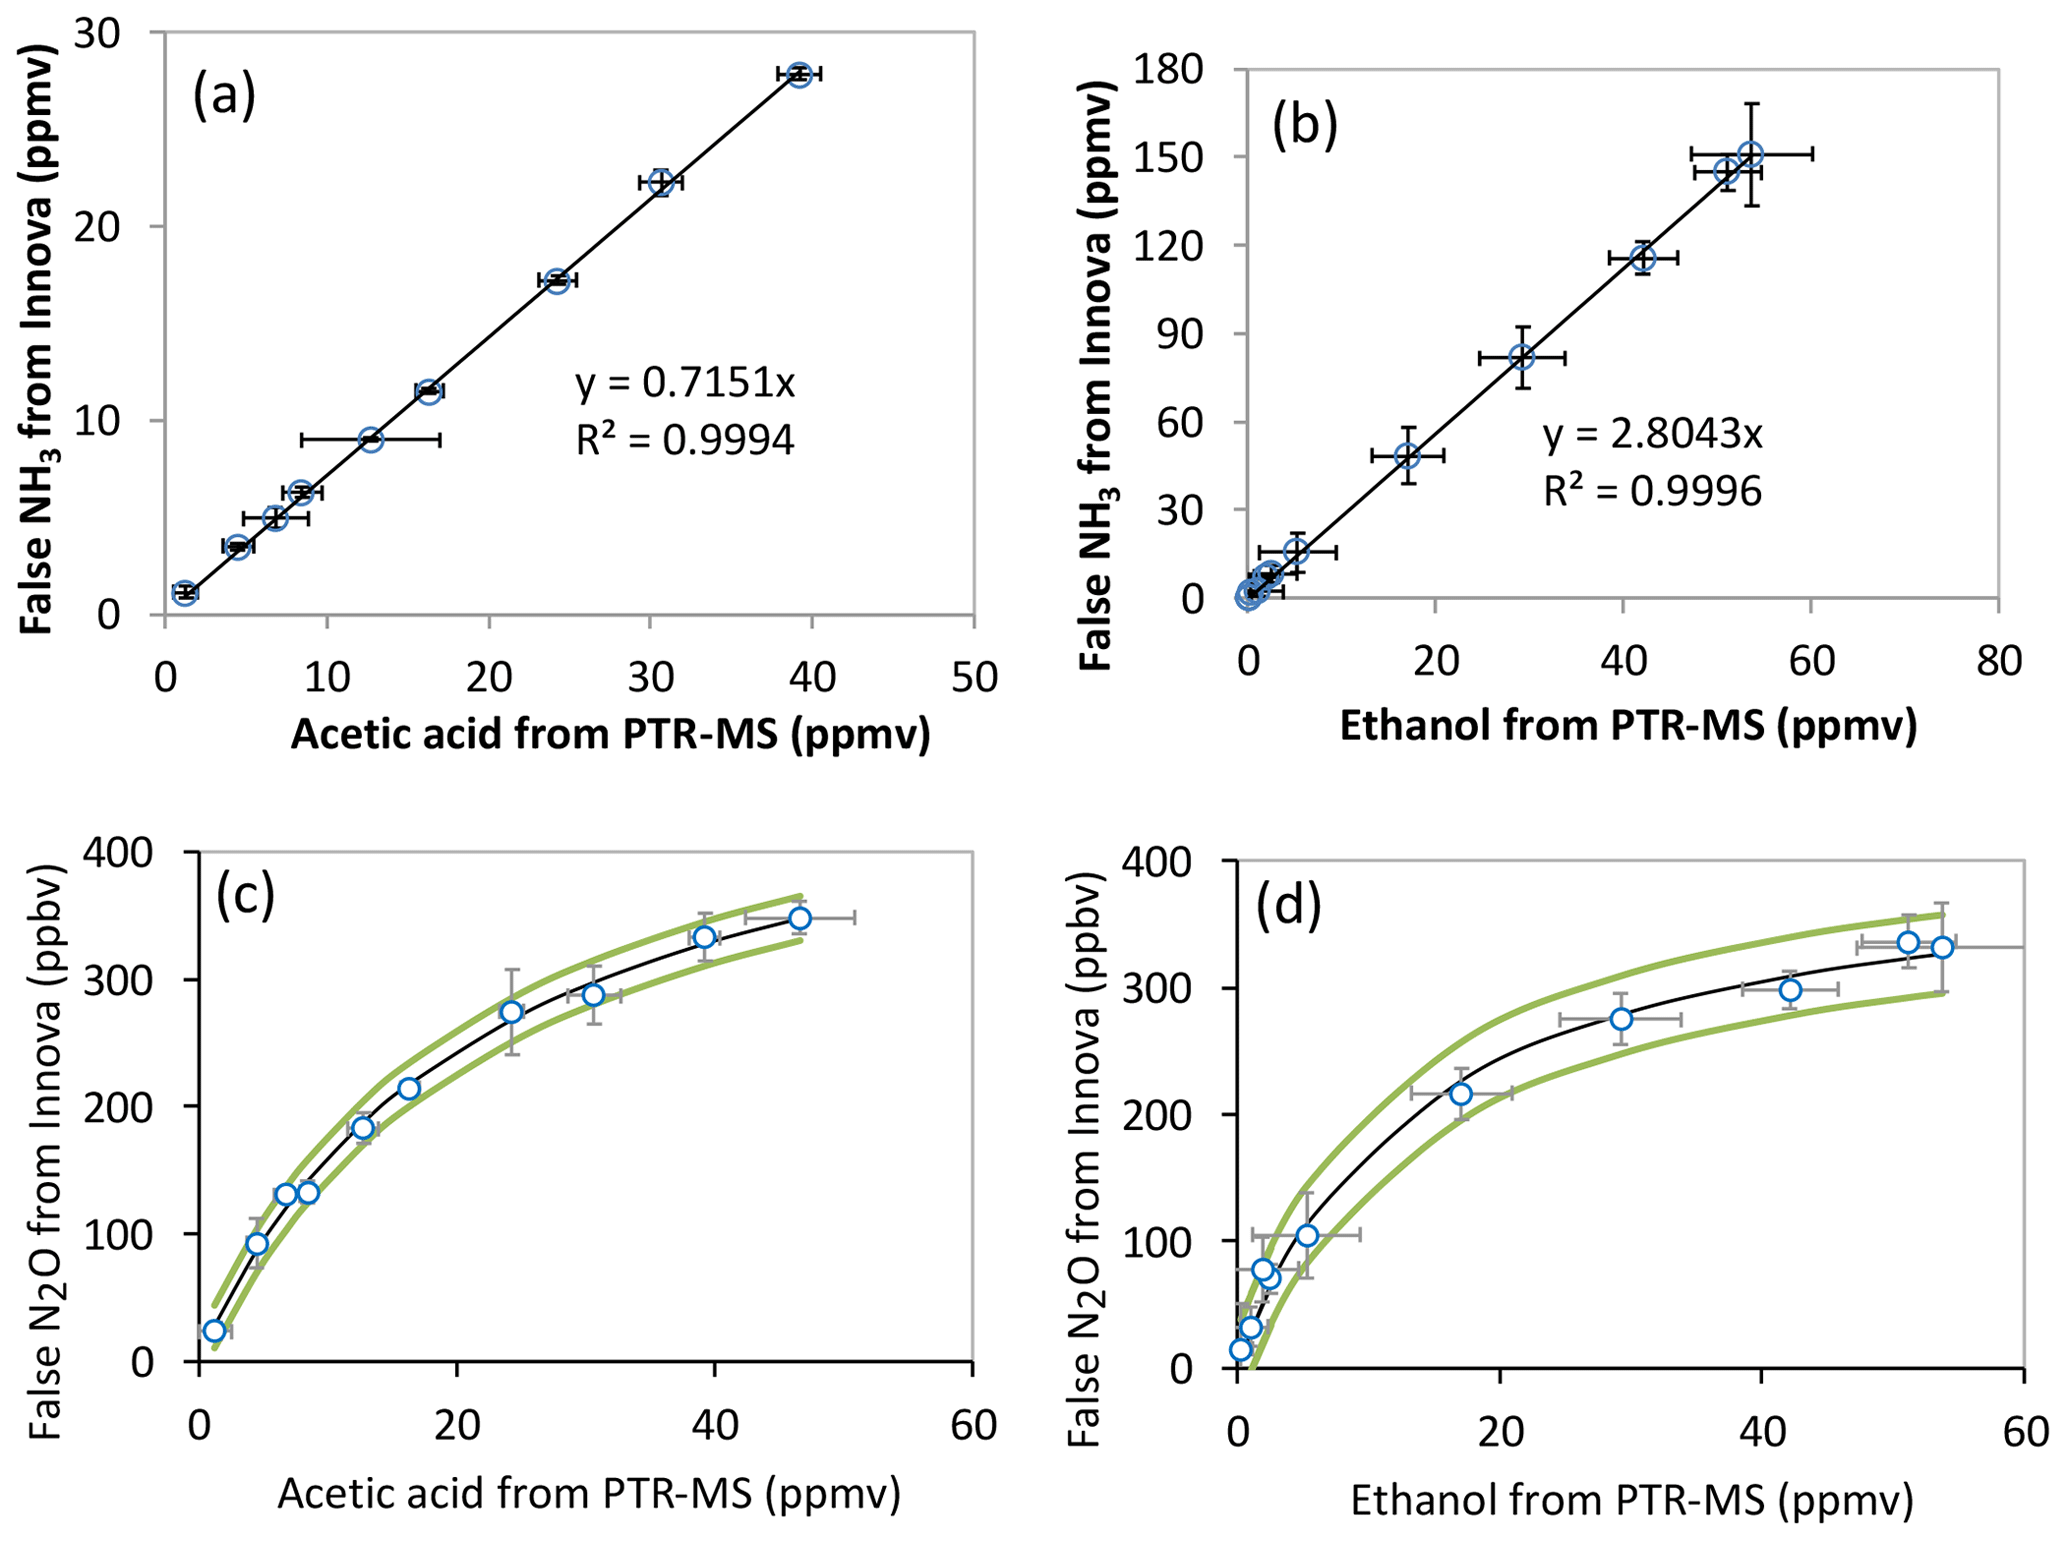
Figure 4Examples for the interference calibration from non-targeted VOC on NH3 (a, b) and N2O (c, d) measured by the PAS. The VOC concentration on the horizontal axis was measured by the PTR-MS, while the NH3 and N2O concentrations on vertical axis were from false signals measured simultaneously by the PAS. (a) The interference calibration for acetic acid on NH3, (b) the interference calibration for ethanol (corrected for fragments through calibration) on NH3, and (c) the interference calibration for ethanol (corrected for fragments through calibration) on N2O. (d) The interference calibration for acetic acid on N2O. In (c) and (d), the dark line indicated the curve fitted by equation , and the green curves indicated 95 % confidence range. The plotted error bars represent the standard deviations for the measured VOC by the PTR-MS under a selected VOC level (x axis) and for the measured NH3∕N2O level by the PAS simultaneously (y axis). Data were all background subtracted, and the linear fits were least-square fits without error weighting.
3.3 Experiment 3: laboratory test for empirical relationships
The interference of non-targeted VOCs on ammonia measurement by the PAS was investigated using single-VOC-containing air as an inlet measured simultaneously by PAS, PTR-MS and CRDS, as shown in the setup in Fig. 1. An example of the interference test can be seen in Fig. S1, where acetic acid was measured simultaneously by the three instruments under various concentration levels. Concentration-dependent interference was clear for acetic acid on PAS ammonia measurements.
In principle, establishing empirical-correction factors for each specific compound could be used to minimize the interferences of VOCs on the target gas measurements on a specific instrument with the same filter specifications. This requires, however, that VOC concentrations be measured simultaneously by expensive analyzers such as PTR-MS and will in any case result in higher uncertainties due to accumulated uncertainties from multiple interference relationships. Figure 4a and b show two examples of the calibration lines for acetic acid and ethanol, from which an empirical relationship (ER) between the false ammonia concentration and the tested compound could be obtained (ER = 0.72 for acetic acid and ER = 2.8 for ethanol). A linear response of the ammonia interference was observed for all the tested compounds, and they had generally low SDs for the slope of the linear fits. The ER for ammonia interference by other tested VOCs can be found in Table 2, where ethanol, methanol, 1-propanol and 1-butanol give the highest false signals on ammonia measured by the PAS, with an ER of 2.8, 3.3, 2.4 and 2.7, respectively. Due to the fact that these compounds are often found in cattle barns and feed silage even on the level of parts per million by volume, especially for ethanol, methanol and 1-propanol (Rabaud et al., 2003; Ngwabie et al., 2008; Howard et al., 2010; Hafner et al., 2013), severe interference on ammonia measured by PAS will therefore occur. While acetic acid gave significant false signals on ammonia (ER = 0.72), acetone only showed little interference on ammonia (ER = 0.02). Meanwhile, negative false signals were observed for ammonia by 2-butanone (ER = −0.13). Such negative interferences can usually be explained by the internal cross-compensation procedure for one target filter (first target filter, such as NH3 filter) on positive artifacts at another target filter (second target filter, such as CH4 filter) caused by non-target gas (such as VOC) on the second target filter. This physical explanation was included in a few relevant references such as Zhao et al. (2012). Interestingly, the empirical relationship for false ammonia by methanol in nitrogen matrix is significantly different from that by methanol presented in the air matrix (ER = 1.03 vs. 3.29). This observation is possibly related to the relatively rapid vibrational energy transfer between the VOC and oxygen (Harren et al., 2000). While nitrogen has a vibrational frequency around 2360 cm−1, oxygen has a vibrational frequency of 1554 cm−1, with only 170 collisions needed to transfer energy to the vibrational mode of O2 (Lambert, 1977).
Table 2Obtained empirical relationships (slope) describing the functional dependence of the interference in the measurement of the target compound (e.g., NH3) by PAS on non-targeted VOC concentrations. The value in the brackets indicated the uncertainty (SD of the slope) of the linear fit, except for N2O, where correlation coefficient is shown. N is the number of VOC concentration levels tested for determination of empirical relationships. Nonlinear fit was given for N2O, where x is measured VOC concentration and y is the false concentration measured by PAS. The concentration range covered for the tested VOC is as follows: ethanol (7 ppbv–58 ppmv), methanol (5 ppbv–45 ppmv), acetic acid (3 ppbv–48 ppmv), acetaldehyde (8 ppbv–38 ppmv), 2-butanone (3 ppbv–60 ppmv), acetone (4 ppbv–48 ppmv), 1-propanol (5 ppbv–55 ppmv) and 1-butanol (6 ppbv–52 ppmv).
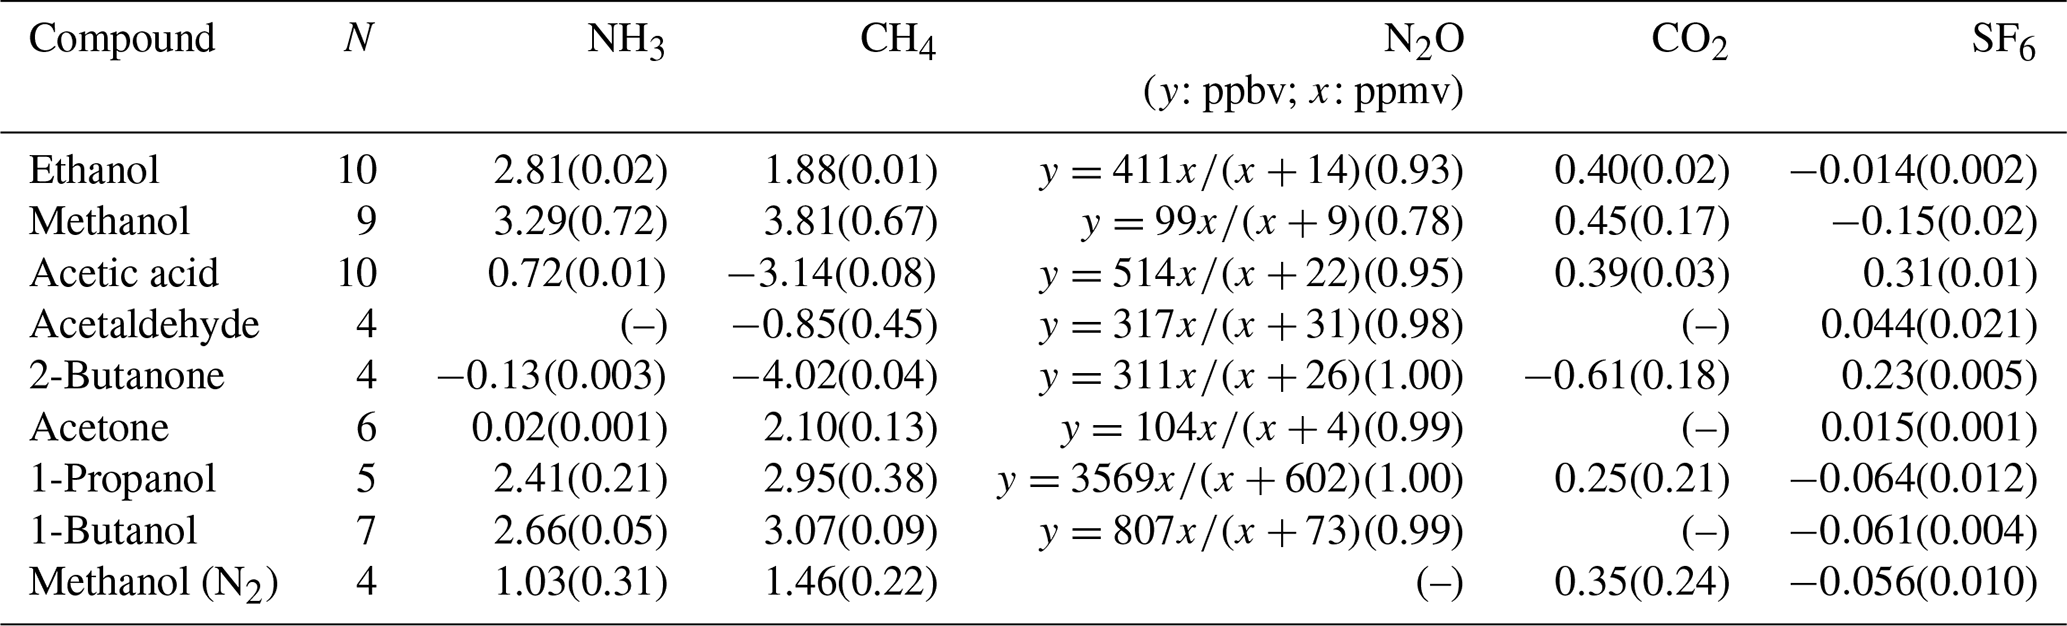
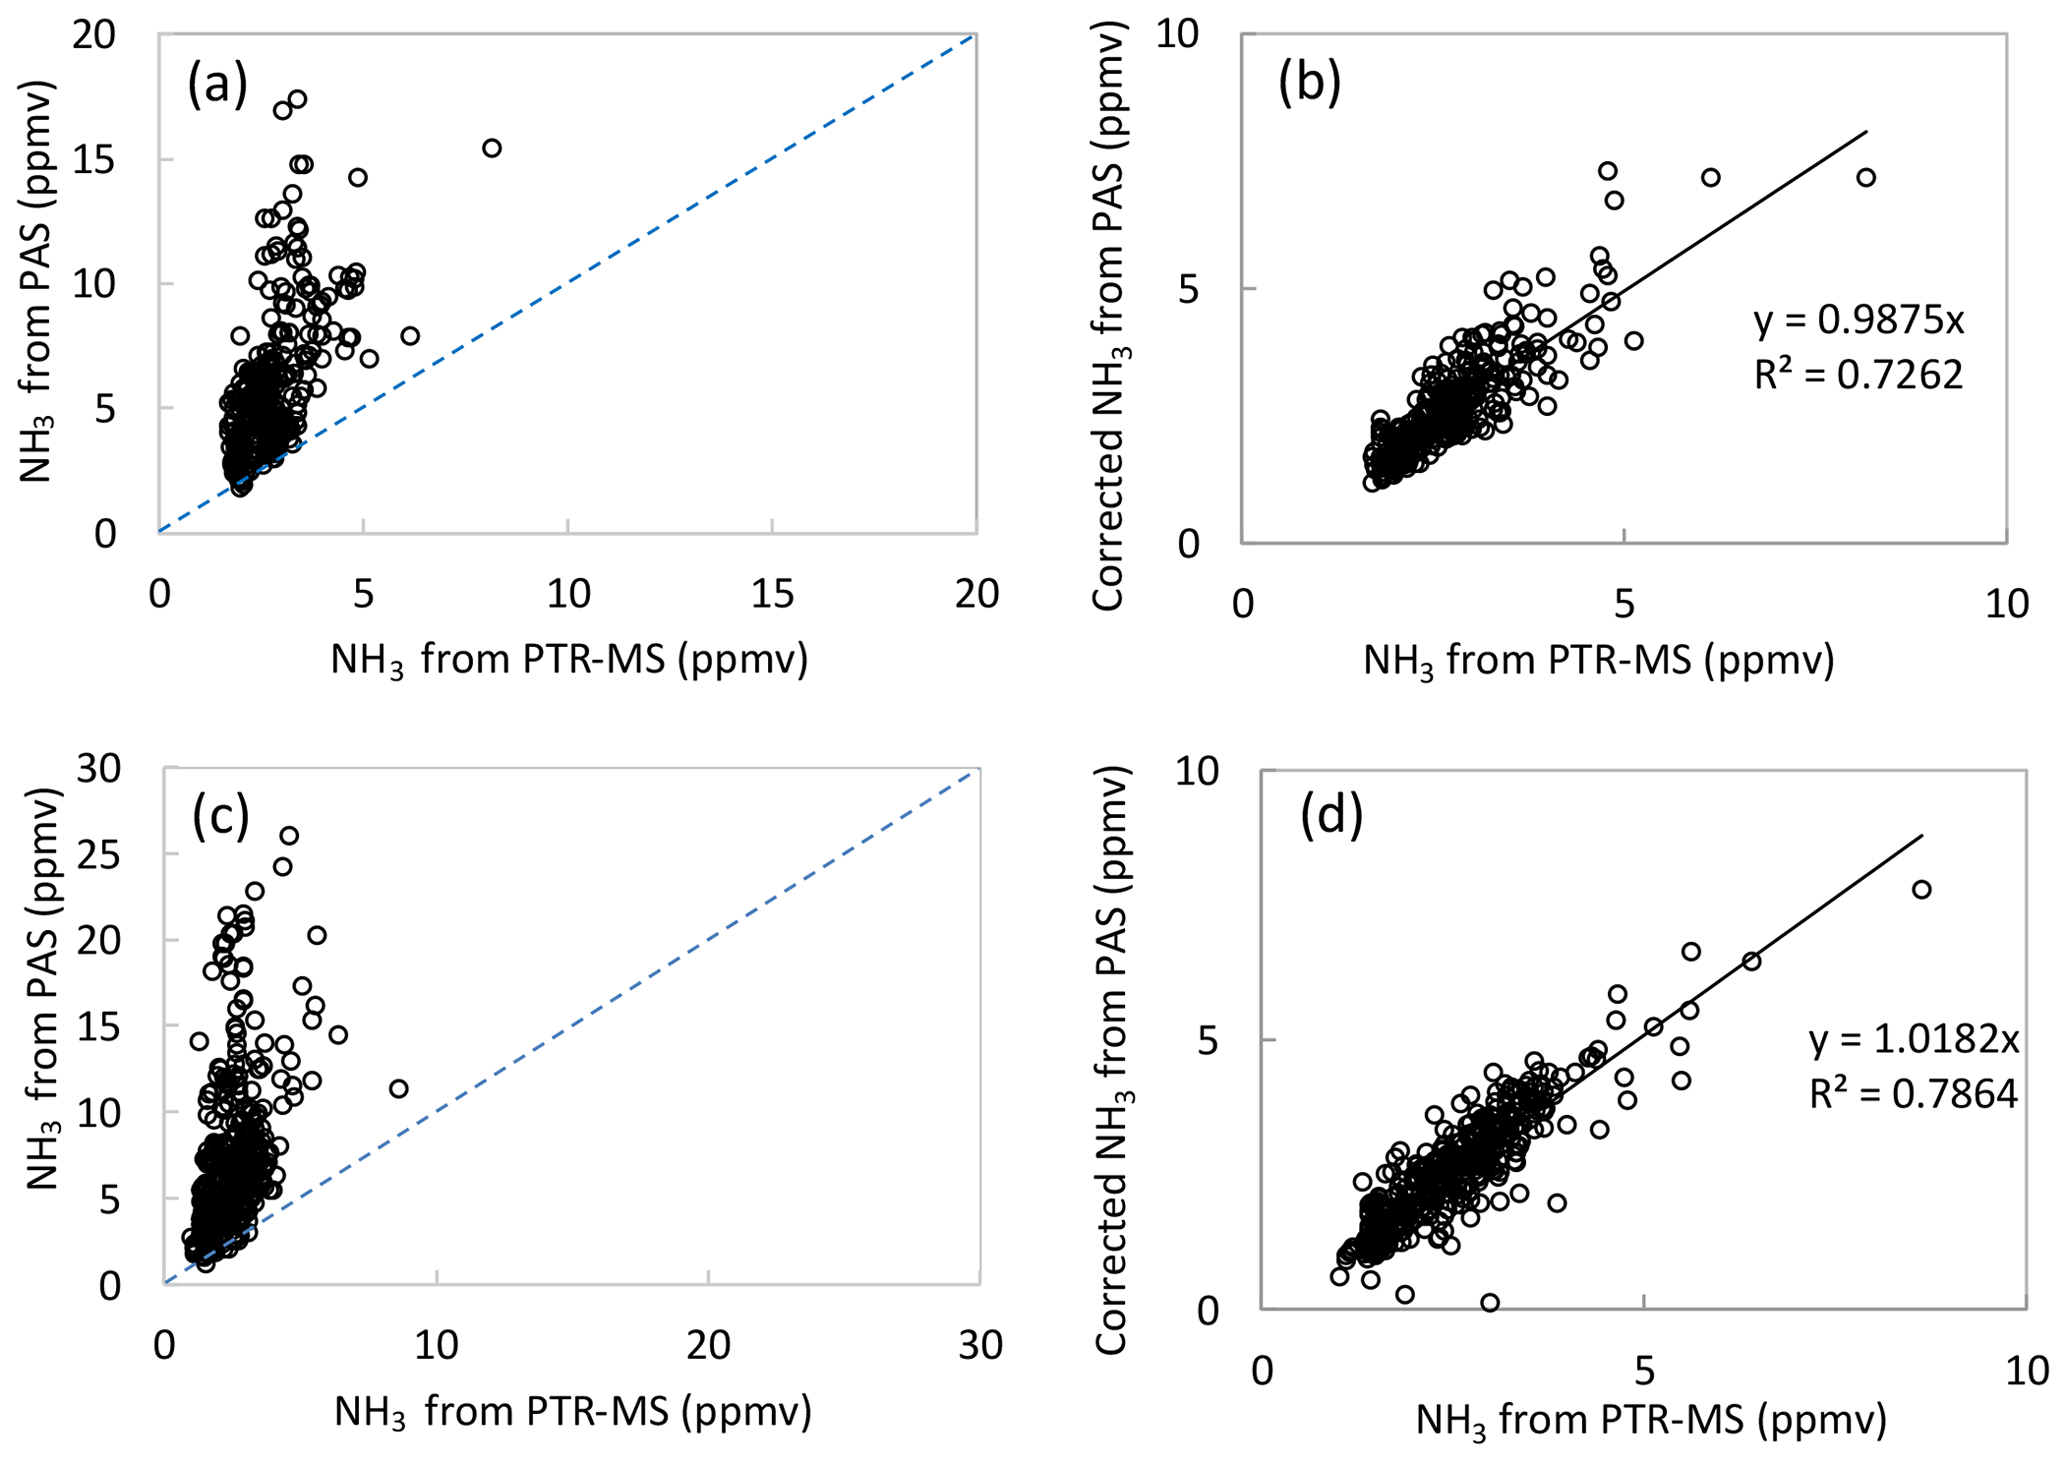
Figure 5NH3 concentrations measured by the PAS (vertical axis) and by the PTR-MS (horizontal axis) in the field measurement from Location 1 before the correction by the tested non-targeted VOCs (a) and after the correction by the tested non-targeted VOCs (b), and from Location 2 before the correction by the tested non-targeted VOCs (c) and after the correction by the tested non-targeted VOCs (d). Data from (b) and (d) were background corrected, and the linear fits were least-square fits without error weighting.
Besides the interferences on ammonia by the non-targeted VOCs, other target gases also showed various levels of interferences, as also indicated by previous studies (e.g., Zhao et al., 2012; Hassouna et al., 2013). Because target gases may have more overlap for the infrared spectrum, the primary interference on one target gas caused by the overlap with non-targeted VOCs could therefore influence and cause secondary interference on other target gases (Zhao et al., 2012; Adamsen, 2018). Still, in theory, empirical relationships could be obtained for the interfered gases by the tested VOCs. Specifically, for the interference on methane by non-targeted methanol, 1-butanol, 1-propanol, acetone and ethanol showed positive false signals (ER = 3.8, 3.1, 3.0, 2.1 and 1.9, respectively). 2-Butanone, acetic acid and acetaldehyde showed negative false signals to methane, with an ER equal to −4.02, −3.14 and −0.85, respectively. An explanation for the negative false signals could be that absorption takes place in the band for H2O correction (Adamsen, 2018). All interferences on methane are shown in Table 2. For methanol in nitrogen, the calibration showed a significant difference compared to air (ER = 1.46 vs. 3.81).
Meanwhile, the non-targeted VOC also caused false signals on nitrous oxide signals, with a much lower level of interference. Furthermore, the calibrations of the nitrous oxide interference by the non-targeted VOCs seemed not to follow linear relationships. For example, Fig. 4c and d showed the false signals of nitrous oxide caused by ethanol and acetic acid. A nonlinear relationship exists between nitrous oxide interference and VOC concentration. The curves could be well fitted to the nonlinear equation of , where k represents the maximum interference on nitrous oxide by the single VOC, and m represents the half-saturation constant indicating the higher level at which the VOC concentration could cause half of the maximum interference on nitrous oxide. As shown in Table 2, all tested VOCs showed positive nonlinear interference on the nitrous oxide signals, and 1-butanol showed the highest maximum interference on nitrous oxide. Interestingly, no interference was observed for nitrous oxide when methanol was presented in a nitrogen matrix, while a relatively lower level of interference by methanol was observed for nitrous oxide when presented in atmospheric air.
Furthermore, some of the tested VOCs also caused interference on carbon dioxide measured by the PAS. The background of carbon dioxide was considered to be unchanged during the interference tests. While methanol, ethanol, acetic acid and 1-propanol caused positive false signals for carbon dioxide measured by the PAS (ER = 0.45, 0.40, 0.39, 0.25, respectively), 2-butanone caused negative false signals, with ER = −0.61 (Table 2). Other tested VOCs, including acetone, acetaldehyde and 1-butanol, did not show interferences on carbon dioxide measured by the PAS. This is likely because no overlap of the gas infrared adsorption spectra exists between these VOCs and carbon dioxide. As expected, methanol in nitrogen also caused interference on carbon dioxide (ER = 0.35) that was slightly lower than methanol in air.
Besides this, SF6 measurements were interfered by the tested non-targeted VOC, with a lower empirical relationship obtained compared to NH3, CH4, N2O and CO2. Acetic acid and 2-butanone caused the highest interferences on SF6, with an ER of 0.31 and 0.23, respectively. Other tested VOCs caused significantly less interference on SF6, among which methanol gave the highest negative ER of −0.15. Again, the methanol in nitrogen gave a significantly lower level of interference on SF6 compared to methanol in air (ER = −0.056 vs. −0.15).
Overall, the tested non-target VOCs in this study caused significant interference on target gases, of which ammonia and methane were influenced to the largest degree. Even though less interference was observed for nitrous oxide, this could still cause problems due to the typically low concentration level of this compound in, for example, livestock facilities or soil (Iqbal et al., 2013; Rong et al., 2014).
3.4 Experiment 4: field test for validation of empirical relationships
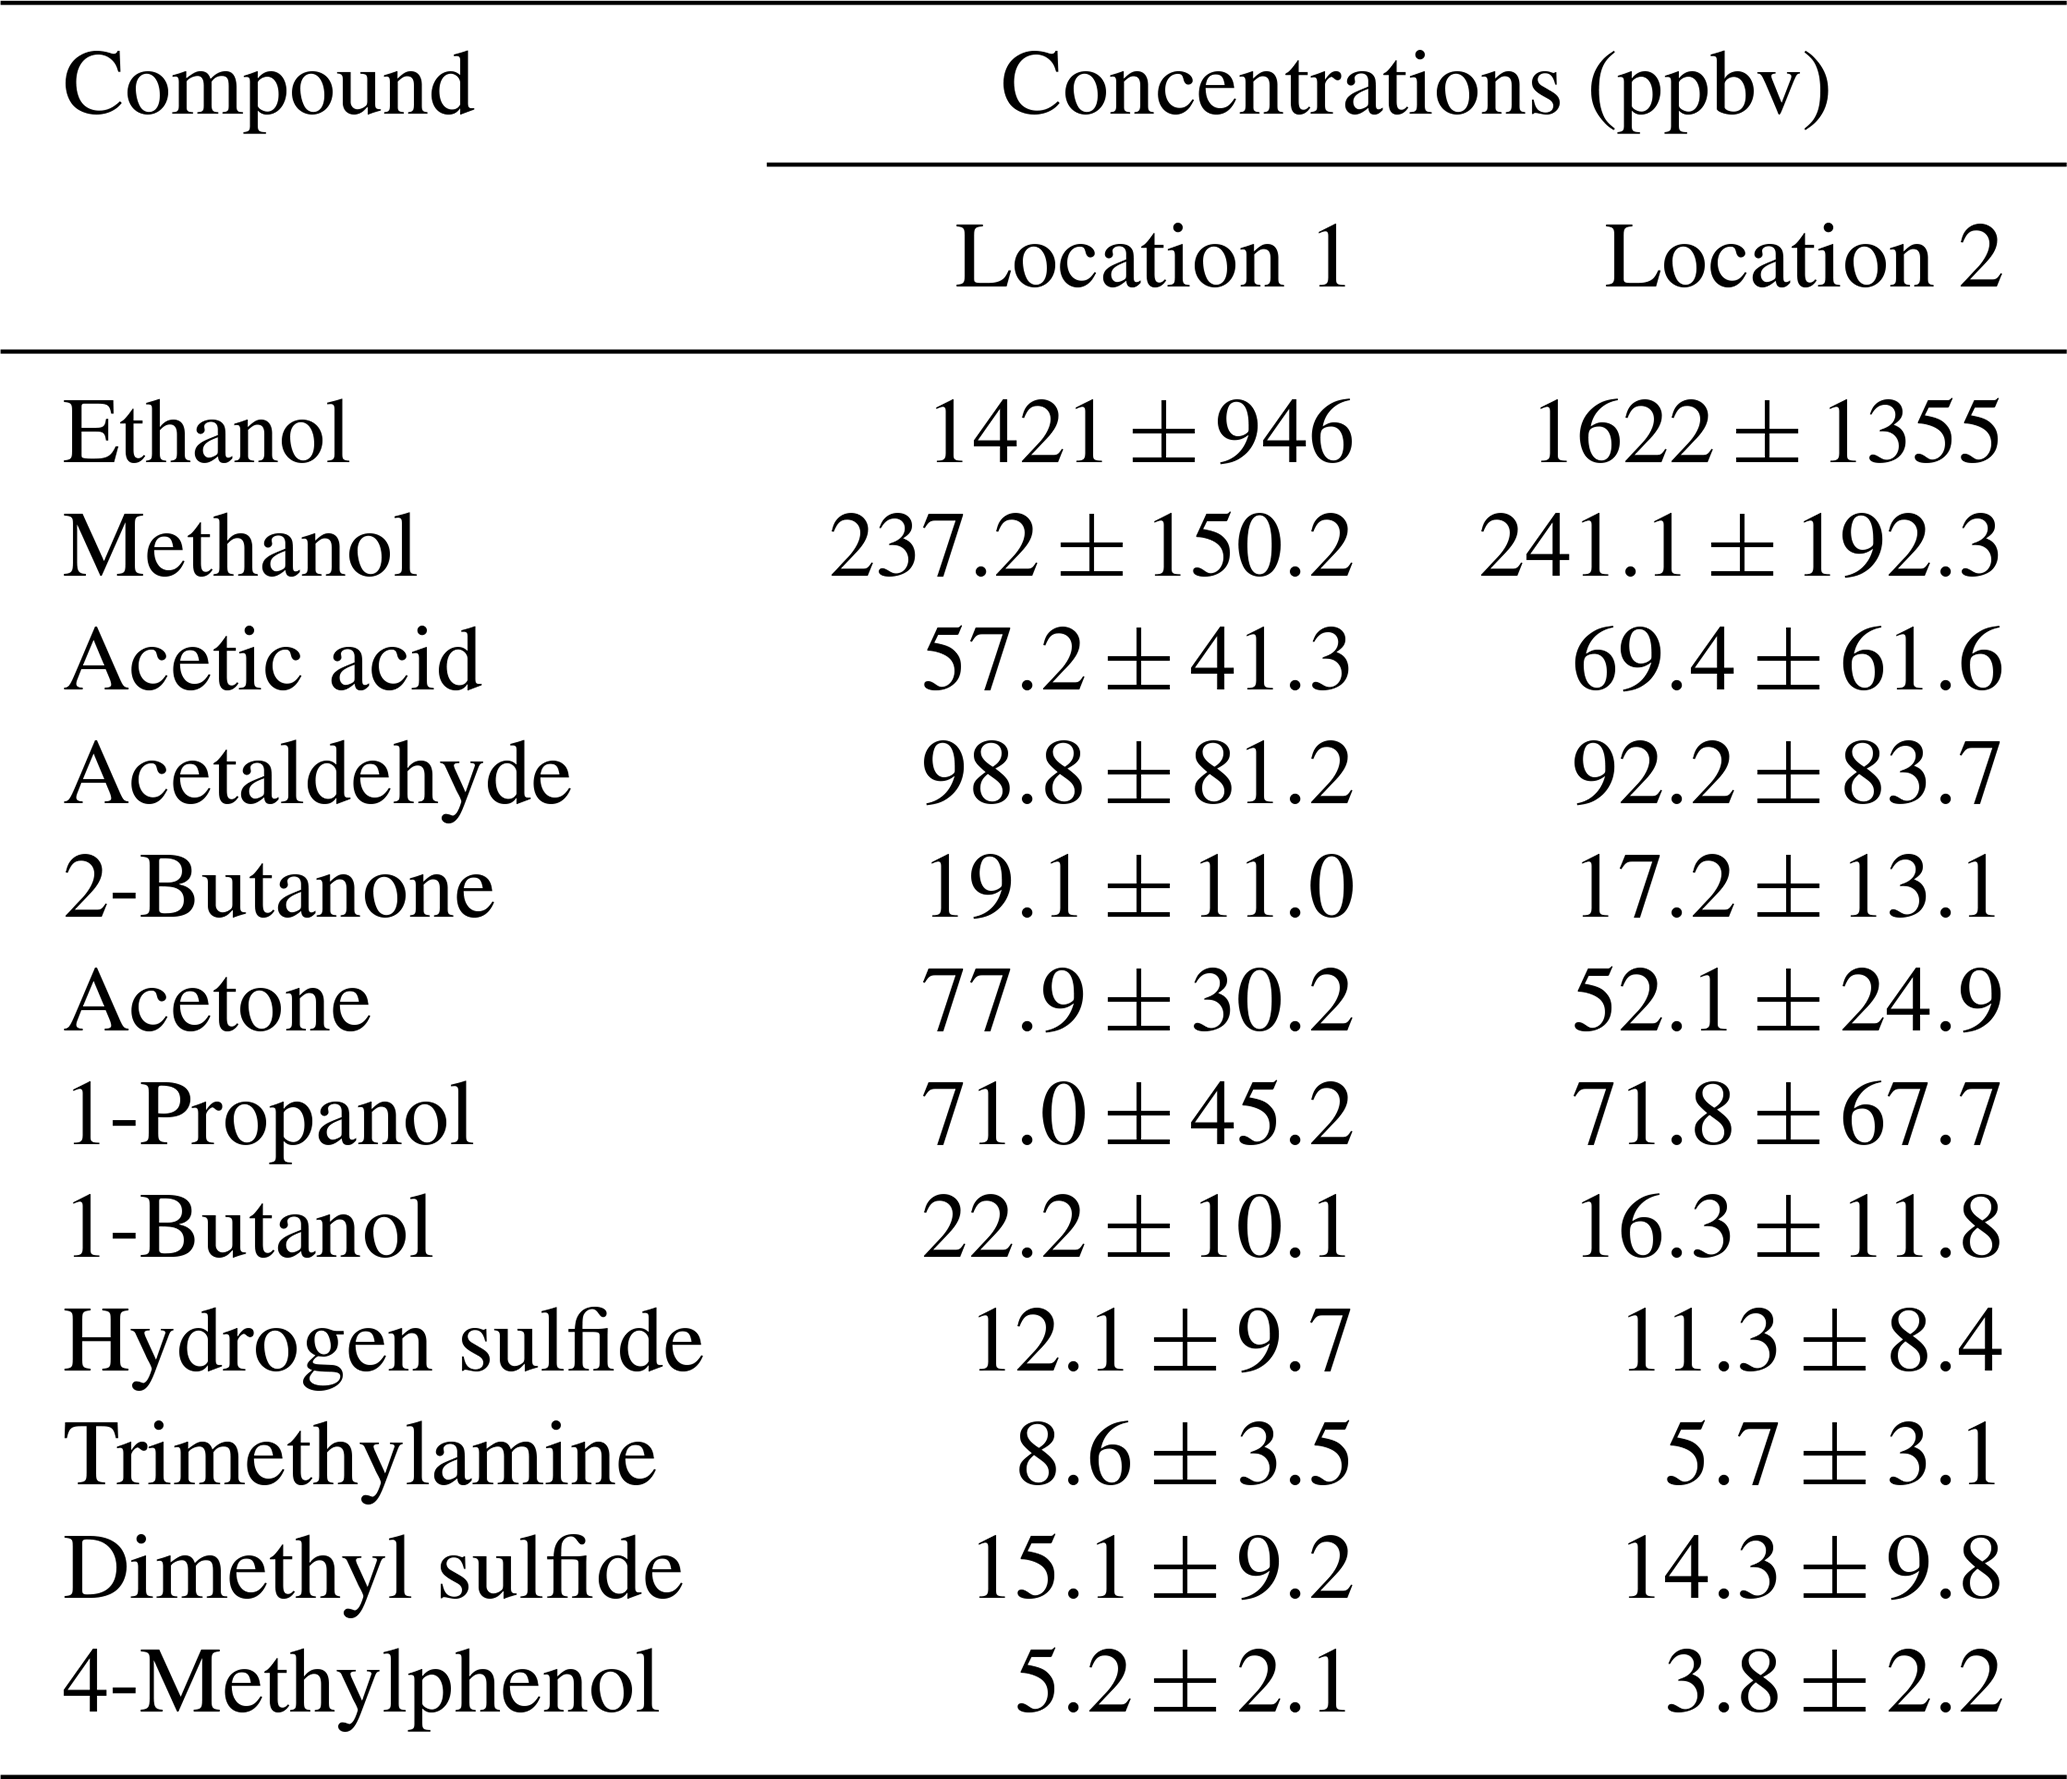
During the field test in the dairy barn, the ammonia measurements by PAS and PTR-MS were compared to each other for one location in the pit and two locations (Location 1 and Location 2) in the barn. Figure S2 shows ammonia concentration measured by PAS and PTR-MS at the pit ventilation. In the pit ventilation, low concentrations of VOCs were generally obtained, and relatively high concentrations of ammonia were observed for both instruments. Thus, no significant interferences were observed for ammonia measured by the PAS, and ammonia measurements by PAS and PTR-MS showed a good agreement, as shown in Fig. S2. However, for the two measurement points inside the barn, significantly higher ammonia concentrations were obtained from PAS compared to the concentrations measured by PTR-MS (Fig. 5a and c). Table S2 showed the percentage for each range of ratio of PAS/PTR-MS concentrations for the data shown in Fig. 5a and c, where the ratio of PAS/PTR-MS concentrations is mostly within 1–4. The higher ammonia concentration observed for the PAS measurement is ascribed to interferences from VOCs, some of which had high concentrations, especially for ethanol, as shown in Table 3. The relation between the ammonia concentrations measured by PAS and the ethanol concentrations measured by PTR-MS were highly correlated for both measurement locations, with slopes close to 3 (3.0 and 3.1; see Fig. S3). These two numbers are generally close to the empirical relationship obtained for ethanol (ER = 2.8). The empirical relationships obtained in Experiment 3 were used for data correction of ammonia measurement by PAS, since the instrument configurations were kept the same. Thus, the interference of the VOCs on ammonia measurement by PAS could be estimated from the empirical relationships obtained in Experiment 3 and used to correct the ammonia data. Figure 5b and d show the corrected ammonia concentrations measured by PAS by using the empirical relationships together with the measured ammonia concentration by the PTR-MS for both measurement locations. The corrected ammonia concentrations from the PAS are generally in good agreement with the ammonia concentration measured by the PTR-MS, with slopes close to 1 (0.99 and 1.02). It should be noted that although the empirical relationships were obtained for single VOC interferences on ammonia measurement by PAS, they were treated as being additive under field conditions where multiple VOCs are presented. Ethanol dominated the VOC composition in general, but other types of VOCs also contribute significantly. The average ratio of ethanol concentration to the sum of the eight VOCs (tested in the lab with obtained empirical relationships) was 0.64 (±0.11) for Location 2 in the field study. This single application suggests that the interference is close to additive, but further investigation is needed to confirm this finding. The cattle barn experiment validated that correction from major VOCs is necessary for reliable PAS measurements. In principle, it is possible to estimate the interference on NH3 measured by PAS measurements in field applications. However, it should be noted that a lot of redundant work is needed to make this correction if only NH3 concentration is measured, since the concentrations of several VOCs need to be known to achieve a proper correction.
Table 3Average concentrations (± SD) of selected VOCs during the field test in the dairy cattle barn for the two sampling locations, 1 and 2, which are both located inside the barn. The standard deviation applies to the mean values.
When measuring NH3 and greenhouse gas emissions (CH4, N2O and CO2) by PAS, non-target VOCs may interfere significantly with the target gases, causing inaccurate results. To confirm and determine the magnitude of interferences, experiments have been conducted by simultaneously using a PAS and a PTR-MS. Results from these experiments provide useful guidelines concerning interferences caused by non-targeted VOCs. The results demonstrate that ethanol, methanol, 1-butanol, 1-propanol and acetic acid cause the most significant interferences on NH3 measured by PAS. A field test in a cattle barn validated the interference caused by VOCs on NH3 measurement by PAS by simultaneously measuring VOCs with PTR-MS.
Data and code are available upon request to the corresponding author.
The supplement related to this article is available online at: https://doi.org/10.5194/amt-13-259-2020-supplement.
DL, LR and AF designed the setup for the experiments performed. LR, JK and AC contributed to setting up and conducting experiments and acquiring data. DL, AF, JK, XK and APA contributed to writing the paper and to data interpretation and data analysis. LR, AF and JK assisted in data analysis and editing the paper.
The authors declare that they have no conflict of interest.
This research has been supported by the National Natural Science Fund of China (grant no. 31672468).
This paper was edited by Andreas Hofzumahaus and reviewed by three anonymous referees.
Adamsen, A. P.: Measurement of climate gases from livestock barns with infrared photo-acoustic spectrometry (in Danish: Måling af klimagasser fra stalde med infrarød fotoakustisk spektrometri), Technical Report, SEGES, December, 2018.
Aneja, V. P., Schlesinger, W. H., and Erisman, J. W.: Effects of agriculture upon the air quality and climate: research, policy, and regulations, Environ. Sci. Technol., 43, 4234–4240, https://doi.org/10.1021/es8024403, 2009.
Angela, E., Di, F. C., Mario, L. P., and Gaetano, S.: Photoacoustic Spectroscopy with Quantum Cascade Lasers for Trace Gas Detection, Sensors-Basel, 6, 1411–1419, https://doi.org/10.3390/s6101411, 2006.
Berden, G., Peeters, R., and Meijer, G.: Cavity ring-down spectroscopy: Experimental schemes and applications, Int. Rev. Phys. Chem., 19, 565–607, https://doi.org/10.1080/014423500750040627, 2000.
Blake, R. S., Monks, P. S., and Ellis, A. M.: Proton-transfer reaction mass spectrometry, Chem. Rev., 109, 861–896, https://doi.org/10.1002/chin.200923275, 2009.
Blanes-Vidal, V., Topper, P. A., and Wheeler, E. F.: Validation of ammonia emissions from dairy cow manure estimated with a non-steady-state, recirculation flux chamber with whole-building emissions, T. ASABE, 50, 633–640, https://doi.org/10.13031/2013.22652, 2007.
Bouwman, A. F., Lee, D. S., Asman, W. A. H., Dentener, F. J., Van, D. H. K. W., and Olivier, J. G. J.: A global high-resolution emission inventory for ammonia, Global Biogeochem. Cy., 11, 561–587, https://doi.org/10.1029/97GB02266, 1997.
California Air Resources Board (CARB): Manufacturer Notification, Mail-Out #MSO 2000-08, CARB: Sacramento, CA, USA, available at: http://www.arb.ca.gov/msprog/mailouts/mso0008/mso0008.pdf (last access: 15 October 2018), 2000.
Chadwick, D., Sommer, S., Thorman, R., Fangueiro, D., Cardenas, L., Amon, B., and Misselbrook, T.: Manure management: Implications for greenhouse gas emissions, Anim. Feed Sci. Tech., 166–167, 514–531, https://doi.org/10.1016/j.anifeedsci.2011.04.036, 2011.
Christensen, J.: The Brüel&Kjær Photoacoustic Transducer System and its Physical Properties, Brüel & Kjær Technical Review, 1, 1990a.
Christensen, J.: Optical filters and their use with the type 1302 type 1306 phtoacoustic gas monitors, Brüel & Kjær Technical Review, 2, 1990b.
Chung, M. Y., Beene, M., Ashkan, S., Krauter, C., and Hasson, A. S.: Evaluation of non-enteric sources of non-methane volatile organic compound (NMVOC) emissions from dairies, Atmos. Environ., 44, 786–794, https://doi.org/10.1016/j.atmosenv.2009.11.033, 2009.
Cortus E. L., Jacobson L. D., Hetchler B. P., and Heber A. J.: Emission monitoring methodology at a NAEMS dairy site, with an assessment of the uncertainty of measured ventilation rates, ASABE – 9th International Livestock Environment Symposium, 583–590, https://doi.org/10.13031/2013.41578, 2012.
De Gouw, J. and Warneke, C.: Measurements of volatile organic compounds in the earth's atmosphere using proton-transfer-reaction mass spectrometry, Mass Spectrom. Rev., 26, 223–257, https://doi.org/10.1002/mas.20119, 2007.
De Vries, J. W. and Melse, R. W.: Comparing environmental impact of air scrubbers for ammonia abatement at pig houses: A life cycle assessment, Biosyst. Eng., 161, 53–61, https://doi.org/10.1016/j.biosystemseng.2017.06.010, 2017.
EMEP, Agency: EMEP/EEA air pollutant emission inventory guidebook – 2013, Luxembourg: Publications Office of the European Union, 3B: Manure management, https://www.eea.europa.eu/publications/emep-eea-guidebook-2013/part-b-sectoral-guidance-chapters/4-agriculture/3-b-manure-management/view (last access: : 4 May 2018), 2013.
Emmenegger, L., Mohn J., Sigrist M., Marinov D., Steinemann U., Zumsteg F., and Meier M.: Measurement of ammonia emissions using various techniques in a comparative tunnel study, Int. J. Environ. Pollut., 22, 326–341, https://doi.org/10.1504/IJEP.2004.005547, 2004.
Erisman, J. W., Bleeker, A., Galloway, J., and Sutton, M. S.: Reduced nitrogen in ecology and the environment, Environ. Pollut., 150, 140–149, https://doi.org/10.1016/j.envpol.2007.06.033, 2007.
Feilberg, A., Liu, D., Adamsen, A. P. S., Hansen, M. J., and Jonassen, K. E. N.: Odorant emissions from intensive pig production measured by online proton-transfer-reaction mass spectrometry, Environ. Sci. Technol., 44, 5894–5900, https://doi.org/10.1021/es100483s, 2010.
Flèchard, C. R., Neftel, A., Jocher, M., Ammann, C., and Fuhrer, J.: Bi-directional soil/atmosphere N2O exchange over two mown grassland systems with contrasting management practices, Global Change Biol., 11, 2114–2127, https://doi.org/10.1111/j.1365-2486.2005.01056.x, 2005.
Hafner, S. D., Howard, C., Muck, R. E., Franco, R. B., Montes, F., Green, P. G., Mitloehner, F., Trabue, S. L., and Rotz, C. A.: Emission of volatile organic compounds from silage: Compounds, sources, and implications, Atmos. Environ., 77, 827–839, https://doi.org/10.1016/j.atmosenv.2013.04.076, 2013.
Harren, F. J. M., Cotti, G., Oomens, J., and Hekkert, S. L.: Photoacoustic Spectroscopy in Trace Gas Monitoring, in: Encyclopedia of Analytical Chemistry, edited by: Meyers, R. A., 2203–2226, JohnWiley & Sons Ltd, Chichester, 2000.
Hassouna, M., Espagnol, S., Robin, P., Paillat, J. M., Levasseur, P., and Li, Y.: Monitoring NH3, N2O, CO2 and CH4 emissions during pig solid manure storage and effect of turning, Compost Sci. Util., 16, 267–274, https://doi.org/10.1080/1065657X.2008.10702388, 2008.
Hassouna, M., Robin, P., Charpiot, A., Edouard, N., and Méda, B.: Infrared photoacoustic spectroscopy in animal houses: Effect of non-compensated interferences on ammonia, nitrous oxide and methane air concentrations, Biosyst. Eng., 114, 318–326, https://doi.org/10.1016/j.biosystemseng.2012.12.011, 2013.
Heber, A. J., Ni, J.-Q., Lim, T. T., Tao, P.-C., Schmidt, A. M., Koziel, J. A., Beasley, D. B., Hoff, S. J., Nicolai, R. E., Jacobson, L. D., and Zhang, Y.: Quality assured measurements of animal building emissions: Gas concentrations, J. Air Waste Manage., 56, 1472–1483, https://doi.org/10.1080/10473289.2006.10465680, 2006.
Howard, C. J., Kumar, A., Malkina, I., Mitloehner, F., Green, P. G., Flocchini, R. G., and Kleeman, M. J.: Reactive organic gas emissions from livestock feed contribute significantly to ozone production in central California, Environ. Sci. Technol., 44, 2309–2314, https://doi.org/10.1021/es902864u, 2010.
Hutchings, N. J., Sommer, S. G., Andersen, J. M., and Asman, W. A. H.: A detailed ammonia emission inventory for Denmark, Atmos. Environ., 35, 1959–1968, https://doi.org/10.1016/S1352-2310(00)00542-2, 2001.
Inomata S. and Tanimoto H.: A deuterium-labeling study on the reproduction of hydronium ions in the PTR-MS detection of ethanol, Int. J. Mass Spectrom., 285, 95–99, https://doi.org/10.1016/j.ijms.2009.05.001, 2009.
Insam, H. and Seewald, M. S. A.: Volatile organic compounds (VOCs) in soils, Biol. Fert. Soils, 46, 199–213, https://doi.org/10.1007/s00374-010-0442-3, 2010.
Iqbal, J., Castellano, M. J., and Parkin, T. B.: Evaluation of photoacoustic infrared spectroscopy for simultaneous measurement of N2O and CO2 gas concentrations and fluxes at the soil surface, Global Change Biol., 19, 327–336, https://doi.org/10.1111/gcb.12021, 2013.
Joo, H. S., Ndegwa, P. M., Neerackal, G. M., Wang, X., and Harrison, J. H.: Effects of manure managements on ammonia, hydrogen sulfide and greenhouse gases emissions from the naturally ventilated dairy barn, ASABE, 2, 1302–1311, https://doi.org/10.13031/aim.20131593447, 2013.
Kamp, J. N., Chowdhury, A., Adamsen, A. P. S., and Feilberg, A.: Negligible influence of livestock contaminants and sampling system on ammonia measurements with cavity ring-down spectroscopy, Atmos. Meas. Tech., 12, 2837–2850, https://doi.org/10.5194/amt-12-2837-2019, 2019.
Lambert J. D.: Vibrational and Rotational Relaxation in Gases, Clarendon Press, Oxford, 1977.
Lin, X., Zhang, R., Jiang, S., El-Mashad, H., and Xin, H.: Emissions of ammonia, carbon dioxide and particulate matter from cage-free layer houses in California, Atmos. Environ., 152, 246–255, https://doi.org/10.1016/j.atmosenv.2016.12.018, 2017.
Liu, D., Lokke, M. M., Leegaard Riis, A., Mortensen, K., and Feilberg, A.: Evaluation of clay aggregate biotrickling filters for treatment of gaseous emissions from intensive pig production, J. Environ. Manage., 136, 1–8, https://doi.org/10.1016/j.jenvman.2014.01.023, 2014.
Liu, D., Nyord, T., Rong, L., and Feilberg, A.: Real-time quantification of emissions of volatile organic compounds from land spreading of pig slurry measured by PTR-MS and wind tunnels, Sci. Total. Environ., 639, 1079–1087, https://doi.org/10.1016/j.scitotenv.2018.05.149, 2018.
Lumasense: Photoacoustic Gas Monitor – INNOVA 1412i, available at: http://www.lumasenseinc.com/FR/produits/gas-sensing/gas-monitoring-instruments/photoacoustic-spectroscopy-pas/photoacoustic-gas-monitor-innova-1412i/ (last access: 18 November 2018), 2012.
Malkina, I. L., Kumar, A., Green, P. G., and Mitloehner, F. M.: Identification and quantitation of volatile organic compounds emitted from dairy silages and other feedstuffs, J. Environ. Qual., 40, 28–36, https://doi.org/10.2134/jeq2010.0302, 2011.
Mathot, M., Decruyenaere, V., Lambert, R., and Stilmant, D.: Emissions de CH4, N2O et NH3 en é tables et lors du stockage des engrais de ferme de génisses Blanc Bleu Belge, Paper presented at the 14e`me Journées 3R, Paris, 2007.
Melse, R. W. and van der Werf, A. W.: Biofiltration for mitigation of methane emission from animal husbandry, Environ. Sci. Technol., 39, 5460, https://doi.org/10.1021/es048048q, 2005.
Moset, V., Cambra-López, M., Estellés, F., Torres, A. G., and Cerisuelo, A.: Evolution of chemical composition and gas emissions from aged pig slurry during outdoor storage with and without prior solid separation, Biosyst. Eng., 111, 2–10, https://doi.org/10.1016/j.biosystemseng.2011.10.001, 2012.
Ngwabie, N. M., Schade, G. W., Custer, T. G., Linke, S., and Hinz, T.: Abundances and flux estimates of volatile organic compounds from a dairy cowshed in Germany, J. Environ. Qual., 37, 565–573, https://doi.org/10.2134/jeq2006.0417, 2008.
Ngwabie, N. M., Jeppsson, K. H., Gustafsson, G., and Nimmermark, S.: Effects of animal activity and air temperature on methane and ammonia emissions from a naturally ventilated building for dairy cows, Atmos. Environ., 45, 6760–6768, https://doi.org/10.1016/j.atmosenv.2011.08.027, 2011.
Ni, J. Q. and Heber, A. J.: Sampling and Measurement of Ammonia at Animal Facilities, Adv. Agron., 98, 201–269, https://doi.org/10.1016/s0065-2113(08)00204-6, 2008.
Ni, J. Q., Diehl, C. A., Chai, L., Chen, Y., Heber, A. J., Lim, T. T., and Bogan, B. W.: Factors and characteristics of ammonia, hydrogen sulfide, carbon dioxide, and particulate matter emissions from two manure-belt layer hen houses, Atmos. Environ., 156, 113–124, https://doi.org/10.1016/j.atmosenv.2017.02.033, 2017.
Norman, M., Hansel, A., and Wisthaler, A.: as reagent ion in the PTR-MS instrument: Detection of gas-phase ammonia, Int. J. Mass Spectrom., 265, 382–387, https://doi.org/10.1016/j.ijms.2007.06.010, 2007.
Osada, T. and Fukumoto, Y.: Development of a new dynamic chamber system for measuring harmful gas emissions from composting livestock waste, Water Sci. Technol., 44, 79–86, https://doi.org/10.2166/wst.2001.0513, 2001.
Osada, T., Rom, H. B., and Dahl, P.: Continuous measurement of nitrous oxide and methane emission in pig units by infrared photoacoustic detection, T. ASAE, 41, 1109–1114, https://doi.org/10.13031/2013.17256, 1998.
Paulot, F., Jacob, D. J., Pinder, R. W., Bash, J. O., Travis, K., and Henze, D. K.: Ammonia emissions in the United States, European Union, and China derived by high resolution inversion of ammonium wet deposition data: Interpretation with a new agricultural emissions inventory (MASAGE_NH3), J. Geophys. Res., 119, 4343–4364, https://doi.org/10.1002/2013JD021130, 2015.
Pearson, J. and Stewart, G. R.: The deposition of atmospheric ammonia and its effects on plants, New Phytol., 125, 283–305, https://doi.org/10.1111/j.1469-8137.1993.tb03882.x, 1993.
Phillips, V. R., Lee, D. S., Scholtens, R., Garland, J. A., and Sneath, R. W.: SE – Structures and Environment: A Review of Methods for measuring Emission Rates of Ammonia from Livestock Buildings and Slurry or Manure Stores, Part 2: monitoring Flux Rates, Concentrations and Airflow Rates, J. Agr. Eng. Res., 78, 1–14, https://doi.org/10.1006/jaer.2000.0618, 2001.
Picarro: Technology: Cavity Ring-Down Spectroscopy (CRDS), available at: https://www.picarro.com/technology/cavity_ring_down_spectroscopy, last access: 12 May, 2018.
Pinder, R. W., Adams, P. J., and Pandis, S. N.: Ammonia emission controls as a cost-effective strategy for reducing atmospheric particulate matter in the Eastern United States, Environ. Sci. Technol., 41, 380–386, https://doi.org/10.1021/es060379a, 2007.
Rabaud, N. E., Ebeler, S. E., Ashbaugh, L. L., and Flocchini, R. G.: Characterization and quantification of odorous and non-odorous volatile organic compounds near a commercial dairy in California, Atmos. Environ., 37, 933–940, https://doi.org/10.1016/S1352-2310(02)00970-6, 2003.
Rong, L., Nielsen, P. V., and Zhang, G. Q.: Effects of airflow and liquid temperature on ammonia mass transfer above an emission surface: experimental study on emission rate, Bioresource Technol., 100, 4654–4661, https://doi.org/10.1016/j.biortech.2009.05.003, 2009.
Rong, L., Liu, D., Pedersen, E. F., and Zhang, G.: Effect of climate parameters on air exchange rate and ammonia and methane emissions from a hybrid ventilated dairy cow building, Energ. Buildings, 82, 632–643, https://doi.org/10.1016/j.enbuild.2014.07.089, 2014.
Rong, L., Liu, D., Pedersen, E. F., and Zhang, G.: The effect of wind speed and direction and surrounding maizeon hybrid ventilation in a dairy cow building in Denmark, Energy and Buildings, 86, 25–34, https://doi.org/10.1016/j.enbuild.2014.10.016, 2015.
Schilt, S., Thévenaz, L., Niklès, M., Emmenegger, L., and Hüglin, C.: Ammonia monitoring at trace level using photoacoustic spectroscopy in industrial and environmental applications, Spectrochim. Acta. A, 60, 3259–3268, https://doi.org/10.1016/j.saa.2003.11.032, 2004.
Scholtens, R., Jones, C. J. D. M., Lee, D. S., and Phillips, V. R.: Measuring ammonia emission rates from livestock buildings and manure stores – part 1: development and validation of external tracer ratio, internal tracer ratio and passive flux sampling methods, Atmos. Environ., 38, 3003–3015, https://doi.org/10.1016/j.atmosenv.2004.02.030, 2004.
Seinfeld, J. H. and Pandis, S. N.: Atmospheric Chemistry and Physics: From Air Pollution to Climate Change, Wiley-VCH, New York, 1326 pp., 1997.
Shaw, S. L., Mitloehner, F. M., Jackson, W., Depeters, E. J., Fadel, J. G., Robinson, P. H., Holzinger, R., and Goldstein, A. H.: Volatile organic compound emissions from dairy cows and their waste as measured by proton-transfer-reaction mass spectrometry, Environ. Sci. Technol., 41, 1310–1316, https://doi.org/10.1021/es061475e, 2007.
Smith, P., Martino, D., Cai, Z., Gwary, D., Janzen, H., Kumar, P., Mccarl, B., Ogle, S., O'Mara, F., and Rice, C.: Greenhouse gas mitigation in agriculture, Philos. T. R. Soc. B, 363, 789–813, https://doi.org/10.1098/rstb.2007.2184, 2008.
Thomas, C. D., Cameron, A., Green, R. E., Bakkenes, M., Beaumont, L. J., Collingham, Y. C., Erasmus, B. F., De Siqueira, M. F., Grainger, A., and Hannah, L.: Extinction risk from climate change, Nature, 427, 145–148, https://doi.org/10.1038/nature02121, 2004.
Van Breemen, N., Mulder, J., and Driscoll, C. T.: Acidification and alkalinization of soils, Plant Soil, 75, 283–308, https://doi.org/10.1007/BF02369968, 1983.
von Bobrutzki, K., Braban, C. F., Famulari, D., Jones, S. K., Blackall, T., Smith, T. E. L., Blom, M., Coe, H., Gallagher, M., Ghalaieny, M., McGillen, M. R., Percival, C. J., Whitehead, J. D., Ellis, R., Murphy, J., Mohacsi, A., Pogany, A., Junninen, H., Rantanen, S., Sutton, M. A., and Nemitz, E.: Field inter-comparison of eleven atmospheric ammonia measurement techniques, Atmos. Meas. Tech., 3, 91–112, https://doi.org/10.5194/amt-3-91-2010, 2010.
Wang-Li, L., Li, Q.-F., Chai, L., Cortus, E. L., Wang, K., Kilic, I., Bogan, B. W., Ni, J.-Q., and Heber, A. J.: The national air emissions monitoring study's Southeast Layer Site: Part III, Ammonia concentrations and emissions, T. ASABE, 56, 1185–1197, https://doi.org/10.13031/trans.56.9673, 2013.
Yuan, B., Koss, A. R., Warneke, C., Coggon, M., Sekimoto, K., and de Gouw, J. A.: Proton-Transfer-Reaction Mass Spectrometry: Applications in Atmospheric Sciences, Chem. Rev., 117, 13187–13229, https://doi.org/10.1021/acs.chemrev.7b00325, 2017.
Zhao, L., Hadlocon, L. J. S., Manuzon, R. B., Darr, M. J., Keener, H. M., Heber, A. J., and Ni, J.: Ammonia concentrations and emission rates at a commercial poultry manure composting facility, Biosyst. Eng., 150, 69–78, https://doi.org/10.1016/j.biosystemseng.2016.07.006, 2016.
Zhao, Y., Pan, Y., Rutherford, J., and Mitloehner, F. M.: Estimation of the Interference in Multi-Gas Measurements Using Infrared Photoacoustic Analyzers, Atmos., 3, 246–265, https://doi.org/10.3390/atmos3020246, 2012.