the Creative Commons Attribution 4.0 License.
the Creative Commons Attribution 4.0 License.
 | 20 May 2020
Aerosol retrievals from the EKO MS-711 spectral direct irradiance measurements and corrections of the circumsolar radiation
Rosa Delia García-Cabrera
Emilio Cuevas-Agulló
África Barreto
Victoria Eugenia Cachorro
Mario Pó
Ramón Ramos
Kees Hoogendijk
Spectral direct UV–visible normal solar irradiance (DNI) has been measured with an EKO MS-711 grating spectroradiometer, which has a spectral range of 300–1100 nm, and 0.4 nm step, at the Izaña Atmospheric Observatory (IZO, Spain). It has been used to determine aerosol optical depth (AOD) at several wavelengths (340, 380, 440, 500, 675, and 870 nm) between April and September 2019, which has been compared with synchronous AOD measurements from a reference Cimel and Aerosol RObotic NETwork (AERONET) sun photometer. The EKO MS-711 has been calibrated at the Izaña Atmospheric Observatory by using the Langley plot method during the study period. Although this instrument has been designed for spectral solar DNI measurements, and therefore has a field of view (FOV) of 5∘ that is twice the recommended amount in solar photometry for AOD determination, the AOD differences compared to the AERONET–Cimel reference instrument (FOV ) are fairly small. A comparison of the results from the Cimel AOD and EKO MS-711 AOD presents a root mean square (rms) of 0.013 (24.6 %) at 340 and 380 nm, and 0.029 (19.5 %) for longer wavelengths (440, 500, 675, and 870 nm). However, under relatively high AOD, near-forward aerosol scattering might be significant because of the relatively large circumsolar radiation (CSR) due to the large EKO MS-711 FOV, which results in a small but significant AOD underestimation in the UV range. The AOD differences decrease considerably when CSR corrections, estimated from libRadtran radiative transfer model simulations, are performed and obtain an rms of 0.006 (14.9 %) at 340 and 380 nm, and 0.005 (11.1 %) for longer wavelengths. The percentage of 2 min synchronous EKO AOD–Cimel AOD differences within the World Meteorological Organization (WMO) traceability limits were ≥96 % at 500, 675, and 870 nm with no CSR corrections. After applying the CSR corrections, the percentage of AOD differences within the WMO traceability limits increased to >95 % for 380, 440, 500, 675, and 870 nm, while for 340 nm the percentage of AOD differences showed a poorer increase from 67 % to a modest 86 %.
- Article
(2374 KB) - Full-text XML
- BibTeX
- EndNote


One of the most important elements that governs the Earth’s climate and its processes is the presence of atmospheric aerosols, which produce a significant radiative forcing that results from light scattering and absorption, as well as radiation emissions. Moreover, they act as cloud condensation nuclei by modifying cloud properties (IPCC, 2013). The aerosols' effect on the Earth's radiation balance has been quantified as a cooling of −0.45 and −0.9 W m−2 when considering the combined effect of both aerosols and clouds. However, the uncertainty of these values is still very high (WMO, 2016); therefore, it is necessary to make more efforts to evaluate the aerosol atmospheric content and optical properties, such as the aerosol optical depth (AOD), Ångström exponent (AE), single scattering albedo (SSA), scattering coefficient, and absorption coefficient.
The amount of aerosols present in the atmosphere can be addressed by using the aerosol optical depth (AOD), which gives the optical attenuation of aerosols in the atmospheric path. The AOD is derived from surface or satellite observations from sunlight attenuation measurements (WMO, 2016) and is combined with the Beer–Lambert–Bouguer law. This law has been applied to retrieve the extinction of solar radiation (Ångström, 1930, 1961; Shaw, 1983). The AOD is derived through direct sun radiation measurements at different wavelengths with several instruments, such as filter radiometers or spectroradiometers, by selecting spectral ranges where the influence of trace gases is minor or even negligible (WMO, 2016; Kazadzis et al., 2018a). The World Meteorological Organization (WMO) recommended the following wavelengths for AOD retrieval: 368, 412, 500, 675, 778, and 862 nm, with a bandwidth of 5 nm (WMO, 1986), and the use of instruments with a full opening angle of 2.5∘ and a slope angle of 1∘ (WMO, 2008).
The AOD retrieval with sun photometers has been addressed in an extensive list of publications (e.g. Schmid et al., 1999; Kazadzis et al., 2014, 2018a; Barreto et al., 2014; Cuevas et al., 2019), mainly due to the establishment of aerosol measurement networks, such as AErosol RObotic NETwork (AERONET; Holben et al., 1998), the Global Atmosphere Watch (GAW), the Precision Filter Radiometer network (PFR, collectively GAW–PFR; Wehrli, 2000, 2005), the SKYNET sky radiometer network (Takamura and Nakajima, 2004), and Surface Radiation Budget Network (SURFRAD; Augustine et al., 2008). Recently, Cuevas et al. (2019) conducted a study comparing AOD from AERONET–Cimel (1.2∘ field of view (FOV)) with that of GAW–PFR (2.5∘ FOV) by showing a difference of ∼3 % at 380 nm and ∼2 % at 500 nm; thus, GAW–PFR showed lower values when compared to AERONET–Cimel for AOD >0.1. They demonstrated that this difference was due to the higher amount of dust near-forward scattering measured by GAW–PFR because of its larger FOV. On the other hand, the AOD retrievals from ground-based spectroradiometers are scarce and normally limited to the visible (VIS) range (e.g. Cachorro et al., 2000; Estellés et al., 2006). The reasons for this shortfall may be found in the high cost of the investment, the maintenance of spectroradiometers, and their substantial requirements for calibration compared to sun photometers. However, spectroradiometers offer the possibility of providing other atmospheric components (e.g. O3, NO2, SO2, CH4, and H2O; Michalsky et al., 1995; Cachorro et al., 1996; Schmid et al., 2001; Barreto et al., 2014; Raptis et al., 2018).
The first attempts to retrieve AOD from spectroradiometers were done by Cachorro et al. (1987) and Ahern et al. (1991), with results based on little available data. More recently, several works tackled the AOD multispectral retrieval from spectroradiometers with larger data sets. Thus, Cachorro et al. (2000) and Vergaz et al. (2005) reported a quantitative characterization of aerosols in southern Spain. However, they did not provide a comparison with another AOD retrieval method. Kazadzis et al. (2005) and Gröbner et al. (2001) found AOD differences lower than 0.1 at 355 nm and differences between −0.07 and 0.02 at 315.5, 316.75, and 320 nm when comparing AOD retrievals performed with the Brewer MkIII spectrophotometer and Bentham DTM 300 and LI-COR spectroradiometers respectively. Estellés et al. (2006) retrieved AOD with LI-COR spectroradiometers and found differences with the Cimel CE318-T sun photometer's AOD in the 0.01–0.03 (0.02–0.05) range in the VIS range (UV range). Cachorro et al. (2009) compared the AOD retrievals from LI-COR and a sun photometer and found AOD differences within 0.02 in the range of 440–1200 nm. Kazadzis et al. (2018a) presented the results from the fourth WMO filter radiometer comparison for AOD measurements and found an excellent agreement at 500 and 865 nm between the Precision Solar Spectroradiometer (PSR; Raptis et al., 2018), Precision Filter Radiometer (PFR; Wehrli, 2008), and overestimation from 0.01 to 0.03 respectively. López-Solano et al. (2018) compared AOD retrievals from Brewer spectrophotometers, AERONET–Cimel, and UV–PFR in the range of 300–320 nm at the Izaña Atmospheric Observatory, with uncertainties lower than 0.05.
In this paper, we contribute to the knowledge of spectral AOD with a comparison between AOD from an AERONET–Cimel sun photometer (hereafter Cimel AOD) and AOD computed from the direct normal irradiance (DNI) measurements performed with an EKO MS-711 spectroradiometer (hereafter EKO AOD). We have also addressed the small, but significant, EKO AOD underestimation under relatively high AOD due to dust near-forward scattering, but in this case we have compared two instruments whose FOV values show a big difference since the EKO FOV is 5∘. We have divided this work into five sections as follows: Sect. 2 describes the main characteristics of the Izaña station and the technical description of the instruments used in this research. In Sect. 3 the methodology used to determine AOD and the corrections due to the differences in dust near-forward scattering, by using the libRadtran radiative transfer model (RTM) and spectral Langley plot calibration, are described. In Sect. 4 the main results of the comparison are shown. Finally, a summary and the main conclusions are given in Sect. 5.
2.1 Site description
The data used in this paper were acquired between April and September 2019 at the Izaña Atmospheric Observatory (IZO). This observatory is located on the island of Tenerife (Spain; 28.3∘ N, 16.5∘ W; 2.4 km a.s.l.), and it is approximately 350 km away from the African continent. This observatory is managed by the Izaña Atmospheric Research Center (IARC) from the State Meteorological Agency of Spain (AEMET; more information at http://izana.aemet.es; last access: 7 November 2019).
In 1984, IZO enrolled in the WMO Background Atmospheric Pollution Monitoring Network (BAPMoN) and the WMO Global Atmosphere Watch (GAW) programme in 1989. IZO collaborates with different international networks, such as the Network for the Detection of Atmospheric Composition Change (NDACC) since 1999 and the GAW–PFR since 2001. In 2003, the Regional Brewer Calibration Center for Europe (WMO–GAW RBCC–E) was established. Furthermore, IZO has been part of AERONET since 2004, as one of the two AERONET–Langley plot calibration sites (Toledano et al., 2018). Since 2009, IZO has run a Baseline Surface Radiation Network (BSRN) station. In 2014, IZO was appointed by WMO as a Commission for Instruments and Methods of Observation (CIMO) test bed for aerosols and water vapour remote-sensing instruments (WMO, 2014). More details of IZO programmes can be found in Cuevas et al. (2017).
2.2 Instrument: EKO MS-711 spectroradiometer
An EKO MS-711 grating spectroradiometer used in direct sun-measurement mode has been tested (Fig. 1) in the CIMO test bed programme from April to September 2019 (14 706 data points).
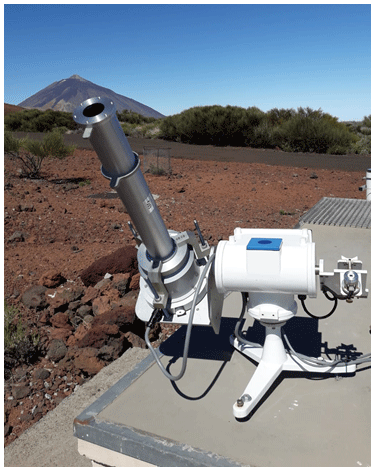
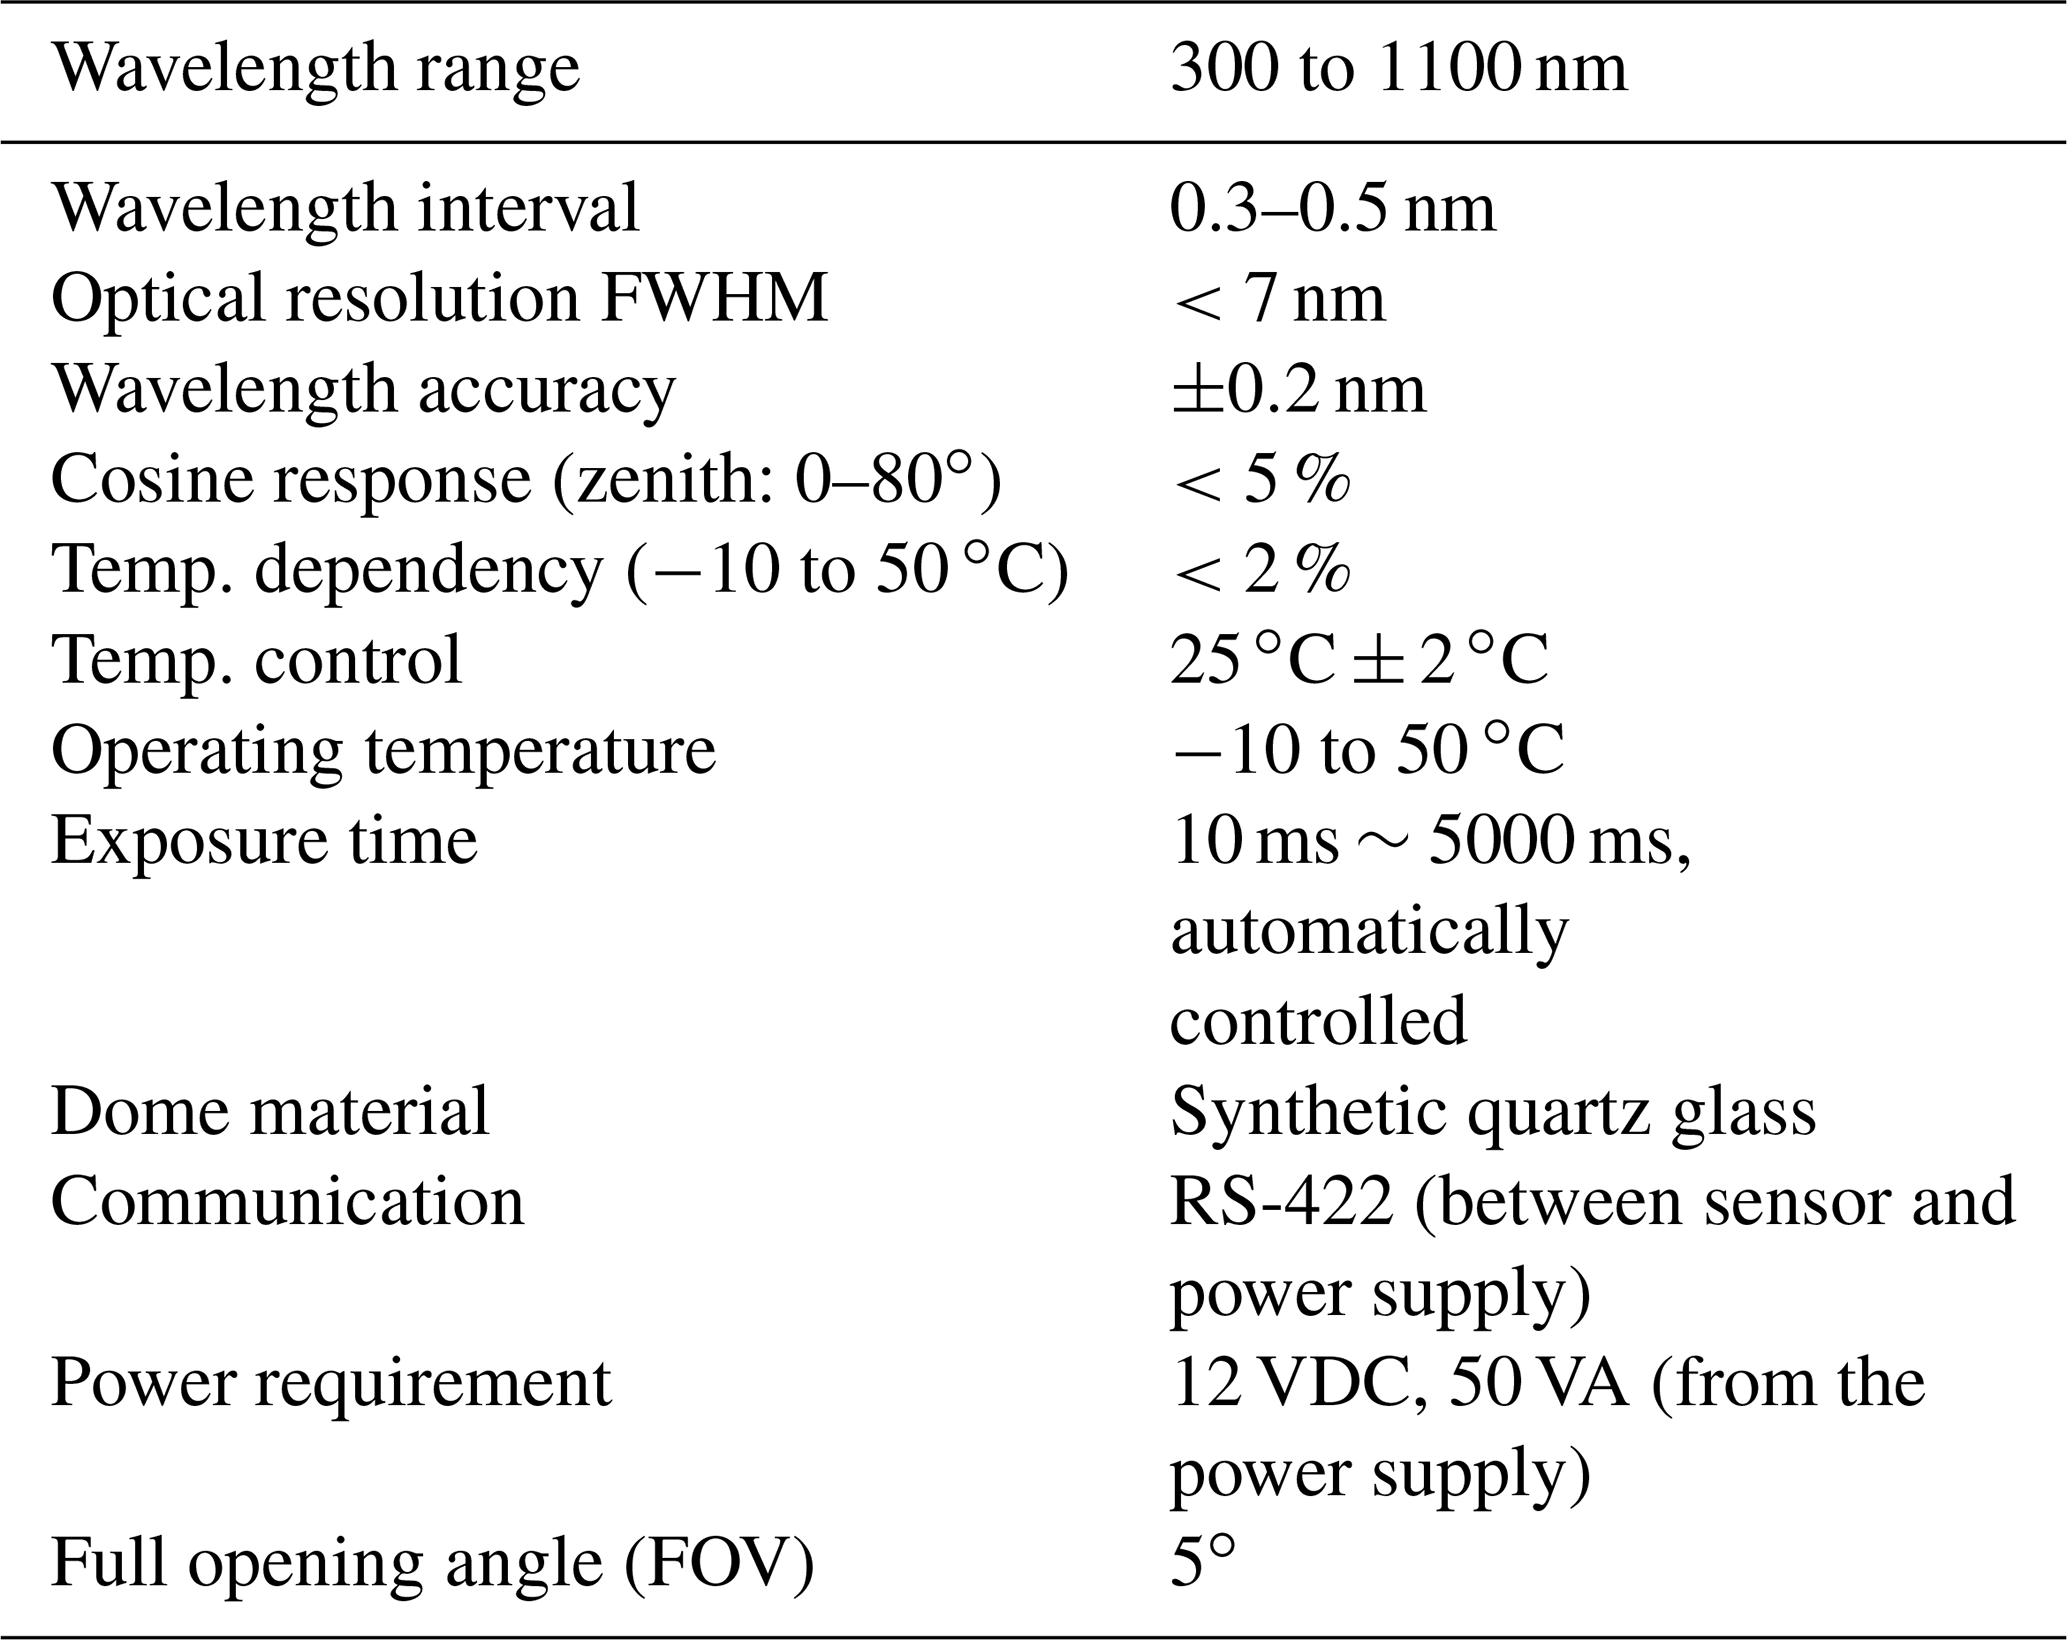
The EKO MS-711 was designed to measure global solar spectral radiation within the 300 and 1100 nm wavelength range with an average step of ∼0.4 nm, which exhibits a full width at half maximum (FWHM) <7 nm. It is equipped with built-in entrance optics, and the housing is temperature-stabilized at (Egli et al., 2016). EKO Instruments designed a collimator tube that also allows for the measurement of DNI (see Fig. 1).
This spectroradiometer has been mounted on an EKO sun tracker STR-21G-S2 (accuracy of ). This set-up performs one spectrum per minute, with an exposure time that changes automatically according to the intensity of the irradiance that varies from 10 ms to 5 s. The main specifications of the EKO MS-711 spectroradiometer are shown in Table 1.
Table 1Main specifications of the EKO MS-711 spectroradiometer.
2.3 Ancillary information: AERONET–Cimel sun photometer
In this paper, we have used AOD data provided by the permanent AERONET–Cimel CE318-T reference instrument to compare the AOD derived from the EKO MS-711 spectroradiometer. The different Cimel references have been shown to have good AOD traceability with the GAW–PFR worldwide reference (Cuevas et al., 2019). The World AOD reference is maintained by the World Optical Depth Research and Calibration Center (WORCC) (Kazadzis et al., 2018b).
The Cimel CE318-T photometer is an automatic sun–sky scanning filter radiometer that measures AOD at 340, 380, 440, 500, 675, 870, and 1020 nm (nominal wavelength; extended wavelength versions additionally have 1640 nm), with a full opening angle of 1.2∘. The uncertainty in AOD measurements from Cimel field instruments was estimated to be ±0.01 in the VIS range and near-IR, which increased to ±0.02 in the UV range (340 and 380 nm) (Eck et al., 1999). This estimate gives an absolute bias <0.01 for AOD lower than 1.5 (Sinyuk et al., 2012). In this study, we have used AERONET version 3.0 level 1.5 AOD data.
3.1 Spectral Langley calibration
The EKO MS-711 spectroradiometer was factory calibrated by EKO Instruments, by making use of a calibrated transfer standard 1000 W quartz tungsten halogen coiled coil filament lamp that is traceable to the National Institute of Standards and Technology (NIST) standard (Yoon et al., 2000). The instrument's resultant uncertainty is ±17 % for the UV range and <5 % for the VIS range. In November 2016, the EKO MS-711 participated in an intercomparison campaign of spectroradiometers at the National Oceanic and Atmospheric Administration (NOAA) Mauna Loa Observatory (MLO), Hawaii, USA (19.54∘ N, 155.58∘ W; 3397 m a.s.l.; Pó et al., 2018), where it was calibrated with the Langley method (Ångström, 1970; Shaw et al., 1973; Shaw, 1983). In 2018 the instrument was deployed at the Physical–Meteorological Observatory and World Radiation Center (PMOD–WRC) for its characteristic use of a tunable laser (Sengupta et al., 2019). Recently, between April and September 2019, the EKO MS-711 was calibrated at the Izaña Atmospheric Observatory by using the Langley method in the 300–1100 nm spectral range. In this study we have used the calibration coefficients with the Langley plot method.
The Langley method used in the IZO Langley calibration is based on the Beer–Lambert–Bouguer law as follows:
where DNI(λ) is the direct normal irradiance at wavelength (λ) measured by the instrument; DNIo(λ) is the top-of-atmosphere irradiance corrected for the Sun–Earth distance at wavelength (λ); m is air mass; and τ(λ) is the optical depth. This expression can be written in the UV–VIS range as follows:
where τR(λ) is the Rayleigh optical depth (Hansen and Travis, 1974), due to the molecular scattering that depends on the station pressure and on the optical air mass (mR) (Bodhaine et al., 1999); τa(λ) is the AOD; and the rest of the terms are the absorption by atmospheric gases in the affected wavelengths (Gueymard, 2001). These are defined as follows:
where P is the pressure at the measurement site within the Earth's atmosphere; Po is the standard pressure at sea level; and λ is the wavelength in micrometres. In situ actual pressure at IZO was used.
where is the reduced path length (in atm cm) taken from the Ozone Monitoring Instrument (OMI) total column NO2 monthly average climatology, and is its spectral absorption coefficient (Rothman et al., 2013).
where is the column water vapour content (precipitable water) taken from a global navigation satellite system (GNSS) receiver that considers satellite precise orbits at IZO (Romero Campos et al., 2009); is the spectral absorption coefficient (Rothman et al., 2013); and the exponent depends on the central wavelength position, instrument filter function, as well as the atmosphere pressure and temperature (Halthore et al., 1997). We have determined from the transmittance for different water vapour and solar zenith angle (SZA) values from the MODerate resolution atmospheric TRANsmission (MODTRAN) model (Raptis et al., 2018).
where is the altitude-dependent gaseous-scaled path length taken from the Fourier-transform infrared spectrometer (FTIR) measurements at IZO (Schneider et al., 2005); is the spectral absorption coefficient (Rothman et al., 2013); and the exponent was obtained from the transmittance values simulated with the MODTRAN model (Berk et al., 2000) for IZO, which obtained a value of 0.454. This value is similar to that obtained by Pierluissi and Tsai (1986, 1987).
where is the total column ozone obtained with a reference Brewer spectrophotometer at IZO (Redondas et al., 2018) and is the ozone absorption cross section (Brion et al., 1993, 1998).
The Langley plot determines DNIo(λ) (which allows us to derive calibration constant) from a linear extrapolation of DNI(λ) measurements to zero air mass, which is corrected to mean Sun–Earth distance, and plotted on a logarithmic scale versus air mass as follows:
where the different air masses have the following expressions:
where R (6370 km) is the mean radius of the Earth, r is the station height above mean sea level in kilometres, and h is the mean height of the ozone layer in kilometres (22 km).
3.2 AOD-retrieval method
The AOD retrievals have been calculated from Eq. (8), as follows:
By grouping the gas contributions, such as τgas, the AOD expression is reduced to the following:
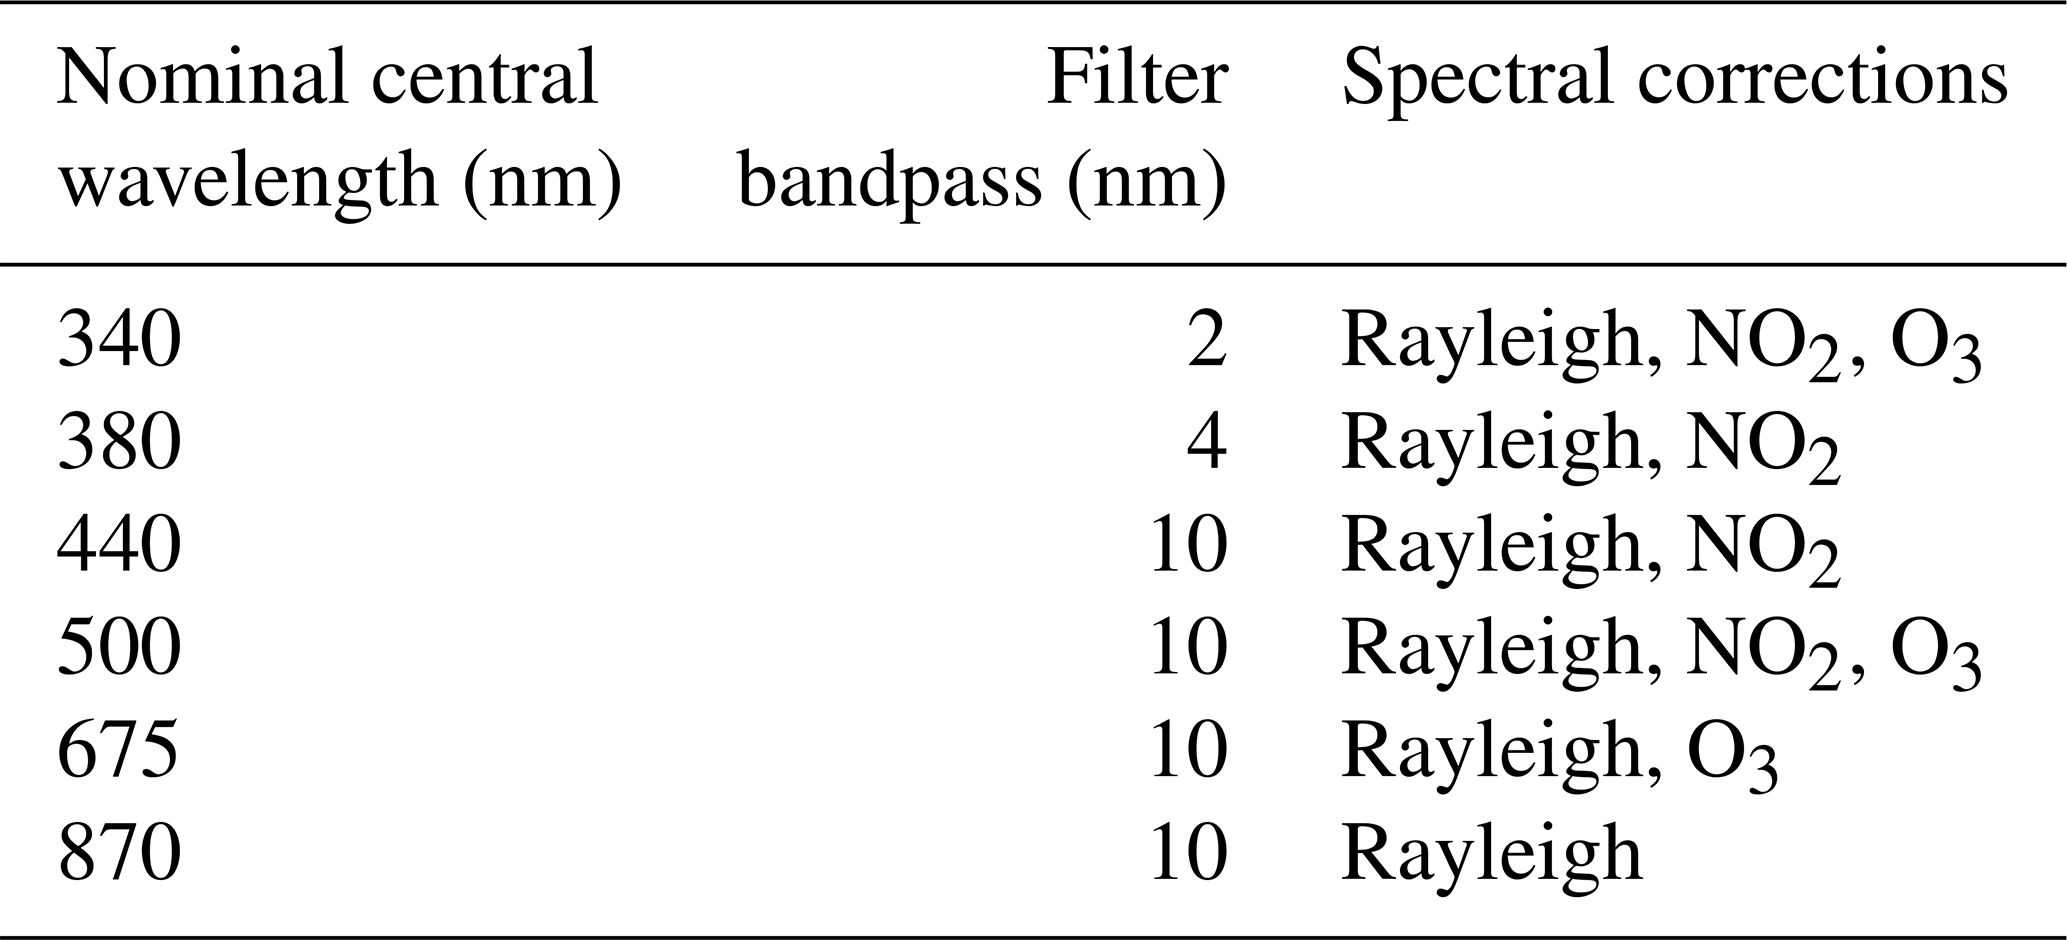
In this work, we have calculated the EKO AOD at the same nominal wavelengths as those of the Cimel (340, 380, 440, 500, 675, and 870 nm), by integrating the measured irradiance on the considered bandpass (see Table 2) and following the methodology used by AERONET (Holben et al., 2001; Giles et al., 2019, and references therein). For each wavelength, we have taken the spectral corrections shown in Table 2 into account. All wavelengths have been corrected by the Rayleigh scattering (see Sect. 3.1). Furthermore the 340, 380, 440, and 500 nm are corrected from nitrogen dioxide (NO2) absorption, with the optical depth being calculated by using the OMI total column NO2 climatological monthly averages and the NO2 absorption coefficient from Burrows et al. (1999). The 340, 500, and 675 nm channels are corrected of column ozone, by using the ozone values from the Izaña WMO–GAW reference Brewer spectrophotometer.
Table 2Wavelengths characteristics of Cimel and spectral corrections used in the calculation of AOD.
3.3 Corrections in AOD under relatively high CSR
The full opening angle and the FOV are normally used indistinctly in the literature, which should not be confused with the viewing angle. Therefore, we use the term FOV for referring to the full opening angle. As we remarked in the introduction, the WMO has recommended the use of instruments with FOV lower than 2.5∘ and slope angle of 1∘ (WMO, 2008) for AOD retrieval. Since the EKO MS-711 was designed for DNI measurements, it has a larger FOV of 5∘, which is twice the WMO-recommended value for AOD retrievals. To account for the different geometries, we have applied a correction to the EKO irradiance measurements. In this section, we explain the methodology applied to the measurements and comparisons with Cimel AOD.
The DNI measurement implies that a certain amount of diffuse radiation is coming from the line of sight of the instrument positioned towards the Sun, and an annular region around it, the so-called circumsolar region, is measured together with the DNI coming from the Sun disc (DNISUN). The source of this diffuse radiation, the circumsolar radiation (CSR), lies in the scattering processes due to the presence of aerosols and clouds (Blanc et al., 2014) in the atmosphere. This CSR has a high dependence on the particle size (Räisänen and Lindfors, 2019); thus large particles (such as desert dust) produce a higher scattering on the incident beam than the smaller particles (e.g. rural background aerosols), which leads this contribution to overestimate the DNI. Thus, the experimental DNI measured by a collimated instrument may be expressed as the sum of both contributions as follows:
where DNISUN is the direct normal irradiance coming from the Sun disc and CSR is the diffuse radiation coming from the sky that is seen by the instrument FOV. This FOV is defined by the instrument geometry and determines the amount of CSR reaching the instrument detector. The value of the DNI measured by the instrument also depends on the atmospheric conditions and the specific instrument characteristics. The most important element that defines the amount of CSR captured by the instrument is the penumbra function P (Pastiels, 1959), which defines the fraction of Sun radiation that is captured or not by the collimator, depending on its angle of vision. This penumbra function can be derived from the geometrical features of the instrument (Major, 1980; Blanc et al., 2014) as follows: the aperture half-angle α, the slope angle αs, and the limit angle αl (Fig. 2a). Usually the three angles are known, with the most important being the aperture half-angle α. Thus, the radiation coming from the sky with an angle higher than the αl is outside the collimator and is then not measured by the instrument.
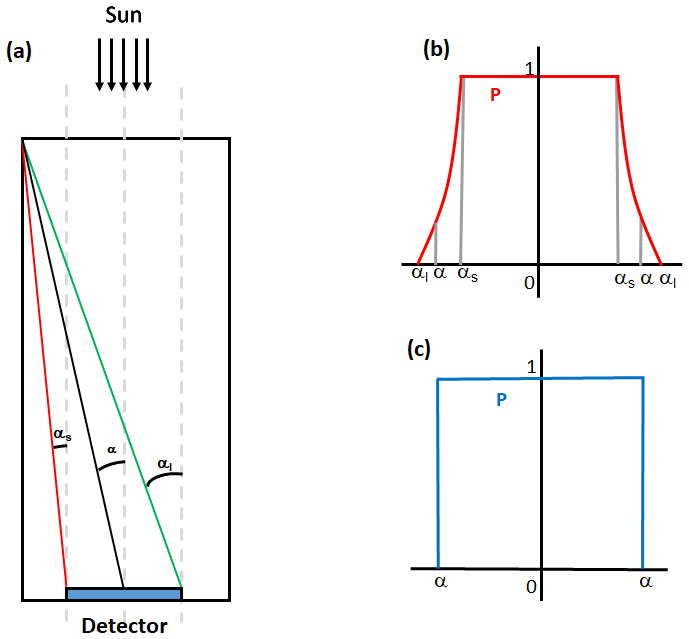
Figure 2(a) Characteristic angles of the instrument: slope angle αs, aperture half-angle α, and limit angle αl. On the right, penumbra functions P(α) when (b) the three angles are known and (c) only if the angle of the half-angle is known. (Figure adapted from Blanc et al., 2014.)
If all the angles are known, then the function P takes the shape of Fig. 2b; if αs and αl are unknown, then the penumbra function P can be approximated as the shape on Fig. 2c. In this paper, we used the penumbra function P described in Fig. 2c because αs and αl are unknown, and we consider that α= FOV/2 .
3.4 CSR simulation
Since it is not possible to obtain accurate CSR measurements, it has been simulated with the libRadtran radiative transfer model (Mayer and Kylling, 2005; Emde et al., 2016; more information at http://www.libradtran.org; last access: 7 November 2019), which provides the possibility of simulating the diffuse radiance on sky elements as defined by its azimuthal and polar angles. We briefly describe the method followed to simulate the amount of CSR measured by the EKO MS-711. The first step is to describe the geometry of the problem, as shown in Fig. 3.
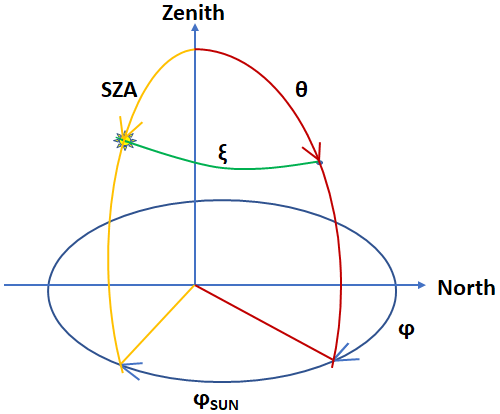
Figure 3Geometry of the problem. The Sun is located at the coordinates (SZA, φSUN) and the sky point is in θ, ϕ. The instrument is located at the origin of the axes.
For a sky point defined by the polar angle θ and azimuthal angle φ, the sky radiance on that point is L (θ, φ) in W m−2 sr−1. The angular distance between the considered point and the Sun's position (the green arc in Fig. 3) is the so-called scattering angle, ξ. To obtain the angle ξ of each point in the sky in terms of the polar and azimuthal angles, the following equation should be used:
Taking this relation into account, the radiation field L can be expressed in terms of ξ and φ; thus, the irradiance in the solid angle subtended by an angular distance from the Sun's centre ξ, for an instrument with an aperture half-angle α, is (Blanc et al., 2014) as follows:
where P(ξ,φ) is the penumbra function defined in Sect. 3.3. If the Sun is in the angular field considered, the obtained irradiance is the DNI of Eq. (15); if not, the result will only be the diffuse radiation. Thus, the key is to simulate the radiances L(ξ,φ) of the points in the FOV that the instrument is “seeing”. In this paper, and taking into account that the instrument is continuously pointing towards the Sun, the integration is performed for ξ values from to , with the aim of simulating the diffuse radiation coming from a circumsolar ring in order to compare AOD from both instruments using the same CSR.
Hess et al. (1998)Gasteiger et al. (2014)Anderson et al. (1986)Kurucz (1994)Stamnes et al. (1988)García et al. (2014)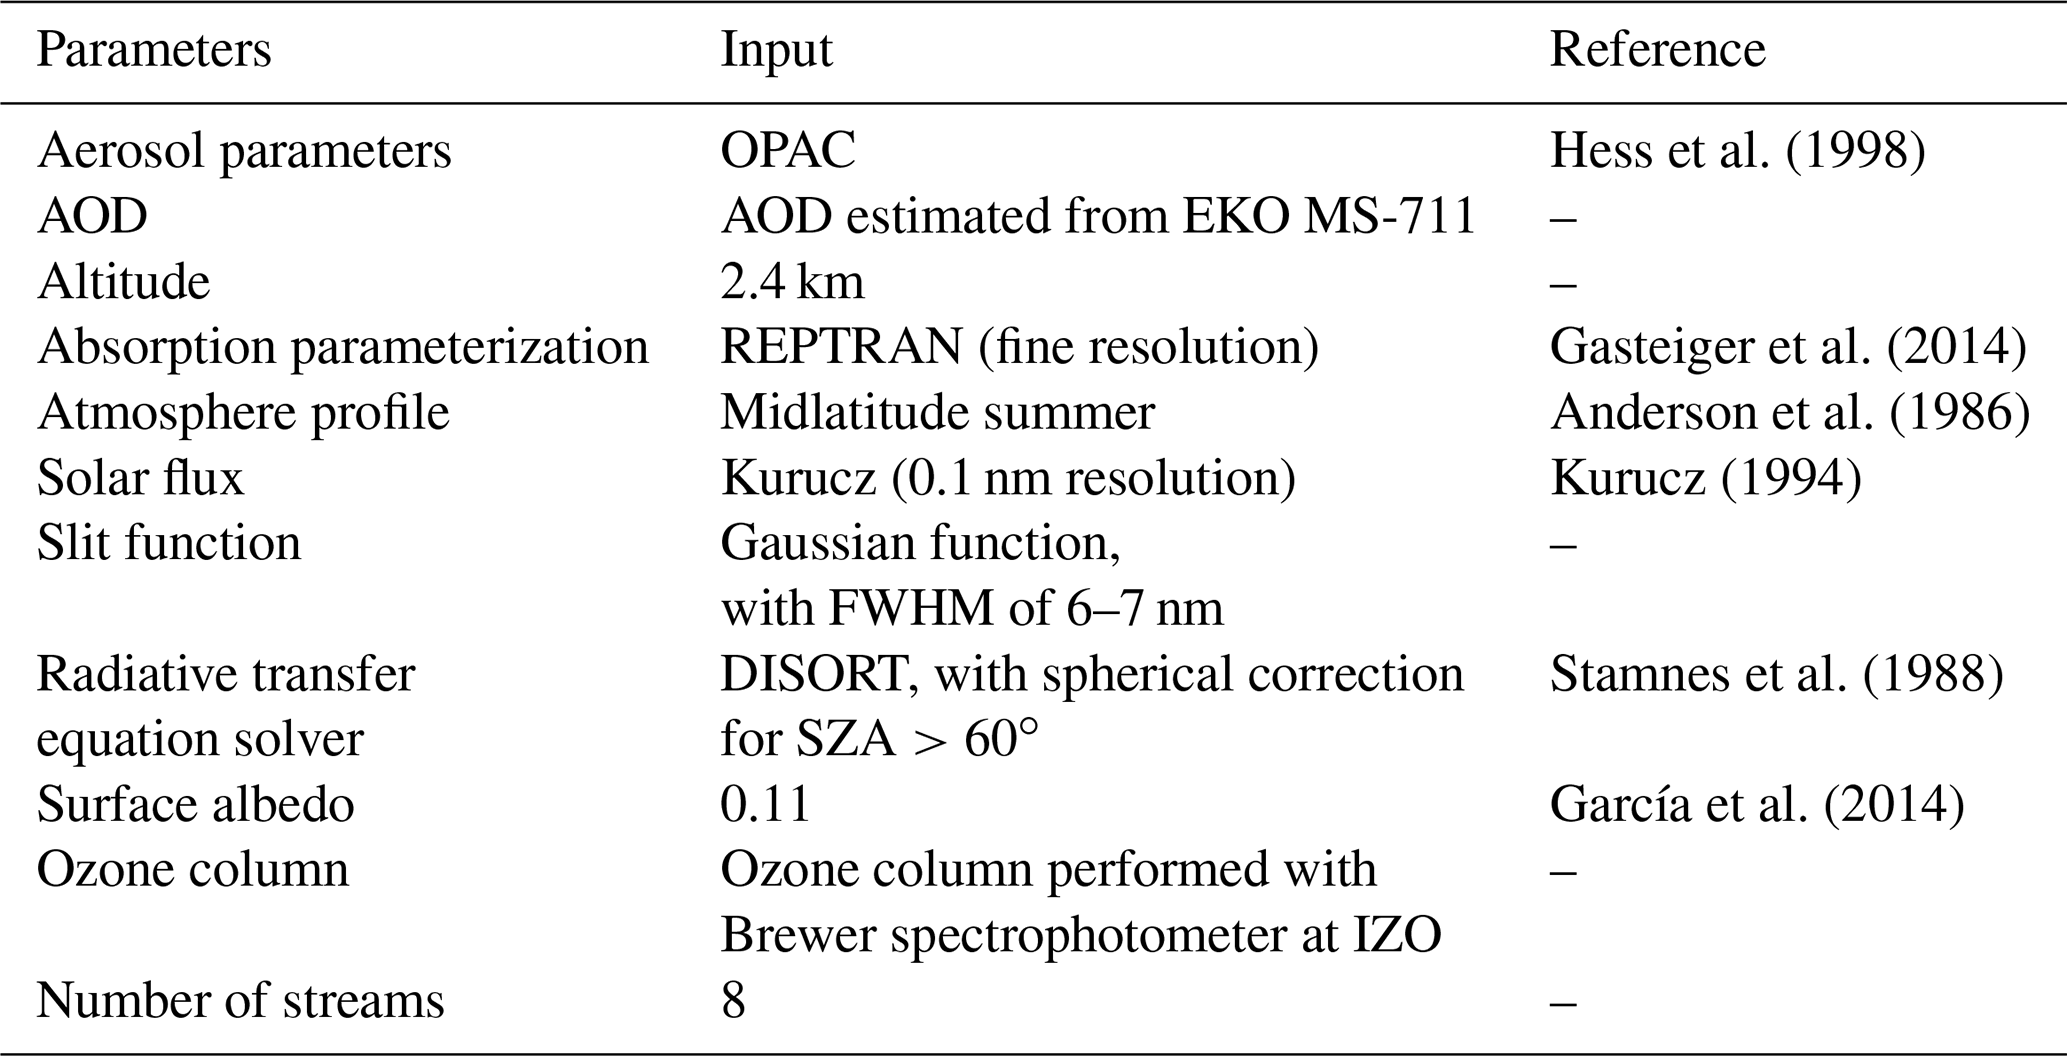
The input parameters used in the simulations are shown in Table 3. The aerosol contribution has been included in the simulations by using the Optical Properties of Aerosols and Clouds (OPAC software package; Hess et al., 1998). This library provides the optical properties of the aerosol (and clouds) in the range from 250 to 4000 nm. In our case, we focused the interest on the aerosol mixtures due to the fact that the aerosols in the atmosphere are found as a mixture of different particles. In the libRadtran package the aerosol mixtures described in Hess et al. (1998) are included. The following aerosol optical properties stored in the data sets are used: the extinction coefficient, scattering coefficient, absorption coefficient, volume-phase function, single scattering albedo, and asymmetry parameter. Due to the location of the IZO station, we have selected the desert mixtures for the cases of low and high aerosol load.
At this point we should note that the use of 1D simulations with the discrete ordinate method radiative transfer (DISORT; Stamnes et al. (1988)) solver implies that the Sun is supposed to be a Dirac delta function, while the Sun has an angular radius of (Emilio et al., 2012). However, Stamnes et al. (1988) demonstrated that the error in DNISUN simulations, when the Sun is assumed to be a point source, is negligible with respect to the finite sun assumption (Stamnes et al., 2000; Reinhardt, 2013); this showed that the simulations of radiances in the vicinity of the Sun that were performed using the DISORT and OPAC aerosols for cloud-free cases gave the same results as the simulations made with the Monte Carlo RTE solver (MYSTIC) included in libRadtran (Mayer, 2009), by taking the angular extent of the solar disc into account. The differences remain under 1 % and even very close to 0 %. Since we want to simulate cloud-free cases, we can use the 1D DISORT without introducing significant errors into the simulations when compared to the more precise Monte Carlo simulations.
Once we have selected the input parameters, we must also select the correct angular grid in the azimuthal and polar coordinates to cover, at least, the angular region previously defined (). By using Eq. (16) we can calculate the ranges of polar angles θ and azimuthal angles φ needed. The result of a monochromatic simulation, i.e. L(ξ,φ) at 495 nm for the day 26 July 2019 at SZA of , is shown in Fig. 4a. In Fig. 4b the penumbra function, i.e. P(ξ,φ), is shown, and in Fig. 4c the result of multiplying P(ξ,φ) L(ξ,φ) is shown. Note that the angular grid has been selected in steps of 0.1∘.
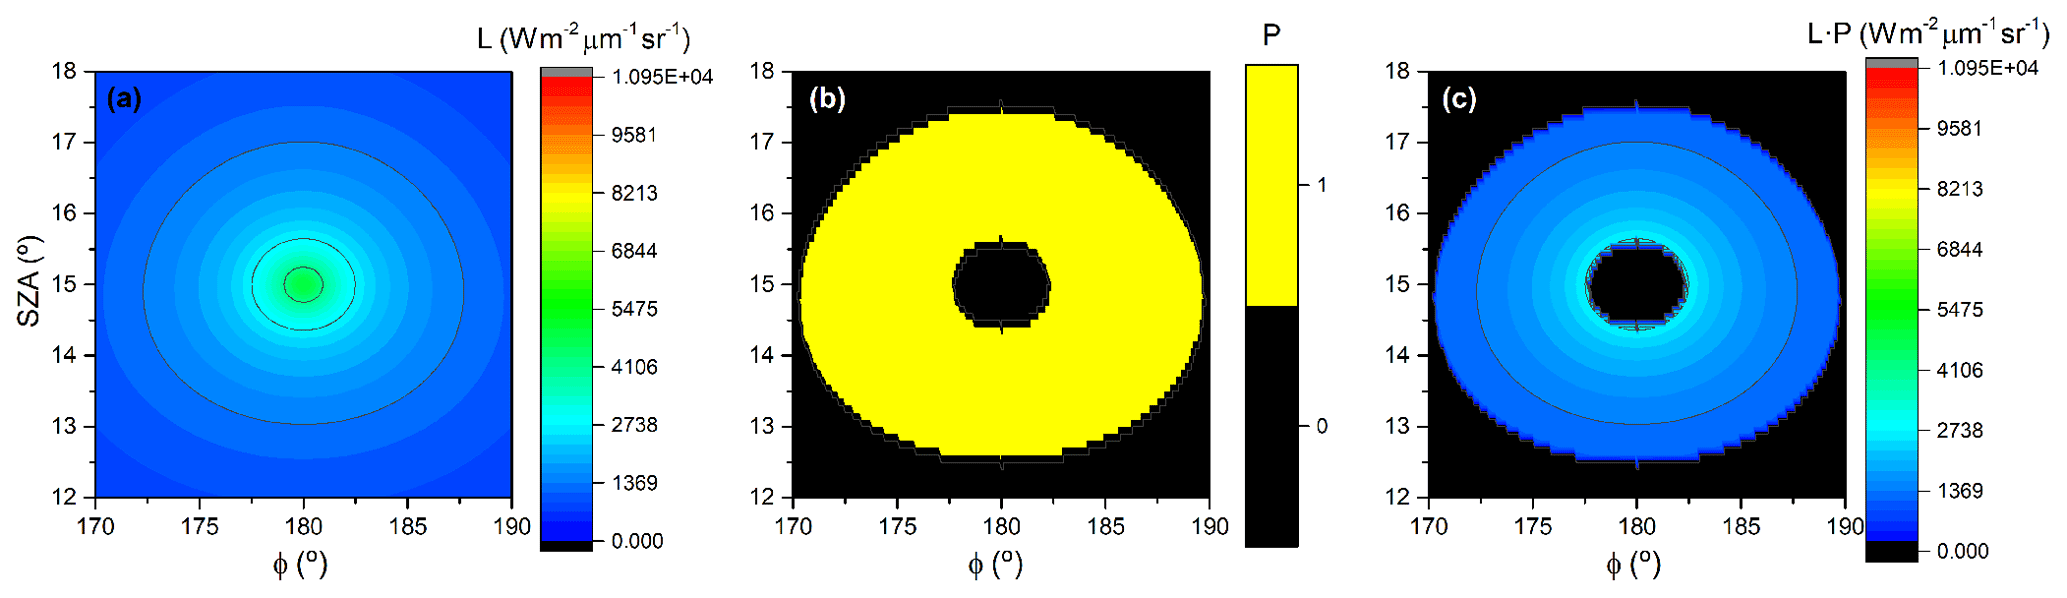
Figure 4Example of the (a) diffuse radiance L (Wm−2 µm−1 sr−1) at 500 nm shown in colours at different SZA φ; (b) penumbra function P determined from Eq. (16); and (c) the product of the diffuse radiance L and penumbra function P.
The expected CSR will be obtained by integrating the radiation field P(ξ,φ) L(ξ,φ) as indicated in Eq. (17). The integration is done by using the angres tool (Mayer and Kylling, 2005) that is provided in the libRadtran package, which uses a Monte Carlo integration in 2D to obtain the diffuse radiation in the considered radiation field.
3.5 AOD retrievals with CSR corrections
Once the CSR has been determined, we apply the correction to the measured DNI by taking the CSR simulations explained before into account. Thus, from Eq. (15) the corrected DNI is as follows:
This correction will lead to a DNICORR<DNI with which we can retrieve an AOD with a similar expression to Eq. (14) as follows:
We must note that in Eq. (19) that DNIo, calculated with the Langley plot calibration method (see Sect. 3.1), should also be calculated by applying the FOV correction using Eq. (8) and substituting DNIo with the corrected DNIoCORR. The EKO AODCORR obtained from Eq. (19) with a DNIoCORR calculated from Eq. (18) is supposed to be “free” of any CSR contribution, and then it is straight-forward to assume that the AODCORR is closer to the real AOD present in the atmosphere. In order to know the impact of the aerosol load and the FOV size in the values of the CSR simulations, we have calculated the ratio of the simulated CSR with respect to the DNI given by Eq. (15). This is the so-called circumsolar ratio (CR) under cloud-free conditions. We have done simulations of DNISUN and CSR to obtain the previously cited CR, by varying the aerosol load in the range [0–0.50] and the FOV in the range [0–5∘]. The rest of the input parameters remain fixed. The results of CR are shown in percentages (Neumann and Witzke, 1999) for a solar zenith angle of 30∘ for the six Cimel channels in Fig. 5.
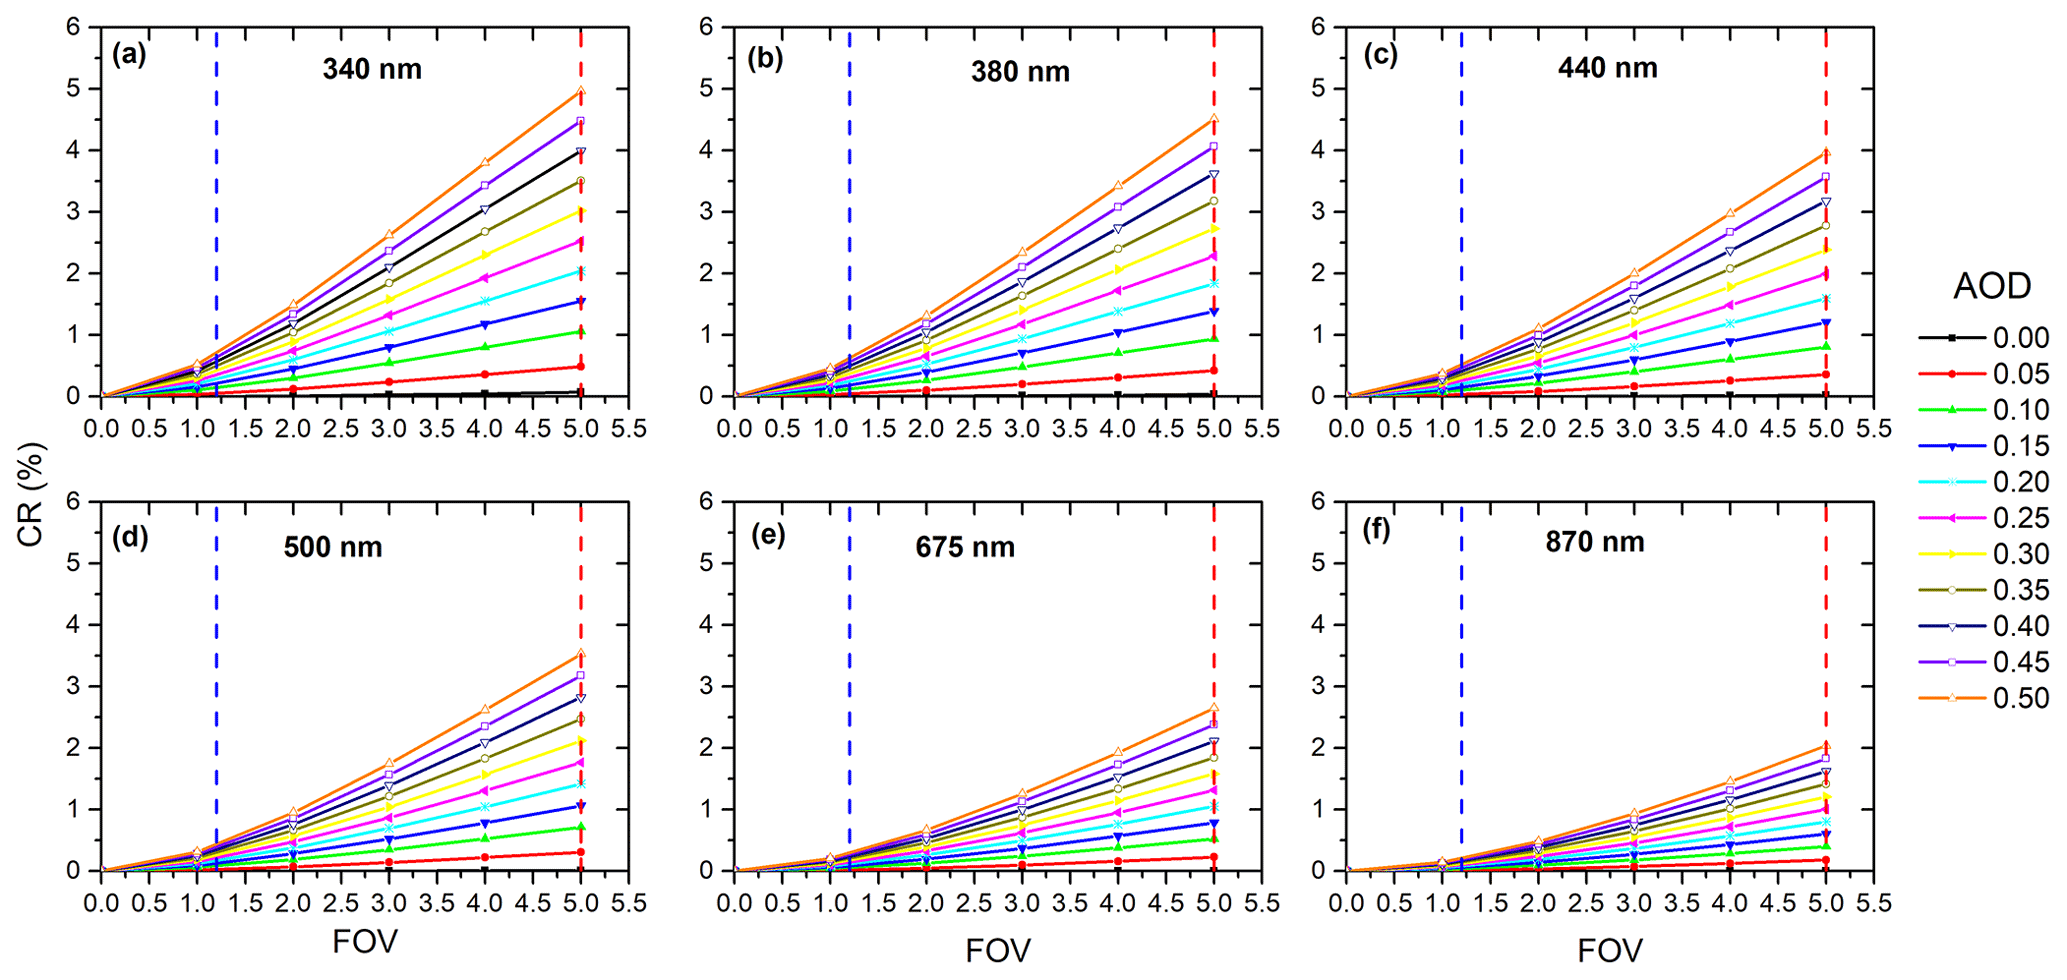
Figure 5Simulations of CR at (a) 340, (b) 380, (c) 440, (d) 500, (e) 675, and (f) 870 nm for AOD between 0.0 and 0.50, and FOV between 0 and 5∘ at SZA 30∘. The dashed blue and red lines represent the Cimel FOV (1.2∘) and EKO MS-711 FOV (5∘) respectively.
As seen in Fig. 5, CR increases for higher FOV and larger AOD, as expected, and for the lower wavelengths. The dashed lines in Fig. 5 indicate the FOV of the instruments used in this paper with the Cimel (blue line) and EKO (red line) results. In all cases, the CR for the Cimel is lower than 1 % and even 0.5 % for the channels over 440 nm. For EKO, the CR ranges between 2 % in the 870 nm channel and 5 % for the 340 nm channel. Thus, the expected CSR maximum values in Fig. 5 should be found under these conditions: FOV of 5∘, AOD of 0.50, and wavelength of 340 nm in which a CR of 5 % is found. We have simulated the AOD retrievals as a function of CSR. By combining Eq. (18) to (20), we can vary CR (the value of CSR, in fact) and calculate the AOD retrieved with the corresponding DNIoCORR.
These results indicate that the CSR impacts significantly on the EKO AOD retrievals under relatively high AOD, which leads to AOD underestimation, with the effect being less important for the Cimel AOD retrievals because of its narrower FOV.
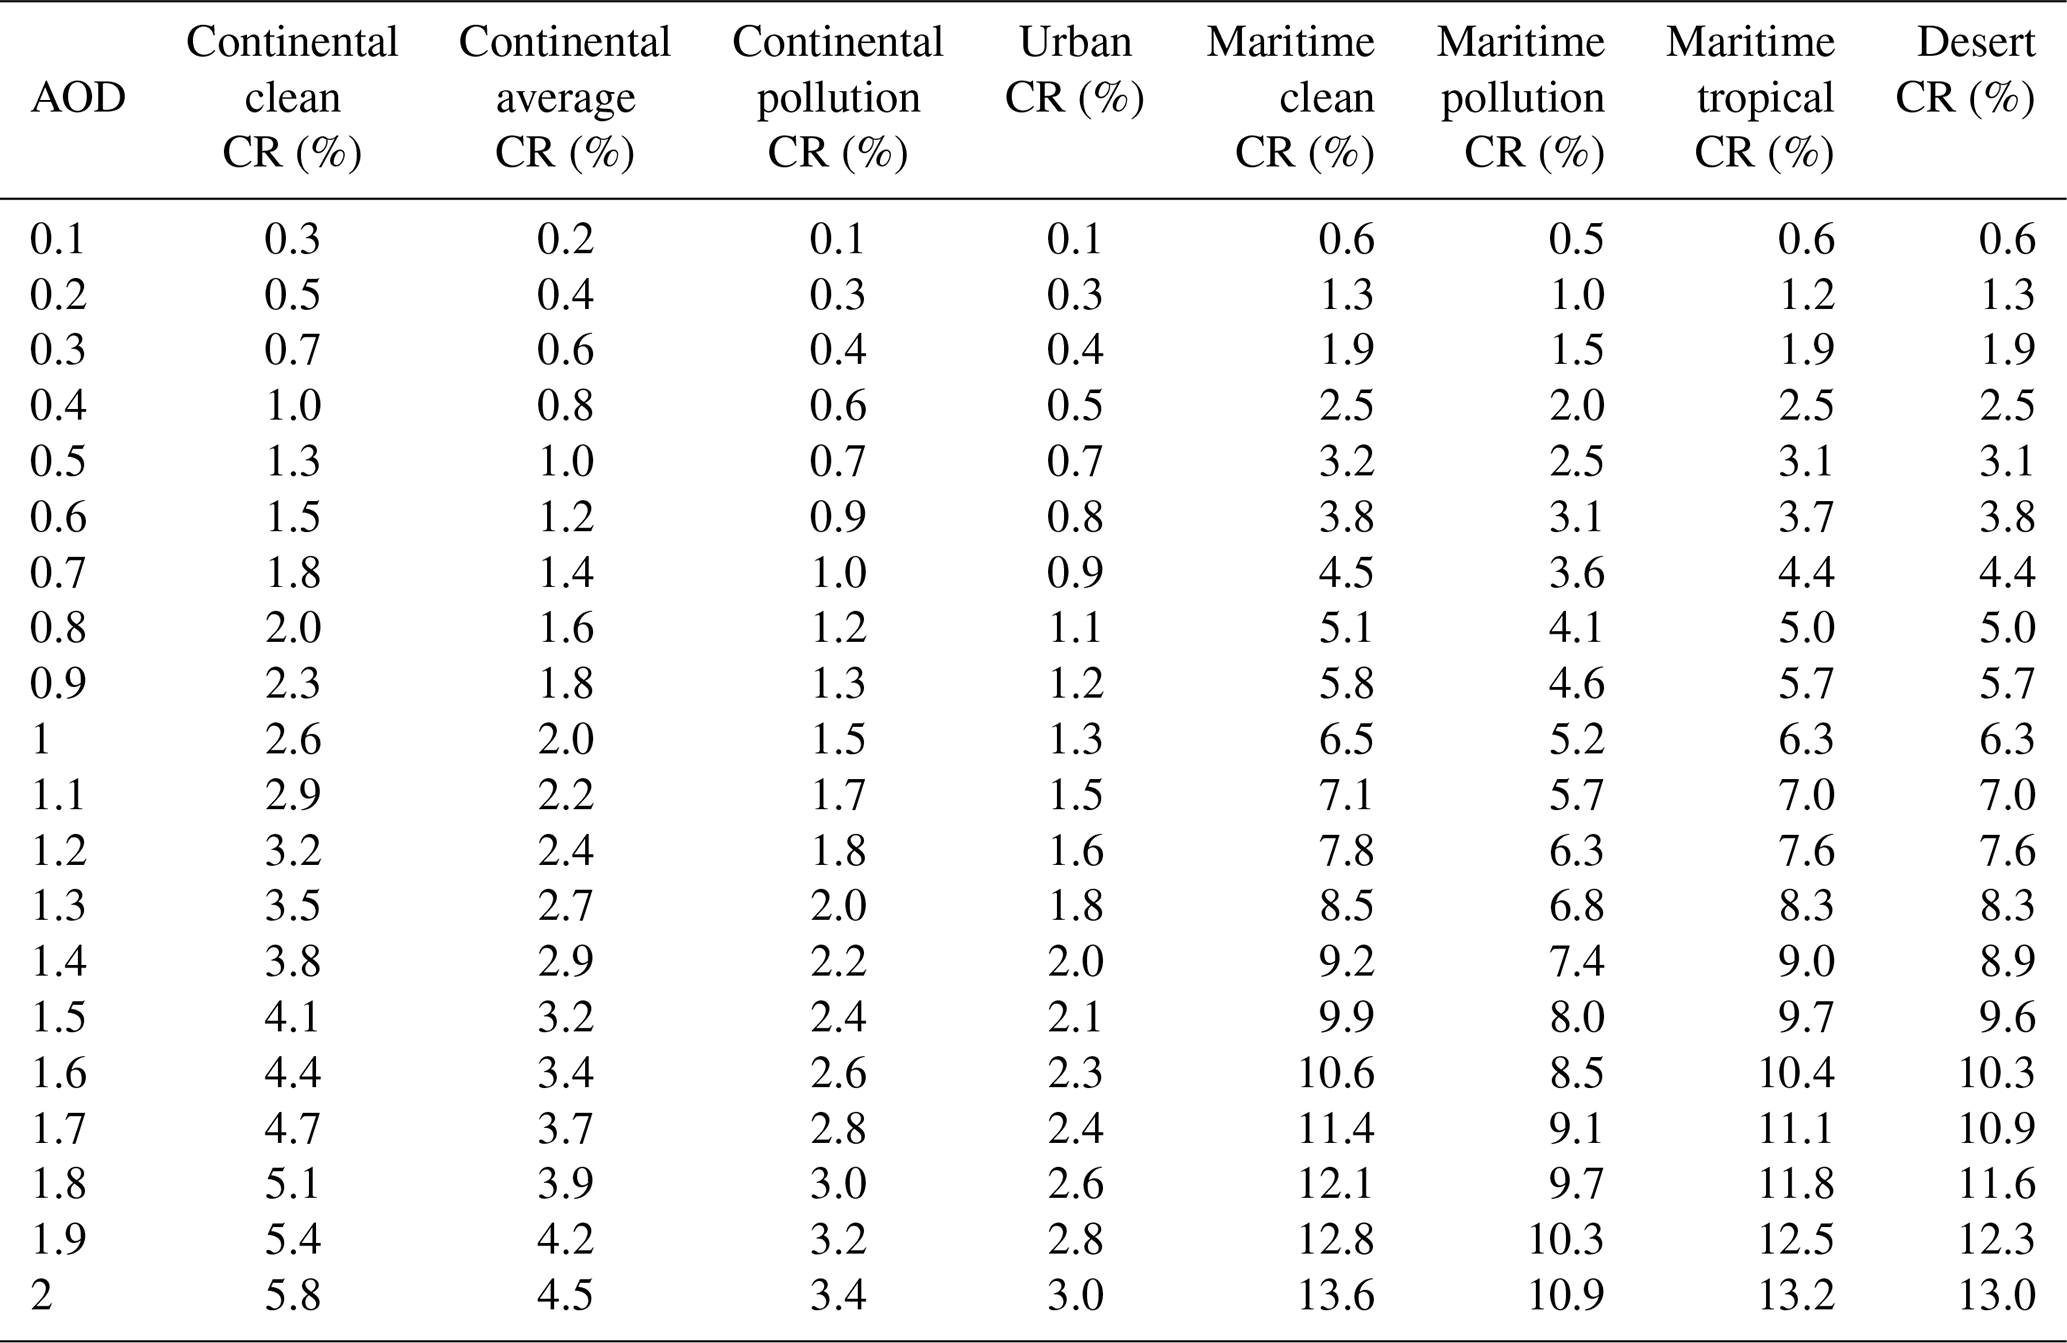
These results have been simulated by considering the typical conditions of IZO where mineral dust is practically the only aerosol present (Berjón et al., 2019; García et al., 2017). Simulations of the effect on the CR of the eight OPAC mixture aerosols available in the libRadtran model, which include continental (clean, average, and polluted), urban, maritime (clean, polluted, and tropical), and desert aerosols (Hess et al., 1998) for FOV are shown in Fig. 6. For SZA , with an AOD500 nm range between 0 and 2 at sea level, two defined groups are distinguished, namely the continental and urban aerosol mixtures, and the maritime and desert dust mixtures. It should be noted that for stations located in urban or continental (clean and contaminated) environments, which are the majority, the correction that would have to be made to the AOD for a very high aerosol load (e.g. AOD =1) would be much lower, between 1∕3 to 1∕6, than the correction that would have been performed in the case of dust aerosol (Fig. 6 and Appendix B).
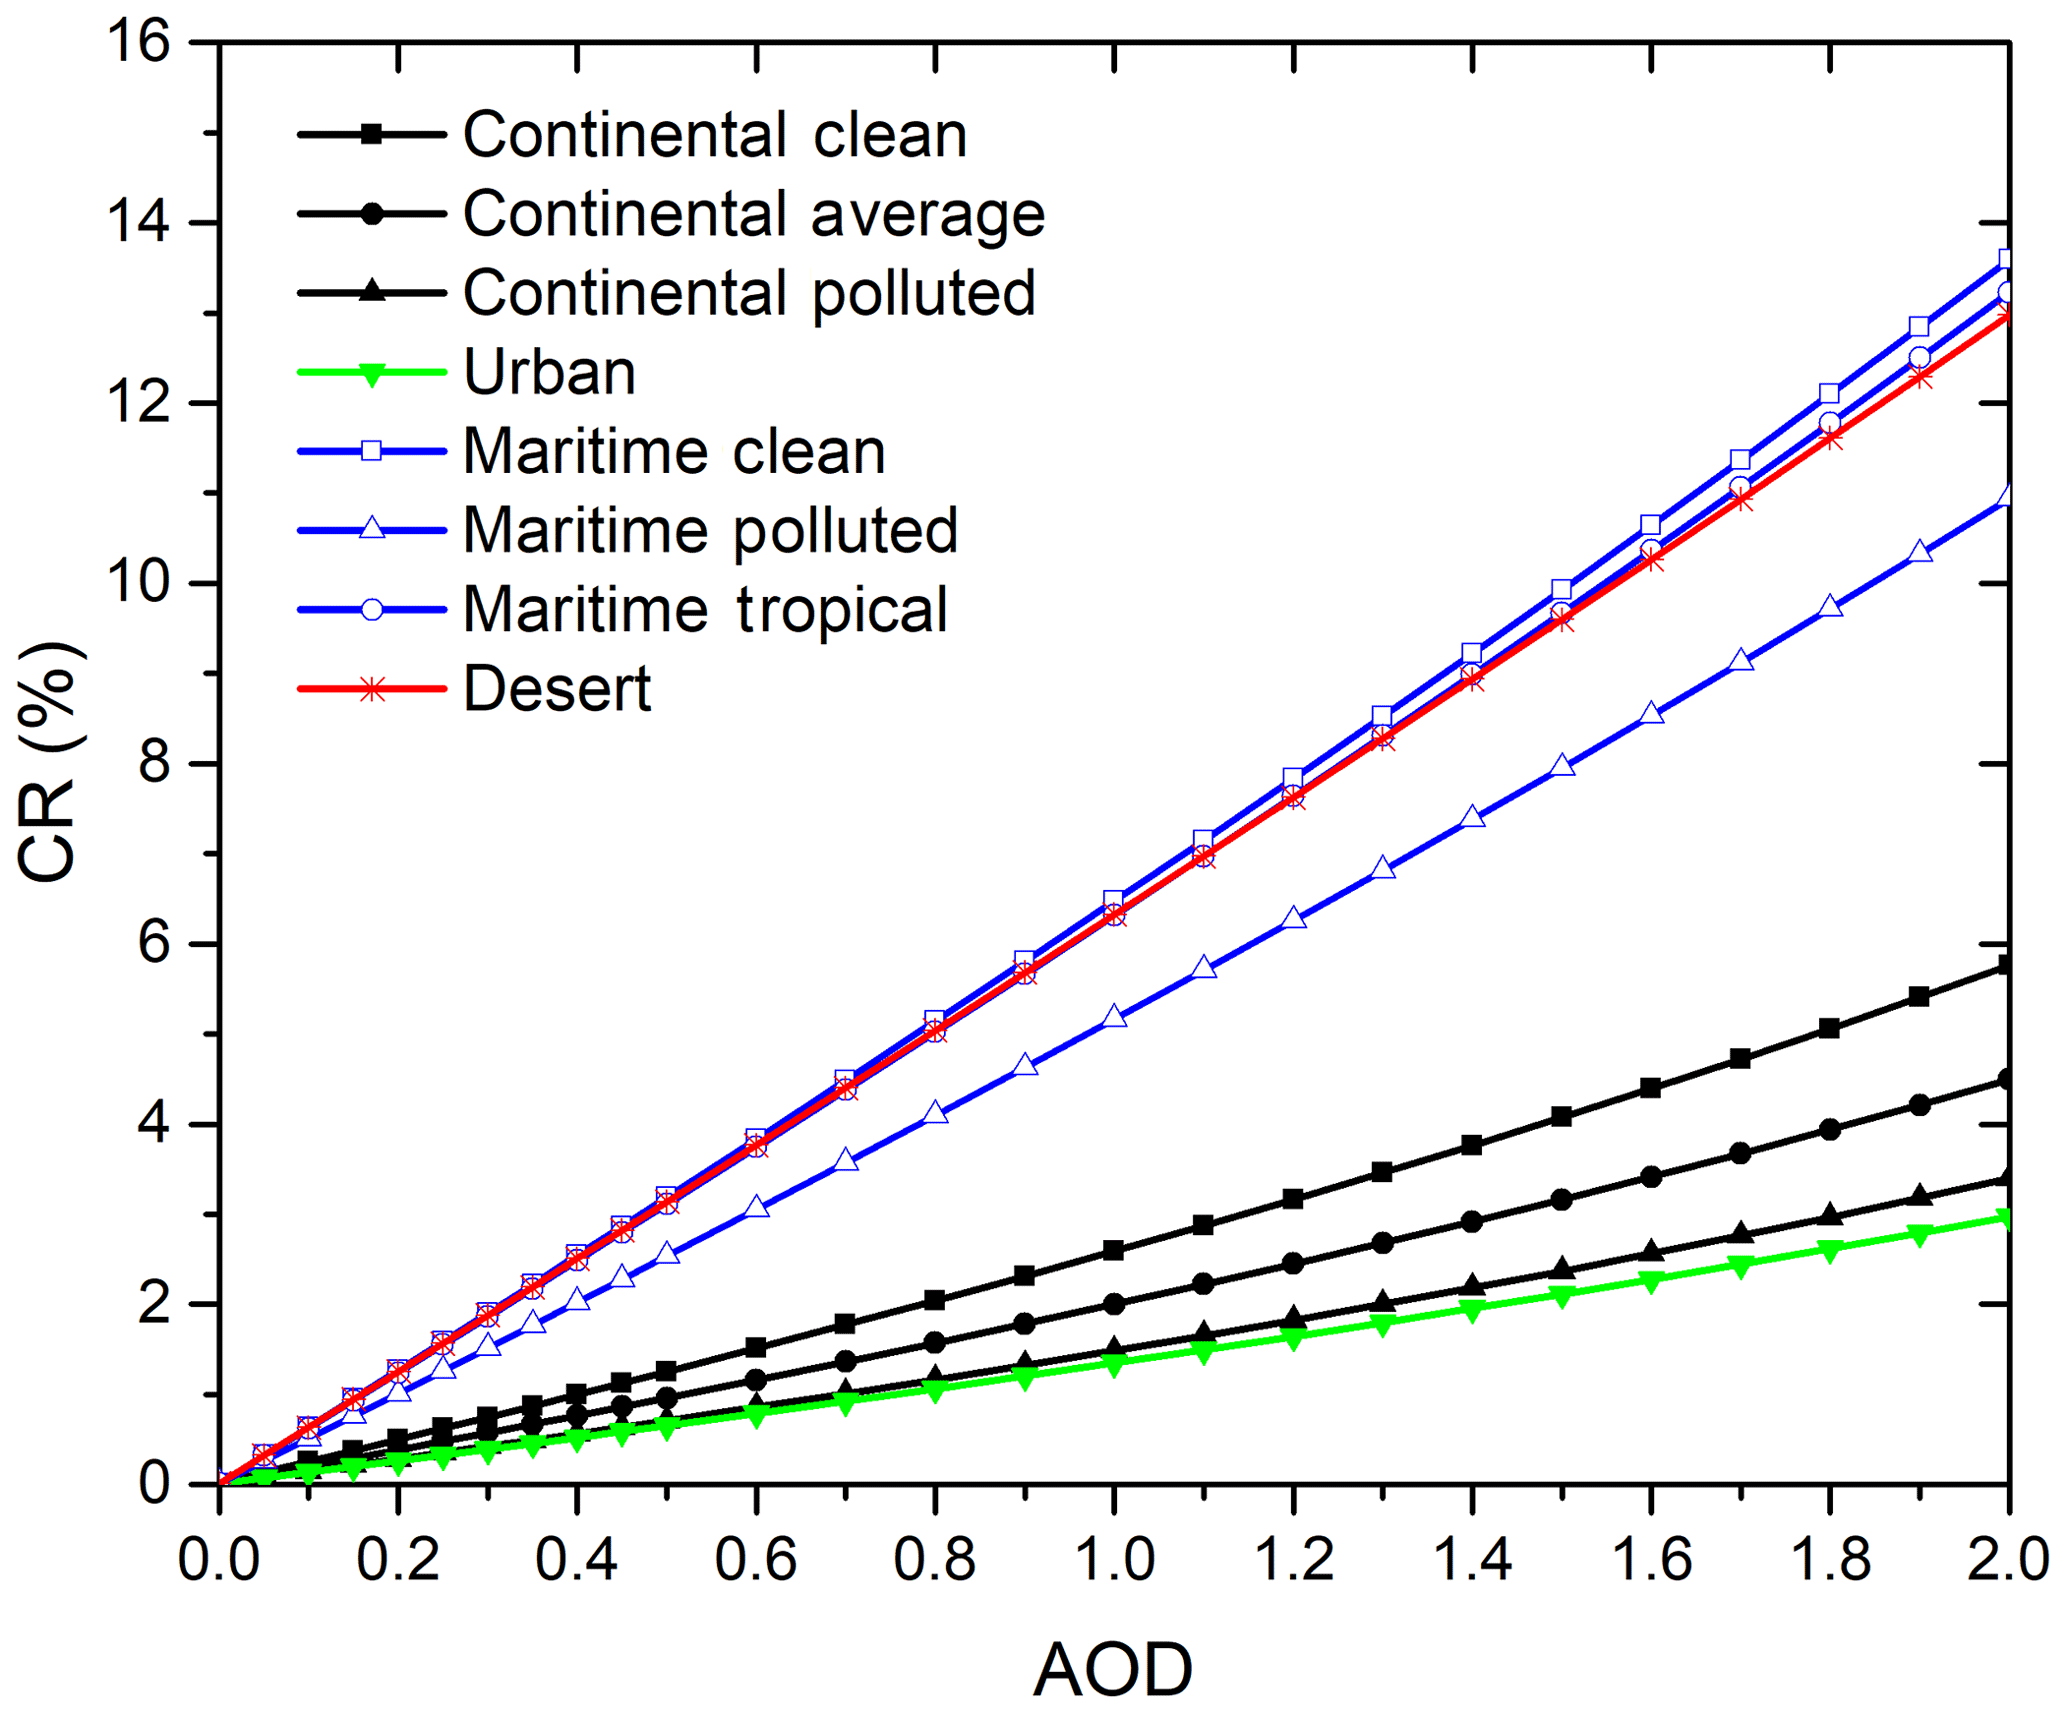
Figure 6Simulations of CR (%) for SZA 30∘ at sea level for AOD values between 0 and 2, at 500 nm, for different types of aerosols for FOV of 5∘.
4.1 Langley calibration at the Izaña Atmospheric Observatory
Based on the experience of Kiedron and Michalsky (2016) and Toledano et al. (2018), we have considered that the Langley calibration is suitable if the standard deviation (σ) of the fit (Eq. 8) is lower than 0.006, the correlation coefficient , the number of valid points >33 % of the initial sample, and AOD (500 nm) <0.025. In order to test the Langley method described in Sect. 3.1, an example of Langley plots using the UV–VIS near-IR direct Sun measurements on 19 March 2019 at the Izaña Atmospheric Observatory is shown in Fig. 7.
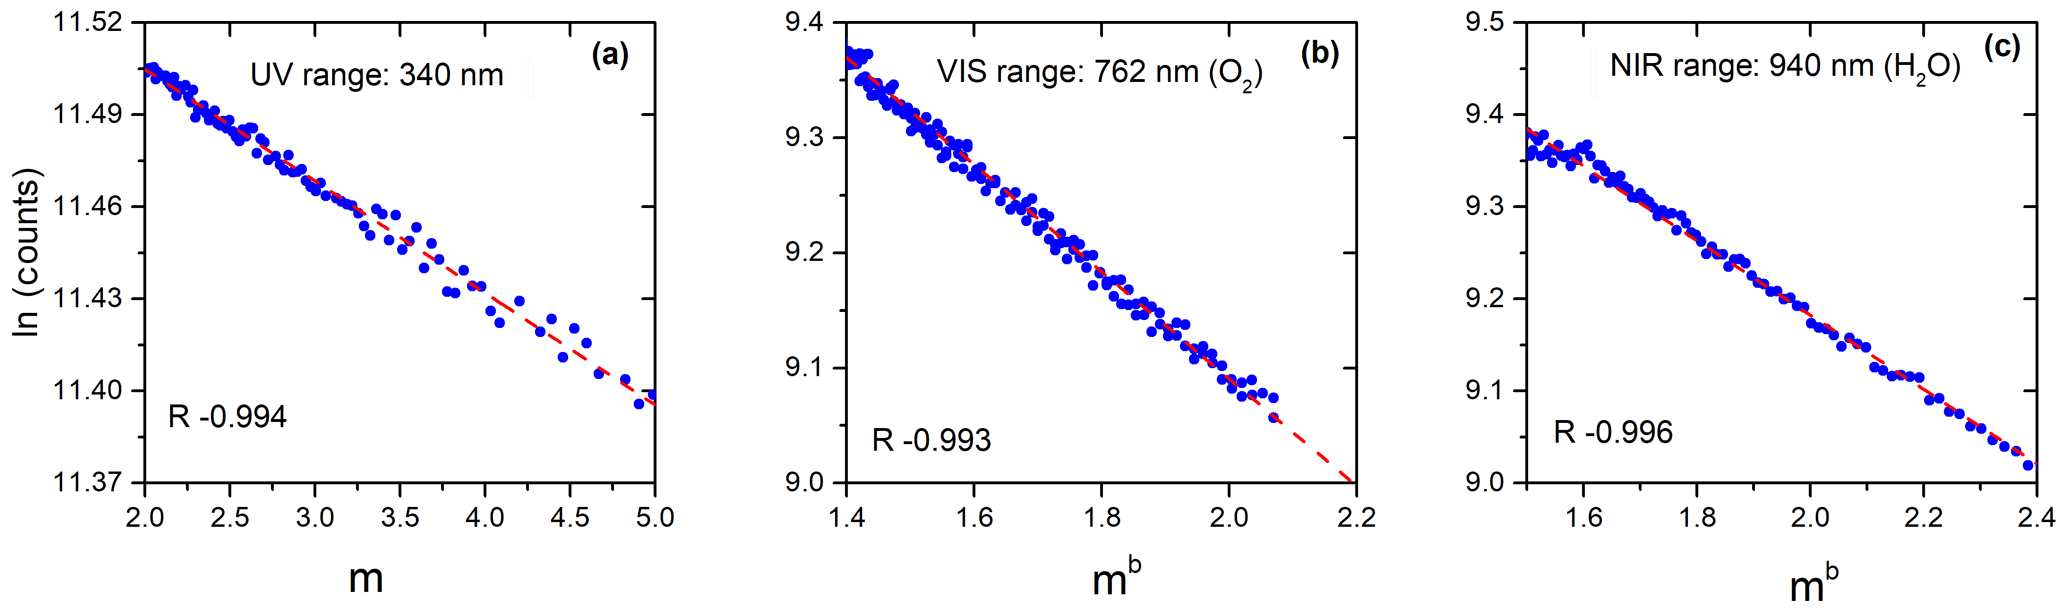
Figure 7Examples of Langley plots using the UV–VIS near-IR direct Sun measurements on 19 March 2019 at the Izaña Atmospheric Observatory at (a) 340 nm, (b) 762 nm (O2), and (c) 940 nm (H2O) nm. R: correlation coefficient.
The comparison between the factory calibration performed by EKO Instruments in 2016 and the IZO Langley plot calibration (2019) is shown in Fig. 8. These results indicate that the stability of the EKO MS-711 in the range of 300–1100 nm during a 3-year period, between the manufacturer's lamp calibration and the Langley calibrations at IZO, is remarkable. The factory calibration and the IZO Langley plot calibration 3 years later present differences ∼4.8 % between 350 and 1100 nm, and even ≤2.3 % and 3.1 % in the VIS and near-IR range respectively. The larger differences below 350 nm are attributed to the low halogen lamp signal, which was experienced in this region during the factory calibration, and the low instrument sensitivity in this region.
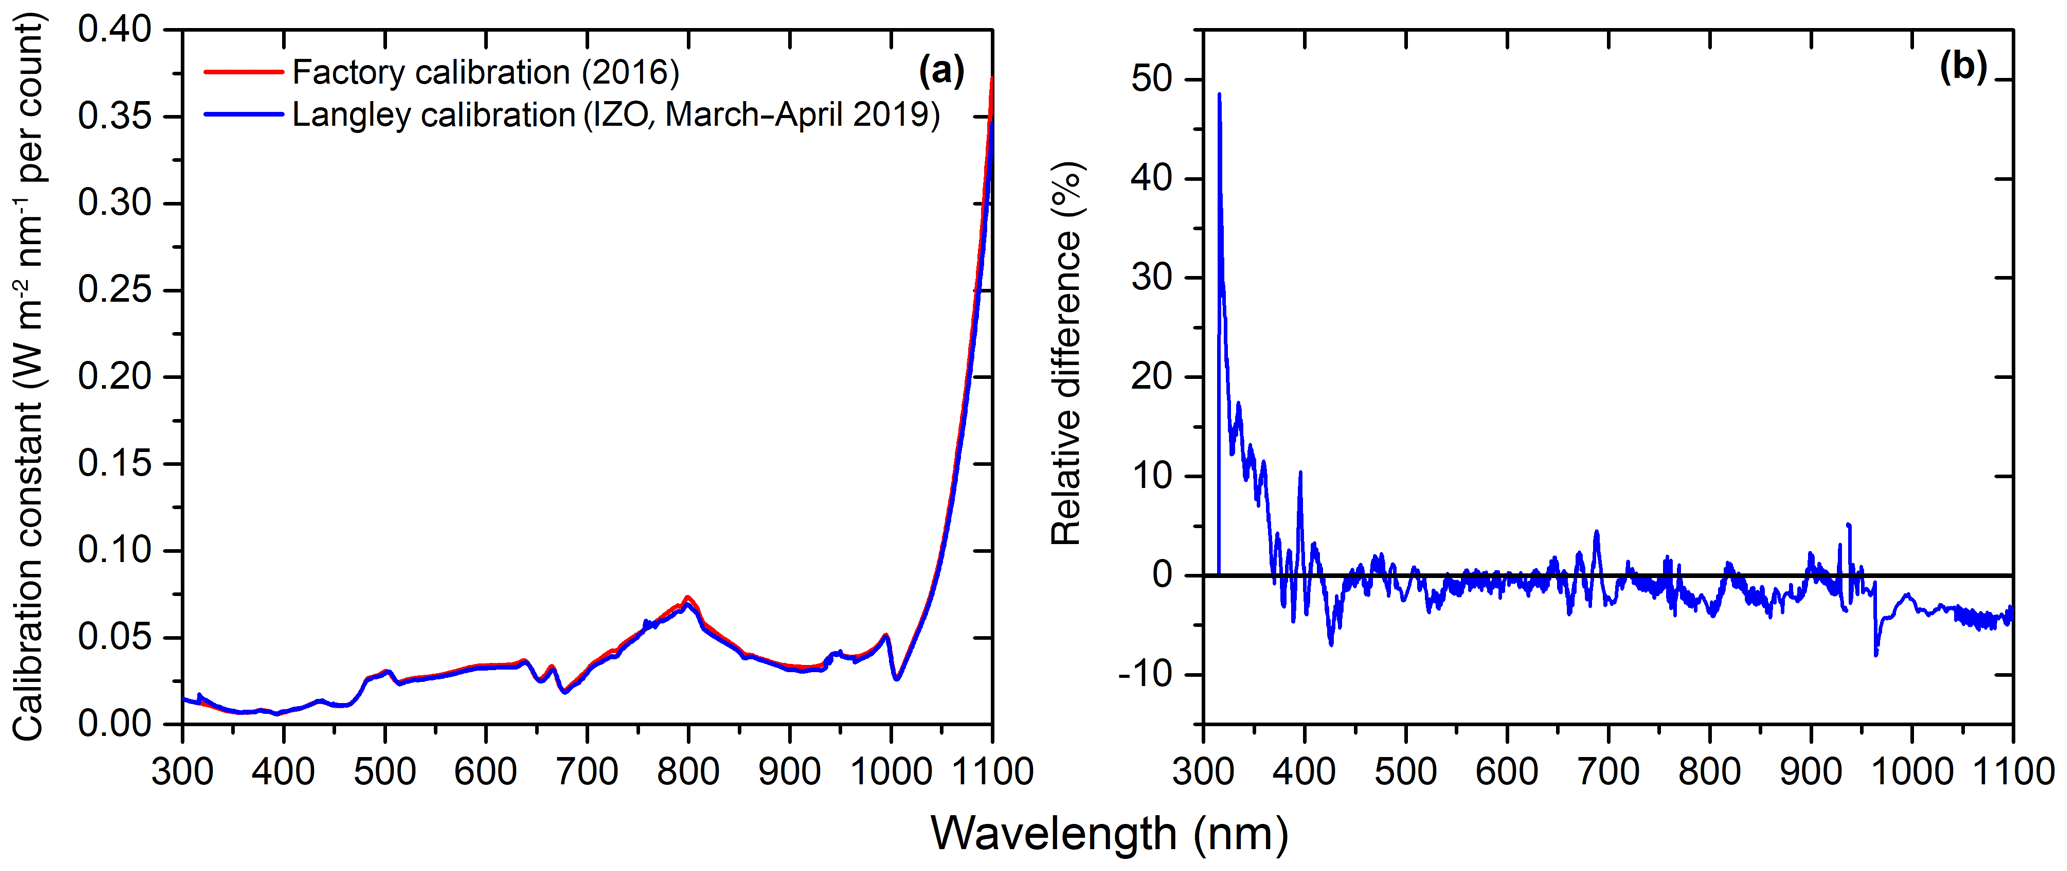
Figure 8(a) Calibration constants (W m−2 nm−1 per count) of the EKO MS-711 spectroradiometer, and (b) relative differences between factory calibration constants and those obtained from Langley plots at IZO.
By applying the previous method, DNIo(λ) values and their standard deviations from the EKO MS-711 measurements (from April to September 2019 at the Izaña Atmospheric Observatory), at the nominal wavelengths measured by the Cimel (340, 380, 440, 500, 675, and 870 nm) as a function of time, are shown in Fig. 9. These DNIo(λ) values have been used in the AOD retrievals.
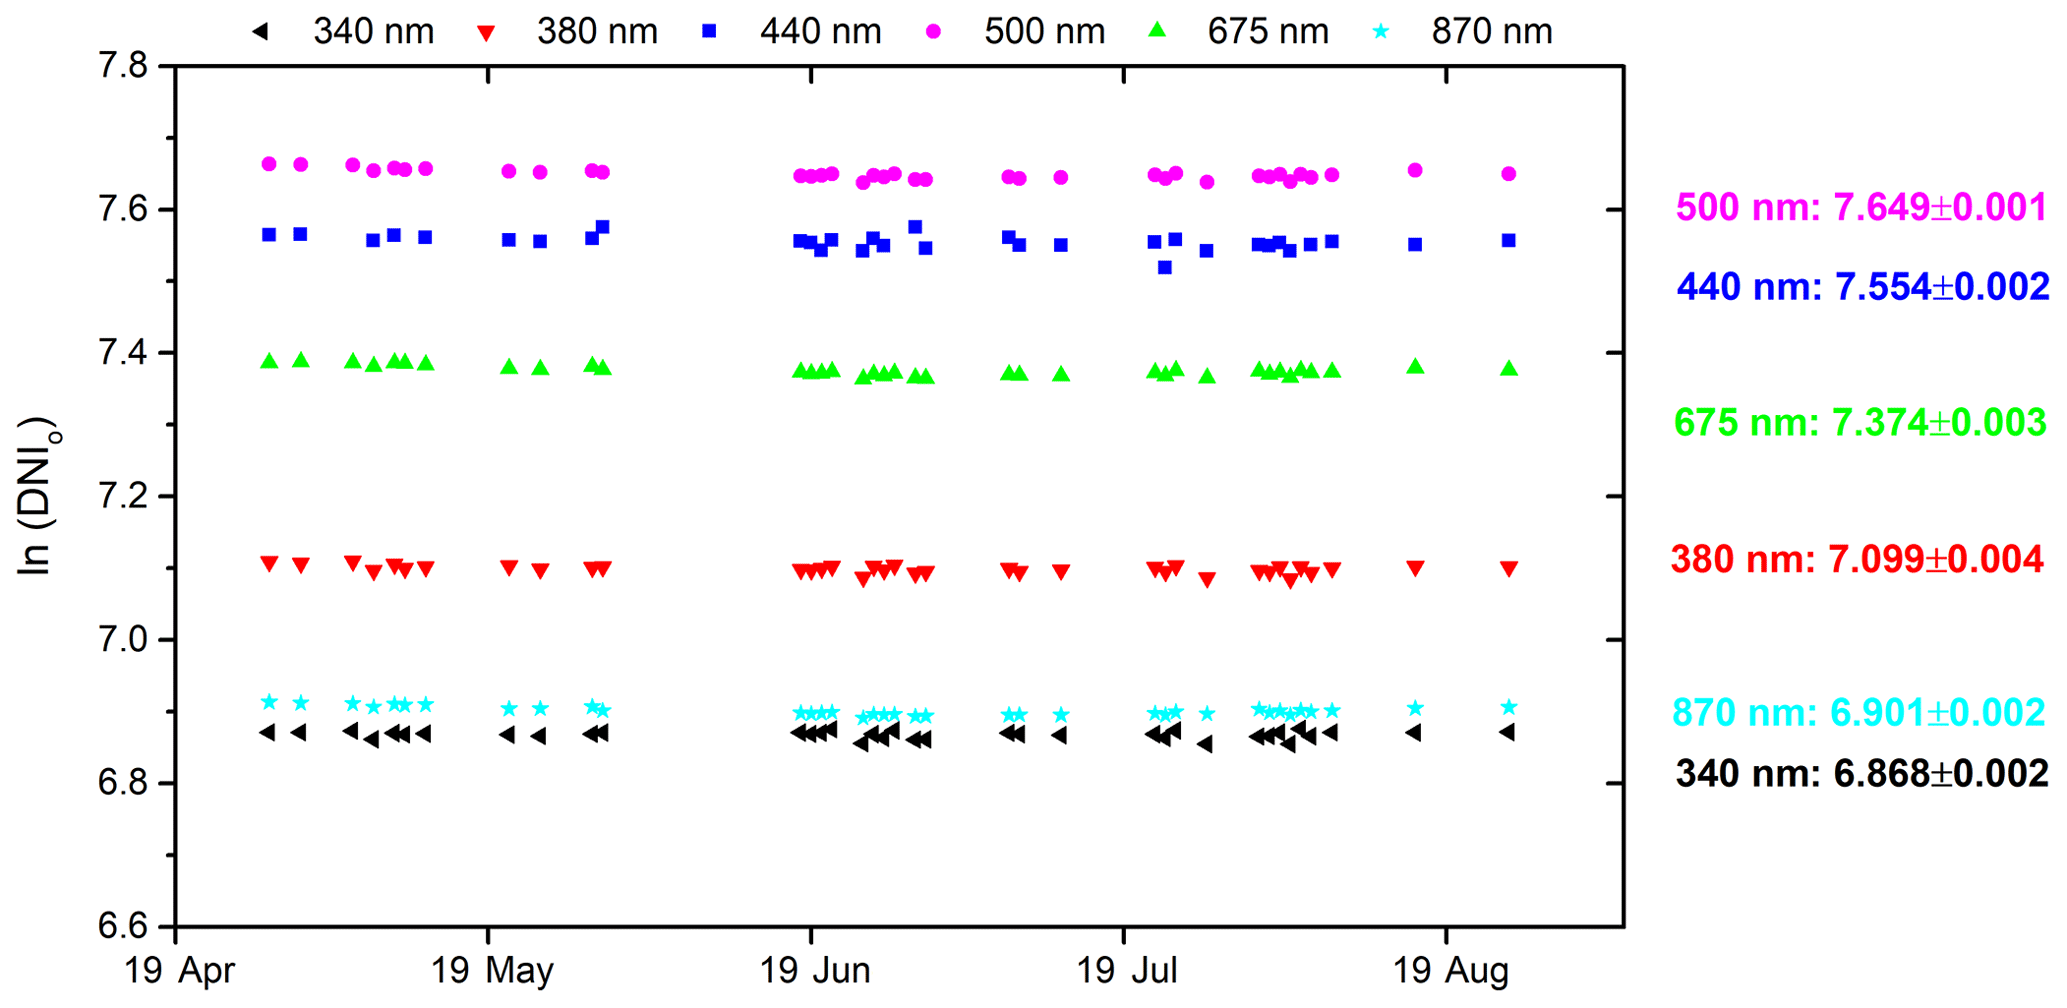
Figure 9EKO MS-711 DNIo(λ) values, and corresponding standard deviations, between April and September 2019 at IZO for all nominal wavelengths measured by the Cimel (340, 380, 440, 500, 675, and 870 nm).
4.1.1 AOD retrievals
In this section, we present the results obtained when comparing Cimel AOD and EKO AOD with no CSR corrections (CSR Unc. AOD) and applying a CSR correction (CSR Corr. AOD). The comparisons were done by considering the measurements of both instruments that match to within 2 min for all wavelengths. This approach produced a Cimel and EKO AOD data set with a total of 14 706 quasi-coincident measurements. The results (Table 4) show that there is good agreement (correlation coefficient >0.98) between EKO AOD and Cimel AOD for all channels, even for no CSR correction, except for the lowest 340 nm UV channel.
Table 4Statistics of the comparison between EKO AOD, with no CSR corrections (CSR Unc.) and implementing CSR corrections (CSR Corr.), and Cimel AOD at 340, 380, 440, 500, 675, and 870 nm at IZO between April and September 2019. R – correlation coefficient, slope of the least squares fit between EKO AOD and Cimel AOD; rms – root mean square of the bias; and MB – mean bias. The results of the relative bias are in brackets (in %).

The uncorrected EKO AOD shows slopes ∼1.06 and correlation coefficients over 0.97 for all wavelengths. The rms ranges from 0.017 (28.9 %) at 340 nm to 0.004 (18.8 %) at 870 nm. These results improve significantly when taking the CSR corrections for all wavelengths into account. Thus, for the corrected EKO AOD the correlation coefficients are ∼0.98 for the shorter wavelengths and ∼1 for the rest of the wavelengths. The rms and mean bias (MB) show the same trend as that of the uncorrected EKO AOD case; that is, we find the lowest values for the higher wavelengths. The negative values of the MB (EKO AOD–Cimel AOD) indicate that the EKO AOD values are normally lower than the Cimel AOD values. However, these values are within the Cimel instrument uncertainties at ±0.01 in the VIS and near-IR and ±0.02 in the UV ranges (Eck et al., 1999). These results also agree with other studies. For example, Estellés et al. (2006) and Cachorro et al. (2009) found differences between 0.01 and 0.03 in the VIS range and between 0.02 and 0.05 for the UV range when comparing LI-COR AOD with Cimel AOD. Recently, Kazadzis et al. (2018a) found AOD differences ranging between 0.01 and 0.03 at 500 and 865 nm respectively, when comparing AOD from PSR and PFR. Recently, Cuevas et al. (2019), using a long-term AOD data series from both GAW–PFR and AERONET–Cimel radiometers, reported differences in AOD ∼3 % lower at 380 nm and ∼2 % lower at 500 nm for GAW–PFR due to its larger FOV.
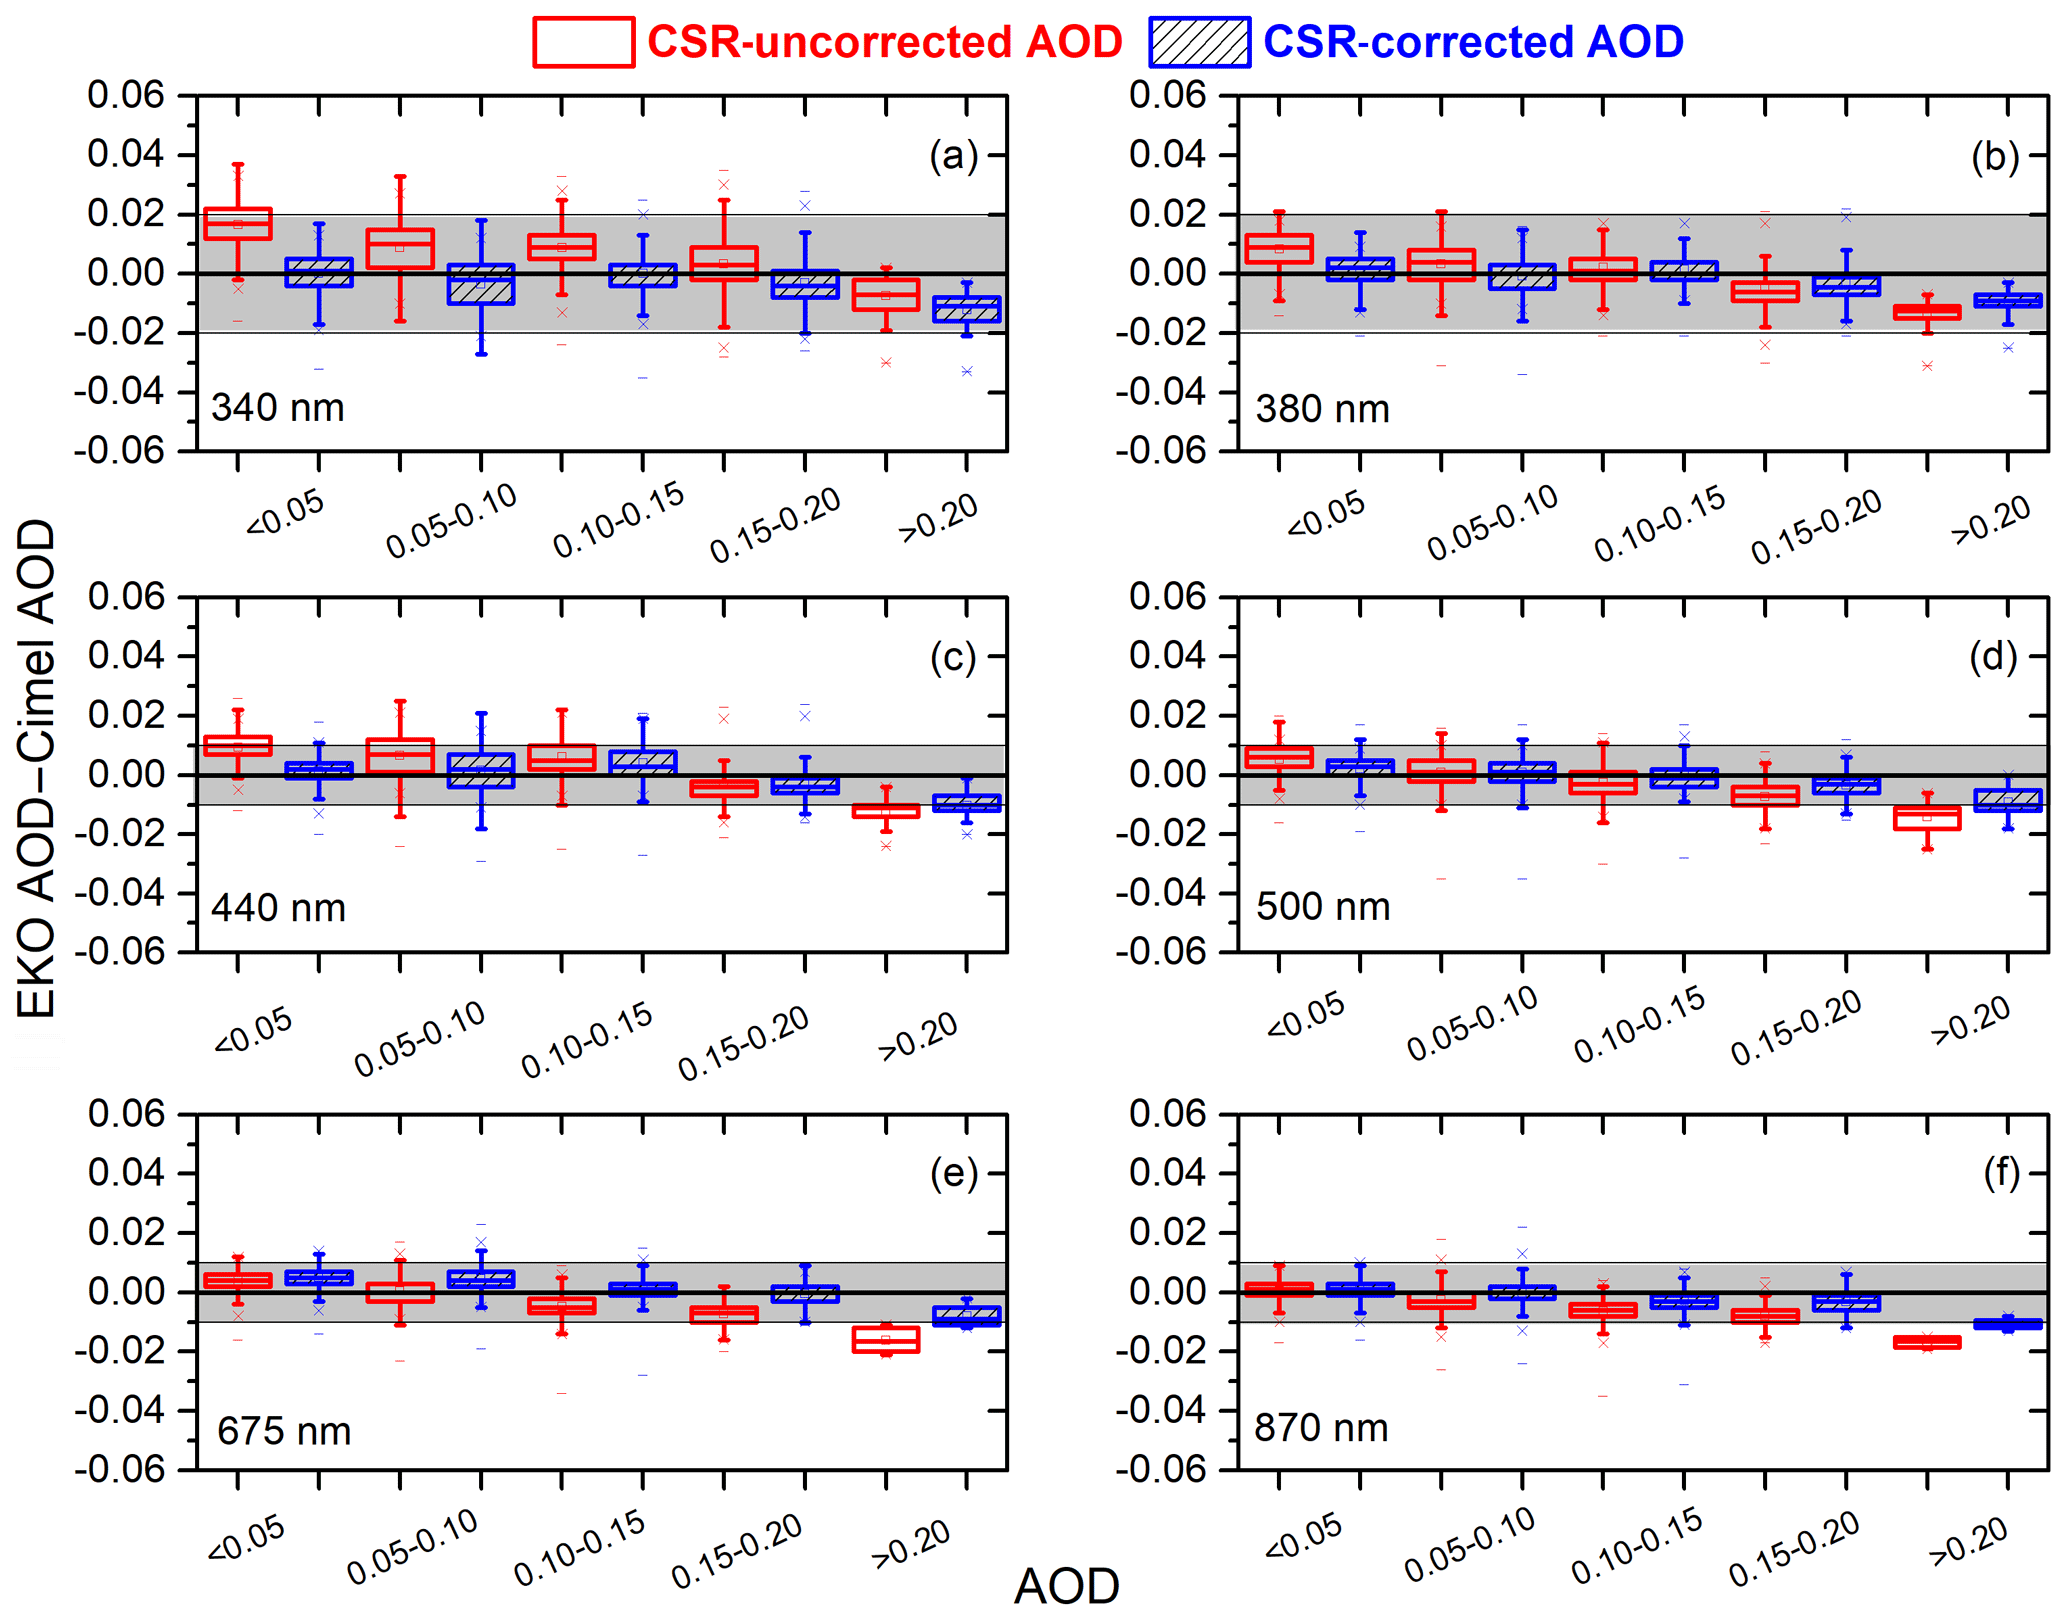
Figure 10Box plot of the differences between the EKO AOD with (no) CSR corrections and Cimel AOD versus AOD for the period April–September 2019 at IZO in blue (red). Lower and upper boundaries for each box are the 25th and 75th percentiles; the solid line is the median value; the crosses indicate values out of the 1.5-fold box area (outliers); and hyphens are the maximum and minimum values. Shadings show the range of uncertainty of Cimel (±0.02 for the UV range and ±0.01 for VIS and near-IR ranges; Eck et al., 1999).
The box plots of MB differences (EKO AOD–Cimel AOD) for different AOD intervals are presented in Fig. 10. In general, it can be seen that a significant improvement in the AOD retrievals is found after the CSR correction, with the corrected AOD medians being closer to 0 in all wavelengths. The improvement in AOD for AOD >0.1 conditions (20 % of the data for 340 and 380 nm, and 16 % for the rest of the wavelengths) is remarkable, as already mentioned in the CSR-correction section. The scatter is also significantly reduced for all wavelengths and aerosol loads, except in the 340 nm UV channel. This is mainly attributed to the following: the instrumental error in the spectral range between 300 and 350 nm (17.2 %), of which 6 % corresponds to stray light and 6 % corresponds to measurement repeatability (Zong et al., 2006); to the different FWHM between EKO (7 nm) and CIMEL (2 nm) at 340 nm; and to the fact that Rayleigh and aerosol scattering are higher in the UV range (Cuevas et al., 2019). Despite these drawbacks, the improvement in AOD is significant after performing a simple correction of the CSR estimated with libRadtran.
Table 5Linear AOD-correction equations (slope and intercept) at 340, 380, 440, 500, 675, and 870 nm obtained with data measured from 1 April to 31 July 2019 at the Izaña Atmospheric Observatory. Validation of the linear AOD-correction equations was performed using data obtained between 1 August and 30 September 2019.
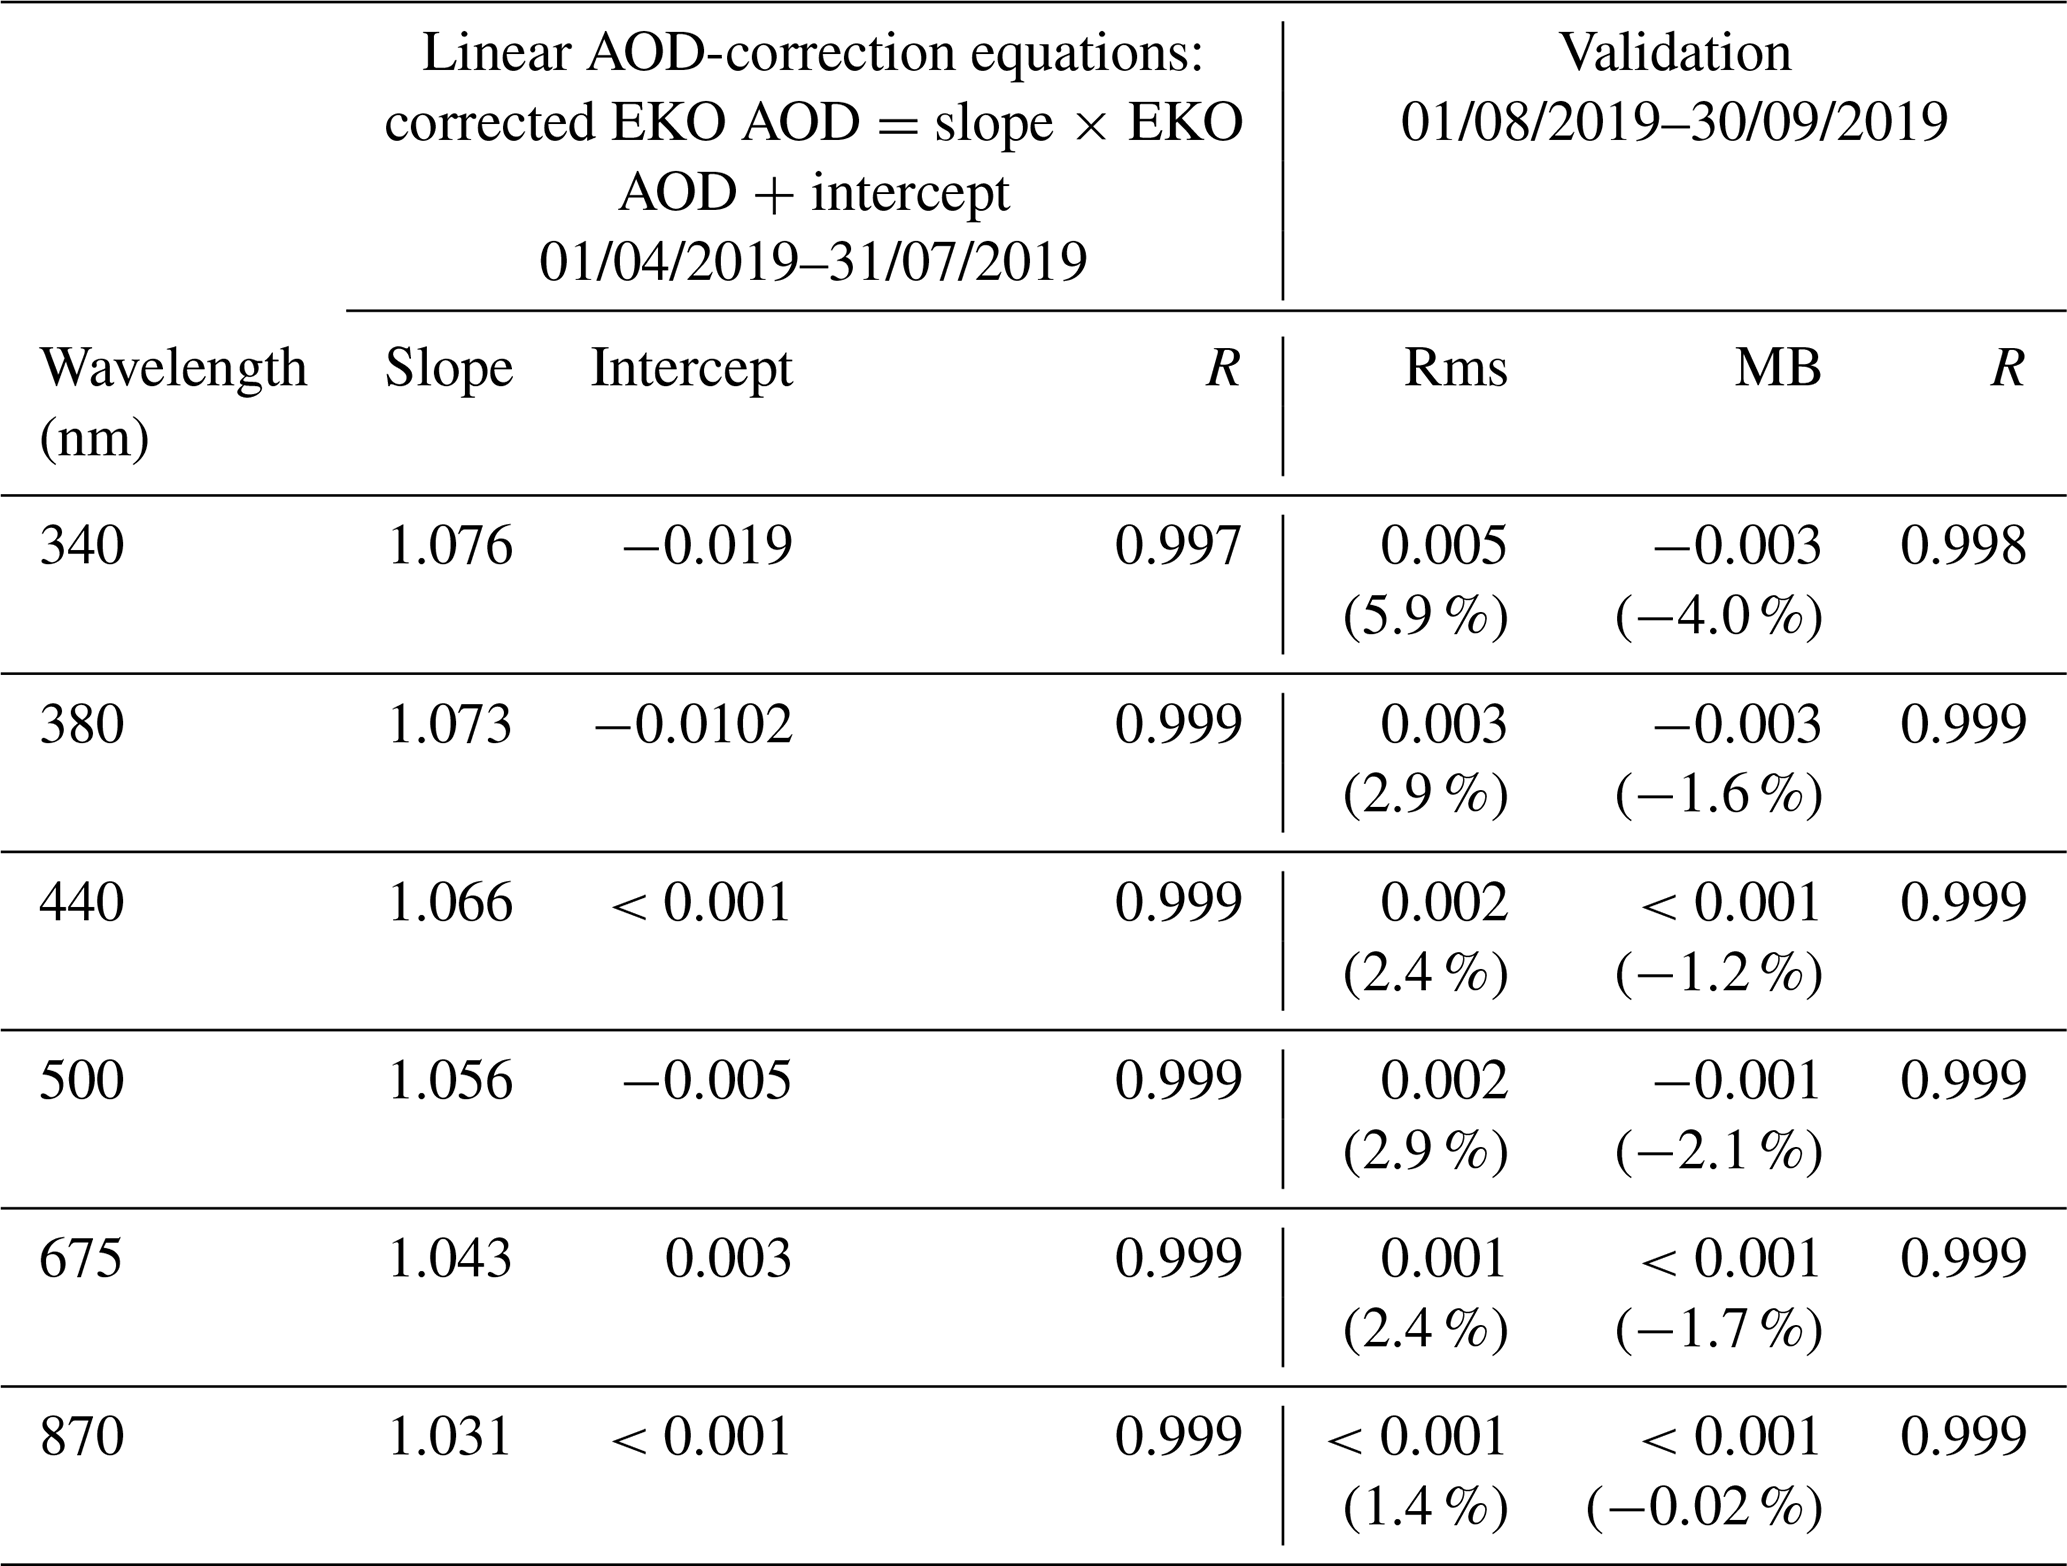
The linear AOD-correction equations were determined by using data measured from 1 April to 31 July 2019 (69 % of the data) at the Izaña Atmospheric Observatory (Table 5). The validation of these linear AOD-correction equations was performed by using an independent period of data (between 1 August and 30 September 2019; 31 % of the data). Note that abs(MB) ≤1.6 % for all wavelengths, except for 340 nm for which a significantly larger MB (−4.0 %) is registered. In any case, it should be noted that the CSR correction applied in this study has been made in the presence of mineral dust. It would be necessary to verify that these CRS corrections have similar validity under the moderate-to-high influence of other types of aerosols, such as marine or biomass-burning aerosols.
In order to check the quality of EKO AOD, we have applied the WMO traceability criteria (WMO, 2005) defined for finite FOV instruments as follows:
where ma is the optical air mass. The percentage of data meeting the WMO traceability requirements (95 % of the AOD differences of an instrument compared to the WMO standards lie within specific limits) is >95 % at 500, 675, and 870 nm when taking the AERONET–Cimel as the reference (Fig. 11).
The percentage of EKO AOD data meeting the WMO criteria increases considerably when we include the CSR corrections, by increasing from 67 % to more than 86 % at 340 nm and above 95 % for the rest of the channels taken into account. The poorest results shown by the 340 nm channel (86 %) might be partially explained by the EKO's 7nm FWHM influence on the smaller 2 and 4 nm bandpass UV channels. The instrument uncertainty is larger in the UV range, which is mostly associated with stray light in the instrument's inner optics (Zong et al., 2006).
When focusing the analysis on relatively high AOD (AOD >0.10), we found that the percentage of AOD differences from the WMO U95 limits were ∼3.5 % (0.8 % of the data) at 380 nm and 0.6 % (0.3 % of the data) at 870 nm, which is consistent with the lower percentages of AOD differences from the WMO U95 reported by Cuevas et al. (2019) when comparing GAW–PFR (FOV ) and AERONET–Cimel radiometers that present a lower difference in FOV (1.2∘).
In this paper, we present the characterization of an EKO MS-711 spectroradiometer. The instrument was calibrated at the Izaña Atmospheric Observatory by using the Langley plot method between April and September 2019. This calibration has been compared to the lamp calibration performed at the EKO Instruments factory in 2016, by obtaining relative differences ≤2.3 % and 3.1 % in the VIS and near-IR range respectively. These results indicate a high spectral stability of the instrument in this 3-year time period (2016–2019).
The EKO MS-711 has been designed for spectral solar DNI measurements, and therefore it has a relatively high FOV (5∘), which is double the FOV recommended by WMO for AOD radiometers and 4 times larger than the AERONET–Cimel FOV. This difference in FOV might lead to a significant difference in near-forward scattering under relatively high aerosol content, which results in a small, but significant, AOD underestimation, especially in the UV range.
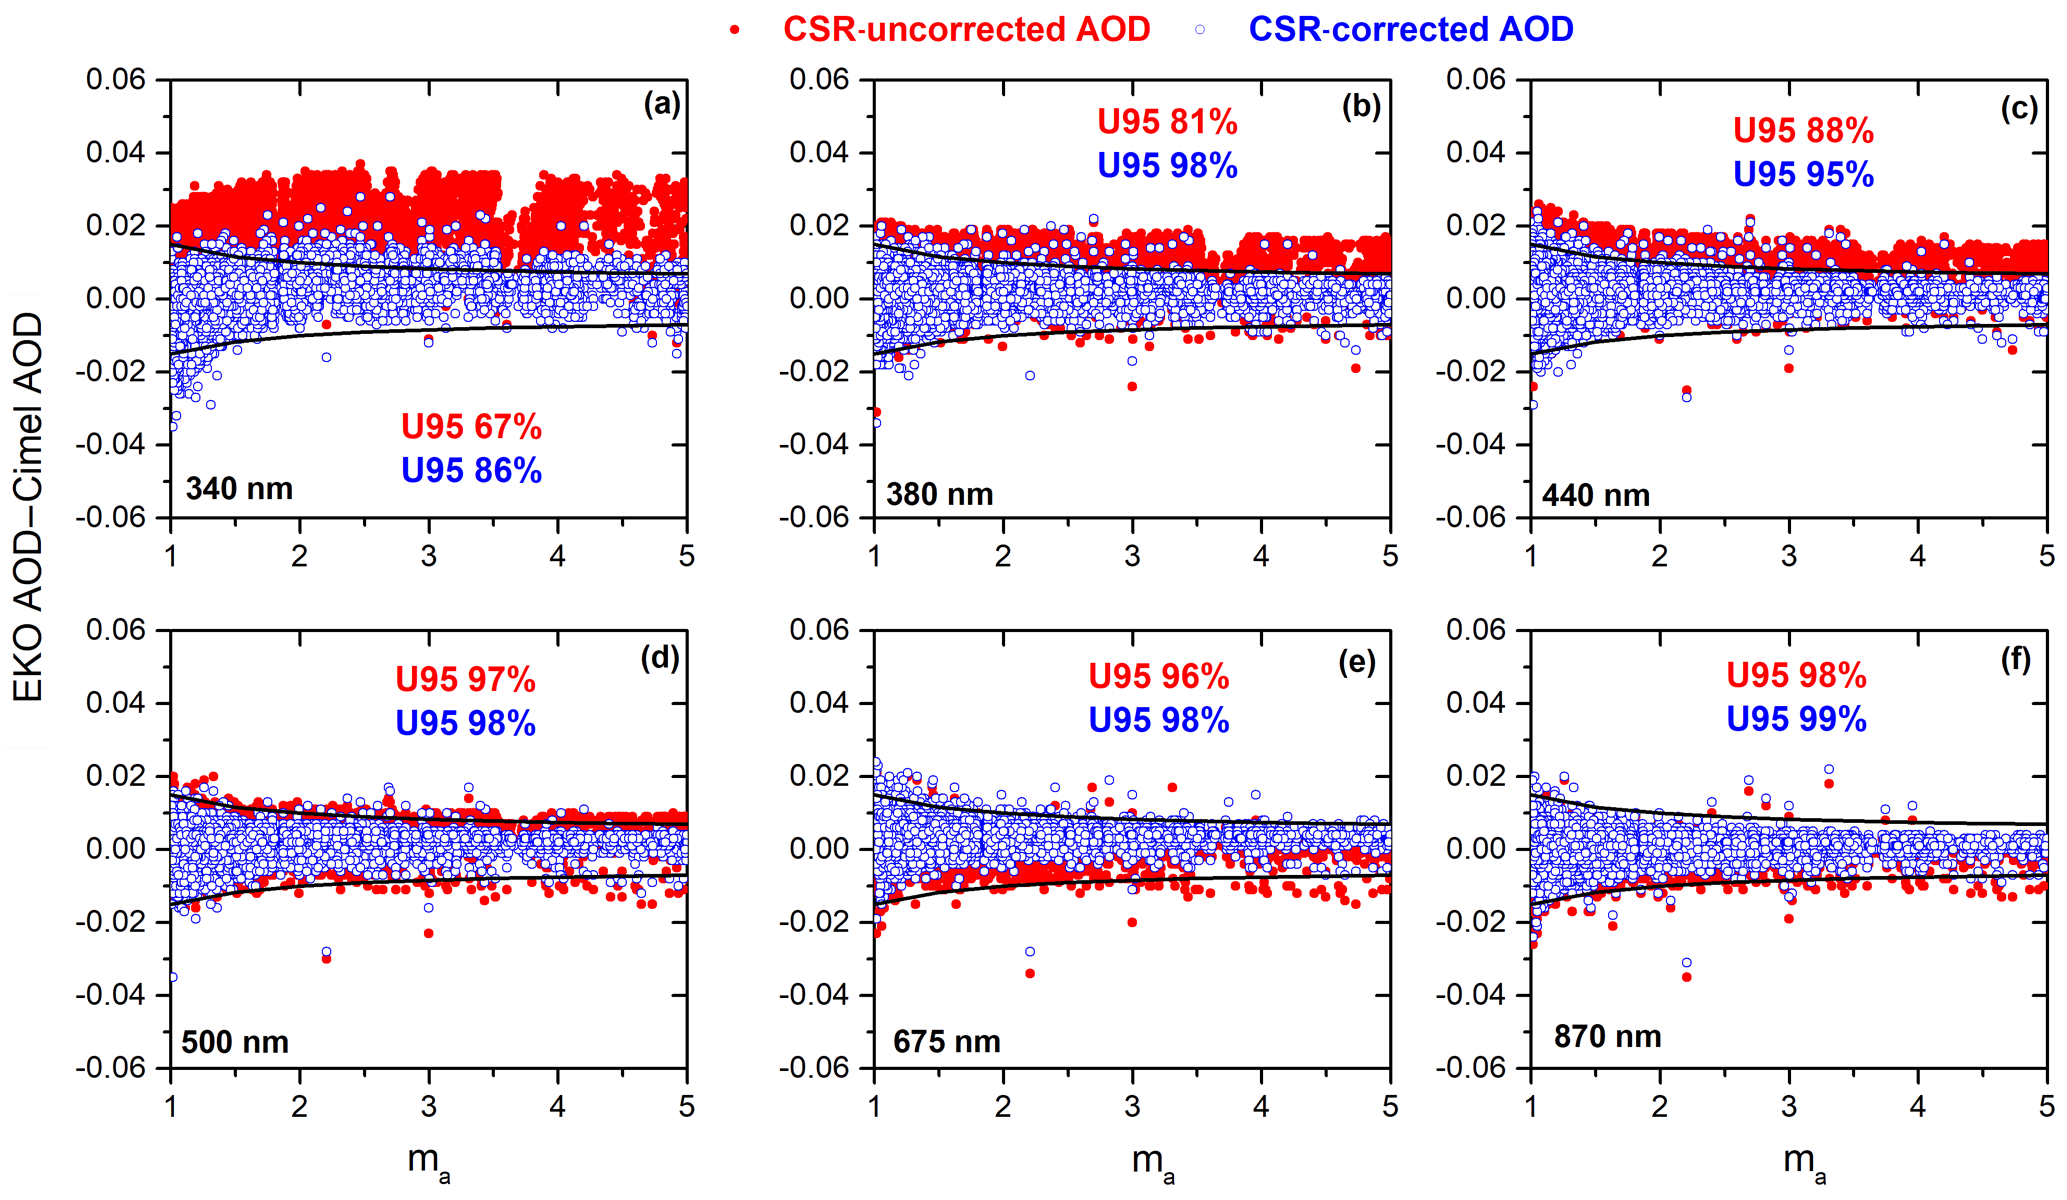
Figure 11AOD differences (EKO AOD–Cimel AOD) versus the optical air mass (ma). Black lines represent the U95 uncertainty limits.
However, the AOD retrievals from an EKO MS-711 spectral DNI measurements show a rather good agreement with those from an AERONET reference radiometer. The AOD comparison was held at the Izaña Atmospheric Observatory between April and September 2019. Quality assessment of the EKO MS-711 AOD has been performed by comparing it with coincident AOD from AERONET at 340, 380, 440, 500, 675, and 870 nm, by considering measurements from both instruments that are as close as 2 min apart, with a total of 14 706 analysed data pairs. The skill scores of the AOD comparison are fairly good, with an rms of 0.013 (24.6 %) at 340 and 380 nm, and 0.029 (19.5 %) for longer wavelengths (440, 500, 675, and 870 nm), and with AOD being underestimated by the EKO radiometer. The MB (EKO AOD–Cimel AOD) is 0.011 (19.7 %) for 340 and 380 nm, and 0.004 (10.6 %) for 440, 500, 675, and 870 nm. These results improve considerably when we take into account the CSR corrections made to EKO AOD because of the higher EKO FOV. The CSR differences between EKO and AERONET–Cimel were obtained by using a libRadtran model. When comparing the EKO AOD-corrected values, the rms is reduced to 0.006 (14.9 %) at 340 and 380 nm and to 0.005 (11.1 %) for longer wavelengths, while MB is reduced to <0.001 (1.3 %) for 340 and 380 nm, and <0.001 (0.4 %) for 500, 675, and 870 nm. These values are within the Cimel instrumental uncertainty (±0.01 in the VIS and near-IR, and ±0.02 in the UV ranges).
Following WMO recommendations, we have analysed the percentage of EKO AOD–Cimel AOD differences within the WMO U95 limits defined for finite FOV instruments, and we found that with no CSR corrections ≥96 % of the AOD differences fell within the WMO U95 limits at 500, 675, and 870 nm. After applying the CSR corrections, the percentage of AOD differences within the WMO U95 limits were >95 % for 380, 440, 500, 675, and 870 nm, while for 340 nm the percentage of AOD differences within the WMO U95 increased only to a modest 86 %. The known greater AOD uncertainty in the UV range, along with stray-light problems not fully corrected in this instrument, seems to be the reason behind the poorer AOD agreement with AERONET–Cimel at 340 nm.
The EKO MS-711 has proven to be an instrument which, despite having been designed for solar radiation measurements, can provide high-quality AOD measurements in the VIS and near-IR ranges, with excellent results when compared to the AERONET–Cimel reference radiometer, which, in turn, has shown a very good AOD traceability with the WORCC's World AOD reference.
| AEMET | State Meteorological Agency of Spain |
| AERONET | AErosol RObotic NETwork |
| AOD | Aerosol optical depth |
| BAPMoN | Background Atmospheric Pollution Monitoring Network |
| BSRN | Baseline Surface Radiation Network |
| CIMO | Commission for Instruments and Methods of Observation |
| CSR | Circumsolar radiation |
| DNI | Direct normal irradiance |
| FOV | Field of view |
| FTIR | Fourier-transform infrared spectrometer |
| FWHM | Full width at half maximum |
| GAW–PFR | Global Atmosphere Watch and Precision Filter Radiometer network |
| GNSS | Global navigation satellite system |
| IARC | Izaña Atmospheric Research Center |
| IZO | Izaña Atmospheric Observatory |
| MB | Mean bias |
| NDACC | Network for the Detection of Atmospheric Composition Change |
| NIST | National Institute of Standards and Technology |
| NOAA | National Oceanic and Atmospheric Administration |
| OPAC | Optical properties of aerosols and clouds |
| PMOD–WRC | Physical–Meteorological Observatory and World Radiation Center |
| PSR | Precision Solar Spectroradiometer |
| Rms | Root mean square |
| SKYNET | Sky radiometer network |
| SURFRAD | Surface Radiation Budget Network |
| SZA | Solar zenith angle |
| UV | Ultraviolet range |
| VIS | Visible range |
| WMO | World Meteorological Organization |
| WORCC | World Optical Depth Research and Calibration Center |
Table B1Numerical values of the CR (%) simulations for SZA 30∘ at sea level for AOD values between 0 and 2, at 500 nm, for different types of aerosols for FOV of 5∘.
The AERONET–Cimel data from the Izaña Atmospheric Observatory (“Izaña”) are available on the AERONET website: https://aeronet.gsfc.nasa.gov/cgi-bin/data_display_aod_v3?site=Izana&nachal=2&level=3&place_code=10 (Holben et al., 1998). The EKO MS-711 data might be available upon request from EKO Instruments and Izaña WMO–CIMO test bed.
RDG-C and EC-A designed the structure and methodology of the paper, and wrote the main part of the paper. RDG-C computed all the calculations performed in the paper. AB discussed the modelling results and participated in the AOD retrieval and the Langley calibration analysis. VEC provided interesting ideas used in this paper and advice based on her experience in spectroradiometry. RR performed the maintenance and daily checks of the EKO MS-711 spectroradiometer. MP provided detailed technical information and calibrations of the EKO MS-711 spectroradiometer. KH enabled the EKO MS-711 used in this study to be evaluated in the WMO–CIMO Izaña test bed by taking care of all the associated logistics. All authors discussed the results and contributed to the final paper.
The authors declare that they have no conflict of interest.
This paper has been developed within the framework of the activities of the World Meteorological Organization (WMO) Commission for Instruments and Methods of Observation (CIMO) Izaña test bed for aerosols and water vapour remote-sensing instruments. The authors are grateful to EKO Instruments for their availability and that they allowed for the testing and independent evaluation of the EKO MS-711 spectroradiometer by the WMO–CIMO Izaña test bed. The libRadtran radiative transfer model has been used to estimate the circumsolar radiation. AERONET sun photometers at the Izaña Atmospheric Observatory have been calibrated within the AERONET–Europe Transnational Access (TNA). We also acknowledge our colleague Celia Milford for improving the English of the manuscript.
This research has received funding from the European Union’s Horizon 2020 Research and Innovation Programme (grant no. 654109; ACTRIS-2). The funding from MINECO (grant no. CTM2015-66742-R) and Junta de Castilla y León (grant no. VA100P17) is also gratefully acknowledged. Much of this study has been performed in the framework of the WMO–CIMO Izaña test bed for aerosols and water vapour remote-sensing instruments and has been funded by the State Meteorological Agency of Spain (AEMET).
This paper was edited by Saulius Nevas and reviewed by Lionel Doppler and two anonymous referees.
Ahern, F. J., Gauthier, R. P., Teillet, P. M., Sirois, J., Fedosejevs, G., and Lorente, D.: Investigation of continental aerosols with high-spectral-resolution solar-extinction measurements, Appl. Optics, 30, 5276–5287, https://doi.org/10.1364/AO.30.005276, 1991. a
Anderson, G., Clough, S., Kneizys, F., Chetwynd, J., and Shettle, E.: AFGL atmospheric constituent profiles, Environ. Res., 954, 1–46, 1986. a
Ångström, A.: On the atmospheric transmission of sun radiation. II, Geogr. Ann., 12, 130–159, 1930. a
Ångström, A.: Techniques of determinig the turbidity of the atmosphere, Tellus, 13, 214–223, 1961. a
Ångström, A.: Apparent solar constant variations and their relation to the variability of atmospheric transmission, Tellus, 22, 205–218, https://doi.org/10.1111/j.2153-3490.1970.tb01522.x, 1970. a
Augustine, J. A., Hodges, G. B., Dutton, E. G., Michalsky, J. J., and Cornwall, C. R.: An aerosol optical depth climatology for NOAA's national surface radiation budget network (SURFRAD), J. Geophys. Res.-Atmos., 113, D11, https://doi.org/10.1029/2007JD009504, 2008. a
Barreto, A., Cuevas, E., Pallé, P., Romero, P. M., Guirado, C., Wehrli, C. J., and Almansa, F.: Recovering long-term aerosol optical depth series (1976–2012) from an astronomical potassium-based resonance scattering spectrometer, Atmos. Meas. Tech., 7, 4103–4116, https://doi.org/10.5194/amt-7-4103-2014, 2014. a, b
Berjón, A., Barreto, A., Hernández, Y., Yela, M., Toledano, C., and Cuevas, E.: A 10-year characterization of the Saharan Air Layer lidar ratio in the subtropical North Atlantic, Atmos. Chem. Phys., 19, 6331–6349, https://doi.org/10.5194/acp-19-6331-2019, 2019. a
Berk, A., Acharya, P. K., Bernstein, L. S., Anderson, G. P., Chetwynd Jr., J. H., and Hoke, M. L.: Reformulation of the MODTRAN band model for higher spectral resolution, in: Algorithms for Multispectral, Hyperspectral, and Ultraspectral Imagery VI, 4049, 190–198, International Society for Optics and Photonics, https://doi.org/10.1117/12.410340, 2000. a
Blanc, P., Espinar, B., Geuder, N., Gueymard, C., Meyer, R., Pitz-Paal, R., Reinhardt, B., Renné, D., Sengupta, M., Wald, L., and Wilbert, S.: Direct normal irradiance related definitions and applications: The circumsolar issue, Sol. Energ., 110, 561–577, https://doi.org/10.1016/j.solener.2014.10.001, 2014. a, b, c, d
Bodhaine, B. A., Wood, N. B., Dutton, E. G., and Slusser, J. R.: On Rayleigh optical depth calculations, J. Atmos. Ocean. Tech., 16, 1854–1861, 1999. a
Brion, J., Chakir, A., Daumont, D., Malicet, J., and Parisse, C.: High-resolution laboratory absorption cross section of O3. Temperature effect, Chem. Phys. Lett., 213, 610–612, 1993. a
Brion, J., Chakir, A., Charbonnier, J., Daumont, D., Parisse, C., and Malicet, J.: Absorption spectra measurements for the ozone molecule in the 350–830 nm region, J. Atmos. Chem., 30, 291–299, 1998. a
Burrows, J., Richter, A., Dehn, A., Deters, B., Himmelmann, S., Voigt, S., and Orphal, J.: Atmospheric remote-sensing reference data from GOME-2 temperature-dependent absorption cross sections of O3 in the 231–794 nm range, J. Quant. Spectrosc. Ra., 61, 509–517, https://doi.org/10.1016/S0022-4073(98)00037-5, 1999. a
Cachorro, V., Casanova, J., and de Frutos, A.: The influence of Angstrom parameters on calculated direct solar spectral irradiances at high turbidity, Sol. Energ., 39, 399–407, https://doi.org/10.1016/S0038-092X(87)80058-0, 1987. a
Cachorro, V., Durán, P., and De Frutos, A.: Retrieval of vertical ozone content using the Chappuis band with high spectral resolution solar radiation measurements, Geophys. Res. Lett., 23, 3325–3328, https://doi.org/10.1029/96GL03239, 1996. a
Cachorro, V. E., Durán, P., Vergaz, R., and de Frutos, A. M.: Measurements of the atmospheric turbidity of the north-centre continental area in Spain: Spectral aerosol optical depth and Ångström turbidity parameters, J. Aerosol Sci., 31, 687–702, https://doi.org/10.1016/S0021-8502(99)00552-2, 2000. a, b
Cachorro, V. E., Berj\ón, A., Toledano, C., Mogo, S., Prats, N., de Frutos, A. M., Vilaplana, J. M., Sorribas, M., De La Morena, B. A., Gröbner, J., and Laulainen, N.: Detailed Aerosol Optical Depth Intercomparison between Brewer and Li-Cor 1800 Spectroradiometers and a Cimel Sun Photometer, J. Atmos. Ocean. Tech., 26, 1558–1571, https://doi.org/10.1175/2009JTECHA1217.1, 2009. a, b
Cuevas, E., Milford, C., Bustos, J. J., del Campo-Hernández, García, O., D., G. R., Gómez-Peláez, Guirado-Fuentes, C., Marrero, C., Prats, N., Ramos, R., Redondas, A., Reyes, E., Rodríguez, S., Romero-Campos, P., Scheneider, M., Belmonte, J., Yela, M., Almansa, F., Barreto, A., López-Solano, C., Basart, S., Terradellas, E., Afonso, S., Bayo, C., Berjón, A., Bethencourt, J., Carreño, V., Castro, N. J., Cruz, A. M., Damas, M., De Ory-Ajamil, F., García, M. I., Gómez-Trueba, V., González, Y., Hernández, C., Hernández, Y., Hernández-Cruz, B., Jover, M., León, S., López-Fernández, R., López-Solano, J., Rodríguez, E., Rodríguez-Franco, J., Rodríguez-Valido, M., Sálamo, C., Sanromá, E., Santana, D., Santo-Tomás, F., Sepúlveda, E., Sierra, M., and Sosa, E.: Izaña Atmospheric Research Center Activity Report 2015–2016, State Meteorological Agency (AEMET), 2017. a
Cuevas, E., Romero-Campos, P. M., Kouremeti, N., Kazadzis, S., Räisänen, P., García, R. D., Barreto, A., Guirado-Fuentes, C., Ramos, R., Toledano, C., Almansa, F., and Gröbner, J.: Aerosol optical depth comparison between GAW-PFR and AERONET-Cimel radiometers from long-term (2005–2015) 1 min synchronous measurements, Atmos. Meas. Tech., 12, 4309–4337, https://doi.org/10.5194/amt-12-4309-2019, 2019. a, b, c, d, e, f
Eck, T., Holben, B., Reid, J., Dubovik, O., Smirnov, A., O'neill, N., Slutsker, I., and Kinne, S.: Wavelength dependence of the optical depth of biomass burning, urban, and desert dust aerosols, J. Geophys. Res.-Atmos., 104, 31333–31349, https://doi.org/10.1029/1999JD900923, 1999. a, b, c
Egli, L., Gröbner, J., Hülsen, G., Bachmann, L., Blumthaler, M., Dubard, J., Khazova, M., Kift, R., Hoogendijk, K., Serrano, A., Smedley, A., and Vilaplana, J.-M.: Quality assessment of solar UV irradiance measured with array spectroradiometers, Atmos. Meas. Tech., 9, 1553–1567, https://doi.org/10.5194/amt-9-1553-2016, 2016. a
Emde, C., Buras-Schnell, R., Kylling, A., Mayer, B., Gasteiger, J., Hamann, U., Kylling, J., Richter, B., Pause, C., Dowling, T., and Bugliaro, L.: The libRadtran software package for radiative transfer calculations (version 2.0.1), Geosci. Model Dev., 9, 1647–1672, https://doi.org/10.5194/gmd-9-1647-2016, 2016. a
Emilio, M., Kuhn, J. R., Bush, R. I., and Scholl, I. F.: Measuring the solar radious from space during the 2003 and 2006 mercury transits, Astrophysical, 750, 135, https://doi.org/10.1088/0004-637x/750/2/135, 2012. a
Estellés, V., Utrillas, M., Martínez-Lozano, J., Alcántara, A.,Alados-Arboledas, L., Olmo, F., Lorente, J., De Cabo, X., Cachorro, V., Horvath, H., Labajo, A., Sorribas, M., Díaz, J. P., Díaz, A. M., Silva, A. M., Elías, T., Pujadas, M., Rodrigues, J. A., Cañada, J., and García, Y.: Intercomparison of spectroradiometers and Sun photometers for the determination of the aerosol optical depth during the VELETA-2002 field campaign, J. Geophys. Res.-Atmos., 111, D17207, https://doi.org/10.1029/2005JD006047, 2006. a, b, c
García, M. I., Rodríguez, S., and Alastuey, A.: Impact of North America on the aerosol composition in the North Atlantic free troposphere, Atmos. Chem. Phys., 17, 7387–7404, https://doi.org/10.5194/acp-17-7387-2017, 2017. a
García, R. D., García, O. E., Cuevas, E., Cachorro, V. E., Romero-Campos, P. M., Ramos, R., and de Frutos, A. M.: Solar radiation measurements compared to simulations at the BSRN Izaña station. Mineral dust radiative forcing and efficiency study, J. Geophys. Res.-Atmos., 119, 179–194, https://doi.org/10.1002/2013JD020301, 2014. a
Gasteiger, J., Emde, C., Mayer, B., Buras, R., Buehler, S., and Lemke, O.: Representative wavelengths absorption parameterization applied to satellite channels and spectral bands, J. Quant. Spectrosc. Ra., 148, 99–115, https://doi.org/10.1016/j.jqsrt.2014.06.024, 2014. a
Giles, D. M., Sinyuk, A., Sorokin, M. G., Schafer, J. S., Smirnov, A., Slutsker, I., Eck, T. F., Holben, B. N., Lewis, J. R., Campbell, J. R., Welton, E. J., Korkin, S. V., and Lyapustin, A. I.: Advancements in the Aerosol Robotic Network (AERONET) Version 3 database – automated near-real-time quality control algorithm with improved cloud screening for Sun photometer aerosol optical depth (AOD) measurements, Atmos. Meas. Tech., 12, 169–209, https://doi.org/10.5194/amt-12-169-2019, 2019. a
Gröbner, J., Vergaz, R., Cachorro, V. E., Henriques, D., Lamb, K., Redondas, A., Vilaplana, J. M., and Rembges, D.: Intercomparison of aerosol optical depth measurements in the UVB using Brewer Spectrophotometers and a Li-Cor Spectrophotometer, Geophys. Res. Lett., 28, 1691–1694, https://doi.org/10.1029/2000GL012759, 2001. a
Gueymard, C.: SMARTS2: a simple model of the atmospheric radiative transfer of sunshine: algorithms and performance assessment, Florida Solar Energy Center Cocoa, FL, 1995.
Gueymard, C. A.: Parameterized transmittance model for direct beam and circumsolar spectral irradiance, Sol. Energ., 71, 325–346, https://doi.org/10.1016/S0038-092X(01)00054-8, 2001. a
Halthore, R. N., Schwartz, S. E., Michalsky, J. J., Anderson, G. P., Ferrare, R. A., Holben, B. N., and Ten Brink, H. M.: Comparison of model estimated and measured direct-normal solar irradiance, J. Geophys. Res.-Atmos., 102, 29991–30002, https://doi.org/10.1029/97JD02628, 1997. a
Hansen, J. E. and Travis, L. D.: Light scattering in planetary atmospheres, Space Sci. Rev., 16, 527–610, https://doi.org/10.1007/BF00168069, 1974. a
Hess, M., Koepke, P., and Schult, I.: Optical properties of aerosols and clouds: The software package OPAC, B. Am. Meteorol. Soc., 79, 831–844, https://doi.org/10.1175/1520-0477(1998)079<0831:OPOAAC>2.0.CO;2, 1998. a, b, c, d
Holben, B., Eck, T., Slutsker, I., Tanré, D., Buis, J., Setzer, A., Vermote, E., Reagan, J., Kaufman, Y., Nakajima, T., Lavenu, F., Jankowiak, I., and Smirnov, A.: AERONET–A Federated Instrument Network and Data Archive for Aerosol Characterization, Remote Sens. Environ., 66, 1–16, https://doi.org/10.1016/S0034-4257(98)00031-5, 1998. a
Holben, B. N., Tanré, D., Smirnov, A., Eck, T. F., Slutsker, I.,Abuhassan, N., Newcomb, W. W., Schafer, J. S., Chatenet, B., Lavenu, F., Kaufman, Y. J., Vande Castle, J., Setzer, A., Markham, B., Clark, D., Frouin, R., Halthore, R., Karneli, A., O'neill, N. T., Pietras, C., Pinker, C., Voss, K., and Zibordi, G.: An emerging ground-based aerosol climatology: Aerosol optical depth from AERONET, J. Geophys. Res.-Atmos., 106, 12067–12097, https://doi.org/10.1029/2001JD900014, 2001 (data available at: https://aeronet.gsfc.nasa.gov/cgi-bin/data_display_aod_v3?site=Izana&nachal=2&level=3&place_code=10, last access: 14 November 2019). a
IPCC: The Physical Science Basis. Intergovernmental Panel on Climate Change, https://doi.org/10.1017/CBO9781107415324, 2013. a
Kasten, F.: A new table and approximation formula for the relative optical air mass, Arch. Meteor. Geophys. B, 14, 206–223, 1966.
Kasten, F. and Young, A. T.: Revised optical air mass tables and approximation formula, Appl. Optics, 28, 4735–4738, https://doi.org/10.1364/AO.28.004735, 1989.
Kazadzis, S., Bais, A., Kouremeti, N., Gerasopoulos, E., Garane, K., Blumthaler, M., Schallhart, B., and Cede, A.: Direct spectral measurements with a Brewer spectroradiometer: absolute calibration and aerosol optical depth retrieval, Appl. Optics, 44, 1681–1690, https://doi.org/10.1364/AO.44.001681, 2005. a
Kazadzis, S., Veselovskii, I., Amiridis, V., Gröbner, J., Suvorina, A., Nyeki, S., Gerasopoulos, E., Kouremeti, N., Taylor, M., Tsekeri, A., and Wehrli, C.: Aerosol microphysical retrievals from precision filter radiometer direct solar radiation measurements and comparison with AERONET, Atmos. Meas. Tech., 7, 2013–2025, https://doi.org/10.5194/amt-7-2013-2014, 2014. a
Kazadzis, S., Kouremeti, N., Diémoz, H., Gröbner, J., Forgan, B. W., Campanelli, M., Estellés, V., Lantz, K., Michalsky, J., Carlund, T., Cuevas, E., Toledano, C., Becker, R., Nyeki, S., Kosmopoulos, P. G., Tatsiankou, V., Vuilleumier, L., Denn, F. M., Ohkawara, N., Ijima, O., Goloub, P., Raptis, P. I., Milner, M., Behrens, K., Barreto, A., Martucci, G., Hall, E., Wendell, J., Fabbri, B. E., and Wehrli, C.: Results from the Fourth WMO Filter Radiometer Comparison for aerosol optical depth measurements, Atmos. Chem. Phys., 18, 3185–3201, https://doi.org/10.5194/acp-18-3185-2018, 2018a. a, b, c, d
Kazadzis, S., Kouremeti, N., Nyeki, S., Gröbner, J., and Wehrli, C.: The World Optical Depth Research and Calibration Center (WORCC) quality assurance and quality control of GAW-PFR AOD measurements, Geosci. Instrum. Method. Data Syst., 7, 39–53, https://doi.org/10.5194/gi-7-39-2018, 2018b. a
Kiedron, P. W. and Michalsky, J. J.: Non-parametric and least squares Langley plot methods, Atmos. Meas. Tech., 9, 215–225, https://doi.org/10.5194/amt-9-215-2016, 2016. a
Komhyr, W. D., Grass, R. D., and Leonard, R. K.: Dobson spectrophotometer 83: A standard for total ozone measurements, 1962–1987, J. Geophys. Res.-Atmos., 94, 9847–9861, 1989.
Kurucz, R. L.: Synthetic infrared spectra, in: Infrared solar physics, 523–531, Springer, 1994. a
López-Solano, J., Redondas, A., Carlund, T., Rodriguez-Franco, J. J., Diémoz, H., León-Luis, S. F., Hernández-Cruz, B., Guirado-Fuentes, C., Kouremeti, N., Gröbner, J., Kazadzis, S., Carreño, V., Berjón, A., Santana-Díaz, D., Rodríguez-Valido, M., De Bock, V., Moreta, J. R., Rimmer, J., Smedley, A. R. D., Boulkelia, L., Jepsen, N., Eriksen, P., Bais, A. F., Shirotov, V., Vilaplana, J. M., Wilson, K. M., and Karppinen, T.: Aerosol optical depth in the European Brewer Network, Atmos. Chem. Phys., 18, 3885–3902, https://doi.org/10.5194/acp-18-3885-2018, 2018. a
Major, G.: A method for determining the circumsolar sky function, Tellus, 32, 340–347, https://doi.org/10.1111/j.2153-3490.1980.tb00961.x, 1980. a
Mayer, B.: Radiative transfer in the cloudy atmosphere, in: EPJ Web of Conferences, vol. 1, 75–99, EDP Sciences, https://doi.org/10.1140/epjconf/e2009-00912-1, 2009. a
Mayer, B. and Kylling, A.: Technical note: The libRadtran software package for radiative transfer calculations - description and examples of use, Atmos. Chem. Phys., 5, 1855–1877, https://doi.org/10.5194/acp-5-1855-2005, 2005. a, b
Michalsky, J., Liljegren, J., and Harrison, L.: A comparison of sun photometer derivations of total column water vapor and ozone to standard measures of same at the Southern Great Plains Atmospheric Radiation Measurement site, J. Geophys. Res.-Atmos., 100, 25995–26003, https://doi.org/10.1029/95JD02706, 1995. a
Neumann, A. and Witzke, A.: The influence of sunshape on the DLR solar furnace beam, Sol. Energ., 66, 447–457, https://doi.org/10.1016/S0038-092X(99)00048-1, 1999. a
Pastiels, R.: Contribution à l'étude du problème des méthodes actinométriques, Publ. A11, Institut Royal Météorologique de Belgique, Uccle, Belgium, 1959. a
Pierluissi, J. H. and Tsai, C.-M.: Molecular transmittance band model for oxygen in the visible, Appl. Optics, 25, 2458–2460, https://doi.org/10.1364/AO.25.002458, 1986. a
Pierluissi, J. H. and Tsai, C.-M.: New LOWTRAN models for the uniformly mixed gases, Appl. Optics, 26, 616–618, https://doi.org/10.1364/AO.26.000616, 1987. a
Pó, M., Hoogendijk, K., Beuttell, W., Kazunori, S., and Takeuchi, E.: Direct Spectral Irradiance Measurements from Rotating Shadowband EKO Grating Spectroradiometer, in: 2018 IEEE 7th World Conference on Photovoltaic Energy Conversion (WCPEC) (A Joint Conference of 45th IEEE PVSC, 28th PVSEC & 34th EU PVSEC), 2337–2340, IEEE, https://doi.org/10.1109/PVSC.2018.8547445, 2018. a
Räisänen, P. and Lindfors, A. V.: On the Computation of Apparent Direct Solar Radiation, J. Atmos. Sci., 76, 2761–2780, https://doi.org/10.1175/JAS-D-19-0030.1, 2019. a
Raptis, P.-I., Kazadzis, S., Gröbner, J., Kouremeti, N., Doppler, L., Becker, R., and Helmis, C.: Water vapour retrieval using the Precision Solar Spectroradiometer, Atmos. Meas. Tech., 11, 1143–1157, https://doi.org/10.5194/amt-11-1143-2018, 2018. a, b, c
Redondas, A., Nevas, S., Berjón, A., Sildoja, M.-M., León-Luis, S. F., Carreño, V., and Santana-Díaz, D.: Wavelength calibration of Brewer spectrophotometer using a tunable pulsed laser and implications to the Brewer ozone retrieval, Atmos. Meas. Tech., 11, 3759–3768, https://doi.org/10.5194/amt-11-3759-2018, 2018. a
Reinhardt, B.: On the retrieval of circumsolar radiation from satellite observations and weather model output, PhD thesis, LMU München, Faculty of Physics, 2013. a
Romero Campos, P. M., Cuevas Agulló, E., Ramos López, R., Valdés Pérez de Vargas, M., and Schneider, M.: Programa de vapor de agua en columna del Centro de Investigación Atmosférica de Izaña: Análisis e Intercomparación de diferentes Técnicas de Medida, NIPO 784-09-009-9, Agencia Estatal de Meteorologia, Ministerio de Medio Ambiente, y Medio Rural y Marino, 2009. a
Rothman, L., Gordon, I., Babikov, Y., Barbe, A., Benner, D. C., Bernath, P., Birk, M., Bizzocchi, L., Boudon, V., Brown, L., Campargue, A., Chance, K., Cohen, E., Coudert, L., Devi, V., Drouin, B., Fayt, A., Flaud, J.-M., Gamache, R., Harrison, J., Hartmann, J.-M., Hill, C., Hodges, J., Jacquemart, D., Jolly, A., Lamouroux, J., Roy, R. L., Li, G., Long, D., Lyulin, O., Mackie, C., Massie, S., Mikhailenko, S., Müller, H., Naumenko, O., Nikitin, A., Orphal, J., Perevalov, V., Perrin, A., Polovtseva, E., Richard, C., Smith, M., Starikova, E., Sung, K., Tashkun, S., Tennyson, J., Toon, G., Tyuterev, V., and Wagner, G.: The HITRAN2012 molecular spectroscopic database, J. Quant. Spectrosc. Ra., 130, 4–50, https://doi.org/10.1016/j.jqsrt.2013.07.002, 2013. a, b, c
Schmid, B., Michalsky, J., Halthore, R., Beauharnois, M., Harrison, L., Livingston, J., Russell, P., Holben, B., Eck, T., and Smirnov, A.: Comparison of aerosol optical depth from four solar radiometers during the fall 1997 ARM intensive observation period, Geophys. Res. Lett., 26, 2725–2728, https://doi.org/10.1029/1999GL900513, 1999. a
Schmid, B., Michaslky, J. J., Slater, D. W., Barnard, J. C., Halthore, R. N., Liljegren, J. C., Holben, B. N., Eck, T. F., Livingston, J. M., Russell, P. B., Ingold, T., and Slutsker, I.: Comparison of columnar water-vapor measurements from solar transmittance methods, Appl. Optics, 40, 1886–1896, https://doi.org/10.1364/AO.40.001886, 2001. a
Schneider, M., Blumenstock, T., Chipperfield, M. P., Hase, F., Kouker, W., Reddmann, T., Ruhnke, R., Cuevas, E., and Fischer, H.: Subftropical trace gas profiles determined by ground-based FTIR spectroscopy at Izaña (28° N, 16° W): Five-year record, error analysis, and comparison with 3-D CTMs, Atmos. Chem. Phys., 5, 153–167, https://doi.org/10.5194/acp-5-153-2005, 2005. a
Sengupta, M., Habte, A. M., Xie, Y., Lopez, A. J., Dooraghi, M., Kutchenreiter, M. C., Andreas, A. M., Reda, I. M., Maclaurin, G. J., Foster, M. J., and Gueymard, C.: Solar Resource Calibration, Measurement, and Dissemination: Final Report FY 2016-FY 2018, Tech. rep., National Renewable Energy Lab. (NREL), Golden, CO, USA, https://doi.org/10.2172/1513198, 2019. a
Shaw, G. E.: Sun Photometry, B. Am. Meteorol. Soc., 64, 4–10, https://doi.org/10.1175/1520-0477(1983)064<0004:SP>2.0.CO;2, 1983. a, b
Shaw, G. E., Reagan, J. A., and Herman, B. M.: Investigations of atmospheric extinction using direct solar radiation measurements made with a multiple wavelength radiometer, J. Appl. Meteorol., 12, 374–380, https://doi.org/10.1175/1520-0450(1973)012<0374:IOAEUD>2.0.CO;2, 1973. a
Sinyuk, A., Holben, B. N., Smirnov, A., Eck, T. F., Slutsker, I., Schafer, J. S., Giles, D. M., and Sorokin, M.: Assessment of error in aerosol optical depth measured by AERONET due to aerosol forward scattering, Geophys. Res. Lett., 39, L23806, https://doi.org/10.1029/2012GL053894, 2012. a
Stamnes, K., Tsay, S.-C., Wiscombe, W., and Jayaweera, K.: Numerically stable algorithm for discrete-ordinate-method radiative transfer in multiple scattering and emitting layered media, Appl. Optics, 27, 2502–2509, https://doi.org/10.1364/AO.27.002502, 1988. a, b, c
Stamnes, K., Tsay, S.-C., Wiscombe, W., and Laszlo, I.: DISORT, a general-purpose Fortran program for discrete-ordinate-method radiative transfer in scattering and emitting layered media: documentation of methodology, Tech. rep., Tech. rep., Dept. of Physics and Engineering Physics, Stevens Institute of Technology, Hoboken, NJ 07030, 2000. a
Takamura, T. and Nakajima, T.: Overview of SKYNET and its activities, Optica Pura y Aplicada, 37, 3303–3308, 2004. a
Toledano, C., González, R., Fuertes, D., Cuevas, E., Eck, T. F., Kazadzis, S., Kouremeti, N., Gröbner, J., Goloub, P., Blarel, L., Román, R., Barreto, Á., Berjón, A., Holben, B. N., and Cachorro, V. E.: Assessment of Sun photometer Langley calibration at the high-elevation sites Mauna Loa and Izaña, Atmos. Chem. Phys., 18, 14555–14567, https://doi.org/10.5194/acp-18-14555-2018, 2018. a, b
Vergaz, R., Cachorro, V. E., De Frutos, Ã. M., Vilaplana, J. M., and De La Morena, B. A.: Columnar characteristics of aerosols by spectroradiometer measurements in the maritime area of the Cadiz Gulf (Spain), Int. J. Climatol., 25, 1781–1804, https://doi.org/10.1002/joc.1208, 2005. a
Wehrli, C.: Calibrations of filter radiometers for determination of atmospheric optical depth, Metrologia, 37, 419, https://doi.org/10.1088/0026-1394/37/5/16,, 2000. a
Wehrli, C.: GAWPFR: A network of aerosol optical depth observations with precision filter radiometers, Global Atmosphere Watch, p. 36, 2005. a
Wehrli, C.: Precision Filter Radiometer Documentation,Version 4.0, 38 pp., Davos Dorf, 2008. a
WMO: Recent progress in sunphotometry: determination of the aerosol optical depth, WMO/TD-No. 143, GAW Report-No. 43, 1986. a
WMO: WMO/GAW Experts Workshop on a Global Surface-Based Network for Long Term Observations of Column Aerosol Optical Properties,GAW Report No. 162, WMO TD No. 1287, available at: https://library.wmo.int/pmb_ged/wmo-td_1287.pdf (last access: 7 November 2019), 2005. a
WMO: Fourth WMO Workshop on the Impact of Various Observing Systems on Numerical Weather Prediction WMO/TD No. 1450, World Weather Watch, available at: https://www.wmo.int/pages/prog/www/OSY/Meetings/NWP-4-Geneva2008/Abridged_Version.pdf (last access: 14 November 2019), 2008. a, b
WMO: Commission for Instruments and Methods of Observation, Sixteenth session WMO no. 1138, Saint Petersburg, Secretariat of the World Meteorological Organization, 2014. a
WMO: WMO/GAW Aerosol Measurement Procedures,Guidelines and Recommendations, 2nd Edition, WMO-No. 1177, GAW Report-No. 227, Guidelines and Recommendations, available at: https://library.wmo.int/doc_num.php?explnum_id=3073 (last access: 7 November 2019), 2016. a, b, c
Yoon, H. W., Sperfeld, P., Yousef, S. G., and Metzdorf, J.: NIST-PTB measurements of the radiometric temperatures of a high-temperature black body using filter radiometers, Metrologia, 37, 377, https://doi.org/10.1088/0026-1394/37/5/7, 2000. a
Zong, Y., Brown, S. W., Johnson, B. C., Lykke, K. R., and Ohno, Y.: Simple spectral stray light correction method for array spectroradiometers, Appl. Optics, 45, 1111–1119, https://doi.org/10.1364/AO.45.001111, 2006. a, b