the Creative Commons Attribution 4.0 License.
the Creative Commons Attribution 4.0 License.
 | 29 May 2020
The CopterSonde: an insight into the development of a smart unmanned aircraft system for atmospheric boundary layer research
Brian R. Greene
Tyler M. Bell
William Doyle
Joshua J. Martin
Elizabeth A. Pillar-Little
Phillip B. Chilson
The CopterSonde is an unmanned aircraft system (UAS) developed in house by a team of engineers and meteorologists at the University of Oklahoma. The CopterSonde is an ambitious attempt by the Center for Autonomous Sensing and Sampling to address the challenge of filling the observational gap present in the lower atmosphere among the currently used meteorological instruments such as towers and radiosondes. The CopterSonde is a unique and highly flexible platform for in situ atmospheric boundary layer measurements with high spatial and temporal resolution, suitable for meteorological applications and research. Custom autopilot algorithms and hardware features were developed as solutions to problems identified throughout several field experiments carried out since 2017. In these field experiments, the CopterSonde has been proven capable of safely operating at wind speeds up to 22 m s−1, flying at 3050 m above mean sea level, and operating in extreme temperatures: nearly −20 ∘C in Finland and 40 ∘C in Oklahoma, United States. Leveraging the open-source ArduPilot autopilot code has allowed for seamless integration of custom functions and protocols for the acquisition, storage, and distribution of atmospheric data alongside the flight control data. This led to the development of features such as the “wind vane mode” algorithm, which commands the CopterSonde to always face into the wind. It also inspired the design of an asymmetric airframe for the CopterSonde, which is shown to provide more suitable locations for weather sensor placement, in addition to allowing for improvements in the overall aerodynamic characteristics of the CopterSonde. Moreover, it has also allowed the team to design and create a modular shell where the sensor package is attached and which can run independently of the CopterSonde's main body. The CopterSonde is on the trend towards becoming a smart UAS tool with a wide possibility of creating new adaptive and optimized atmospheric sampling strategies.
- Article
(16578 KB) - Full-text XML
- BibTeX
- EndNote


The atmospheric boundary layer (ABL) is a dynamic system that experiences significant changes in the thermodynamic and kinematic states in its vertical and horizontal structures. An understanding of these structures is key for improving numerical modeling, simulations, and weather forecasts. A combination of fine-scale domain models along with higher-resolution observations in space and time is required in order to advance such understanding. The measurement of temperature, humidity, pressure, and winds are some of the most important parameters for the description of the thermodynamic and kinematic behavior of the ABL. There are currently several meteorological instruments able to measure these parameters effectively; however, they are limited in coverage and have high operating costs. This has resulted in a “data gap” in the ABL, which is gaining national and international attention (National Research Council, 2009; Hardesty and Hoff, 2012; Geerts et al., 2017; National Academies of Sciences, Engineering, and Medicine, 2018).
The National Academies have initiated and overseen two “Decadal Surveys” over the last 20 years with the goal of generating “recommendations from the environmental monitoring and Earth science and applications communities for an integrated and sustainable approach to the conduct of the US government's civilian space-based Earth-system science programs.” (National Academies of Sciences, Engineering, and Medicine, 2018). The 2017–2027 Decadal Survey, released in January 2018, states “Earth science and derived Earth information have become an integral component of our daily lives, our business successes, and society's capacity to thrive. Extending this societal progress requires that we focus on understanding and reliably predicting the many ways our planet is changing.” (National Academies of Sciences, Engineering, and Medicine, 2018).
Unmanned aircraft systems (UASs) are an emerging technology with a growing interest for weather research and atmospheric monitoring in the scientific community. Correspondingly, rapid growth in the developments of the autopilot capabilities, ground station software, and airframes is also being observed. However, a well-proven design that fully satisfies the needs of measuring atmospheric parameters accurately and effectively is still in its early stages of development. The first attempts of using UAS for atmospheric research go back to the 1970s (Konrad et al., 1970) and, since then, the integration of sensors aboard the platform as a whole has been gradually improving. For instance, the Small Unmanned Meteorological Observer (SUMO) is a fixed-wing aircraft that was developed at the University of Bergen as a cost-effective atmospheric measurement system (Reuder et al., 2009). Later, Wainwright et al. (2015) and Bonin et al. (2015) showed a clear example of the use of the fixed-wing SUMO for estimating the temperature structure function parameter and compared them against large-eddy simulations and sodar observations, respectively. Furthermore, the multipurpose airborne sensor carrier (MASC) UAS was recently developed by the Eberhard Karls University. It was originally designed for boundary layer research, capable of collecting temperature, humidity, and wind data in situ at high resolution (Wildmann et al., 2014).
Nowadays, the development of a fully autonomous system that can operate with little to no human intervention seems to be the next big step in the field. However, the airspace over the United States is regulated by the Federal Aviation Administration (FAA), and their main mission is to deconflict the airspace and keep the airways safe. Therefore, it is imperative that UAS operations always comply with the FAA rules. At the time this paper was written, the FAA required a licensed UAS operator to be physically present at the flight site and it also explicitly states that the UAS must be within sight at all times, unless special permissions from the FAA were acquired. Hence, the current UAS operations are limited by legal factors. However, there are strong interests from the scientific community in collaborating with the FAA and providing safe solutions with appropriate risk mitigation. Chilson et al. (2019) envisions the future concept of operations of a large network of fully autonomous and unattended UAS distributed over the state of Oklahoma and beyond, also known as the 3-D Mesonet concept.
The CopterSonde rotary-wing UAS is part of this larger project and was specifically designed to be a reusable and safe system capable of adapting to the current and future rules and conditions. Moreover, the CopterSonde was developed as a flexible and cost–effective platform (below USD 5000 in materials) for the precise measurement of temperature, humidity, pressure, and wind profiles. Additionally, the CopterSonde will receive firmware improvements over time aimed towards a more autonomous and unattended system. In this paper, the design process and the technical capabilities of the CopterSonde are discussed. Results from some field campaigns are also shown to demonstrate the ability of the CopterSonde to repeatedly and consistently collect accurate data while enduring challenging conditions such as low-level jet winds, icing events, and low air density at high altitudes.
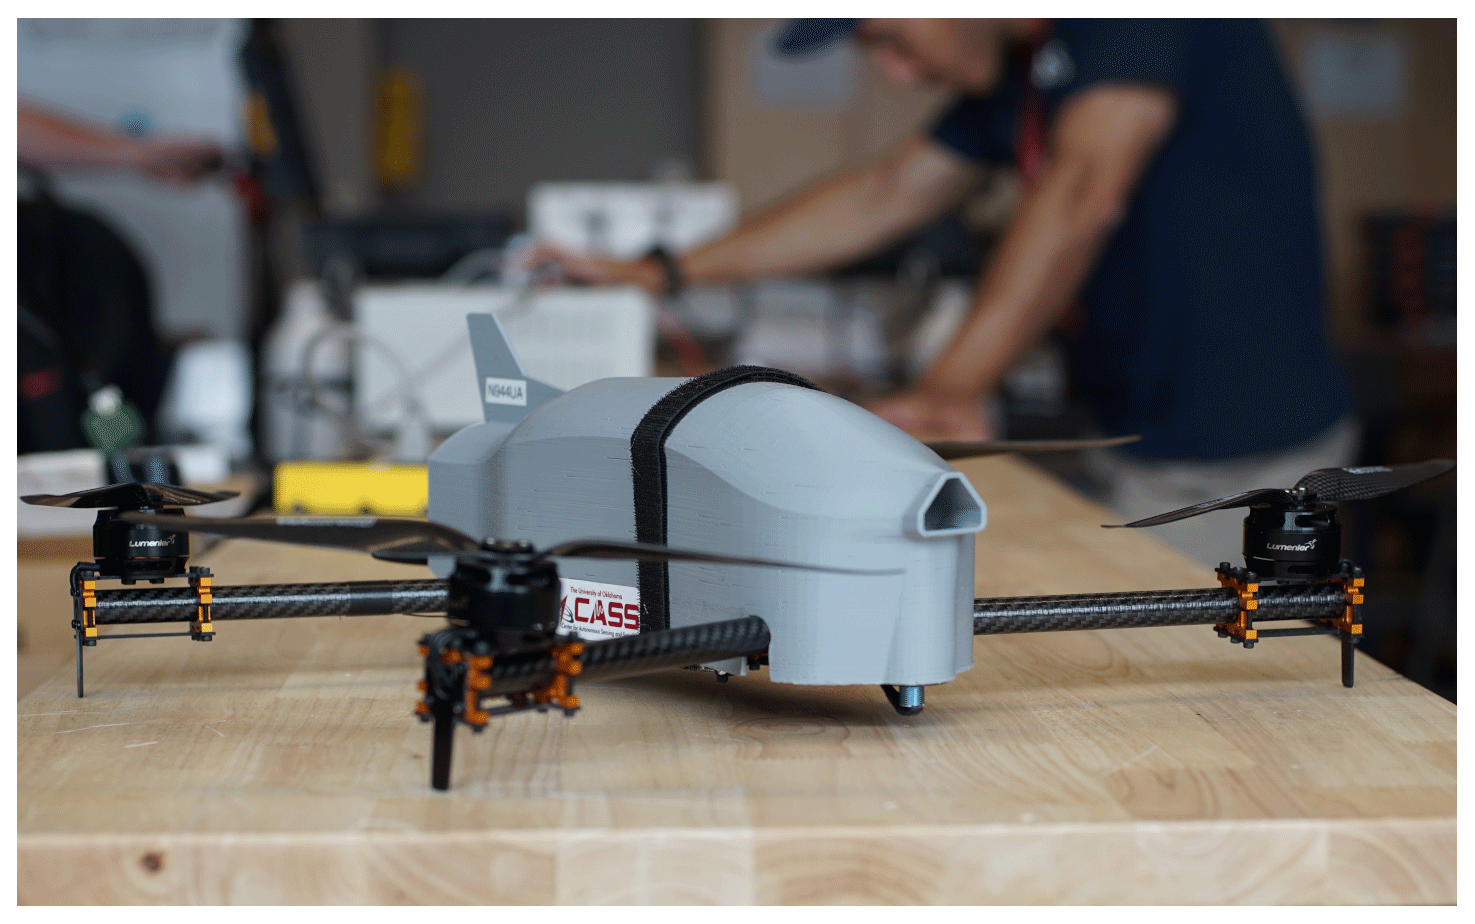
The Center for Autonomous Sensing and Sampling (CASS) from the University of Oklahoma (OU) has enabled the development of the CopterSonde UAS for weather research, shown in Fig. 1. The foundation of the CopterSonde design started with a commercially available airframe equipped with an open-source autopilot system. In the most recent version, the airframe and autopilot have gone through heavy modifications in order to optimize it for atmospheric data acquisition, in particular for temperature, humidity, pressure, and wind data.
2.1 Airframe
The presented CopterSonde airframe is based on a modified version of the Lynxmotion HQuad500 construction frame kit from RobotShop Distribution Inc. The CopterSonde is a rotary-wing vehicle that has four fixed pitch rotors mounted at the end of four almost equally spaced arms attached to the main body, also known as quadcopter. The structure of the quadcopter is made of G10 fiberglass plates, carbon fiber tubes, aluminum tube-clamps, and stand-offs. A combination of T-motor U3 700 KV motors with carbon fiber T-style propellers 11 (27.94 cm×13.97 cm) is attached at the end of each arm. The motors are controlled by a Lumenier 30 A BLHeli32 4-in-1 speed controller which is powered by a single four-cell 6750 mAh lithium polymer battery. The battery has its own compartment inside the CopterSonde to avoid exposing it to extreme environments and to keep it within operating temperatures. Furthermore, all of the CopterSonde's electronics are covered by a shell to protect them from external hazards. The CopterSonde technical and performance specifications are summarized in Table 1.
The original frame was intended for simple recreational flights, in particular for long-endurance first-person view (FPV) flights. Therefore, the quadcopter had to undergo some modifications to accommodate the desired components and repurpose the functionality of the aircraft for weather data collection. Several components were fitted in the CopterSonde, which included a high-precision Here+ V2 Ublox M8P GPS that has the ability to process real-time kinematic (RTK) GPS positioning with a precision on the order of few centimeters. Also, a lidar-based rangefinder was mounted on the CopterSonde to accurately measure the height close to the ground which works in conjunction with a precision landing system based on an infrared camera. Figure 2 shows the 3-D-printed mount supports for the lidar device and the precision landing camera, respectively, which were integrated into the structure of the quadcopter. The 3-D-printed parts, including the shell that encloses the body of the CopterSonde, were modeled using the SolidWorks® computer aided design (CAD) program. Several iterations of the different CAD parts were printed with polylactic acid (PLA) plastic using a LulzBot® TAZ 6 3-D printer until a perfect fit was attained. Furthermore, the digital models were also useful to study the airflow behavior and its trajectory around such parts and the CopterSonde by using computational fluid dynamic (CFD) simulations, which is discussed in Sect. 2.5.
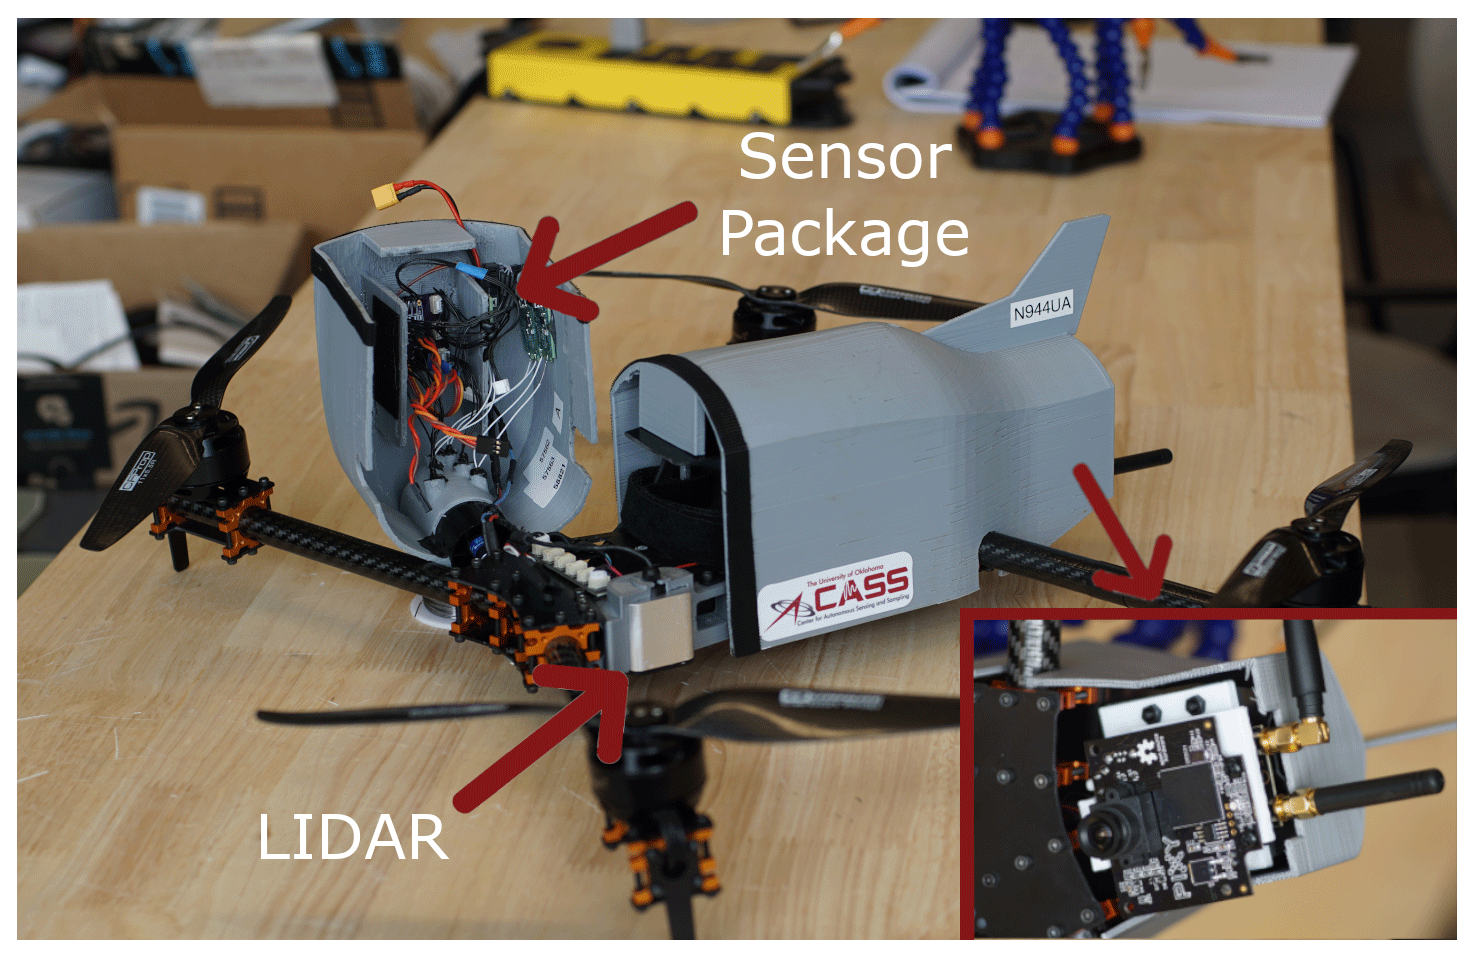
Figure 2Left side view picture of the CopterSonde UAS illustrating the location of the custom mounts for the LightWare 20/C lidar type rangefinder and the IR-LOCK precision landing camera. The inset picture in the lower right corner shows the camera mounted on the bottom of the CopterSonde. The sensor package is also shown unmounted next to the CopterSonde.
The arrangement of the electronic components within the CopterSonde was carefully planned to increase its modularity and facilitate performing routine maintenance. In particular, the payload was strategically placed at the front-most section of the CopterSonde. Consequently, the sensors are subjected to a cleaner airflow by keeping the payload always facing into the wind. As a result, undesired data contamination (produced by sources such as the heat emanated by the CopterSonde) is significantly reduced. This technique is better described in Sect. 2.3.
Table 1Technical specifications of the CopterSonde airframe.
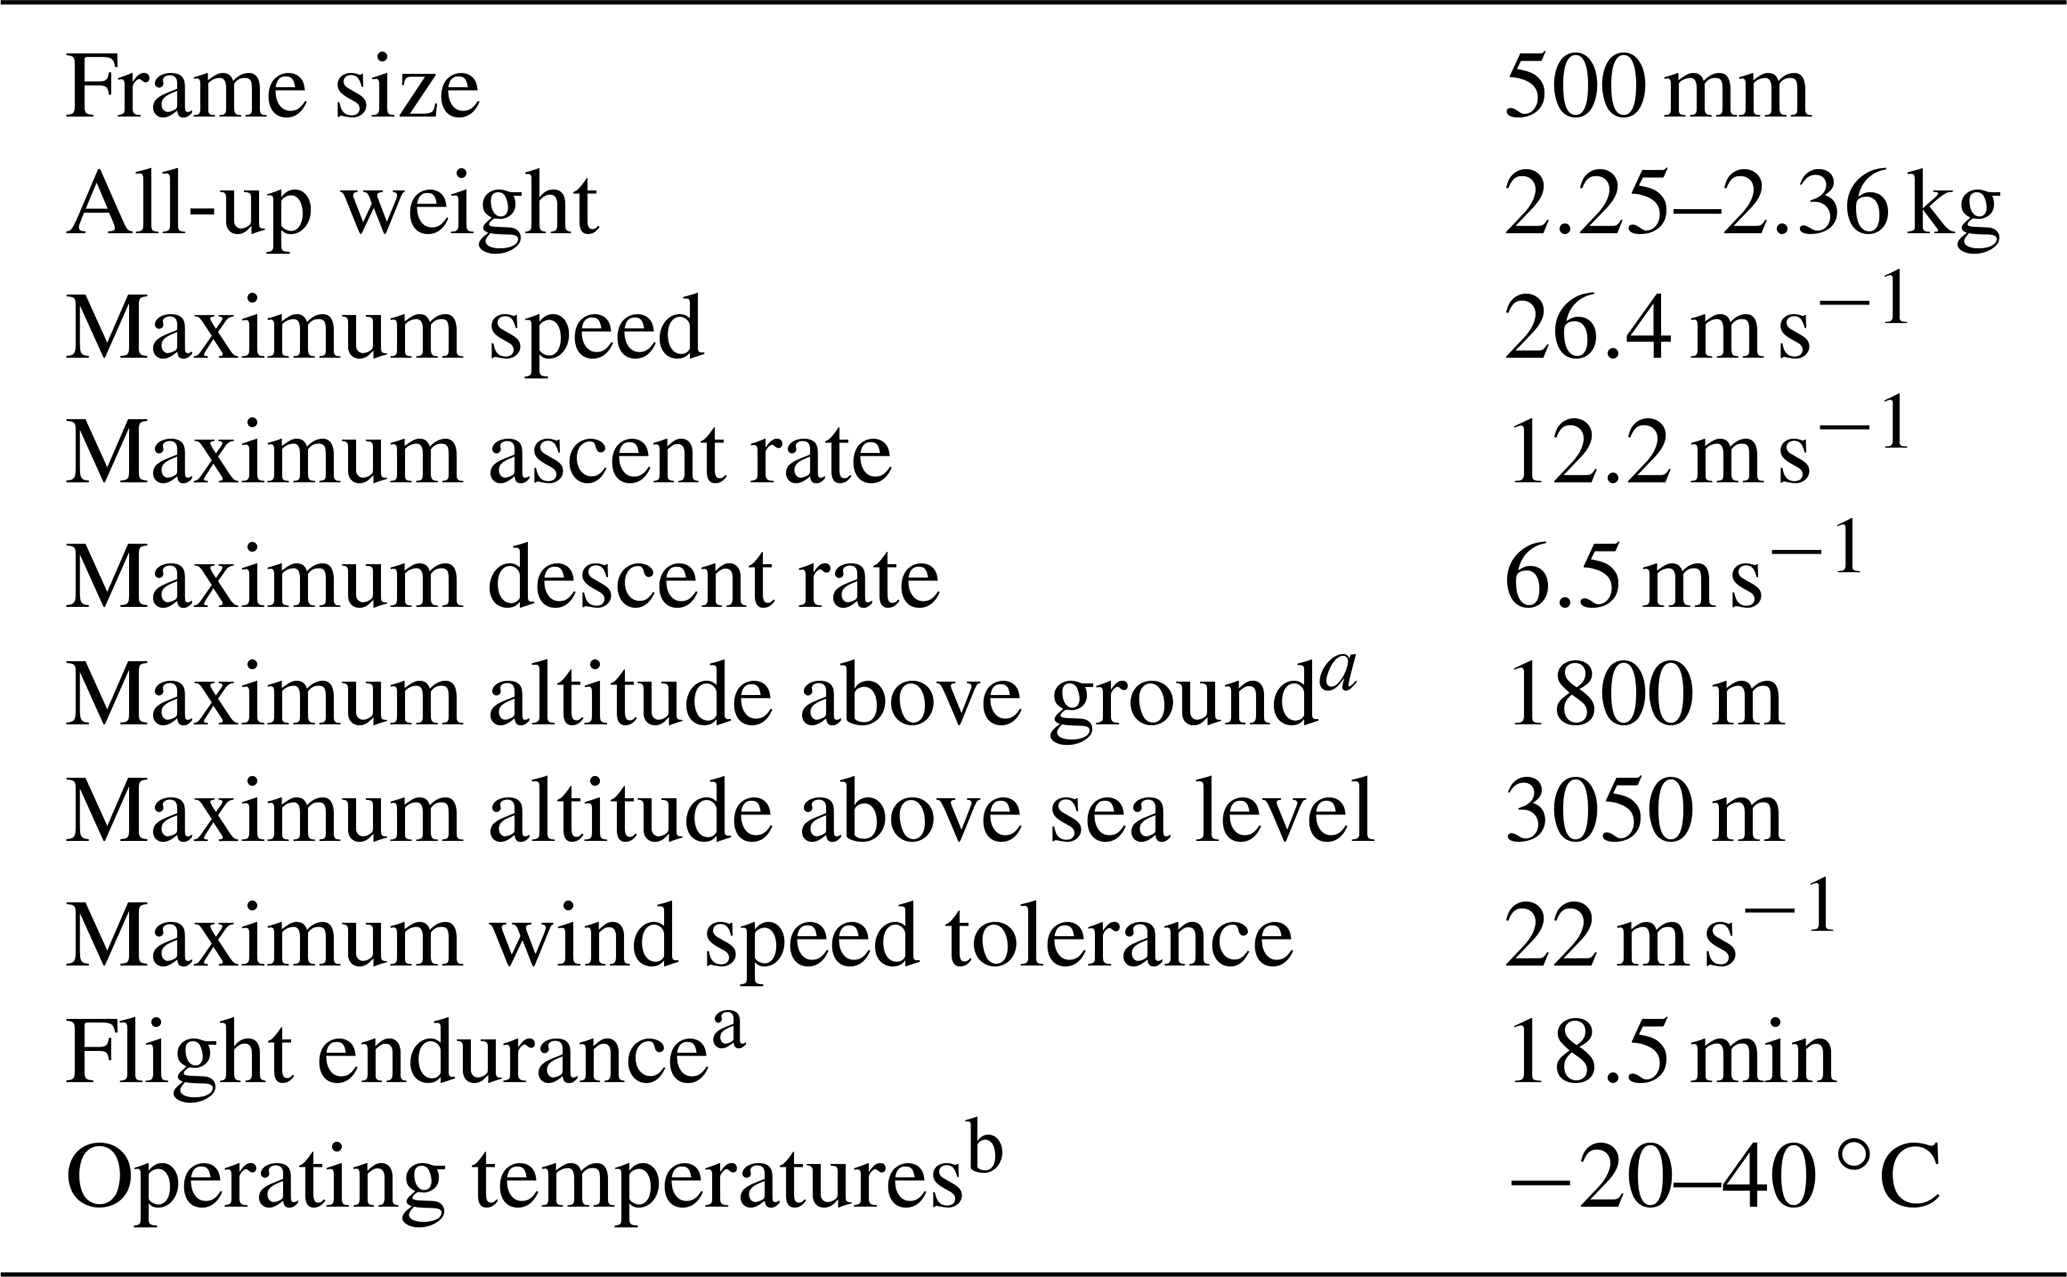
a Under favorable weather conditions with almost no wind.
b Tested temperatures; the range can be larger than stated.
2.2 Autopilot software system
The CopterSonde is equipped with a Pixhawk Cube 2.1 autopilot board (Hex Technology, Sha Tin, Hong Kong), which is used as the main controller for flight stabilization and navigation. The Pixhawk is an open-hardware project that provides users with a readily available, economic, and high-end autopilot board solution for academic, hobby, and industrial communities. It contains a powerful microcontroller capable of executing complex autonomous missions. The Pixhawk board runs the ArduPilot autopilot code, which is a free software package that can be redistributed and modified under the terms of the GNU General Public License version 3 (GPLv3). This means that anyone is free to use all of the code and tools provided in the ArduPilot GitHub repository without authorization or involvement from the ArduPilot team. However, it is the responsibility of anyone using the code to inform the end user that open software is used and the source must be provided. Therefore, under the given license terms, the code source release made by CASS is available to the users in Segales et al. (2019), which is in accordance with ArduPilot's GPLv3 license.
The motivation behind the decision taken to modify an existing open-source autopilot code was the flexibility of incorporating additional desired features not dependent on proprietary codes from companies, which usually do not follow the same research line and are prone to being discontinued. By having full access to the UAS autopilot code and being able to modify it as desired, it allowed for considerable reduction in the required electronic hardware by centralizing functions in a single processing unit. For instance, separate data loggers for the weather sensors were not needed, as the Pixhawk autopilot board has sufficient computing power to accommodate the extra data. This also came with the benefit of weight reduction which is crucial to improving flight performance and endurance. The official ArduPilot code by default does not support the desired meteorological sensors nor the adaptive flight behaviors for optimal atmospheric sample acquisition. Thus, the ArduPilot code has undergone modifications to incorporate custom user-code functions to adapt it to the specific application.
In the current version of the CASS–ArduPilot code run by the CopterSonde, a set of custom functions was added on top of the original ArduPilot code. These are itemized with their motivation and description as follows.
-
Code libraries to read the bead thermistors distributed by International Met Systems (iMet) and HYT-271 humidity sensors distributed by Innovative Sensor Technology (IST) were added into the autopilot code to achieve weather sensor integration. The communication between the sensors and the autopilot is done over a single bus using the I2C protocol, capable of sampling and storing up to eight sensors at 20 Hz each to an internal SD card.
-
Custom sensor messages were then added to the wireless data stream, which is transmitted to the ground control station (GCS) through the telemetry radio. The autopilot uses the Micro Air Vehicle Link (MAVLink) protocol to code the messages, which can be modified to include new message definitions. Consequently, the sensors can be monitored in real time while in flight. Additionally, a copy of the streamed data is stored in the GCS computer.
-
A wind vane mode consisting in a simple wind estimation algorithm was implemented along with a 2-D wind direction tracker for the autopilot. The autopilot estimates the wind direction and adaptively turns the CopterSonde into the wind. By maintaining the CopterSonde orientation into the oncoming wind, the air being drawn across the sensors has not been disturbed by effects from the CopterSonde body. As a result, data contamination is minimized, as shown in Greene et al. (2019). Furthermore, the wind vane mode creates quasi-symmetric conditions that simplifies the wind vector calculation in post-processing. It also enables the design to take on an asymmetric distribution of the electrical components. This greatly contributes to the aerodynamic shape, as it adds stability in higher wind speeds that would otherwise be unachievable with a conventional symmetric UAS airframe.
-
A smart fan for sensor aspiration was used since the chosen weather sensors have a delicate structure and that must be kept protected from dust and debris. Therefore, the sensors were mounted inside a tubular shield and aspirated by a smart fan, which is controlled by an algorithm executed by the autopilot. The algorithm toggles the fan's power on/off functions at specified heights after takeoff and before landing.
Before flashing the custom code into the Pixhawk autopilot board, a thorough debugging of the code can be achieved by using a simulator included in the ArduPilot code. This prevents incidents or malfunctions when running the code for the first time during a real flight and it significantly reduces the software development time. Figure 3 shows a screen capture of the simulator's graphical user interface with a live temperature and humidity data monitor developed in house. Moreover, the simulator can create different environmental scenarios, such as adding wind and turbulence, for further evaluations. Additionally, given that the ArduPilot repository is managed by a code-hosting platform for version control and collaboration (GitHub), the update releases from the official ArduPilot account can be easily tracked and merged to the custom forked code. This feature allows developers to continue harnessing the power of the ArduPilot code for future integrations and optimizations for any desired application.
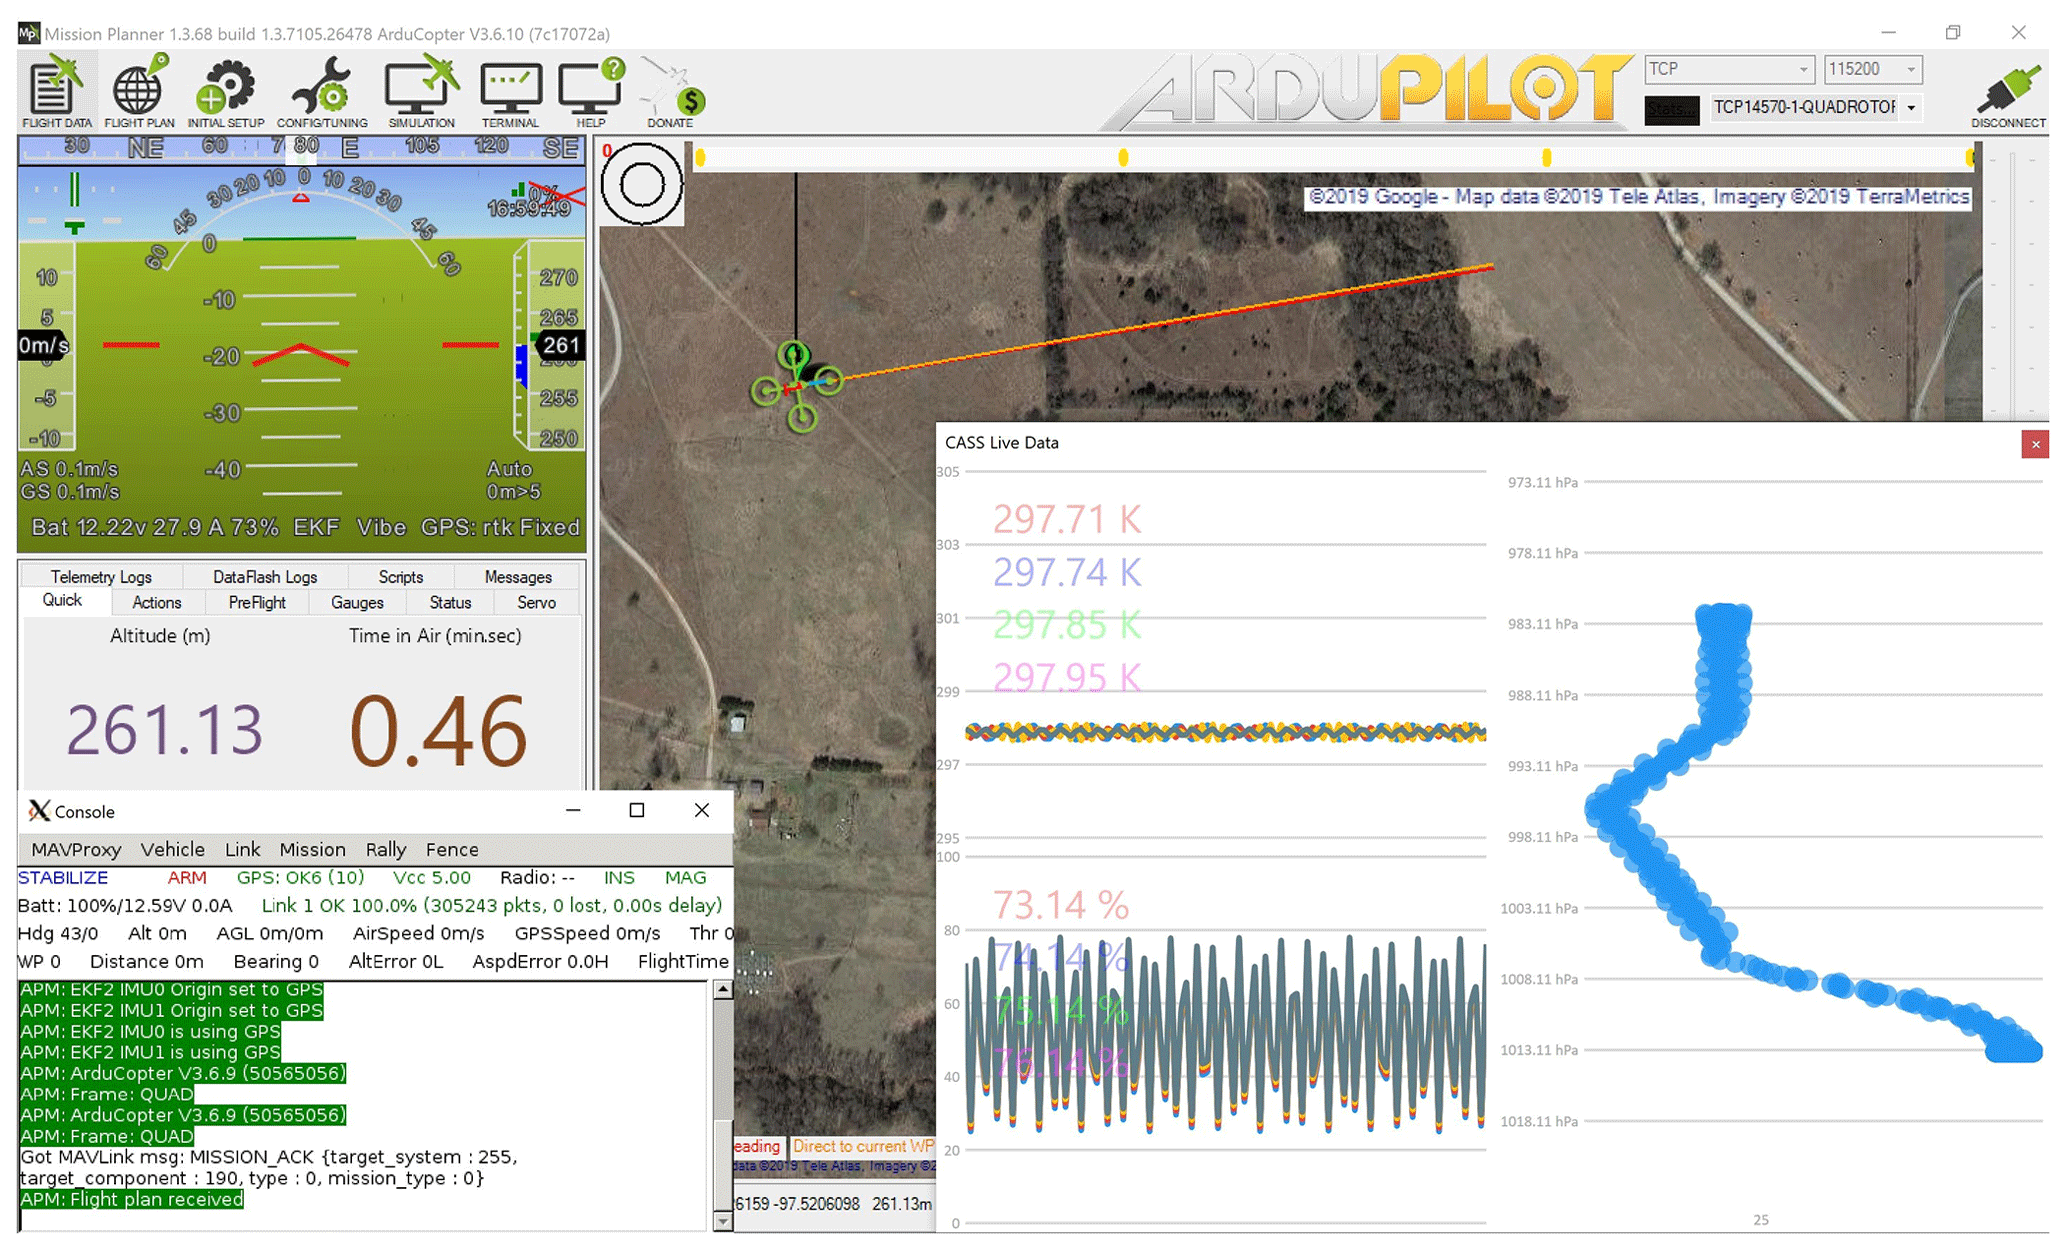
Figure 3Screen capture of the simulator's graphical user interface in which every flight parameter is displayed as if flying a real UAS. The UAS is represented by the green quadcopter in the map provided by Google (© 2019 Google – map data: © 2019 Tele Altas, Imagery © 2019 TerraMetrics); the heads-up display (HUD) in the top left corner shows the necessary avionics for the operator. The inset picture in the bottom right corner is a live view of the simulated temperature and humidity data interacting with the simulated UAS. Work is underway to better represent the vertical temperature and humidity profiles in the simulator.
2.3 Adaptive sampling: the wind vane mode
The approach used to estimate the 2-D wind vector on the CopterSonde is based mainly on the tilt measurements given by its onboard inertial measurement unit (IMU). By keeping the magnitude of the roll angle of the CopterSonde around zero, a quasi-symmetric condition to the oncoming wind can be achieved, and thus the wind speed can be calculated based on the pitch angle and a function of projected area normal to the wind (discussed in Sect. 2.6.2). This approach is referred as the “wind vane mode”. Concisely, the concept of the wind vane mode is to ensure that the CopterSonde is pointing headwind by changing its yaw angle in the direction that the roll is minimized.
The advantage of this approach is that there is no need for an additional dedicated airspeed sensor or anemometer, which is challenging to implement properly on a multicopter and would also reduce the available space and weight limit for other valuable payload components. However, the inherent rotor wash causes a big limitation within this approach, because it disturbs the aerodynamic field around the CopterSonde. Hence, resolving for small wind fluctuations becomes highly unreliable.
The wind vane mode algorithm has to quickly calculate the wind vector to keep the CopterSonde within the quasi-symmetric conditions while ascending and descending. Also, the algorithm does not resolve for the fine-scale wind vector in order to reduce mathematical complexity and thus reduces the computing time on the Pixhawk controller. Therefore, the kinematic equations of motion of the CopterSonde were used for the algorithm over the more complex dynamical model.
The reference frame convention used for vector calculations is shown in Fig. 4, where nyz is a unit vector in the direction of X normal to the plane YZ of the inertial frame , θ and ϕ are pitch and roll angles, respectively, and eθ and eϕ are unit vectors of the body reference frame. The angle between the vector , normal to the CopterSonde's horizontal plane, and the axis Z is a measure of the tilt of the CopterSonde and it is denoted by γ. The magnitude and direction of the projection of v onto the plane XY of I can be directly associated with the wind speed and direction, respectively. Subsequently, the wind direction with respect to the CopterSonde's true heading (X axis) is
and after some vector operations and math simplifications, λ results in
where
as similarly deduced by Neumann and Bartholmai (2015). Additionally, the CopterSonde is constantly measuring its heading with respect to the true north by means of an onboard compass which is denoted by ψ. The sum of ψ with the computed angle λ gives the absolute wind direction. However, since the algorithm commands the CopterSonde to turn into the wind, the angle λ tends to zero, and consequently, ψ tends to the absolute wind direction. It should be noted that the wind vane algorithm works only when the CopterSonde is horizontally steady, and the tilt angle γ is produced only as a result of the CopterSonde compensating for wind.
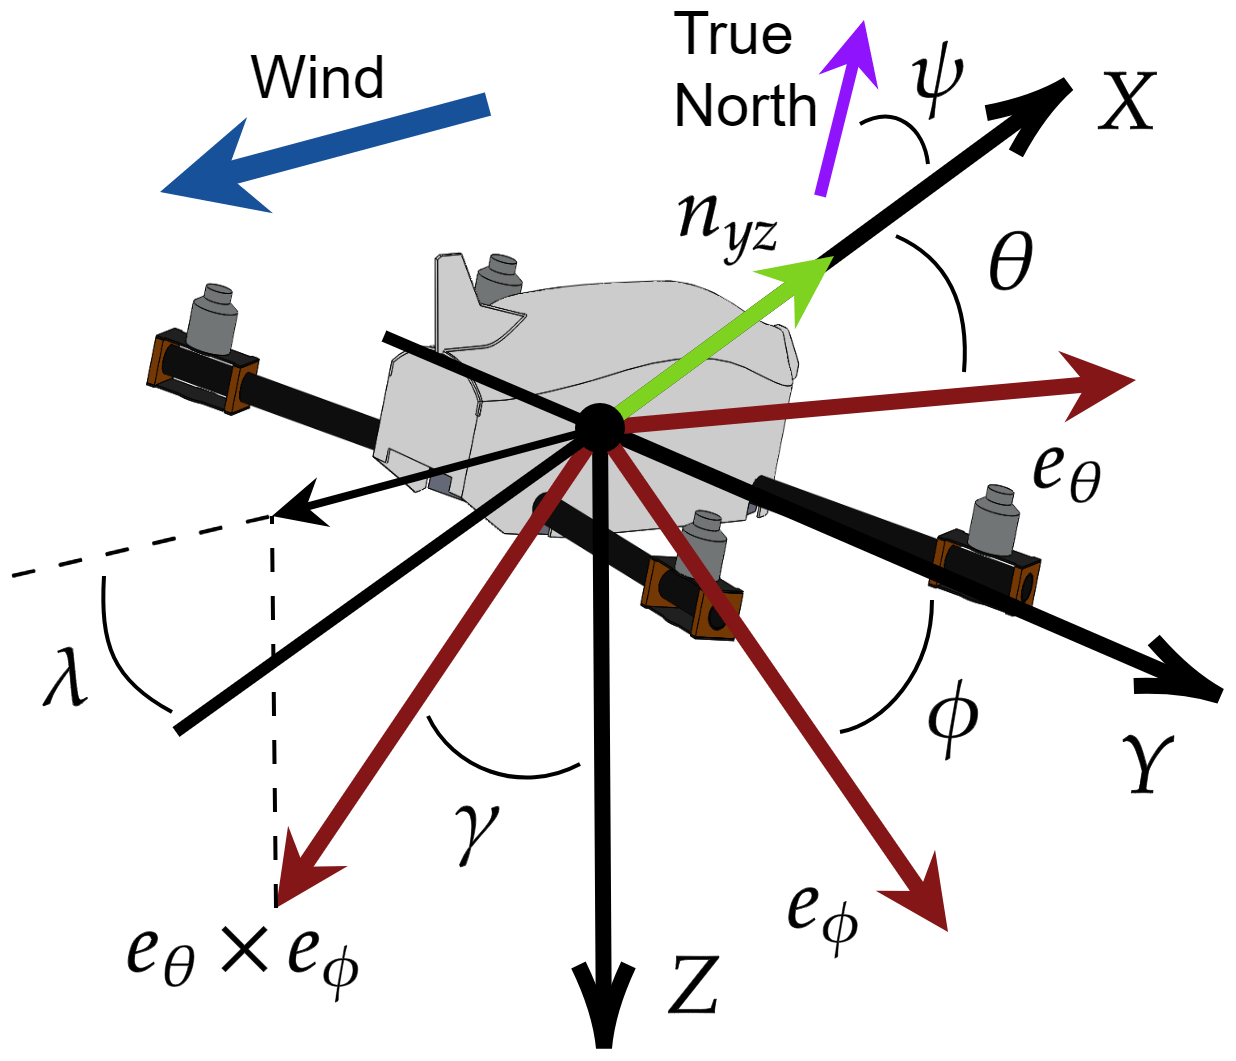
Figure 4Reference frame convention used by ArduPilot and illustrated with the set of orthonormal vectors . The plane described by X and Y is parallel to the surface of the Earth, while the Z axis points downwards to the center of the Earth. The horizontal plane fixed to the CopterSonde body is described by eθ and eϕ, and their cross product eθ×eϕ is the tilt vector used for calculating the wind.
The autopilot board executes the wind vane code and calculates the wind direction λ at a frequency rate of 10 Hz. Despite the fast computation of λ, it is better to take the average over a time period of a sequence of λs to filter out any perturbations caused by the rotor wash and other undesired aerodynamic disturbance. The time-averaged angle is then inserted directly into the autopilot flight control algorithm as a yaw command, turning the CopterSonde about its yaw axis to face it into the wind. After several bench tests of the code with the simulator, the time interval for the average was set to 5 s or 50 samples. It was found that a shorter time interval causes the CopterSonde to oscillate about its yaw axis, while a longer time interval outputs wind direction estimates at a very slow rate.
2.4 Shell and payload
The CopterSonde was designed to be a modular system; in particular, the payload has its own detachable compartment capable of operating independently from the main body of the CopterSonde. This feature is particularly useful for calibration and maintenance purposes. The CopterSonde's shell is divided into two pieces: the front shell and the back shell, as shown in Fig. 5. The back shell's main purpose is to protect the vital components inside the CopterSonde such as the battery and the autopilot. Moreover, it makes the CopterSonde more aerodynamic and its rear vertical fin helps with orienting the CopterSonde into the wind. The sensor compartment is located in the front shell of the CopterSonde. The shells are exchangeable, which provides the option to have a variety of shells with different sensor configurations for a broad range of experiments. The dimensions of the compartment are approximately mm and can carry a maximum payload weight of 205 g and a minimum of 90 g (not including the shell). The CopterSonde's center of gravity (CG) without the shells is slightly rear-shifted with respect to its center. Under the minimum payload weight configuration, the CG is located at the center of the CopterSonde, whereas the CG is slightly forward under maximum payload weight configuration. None of these configurations seem to compromise the CopterSonde's stability or performance to any noticeable degree. The current version of the CopterSonde's front shell is outfitted with a set of three thermistors and three humidity sensors for redundant thermodynamic sampling. Figure 6 shows the location of the sensors and the fan inside the L-shaped duct incorporated into the front shell. The sensors were placed in an inverted “V”-shape pattern to prevent the sensors from sampling heated and disturbed air produced by the wake and self-heating of the upstream sensors. The fan was calibrated to draw air across the sensors at a constant speed of 12 m s−1. It automatically switches on (off) after takeoff (before landing) to protect the sensors from dust close to the ground. Further analysis and considerations about the sensor placement on the CopterSonde can be found in Greene et al. (2018) and Greene et al. (2019).
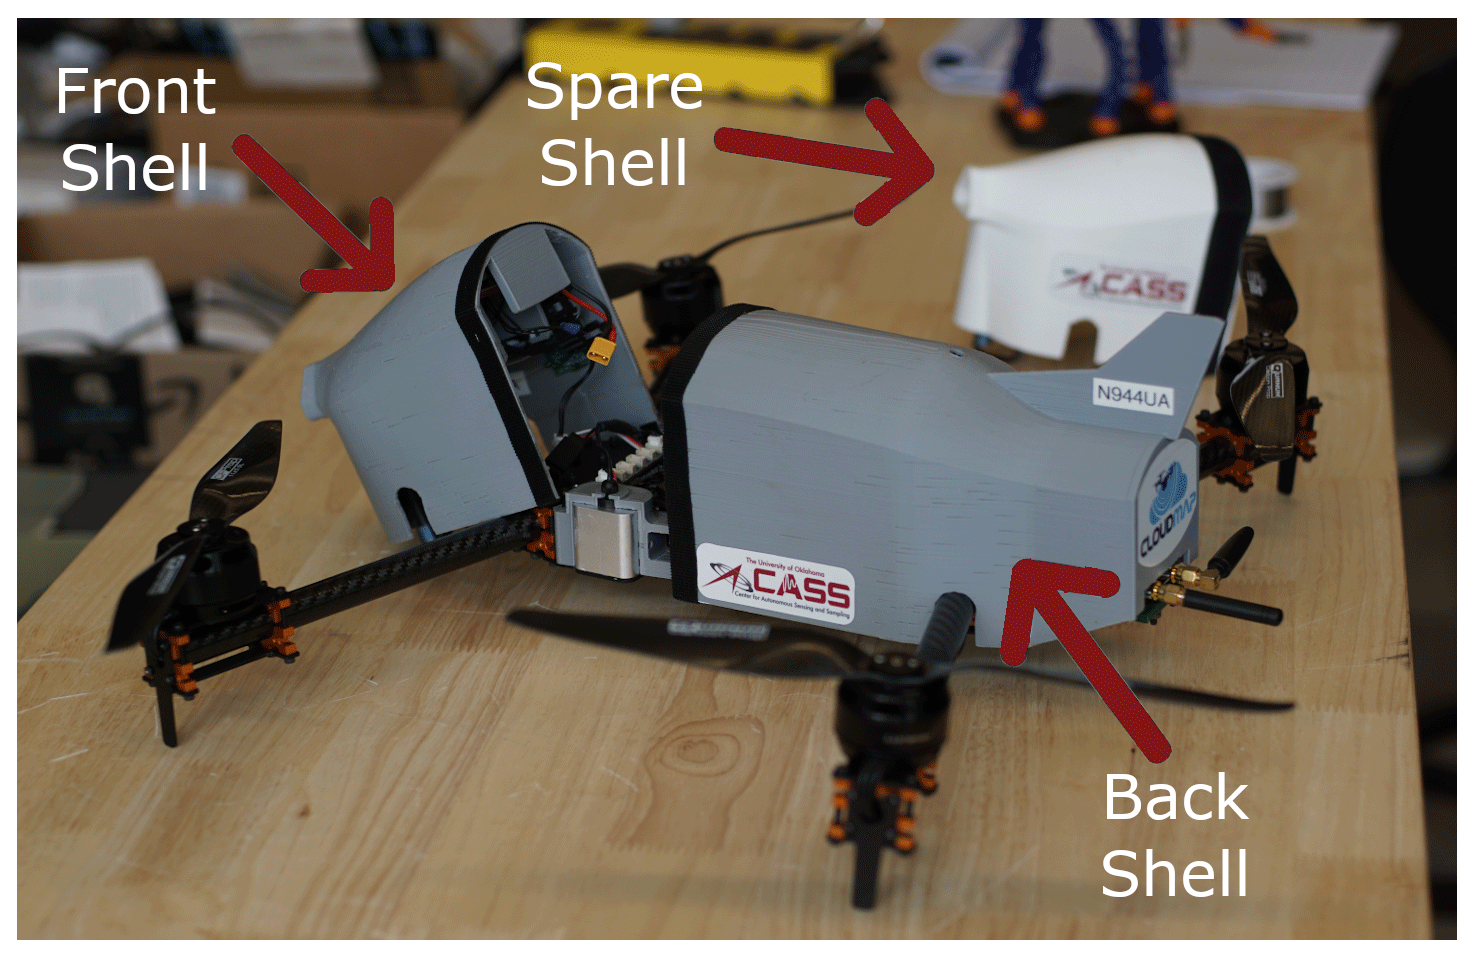
Figure 5Side view picture of the CopterSonde UAS illustrating the modular parts of the 3-D-printed shell. The front shell is shown unmounted and a spare front shell is shown in the background to exhibit the ease of interchangeability of the CopterSonde's shell.
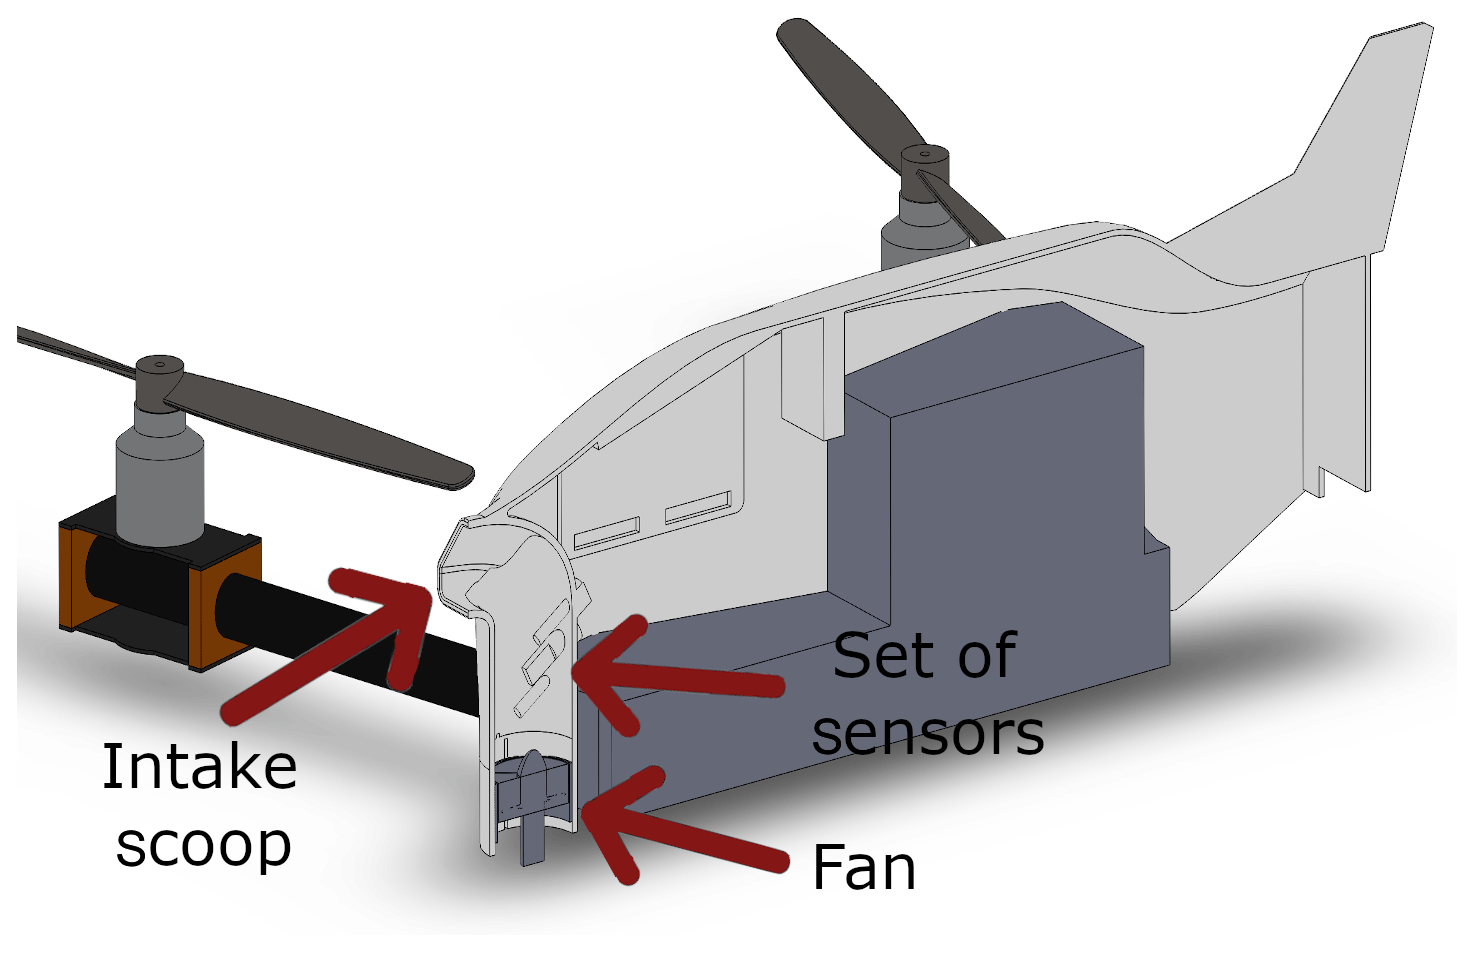
Figure 6Longitudinal section cut view of the CopterSonde CAD model showing the different parts of the inside of the L-shaped duct. The sensors were placed as far from the intake as possible to reduce the heating produced by solar radiation. The airflow induced by the fan circulates from top to bottom at a constant speed.
Table 2Technical specifications of the weather sensors mounted on the CopterSonde according to the manufacturers.

a Micro electromechanical system.
b At 5 m s−1 airflow across and standard ambient temperature and pressure (SATP).
The additional meteorological sensors are the iMet-XF bead thermistor and the IST HYT-271 capacitive humidity sensor, because of their small sizes, low cost, and ease of programming. Pressure is measured by a single MS5611 sensor built-in the Pixhawk autopilot board which is also used for altitude control. The specifications of the sensors are summarized in Table 2. The temperature and humidity sensors were programmed to use the I2C communication protocol to exchange data streams with the Pixhawk autopilot board. Only two connecting cables are required to transfer data between the payload and the CopterSonde's autopilot board. Additionally, the shell carries its own battery that powers the sensors and the fan. It has enough energy for four consecutive flights before needing to be replaced. It should also be mentioned that the front shell can be redesigned to fit other types of sensors, such trace gas monitors, provided that the sensors can fit within the payload dimensions and weight limitations.
2.5 Flow simulation
The design of the CopterSonde was mostly driven by the meteorological sampling needs, one of them being the acquisition of data representative of the environment. Therefore, a thorough study of the airflow around the CopterSonde and its payload was conducted. The aim of the experiment was to mitigate undesired modifications to the sampled air resulting from the CopterSonde body and characterize any possible bias. To address this challenge, a digital 3-D model of the CopterSonde body was created, and subsequently, flow simulations were conducted using CFD included in the SolidWorks® program.
First, real observations were conducted with the CopterSonde in windy conditions at the Kessler Atmospheric and Ecological Field Station (KAEFS) in Purcell, Oklahoma, USA, located 30 km southwest of the OU Norman campus. The CopterSonde completed several hovers while oriented into and perpendicular to the wind. The flights were conducted next to the Washington Oklahoma Mesonet 10 m meteorological tower (WASH; Brock et al., 1995; McPherson et al., 2007), which recorded the atmospheric conditions close to the surface. The external temperature of the CopterSonde body and shell was also recorded using an infrared thermometer. The observations were then used as initial conditions for the flow simulation. A steady state in the simulation was reached after approximately 0.8 s of simulated physical time, which took about 8 h of computing time. Figure 7 shows a cross-section view of the airflow's temperature with streamlines denoting the air's path. This helped in identifying the air trajectory, patterns, and sources of heat around the CopterSonde and across the sensors. Noting that the blue color is the environmental temperature, a heat aura can be discerned around the CopterSonde. Despite the hottest location being only 1 K higher than the environmental temperature, it can be seen that the region in the air flow corresponding to the smallest temperature perturbation occurs inside the L-shaped duct. Based on the simulation results, the sensing elements are exposed to the cleanest airflow relative to the CopterSonde's surroundings. However, other environmental factors, such as the solar radiation, were missing in the simulation. Solar radiation has a significant contribution to data contamination as found by Greene et al. (2019). Work is underway to produce a more accurate modeling of the CopterSonde that includes impacts from environmental factors.
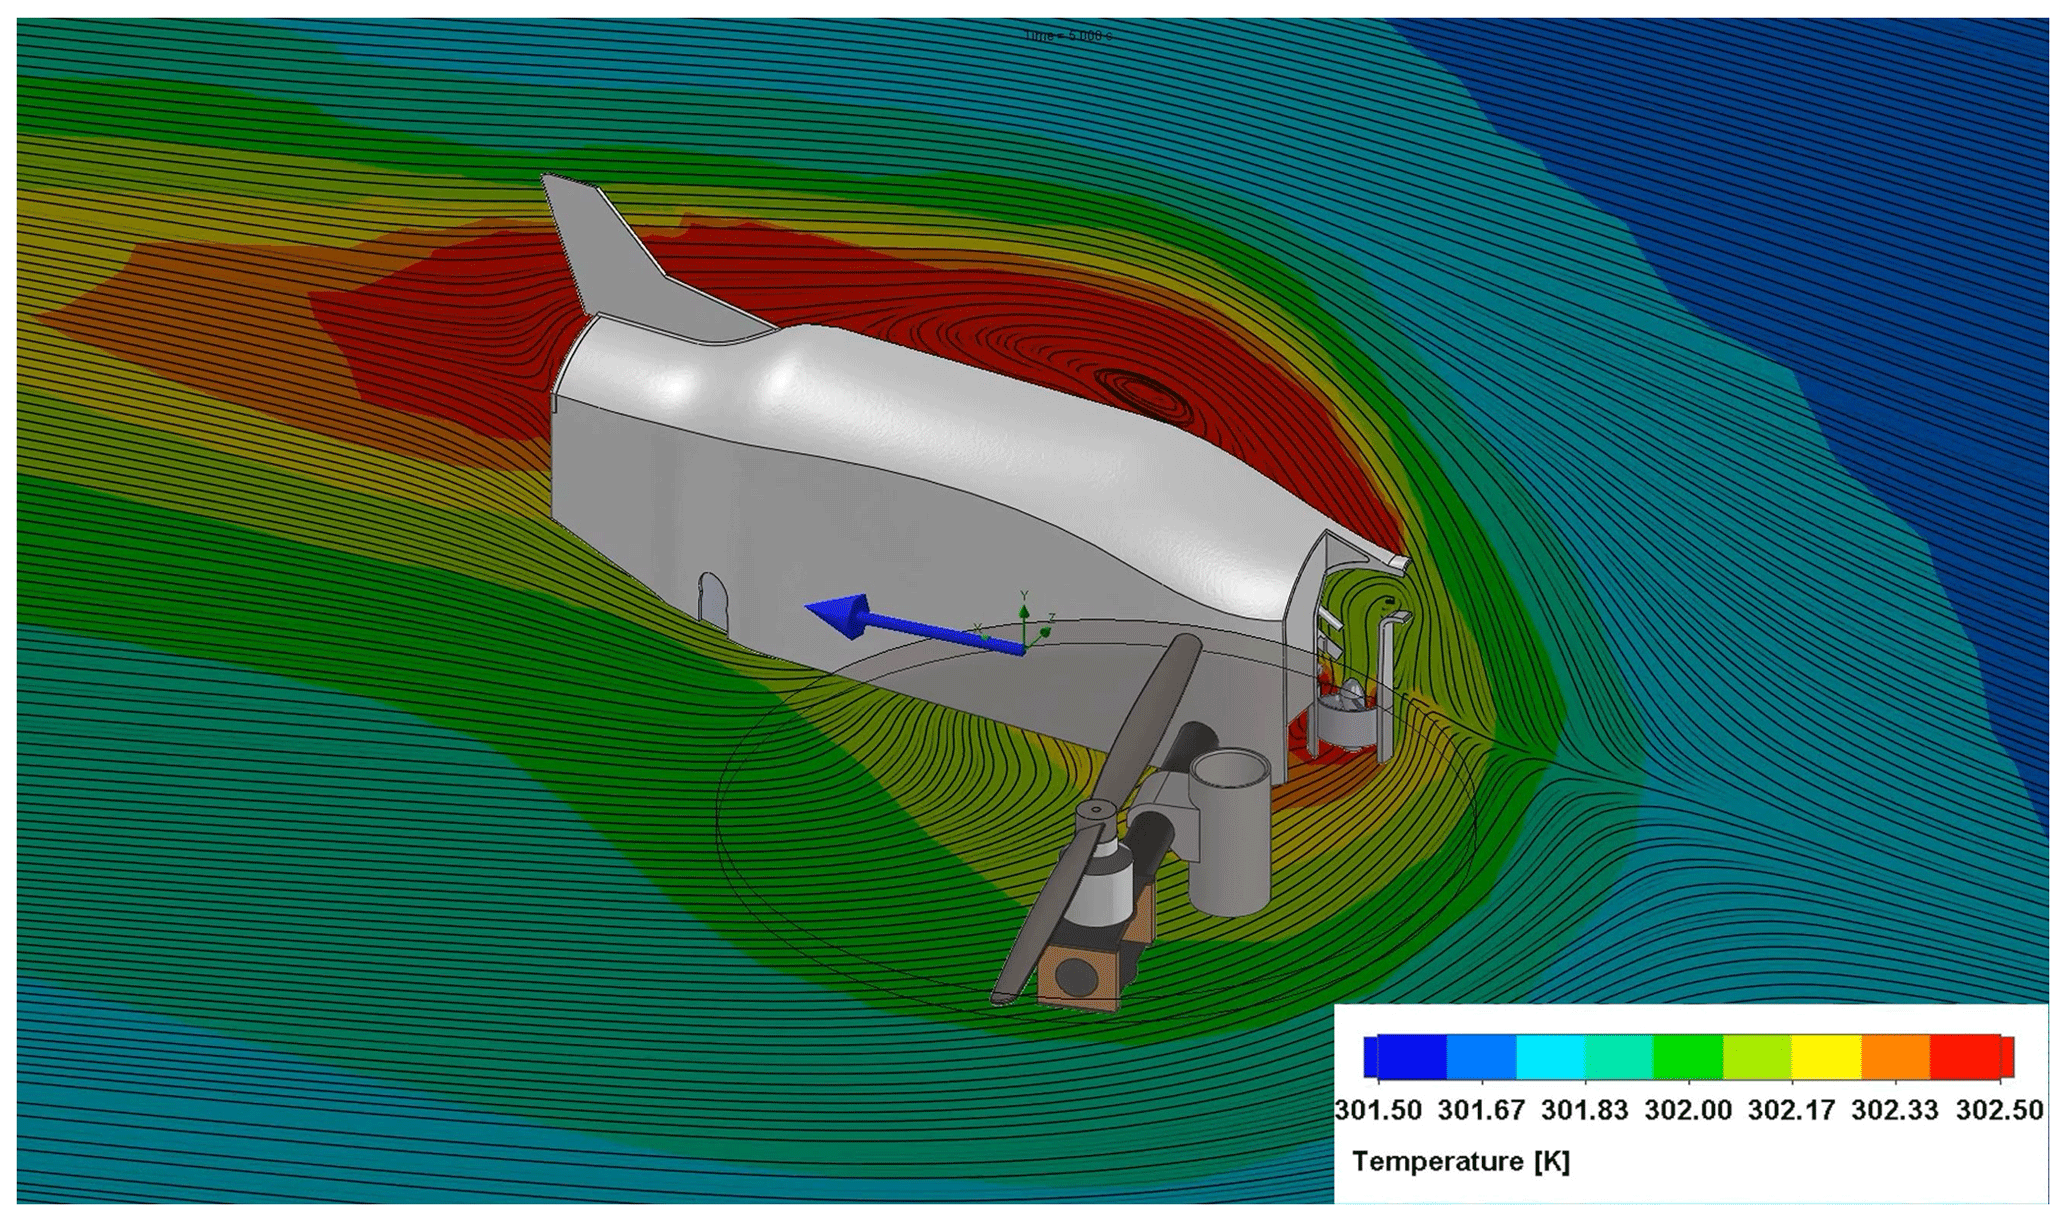
Figure 7Longitudinal cross-section view of the airflow around the CopterSonde CAD model. It shows the CopterSonde facing into winds of 3.6 m s−1 blowing in the direction of the blue arrow. The color spectrum represents the air temperature (in Kelvin) and the streamlines show the flow trajectory. To save computational time and reduce complexity, the rear propellers were removed for the simulation since these are located downwind of the region of interest. Additionally, a section cut view of the L-shaped duct shows the airflow across the sensors and the fan.
2.6 Calibration
Every new build of the CopterSonde undergoes a series of calibration and validation steps. First, the CopterSonde's autopilot system is tuned to achieve the most stable flight under a wide range of weather conditions. Detecting any undesired oscillations or sluggishness in its behavior in this stage is crucial. If the tuning is poor, the errors can potentially propagate and impact wind estimations or produce other serious consequences in performance. Another advantage of the modularity of the CopterSonde's sensor payload is that it can be calibrated as a single system instead of its individual components or sensors. The calibration and validation of the sensor package are described in the following sections.
2.6.1 Thermodynamic payload
For calibration of the thermodynamic payload, the entire ducted fan setup was placed inside a reference chamber operated by the Oklahoma Mesonet instruments laboratory. Chamber temperatures ranged from 10 to 30 ∘C in increments of 10 ∘C every hour at a constant relative humidity of 50 %. For relative humidity, the chamber was held at a constant 25 ∘C while varying in relative humidity for an hour at each level. These levels were 15 %, 35 %, 55 %, 75 %, and 95 %. Throughout both of these procedures, the ducted fan was on to continually aspirate the sensors. Individual linear temperature and relative humidity sensor biases were then obtained by comparing 1 min averaged measurements to the reference chamber's National Institute of Standards and Technology (NIST) traceable sensor temperature and relative humidity and computing their average differences. This is the same procedure as discussed in Greene et al. (2019).
By applying these calibration offsets, Greene et al. (2019) showed that the CopterSonde temperature measurement spread between the sensors is typically below 0.15 ∘C. Bell et al. (2019) compared CopterSonde temperature and relative humidity measurements to radiosondes and found that CopterSonde temperature and relative humidity measurements are accurate to within ±0.1 ∘C and ±2 %, respectively.
2.6.2 Horizontal wind vector
As mentioned in Sect. 2.3, the CopterSonde is capable of internally making estimations of the horizontal wind vector using the kinematic model outlined by Neumann and Bartholmai (2015) and Palomaki et al. (2017). However, a more accurate wind vector calculation can be achieved in post-processing. This can be done by considering a more complex model and exploiting the high-temporal-resolution data stored in the CopterSonde. This model is based on a multicopter maintaining its horizontal position by tilting into any oncoming wind to divert its vertical thrust vector, which can then be characterized as a function of wind speed. Based on the local coordinate system of the aircraft, the inclination angle (or vertical tilt) γ is calculated as
where θ and ϕ are again the pitch and roll angles, respectively. Note that γ here is equivalent to ψ defined by Neumann and Bartholmai (2015) but is changed due to the convention of using ψ as the aircraft yaw angle. The inclination angle is directly proportional to the drag force Fd by the wind on the aircraft as tan γ, and Fd in turn is related to the wind speed encountered by the multicopter v as
where ρ is the air density, Aproj is the aircraft surface area normal to the wind, and cd is a drag coefficient (Neumann and Bartholmai, 2015). Because of continually changing conditions and orientations of the multicopter, Aproj and cd are generally not well defined. However, it is possible to estimate wind speed through a linear regression model as
where constants C0 and C1 are derived empirically using a common reference measuring wind speed. This model therefore accounts for the intricate design geometry of the aircraft to a first order approximation without the need for complicated expressions for drag coefficients and surface areas. Environmental wind direction can also be estimated based on the direction of the aircraft tilt. By also incorporating the aircraft heading relative to true north (yaw angle, ψ), the wind direction can be evaluated though the same procedure in Sect. 2.3 using Eq. (2).
The procedure for determining coefficients C0 and C1 in Eq. (5) and evaluating the performance of these models for the CopterSonde is nearly identical to that from Sect. 3.1.2 of Greene (2018). The Washington site of the Oklahoma Mesonet is again used as a reference for wind speed and direction, which outputs 1 min data from an RM Young wind monitor. Note that the Oklahoma Mesonet nominally produces wind data every 5 min, but CASS has access a data stream from the tower with a better time resolution. The CopterSonde is flown at a hover at 10 m near the tower, as shown in Fig. 8, for 10–15 min at a time on several days under a variety of wind conditions for the statistical model. The aircraft inclination angles are then averaged to 1 min intervals to be consistent with the Mesonet data. Linear regression is then performed with the input of and Mesonet wind speed as a reference to get a transfer function of the form in Eq. (5). This can then be applied to output CopterSonde wind speed estimates (Fig. 9). In practice, compared to other sampling methodologies like radiosondes and Doppler wind lidars, this method of estimating wind speed with the CopterSonde is accurate to ±0.6 m s−1 from recent calibrations (Bell et al., 2019). Work is underway to improve the wind estimation algorithm, which should reduce the uncertainty.

Figure 8Picture of the CopterSonde hovering and tracking the wind next to the Oklahoma Mesonet tower at KAEFS. The aerial photo was taken by a DJI Phantom 4 Pro drone from above.
Similarly, the wind direction estimated by the CopterSonde during these flights is compared to the reference Mesonet tower. Generally, this is a more direct approach and does not require any statistical modeling, unless a constant offset bias is observed. The output angle for the CopterSonde as calculated from Eq. (2), and accounting for the yaw angle ψ tends to be within 4∘ of the reference in recent calibrations, which is then left uncorrected (Bell et al., 2019). A more in-depth analysis of this methodology for an older model of the CopterSonde is provided in Greene (2018).
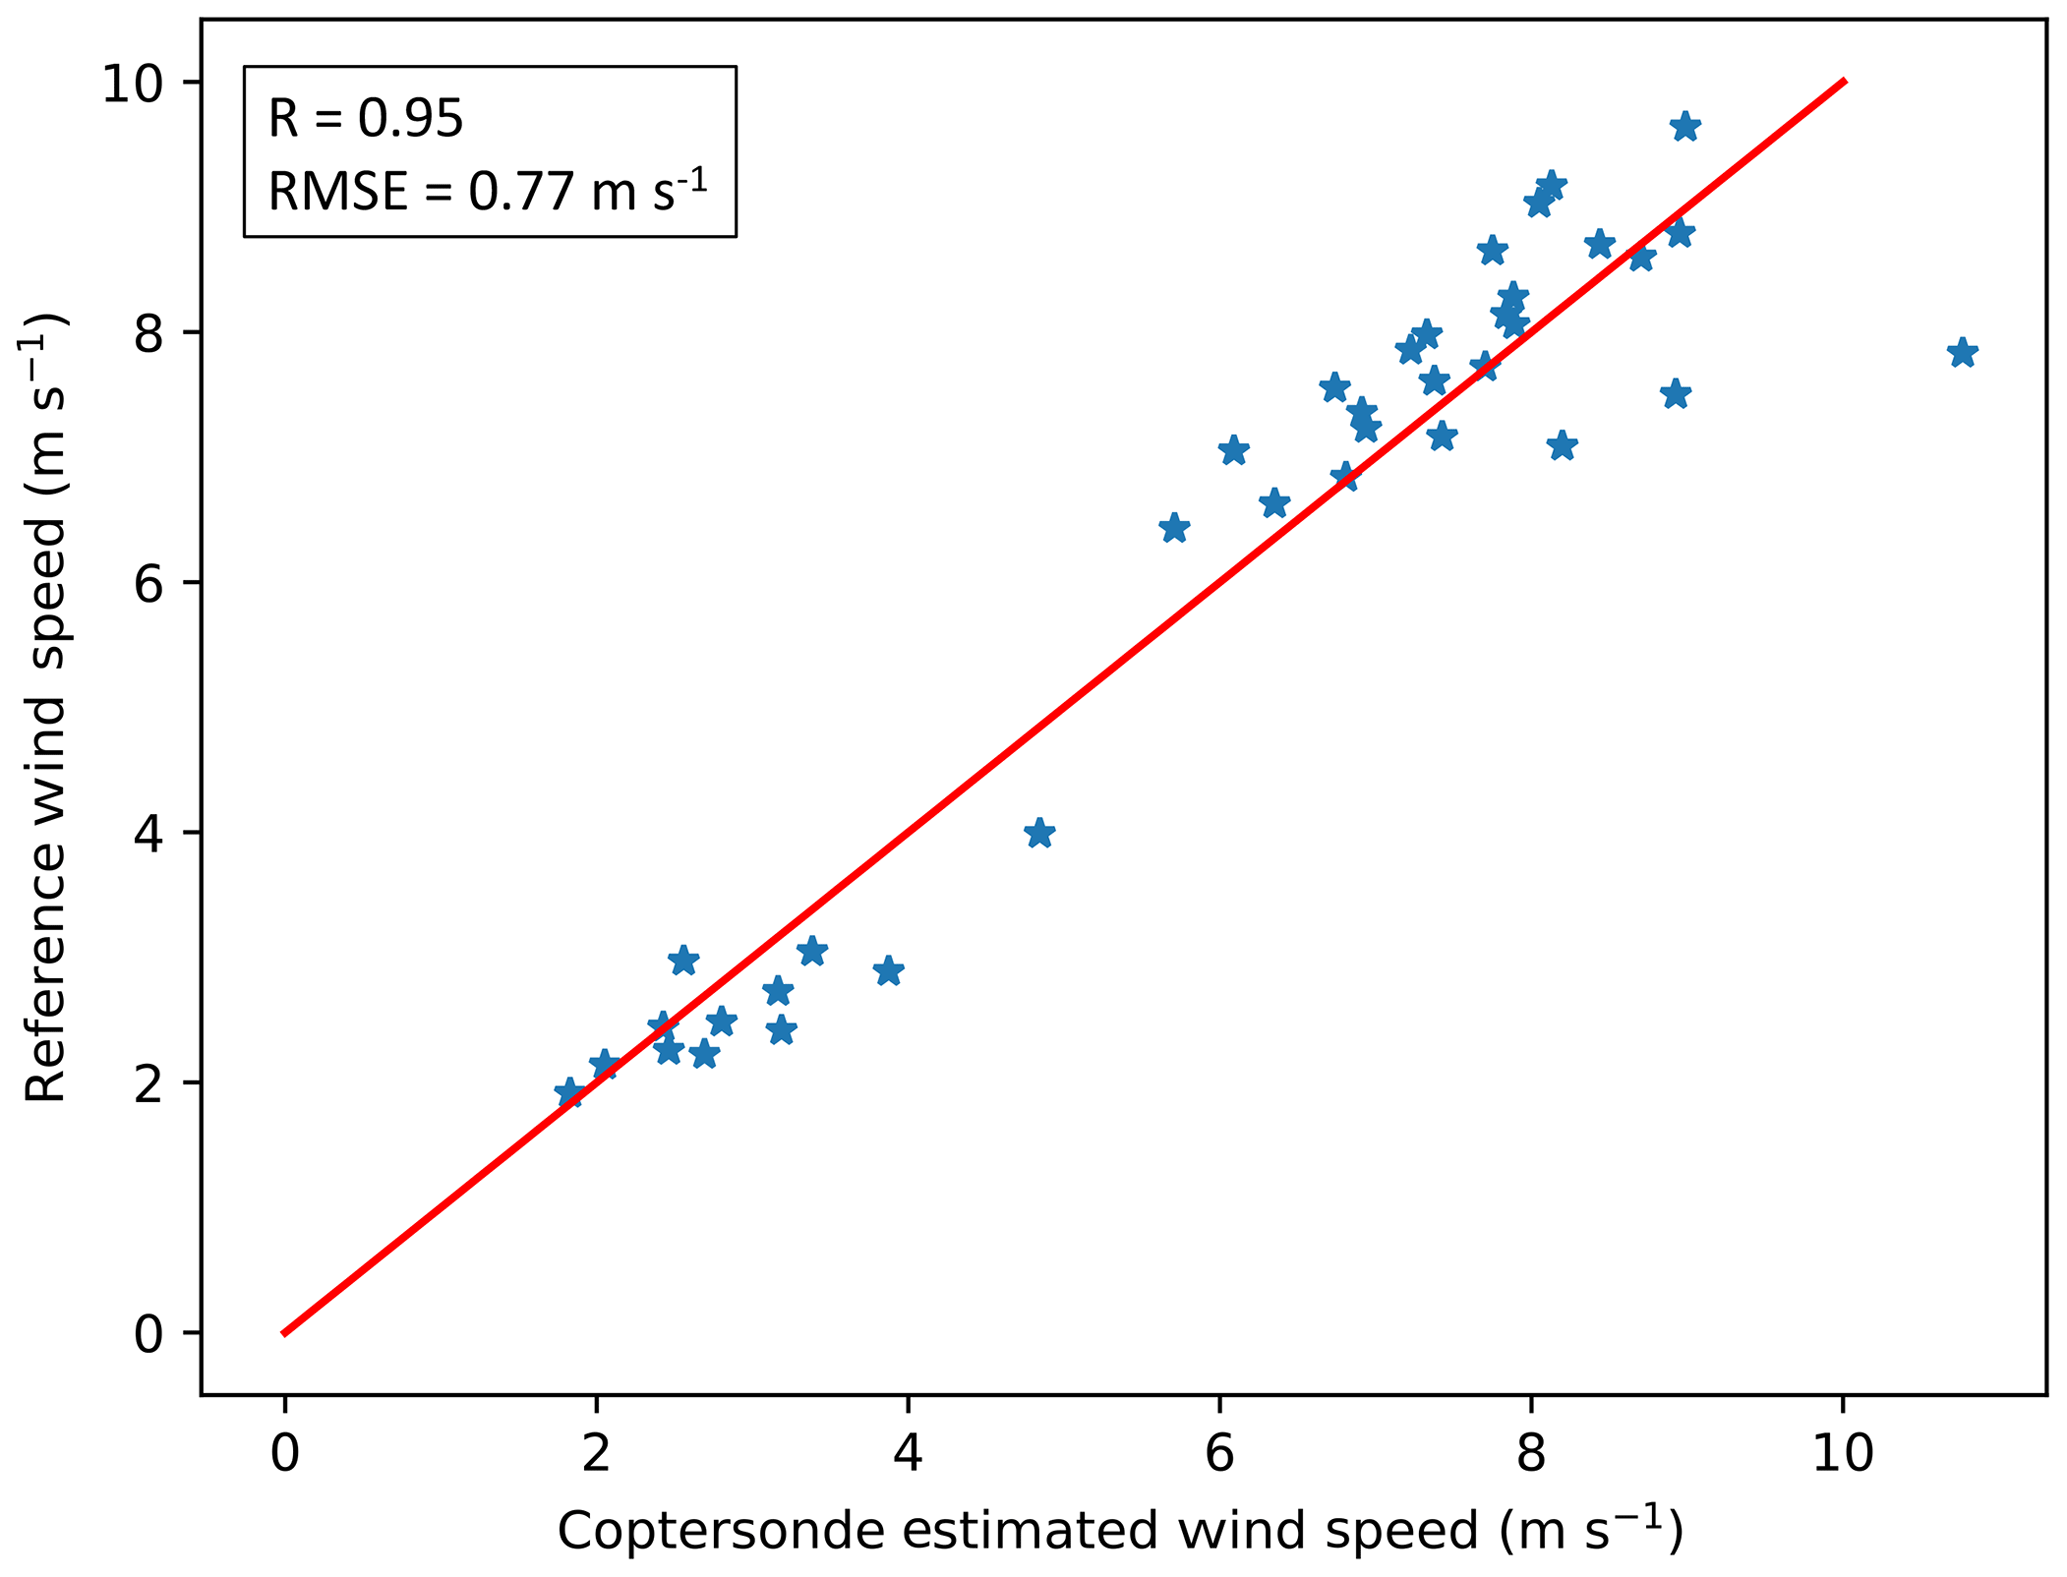
Figure 9Example of CopterSonde wind speed calibration against 1 min Oklahoma Mesonet 10 m anemometer measurements. The red line represents the 1-to-1 line for reference. This statistical fit produces a correlation coefficient of 0.95 and root mean squared error of 0.77 m s−1 compared to the Mesonet reference.
The CopterSonde system, in its present version and in compliance with our current FAA and OU operating requirements, requires a ground crew of three people for flight operations. The head of operations is the pilot in command (PIC) who is in charge of the risk assessment and is responsible for decisions taken during the operation. The second person is the UAS operator and has the duty of preparing and controlling the CopterSonde by means of a remote control (RC) as needed. The CopterSonde can fly autonomously from takeoff to landing; however, the UAS operator can assume control at any time if necessary. The third person is the GCS operator, who builds the waypoint mission and monitors the CopterSonde's streamed parameters through a computer interface.
The takeoff of the CopterSonde is usually performed autonomously and initialized by the UAS operator with the authorization of the PIC. The CopterSonde immediately proceeds to execute the preloaded waypoint mission. The waypoint mission is the desired flight route for the CopterSonde to follow which is planned and created before the flight by the GCS operator. The CopterSonde is capable of performing a variety of flight routes from simple straight lines to complex spline curves. However, the direct vertical ascent and descent pattern is preferred for temperature and humidity profiling, for which the CopterSonde was designed and optimized. The CopterSonde requires at least good GPS conditions to enable autonomous landings. Good GPS conditions are defined by ArduPilot as having horizontal dilution of precision (HDOP) less than five and more than five satellites visible. Moreover, the user can increase the landing precision by placing an infrared beacon in the landing area. The IR-LOCK camera (mentioned in Sect. 2.1) tracks the beacon and sends corrections to the autopilot to precisely guide the CopterSonde while descending. Otherwise, the UAS operator can take control through the remote control and manually land the CopterSonde at any time.
3.1 Ground control station software
The CopterSonde concept extends beyond the aircraft and also includes data handling and distribution systems for the end user. There are three primary components related to the distribution of sensor data from the CopterSonde. The first component is the sensor package within the flight controller that is responsible for collecting the measurement data, logging to a local log file, and transmitting the collected data to the GCS. Sensor data are packed into a custom MAVLink message and transmitted through a telemetry radio to the GCS using ArduPilot's standard messaging platform. The second component is the GCS software, which processes the MAVLink message, plots the live data on various graphical interfaces for visual feedback, and forwards the data to the online cloud service. The final component is the data processing systems located within the cloud computing service Microsoft® Azure. Sensor data are transmitted via the Advanced Message Queueing Protocol (AMQP) to a preprocessing Azure Service Bus, where it then waits to be dequeued by one of the data processing virtual machines. The virtual machines analyze the ingested data, store the results in a cloud database, and finally pass the data to a post-processing Service Bus for interested subscribers.
3.2 Deliverables
The CopterSonde system stores the collected data in multiple ways, which is convenient for creating backups and retrieving the data in any circumstance. While in flight, the CopterSonde is continuously broadcasting data through the telemetry radio to the GCS, which stores and uploads the data to the Azure cloud. The processed data are transferred directly from the post-processing Service Bus to the subscribers, as mentioned in Sect. 3.1. For example, the public web application http://wxuas.com (last access: 1 November 2019) is subscribed to such service and it was created to distribute the CopterSonde's data. The web application then forwards the information directly to connected web clients via web sockets. This enables a live view of the CopterSonde's data for any remote user via the web during flight operations. Another method of data storage is by using the included removable micro-SD card mounted on the Pixhawk board. This method is preferred over the streamed data for post-processing because it stores higher-temporal-resolution data. However, retrieving the data from the SD card requires partially taking the CopterSonde apart which hinders the goal of making the system autonomous. Therefore, there are plans to improve data transmission and increase the temporal resolution of the streamed data to reduce dependence on the SD card transfer. Some useful products generated based on data acquired by the CopterSonde are the Skew-T log-p figures and time–height temperature contours shown in Figs. 10 and 11, respectively. Post-processing and visualization of CopterSonde data are performed in Python using the open-source packages NumPy (van der Walt et al., 2011), Matplotlib (Hunter, 2007), MetPy (May et al., 2008–2019), and SciPy (Virtanen et al., 2019). These two types of visualizations allow atmospheric scientists to understand small-scale ABL processes in frameworks they are already familiar with from radiosondes and ground-based remote sensors.
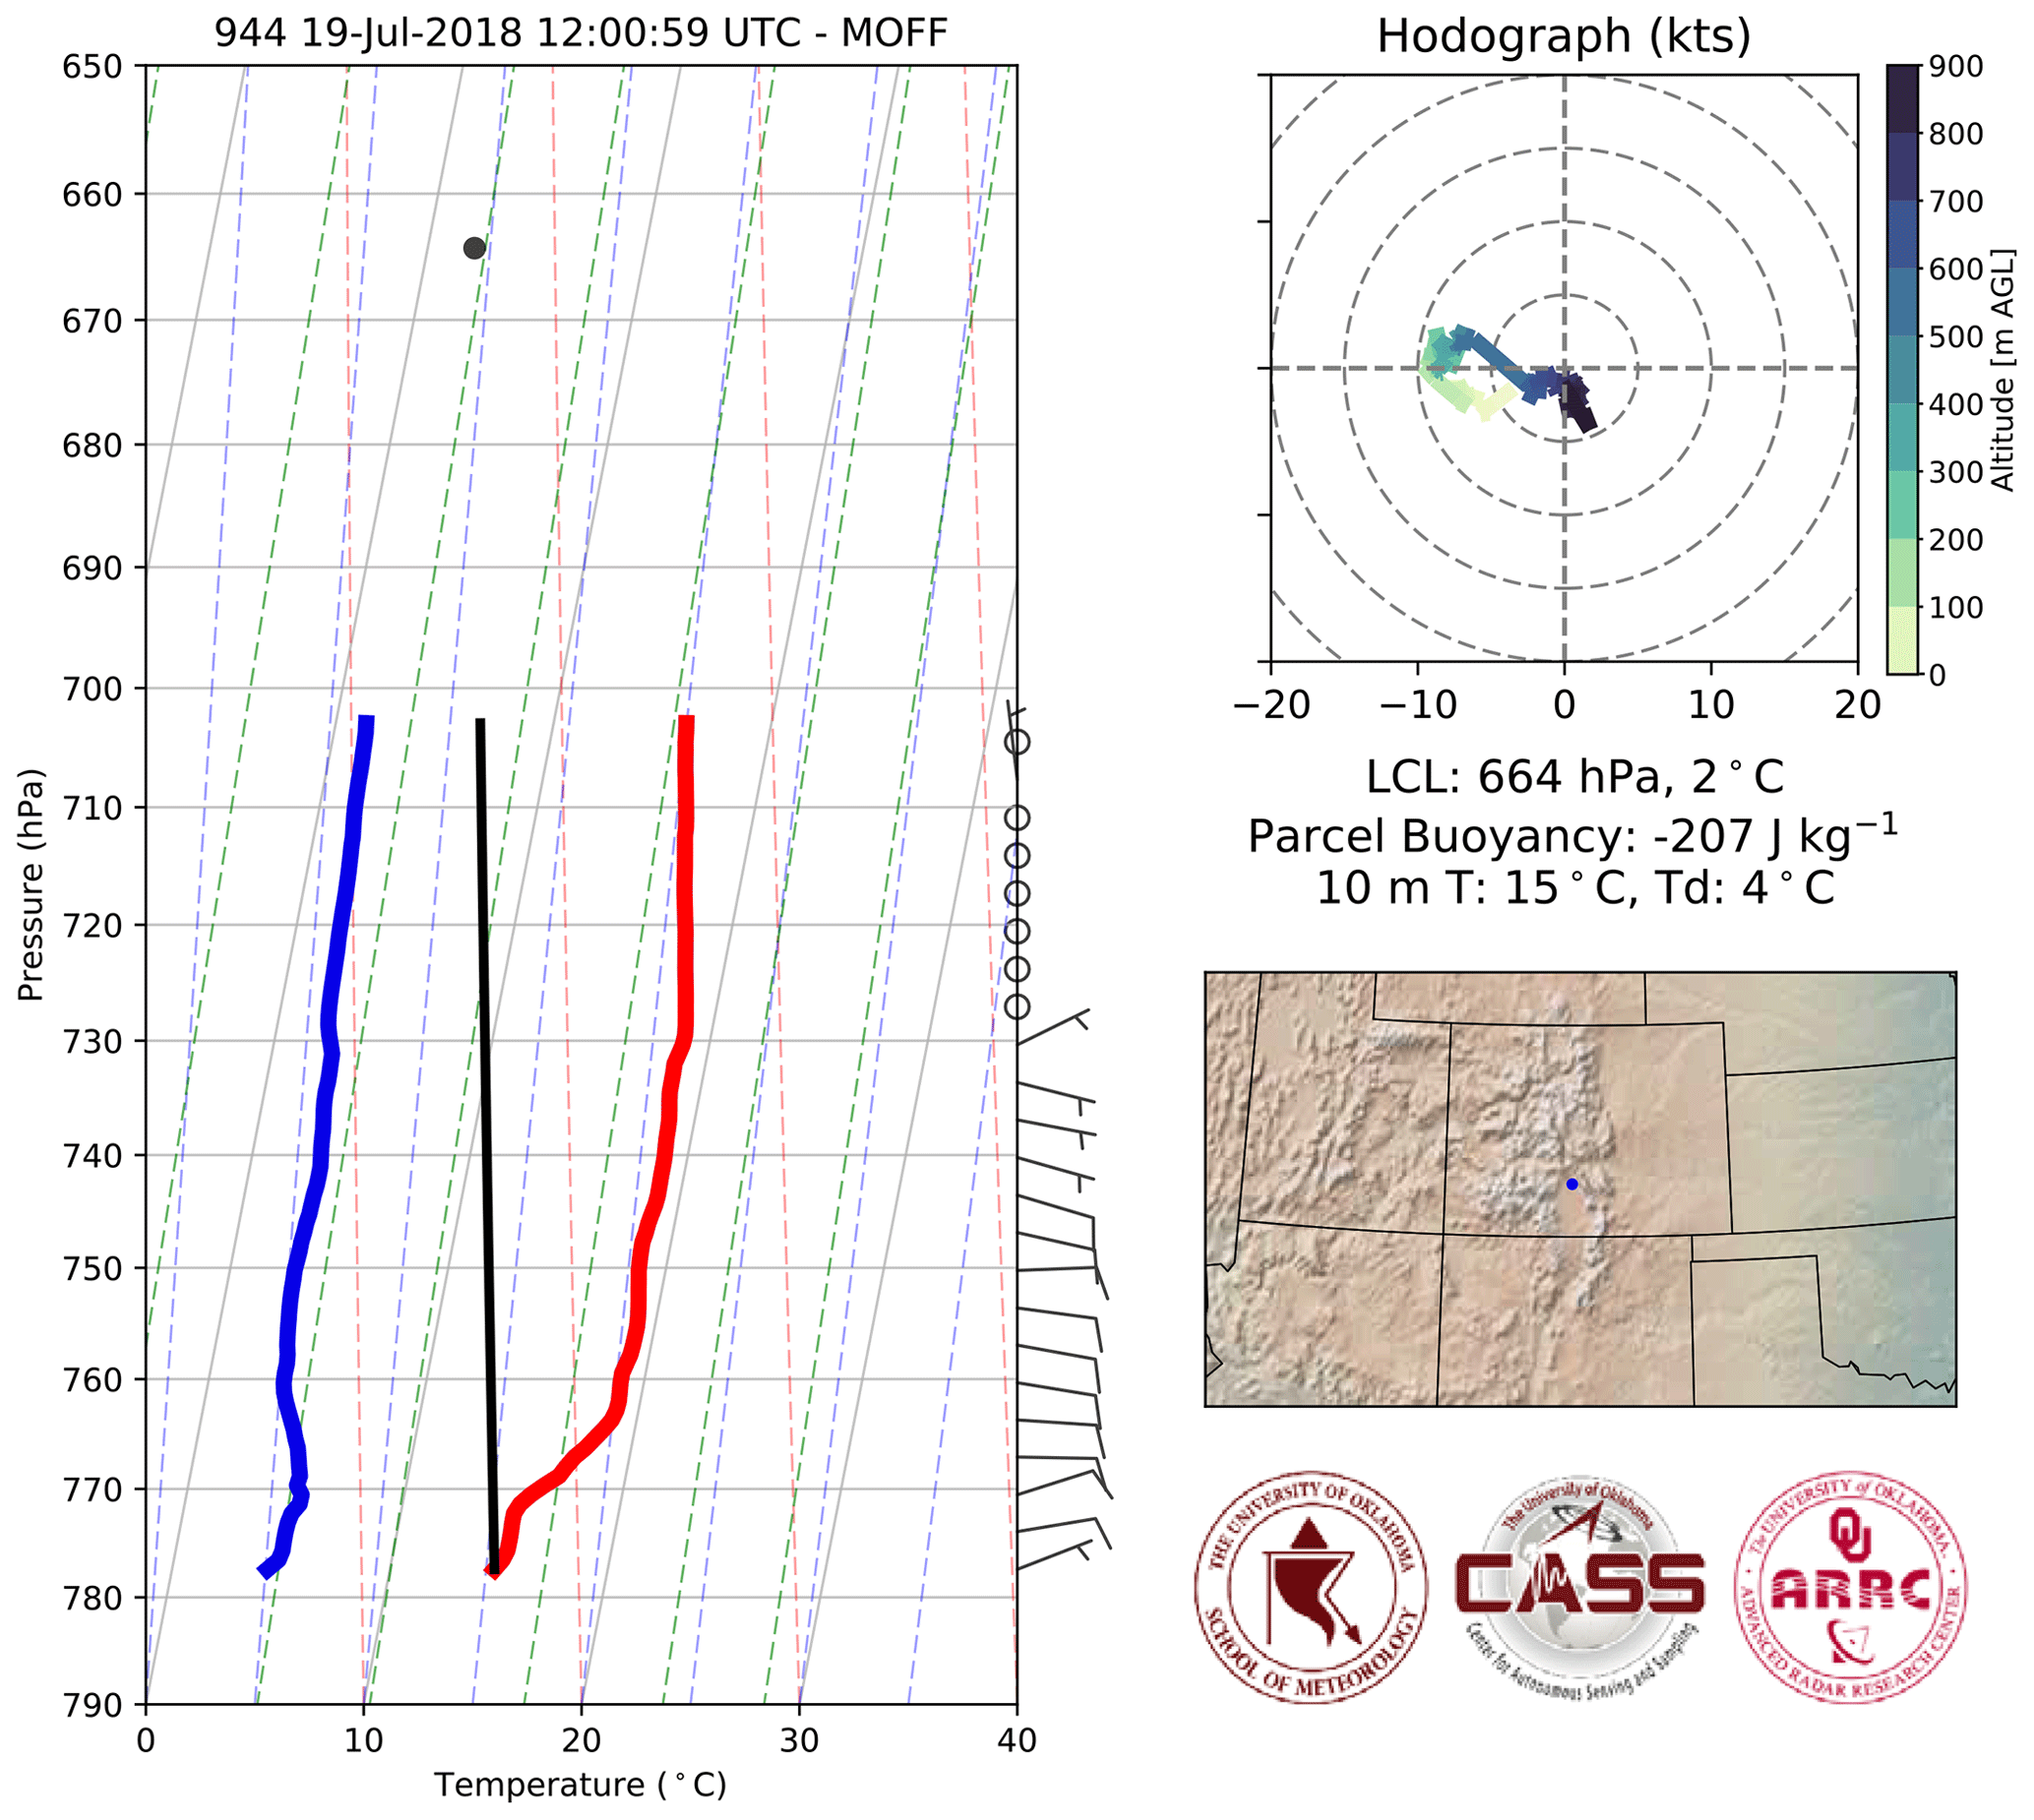
Figure 10Skew-T log-p plot of temperature (red line) and dew point (blue line) generated from a single CopterSonde flight. The surface-based parcel process curve is also included (black line). A hodograph in the upper right corner shows the wind speed and direction over height. Also included are some basic thermodynamic air parcel properties and a map of where the profile was measured. Map is generated using the open-source Basemap package, which references the Generic Mapping Tools dataset (Wessel et al., 2013) for state borders.
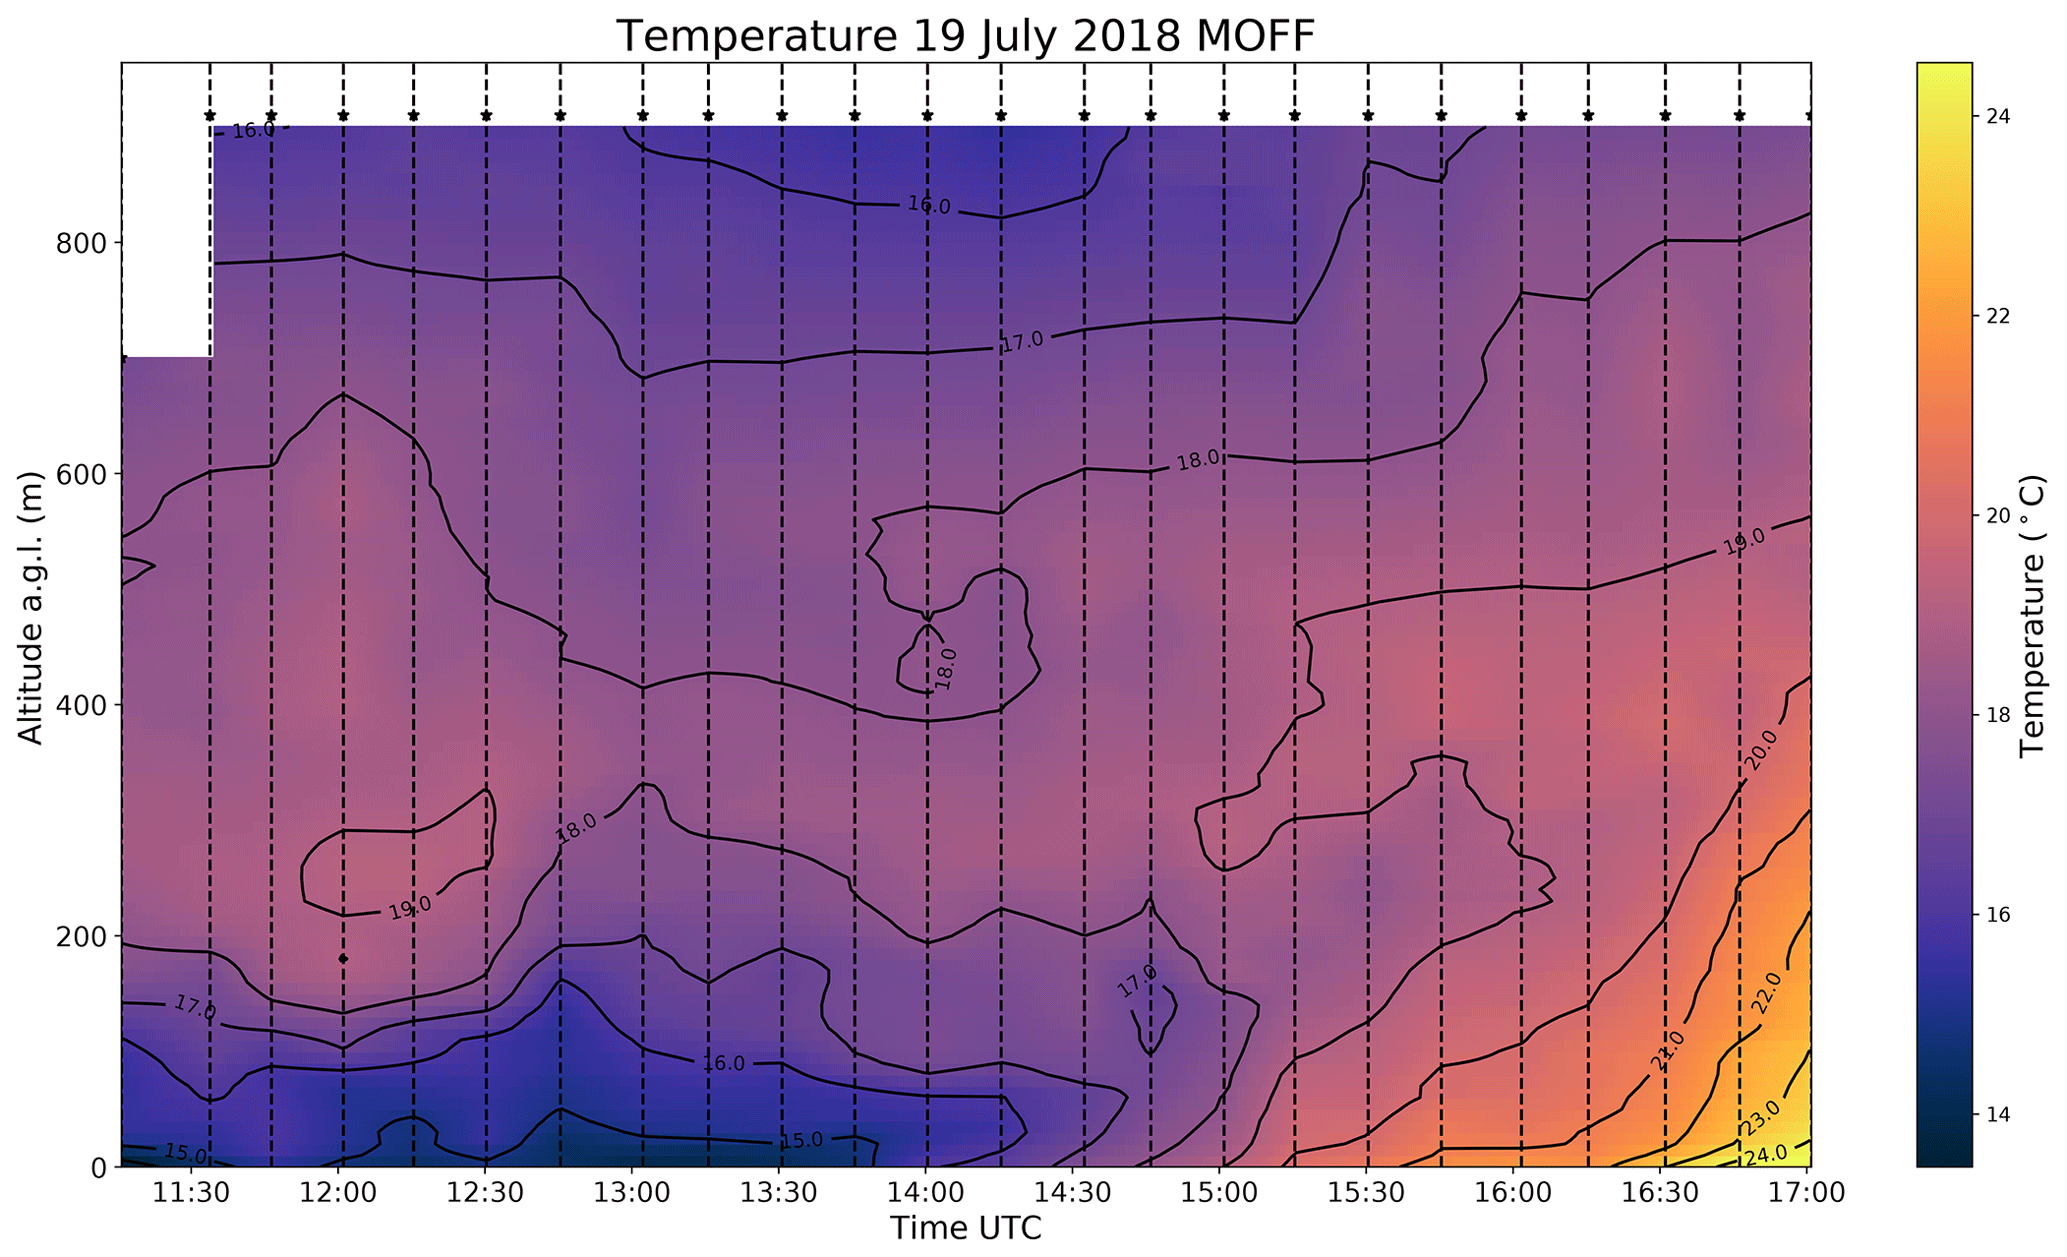
Figure 11Plot of the temperature evolution over time with contour lines up to a height of 914 m. Each CopterSonde profile is separated by about 15 min and is denoted by vertical dashed lines. The contours and color fill are produced by interpolating each observation level in time, resulting in a rectangular time–height cross-section view.
To date, multiple iterations of CopterSonde have been deployed in several measurement campaigns that have encompassed a wide range of meteorological conditions. Each of the field campaigns led to new design ideas that shaped and streamlined the CopterSonde until the current version. The first CopterSonde was deployed in the Environmental Profiling and Initiation of Convection (EPIC) field project in May 2017 to determine the potential of severe weather development (Koch et al., 2018). The CopterSonde was operated for the first time in polar conditions during a 4-week field campaign in Hailuoto, Finland, in February 2018. The experiment was known as the Innovative Strategies for Observations in the Arctic Atmospheric Boundary Layer (ISOBAR), and it was dedicated to the investigation of the atmospheric boundary layer in the arctic environment (Kral et al., 2018). Surface temperatures dropped to around −20 ∘C during the campaign with no notable effects in the CopterSonde performance. It was during this campaign that the CopterSonde achieved its flight altitude record of 1800 m above ground level (a.g.l.).
Prior to then, the CopterSonde was used to sample the atmosphere for direct scientific evaluations and to assess its limits under different conditions. Thorough comparisons of the CopterSonde against conventional weather tools occurred later in 2018. The CopterSonde was also a part of the Lower Atmospheric Profiling Studies at Elevation – A Remotely-piloted Aircraft Team Experiment (LAPSE-RATE) campaign in June 2018, and an in-house Flux Capacitor field campaign in October 2018, both of which extensively studied the CopterSonde's performance and data quality. Comparisons of the CopterSonde's data against data from meteorological towers, radiosondes, and a lidar are discussed in Bell et al. (2019). A brief overview of cases from the last two field campaigns is provided below.
4.1 Case study 1: LAPSE-RATE
The LAPSE-RATE campaign took place in the San Luis Valley in south-central Colorado. This campaign aimed to study various atmospheric phenomena, such as the morning ABL transition, convection initiation, and valley drainage flows, using spatially distributed weather sensing UAS from different research institutes (de Boer et al., 2019). Between the three CopterSonde platforms flown during LAPSE-RATE, there were over 200 successful flights over a span of 5 consecutive days. CASS flew at two different locations each day, one of them situated at the Moffat Consolidated School where the Collaborative Lower Atmospheric Mobile Profiling System (CLAMPS; Wagner et al., 2019) was running and launching radiosondes every couple of hours. CLAMPS contains an Atmospheric Emitted Radiance Interferometer (AERI), a HATPRO microwave radiometer (MWR), and a Halo Photonics scanning Doppler wind lidar. The AERI and MWR data were combined and run through the AERI optimal estimation (AERIoe; Turner and Blumberg, 2018) retrieval to obtain temperature and moisture profiles of the boundary layer. The Doppler lidar performed velocity azimuth display (VAD) scans and vertical stares. CLAMPS also has the ability to store helium tanks and launch radiosondes.
The CASS team operated under a certificate of authorization (COA) granted by the FAA that allowed flights to a maximum altitude of 914 m a.g.l. The CopterSonde flew vertical profile flights with an ascent rate of 3.5 m s−1 and a descent rate of 6 m s−1. It took approximately 8 min to perform a profile, allowing for a 15 min cadence when needed to observe features of interest. The cadence was determined by the meteorological conditions observed from the live data readout discussed in Sect. 3.1.
Sample data from the Moffat site are shown in Fig. 12a–c compared to both co-located radiosondes and remote sensors from CLAMPS. During this time period, winds were less than 5 m s−1 throughout the CopterSonde profile (Fig. 12a). The CopterSonde generally estimated the wind speed to be approximately 2 m s−1 less than both the radiosonde and the VAD from the CLAMPS Doppler lidar. The CopterSonde did successfully capture a directional shear layer around 750 m (Fig. 12b). It should be noted that the wind direction data presented in Fig. 12b reveal better agreement between the CopterSonde and VAD than the CopterSonde and radiosonde. Since the radiosonde drifts with the wind, only the measurements from the CopterSonde and VAD represent true vertical profiles. Moreover, at lower altitudes, below 200 m a.g.l., there is considerable scatter in the wind direction measurements from the CopterSonde and VAD, likely because of the low speeds. The radiosonde data have been smoothed over height. Here, again, there is better agreement between the CopterSonde and VAD. The swinging motion of the instrument package on a radiosonde can produce erroneous result at low altitudes after release. Though the wind speed bias falls outside the stated accuracy above (±0.6 m s−1), it is a consistent bias and can be corrected. Work is ongoing to determine a calibration procedure for calculating the coefficients in Eq. (5) for an ascending rotary-wing UAS, as opposed to a hovering rotary-wing UAS (see Sect. 2.6.2). For this case study, the temperature measured by the CopterSonde is nearly identical to the radiosonde temperature (Fig. 12c).
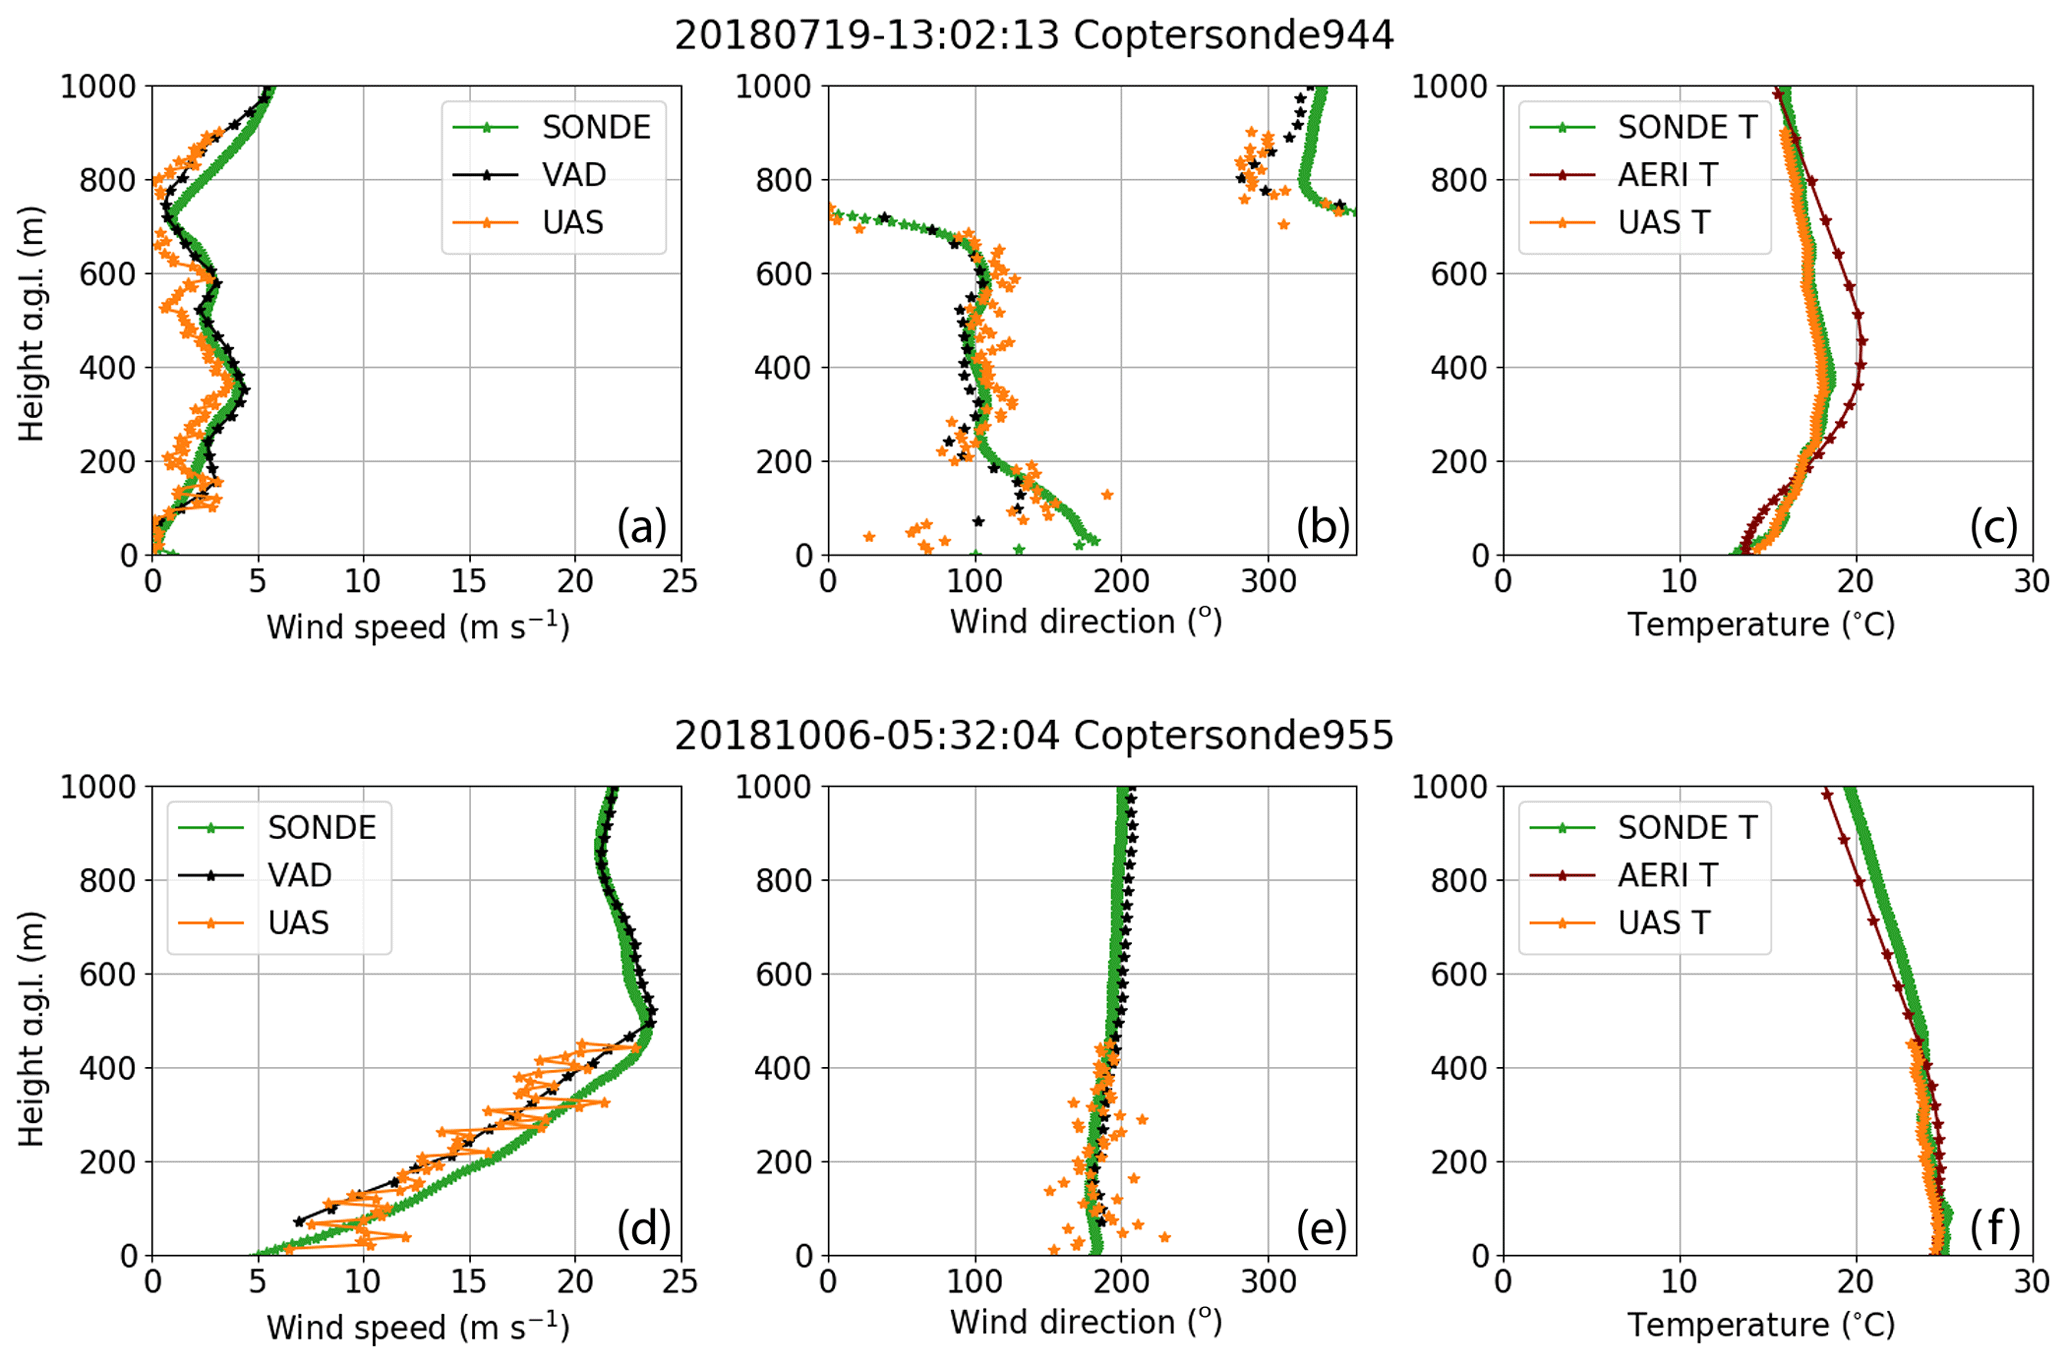
Figure 12Profiles of wind speed (m s−1, a, d), wind direction (degrees, b, e), and temperature (∘C, c, d). Data from LAPSE-RATE (a–c) are from 19 June 2018 at 13:02 UTC, while data from Flux Capacitor (d–e) are from 6 October 2018 at 05:32 UTC.
4.2 Case study 2: Flux Capacitor
In the months following LAPSE-RATE, a local, OU-coordinated campaign, known as Flux Capacitor, was organized to evaluate the CopterSonde over a full 24 h diurnal cycle. This campaign was held at KAEFS. Similar to LAPSE-RATE, CLAMPS was deployed and radiosondes were launched while flights with the CopterSonde were conducted. During this campaign, OU operated under a COA that allowed flights to a maximum altitude of 1500 m, though the team usually could no longer see the CopterSonde past approximately 1200 m and thus was forced to descend to comply with the FAA rule on maintaining visual line of sight on the platform. Figure 12d–f show example data from this campaign.
This time period was characterized by a strong nocturnal low-level jet (Fig. 12d) with wind speeds approaching 25 m s−1 at around 500 m. Due to safety concerns, the CopterSonde was commanded to descend if the pitch was greater than 30∘ due to the high winds. This generally occurred when the wind speed approached 22 m s−1. Again, the CopterSonde estimated wind speeds to be slightly lower (still 2 m s−1) than what was measured by the radiosonde (Fig. 12d). As mentioned before, this is likely due to the coefficients used for the wind estimation Eq. (5). Additionally, the temperatures measured by the CopterSonde agree with the observations from the radiosonde (Fig. 12f).
More detailed statistical analyses of how the CopterSonde performs compared to radiosondes and remote sensors can be found in Bell et al. (2019).
The CopterSonde has been under development for almost 2 years, during which it has undergone near-continuous modifications resulting from lessons learned during several successful deployments in diverse locations and under a variety of weather conditions. The CopterSonde is now capable of providing atmospheric measurements of comparable or better quality than many conventional meteorological instruments. For example, it has been shown that the CopterSonde produces similar results as radiosondes, with the difference being that the CopterSonde is able to control its trajectory and hence its sampling location. However, there are still some aspects that need to be improved, such as better characterization of the CopterSonde for accurate 2-D wind estimations. Despite this, the CopterSonde has been shown to be capable of providing robust and reliable vertical soundings of the ABL. Reusability and safe operability are also distinctive features of the CopterSonde, which make it easier to operate in most locations with low operating costs.
The CopterSonde incorporates adaptive atmospheric sampling through its ability to modify a given flight plan based on the observed environmental parameters, as shown with the wind vane mode. Adding new capabilities and functionalities is a relatively simple process of developing code for the autopilot, conducting initial testing with the ground station simulator, and then performing field tests with the CopterSonde. Moreover, the CopterSonde's adaptive sampling capabilities can provide opportunity to sample the atmosphere in unique ways. For example, the CopterSonde can rapidly determine the temperature gradient while in flight and subsequently adjust its ascent/descent speed to improve the spatial and temporal sampling resolution. Such a feature is currently under development and will be featured in the next CopterSonde iteration. It is the intention of the authors to keep and maintain an open-source code approach.
Finally, the real-time data processing and dissemination feature developed for the CopterSonde is a key component for the meteorological community. The rapid availability of high-spatial-resolution and high-temporal-resolution data can be assimilated into numerical weather prediction models and will help to improve forecasters' situational awareness of prevailing conditions. The authors are collaborating with various modeling teams to explore means to standardize weather data collected by UAS for its assimilation into numerical weather prediction models.
The code used in this paper is available at https://doi.org/10.5281/zenodo.3494656 (Segales et al., 2019).
Data are available upon request to the corresponding author.
The CopterSonde was conceptualized by ARS, WD, and PBC. The methodology was designed by ARS and BRG. The software was developed by ARS and JJM. The formal analysis and post-processing of the data were carried out by ARS, BRG, and TMB. The experiments and data collection were conducted by BRG, TMB, and ARS. The materials and resources were provided by WD and EAPL. The original draft was written by ARS, BRG, TMB, and JJM. The project was supervised by PBC and EAPL. The funding was acquired by PBC.
The authors declare that they have no conflict of interest.
This research has been supported in part by the Vice President for Research and Partnerships (VPRP) of the University of Oklahoma (OU).
This research has been supported by the National Science Foundation, Office of Experimental Program to Stimulate Competitive Research (grant no. 1539070).
This paper was edited by Laura Bianco and reviewed by two anonymous referees.
Bell, T. M., Greene, B. R., Klein, P. M., Carney, M. B., and Chilson, P. B.: Confronting the Boundary Layer Data Gap: Evaluating New and Existing Methodologies of Probing the Lower Atmosphere, Atmos. Meas. Tech. Discuss., https://doi.org/10.5194/amt-2019-453, in review, 2019. a, b, c, d, e
Bonin, T. A., Goines, D., Scott, A., Wainwright, C., Chilson, P. B., and Gibbs, J.: Measuring Structure Function Parameters with a Small Unmanned Aerial System, Bound-Lay. Meteorol., 155, 417–434, https://doi.org/10.1007/s10546-015-0009-9, 2015. a
Brock, F. V., Crawford, K. C., Elliott, R. L., Cuperus, G. W., Stadler, S. J., Johnson, H. L., and Eilts, M. D.: The Oklahoma Mesonet: a technical overview, J. Atmos. Ocean. Tech., 12, 5–19, https://doi.org/10.1175/1520-0426(1995)012<0005:TOMATO>2.0.CO;2, 1995. a
Chilson, P. B., Bell, T. M., Brewster, K. A., Britto Hupsel de Azevedo, G., Carr, F. H., Carson, K., Doyle, W., Fiebrich, C. A., Greene, B. R., Grimsley, J. L., Kanneganti, S. T., Martin, J., Moore, A., Palmer, R. D., Pillar-Little, E. A., Salazar-Cerreno, J. L., Segales, A. R., Weber, M. E., Yeary, M., and Droegemeier, K. K.: Moving towards a Network of Autonomous UAS Atmospheric Profiling Stations for Observations in the Earth's Lower Atmosphere: The 3D Mesonet Concept, Sensors, 19, 2720, https://doi.org/10.3390/s19122720, 2019. a
de Boer, G., Diehl, C., Jacob, J., Houston, A., Smith, S. W., Chilson, P., Schmale, D. G., Intrieri, J., Pinto, J., Elston, J., Brus, D., Kemppinen, O., Clark, A., Lawrence, D., Bailey, S. C., Sama, M. P., Frazier, A., Crick, C., Natalie, V., Pillar-Little, E., Klein, P., Waugh, S., Lundquist, J. K., Barbieri, L., Kral, S. T., Jensen, A. A., Dixon, C., Borenstein, S., Hesselius, D., Human, K., Hall, P., Argrow, B., Thornberry, T., Wright, R., and Kelly, J. T.: Development of community, capabilities and understanding through unmanned aircraft-based atmospheric research: The LAPSE-RATE campaign, B. Am. Meteorol. Soc., accepted, https://doi.org/10.1175/BAMS-D-19-0050.1, 2019. a
Geerts, B., Raymond, D., Barth, M., Detwiler, A., Klein, P., Lee, W.-C., Markowski, P., and Mullendore, G.: Community Workshop on Developing Requirements for In Situ and Remote Sensing Capabilities in Convective and Turbulent Environments (C-RITE), Tech. rep., UCAR/NCAR Earth Observing Laboratory, https://doi.org/10.5065/D6DB80KR, 2017. a
Greene, B. R.: Boundary Layer Profiling Using Rotary-Wing Unmanned Aircraft Systems: Filling the Atmospheric Data Gap, Master's thesis, The University of Oklahoma, available at: https://hdl.handle.net/11244/301374 (last access: 31 October 2019), 2018. a, b
Greene, B. R., Segales, A. R., Waugh, S., Duthoit, S., and Chilson, P. B.: Considerations for temperature sensor placement on rotary-wing unmanned aircraft systems, Atmos. Meas. Tech., 11, 5519–5530, https://doi.org/10.5194/amt-11-5519-2018, 2018. a
Greene, B. R., Segales, A. R., Bell, T. M., Pillar-Little, E. A., and Chilson, P. B.: Environmental and Sensor Integration Influences on Temperature Measurements by Rotary-Wing Unmanned Aircraft Systems, Sensors, 19, 1470, https://doi.org/10.3390/s19061470, 2019. a, b, c, d, e
Hardesty, R. M. and Hoff, R. M.: Thermodynamic Profiling Technologies Workshop Report to the National Science Foundation and the National Weather Service, Tech. Rep. NCAR/TN-488+STR, National Center for Atmospheric Research, https://doi.org/10.5065/D6SQ8XCF, 2012. a
Hunter, J. D.: Matplotlib: A 2D graphics environment, Comput. Sci. Eng., 9, 90–95, https://doi.org/10.1109/MCSE.2007.55, 2007. a
Koch, S. E., Fengler, M., Chilson, P. B., Elmore, K. L., Argrow, B., Andra, Jr., D. L., and Lindley, T.: On the Use of Unmanned Aircraft for Sampling Mesoscale Phenomena in the Preconvective Boundary Layer, J. Atmos. Ocean. Tech., 35, 2265–2288, https://doi.org/10.1175/JTECH-D-18-0101.1, 2018. a
Konrad, T. G., Hill, M. L., Meyer, J. H., and Rowland, J. R.: A small, radio-controlled aircraft as a platform for meteorological sensors, Applied Physics Lab Technical Digest, 10, 11–19, 1970. a
Kral, S., Reuder, J., Vihma, T., Suomi, I., O'Connor, E., Kouznetsov, R., Wrenger, B., Rautenberg, A., Urbancic, G., Jonassen, M., Båserud, L., Maronga, B., Mayer, S., Lorenz, T., Holtslag, A., Steeneveld, G.-J., Seidl, A., Müller, M., Lindenberg, C., Langohr, C., Voss, H., Bange, J., Hundhausen, M., Hilsheimer, P., and Schygulla, M.: Innovative Strategies for Observations in the Arctic Atmospheric Boundary Layer (ISOBAR) – The Hailuoto 2017 Campaign, Atmosphere, 9, 268, https://doi.org/10.3390/atmos9070268, 2018. a
May, R. M., Arms, S. C., Marsh, P., Bruning, E., Leeman, J. R., Goebbert, K., Thielen, J. E., and Bruck, Z.: MetPy: A Python Package for Meteorological Data, https://doi.org/10.5065/D6WW7G29, 2008–2019. a
McPherson, R. A., Fiebrich, C. A., Crawford, K. C., Kilby, J. R., Grimsley, D. L., Martinez, J. E., Basara, J. B., Illston, B. G., Morris, D. A., Kloesel, K. A., Stadler, S. J., Melvin, A. D., Sutherland, A. J., Shrivastava, H., Carlson, J. D., Wolfinbarger, J. M., Bostic, J. P., and Demko, D. B.: Statewide monitoring of the mesoscale environment: A technical update on the Oklahoma Mesonet, J. Atmos. Ocean. Tech., 24, 301–321, https://doi.org/10.1175/JTECH1976.1, 2007. a
National Academies of Sciences, Engineering, and Medicine: Thriving on Our Changing Planet: A Decadal Strategy for Earth Observation from Space, The National Academies Press, Washington, D.C., https://doi.org/10.17226/24938, 2018. a, b, c
National Research Council, Washington, D.: Observing Weather and Climate from the Ground Up: A Nationwide Network of Networks, Natl. Acad. Press, https://doi.org/10.17226/12540, 2009. a
Neumann, P. P. and Bartholmai, M.: Real-time wind estimation on a micro unmanned aerial vehicle using its inertial measurement unit, Sensor Actuat. A-Phys., 235, 300–310, https://doi.org/10.1016/j.sna.2015.09.036, 2015. a, b, c, d
Palomaki, R. T., Rose, N. T., van den Bossche, M., Sherman, T. J., and De Wekker, S. F.: Wind estimation in the lower atmosphere using multirotor aircraft, J. Atmos. Ocean Tech., 34, 1183–1191, https://doi.org/10.1175/JTECH-D-16-0177.1, 2017. a
Reuder, J., Brisset, P., Jonassen, M., Müller, M., and Mayer, S.: The Small Unmanned Meteorological Observer SUMO: A new tool for atmospheric boundary layer research, Meteorol. Z., 18, 141–147, https://doi.org/10.1127/0941-2948/2009/0363, 2009. a
Segales, A. R., Tridgell, A., Mackay, R., Barker, P., Marchi, L. D., WickedShell, Riseborough, P., Pittenger, T., Jason4short, Kancir, P., Jschall, de Sousa, G. J., Hall, L., Oborne, M., Walser, J., Hickey, P., Lucas, A., Lefebvre, R., Purohit, S. B., Ferreira, F., Katsutoshi, M., de Oliveira Filho, C. M., Staroselskii, G., Morphett, G., Denecke, M., Shamaev, E., Beraud, J., Jehangir, R., Hall, P., Goppert, J., and Vilches, V. M.: oucass/CASS-ardupilot: CASSv1.5.1-Copter-3.6.11, Zenodo, https://doi.org/10.5281/zenodo.3494656, 2019. a, b
Turner, D. D. and Blumberg, W. G.: Improvements to the AERIoe Thermodynamic Profile Retrieval Algorithm, IEEE J. Sel. Top. Appl., 12, 1–16, https://doi.org/10.1109/JSTARS.2018.2874968, 2018. a
van der Walt, S., Colbert, S. C., and Varoquaux, G.: The NumPy Array: A Structure for Efficient Numerical Computation, Comput. Sci. Eng., 13, 22–30, https://doi.org/10.1109/MCSE.2011.37, 2011. a
Virtanen, P., Gommers, R., Oliphant, T. E., Haberland, M., Reddy, T., Cournapeau, D., Burovski, E., Peterson, P., Weckesser, W., Bright, J., van der Walt, S. J., Brett, M., Wilson, J., Jarrod Millman, K., Mayorov, N., Nelson, A. R. J., Jones, E., Kern, R., Larson, E., Carey, C., Polat, İ., Feng, Y., Moore, E. W., VanderPlas, J., Laxalde, D., Perktold, J., Cimrman, R., Henriksen, I., Quintero, E. A., Harris, C. R., Archibald, A. M., Ribeiro, A. H., Pedregosa, F., van Mulbregt, P., and SciPy 1.0 Contributors: SciPy 1.0–Fundamental Algorithms for Scientific Computing in Python, arXiv e-prints, arXiv:1907.10121, 2019. a
Wagner, T. J., Klein, P. M., and Turner, D. D.: A New Generation of Ground-Based Mobile Platforms for Active and Passive Profiling of the Boundary Layer, B. Am. Meteorol. Soc., 100, 137–153, https://doi.org/10.1175/BAMS-D-17-0165.1, 2019. a
Wainwright, C. E., Bonin, T. A., Chilson, P. B., Gibbs, J. A., Fedorovich, E., and Palmer, R. D.: Methods for Evaluating the Temperature Structure-Function Parameter Using Unmanned Aerial Systems and Large-Eddy Simulation, Bound-Lay. Meteorol., 155, 189–208, https://doi.org/10.1007/s10546-014-0001-9, 2015. a
Wessel, P., Smith, W. H. F., Scharroo, R., Luis, J., and Wobbe, F.: Generic Mapping Tools: Improved Version Released, EOS T. Am. Geophys. Un., 94, 409–410, https://doi.org/10.1002/2013EO450001, 2013. a
Wildmann, N., Hofsäß, M., Weimer, F., Joos, A., and Bange, J.: MASC – a small Remotely Piloted Aircraft (RPA) for wind energy research, Adv. Sci. Res., 11, 55–61, https://doi.org/10.5194/asr-11-55-2014, 2014. a