the Creative Commons Attribution 4.0 License.
the Creative Commons Attribution 4.0 License.
 | 05 Jun 2020
Comparing lightning observations of the ground-based European lightning location system EUCLID and the space-based Lightning Imaging Sensor (LIS) on the International Space Station (ISS)
Dieter R. Poelman
Wolfgang Schulz
The Lightning Imaging Sensor (LIS) on the International Space Station (ISS), hereafter referred to as ISS-LIS, detects lightning from space by capturing the optical scattered light emitted from the top of the clouds. The ground-based European Cooperation for Lightning Detection (EUCLID) makes use of the low-frequency electromagnetic signals generated by lightning discharges to locate them accordingly. The objective of this work is to quantify the similarities and contrasts between these two distinct lightning detection technologies by comparing the EUCLID cloud-to-ground strokes and intracloud pulses to the ISS-LIS groups in addition to the correlation at the flash level. The analysis is based on the observations made between 1 March 2017 and 31 March 2019 within the EUCLID network and limited to 54∘ north. A Bayesian approach is adopted to determine the relative and absolute detection efficiencies (DEs) of each system. It is found that the EUCLID relative and absolute flash DE improves by approximately 10 % towards the center of the EUCLID network up to a value of 56.3 % and 69.0 %, respectively, compared to the averaged value over the full domain, inherent to the network geometry and sensor technology. In contrast, the relative and absolute ISS-LIS flash DE over the full domain is 48.4 % and 71.3 %, respectively, and is somewhat higher than the values obtained in the center of the EUCLID network. The behavior of the relative DE of each system in terms of the flash characteristics of the other reveals that the greater the value, the more likely the other system will detect the flash. For instance, when the ISS-LIS flash duration is smaller than or equal to 200 ms, the EUCLID relative flash DE drops below 50 %, whereas it increases up to 80 % for ISS-LIS flashes with a duration longer than 750 ms. Finally, the distribution of the diurnal DE indicates a higher DE for the ISS-LIS and a lower DE for EUCLID at night.
- Article
(923 KB) - Full-text XML
- BibTeX
- EndNote


Lightning processes in the cloud and from cloud to ground involve the formation of channels carrying tens of kiloamperes of electric current with temperatures as high as 30 000 K. Those processes are accompanied by intense radiation in the optical frequency range with the peak power typically being of the order of 109 W (Christian et al., 1989). These optical emissions are a result of dissociation, excitation, and subsequent recombination of various atmospheric constituents as a result of the sudden intense heating, and they primarily occur at discrete atomic lines. Satellite-based optical imagers operating in the visible and near-infrared frequency ranges record these optical emissions. The geolocation is carried out by using geometric projection of the images taken from space. In the 1970s, different satellite programs started to use various optical sensors to measure lightning, e.g., Vorpahl et al. (1970), Sparrow and Ney (1971), and Turman (1978). Due to the limited technology at this time, these satellite-based sensors had location accuracies of the order of hundreds of kilometers due to the low spatial resolution of the optical imagers and a detection efficiency of less than 2 %. In 1995 the OV-1 (MicroLab 1) satellite carrying the Optical Transient Detector (OTD) was launched, followed by the Tropical Rainfall Measuring Mission (TRMM) satellite carrying the Lightning Imaging Sensor (LIS), hereafter referred to as TRMM-LIS, in 1997. OV-1 orbited at an altitude of 750 km, whereas the TRMM originally rotated at an altitude of 350 km and has been rotating at an altitude of 400 km since 2001 (Cecil et al., 2014). These two satellites had a large field of view (FOV) of 1300 km×1300 km and 600 km×600 km for the OTD and LIS, respectively. Those optical imagers measure the signals emitted at 777.4 nm associated with the dissociation of molecular oxygen into atomic oxygen due to intense heating produced by lightning processes. Data from such sensors typically consist of the time of occurrence of the lightning discharge, its latitude, and its longitude. The spectral energy density for each event is also available (Koshak, 2010), but interpretation of these measurements is complicated because the optical properties of the path between the emission and the measurement point vary. Since no relationship exists between the peak optical radiance measured by such sensors and the peak currents of lightning discharges, estimated peak current and polarity of lightning discharges are not reported by satellite-based lightning sensors. The OTD and LIS have a location accuracy of about 10 to a few tens of kilometers and a temporal resolution of several milliseconds (e.g., Boccippio et al., 2000). They detect emissions from both cloud and cloud-to-ground discharges but cannot distinguish between the two. The total flash detection efficiency for the LIS during the day and at night is estimated to be 70 % and 88 %, respectively, and approximately 38 % and 52 %, respectively, for the OTD (see Boccippio et al., 2002, and Cecil et al., 2014). It is important to note that, similar to very high frequency (VHF) lightning mapping systems, optical imagers are able to map the full spatial extent of flashes, although with poorer temporal and spatial resolution, and hence may be viewed as lightning mapping systems. Since these optical imagers on low-earth-orbiting satellites observe a given location on the earth's surface for a limited time, typically around 90 s to a few minutes, they can only take snapshots of thunderstorms and cannot monitor them as they develop and evolve.
Generally, for all applications of lightning data it is important to know the performance of the employed lightning location system (LLS). The performance characteristics of lightning location systems are determined by their ability to geolocate lightning discharges with high location accuracy (LA), high detection efficiency (DE), and a low false detection rate and to report various other features of the lightning discharge correctly. Different methods or a combination of methods may be used to validate the performance characteristics of different types of lightning locating systems (see Nag et al., 2015). To get information about performance variations over large spatial regions of the ground-based LLS, data of those systems were compared to data from the TRMM-LIS. In recent years several papers have provided additional insights into the performance of ground-based networks with such an analysis, e.g., the World Wide Lightning Location Network (WWLLN; Rudlosky and Shea, 2013), the U.S. National Lightning Detection Network (NLDN; Zhang et al., 2016), the Earth Networks Total Lightning Network (ENTLN; Rudlosky, 2015), the Arrival Time Difference Network (UK Met Office) (ATDnet; Enno et al., 2018), and the Vaisala Global Lightning Dataset (GLD360; Said et al., 2010). One has to keep in mind that during the last years the performance of the ground-based networks improved significantly, and therefore the analyses of data between 2008 and 2014 may not provide information about the current LLS performance.
In April 2013 it was decided that an LIS, built as the flight spare for the TRMM satellite, should be put on the International Space Station (ISS), and almost 4 years later (March 2017) the instrument started recording data. The data of this sensor, called the ISS-LIS, were analyzed in Erdmann et al. (2020) for the time period March 2017 to March 2018. They compared for the first time, although in a small part of Europe, ISS-LIS data to the low-frequency LLS data of Météorage and the lightning mapping array SAETTA (Coquillat et al., 2019) over the northwestern Mediterranean Sea near Corsica. In this paper the performance of EUCLID (European Cooperation for Lightning Detection), a ground-based LLS similar to the LLS of Météorage, will be evaluated against ISS-LIS data over an extended time period and a larger area in Europe as compared to Erdmann et al. (2020). This work is timely given that the Meteosat Third Generation (MTG), which has a Lightning Imager (LI) on board, will probably be launched in 2021.
2.1 EUCLID
Since 2001, the European Cooperation for Lightning Detection (EUCLID) has been geolocating cloud-to-ground (CG) strokes and intracloud (IC) pulses through a combination of time-of-arrival (TOA) and direction finding (DF) techniques. The EUCLID cooperation is special in the sense that it combines real-time raw sensor data of independent lightning location systems – either managed by national meteorological services (NMSs) or by private companies – within a single processor. This is possible since all of the sensors operate in the same low-frequency (LF) range and are from the same manufacturer, Vaisala. The central processor of EUCLID adopts individually calibrated sensor gains and sensitivities to account for any local sensor site conditions. Those values can differ from the ones used by the local LLS provider due to the implicit higher redundancy in EUCLID as a result of the inclusion of additional sensors located outside national borders in a neighboring country. Hence, it assures that the resulting lightning data are of high and nearly homogeneous quality throughout Europe. The performance of EUCLID has been frequently tested over the years in terms of its LA, DE, and peak current estimation. Those performances have been determined either from direct lightning measurements at the Gaisberg Tower (GBT; Diendorfer et al., 2009), Peißenberg tower in Germany (Heidler and Schulz, 2016), and Säntis Tower in Switzerland (Romero et al., 2011; Azadifar et al., 2016) as well as from video and E-field records collected in different regions within Europe (Poelman et al., 2013; Schulz et al., 2016). The current LA is of the order of 100 m based on the location error directly measured at the GBT and based on video and E-field recordings within the majority of the network. The DE for negative CG strokes and flashes reaches 70 % and 96 %, respectively, based on GBT data and are determined to be 84 % and 98 %, respectively, using video and E-field records. On the other hand, the DE for positive discharges is greater than 84 % and 87 % for CG strokes and CG flashes, respectively (Schulz et al., 2016). Finally, IC DE has been validated during the HyMeX experiment (Ducrocy et al., 2013; Defer et al., 2015) in the south of France (Schulz et al., 2014; Pédeboy et al., 2014). For this purpose, EUCLID observations were matched to the observations made by the lightning mapping array “HyLMA”. It is found that the DE of isolated IC flashes, i.e., pure IC flashes without any CG stroke in them, has a large variation ranging from 10 % up to 67 % from one thunderstorm to another. This variability is mainly attributed to differences in the vertical extent of the IC flash and to the flash rates during a storm. Regarding the peak current estimates, EUCLID tends to overestimate those slightly with respect to the currents measured at the GBT with a median error of 4 %. More information regarding the performance and observations by the EUCLID network can be found in Schulz et al. (2016) and Poelman et al. (2016).
2.2 The ISS-LIS
The Lightning Imaging Sensor (LIS) aboard the International Space Station (ISS) is identical to the LIS used on the TRMM satellite, which was operational from 1999 to 2015. The LIS on the ISS was installed in February 2017 with an original intended mission lifespan of two years and has been collecting lightning data from that point onward from a low earth orbit (LEO) at an altitude of about 408 km, similar to the altitude of the TRMM satellite after 2001. The LIS sensor combines a wide-FOV lens with a narrow-band interference filter of 1 nm centered on the strong oxygen triplet emission line at 777.4 nm. In addition, the LIS employs an optical staring imager composed of a 128×128 charged coupled device (CCD) array with a sampling rate of approximately 500 frames per second. Although latitudinal coverage is expanded poleward to 54∘ due to a larger orbit inclination (55∘ instead of 35∘ for the TRMM satellite), the performance characteristics of the ISS-LIS are similar to those of the TRMM-LIS. This means that the electrical activity within thunderstorms is detected with a resolution of 4 km at nadir and increases somewhat towards the edge of the measurement region with a swath width of about 650 km of the earth's surface. Hence, due to the continuous movement of the ISS with an orbital speed of approximately 7 km s−1, lightning observations over a specific region last no longer than 90 s per overpass. When a lightning discharge occurs, the optical signal scatters throughout the cloud. In almost all of the cases except in the unlikely case that the cloud is extremely optically thick, this results in an extended area being lit up on the top of the cloud when viewed from space. At the moment a pixel on the CCD array receives this optical pulse, the signal is compared to the dynamically changing detection background threshold. Once this threshold is exceeded, the processor identifies the illuminated pixel as an LIS event. It is important to note that an LIS event has no counterpart when compared to the observations made by a ground-based LLS such as EUCLID. However, the collection of LIS events from adjacent pixels during the same 2 ms frame integration time, defined as an LIS group, is comparable with either a CG stroke or cloud pulse. Note that the ISS-LIS group location is the radiance-weighted centroid of all the events within the respective group (Mach et al., 2007). Consequently, groups are clustered within a flash when the spatial and time criteria of 5.5 km and 330 ms, respectively, are met. In contrast to EUCLID, the LIS is not able to distinguish between CG and IC lightning. Nevertheless, Boccippio et al. (2002) estimated an upper bound for the TRMM-LIS total flash DE of 88±9 %.
In this work, we make use of the non-quality-controlled ISS-LIS dataset (Publication date: 2019-08-19, version 1, processing level 2) made available by the NASA Global Hydrology Resource Center DAAC (Blakeslee, 2019). The non-quality-controlled label is somewhat misleading since the data do include quality information in the form of alert/warning flags; however some improvements to the algorithm creating the ISS-LIS data files are still ongoing. The main issue is the sensitivity of the ISS-LIS compared to the TRMM-LIS, with the DE for the ISS-LIS on the order of 5 % less than the DE for the TRMM-LIS (R. Blakeslee, 2019 GLM Annual Science Team Meeting, Huntsville), impacting to some degree the DE values presented in this paper. The data include information on geolocated and time-tagged lightning events, groups and flashes, orbit statistics, and metadata. For more in-depth information on the LIS instrument, the interested reader is referred to Christian et al. (1989), Blakeslee et al. (2014) and Blakeslee and Koshak (2016).
In this paper EUCLID and ISS-LIS lightning observations are correlated using data from 1 March 2017 until 31 March 2019 as observed within the EUCLID domain and limited to 54∘ north. The ISS-LIS detects optically bright discharges, such as return strokes and in-cloud discharges inducing a rapid change in the electric field (Goodman et al., 1988). Those rapid changes in the electric field are exactly the features detected by EUCLID. Hence, the fundamental unit of the ISS-LIS, i.e., groups, and EUCLID, i.e., CG strokes and IC pulses, largely correspond to the same physical process and are therefore directly comparable (Bitzer et al., 2016). Additionally, the comparison will be performed on the artificially derived flash level as well.
The approach taken in this work has been applied and described in detail in Rubinstein (1994) and Bitzer et al. (2016), in which a probabilistic method is used to estimate the relative and absolute detection efficiencies of both systems under investigation. The concepts are briefly defined hereafter.
Neither EUCLID nor the ISS-LIS observes all the lightning activity that actually occurs at a given moment in time. Hence, let S be the set of all occurred lightning discharges and A and B be the set of discharges detected by the ISS-LIS and EUCLID, respectively, as illustrated in Fig. 1. It is possible that both of the systems contain some false alarm detections and therefore fall outside S. However, those false alarms constitute roughly 1 % of the total number of discharges detected by EUCLID (Poelman et al., 2017), whereas the false event rate requirement for the LIS is set to be less than 5 %. Hence, the latter has a minor influence on the final outcome. The system-dependent relative detection efficiencies can be expressed as
with nA and nB being the number of discharges detected by system A and B, respectively, and nA⋂nB being the intersection containing discharges detected by both systems. Thus P(A|B) represents the conditional probability that LLS A detects a discharge relative to LLS B, and vice versa in the case of P(B|A). In addition, the true detection efficiency, for example of system A, reads as
whereas the actual number of occurred discharges nS is not known a priori. Therefore, the estimated absolute detection efficiencies (ignoring false detections) can be calculated in the following way:
Since the number of detections in S, nS, is larger than the unique set of combined discharges in A and B, the estimated absolute DE is an upper limit of the true detection efficiency. In order to precisely calculate the above detection efficiencies, only those EUCLID discharges that occurred within the ISS-LIS FOV, nB, need to be taken into account. To this end, the corner points of two consecutive ISS-LIS FOVs, separated by roughly 35 s, are extrapolated to every second to increase accuracy. Then, for each second the EUCLID detections are extracted within the respective FOV. As an example, ISS-LIS flashes and EUCLID CG and IC flashes are plotted on top of the ISS-LIS FOV in Fig. 2. This is the biggest difference compared to the future MTG LI observations from a geostationary orbit. Next, the individual EUCLID CG strokes and IC pulses are correlated in time and space with the ISS-LIS groups in order to retrieve the number of overlapping detections. A match is found when the temporal and spatial criteria of 10 ms and 20 km, respectively, are fulfilled. Those particular criteria have been used in similar intercomparison studies such as Franklin (2013), Bitzer et al. (2016), and Zhang et al. (2016, 2019). Note that for the stroke and group DE comparisons one ISS-LIS group can be matched to several EUCLID strokes and/or pulses and vice versa, but for time and location accuracy comparisons only the closest discharge in space is used. At the flash level, matching is somewhat more complicated due to the fact that EUCLID and the ISS-LIS have their own specific flash clustering algorithms. For the flash analysis, EUCLID strokes and pulses are matched to ISS-LIS groups using larger temporal (100 ms) and spatial (30 km) criteria to account for the fact that a flash can consist of different discharges spread over some time interval. Subsequently, the strokes, pulses and groups are traced back to the respective flash they belong to. Thus, a matched flash can have one or multiple matched discharges or groups. Be aware that since the flash grouping algorithms for EUCLID and the ISS-LIS are different, the matched flash count is slightly different depending on whether EUCLID or ISS-LIS data are used as a reference for the matching algorithm. Hence, to account for this difference a scaling factor is applied in the same way as presented in Zhang, 2019 (p. 140–141). Additionally, the absolute DE values at the level of groups and strokes are not relevant since the number of groups per LLS report is very large, thus artificially increasing the ISS-LIS group absolute DE value. Therefore, absolute DE values are only presented at the flash level in this study.
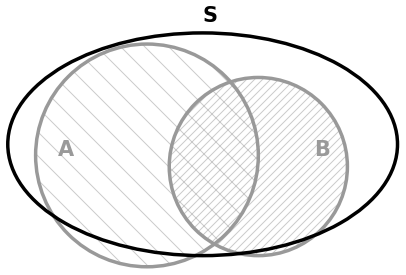
Figure 1A Venn diagram illustrating set S as the total number of occurred lightning discharges and A and B as the set of discharges observed by independent systems. The intersection of A and B is composed of discharges detected by both A and B. Note that there can be a small portion of false-alarm discharges detected by either system that occur outside set S.
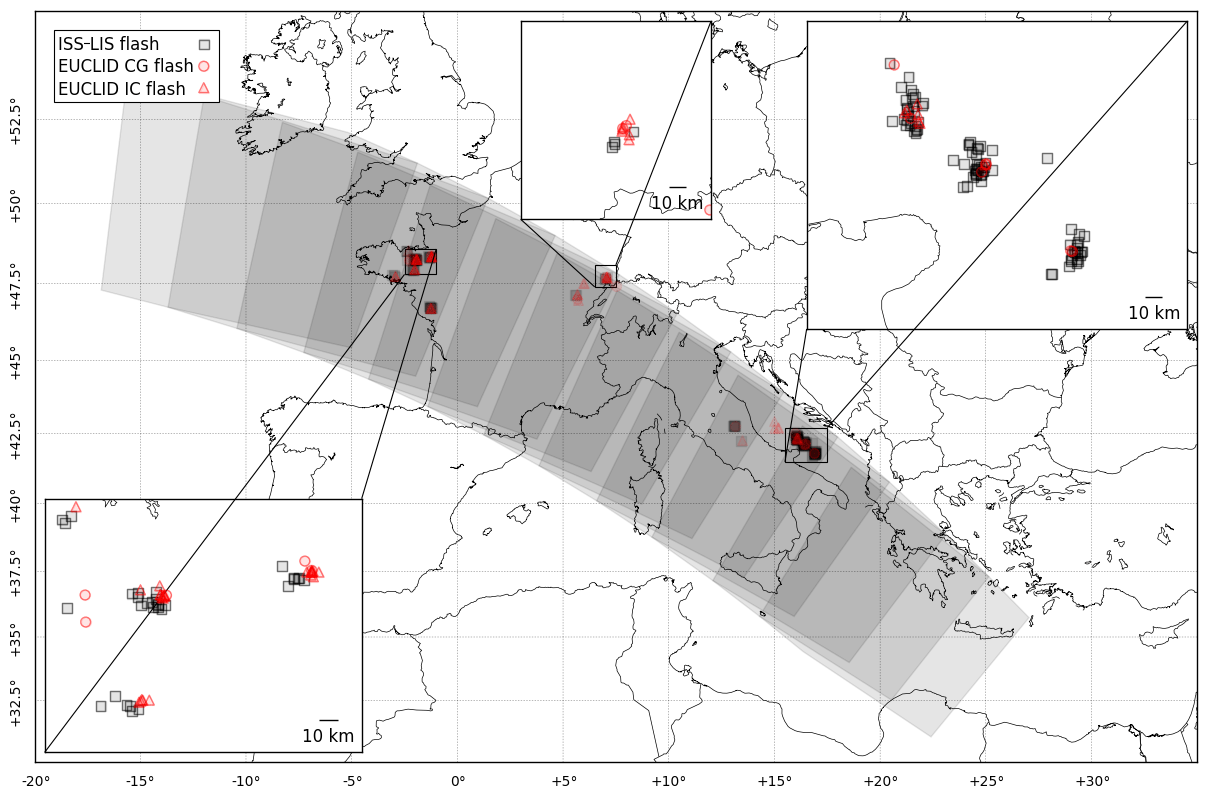
Figure 2Example of an ISS-LIS track over Europe with the LIS field of view at distinct time steps indicated in gray. Lightning flashes observed by the ISS-LIS are displayed as well as the CG and IC flashes detected by EUCLID.
4.1 EUCLID stroke/pulse and ISS-LIS group level
In Fig. 3 the spatial distribution of the IC : CG ratio observed by EUCLID is plotted for IC pulses and CG strokes as well as at the flash level. Only data within the EUCLID domain as indicated by the dashed polygon and cut off at 54∘ north to account for the ISS-LIS latitudinal coverage are used for quantitative analysis in this work. The geographic spread does not reflect the actual IC : CG occurrence within Europe but mainly highlights areas where EUCLID is more capable of detecting IC activity due to sensor technology. Not surprisingly, the highest IC : CG ratios are found in regions where the baseline between LS700x sensors is small and drops off towards the south and east of the domain where mainly IMPACT sensors were installed during the period of investigation. Additionally, during this time period, significant communication problems in the south of Italy and in Spain deteriorated the results. The mean IC : CG stroke and flash ratios over the entire region are 2.6 and 1.9, respectively, and increase to 4.1 and 2.8, respectively, within the rectangle highlighted in white. The rectangle highlighted in white in Fig. 3 will be referred to as the center of the EUCLID network throughout the paper. The mean IC : CG flash ratio in the center of the network is comparable to the values observed by the U.S. National Lightning Detection Network (NLDN) in various parts throughout the contiguous United States as presented by Medici et al. (2017). Since EUCLID observes most of the IC pulses in the center of the network, in the remainder of the paper results will be presented for the full domain as well as for the center.
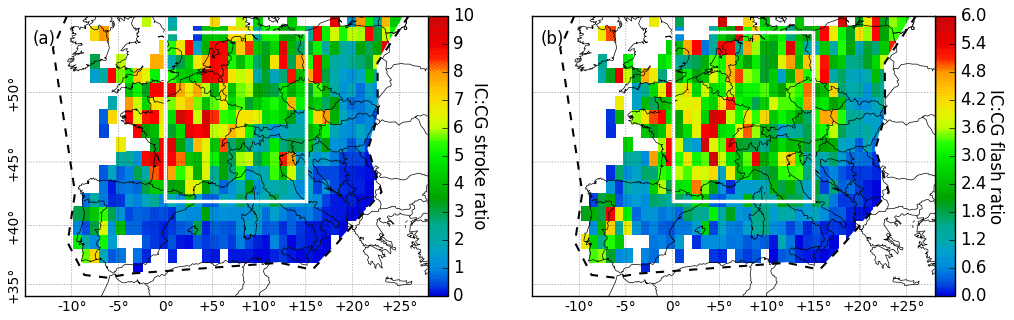
Figure 3IC : CG (a) stroke and (b) flash ratio within the EUCLID domain (dashed) and cut off at 54∘ according to the ISS-LIS maximum latitudinal coverage. The rectangle highlighted in white is the area with the highest IC : CG ratio and is referred to as the center of the EUCLID network throughout the paper.
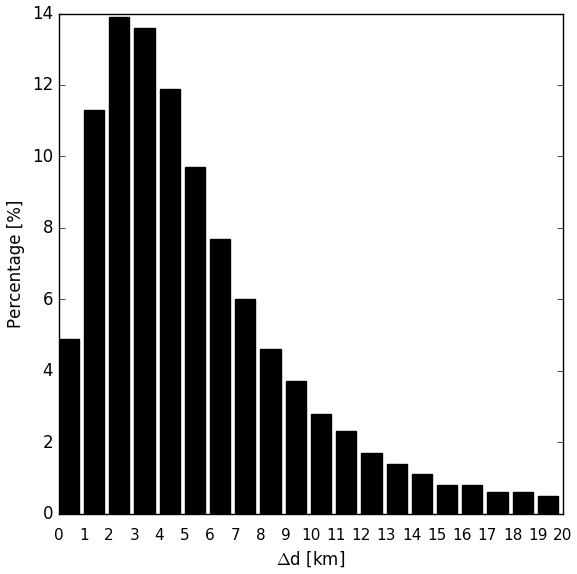
The distance offset Δd in 1 kilometer intervals between matched EUCLID strokes or pulses and ISS-LIS groups is indicated in Fig. 4 and expressed in percentage of occurrence. A steep rise is observed up to 2–3 km, followed by a steady decrease for the larger distance offsets. The mean and median location differences are 5.7 km and 4.8 km, respectively, corresponding to approximately 2 pixels in the ISS-LIS CCD imager. This result is in line with previous findings as presented in Bitzer et al. (2016) and Zhang et al. (2019), who compared LIS group locations with comparable ground-based LLS. Towards the center of the EUCLID network, the mean and median distance offset drops by 180 and 200 m, respectively. This is not surprising since shorter baselines amongst the sensors in this region and the use of sensor-based onset time calculation lead to a better location accuracy and hence better correspondence with the LIS group positions.
Similar to the distance offset, the timing differences Δt, calculated here as tISS-LIS−tEUCLID, can be measured between matched discharges of both systems. The distribution of the time offset between matched ISS-LIS groups and EUCLID strokes and pulses is indicated in Fig. 5. A positive value indicates that the ISS-LIS group occurred later than the EUCLID match, and a negative value indicates that it occurred earlier. It is found that the distribution peaks sharply around ±1 ms, with a positive mean (median) time offset of 0.23 ms (0.11 ms). Thus, on average a EUCLID stroke occurs first. Nonetheless, the majority of the timing differences fall inside the ISS-LIS timing accuracy set by the frame integration time of 2 ms. Unlike for the distance difference, the time offset does not differ within the EUCLID domain.
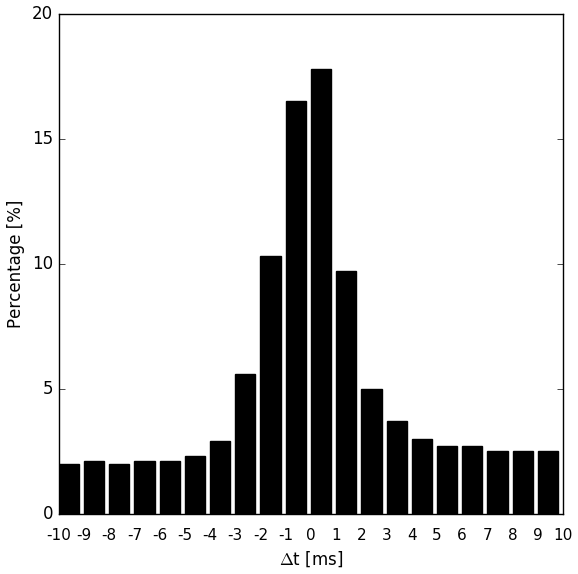
Figure 5Time offset, tISS-LIS−tEUCLID, between matched ISS-LIS groups and EUCLID strokes and pulses. A positive (negative) value indicates that the ISS-LIS group occurred later (earlier) than the matched EUCLID stroke/pulse.
The estimated peak current of matched EUCLID CG strokes (solid line) and IC pulses (dashed line) are correlated with the ISS-LIS group radiance in Fig. 6. Note that positive discharges with peak currents smaller than 10 kA are likely to be misclassified as CG strokes because those are more likely to be of an intracloud nature (Cummins et al., 1998; Wacker and Orville, 1999; Jerauld et al., 2005; Orville et al., 2002; Biagi et al., 2007). Hence, positive CG strokes below 10 kA are all categorized as IC pulses, and therefore no data for positive CG strokes below 10 kA exist. Additionally, the largest positive IC pulse in the EUCLID dataset has an estimated peak current of 28.8 kA, limiting the positive IC pulse curve in the plot. In general, higher peak current signals observed by EUCLID correspond with higher ISS-LIS group radiances. At larger absolute peak current values, i.e., kA, the correlation becomes more variable. However, the latter is an artifact of the sample size as indicated by the gray curve in the plot.
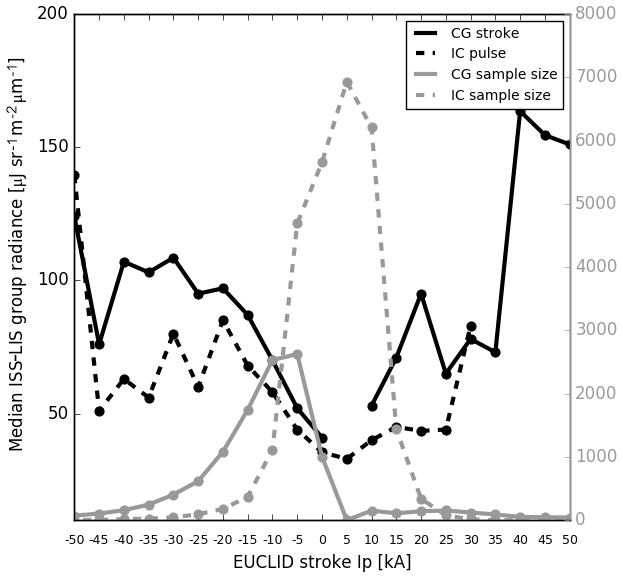
Figure 6Estimated peak currents of matched EUCLID CG strokes (solid) and IC pulses (dashed) are correlated with the corresponding ISS-LIS group radiance. In general, higher peak current signals are correlated with higher ISS-LIS radiances. In addition, the CG and IC sample size is indicated in gray.
Finally, relative detection efficiencies can be calculated using the formulas described in Sect. 3. The results for the full domain and the center are listed in Table 1. It follows that the ISS-LIS group relative DE, i.e., P(ISS-LIS|EUCLID), is 36.5 %, while it is 14.7 % in the case of P(EUCLID|ISS-LIS) over the full domain. In the center of the EUCLID network P(ISS-LIS|EUCLID) is 36.6 %, while P(EUCLID|ISS-LIS) increases to 20.0 %. Those values are comparable with the relative detection efficiency values presented in Zhang et al. (2016), correlating NLDN detections with TRMM-LIS observations in 2013 over the CONUS, although P(TRMM-LIS|NLDN) was somewhat higher, at 52.9 %. A possible explanation of the lower P(ISS-LIS|EUCLID) found in this study compared to P(TRMM-LIS|NLDN) in Zhang et al. (2016) is the advancement of the LS700x technology in detecting IC pulses between 2013 and 2019. Thus, in this work the EUCLID dataset contains more IC pulses, which have no counterpart in the ISS-LIS observations.
Table 1Relative detection efficiencies at the level of EUCLID strokes and pulses and ISS-LIS groups.
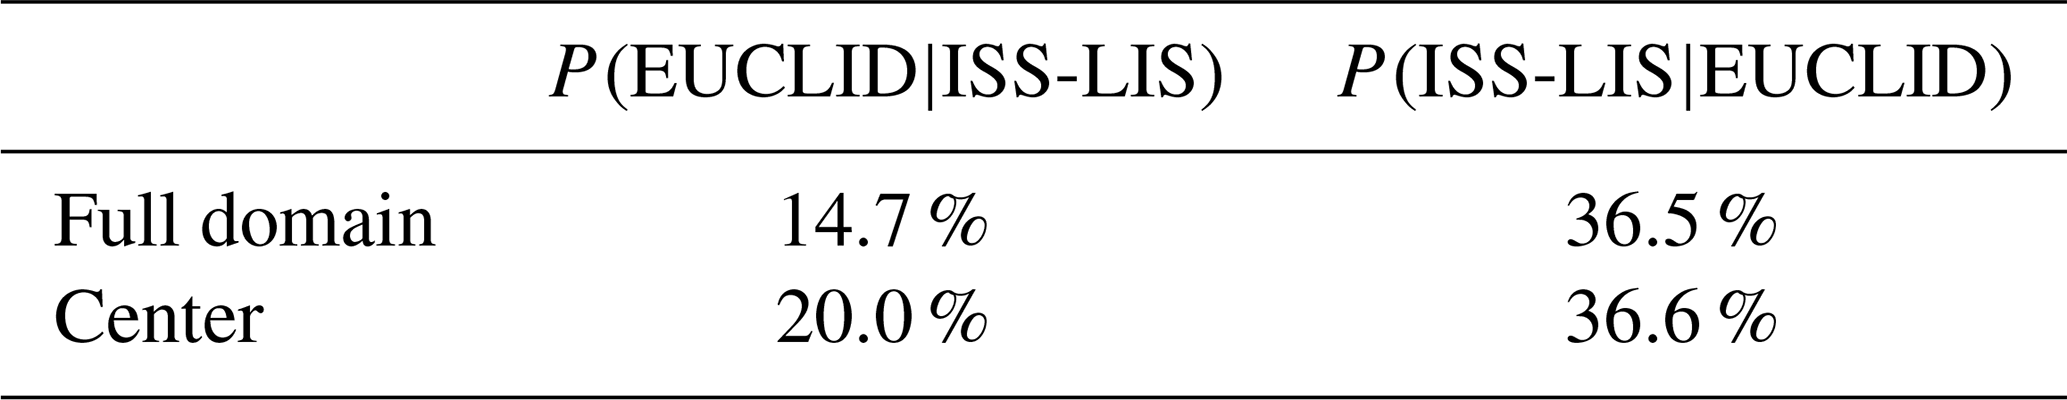
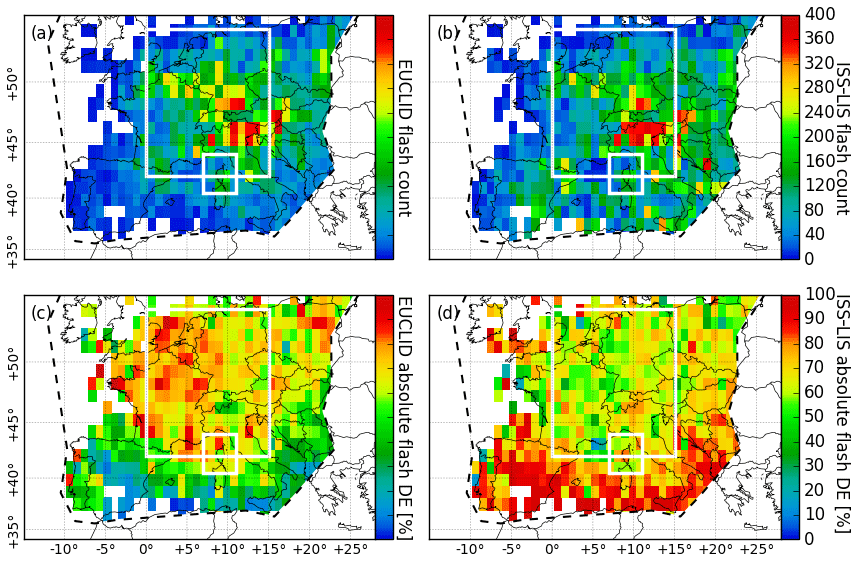
Figure 7EUCLID and ISS-LIS flash counts are depicted in (a) and (b), respectively. Plots (c) and (d) show the spatial distribution of the EUCLID and ISS-LIS absolute detection efficiencies, respectively. The large rectangle highlighted in white is the self-defined center of the EUCLID network in Fig. 3, whereas the smaller white rectangle highlights the area used in Erdmann et al. (2020) against which the results in this paper are compared to.
4.2 Flash level
The spatial distribution of the EUCLID and ISS-LIS flash counts is indicated in the upper plots of Fig. 7, while the lower plots show the geographic spread of the absolute flash detection efficiencies P(EUCLID) and P(ISS-LIS). The overall spatial behavior of the flash counts is similar between the two detection systems. However, the biggest difference in flash counts is found to be outside the center of the EUCLID network, especially over Spain, Italy, and the Mediterranean Sea, where the ISS-LIS outperforms EUCLID in terms of the number of detections. For those regions the same comment applies as for the IC : CG ratio above, namely that this issue is related to the communication problems in those regions. Table 2 summarizes the relative and absolute DEs within the full domain and in the center of the EUCLID network. It is found that P(ISS-LIS|EUCLID) is 48.4 % overall and 48.0 % in the center of the network, while Zhang et al. (2016) found P(TRMM-LIS|NLDN) to be 68.3 %. Similar as in Sect. 4.1, the significantly smaller average sensor baseline of the EUCLID network compared to the NLDN leads to an increased IC flash component in the EUCLID observations without any counterpart in the ISS-LIS flash observations, hence leading to a lower relative ISS-LIS DE in this work. On the other hand, P(EUCLID|ISS-LIS) increases from 45.5 % overall to 56.3 % in the center of the network. The latter result is in line with the 48.7 % found in Zhang et al. (2016). An extra region is outlined in Fig. 7 covering Corsica, corresponding with the region investigated by Erdmann et al. (2020) in which ISS-LIS flashes are matched against those observed by the ground-based Météorage network during an approximately 1-year period from 1 March 2017 until 20 March 2018. Applying analog flash matching criteria as in Erdmann et al. (2020) over the Corsica area, i.e., strokes and pulses are matched to ISS-LIS groups using a 1.0 s temporal and 20 km spatial criterion, P(ISS-LIS|EUCLID) becomes 59.7 % in this study, which is similar to the 62.4 % found in Erdmann et al. (2020).
Table 2Relative and absolute flash detection efficiencies for EUCLID and the ISS-LIS.
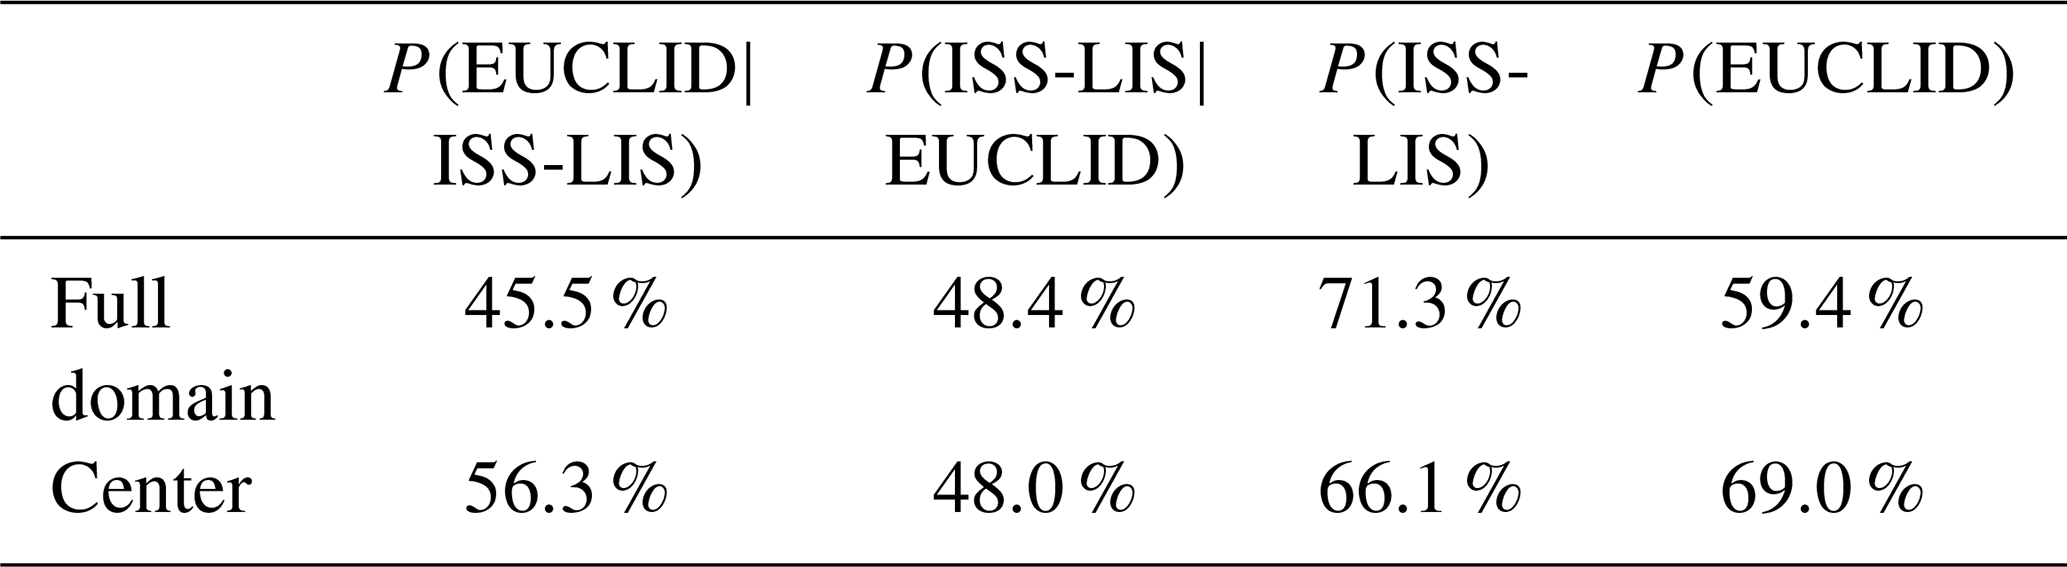
Furthermore, Erdmann et al. (2020) found P(Météorage|ISS-LIS) to be 83.3 % over Corsica, and a similar value is found in this work with P(EUCLID|ISS-LIS) being 82.9 %. The absolute DE of the ISS-LIS, P(ISS-LIS), is ≤71.3 % overall and drops to 66.1 % in the center of the EUCLID network, which is somewhat smaller than the 81.5 % in Zhang et al. (2016). P(EUCLID) is 59.4 % overall and increases to 69.0 % in the center of the network, while it is 58.2 % in Zhang et al. (2016) in the case of the NLDN. Smaller baselines in the center of the EUCLID network lead to a better P(EUCLID), whereas the full domain includes oceans and regions with larger baselines. Additionally, note that in Zhang et al. (2016), the NLDN observations used were restricted to the areas where the NLDN detection efficiency is highest. Hence, P(ISS-LIS) and P(EUCLID) of 66.1 % and 69.0 %, respectively, in this work should be compared to P(TRMM-LIS) and P(NLDN) of 81.5 % and 58.2 %, respectively, in Zhang et al. (2016). Taking into account the fact that the ISS-LIS is somewhat less sensitive compared to the TRMM-LIS would bring the latter values a bit more in line with each other. From Fig. 7 it is found that P(ISS-LIS) is highest outside the center of the EUCLID network, while it is the opposite in the case of P(EUCLID). However, contrary to what is found in this study, the absolute DE for the ISS-LIS should be uniform over the entire region since it is highly unusual to expect a geographic dependence. It is believed that the spatial dependence is related to the limit of the Bayesian algorithm using only two networks. Making use of additional networks would likely eliminate this limitation.

Figure 8The distribution of EUCLID relative flash DE as a function of ISS-LIS flash characteristics is plotted. These characteristics include (a) flash duration, (b) number of groups in flash and maximum number of events in a group, (c) number of events, (d) flash area and maximum group area, and (e) flash radiance. Black lines are the results for the full domain, whereas gray lines are related to the center of EUCLID. Additionally, the ISS-LIS flash counts per interval are plotted as well.
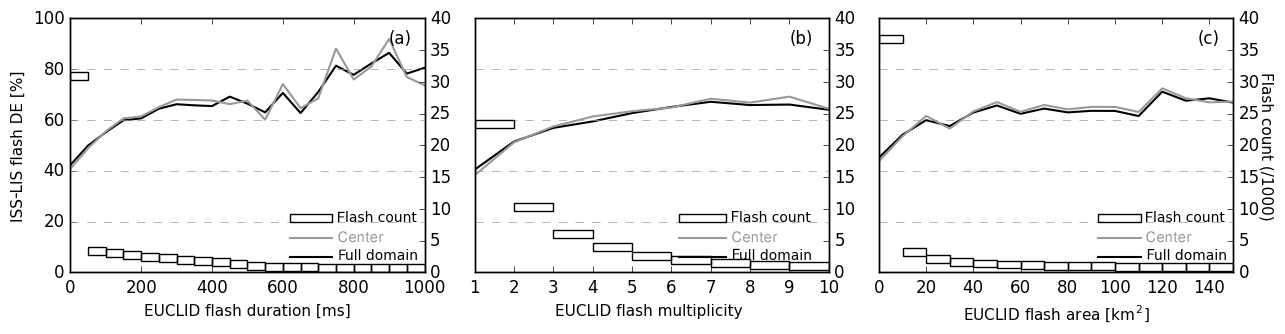
Figure 9The distribution of ISS-LIS relative flash DE as a function of EUCLID flash characteristics such as flash (a) duration, (b) multiplicity, and (c) area. Black lines are the results for the full domain, whereas gray lines are related to the center of EUCLID. Additionally, the ISS-LIS flash counts per interval are plotted as well.
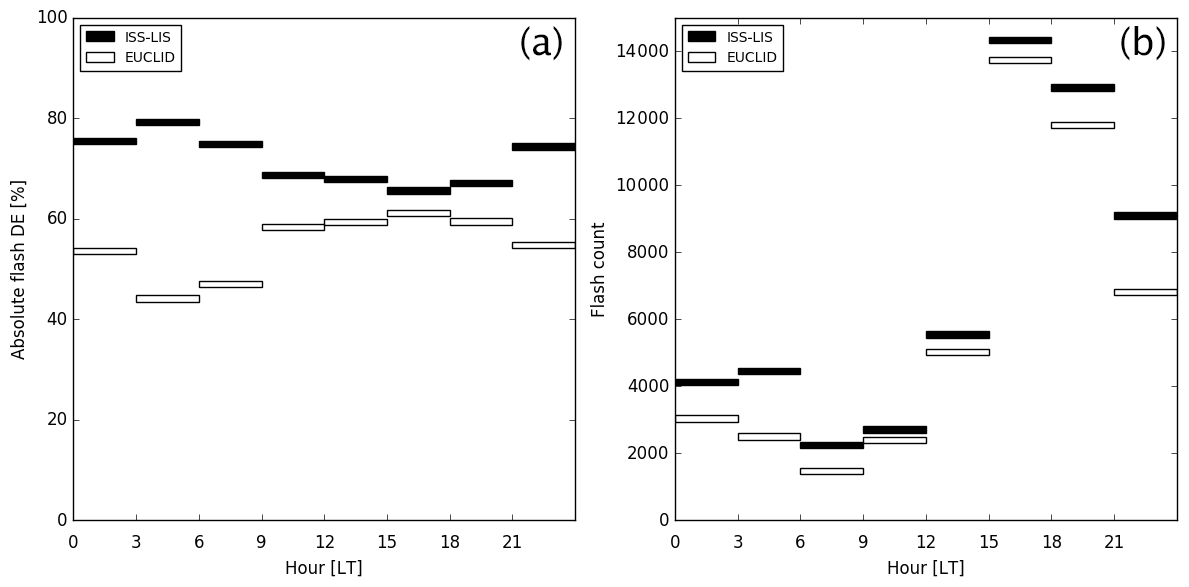
Figure 10Diurnal distribution of the ISS-LIS and EUCLID (a) absolute flash detection efficiencies and (b) flash counts.
The average characteristics of all ISS-LIS flashes, those observed (matched), and those not observed (unmatched) by EUCLID are listed in Table 3, while Fig. 8 provides relative detection efficiency values as a function of those characteristics. From Table 3, it is found that the duration of ISS-LIS flashes is longer by a factor of 1.5 for those that have a match with a EUCLID flash compared to those not observed by EUCLID. Additionally, Fig. 8a demonstrates an increasing trend in the EUCLID flash DE with increasing flash duration. For flashes lasting longer than about 750 ms, the flash DE is stable around 60 %, averaged over the full domain, and increases further by about 20 % in the center of the EUCLID network. On average, ISS-LIS flashes consist of 8.6 groups, while matched flashes contain 10.7 groups and drop to 7.2 groups per flash for the unmatched flashes. Figure 8b indicates a sharp increase in the EUCLID flash DE for ISS-LIS flashes comprising up to about 10 groups followed by a moderate rise in flash DE for flashes containing up to 30 groups. ISS-LIS flashes with more than 30 groups have the highest probability of matching a EUCLID flash, resulting in a EUCLID flash DE between 60 % and 80 %. A similar behavior is found when looking at the maximum number of events per group (MNEG), which has been plotted as well in Fig. 8b. Examining the behavior as a function of the number of events per flash, an analog trend is observed compared to the previously examined behavior of groups per flash. Flashes containing 75 events or more boost the EUCLID flash DE up to 80 % in the center of the EUCLID network as depicted in Fig. 8c. Figure 8d demonstrates an identical behavior of the EUCLID flash DE as a function of ISS-LIS flash area and maximum group area (MGA), with a larger flash DE for those flashes that have a larger optical footprint. Not surprisingly, the flash DE is proportional to the ISS-LIS flash radiance and increases sharply up to an ISS-LIS flash radiance of about 1000 µJ sr m−2 µm−1, as demonstrated in Fig. 8e. The results presented above are similar to the ones found by Rudlosky et al. (2017) evaluating the GLD360 DE with respect to TRMM-LIS flash characteristics.
Table 3Average characteristics of all ISS-LIS flashes, those observed by EUCLID (matched), and those not observed by EUCLID (unmatched).
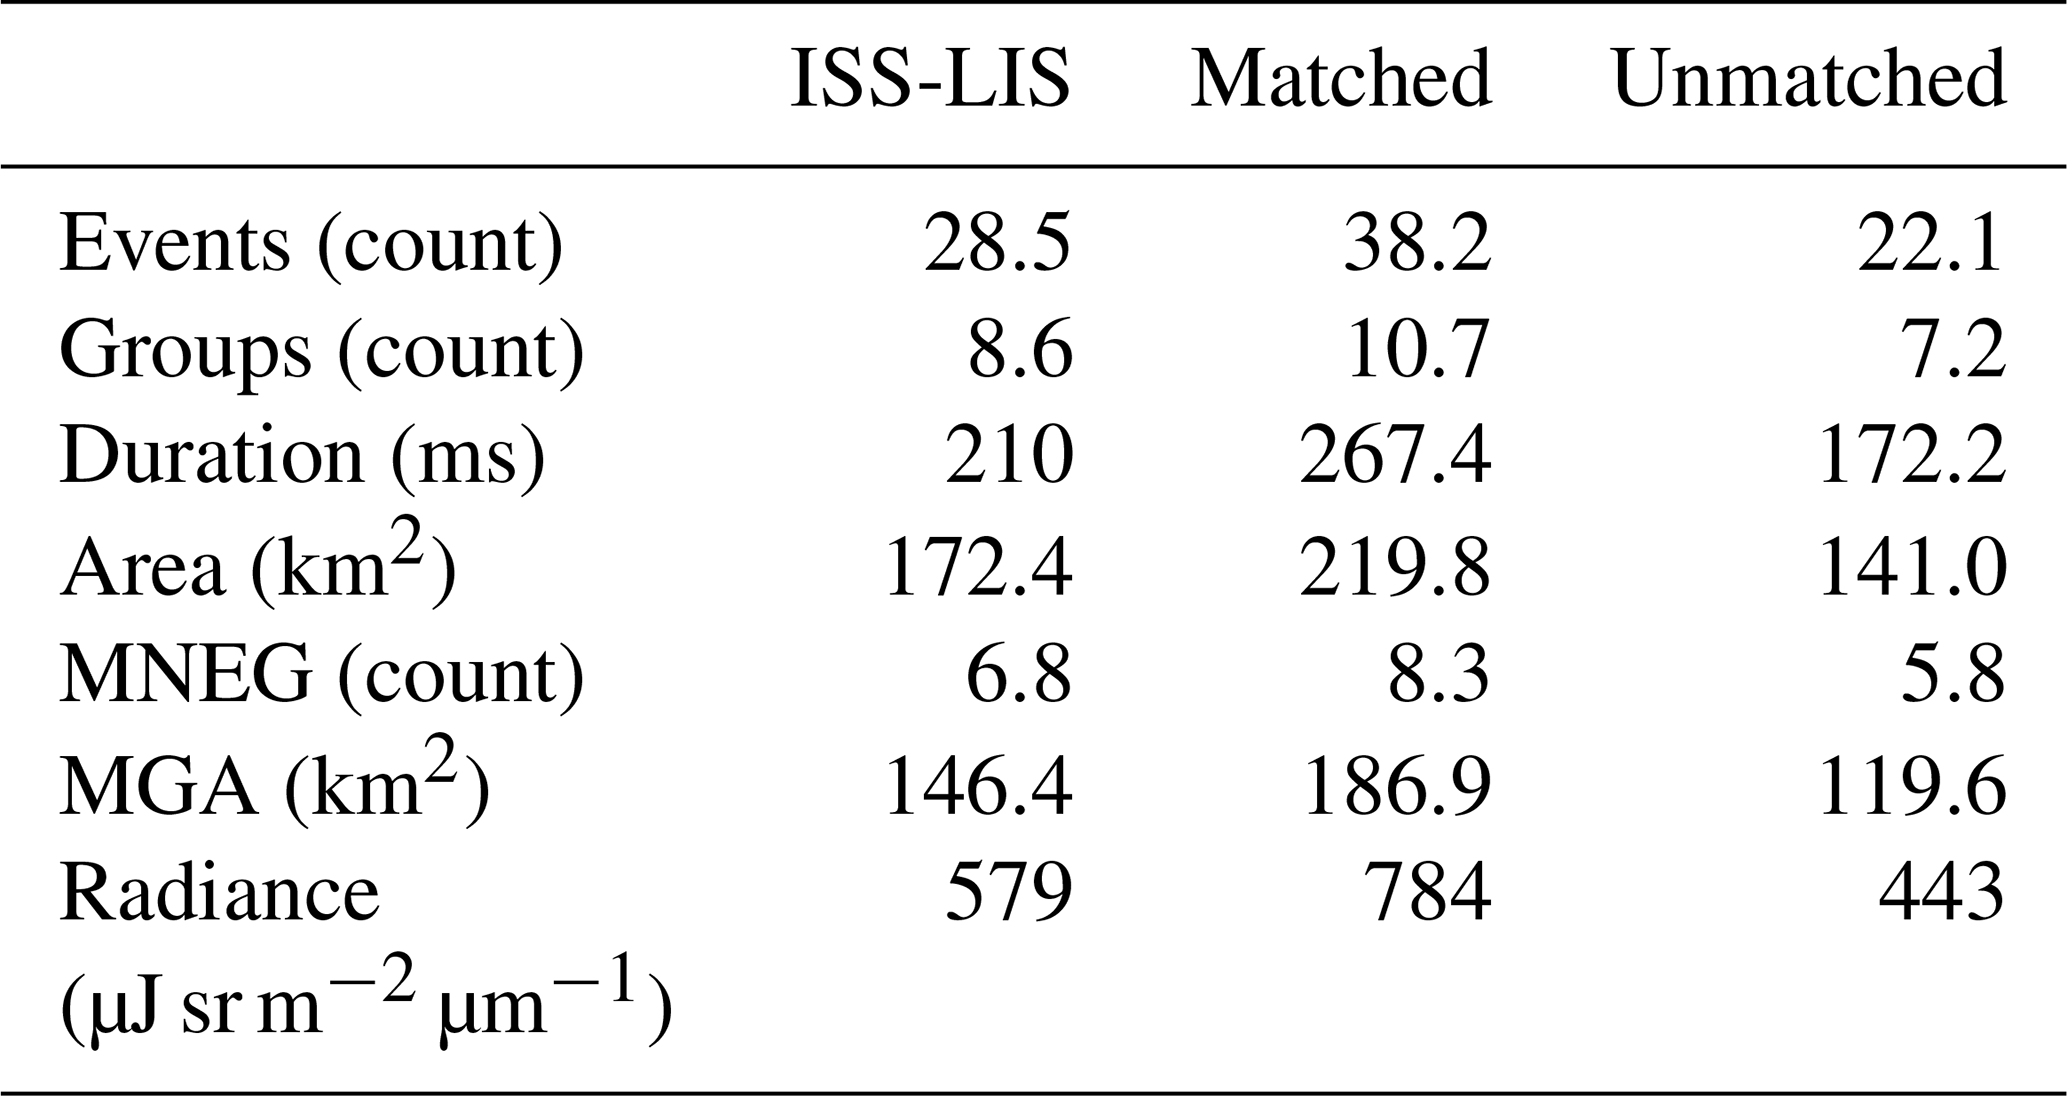
MNEG: maximum number of events per group. MGA: maximum group area.
Conversely, the ISS-LIS flash DE can be linked to EUCLID flash characteristics such as its flash duration, multiplicity, and area. To calculate the area of a EUCLID flash the minimum and maximum latitudinal and longitudinal coordinates within the flash are used. Results hereof are presented in Table 4, and distributions are drawn in Fig. 9. From Fig. 9a it follows that EUCLID flashes with a duration of less than 200 ms have the lowest chance of matching an ISS-LIS flash, resulting in an ISS-LIS flash DE below 60 %. EUCLID flashes lasting longer than 800 ms have an 80 % probability of being matched to an ISS-LIS flash. On average matched EUCLID flashes last twice as long compared to the unmatched flashes. Furthermore, EUCLID flashes have an average multiplicity of 2.4, while this is 2.9 and 2.1 for the flashes that match and do not match an ISS-LIS flash, respectively. For EUCLID flashes with a multiplicity lower than 3, the ISS-LIS flash DE lies between 40 % and 60 % and increases up to about 70 % for EUCLID flash multiplicities greater than 4, as evidenced in Fig. 9b. Although matched EUCLID flashes have an average area of 25.4 km2, twice the size of the unmatched EUCLID flashes, the behavior of the ISS-LIS flash DE as a function of EUCLID flash area is not as pronounced compared to the distributions as a function of EUCLID flash duration and multiplicity.
The diurnal behavior of the absolute flash detection efficiency for the ISS-LIS and EUCLID is plotted in Fig. 10. The absolute ISS-LIS flash DE clearly shows an increase at night compared to daytime, whereas the opposite is noticeable in case of the absolute EUCLID DE. The EUCLID absolute DE drops from about 60 % between 09:00 and 21:00 local time (LT) to about 50 % between 21:00 and 09:00 LT, whereas the ISS-LIS absolute DE increases from about 70 % between 09:00 and 21:00 LT to 75 % between 21:00 and 09:00 LT. This behavior is clearly linked to the increased capacity of the ISS-LIS to detect more flashes during nighttime, whilst during the day the flash count of the ISS-LIS and EUCLID is similar. In contrast, the performance of EUCLID is expected to be stable throughout the entire day. Hence, the day/night variation depicted in Fig. 10 reflects the limits of the absolute DE calculation, namely that it is an upper limit of the true absolute DE.
Table 4Average characteristics of all EUCLID flashes, those observed by the ISS-LIS (matched), and those not observed by the ISS-LIS (unmatched).
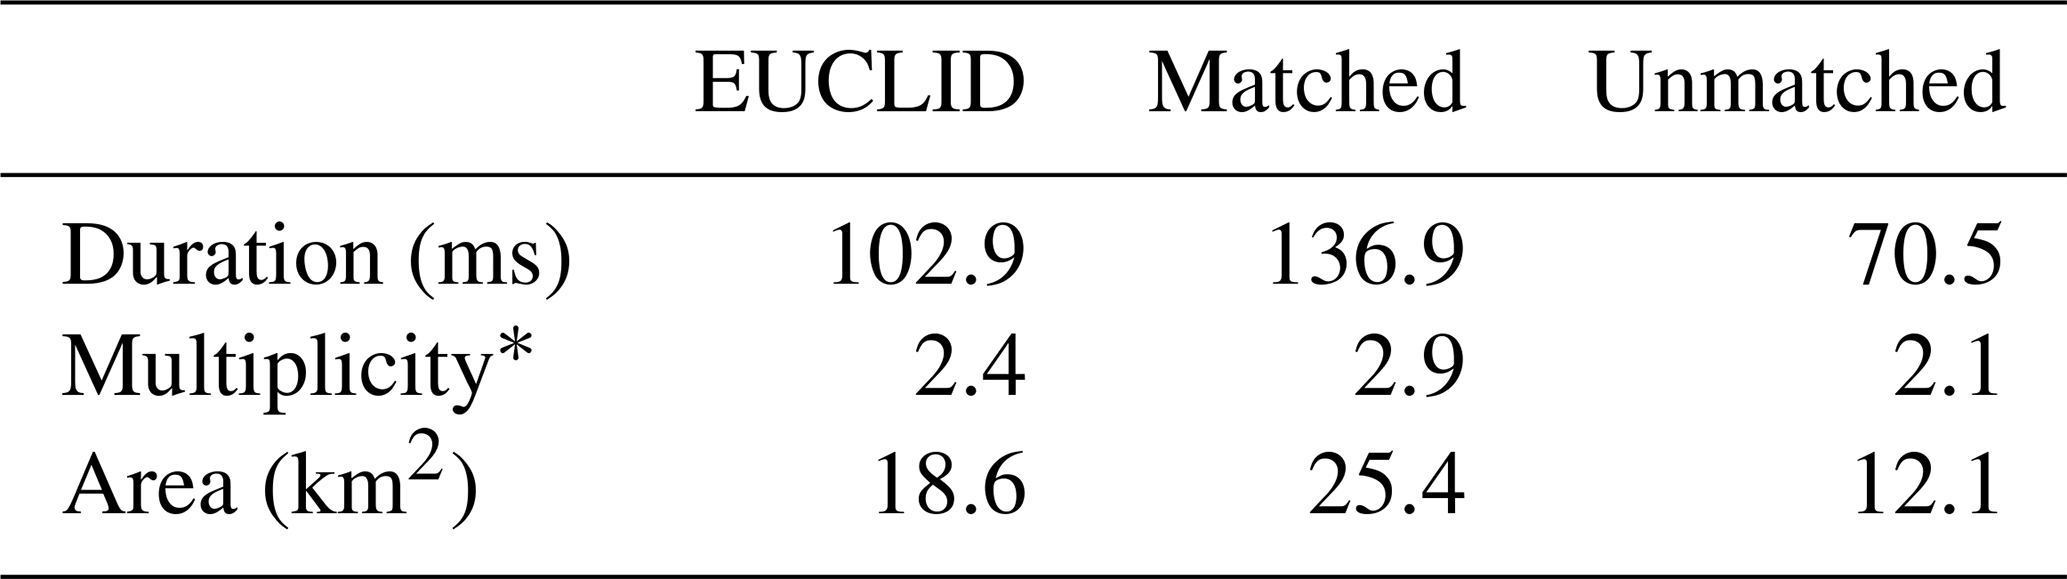
* Multiplicity here means the number of strokes, pulses, or the sum of both in a pure CG, IC, or hybrid flash, respectively.
There exists a multitude of different technologies to detect and locate the electrical activity in thunderstorms, whether on a local, continental, or global scale. This leads to various sets of observations of the same phenomenon. Hence, depending on the requirements, e.g., spatial accuracy and/or extent, the user can favor one system over the other. Nevertheless, it is important to investigate the similarities and differences among different systems. Incited by the forthcoming launch of the Meteosat Third Generation geostationary satellites with the onboard Lightning Imager, this study aims to compare for the first time over a large area in Europe the lightning observations from the ground-based EUCLID network to the optical signals detected by the space-based ISS-LIS. The analysis is based on the lightning activity recorded between 1 March 2017 and 31 March 2019 within the EUCLID network, which was limited to 54∘ north. In this study the EUCLID cloud-to-ground strokes and intracloud pulses are compared to the ISS-LIS groups in addition to the correlation at the level of the flashes of both systems. Besides measuring the temporal and spatial differences between matched observations, a Bayesian approach is adopted to determine the relative and absolute detection efficiencies (DEs) of each system where appropriate.
It is found that the matched EUCLID strokes and pulses and ISS-LIS groups are separated by a median distance of 4.8 km, corresponding to approximately 2 ISS-LIS pixels in the CCD imager. A positive median time difference, tISS-LIS−tEUCLID, of 0.11 ms between matched discharges is well within the time accuracy of the ISS-LIS and indicates that on average the matched EUCLID stroke occurs first. Furthermore, higher peak current signals observed by EUCLID correspond with higher ISS-LIS group radiances. The ISS-LIS group relative DE is 36.5 % overall and 36.6 % in the center of the EUCLID network. The latter values are in contrast to the much lower EUCLID stroke/pulse relative DE values of 14.7 % and 20.0 % over the full domain and in the center of the network, respectively. This is related to the higher number of ISS-LIS groups detected compared to total number of EUCLID strokes and pulses.
On the level of the flashes, the relative ISS-LIS DE is rather homogeneous over the entire EUCLID network, with a value of 48.4 % and the highest values observed at the edge of the EUCLID network, whereas the EUCLID relative DE increases from 45.5 % overall to 56.3 % in the center of the network. This is related to the increased EUCLID IC : CG flash ratio towards the center of the network. The upper bound of the absolute DE for the ISS-LIS drops from 71.3 % overall to 66.1 % in the center of the EUCLID network, whereas in the case of EUCLID this value increases from 59.4 % overall to 69.0 % in the center of the network.
The behavior of the relative DE of one system in terms of the flash characteristics of the other reveals that the greater the value, the more likely the other system is to detect the flash. For instance, it is found that the duration of ISS-LIS flashes is longer by a factor of 1.5 for those that have a match with a EUCLID flash compared to those not observed by EUCLID, while EUCLID flashes that have a match with an ISS-LIS flash last twice as long compared to the unmatched flashes.
Finally, the absolute ISS-LIS group and flash DE clearly shows an increase at night compared to daytime, whereas the opposite is noticeable in the case of the absolute EUCLID DE. This behavior is related to the increased capacity of the ISS-LIS to detect more flashes during nighttime, whilst during the day the flash ratio of ISS-LIS : EUCLID is much closer to 1.
The main objective of this study was to investigate how well the observations of a ground-based LLS, in this case EUCLID, are linked to space-based optical lightning signatures of the LIS on the ISS over a large part of western Europe. Consequently, the method described in this work and results thereof provide a framework to be used in potential future studies involving MTG LI observations over Europe. Moreover, whereas now the focus was on one particular LLS, it is straightforward to apply it to observations of different ground-based LLSs covering the entire MTG LI domain or parts thereof.
The ISS-LIS dataset is available online from the NASA EOSDIS Global Hydrology Resource Center Distributed Active Archive Center, Huntsville, Alabama, USA: https://doi.org/10.5067/LIS/ISSLIS/DATA107 (Blakeslee, 2019). EUCLID data can be provided upon request.
DRP processed and analyzed the different datasets used in this paper, and WS provided feedback at every step of the process. Writing the manuscript was a joint effort between DRP and WS.
The authors declare that they have no conflict of interest.
Special thanks go to Daile Zhang, Felix Erdmann and Hannes Kohlmann for benchmarking the scripts used in this work. The authors thank the two anonymous reviewers for their insightful remarks and suggestions.
This paper was edited by Domenico Cimini and reviewed by two anonymous referees.
Azadifar, M., Rachidi, F., Rubinstein, M., Paolone, M., Diendorfer, G., Pichler, H., Schulz, W., Pavanello, D., and Romero, C.: Evaluation of the performance characteristics of the European Lightning Detection Network EUCLID in the Alps region for upward negative flashes using direct measurements at the instrumented Säntis Tower, J. Geophys. Res.-Atmos., 121, 595–606, https://doi.org/10.1002/2015JD024259, 2016.
Biagi, C. J., Cummins, K. L., Kehoe, K. E., and Krider, E. P.: National Lightning Detection Network (NLDN) performance in southern Arizona, Texas, and Oklahoma in 2003–2004, J. Geophys. Res.-Atmos., 112, D05208, https://doi.org/10.1029/2006JD007341, 2007.
Bitzer, P. M., Burchfield, J. C., and Christian, H. J.: A Bayesian approach to assess the performance of lightning detection systems, J. Atmos. Ocean. Tech., 33, 563–578, https://doi.org/10.1175/JTECH-D-15-0032.1, 2016.
Blakeslee, R. J.: Non-Quality Controlled Lightning Imaging Sensor (LIS) on International Space Station (ISS) Science Data P0.2, Dataset available online from the NASA Global Hydrology Resource Center DAAC, Huntsville, Alabama, USA, https://doi.org/10.5067/LIS/ISSLIS/DATA107, 2019.
Blakeslee, R. J. and Koshak, W. J.: LIS on ISS: Expanded Global Coverage and Enhanced Applications, Earth Obs., 28, 4–14, 2016.
Blakeslee, R. J., Christian, H. J., Stewart, M. F., Mach, D. M., Bateman, M., Walker, T. D., Buechler, D., Koshak, W. J., Wilson, T., Colley, E. C., Abbott, T., Carter, J., Pavelitz, S., and Coker, C.: Lightning Imaging Sensor (LIS) for the International Space Station (ISS): Mission Description and Science Goals, Int. Conf. Atmos. Electr., June, 15–20, 2014.
Boccippio, D. J., Koshak, W. J., Blakeslee, R. J., Driscoll, K. T., Mach, D., Buechler, D. E., Boeck, W. L., Christian, H. J., and Goodman, S. J.: The Optical Transient Detector (OTD): Instrument Characteristics and Cross-Sensor Validation, J. Atmos. Ocean. Tech., 17, 441–458, 2000.
Boccippio, D. J., Koshak, W. J., and Blakeslee, R. J.: Performance Assessment of the Optical Transient Detector and Lightning Imaging Sensor, Part I. Predicted Diurnal Variability, J. Atmos. Ocean. Tech., 19, 1318–1332, https://doi.org/10.1175/1520-0426(2002)019<1318:PAOTOT>2.0.CO;2, 2002.
Cecil, D. J., Buechler, D. E., and Blakeslee, R. J.: Gridded lightning climatology from TRMM-LIS and OTD: Dataset description, Atmos. Res., 135–136, 404–414, https://doi.org/10.1016/j.atmosres.2012.06.028, 2014.
Christian, H. J., Blakeslee, R. J., and Goodman, S. J.: The detection of lightning from geostationary orbit, J. Geophys. Res.-Atmos., 94, 13329–13337, https://doi.org/10.1029/JD094iD11p13329, 1989.
Coquillat, S., Defer, E., de Guibert, P., Lambert, D., Pinty, J.-P., Pont, V., Prieur, S., Thomas, R. J., Krehbiel, P. R., and Rison, W.: SAETTA: high-resolution 3-D mapping of the total lightning activity in the Mediterranean Basin over Corsica, with a focus on a mesoscale convective system event, Atmos. Meas. Tech., 12, 5765–5790, https://doi.org/10.5194/amt-12-5765-2019, 2019.
Cummins, K. L., Murphy, M. J., Bardo, E. A., Hiscox, W. L., Pyle, R. B., and Pifer, A. E.: A Combined TOA/MDF Technology Upgrade of the U.S. National Lightning Detection Network, J. Geophys. Res., 103, 9035, https://doi.org/10.1029/98JD00153, 1998.
Defer, E., Pinty, J.-P., Coquillat, S., Martin, J.-M., Prieur, S., Soula, S., Richard, E., Rison, W., Krehbiel, P., Thomas, R., Rodeheffer, D., Vergeiner, C., Malaterre, F., Pedeboy, S., Schulz, W., Farges, T., Gallin, L.-J., Ortéga, P., Ribaud, J.-F., Anderson, G., Betz, H.-D., Meneux, B., Kotroni, V., Lagouvardos, K., Roos, S., Ducrocq, V., Roussot, O., Labatut, L., and Molinié, G.: An overview of the lightning and atmospheric electricity observations collected in southern France during the HYdrological cycle in Mediterranean EXperiment (HyMeX), Special Observation Period 1, Atmos. Meas. Tech., 8, 649–669, https://doi.org/10.5194/amt-8-649-2015, 2015.
Diendorfer, G., Pichler, H., and Mair, M.: Some Parameters of Negative Upward-Initiated Lightning to the Gaisberg Tower (2000–2007), Electromagn. Compat. IEEE Trans., 51, 443–452, https://doi.org/10.1109/TEMC.2009.2021616, 2009.
Ducrocy, V., Braud, I., Davolio, S., Ferretti, R., Flamant, C., Jansa, A., Kalthoff, N., Richard, E., Taupier-Letage, I., Ayral, P.-A., Belamari, S., Berne, A., Borga, M., Boudevillain, B., Bock, O., Boichard, J.-L., Bouin, M.-N., Bousquet, O., Bouvier, C., Chiggiato, J., Cimini, D., Corsmeier, U., Coppola, L., Cocquerez, P., Defer, E., Delanoë, J., Girolamo, P. Di, Doerenbecher, A., Drobinski, P., Dufournet, Y., Fourrié, N., Gourley, J. J., Labatut, L., Lambert, D., Le Coz, J., Marzano, F. S., Molinié, G., Montani, A., Nord, G., Nuret, M., Ramage, K., Rison, B., Roussot, O., Said, F., Schwarzenboeck, A., Testor, P., Van Baelen, J., Vincendon, B., Aran, M., and Tamayo, J.: HyMeX-SOP1, the field campaign dedicated ot heavy precipitation and flash flooding in the northwestern Mediterranean, B. Am. Meteorol. Soc., 95, 1083–1100, https://doi.org/10.1175/BAMS-D-12-00244.1, 2013.
Enno, S., Sugier, J., Labrador, L. J., and Rudlosky, S.: Comparison and characterisation of ATDnet versus LIS for the period of 2008 to 2014, in 25th International Lightning Detection Conference & 7th International Lightning Meteorology Conference (ILDC/ILMC), 1–7, Ft. Lauderdale, Florida, USA, 12–15 March 2018.
Erdmann, F., Defer, E., Caumont, O., Blakeslee, R. J., Pédeboy, S., and Coquillat, S.: Concurrent satellite and ground-based lightning observations from the Optical Lightning Imaging Sensor (ISS-LIS), the low-frequency network Meteorage and the SAETTA Lightning Mapping Array (LMA) in the northwestern Mediterranean region, Atmos. Meas. Tech., 13, 853–875, https://doi.org/10.5194/amt-13-853-2020, 2020.
Franklin, V.: An evaluation of the Lightning Imaging Sensor with new insights on the discrimination of lightning flash and stroke detectability, University of Alabama in Huntsville, 2013.
Goodman, S. J., Buechler, D. E., Wright, P. D., and Rust, W. D.: Lightning and precipitation history of a microburst-producing storm, Geophys. Res. Lett., 15, 1185–1188, https://doi.org/10.1029/GL015i011p01185, 1988.
Heidler, F. and Schulz, W.: Lightning current measurements compared to data from the lightning location system BLIDS, in: International Colloquium on Lightning and Power Systems (CIGRE), Bologna, Italy, 27–29 June 2016.
Jerauld, J. E., Rakov, V. A., Uman, M. A., Rambo, K. J., Jordan, D. M., Cummins, K. L., and Cramer, J. A.: An evaluation of the performance characteristics of the U.S. National Lightning Detection Network in Florida using rocket-triggered lightning, J. Geophys. Res.-Atmos., 110, D19106, https://doi.org/10.1029/2005JD005924, 2005.
Koshak, W. J.: Optical characteristics of OTD flashes and the implications for flash-type discrimination, J. Atmos. Ocean. Tech., 27, 1822–1838, https://doi.org/10.1175/2010JTECHA1405.1, 2010.
Mach, D. M., Christian, H. J., Blakeslee, R. J., Boccippio, D. J., Goodman, S. J., and Boeck, W. L.: Performance assessment of the Optical Transient Detector and Lightning Imaging Sensor, J. Geophys. Res.-Atmos., 112, D09210, https://doi.org/10.1029/2006JD007787, 2007.
Medici, G., Cummins, K. L., Cecil, D. J., Koshak, W. J., and Rudlosky, S.: The Intracloud Lightning Fraction in the Contiguous United States, Mon. Weather Rev., 145, 4481–4499, https://doi.org/10.1175/MWR-D-16-0426.1, 2017.
Nag, A., Murphy, M. J., Schulz, W., and Cummins, K. L.: Lightning Locating Systems: Insights on Characteristics and Validation Techniques, Earth Space Sci., 2, 65–93, https://doi.org/10.1002/2014EA000051, 2015.
Orville, R. E., Huffines, G. R., Burrows, W. R., Holle, R. L., and Cummins, K. L.: The North American Lightning Detection Network (NALDN) – First Results: 1998–2000, Mon. Weather Rev., 130, 2098–2109, 2002.
Pédeboy, S., Defer, E., and Schulz, W.: Performance of the EUCLID network in cloud lightning detection in the South-East France, in: 8th HyMeX Workshop, Valletta, Malta, 15–18 September 2014.
Poelman, D. R., Schulz, W., and Vergeiner, C.: Performance Characteristics of Distinct Lightning Detection Networks Covering Belgium, J. Atmos. Ocean. Tech., 30, 942–951, https://doi.org/10.1175/JTECH-D-12-00162.1, 2013.
Poelman, D. R., Schulz, W., Diendorfer, G., and Bernardi, M.: The European lightning location system EUCLID – Part 2: Observations, Nat. Hazards Earth Syst. Sci., 16, 607–616, https://doi.org/10.5194/nhess-16-607-2016, 2016.
Poelman, D. R., Schulz, W., Kaltenboeck, R., and Delobbe, L.: Analysis of lightning outliers in the EUCLID network, Atmos. Meas. Tech., 10, 4561–4572, https://doi.org/10.5194/amt-10-4561-2017, 2017.
Romero, C., Paolone, M., Rachidi, F., Rubinstein, M., Rubinstein, A., Diendorfer, G., Schulz, W., Bernardi, M., and Nucci, C. A.: Preliminary comparison of data from the Säntis Tower and the EUCLID lightning location system, in: 2011 International Symposium on Lightning Protection (XI SIPDA), 140–145, IEEE, Fortalzea, Brazil, 3–7 October 2011.
Rubinstein, M.: On the estimation of the stroke detection efficiency by comparison of adjacent lightning location systems, in: 1994 22nd International Conference on Lightning Protection (ICLP), Budapest, Hungary, 19–23 September 1994.
Rudlosky, S.: Evaluating ENTLN Performance Relative to TRMM/LIS, J. Oper. Meteorol., 3, 11–20, https://doi.org/10.15191/nwajom.2015.0302, 2015.
Rudlosky, S. and Shea, D. T.: Evaluating WWLLN performance relative to TRMM/LIS, Geophys. Res. Lett., 40, 2344–2348, https://doi.org/10.1002/grl.50428, 2013.
Rudlosky, S., Peterson, M., and Kahn, D. T.: GLD360 performance relative to TRMM LIS, J. Atmos. Ocean. Tech., 34, 1307–1322, https://doi.org/10.1175/JTECH-D-16-0243.1, 2017.
Said, R. K., Inan, U. S., and Cummins, K. L.: Long-range lightning geolocation using a VLF radio atmospheric waveform bank, J. Geophys. Res.-Atmos., 115, D23108, https://doi.org/10.1029/2010JD013863, 2010.
Schulz, W., Pedeboy, S., Vergeiner, C., Defer, E., and Rison, W.: Validation of the EUCLID LLS during HyMeX SOP1, in: 23rd International Lightning Detection Conference & 5th International Lightning Meteorology Conference (ILDC/ILMC), Tucson, Arizona, USA, 18–21 March 2014.
Schulz, W., Diendorfer, G., Pedeboy, S., and Poelman, D. R.: The European lightning location system EUCLID – Part 1: Performance analysis and validation, Nat. Hazards Earth Syst. Sci., 16, 595–605, https://doi.org/10.5194/nhess-16-595-2016, 2016.
Sparrow, J. G. and Ney, E. P.: Lightning observations by satellite, Nature, 232, 514–540, 1971.
Turman, B. N.: Analysis of lightning data from the DMSP satellite, J. Geophys. Res.-Oceans, 83, 5019–5024, https://doi.org/10.1029/JC083iC10p05019, 1978.
Vorpahl, J. A., Sparrow, J. G., and Ney, E. P.: Satellite observations of lightning, Science, 169, 860–862, 1970.
Wacker, R. S. and Orville, R. E.: Changes in measured lightning flash count and return stroke peak current after the 1994 U.S. National Lightning Detection Network upgrade: 1. Observations, J. Geophys. Res.-Atmos., 104, 2151–2157, https://doi.org/10.1029/1998JD200060, 1999.
Zhang, D.: Inter-Comparison of Space- and Ground-Based Observations of Lightning, PhD Thesis, 2019.
Zhang, D., Cummins, K. L., Nag, A., Murphy, M. J., and Bitzer, P. M.: Evaluation of the National Lightning Detection Network Upgrade Using the Lightning Imaging Sensor, in: 26th International Lightning Detection Conference & 6th International Lightning Meteorology Conference (ILDC/ILMC), San Diego, California, USA, 18–21 April 2016.
Zhang, D., Cummins, K. L., Bitzer, P. M., and Koshak, W. J.: Evaluation of the Performance Characteristics of the Lightning Imaging Sensor, J. Atmos. Ocean. Tech., 36, 1015–1031, https://doi.org/10.1175/JTECH-D-18-0173.1, 2019.