the Creative Commons Attribution 4.0 License.
the Creative Commons Attribution 4.0 License.
 | 12 Jun 2020
Implementation of a chemical background method for atmospheric OH measurements by laser-induced fluorescence: characterisation and observations from the UK and China
Robert Woodward-Massey
Eloise J. Slater
Jake Alen
Trevor Ingham
Danny R. Cryer
Leanne M. Stimpson
Chunxiang Ye
Paul W. Seakins
Lisa K. Whalley
Hydroxyl (OH) and hydroperoxy (HO2) radicals are central to the understanding of atmospheric chemistry. Owing to their short lifetimes, these species are frequently used to test the accuracy of model predictions and their underlying chemical mechanisms. In forested environments, laser-induced fluorescence–fluorescence assay by gas expansion (LIF–FAGE) measurements of OH have often shown substantial disagreement with model predictions, suggesting the presence of unknown OH sources in such environments. However, it is also possible that the measurements have been affected by instrumental artefacts, due to the presence of interfering species that cannot be discriminated using the traditional method of obtaining background signals via modulation of the laser excitation wavelength (“OHwave”). The interference hypothesis can be tested by using an alternative method to determine the OH background signal, via the addition of a chemical scavenger prior to sampling of ambient air (“OHchem”). In this work, the Leeds FAGE instrument was modified to include such a system to facilitate measurements of OHchem, in which propane was used to selectively remove OH from ambient air using an inlet pre-injector (IPI). The IPI system was characterised in detail, and it was found that the system did not reduce the instrument sensitivity towards OH (< 5 % difference to conventional sampling) and was able to efficiently scavenge external OH (> 99 %) without the removal of OH formed inside the fluorescence cell (< 5 %). Tests of the photolytic interference from ozone in the presence of water vapour revealed a small but potentially significant interference, equivalent to an OH concentration of molec. cm−3 under typical atmospheric conditions of [O3] =50 ppbv and [H2O] =1 %. Laboratory experiments to investigate potential interferences from products of isoprene ozonolysis did result in interference signals, but these were negligible when extrapolated down to ambient ozone and isoprene levels. The interference from NO3 radicals was also tested but was found to be insignificant in our system. The Leeds IPI module was deployed during three separate field intensives that took place in summer at a coastal site in the UK and both in summer and winter in the megacity of Beijing, China, allowing for investigations of ambient OH interferences under a wide range of chemical and meteorological conditions. Comparisons of ambient OHchem measurements to the traditional OHwave method showed excellent agreement, with OHwave vs OHchem slopes of 1.05–1.16 and identical behaviour on a diel basis, consistent with laboratory interference tests. The difference between OHwave and OHchem (“OHint”) was found to scale non-linearly with OHchem, resulting in an upper limit interference of (5.0±1.4) ×106 molec. cm−3 at the very highest OHchem concentrations measured (23×106 molec. cm−3), accounting for ∼14 %–21 % of the total OHwave signal.
- Article
(8793 KB) - Full-text XML
-
Supplement
(204 KB) - BibTeX
- EndNote


The removal of pollutants and greenhouse gases in the troposphere is dominated by reactions with the hydroxyl radical (OH), which is closely coupled to the hydroperoxy radical (HO2). Comparisons of the levels of OH and HO2 observed during field campaigns to the results of detailed chemical box models serve as a vital tool to assess our understanding of the underlying chemical mechanisms involved in tropospheric oxidation. Laser-induced fluorescence–fluorescence assay by gas expansion (LIF–FAGE) measurements of OH in forested environments have often been considerably higher than those predicted by models (Carslaw et al., 2001; Lelieveld et al., 2008; Ren et al., 2008; Hofzumahaus et al., 2009; Stone et al., 2011; Whalley et al., 2011; Wolfe et al., 2011). The difficulty in simulating radical concentrations in such environments has prompted a multitude of theoretical (Peeters et al., 2009, 2014; da Silva et al., 2010; Nguyen et al., 2010; Peeters and Muller, 2010), laboratory (Dillon and Crowley, 2008; Hansen et al., 2017), and chamber (Paulot et al., 2009; Crounse et al., 2011, 2012; Wolfe et al., 2012; Fuchs et al., 2013, 2014, 2018; Praske et al., 2015; Teng et al., 2017) studies to help explain the sources of the measurement–model discrepancy through detailed investigations of the mechanism of isoprene oxidation under low NOx conditions, as well as other biogenic volatile organic compounds (BVOCs) (Novelli et al., 2018). However, another hypothesis is that the LIF measurements have, at least in part, suffered from an instrumental bias in these environments due to interfering species.
Early LIF measurements of OH suffered from significant interferences due to laser-generated OH from ozone photolysis in the presence of water vapour (Hard et al., 1984). While this effect has been reduced by going from 282 to 308 nm laser excitation of OH, it may still be significant, especially at night or with the use of multi-pass laser set-ups (e.g. up to molec. cm−3 in Griffith et al., 2016). Laboratory experiments conducted by Ren and co-workers using the Pennsylvania State University (PSU) LIF instrument showed negligible interferences in OH detection for a range of candidate species: H2O2, HONO, HCHO, HNO3, acetone, and various RO2 radicals (Ren et al., 2004). Observations of OH during the PROPHET (Program for Research on Oxidants: PHotochemistry, Emissions and Transport) field campaign in summer 1998, located in a mixed deciduous forest in Michigan, USA, revealed unusually high night-time OH concentrations ( molec. cm−3) but measurement interferences were ruled out (Faloona et al., 2001).
However, the results of more recent studies conducted in forested environments have meant that interferences in the measurement of OH by LIF–FAGE have been revisited. The usual background method of this technique, where the laser wavelength is scanned off-resonance from an OH transition (“OHwave”), does not discriminate between ambient (i.e. “real”) OH and either OH formed inside the FAGE cell (e.g. laser- or surface-generated OH or via unimolecular decomposition in the gas phase to form OH) or fluorescence from other species at λ∼308 nm (e.g. naphthalene, SO2), although it is possible to correct for such effects providing the interference has been previously characterised (Martinez et al., 2004; Ren et al., 2004; Griffith et al., 2013; Fuchs et al., 2016). There is an alternative, chemical method (“OHchem”) for obtaining the OH background signal in LIF instruments that allows for interference signals to be determined without their prior characterisation, in order to rule out possible artefacts from unknown species. The OHchem method involves the addition of a high concentration of an OH scavenger, such as perfluoropropene (C3F6) or propane, just before the FAGE inlet. Ambient OH is quickly titrated away by fast reaction with the scavenger, but any interference should remain in the fluorescence signal, although this must be corrected for reaction of any internally generated OH with the scavenger inside the FAGE cell.
Several LIF–FAGE groups have now made efforts to validate ambient OH measurements through incorporation of the alternative OHchem technique, which was first applied for continuous OH measurements by Mao et al. (2012). Since then, field studies of OH measurement interferences have been conducted in forested (Griffith et al., 2013; Novelli et al., 2014a, 2017; Feiner et al., 2016; Lew et al., 2019), rural (Fuchs et al., 2017; Tan et al., 2017), suburban (Tan et al., 2018, 2019), urban (Ren et al., 2013; Brune et al., 2016; Griffith et al., 2016), and coastal (Novelli et al., 2014a; Mallik et al., 2018) locations. Substantial improvement in measurement–model agreement has been possible when OH backgrounds were determined chemically, especially in forested environments, suggesting that understanding of tropospheric oxidation processes in such regions may be better than previously thought (Mao et al., 2012; Hens et al., 2014; Feiner et al., 2016). This is further supported by the positive identification of two new OH interference candidates in laboratory experiments, namely intermediates in alkene ozonolysis reactions, which may (Novelli et al., 2014b, 2017; Rickly and Stevens, 2018) or may not (Fuchs et al., 2016) be related to stabilised Criegee intermediates (SCIs), and the NO3 radical (Fuchs et al., 2016), although for all cases the observed interferences cannot explain the magnitudes of the OH background signals under ambient conditions. The trioxide species, ROOOH, has also been postulated to explain elevated OH backgrounds in LIF–FAGE measurements made in forested regions (Fittschen et al., 2019).
However, it is not known whether other LIF instruments suffer the same levels of interference, which are likely highly dependent on cell design and operating parameters, especially the residence time of air between sampling and detection (Novelli et al., 2014a; Fuchs et al., 2016; Rickly and Stevens, 2018). Considering the bespoke nature of LIF–FAGE instruments, those of different groups share the same main features but differ in many aspects, such as inlet size and shape, or whether the laser crosses the detection axis once (i.e. single-pass) or multiple times (multi-pass). As a result, the magnitude of any interference is likely to vary significantly between different instruments. Because of this, a general recommendation of the 2015 International HOx Workshop (Hofzumahaus and Heard, 2016) was that different groups should incorporate their own chemical scavenger system for use in ambient OH measurements and to test interferences in the laboratory.
Following this recommendation, the Leeds ground-based FAGE instrument was modified to incorporate a chemical scavenger system, through the addition of an inlet pre-injector (IPI). In this work, we describe the design of the IPI system and its thorough characterisation in terms of sensitivity and the degree of external and internal OH removal. Following this, we present the results of interference testing experiments performed using the IPI system, in which we investigated interferences from O3+H2O, isoprene ozonolysis, and NO3 radicals. Finally, we demonstrate the use of the optimised IPI system for measurements of ambient OH made during three separate field campaigns in the UK and China, which encompassed a wide range of chemical and meteorological conditions.
2.1 Overview of the Leeds ground-based FAGE instrument
The University of Leeds ground-based FAGE instrument, described in detail elsewhere (Creasey et al., 1997a; Whalley et al., 2010, 2013), has participated in 24 intensive field campaigns since its initial deployment in 1996. Measurements of OH, HO2, and, more recently, RO2 radicals (Whalley et al., 2013) have been made in a variety of locations, ranging from pristine marine boundary layer (Creasey et al., 2003; Whalley et al., 2010), tropical rainforest (Whalley et al., 2011), and polar (Bloss et al., 2007) environments to coastal (Smith et al., 2006) and semi-polluted regions (Creasey et al., 2001), as well as urban areas (Heard et al., 2004; Emmerson et al., 2007), including a highly polluted megacity (Lee et al., 2016; Whalley et al., 2016).
Ambient OH is measured using laser-induced fluorescence. Briefly, ambient air is drawn through a 1.0 mm diameter pinhole in a conical turret inlet (4 cm length, 3.4 cm ID; Fig. 1) at ∼7 slm into a stainless steel fluorescence cell, held at ∼2 hPa using a Roots blower (Leybold RUVAC WAU 1001) backed by a rotary pump (Leybold SOGEVAC SV200). An all solid-state laser system is used to excite OH via the electronic transition at λ=308 nm (HO2 is measured by conversion to OH using NO; see details below). The resultant fluorescence at 308 nm is detected by a micro-channel plate photomultiplier (MCP, Photek PMT325/Q/BI/G with 10 mm diameter photocathode) equipped with a 50 ns gating unit (Photek GM10-50) and a 2 GHz 20 dB gain amplifier (Photek PA200-10), and the signal is analysed by gated photon counting (Whalley et al., 2010). The background signal is normally obtained by scanning the laser wavelength off-resonance from the OH transition line, yielding the measurement commonly referred to as OHwave:
where COH is the instrument calibration factor for OH and and are the OH LIF signals at on- and off-resonance wavelengths, respectively. Similarly, the alternative measurement known as OHchem is defined as follows:
where is the OH signal measured at an on-resonance wavelength but in the presence of a scavenger.
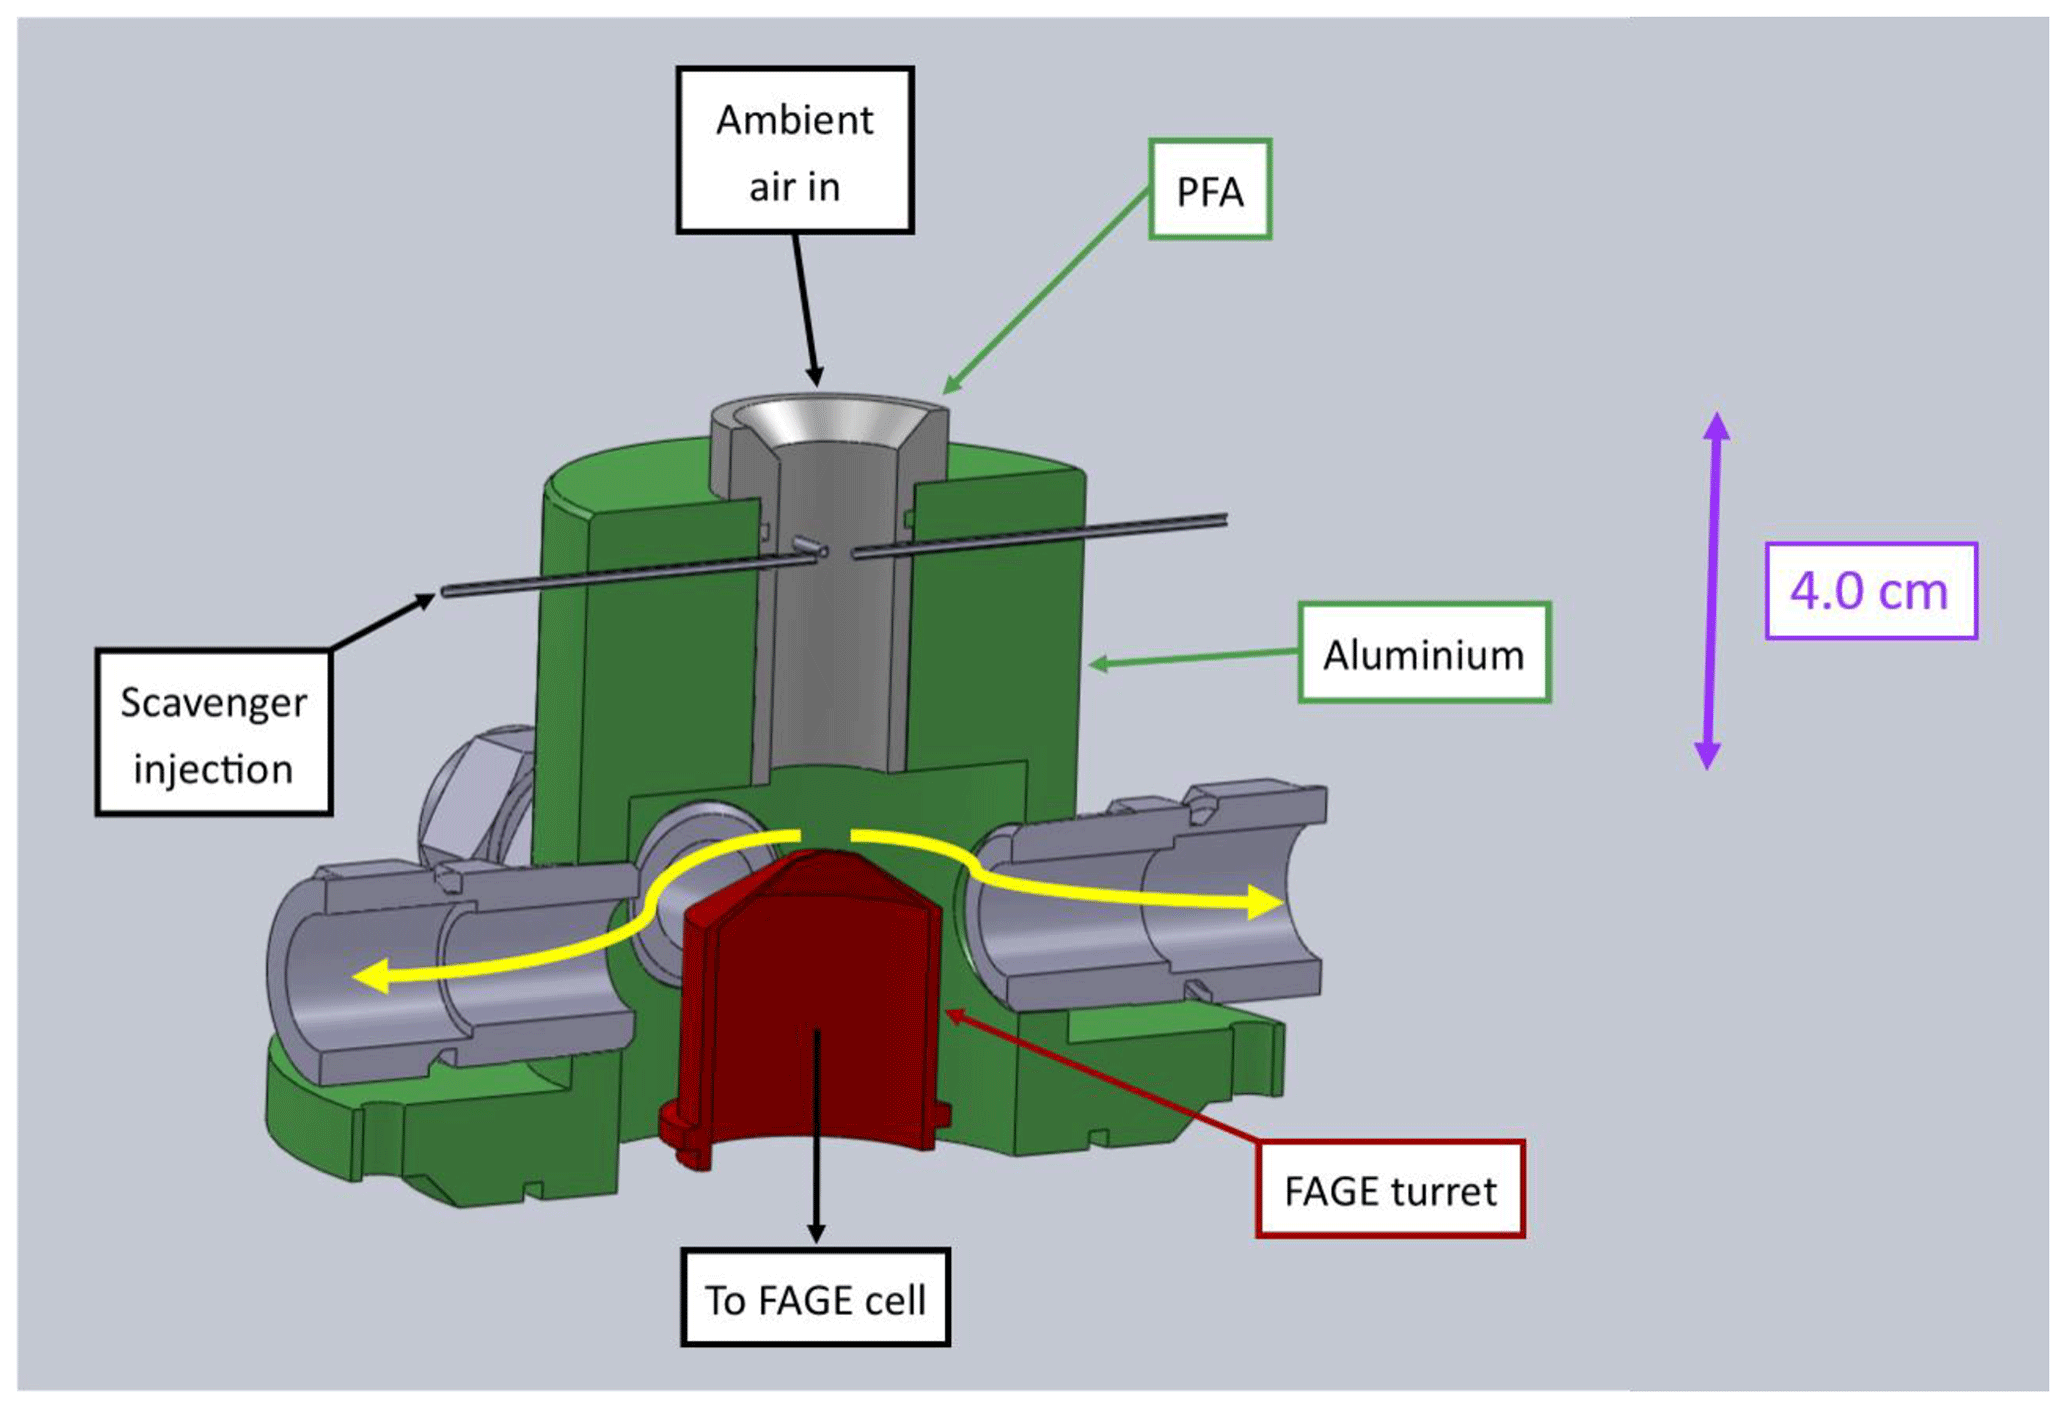
Figure 1Labelled SolidWorks model of the Leeds inlet pre-injector (IPI). The scavenger is injected into the centre of the perfluoroalkoxy (PFA) flow tube via four 0.25 mm ID needles. The thick yellow arrows indicate the direction of the sheath flow.
HO2 is detected via its conversion to OH following the addition of NO (BOC, 99.95 %, and Messer, 99.95 %). Although not reported here, RO2 radicals are measured using the ROxLIF method (Fuchs et al., 2008; Whalley et al., 2013), in which their reactions with NO and CO (BOC, 5 % in N2, and Messer, 10 % in N2) result in conversion initially to OH (using NO; ) and subsequently back to HO2 (using CO; OH→HO2) that is then detected as described above (via addition of NO inside the FAGE cell; HO2→OH). The NO and CO are delivered using mass flow controllers (MFC, MKS Instruments 1179A series), which, unless otherwise stated, were also used to control all other gas flows described in this work. The Leeds FAGE instrument features two fluorescence cells, where laser light (∼10–20 mW at 308 nm, supplied at a pulse repetition frequency of 5 kHz via an optical fibre) enters each cell in series. For normal operation in the field, the first cell (HOx) measures OH and HO2 (low NO flow, 5 sccm; RO2 interference minimised) sequentially, while the second cell (ROx) measures (high NO flow, 50 sccm; RO2 interference maximised) and then total RO2 (Fuchs et al., 2008; Whalley et al., 2013).
Calibration of the FAGE instrument is achieved by supplying known radical concentrations via a turbulent flow tube (known in Leeds as the “wand”) held at ∼45∘ to the instrument inlet, where OH and HO2 are formed in a 1:1 ratio (Fuchs et al., 2011) by the photolysis of water vapour at 184.9 nm using a Hg(Ar) pen-ray lamp (LOT LSP035) in an excess flow (40 slm) of humidified ultra-high-purity air (BOC, BTCA 178, and Messer, 20.5 % O2 in N2). Chemical actinometry is performed via the photolysis of N2O (BOC, medical-grade 98 %) to measure the product of lamp flux and photolysis exposure time to enable calculation of radical concentrations (Edwards et al., 2003; Faloona et al., 2004). The calibration of OH using the water vapour photolysis method has been validated by comparison with other methods, for example the kinetic decay of hydrocarbons (Winiberg et al., 2015).
2.2 Inlet pre-injector (IPI) design
The Leeds inlet pre-injector (Fig. 1) is similar in concept to the design of Mao et al. (2012) and consists of a 4.0 cm length, 1.9 cm ID perfluoroalkoxy (PFA) cylinder embedded inside an aluminium housing, which seals to the FAGE cell via an O-ring base. The scavenger is injected into the centre of the PFA flow tube via four 0.25 mm ID needles, 4.0 cm above the FAGE inlet. The low bore capillary tubing increases the pressure inside the needles, which facilitates mixing of the scavenger into the ambient air stream. In this work propane (BOC, research-grade 99.95 %, and Messer, 99.995 %) was used as the main OH chemical scavenger, with similar results (see Sect. 3.1.2) obtained for C3F6 (Sigma-Aldrich, 99 %). Based on previous investigations of OH interferences (Stevens et al., 1994; Dubey et al., 1996; Faloona et al., 2001; Ren et al., 2004; Mao et al., 2012; Griffith et al., 2013; Rickly and Stevens, 2018), C3F6 was used initially as it reacts quickly and selectively with OH ( cm3 molec.−1 s−1 Sander et al., 2011) and does not contain any hydrogen atoms, which could serve as a source of laser-generated OH via abstraction by O(1D) atoms (Stevens et al., 1994; Dubey et al., 1996). However, C3F6 must be diluted in an inert gas before it can be flowed through MFCs, and its availability in the UK became limited in 2015. Following Novelli et al. (2014a), we therefore used propane for most laboratory experiments and all ambient measurements, despite the fact that it reacts more slowly with OH ( cm3 molec.−1 s−1 Sander et al., 2011).
As shown in Fig. 2, the scavenger (0–50 sccm) is diluted in a flow of N2 (500 sccm, BOC, 99.998 %) prior to injection, which is controlled using a solenoid valve (Metron Semiconductors). Any dead volume after the valve is purged continuously by the N2 dilution flow, using a narrow-bore injector inserted through the tee after the valve, with the injector tip placed as close to the valve orifice as possible. This enables fast flushing of the system to optimise the response time before and after scavenger injection. Incorporation of the purge system resulted in pre- and post-injection stabilisation times on the order of seconds (data not shown), minimising data loss. The valve state and scavenger flow over the course of the data acquisition cycle are controlled using a custom program nested within the FAGE software.
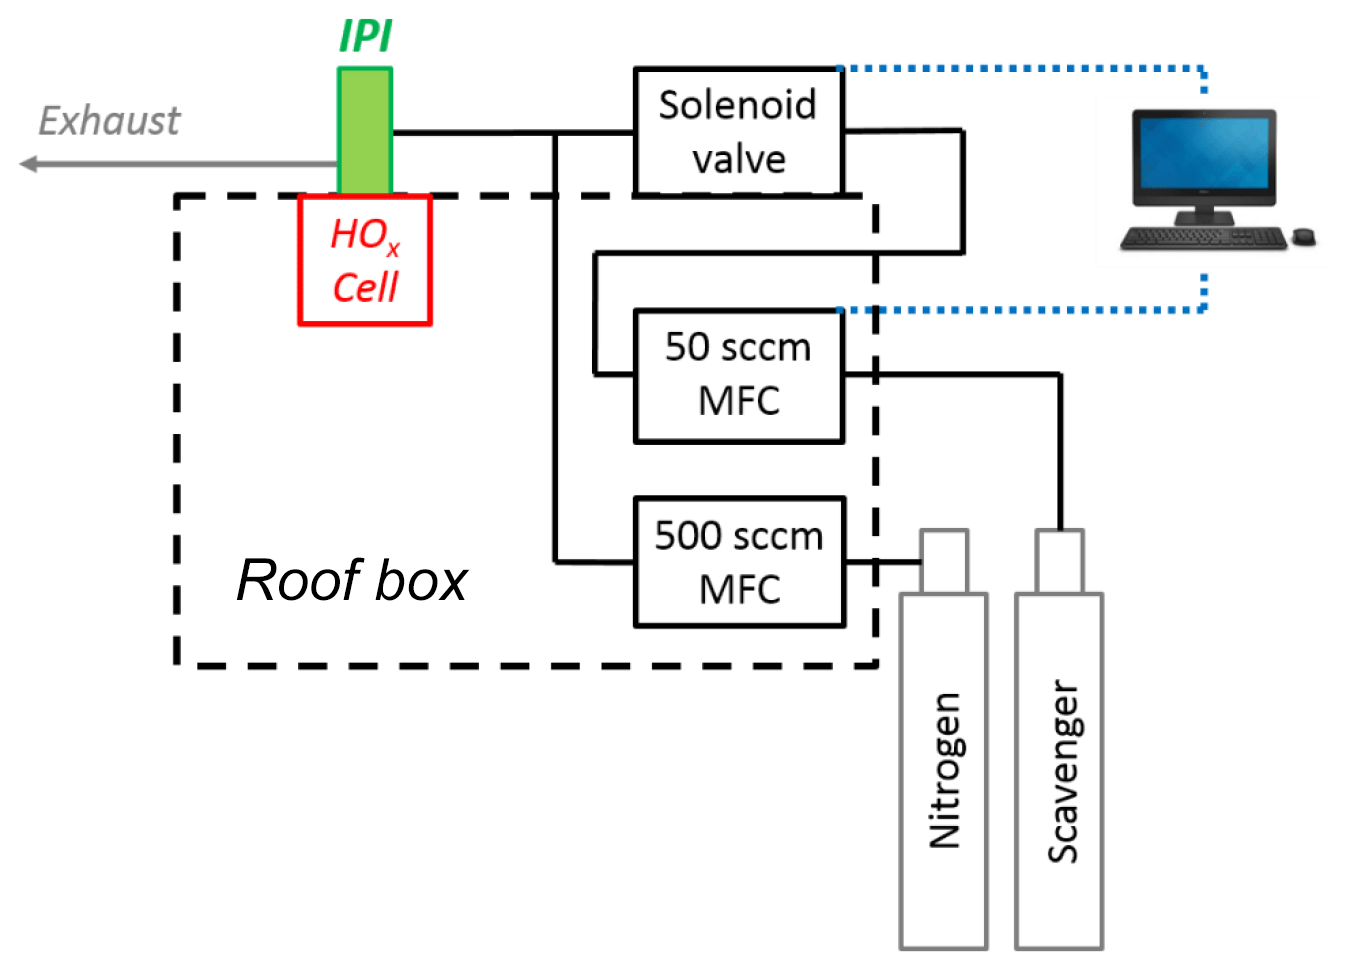
Figure 2Diagram of the gas flows involved in IPI scavenger injection (not to scale). The two mass flow controllers (MFCs) are housed in the roof box, where the scavenger MFC (0–50 sccm) and injection valve (in a weatherproof housing on top of the roof box) are controlled using the main FAGE PC situated in the container laboratory.
To reduce radical wall losses, excess ambient air is drawn through the IPI to generate a sheath flow, via four ports spaced evenly around the flow tube housing as shown in Fig. 1. This minimises the FAGE sampling of air from near the walls of the cylinder, housing, and turret. The total flow rate through the IPI is 32 slm, of which 7 slm is sampled by the FAGE cell and the remainder of the flow is maintained by a vacuum pump (Agilent Technologies IDP-3 Dry Scroll Pump) and measured volumetrically using a rotameter (Brooks 2520, 4–50 L min−1).
During interference testing experiments using the IPI system (Sect. 3.2), ozone and water vapour concentrations were measured using a commercial UV absorption instrument (Thermo Environmental Instruments Inc. 49C) and a chilled mirror dew point hygrometer (General Eastern 1311DR sensor and 4×4 Optica), respectively.
Table 1Overall meteorological and chemical conditions encountered during each field campaign, including example VOCs. Values are given as the median of all points that coincide with IPI sampling periods, except for J(O1D) and O3, which are reported as diurnally averaged maxima.
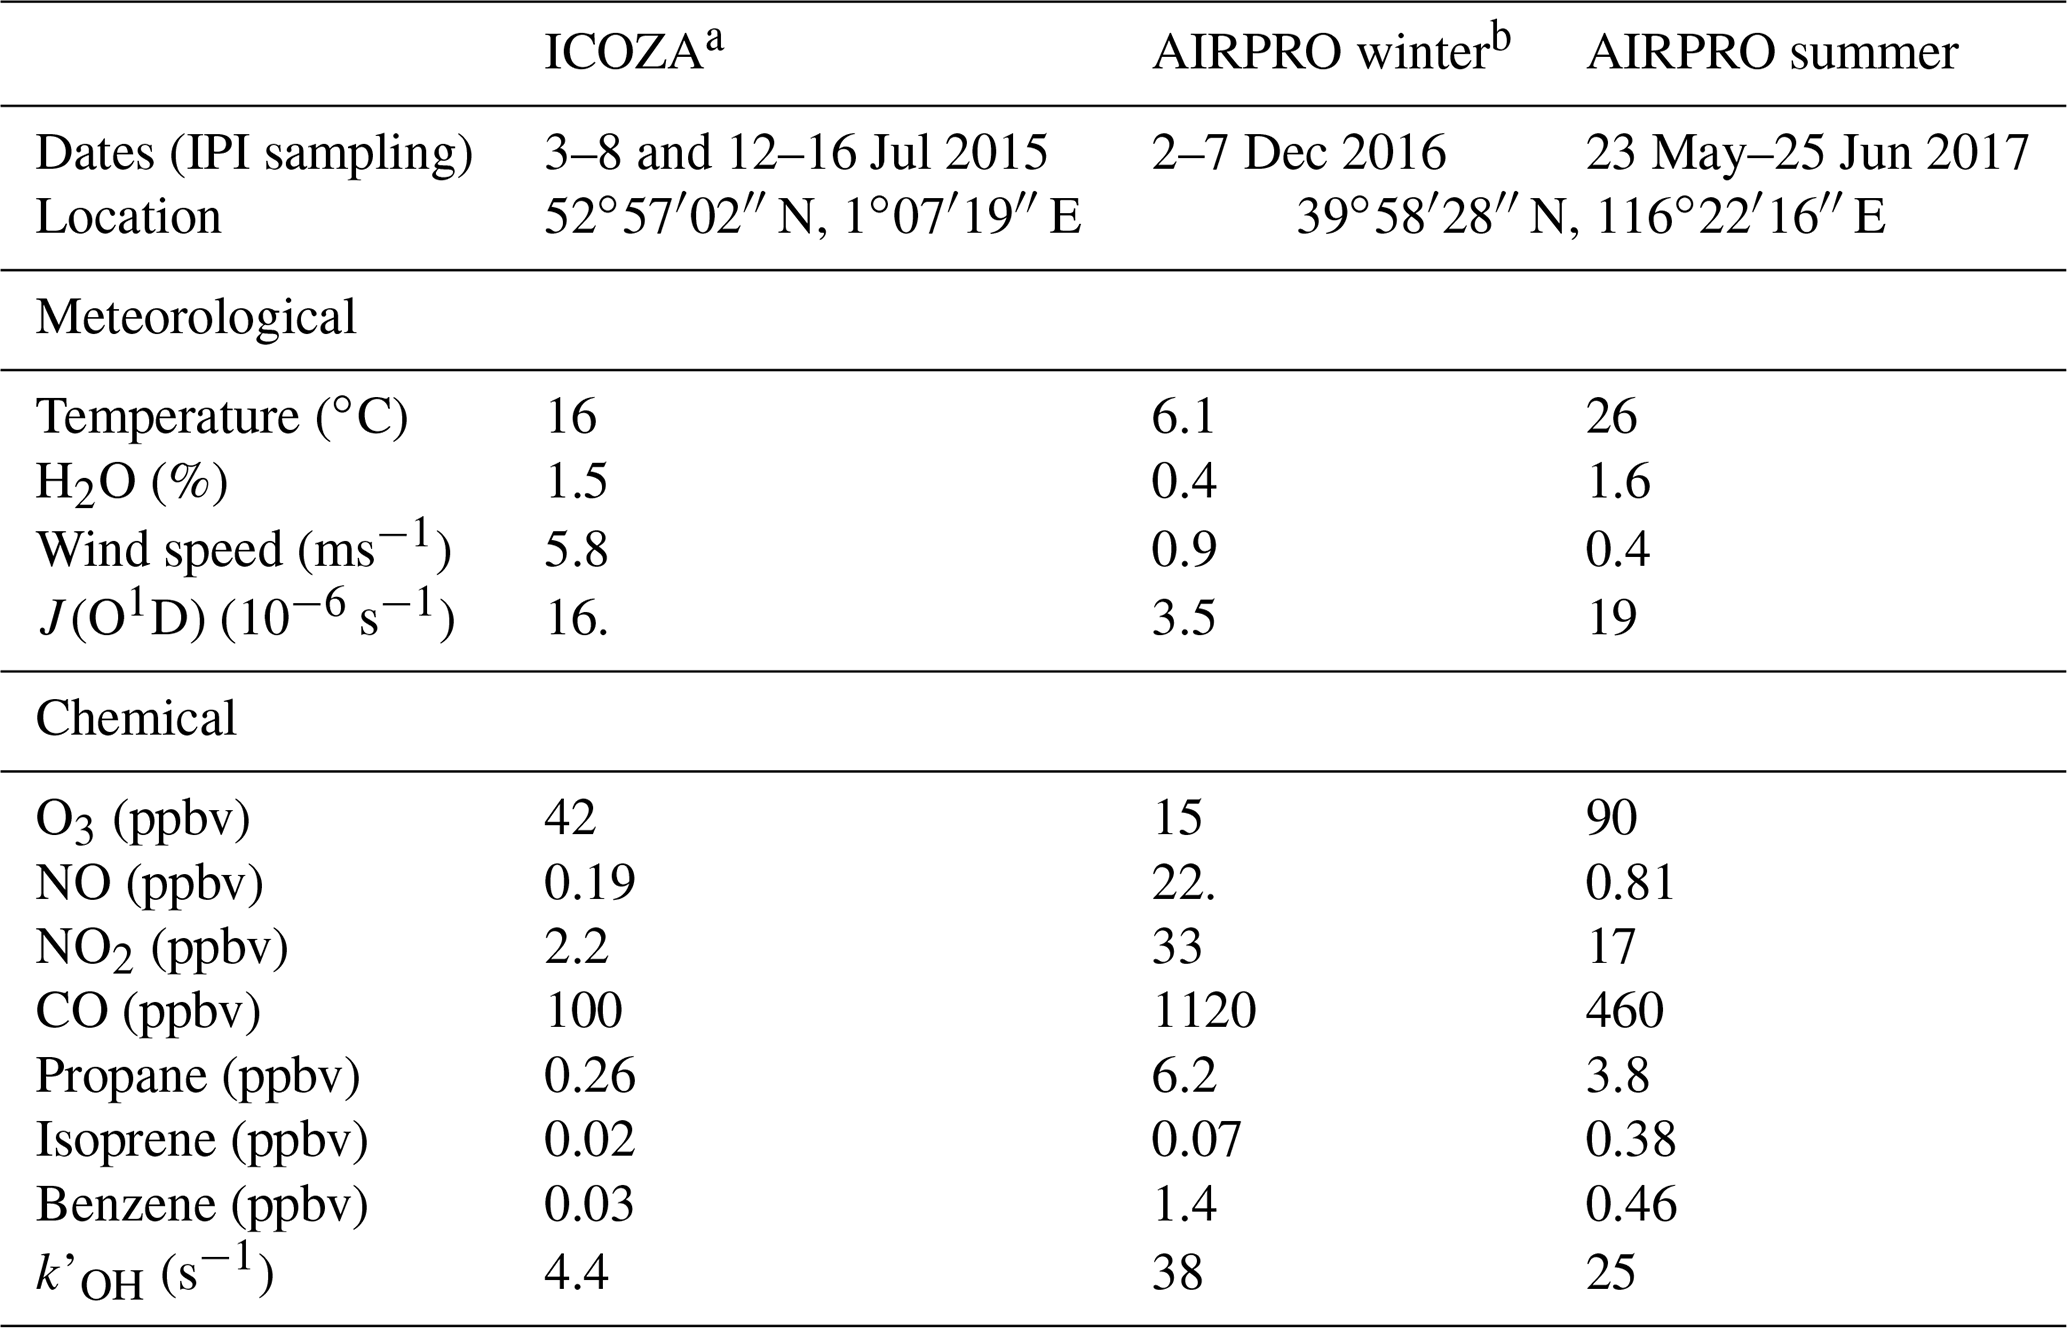
a Integrated Chemistry of OZone in the Atmosphere. b An integrated study of AIR pollution PROcesses in Beijing (Shi et al., 2019).
2.3 Field measurement sites
Ambient measurements of OHwave and OHchem were made using the Leeds IPI–FAGE instrument during three separate intensive field campaigns in different locations and seasons. This allowed for the investigation of potential OH interferences under markedly contrasting conditions. For all three field campaigns, measurements of OH, HO2, and partially speciated RO2 were made using the Leeds FAGE instrument (4 m above ground level), operated in the sequential detection modes described in Sect. 2.1 (Whalley et al., 2013). Total OH reactivity, , was also measured, using the laser flash photolysis–LIF instrument described in detail by Stone et al. (2016). A range of supporting chemical, aerosol, and meteorological parameters were measured, with instruments situated either in buildings or shipping containers at each of the two sites. Gas-phase chemical observations included water vapour, NOx, NOy, O3, CO, SO2, HONO, HCHO (Cryer, 2016), ClNO2, VOCs, and OVOCs. Photolysis rates (J) for a variety of species, including O3 (→ O(1D)), NO2, HCHO, HONO, and ClNO2, were measured using a 2π spectral radiometer (2π actinic receiver optic, Meteorologie Consult GmbH, coupled to an Ocean Optics QE Pro spectrometer), and J(O1D) was also measured using a 2π filter radiometer (Meteorologie Consult GmbH) (Bohn et al., 2008). The meteorological and chemical conditions, including some example VOCs, encountered during each campaign are summarised in Table 1 and discussed in further detail below.
The first deployment of the Leeds IPI was during the ICOZA (Integrated Chemistry of OZone in the Atmosphere) project, which took place in July 2015, at the Weybourne Atmospheric Observatory (WAO), Weybourne, located on the northern Norfolk Coast, UK (52∘57′02′′ N, 1∘07′19′′ E, 15 m a.s.l.). The WAO is a Global Atmospheric Watch (GAW) regional station, and the site is impacted by a range of contrasting air masses, from clean Arctic air to processed emissions from the UK (e.g. London, which is located ∼180 km SSW of the observatory) and northern Europe. The aim of this field campaign was to improve understanding of ozone chemistry through integrated measurements of P(O3), i.e. the chemical or in situ ozone production rate (OPR) (Cazorla and Brune, 2010; Cazorla et al., 2012), with comparisons to a range of other observational and model approaches. Two continuous IPI sampling periods were conducted in the middle of the campaign, separated by a few days (3–8 and 12–16 July), with a total of 9 d where OHchem measurements are available around midday (fully continuous measurements were not always possible due to multiple instrument problems, e.g. cell blockages and laser power drops). For other times, only measurements of OHwave are available. During the IPI sampling periods, power cuts on the nights of 3–4 and 6–7 July resulted in extended data loss.
In general, the ICOZA campaign was characterised (Table 1) by moderate temperatures (16 ∘C median), high humidity (RH ∼80 %), and strong wind speeds (∼6 m s−1), as might be expected at a temperate, coastal location in the summertime. The predominant wind sector, based on wind direction measurements at the site, was westerly (∼30 %), followed by southwesterly (∼20 %) and southerly (∼15 %). Back-trajectory analysis showed that during IPI sampling periods, the site was predominantly under the influence of Atlantic air (Cryer, 2016). These air masses had spent a considerable amount of time (∼1 d) over the UK, often encountering emissions from urban areas, which underwent photochemical ageing during their transport to the WAO site. Overall, the levels of pollution observed at the site were moderate, and the lowest of the three field campaigns discussed in this work (Table 1), and levels of isoprene were low. However, ozone mixing ratios were relatively high, with a diel-average maximum of ∼40 ppbv, driven in part by strong UV and near-UV radiation.
The Leeds IPI was deployed during another two campaigns at the Institute of Atmospheric Physics (IAP, 39∘58′36.06′′ N, 116∘22′53.69′′ E), an urban site in Beijing, China, during winter (November–December) 2016 and summer (May–June) 2017, as part of the AIRPRO (an integrated study of AIR pollution PROcesses in Beijing) project. AIRPRO is part of the wider APHH (Air Pollution and Human Health in a Chinese megacity) project (Shi et al., 2019), a joint UK–China programme. The aims of AIRPRO included the assessment of how pollutants are transformed and removed through transport, chemical, and photolytic processes, with a particular emphasis on the identification of the dominant oxidative degradation pathways (i.e. the relative importance of reactions with OH, NO3, and O3). The AIRPRO project allowed for the assessment of OH measurement interferences under the highly polluted conditions of the megacity Beijing, situated on the heavily industrialised North China Plain. In winter, the site is impacted by urban and regional anthropogenic emissions, in particular those from the combustion of fossil fuels for residential heating. During summer, the site is subject to additional biogenic influences, and strong photochemical activity results in high rates of ozone production. In winter, OHwave and OHchem were measured simultaneously for 6 d of the campaign. In summer, almost 1 month of near-continuous IPI data are available, with 1 d of interruptions due to IPI testing (see Sect. 3.1.2).
For both AIRPRO field intensives, the predominant wind sectors were westerly and southerly–southeasterly, which generally result in higher pollutant concentrations (Chen et al., 2015). Indeed, the two campaigns were subject to high pollutant concentrations, as illustrated by the elevated levels of NO2, CO, propane, benzene, and , many of which were over an order of magnitude higher than ICOZA (Table 1). In addition, the biogenic influence during summer is clear from the relatively high isoprene concentrations observed, ∼0.4 ppbv on average but reaching up to 7.9 ppbv, a level considerably higher than those observed in some forested environments. Despite similar J(O1D) values between ICOZA and AIRPRO summer, the higher VOC loadings during the latter resulted in increased production of ozone (90 ppbv diurnally averaged maximum). In contrast, AIRPRO winter was characterised by small ozone mixing ratios (15 ppbv diurnal maximum), as a consequence of high NO levels (median 22 ppbv) and weak UV radiation. In summer, NO levels were high in the morning (∼14 ppbv at 06:00 China standard time, CST) but surprisingly low in the afternoon, with diel-average median levels of ∼0.5 ppbv (15:00–18:00 CST).
For all ambient observation periods, the IPI data acquisition cycle consisted of 5 min of online wavelength and 30 s of offline wavelength (spectral background) integration, where the online period was split into 2 min of OH measurements and 2 min of propane addition to the IPI flow tube (chemical background), followed by 1 min of HO2 measurements (by the addition of NO to the FAGE cell). In terms of instrumental operation, the only difference between ICOZA and the AIRPRO campaigns was the use of different propane flows in the IPI. The propane concentration in the IPI flow tube was ∼110 ppmv ( s−1, τOH∼0.3 ms) during ICOZA and AIRPRO winter, but after internal removal experiments revealed that the propane level could be increased further (see Sect. 3.1.3), a 10-fold higher concentration (∼1100 ppmv), resulting in a concomitant reduction in the OH lifetime, was used for the AIRPRO summer campaign. On 1 d with high ozone (up to ∼80 ppbv) and moderate isoprene (∼0.5–1 ppbv) levels, the propane mixing ratio was reduced to ∼110 ppmv, but this had no observable effect on the background signals obtained for the summer data. All ambient OHwave data presented here have been corrected for the known interference from O3 in the presence of H2O vapour (see Sect. 3.2.1).
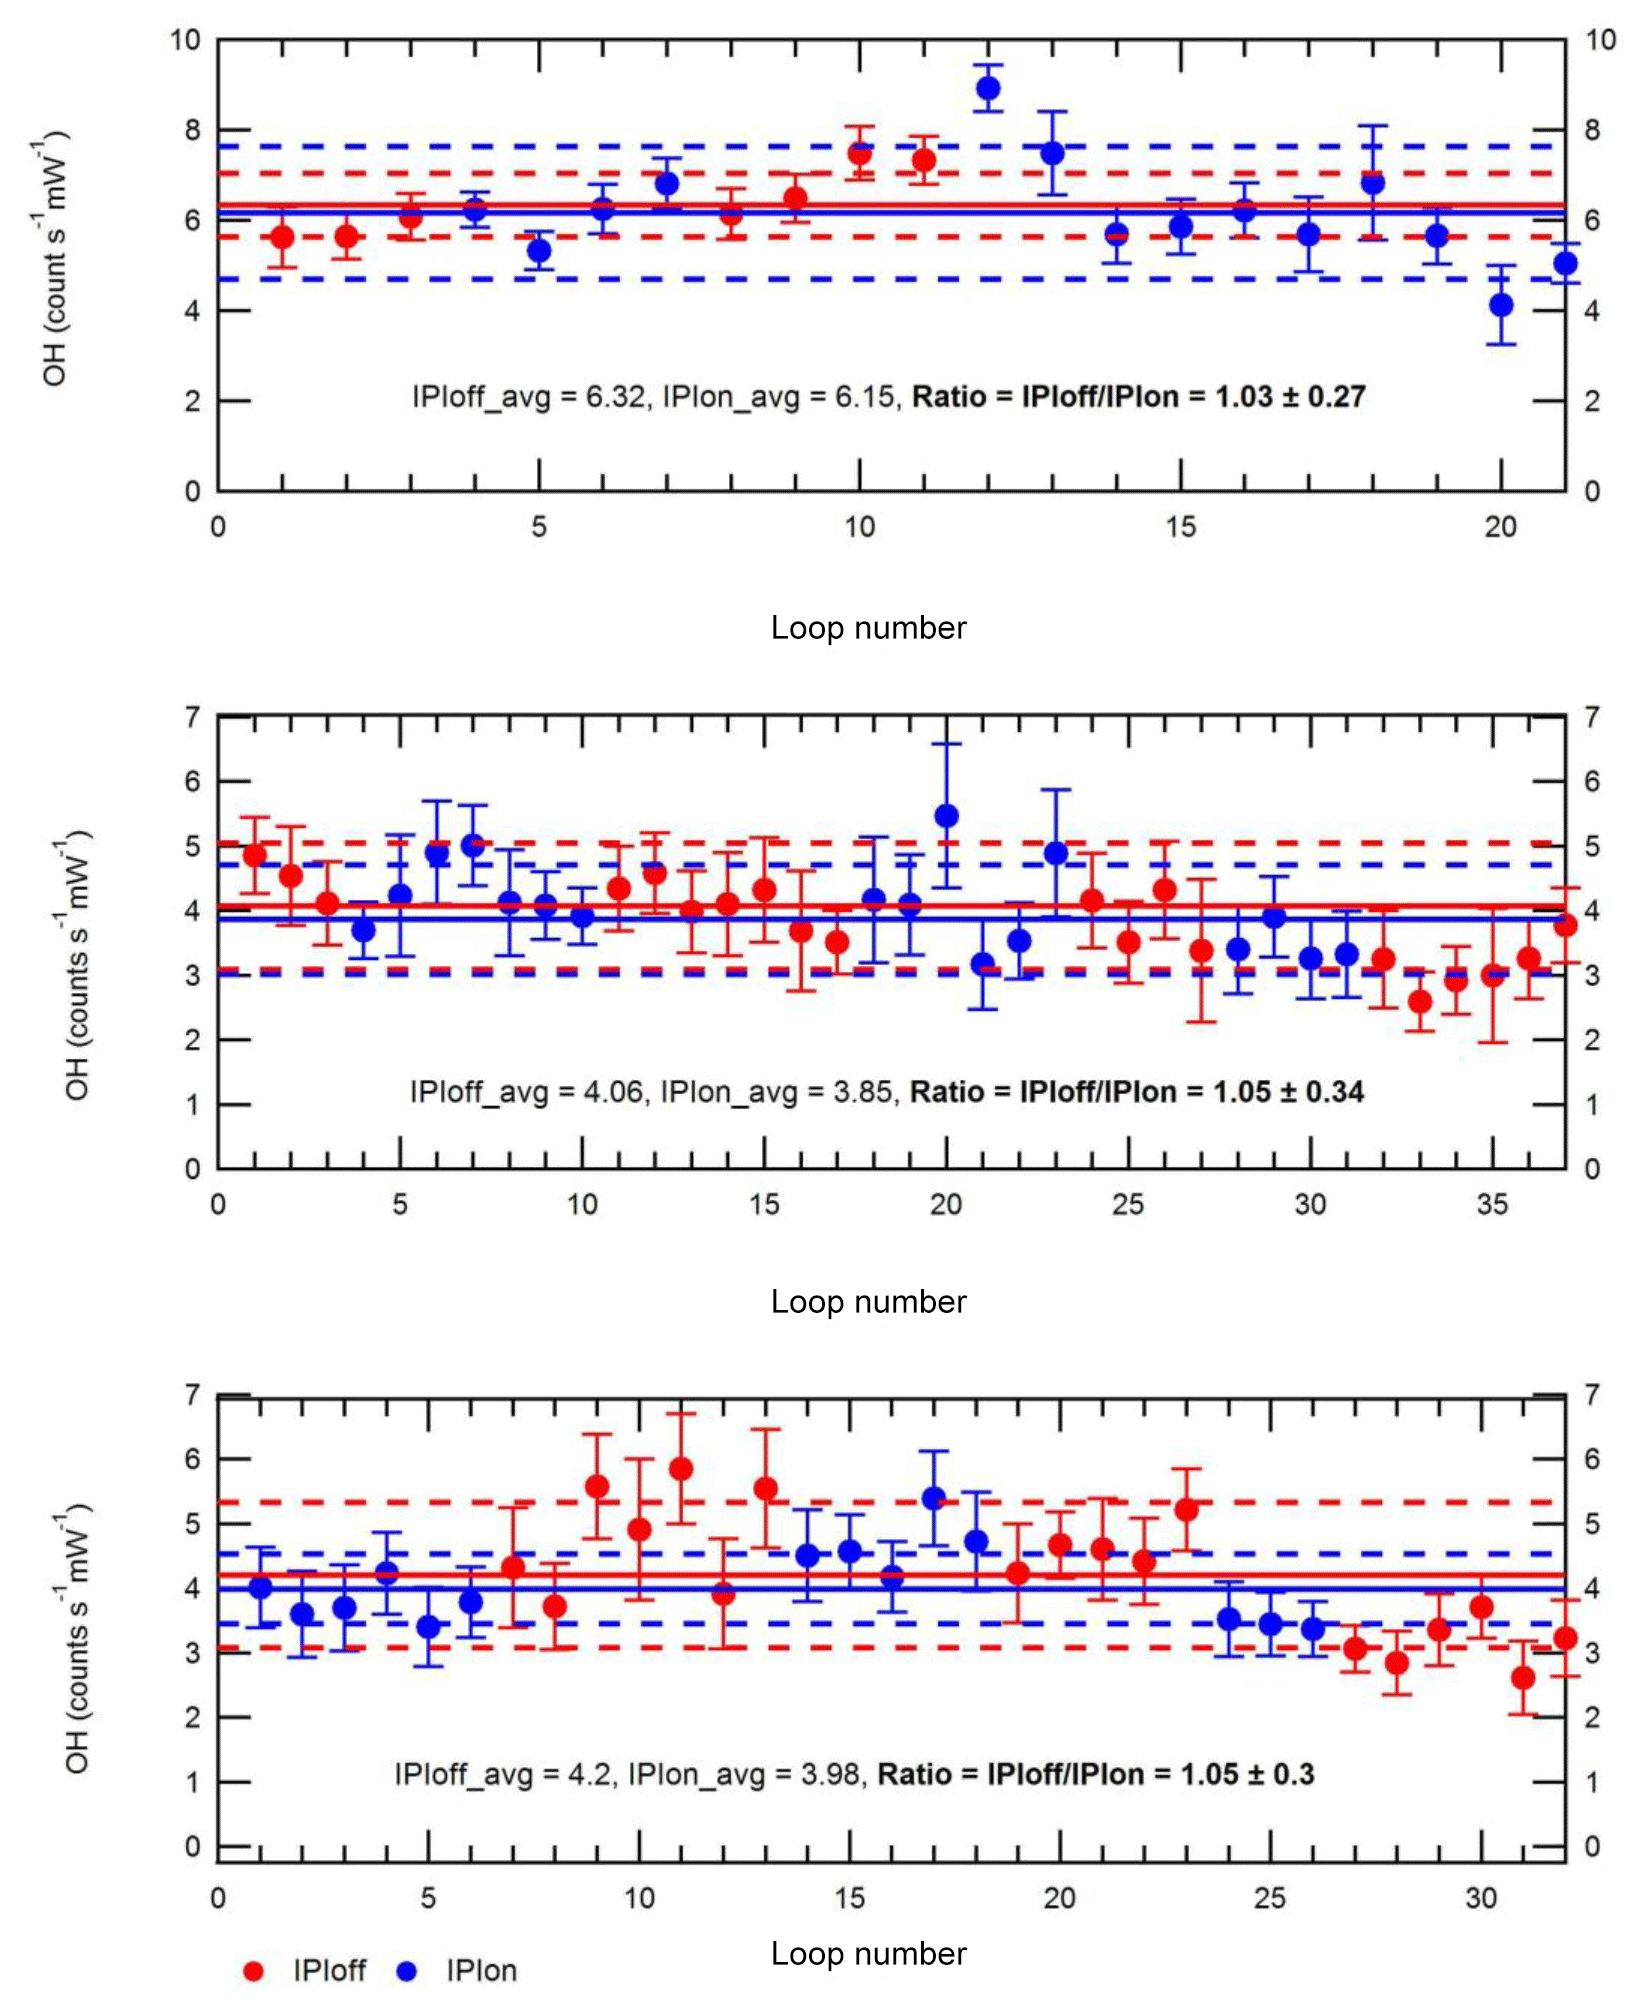
Figure 3Testing of OH losses in the IPI system. Each panel shows repeat measurements of OH signals (±2σ) over the course of 1 d, where high OH concentrations were generated using a 184.9 nm Hg lamp placed near the instrument inlet. Blue and red markers denote individual measurements (one measurement “loop”, i.e. one wavelength online–offline cycle) performed with (“IPIon”) and without (“IPIoff”) the IPI system, respectively. Solid lines correspond to the average signals for each day, with 2σ standard deviations (SD) shown by the dashed lines.
3.1 IPI characterisation
3.1.1 Sensitivity
The presence of additional surfaces in the IPI system may result in radical wall losses and therefore reduce the overall FAGE instrument sensitivity. To test for potential OH losses in the IPI flow tube, OH radicals were generated using a 184.9 nm Hg lamp placed ∼19 cm from the instrument inlet, so that ambient air with elevated radical concentrations (∼2–7×10⁷ molec. cm−3) was sampled, alternating between IPI and non-IPI sampling (Fig. 3), where for the latter the entire IPI assembly was removed. The dominant source of OH was the photolysis of ambient water vapour at 184.9 nm. In these experiments, the Hg lamp was placed sufficiently far away from each inlet within a large tent enclosure on the container roof, such that it could be assumed that OH concentrations were uniform in the region the inlet sampled from. Otherwise, the difference in inlet height between IPI and non-IPI sampling may have resulted in different OH concentrations being sampled, e.g. due to differences in O3 absorption at 184.9 nm (O3 has a high cross section at this wavelength), which would affect the light flux at the point of sampling and hence the concentration of OH generated. Since ambient variability (e.g. in NOx levels) also affects the atmospheric radical concentrations, the IPI–non-IPI cycle was repeated several dozen times on 3 different days within the tent enclosure to ensure sufficient averaging of the results. Any differences in wind speed or direction during the different days are not important because of the tent enclosure. Based on the averages for each set of repeat measurements in Fig. 3, these experiments yield a mean ±2σ IPIoff/IPIon ratio of 1.043±0.023, i.e. a < 5 % sensitivity reduction due to the presence of the IPI. While HO2 loss was not tested, the relative sensitivity is assumed to be closer to unity since it is less reactive than OH. In either case, the correction is smaller than the total instrumental uncertainty (∼26 % at 2σ), and as such no corrections were applied to OH or HO2 calibration factors for the final workup of ambient data collected during IPI sampling periods. In other words, we assume negligible transmission losses within the IPI, and the OH calibration factor we applied to ambient data was the same for (1) OHwave without IPI sampling, (2) OHwave during IPI sampling, and (3) OHchem during IPI sampling. However, it should be noted that in the field, calibrations are normally carried out without the IPI system present.
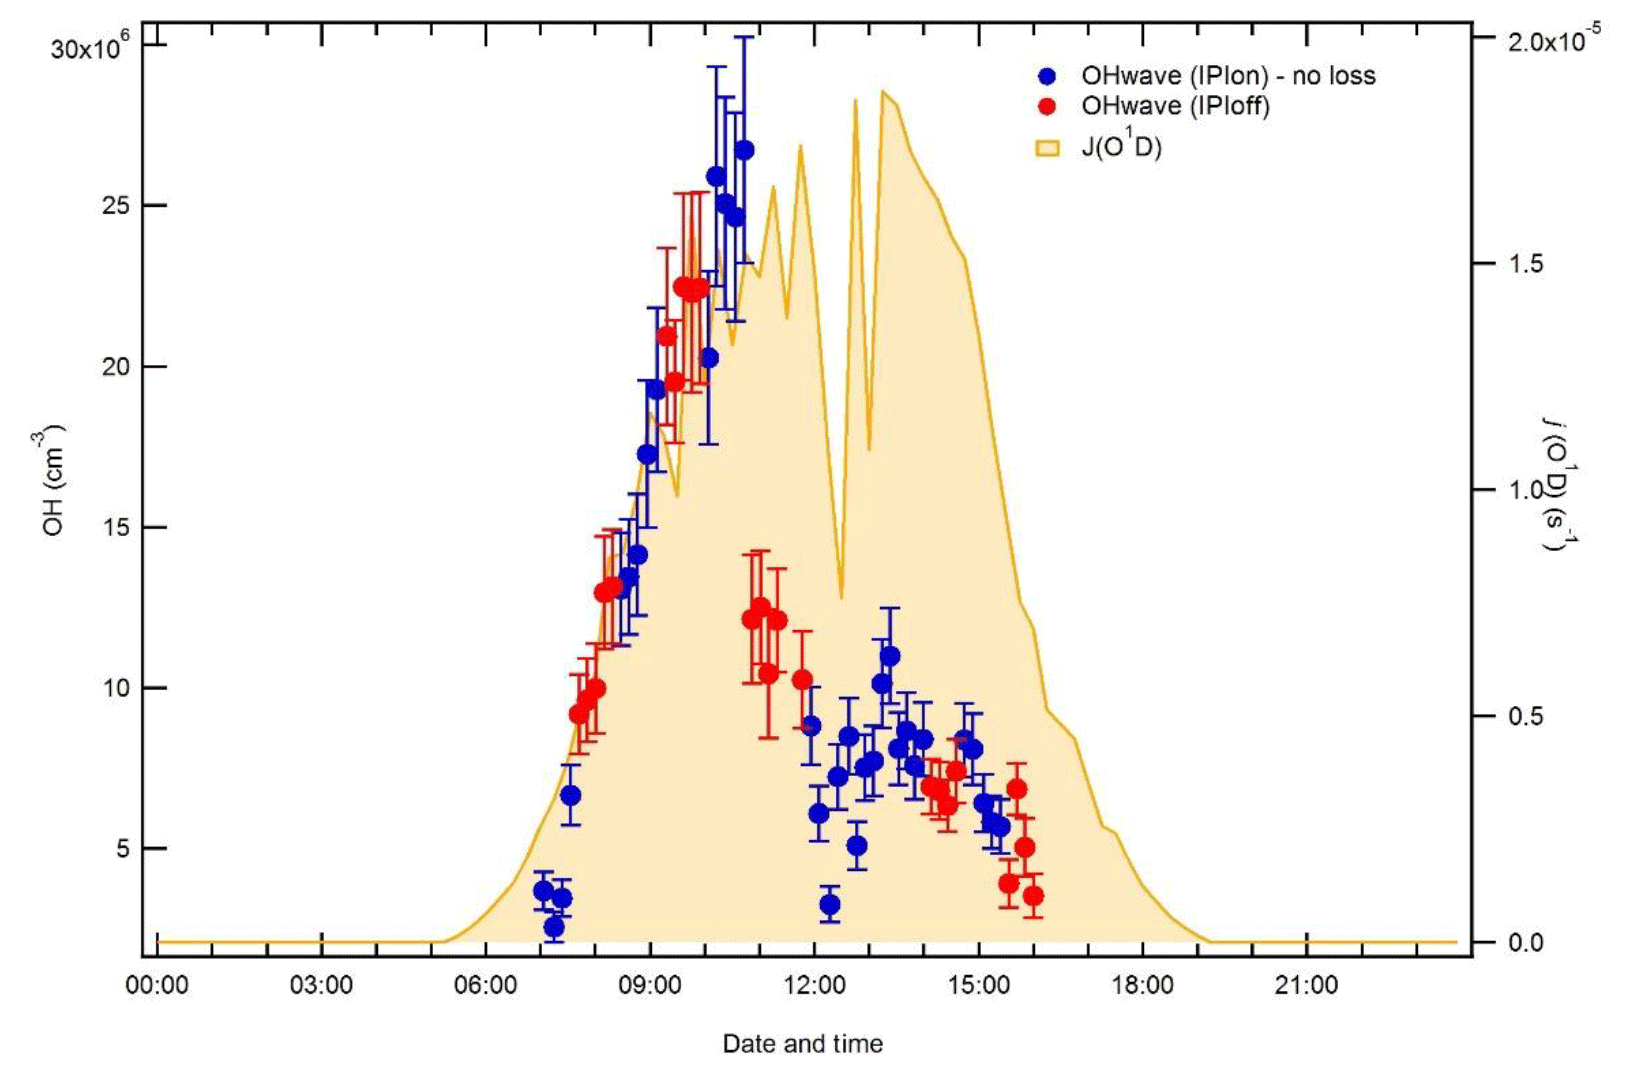
Figure 4Time series of OHwave concentrations in Beijing on 17 June 2017, a period of high OH levels in the summer 2017 AIRPRO (an integrated study of AIR pollution PROcesses in Beijing) campaign. Blue and red markers (±1σ) denote observations made with and without the IPI system, respectively.
The lack of OH loss in the IPI system is further supported by another test conducted in the field during the summer 2017 AIRPRO campaign, where on 1 d of the campaign sequential measurements of OHwave were taken with and without the IPI assembly present. While this was not a formal intercomparison, the summer 2017 campaign provided ideal conditions to assess IPI losses, considering the very high radical concentrations observed (OH was frequently > 1×10⁷ molec. cm−3) in Beijing and thus a good signal-to-noise ratio. The results of this experiment are shown for OH in Fig. 4. It can be seen that if no correction for a reduction in sensitivity is applied, adjacent IPIoff and IPIon periods of data are qualitatively in agreement, with no discontinuities in the temporal profile, implying that the IPI sensitivity loss is close to zero under field operating conditions. Similar results were obtained for HO2 (data not shown).
3.1.2 External OH removal
The external OH removal efficiency in the IPI system is controlled by the injection height, the choice of scavenger (i.e. the rate coefficient of the reaction of scavenger with OH), the scavenger and N2 dilution gas flows delivered to the injectors, and the sheath flow. A key requirement here is efficient mixing of the scavenger into the ambient air stream, which is difficult considering the fast flow rate and hence short residence time of air in the IPI flow tube. Additionally, it is important to consider that some reaction of the scavenger may occur inside the fluorescence chamber (internal OH removal, Sect. 3.1.3). This would give rise to a positive bias in ambient OH concentration measurements made using the OHchem method, as internal OH removal could result in loss of interfering OH and therefore an apparent reduction in the true background signal.
External OH removal experiments were performed by supplying known concentrations of OH and HO2 to the instrument using the calibration wand described in Sect. 2.1. However, in contrast to normal calibration procedures where the wand is held at 45∘ to the pinhole (to overfill the pinhole and minimise sampling of pockets of air which may have been in contact with the metal pinhole surface), IPI characterisation experiments were performed with the wand positioned parallel to the direction of flow within the IPI (i.e. 90∘ relative to the plane of the pinhole), with a distance of ∼3 cm between the wand exit and the PFA flow tube. The high flow through the calibration wand (40 slm) ensured that an excess of calibration gas was delivered to the IPI system (sample flow ∼32 slm).
The external OH removal efficiency (RE) may be calculated from the proportion of OH remaining () after injection of the scavenger, obtained from the ratio of the OH signals in the presence () and absence (SOH) of the scavenger:
Initial tests included variation of the N2 dilution flow; however, the OH removal efficiency was generally low (data not shown), likely due to poor mixing of the scavenger into the sampled air when the flow rate from the injector is small. As a result, the N2 dilution was set to the maximum flow of the MFC used (0.5 slm) for all subsequent experiments. Any further dilution of the ambient air stream would result in a loss of sensitivity towards the detection of radicals; however, at 0.5 slm the dilution flow is virtually negligible compared to the total flow rate in the IPI system (32 slm). In other preliminary experiments, the scavenger was injected closer to the FAGE inlet (1.0 and 2.5 cm), but this also resulted in poor external OH removal owing to the shorter residence time between scavenger injection and FAGE sampling.
The scavenging efficiency was determined for both propane and C3F6, with good agreement between the two scavengers. Figure 5 shows the remaining OH signal as a function of the OH reactivity ( [scavenger]) calculated in the flow tube, which normalises the scavenger concentrations according to their different reaction rates with OH. The observed removal efficiency is in broad agreement with the theoretical scavenging efficiency, based on the residence time in the flow tube (∼20 ms, assuming plug flow) and assuming perfect mixing, suggesting that in the Leeds IPI system the scavenger is well mixed into the gas sampled by the FAGE cell. An optimum removal of virtually 100 % (OH remaining (0.030±0.091) %) was observed at s−1, equivalent to ∼110 ppmv (2.7×10¹⁵ molec. cm−3) propane. This scavenger concentration was used for measurements of OHchem during the summer 2015 ICOZA project and winter 2016 AIRPRO project. For the summer 2017 AIRPRO project, a 10-fold higher scavenger concentration was used (∼1100 ppmv propane), after internal removal experiments revealed no loss of internal OH at this higher concentration, as discussed in detail in the next section.

Figure 5Proportion of the OH signal remaining (i.e. external OH removal efficiency) after addition of increasing concentrations of propane and perfluoropropene (C3F6) scavengers to the IPI flow tube, converted to equivalent OH reactivities () to account for the different rate constants for the reaction of each scavenger with OH: (a) linear y scale, (b) log y scale. Error bars denote the 2σ SD of repeat experiments. The blue curve corresponds to the theoretical scavenging efficiency assuming perfect mixing, using the estimated residence time, τ∼20 ms. The propane OH reactivity used for the ICOZA (Integrated Chemistry of OZone in the Atmosphere) and AIRPRO winter campaigns is given but that used for AIRPRO summer is off-scale.
3.1.3 Internal OH removal
Internal removal of OH was quantified by Mao et al. (2012) after forming OH inside the PSU ground-FAGE cell using a Hg lamp and comparing the OH signal with and without the presence of the scavenger (C3F6), which was added externally in the IPI system. It was found that most of the internal removal occurred in the instrument inlet, rather than in the OH detection axis, with a total loss of ∼20 %. Internal removal was not tested in the laboratory by Novelli et al. (2014a) for the Max Planck Institute for Chemistry (MPIC) FAGE instrument, but instead they limited the scavenger (propene and propane) concentration such that the external OH removal efficiency was < 95 %, to minimise possible reaction of the scavenger with OH inside the fluorescence cell. However, during ambient, night-time tests (constant atmospheric OH concentration assumed), no change in the OH background signal was observed after increasing the scavenger concentration by a factor of 7, providing evidence for a lack of internal removal (Novelli et al., 2014a).
In the present study, a novel approach was devised to quantify internal removal of OH in the Leeds IPI–FAGE instrument. First, under otherwise identical experimental conditions to those for external OH removal tests, sufficient CO (75 sccm, 95 ppmv) was added to the calibration wand to verify that the OH formed (alongside HO2) from the photolysis of water vapour was almost quantitatively converted to HO2 ((98.0±0.4) %, data not shown). Secondly, in addition to the calibration wand CO flow, a high flow of NO (50 sccm) was injected through 0.125 in. stainless steel tubing inside the FAGE cell, with the injector tip positioned centrally just below the turret pinhole, to reconvert the HO2 back to OH for LIF detection; these experimental conditions ensured a fairly high HO2-to-OH conversion efficiency of approximately 30 %. In this manner, OH was only generated inside the FAGE cell, and not in the IPI flow tube, such that any change in the fluorescence signal could be attributed to internal reaction of OH with propane, rather than reaction in the flow tube. The procedure for determination of internal OH removal bears some resemblance to that used for ambient detection of RO2 using the ROxLIF technique (Fuchs et al., 2008; Whalley et al., 2013), i.e. the external conversion of all radical species to HO2 before internal conversion to OH within the fluorescence cell.
The internal OH removal efficiency (RE) was quantified in an analogous manner to the external scavenging efficiency, using the total fluorescence signal in the presence () and absence () of the scavenger:
Figure 6 shows a time series of the LIF signal during two example internal removal experiments. Here, the LIF signal represents the sum of signals from OH and HO2, since they are produced in a 1:1 ratio (Fuchs et al., 2011) in the calibration wand. For both of the propane mixing ratios used, which were shown to result in near complete external OH removal in Sect. 3.1.2, there was no obvious decrease in the LIF signal, indicating no significant internal removal of OH. The average ±2σ internal OH removal observed for repeat experiments was (0.0±4.0) % (Table 2) at a propane mixing ratio of ∼110 ppmv (ICOZA and AIRPRO winter conditions). For repeat experiments at the higher propane mixing ratio used during the AIRPRO summer field campaign (∼1100 ppmv), the internal removal was still very small and almost insignificant ((2.9±6.6) %, Table 2). The observed internal OH removal may be compared to that which might be expected theoretically. In the ambient pressure flow tube, a propane mixing ratio of 1100 ppmv equates to s−1, but this is a factor of 760∕1.5 lower in the detection cell (i.e. the ratio of ambient to cell pressure), 59 s−1 (assuming constant gas density and no change in the OH + propane rate coefficient). Under normal operation, NO injection occurs 10.5 cm below the pinhole and 7.5 cm away from the laser axis (i.e. total of 18 cm between the pinhole and detection volume), with a residence time of 0.9 ms between NO injection and OH detection (Creasey et al., 1997b; Whalley et al., 2013). The gas likely slows down between pinhole sampling and NO injection but, assuming a constant gas velocity, the residence time between the pinhole and the laser axis is estimated at ∼2 ms. Based on this, an internal OH removal efficiency of ∼12 % is calculated, which is higher than observed, likely because the assumption of constant gas velocity is invalid (i.e. the real residence time is closer to ∼1 ms) and mixing between HO2 and NO from the injector is not instantaneous. However, it should be noted that this calculation also neglects the fact that the density is higher in the jet and the perturbation to normal flow caused by moving the NO injector close to the pinhole.
Table 2Internal removal of OH (%, ±2σ) as a function of propane mixing ratio in the IPI flow tube, determined as shown in Fig. 6 (see text for details).
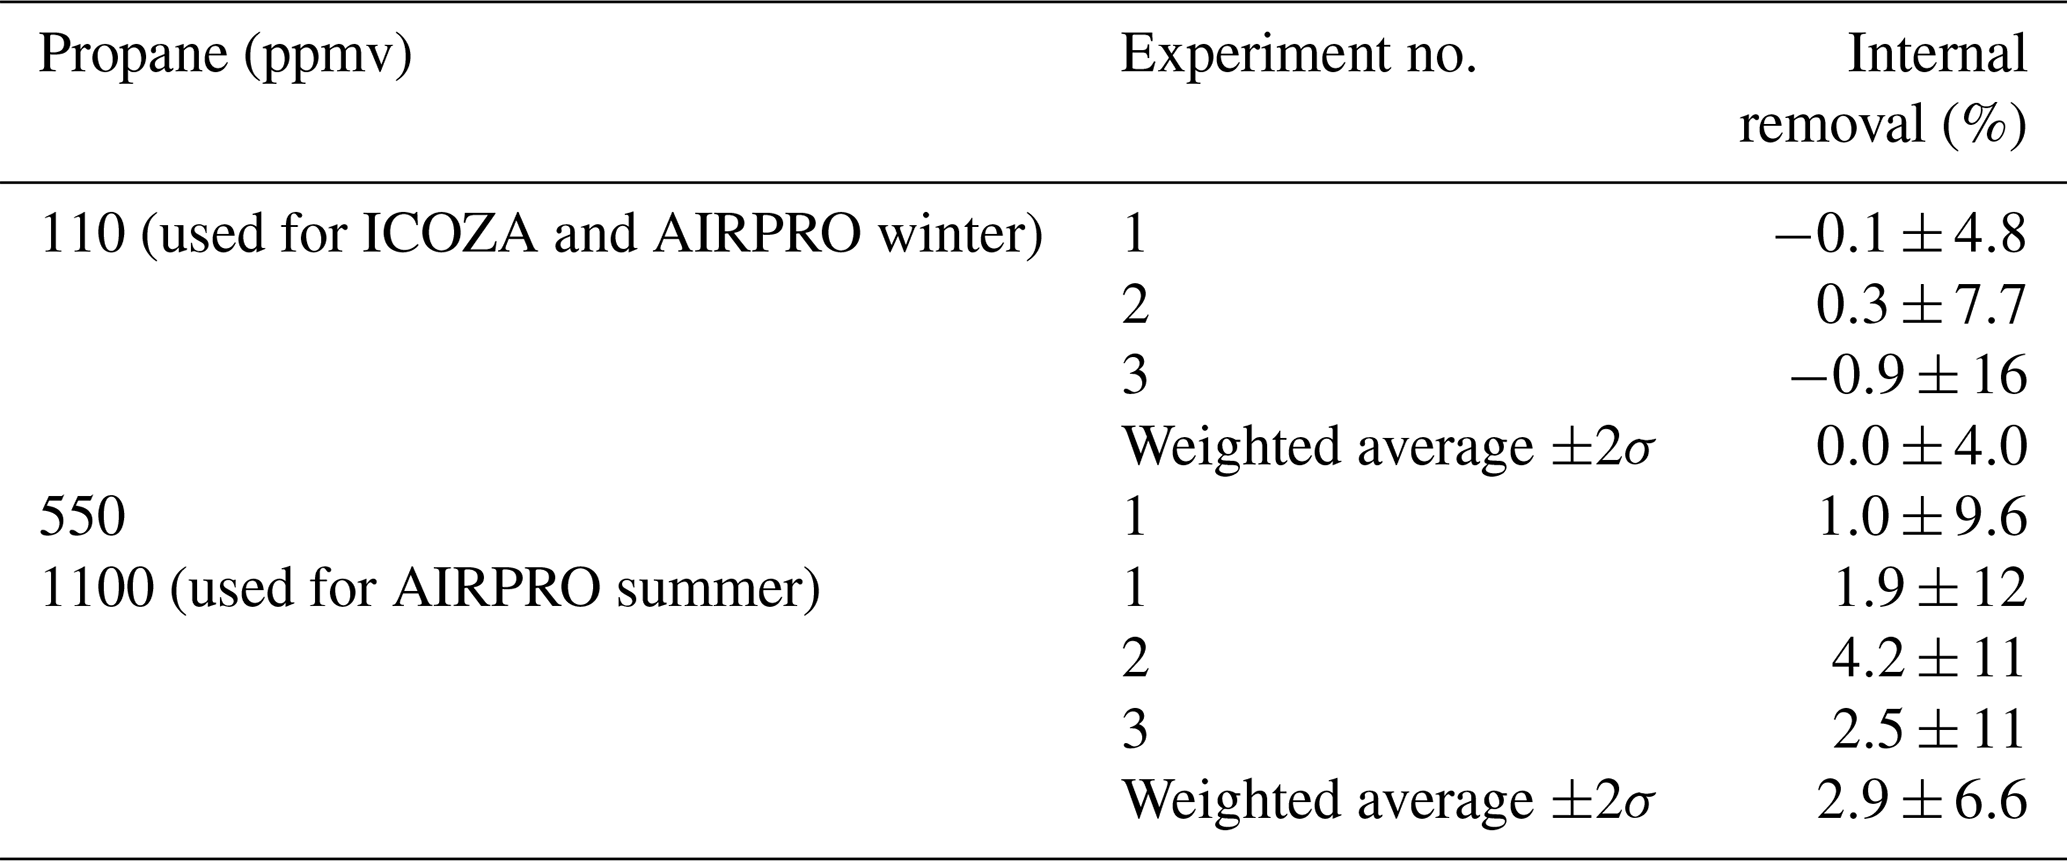
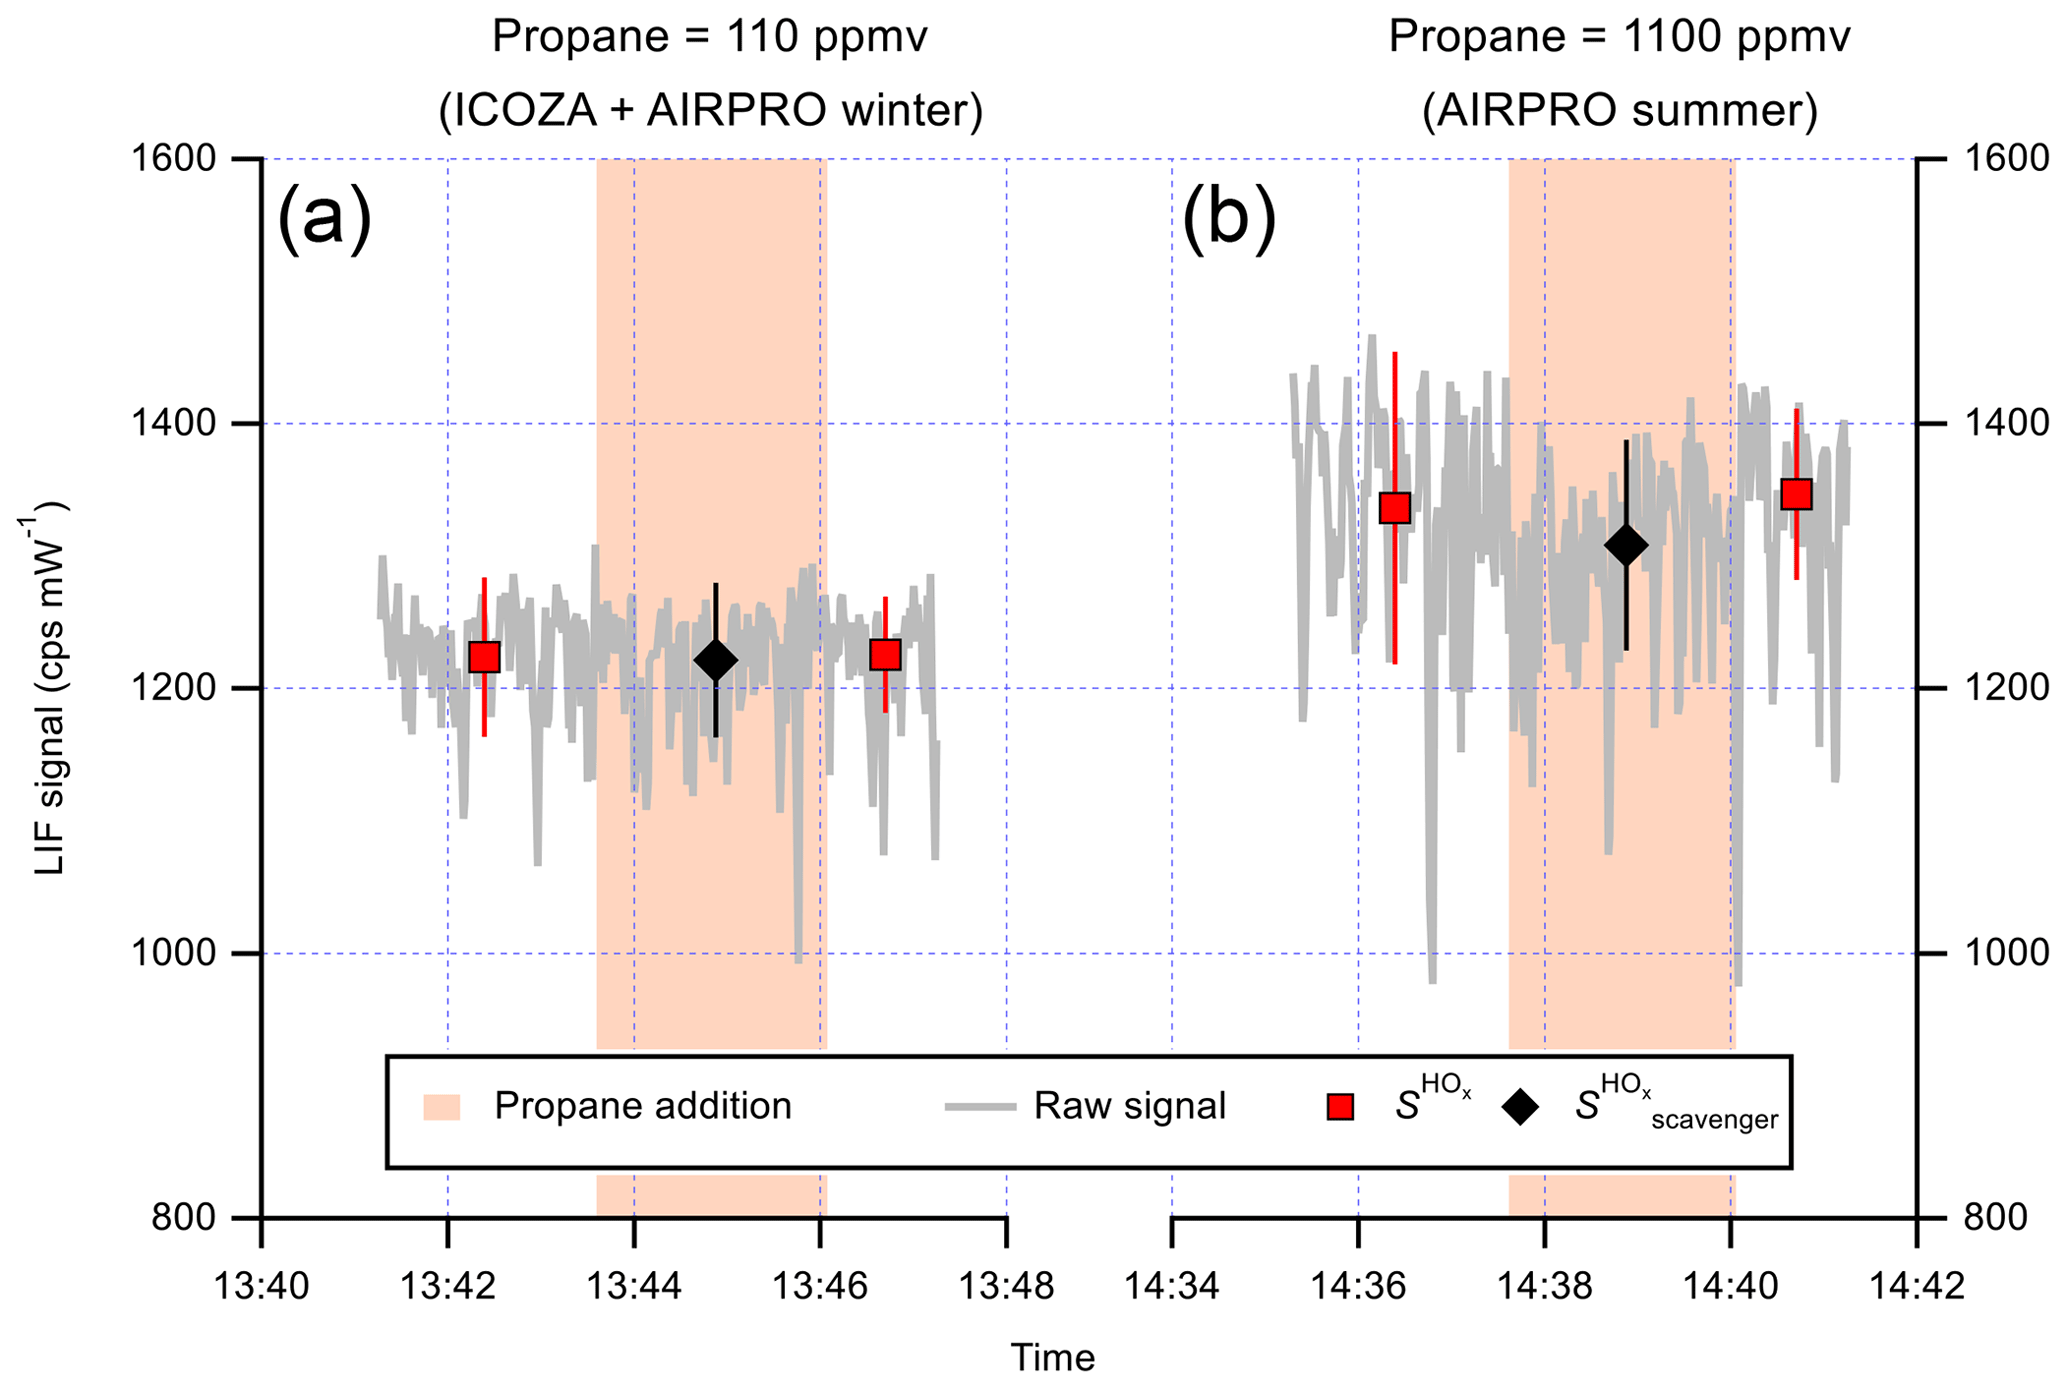
Figure 6Time series of the LIF signal during internal OH removal experiments. The raw 1 s data are given by the grey line. NO was continuously added to the FAGE cell during these experiments (to form OH internally), and points where propane was added to the IPI flow tube are indicated by the orange-shaded panels, with the corresponding signal averages (±1σ) shown as markers (see text for details). The first experiment (a) corresponds to the propane mixing ratio used for ICOZA, while the second (b) corresponds to that used for AIRPRO. The results of the internal OH removal experiments are summarised in Table 2.
In the internal removal experiment, OH is not formed instantly at the pinhole but is built up linearly by HO2∕NO conversion along the line from the pinhole to the laser axis. Therefore, the experimental internal removal may not be directly compared with the theoretical estimate. In such a sequential reaction system, the OH scavenging is about half as efficient as that for the case where OH is formed as an instant point source at the pinhole. Thus, the experimental value should be doubled to (5.8±13) %, which is in reasonable agreement with the theoretical value. From this, we cannot rule out a small internal OH removal on the order of 10 % at the higher propane level used for the AIRPRO summer campaign. However, no such corrections were applied to the ambient data featured in this work.
3.2 Interference testing experiments
3.2.1 O3+H2O vapour
In LIF–FAGE instruments, there is a known interference due to laser-generated OH from ozone photolysis in the presence of water vapour (Fuchs et al., 2016; Griffith et al., 2016; Tan et al., 2017). This interference was quantified by Whalley et al. (2018) and characterised in further detail in the present work. In these experiments, ozone was generated from the 184.9 nm photolysis of oxygen in a 12–20 slm flow of zero air using a Hg(Ar) pen-ray lamp (LOT LSP035). Another 12–20 slm of zero air was humidified using a water (HPLC-grade) bubbler. The two zero air flows were combined and delivered to the calibration wand, from which the IPI sampled in a manner analogous to the experiments conducted to investigate external and internal OH removal discussed above. Ozone mixing ratios in the range 0–2.5 ppmv were generated by varying the Hg lamp current (0–21 mA), while water vapour volume mixing ratios in the range 0.1 %–1.0 % were produced by varying the flow through the bubbler, or by bypassing it completely, and the total flow (32 slm) was compensated for by changing the dry zero air flow. Laser power (LP) at 308 nm was varied in the range 3–17 mW by varying the ratio of acetone : water in a cuvette placed before the fibre launcher that is used to send laser light to the detection cells.
Figure 7 shows the results of O3+H2O vapour interference tests. It can be seen that the interference signal (OHint = OHwave − OHchem) is linear in both ozone (Fig. 7a) and water vapour (Fig. 7b) mixing ratios. The quadratic dependence of the interference signal on laser power (Fig. 7c) in terms of raw count rates indicates that the interference originates from a two-photon process, as expected. However, since OH data are normalised to laser power, the equivalent OH concentrations are linear with respect to laser power. Thus, overall, OHint is linear in ozone, water vapour, and laser power. Normalisation of the slope in Fig. 7a yields the following relation:
where [O3], [H2O], and LP are in units of ppbv, %, and mW, respectively. Under typical atmospheric conditions of [O3] =50 ppbv and [H2O] =1 %, and a typical instrument laser power of 15 mW, the interference signal is equivalent to an OH concentration of 3.9×10⁵ molec. cm−3. This signal is slightly smaller than the instrumental limit of detection (LOD) of molec. cm−3 at a signal-to-noise ratio (SNR) of 2, but nonetheless it was used to correct the ambient OHwave data presented in Sect. 3.3, using co-located measurements of ozone and water vapour.
Table 3Summary of interference tests with O3 and isoprene (ISO) in the presence of propane (PROP), based on the data in Fig. 8. n/a – not applicable.

a Corrected using Eq. (7). b Oxidant and Particle photochemical processes field campaign in Borneo, 2008: average O3=10 ppbv; ISO =3.5 ppbv. c Diurnally averaged maximum O3=90 ppbv; overall maximum ISO =7.9 ppbv.
3.2.2 Isoprene ozonolysis
To test for interferences from isoprene (ISO) ozonolysis products, isoprene (∼16 ppmv), and ozone (∼1.8 ppmv) were mixed in the calibration wand and the scavenger (propane, PROP) was injected into the IPI flow tube. The propane concentrations were set to those used for ambient OHchem measurements, such that the tests were representative of normal atmospheric sampling (i.e. to test whether an interference signal would remain in ambient data). However, to generate sufficient OH signal for quantitative analysis, ozone and isoprene were introduced at concentrations that far exceeded their typical ambient levels (Table 3). Unlike previous tests of interferences from alkene ozonolysis (Novelli et al., 2014b), low [O3] : [ISO] ratios were used to suppress the signal contribution from the atmospheric (real) OH generated by ozonolysis (i.e. isoprene acted as an additional OH scavenger). To allow sufficient time for steady-state conditions to develop, the IPI did not sample from the calibration wand directly, but instead a 30 cm flow tube (polycarbonate, ID ∼19 mm) was used to extend the IPI (which sampled wand gas at the normal IPI flow rate of ∼32 slm, residence time for O3+ isoprene reaction ∼0.15 s).
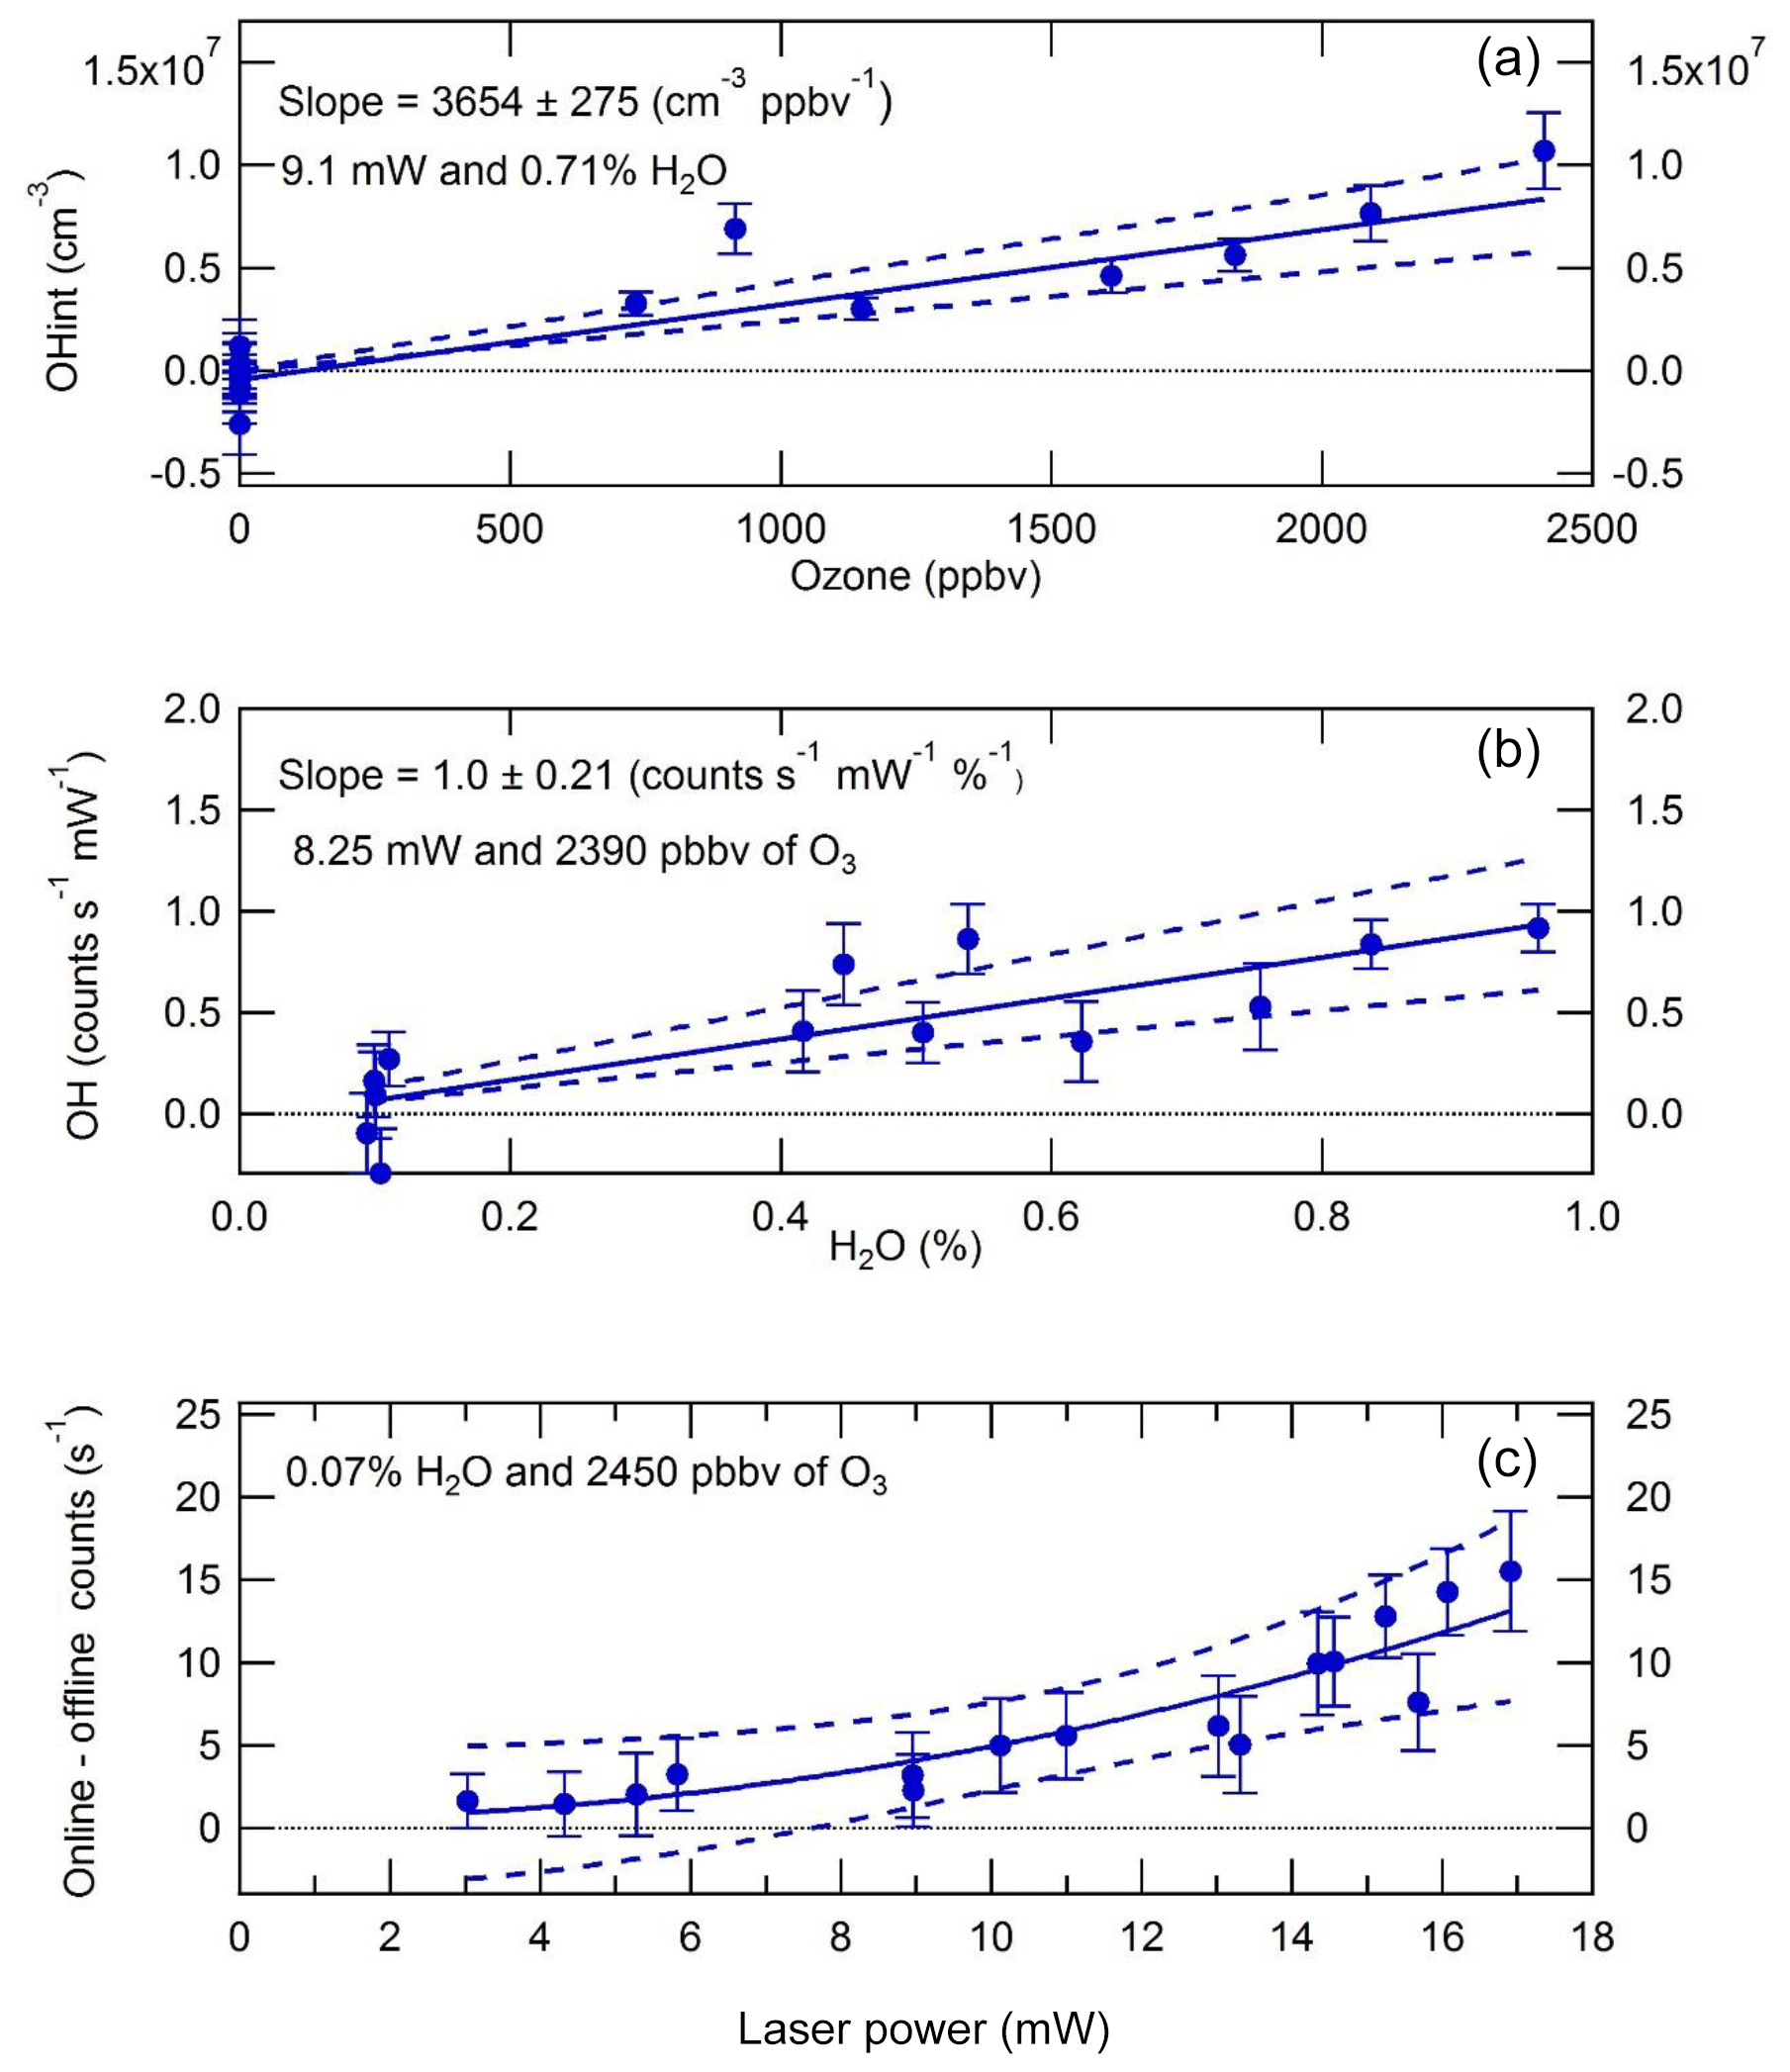
Figure 7OH interference (±1σ) from O3+H2O as a function of (a) O3, (b) H2O, and (c) laser power. The interference signal is linear in O3 and H2O mixing ratios and quadratic in laser power, confirming the two-photon nature of the process. Normalising the slope in panel (a) to O3=1 ppbv, H2O =1 %, and laser power =1 mW yields an OH interference equivalent to a concentration of 565±42 molec. cm−3.
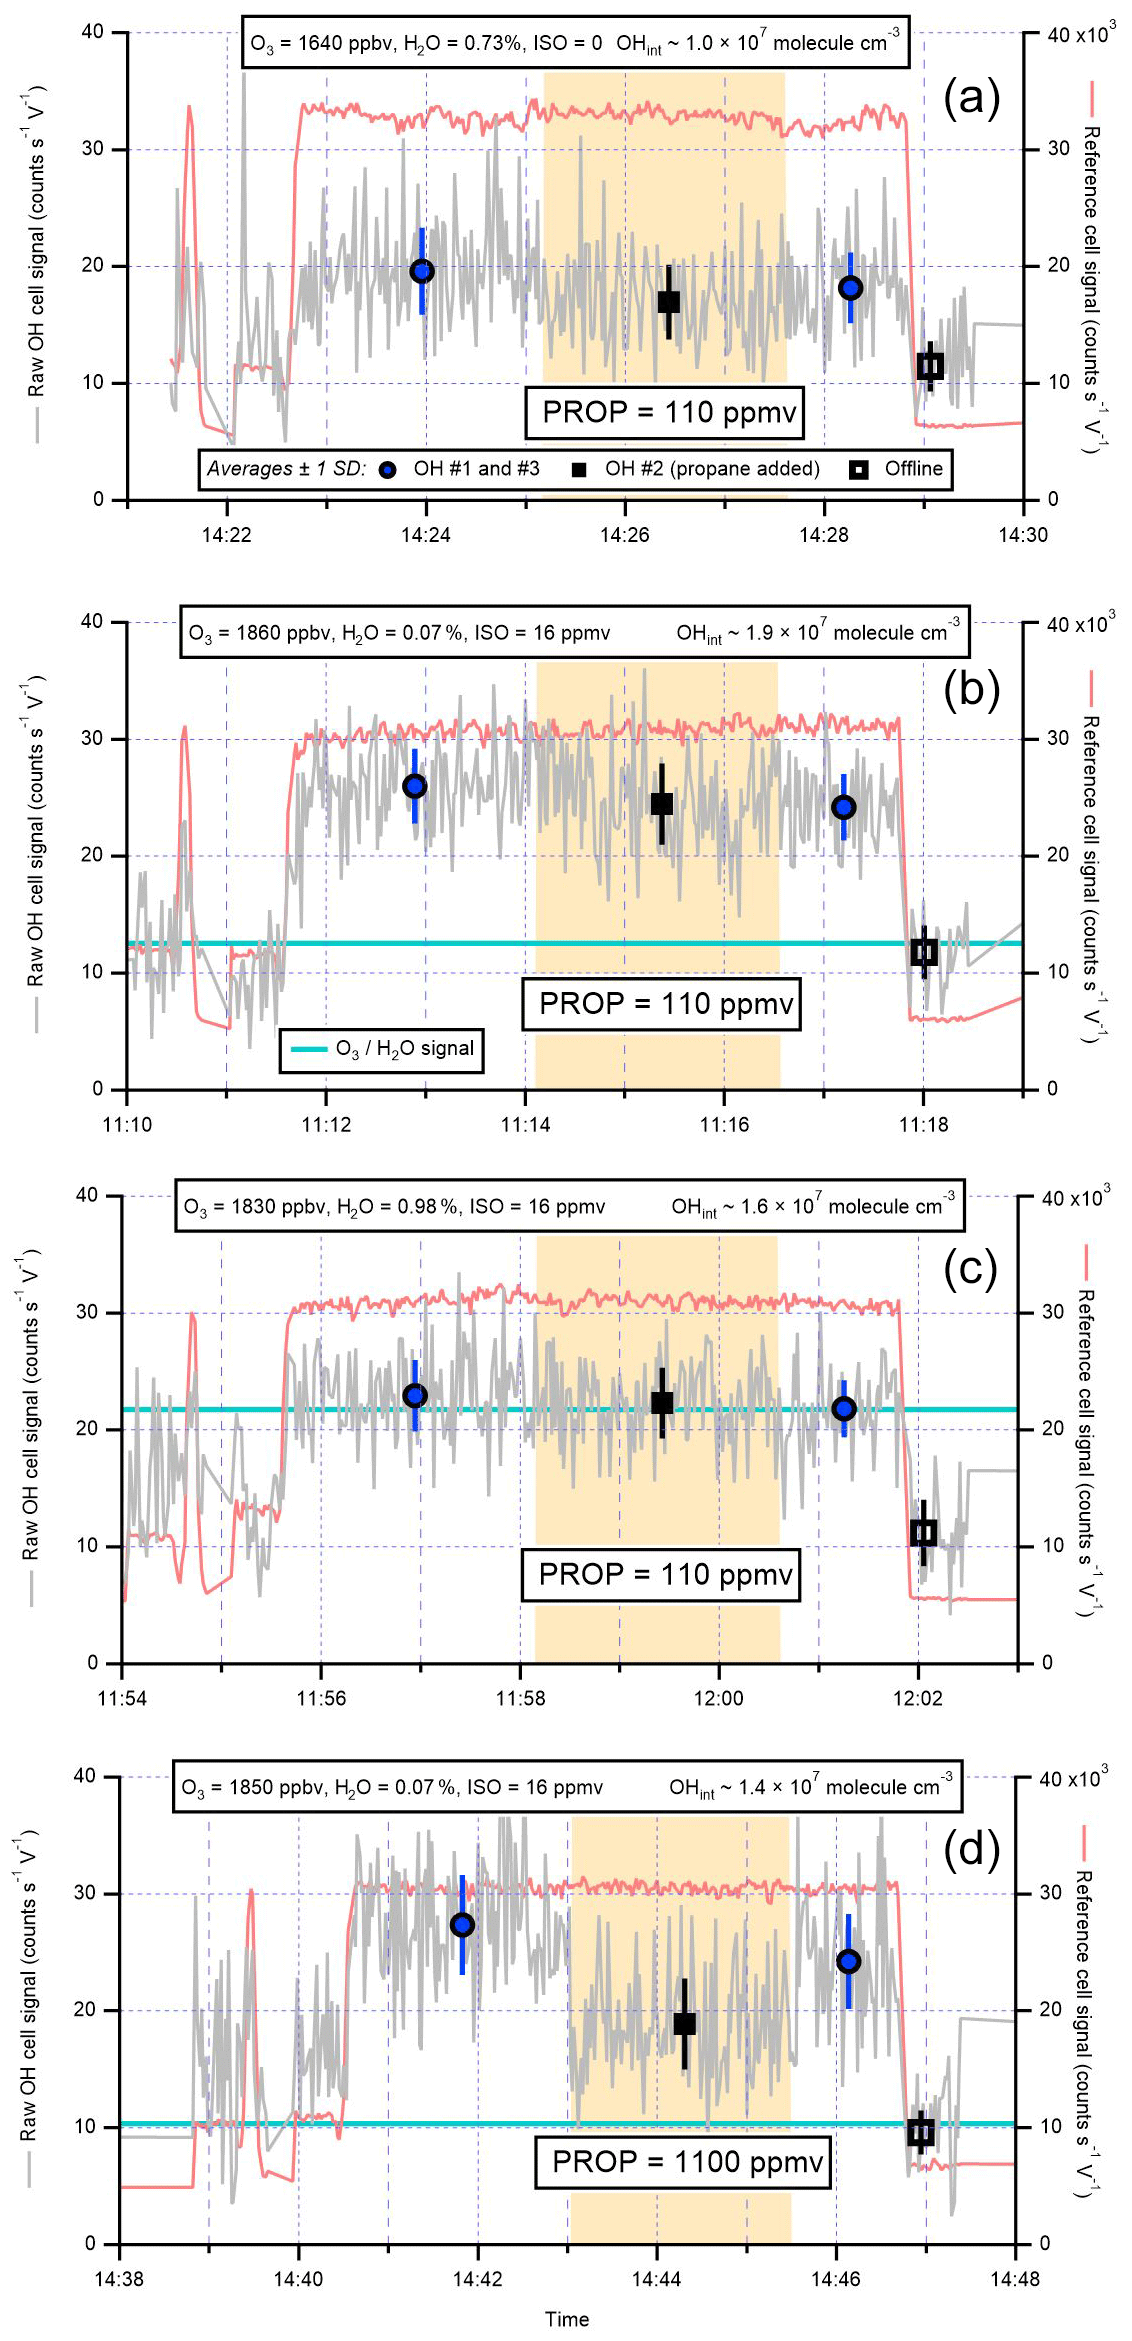
Figure 8Isoprene (ISO) ozonolysis interference tests: (a) O3∕H2O only, (b) O3 and ISO under dry conditions, (c) O3 and isoprene with H2O added, and (d) O3 and isoprene under dry conditions but with a higher concentration of propane (PROP) to remove any steady-state-generated OH. Shaded areas are periods of propane addition, and the light blue lines correspond to the calculated signals from O3+H2O only (for experiments with isoprene present). The interference signals (“OH no. 2” – “offline”) were used to derive equivalent OH concentrations (OHint), which are on the order of ∼1–2×10⁷ molec. cm−3. These experiments are summarised in Table 3. See text for further details.
Time series of the interference testing experiments conducted using the IPI are shown in Fig. 8. In Fig. 8a, no isoprene is added, but due to ozone photolysis in the presence of high [H2O] (0.73 %) an interference signal (OHint) is observed (i.e. signal in the presence of propane is higher than the offline signal). The magnitude of this signal (OHint molec. cm−3) yields a scale factor of 510±270 molec. cm−3 ppbv−1 %−1 mW−1 when linearly extrapolated down from the measured [O3], [H2O], and LP, in agreement with the 565±42 molec. cm−3 ppbv−1 %−1 mW−1 in Eq. (7).
In Fig. 8b, ozone and isoprene react under dry conditions, and an interference signal is observed again. The low H2O (0.07 %) suppressed the O3+H2O interference, such that this cannot explain the magnitude of OHint ( molec. cm−3, Table 3), suggesting that OH was formed internally from a reaction other than O1D + H2O. Under high-humidity (H2O ∼1 %) conditions (Fig. 8c), OHint ( molec. cm−3) was similar, but in this case the signal can be explained almost entirely by the O3+H2O interference. Under dry conditions with a 10-fold higher concentration of propane (as used for the AIRPRO summer campaign, Fig. 8c), the interference signal from Fig. 8b was reduced but remained elevated relative to the offline signal (OHint molec. cm−3), where again the contribution from O3+H2O cannot explain the discrepancy. The decrease in OHint between Fig. 8b and d may be attributed to the suppression of steady-state OH generated from ozonolysis, but the remaining signal implies that OH was also formed internally in both cases. For the dry, low-propane experiment (Fig. 8b), the magnitude of the OH signal is much higher than that calculated from a steady-state model ( molec. cm−3).
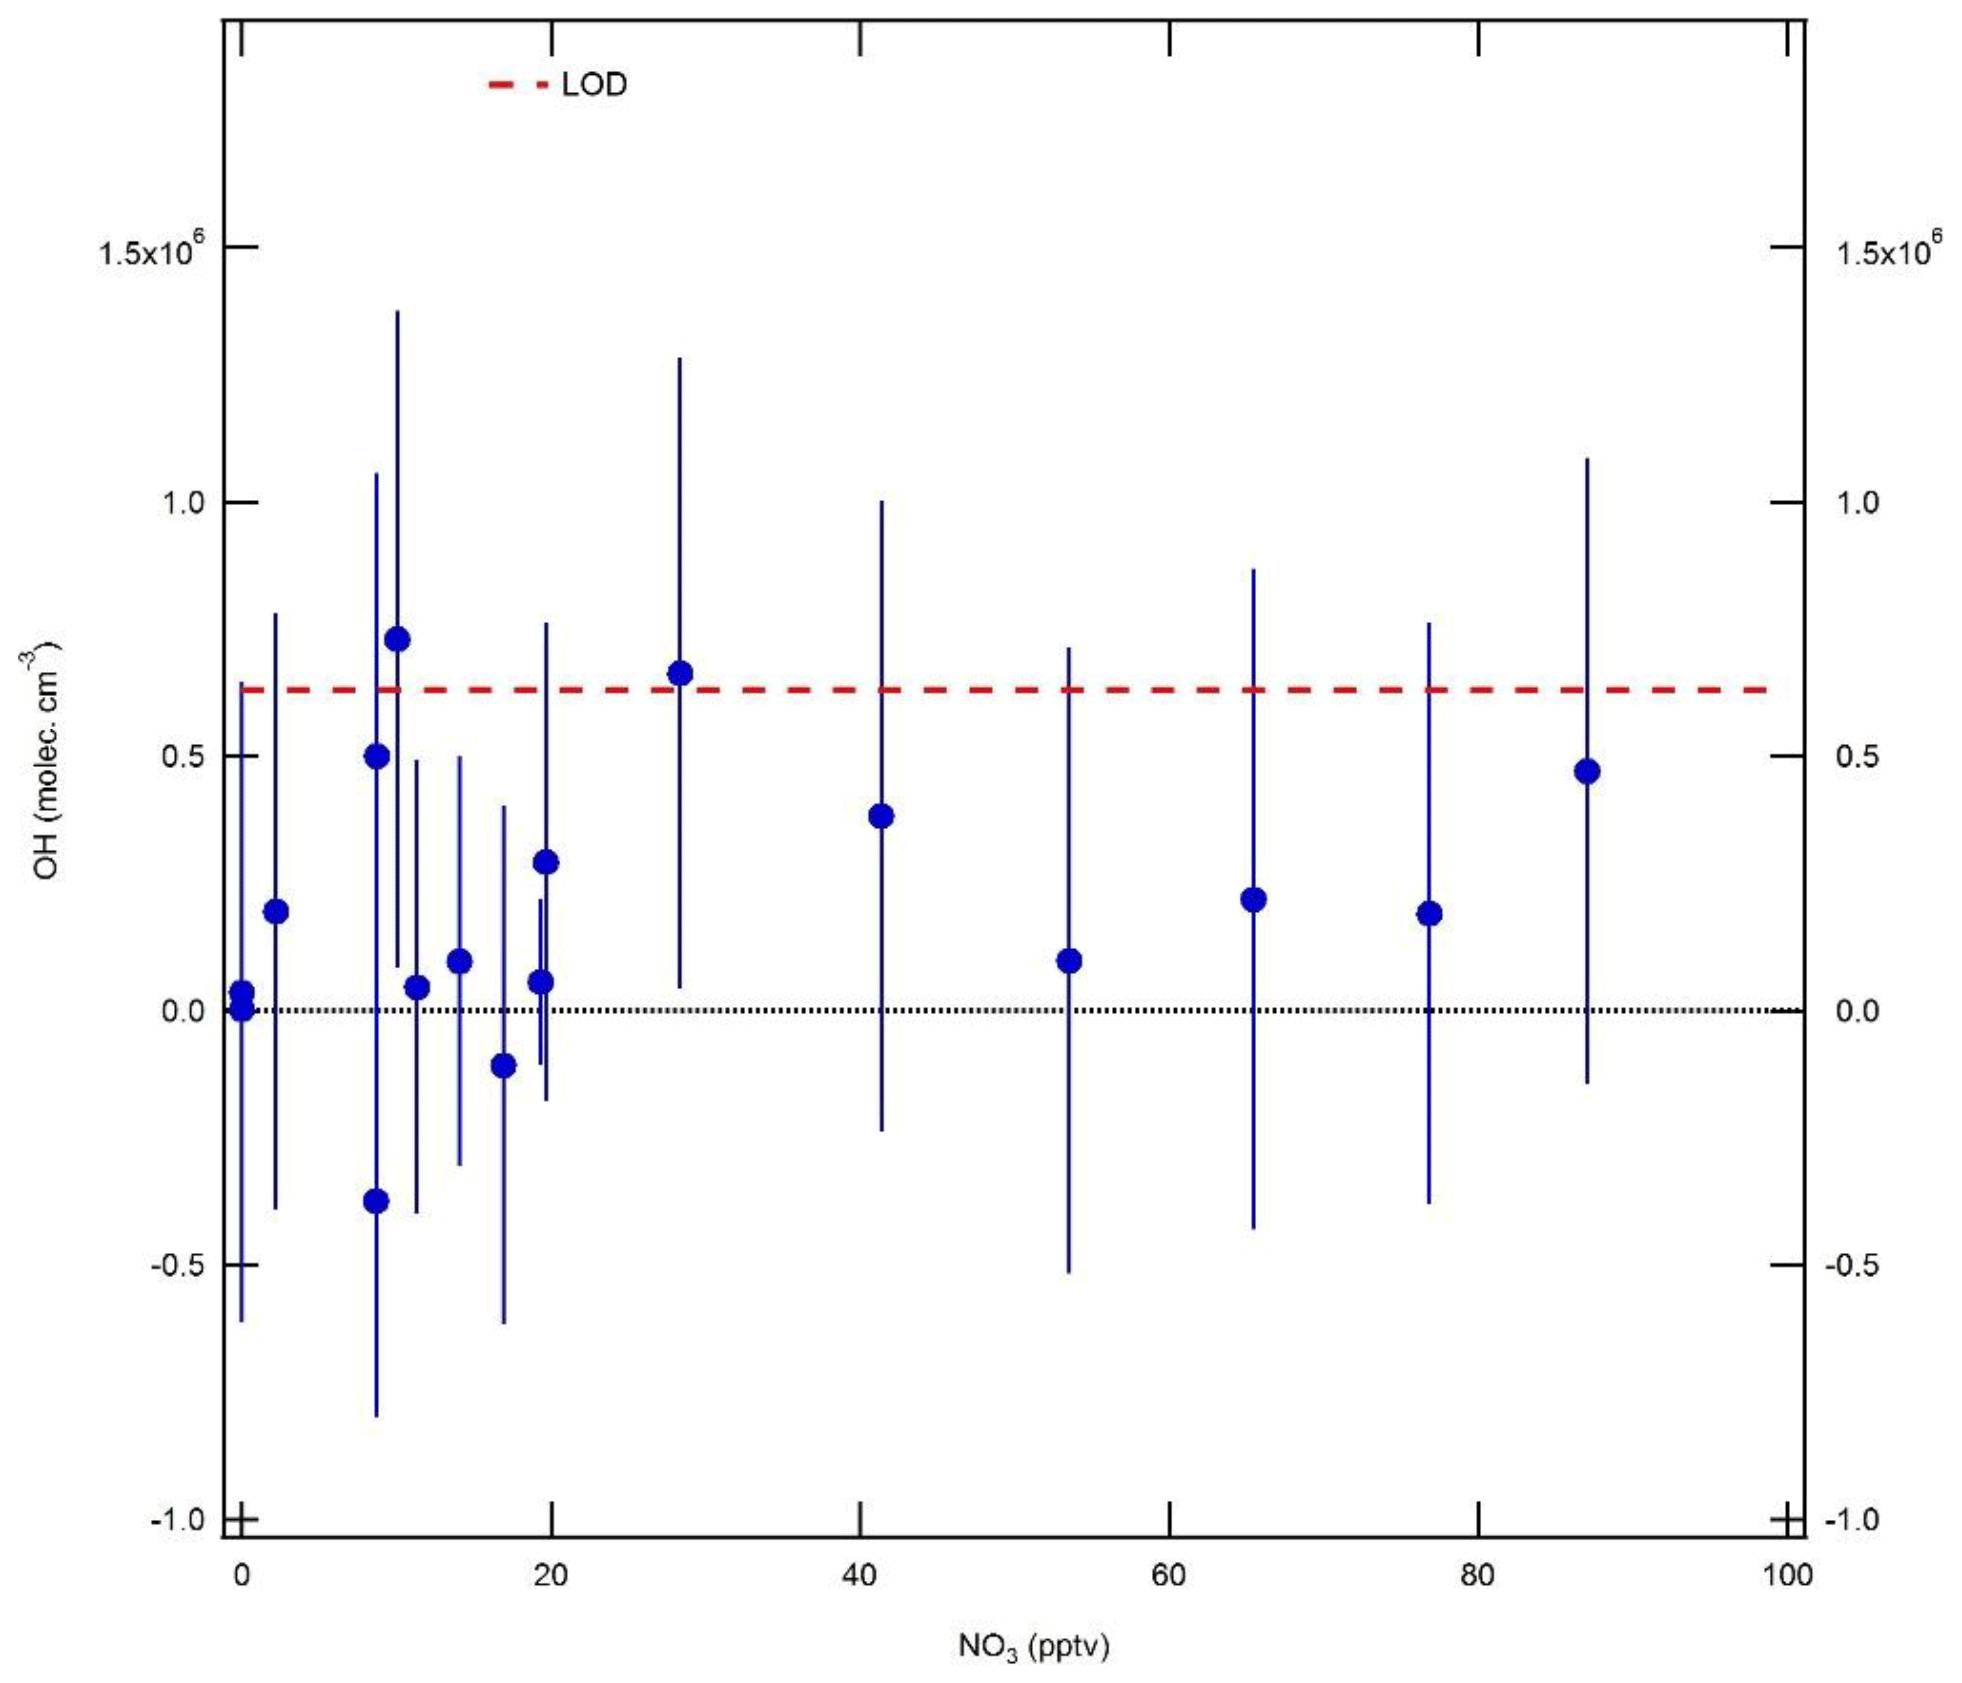
Figure 9Equivalent OH concentrations (±1σ) measured during NO3 radical interference tests. NO3 concentrations were calculated using a box model, and OH interference signals were corrected for the interference from O3+H2O. The OH limit of detection (LOD, 6.3×10⁵ molec. cm−3, SNR =2) is denoted by the dashed red line.
The suppression of the interference signal attributable to O3/isoprene only (i.e. O3+H2O corrected) by the addition of water vapour (H2O ∼1 %; see Fig. 8c) suggests that the internal OH may have been formed from SCIs. The simplest C1 and C2 SCIs are known to react quickly with the water vapour dimer (k∼4– cm3 molec.−1 s−1 at 298 K for CH2OO; Chao et al., 2015; Lewis et al., 2015) and monomer (k∼1– cm3 molec.−1 s−1 for anti-CH3CHOO; Taatjes et al., 2013; Sheps et al., 2014; Lin et al., 2016), respectively. Reaction with the water vapour monomer was also shown to be relatively fast ( cm3 molec.−1 s−1, kloss∼300 s−1 at ∼1 % H2O) for the ensemble of SCIs, including the C1 SCI, generated from isoprene ozonolysis (Newland et al., 2015).
However, regardless of whether the signal observed at high propane is due to internally formed OH, which may have originated from SCIs, the equivalent OH concentrations are negligible when extrapolated back to ambient chemical conditions (Table 3). Assuming a linear dependence of the interference signal on both ozone and isoprene, the interference (after O3+H2O correction) is equivalent to < 102 molec. cm−3 at the ozone (10 ppbv) and isoprene (3.5 ppbv) levels measured in a low-NOx, biogenic environment during the Oxidants and Particle photochemical processes (OP3) campaign in Borneo, 2008 (Hewitt et al., 2010). Similarly, we have modelled the SCI decomposition in our FAGE cell. We assumed an ambient atmosphere containing 100 ppbv O3 and 10 ppbv trans-2-butene and took the reactions, rate coefficients, and yields from Novelli et al. (2014a) and MCMv3.3.1. The rate of CI to SCI was 1×10⁶ s−1 with an SCI yield of 0.18. The unimolecular decomposition of SCI to OH was 3 s−1 and the wall loss rate of SCI was 22 s−1. From this we calculate an equivalent ambient pressure OH concentration of molec. cm−3 from the decomposition of SCIs at our FAGE cell residence time of 2 ms. The insignificance of the interference signal for atmospherically relevant O3/alkene concentrations is consistent with the results of previous interference experiments, for which equivalent OH concentrations of ∼3–4×10⁴ (Novelli et al., 2014b; Fuchs et al., 2016) and molec. cm−3 (Rickly and Stevens, 2018) can be derived.
3.2.3 NO3 radicals
Fuchs et al. (2016) found that, despite the absence of a hydrogen atom, NO3 radicals were responsible for a small OH interference signal in the Forschungszentrum Jülich (FZJ) LIF–FAGE instrument, equivalent to an OH concentration of 1.1×10⁵ molec. cm−3 per 10 pptv NO3. The OH interference scaled linearly with observed NO3 mixing ratios but showed no dependence on inlet length, cell pressure, laser power, or humidity, and the background signal did not change significantly in the presence of CO scavenger, suggesting the OH was indeed being formed internally. It was postulated that the interference was a result of a heterogeneous process involving NO3 and H2O adsorbed on instrument walls. Interference signals were also observed in the detection of HO2 and RO2 radicals, equivalent to 1.0×10⁷ and 1.7×10⁷ molec. cm−3, respectively, per 10 pptv NO3.
To test for an NO3 interference in OH measurements made by the Leeds FAGE instrument, NO3 was generated from the reaction of ozone and NO2:
In these experiments, ozone was generated by flowing zero air (15 slm) past a Hg lamp (LOT LSP035). A constant 0.5 slm flow of NO2 (BOC, 2 ppmv) was diluted in 25 slm zero air and mixed with the zero air–ozone flow and an additional zero air dilution flow of 10 slm, in order to yield a final mixing ratio of 20 ppbv. Gas was delivered to the IPI system using the calibration wand, with a total residence time of 3.7 s for the O3+NO2 reaction. Ozone mixing ratios in the range 0–2.8 ppmv (after dilution) were generated by varying the current supplied to the Hg lamp. NO3 radical mixing ratios in the range 0–90 pptv were calculated based on a box model with rate constants taken from the Master Chemical Mechanism (MCM; http://mcm.leeds.ac.uk/MCM, last access: 15 December 2017) version 3.3.1 ( cm3 molec.−1 s−1, cm3 molec.−1 s−1, and kR3=0.045 s−1). These experiments were performed under dry conditions (H2O ∼0.07 %), such that only a small correction was applied for the O3∕H2O interference.
The results of the NO3 radical interference tests are shown in Fig. 9. It can be seen that the equivalent OH signals were all < 8×10⁵ molec. cm−3 and almost always below the instrument LOD of 6.3×10⁵ molec. cm−3 (SNR =2). Unlike the dependence found by Fuchs et al. (2016), the interference signal does not increase linearly with NO3. However, based on the point at the highest NO3 mixing ratio of ∼90 pptv, the interference is equivalent to an insignificant molec. cm−3 at 10 pptv NO3, or approximately half of that observed by Fuchs et al. (2016). These experiments suggest that an interference from NO3 radicals is not significant for the detection of OH using the Leeds ground-based FAGE instrument.
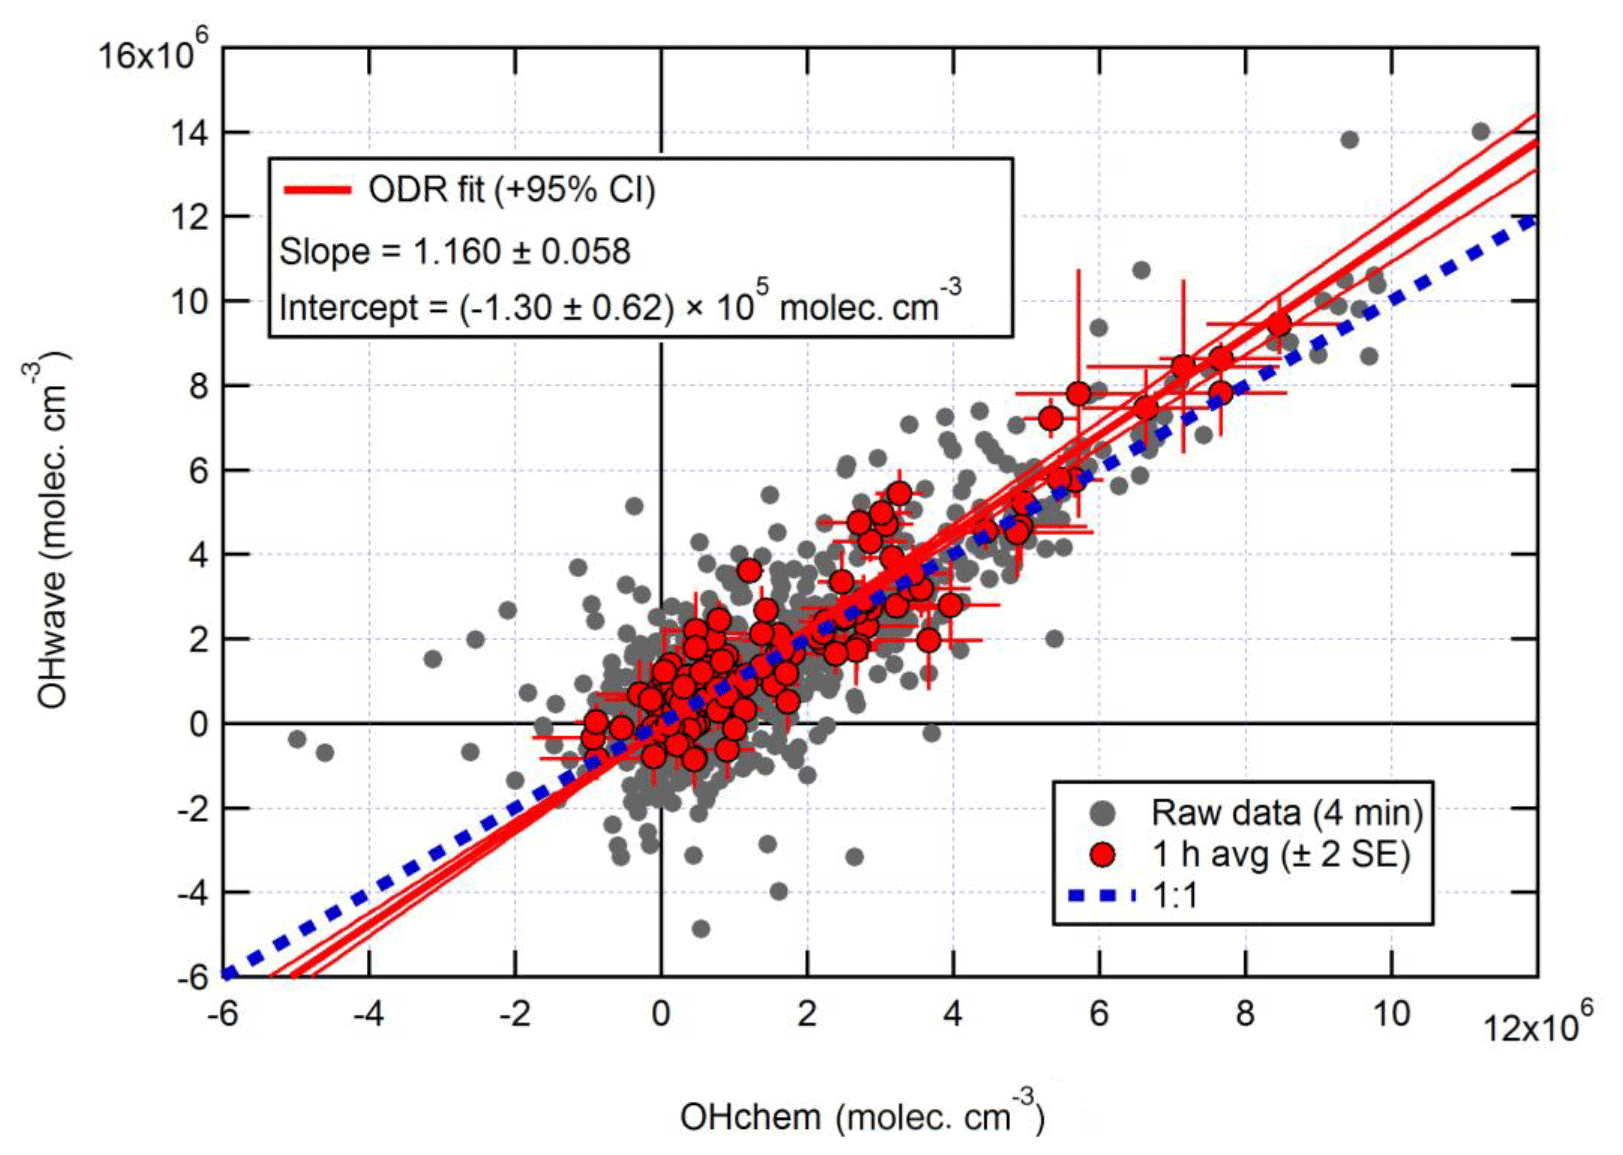
Figure 10Overall intercomparison of OHwave and OHchem observations from the ICOZA campaign. Grey markers represent raw data (4 min), with 1 h averages (±2 standard error, SE) in red. The thick red line is the orthogonal distance regression (ODR) fit to the hourly data, with its 95 % confidence interval (CI) bands given by the thin red lines; fit errors are given at the 2σ level. For comparison, 1:1 agreement is denoted by the dashed blue line. OHwave data were corrected for the known interference from O3+H2O.
3.3 Ambient observations of OHwave and OHchem
3.3.1 ICOZA 2015
Figure 10 shows the overall intercomparison of OHwave (with O3+H2O interference as given in Eq. 7 subtracted) and OHchem measurements made during the ICOZA 2015 campaign. It is evident that the raw data (averaged for 4 min periods) are quite noisy, but averaging to 1 h improves the precision and reveals a tight correlation, with the majority of points scattered around the line of 1:1 agreement. An orthogonal distance regression (ODR) fit (Boggs et al., 1987), which accounts for errors in both the y and x directions, to the hourly data yields a slope of 1.160±0.058 (2σ) and a negative intercept on the order of the instrumental precision. In a similar manner, an unweighted least-squares linear fit (not shown) gives a slope of 1.060±0.065, an intercept of (0.5±1.5) ×105 molec. cm−3, and a correlation coefficient (R2) of 0.992. Regardless of the fit method, these results show that, on average, the two OH measurements agree within the instrumental uncertainty of ∼26 % at 2σ.
Median hourly diurnal profiles of OHwave, OHchem, and J(O1D), averaged over both IPI sampling periods, are shown in Fig. 11. The two OH measurements exhibit virtually identical profiles, with peak values of molec. cm−3 slightly before solar noon, and relatively high concentrations (∼1–2×10⁶ molec. cm−3) persisting into the early evening despite the concomitant falloff in J(O1D). Night-time levels were generally below 5×10⁵ molec. cm−3. The variability in OH concentrations, shown only for OHchem for clarity, was high during both daytime and night-time periods.
In Fig. 10 it can be seen that some points lie substantially above the 1:1 line, especially for the 4 min averaged raw data. It is possible that, despite the good overall agreement between the median diurnal profiles of OHwave and OHchem in Fig. 11, OHint may have exhibited its own distinct diurnal profile, independent of atmospheric OH concentrations, for example if the interference signal was generated from a particular chemical species. However, the median diurnal profile of individual OHint measurements (= OHwave – OHchem) in Fig. 11 exhibits no obvious structure, with values scattered around zero and a mean ±2σ value of (0.3±3.3) ×105 molec. cm−3, which is well below the LOD for individual OH measurements. Similarly, the average (OHwave − OHchem) ∕ OHwave ratio (i.e. the contribution of interferences to the total OHwave signal) was zero within error (mean ±2 standard error, SE, ).
Furthermore, OHint does not exhibit any dependence when binned against various parameters (Fig. S1 in the Supplement), including those previously implicated in LIF–FAGE measurement interferences, such as J(O1D) (Feiner et al., 2016); temperature (Mao et al., 2012; Novelli et al., 2017); OH reactivity (Mao et al., 2012); and O3 (Feiner et al., 2016; Novelli et al., 2017), isoprene (Feiner et al., 2016), and NO (Feiner et al., 2016) mixing ratios.
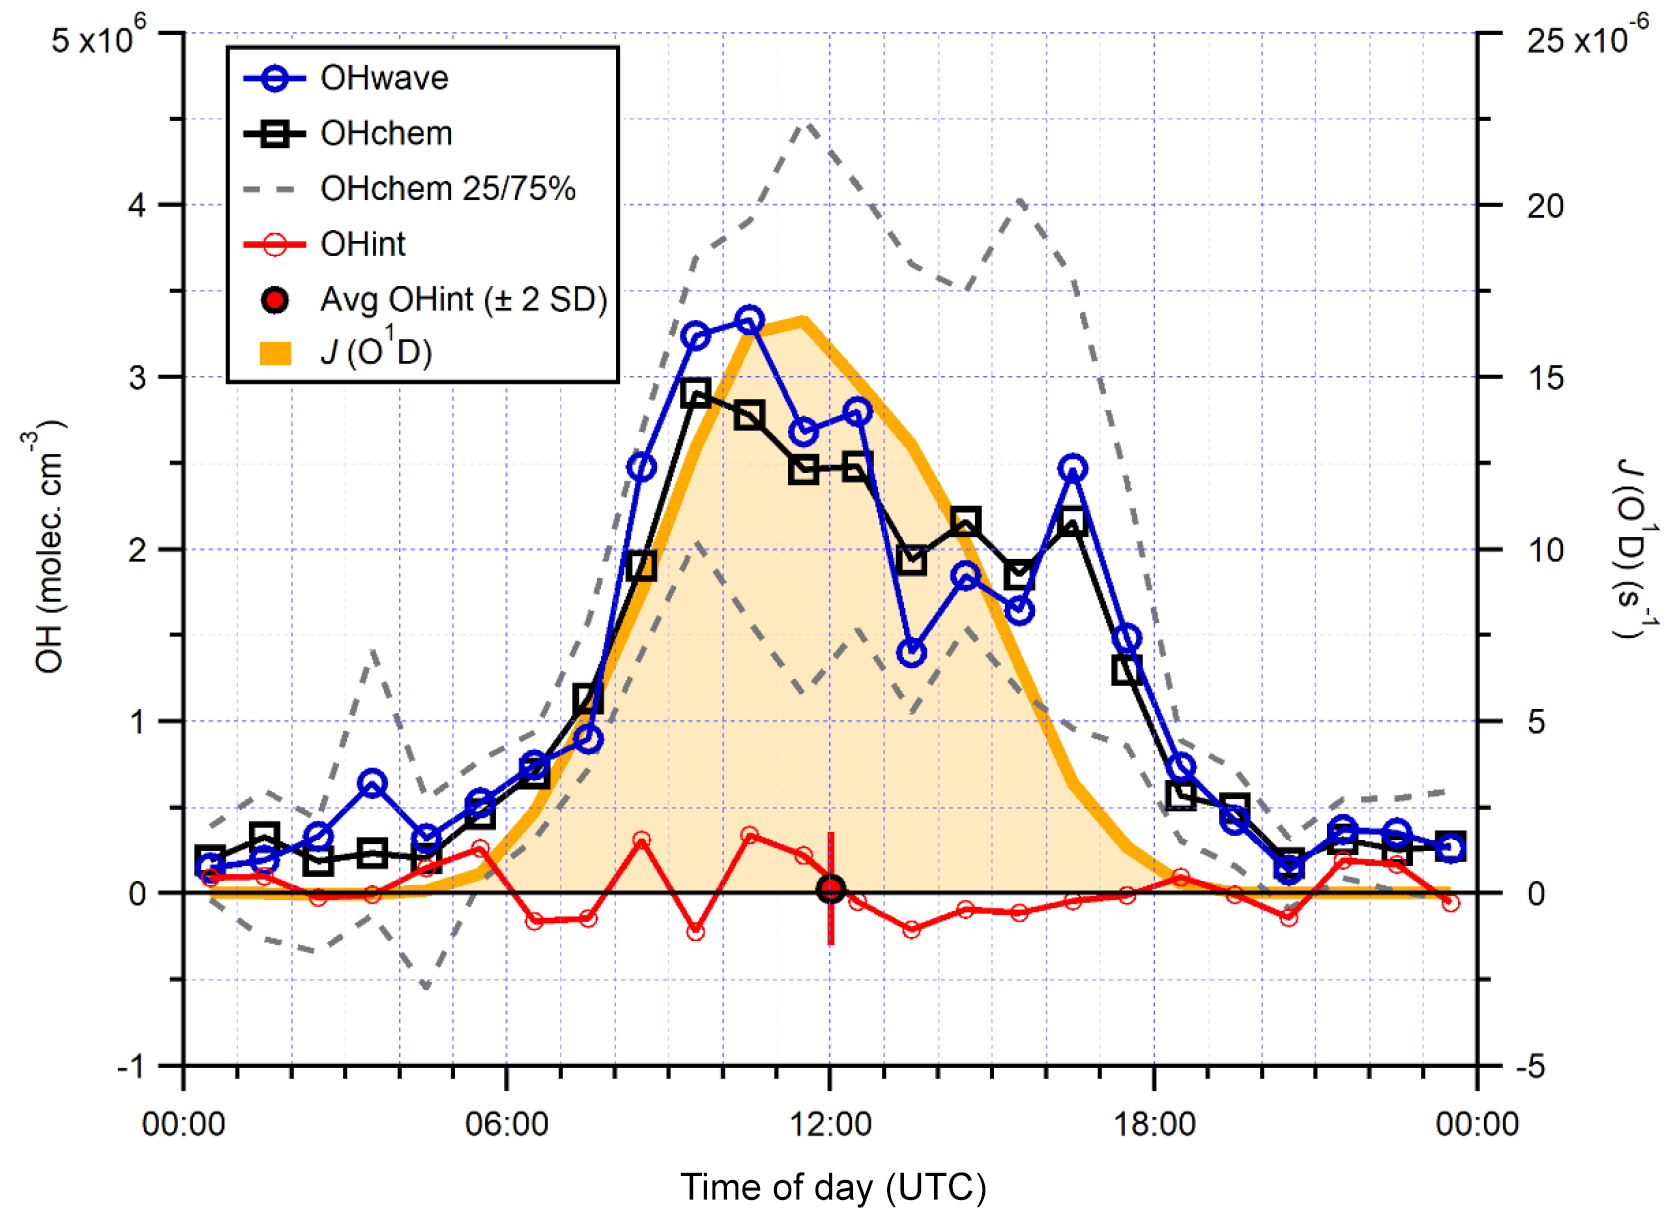
Figure 11Hourly median diurnal profiles of OHwave, OHchem, and J(O1D) (right axis) from the ICOZA campaign. Also shown (red line and markers) is the hourly median diurnal profile of OHint (= OHwave − OHchem), calculated from individual 4 min data points; the single red marker corresponds to the average (±2σ) of this trace. The variability (interquartile range, IQR) in OHchem measurements is denoted by the dashed grey lines and is not shown for others for clarity. OHwave data were corrected for the known interference from O3+H2O.
3.3.2 AIRPRO winter 2016
The overall agreement between the two measurements is presented in the correlation plot in Fig. 12. As with ICOZA (Fig. 10), a tight correlation is revealed after averaging the data to 1 h, and all points are distributed evenly around the line of 1:1 agreement. ODR fitting yields an overall slope of 1.051±0.039 and a negative intercept of a similar magnitude to the instrumental precision. An unweighted least-squares linear fit (not shown) gives a slope of 0.997±0.038, an intercept of (5.1±7.3) ×104 molec. cm−3, and an R2 of 0.97.
The two measurements exhibit the same profile on a diurnal basis (Fig. 13), with a diel maximum of molec. cm−3 occurring in the late morning due to the build-up of HONO overnight. At night, OHchem concentrations were close to the LOD (< molec. cm−3), while OHwave measurements were frequently negative, possibly as a result of over-subtraction of the O3∕H2O interference as this is subject to high uncertainty (Fig. 7). The diurnal profile of OHint is scattered around zero with a mean ±2σ difference of () ×105 molec. cm−3, and the mean ±2 SE contribution of interferences to the total signal was .
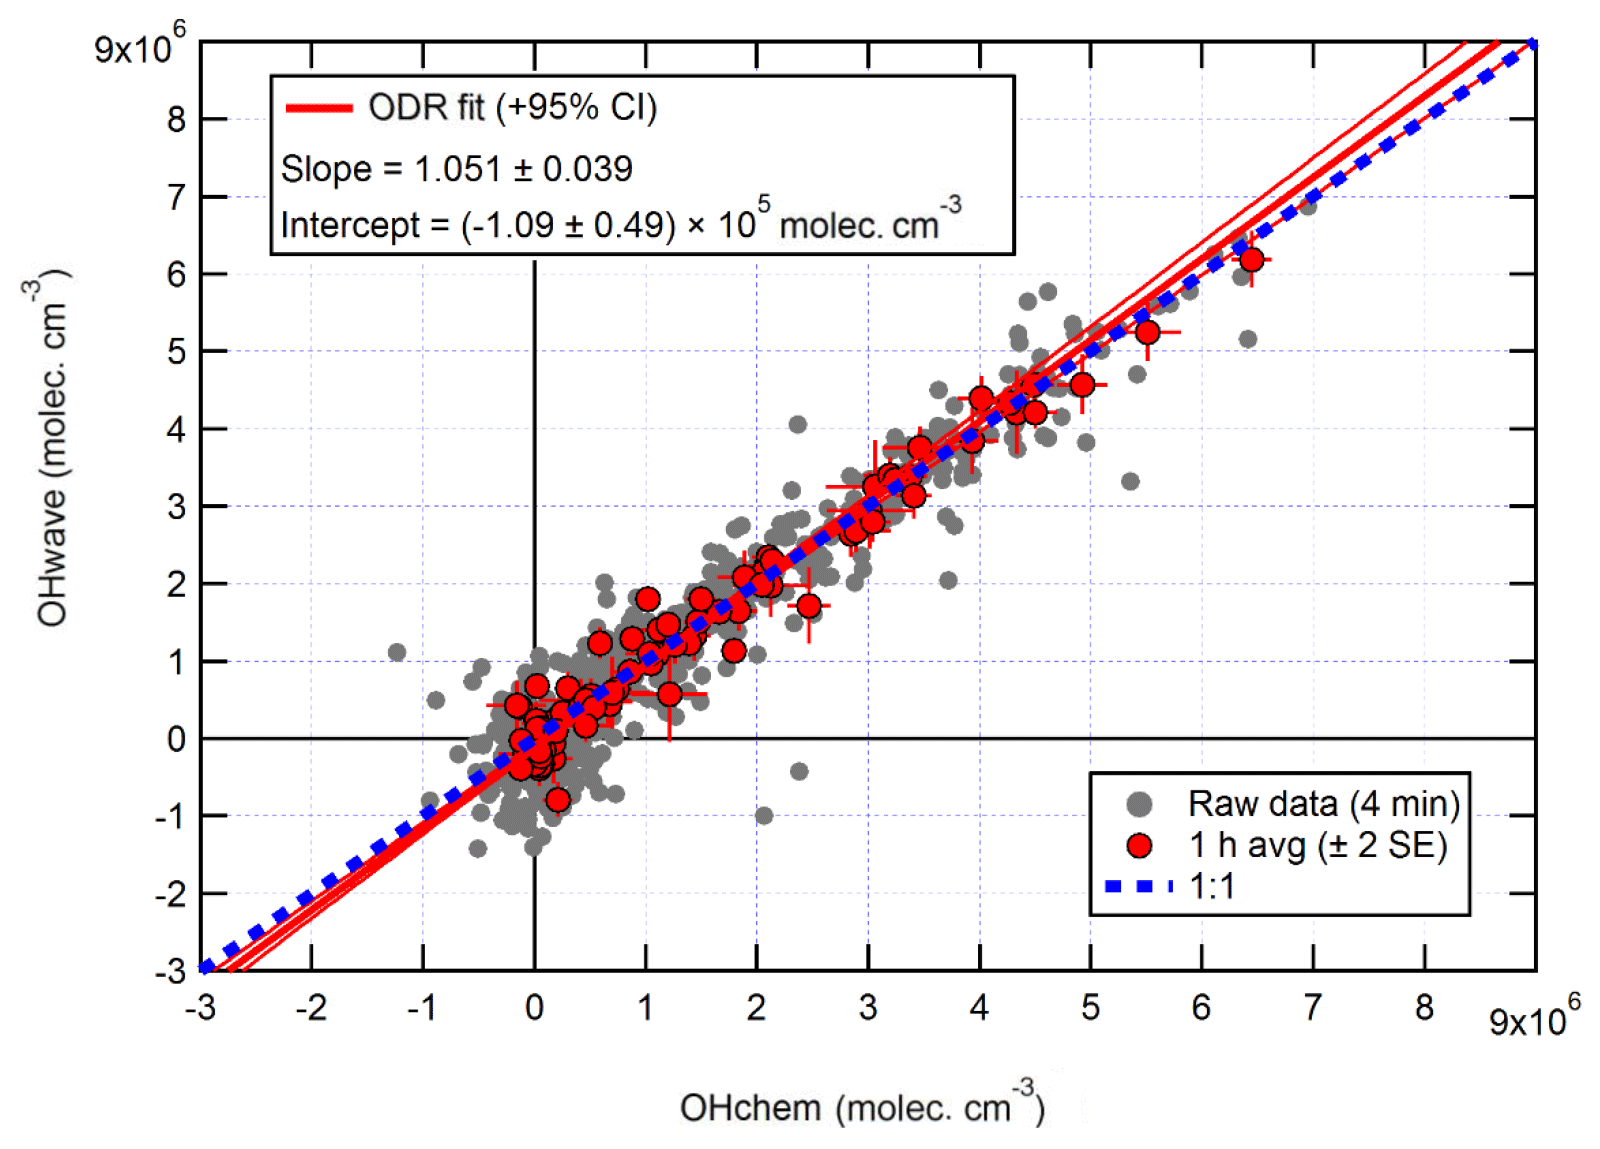
Figure 12Overall intercomparison of OHwave and OHchem observations from the winter 2016 AIRPRO campaign. Grey markers represent raw data (4 min), with 1 h averages (±2 SE) in red. The thick red line is the ODR fit to the hourly data, with its 95 % CI bands given by the thin red lines; fit errors are given at the 2σ level. For comparison, 1:1 agreement is denoted by the dashed blue line. OHwave data were corrected for the known interference from O3+H2O.
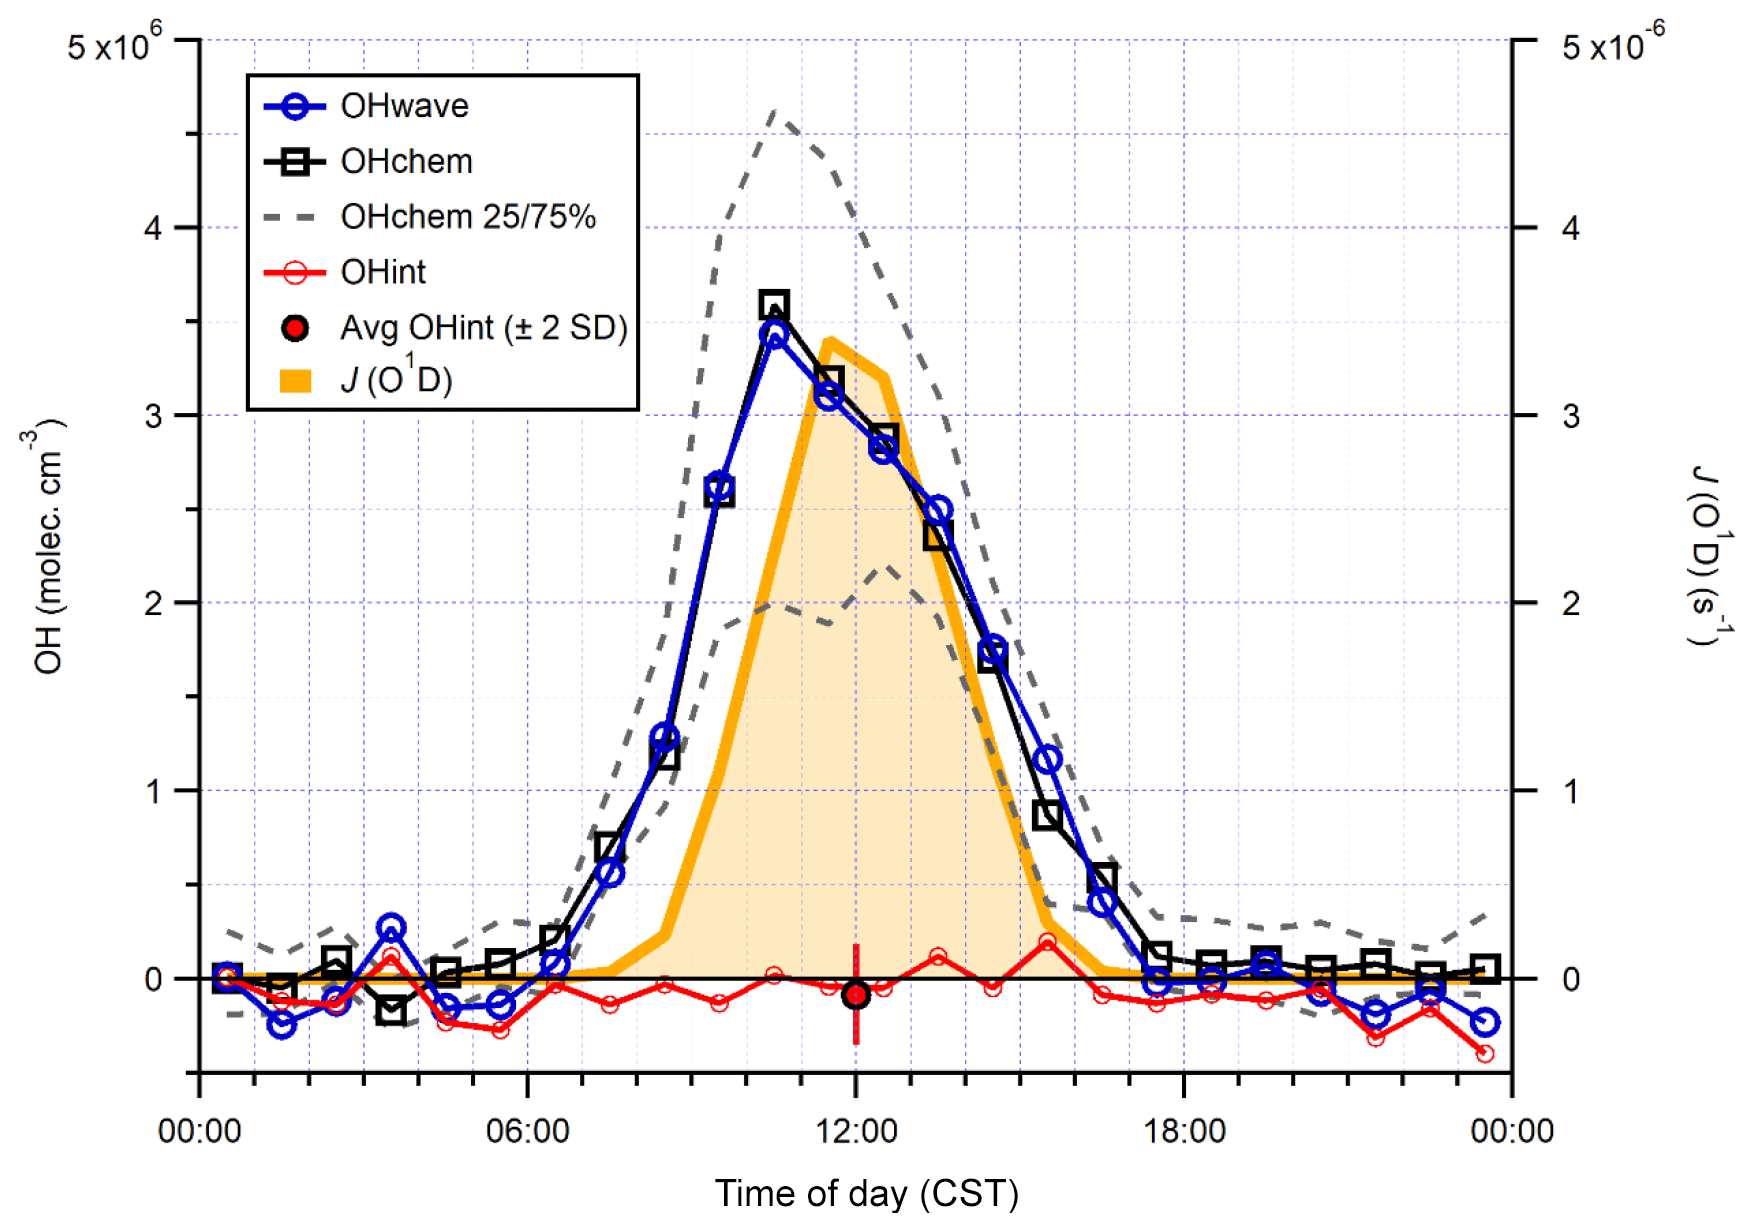
Figure 13Hourly median diurnal profiles of OHwave, OHchem, and J(O1D) (right axis) from the winter 2016 AIRPRO campaign. Also shown (red line and markers) is the hourly median diurnal profile of OHint, calculated from individual 4 min data points; the single red marker corresponds to the average (±2σ) of this trace. The variability (IQR) in OHchem measurements is denoted by the dashed grey lines and is not shown for others for clarity. OHwave data were corrected for the known interference from O3+H2O.
3.3.3 AIRPRO summer 2017
The intercomparison of OHwave and OHchem measurements for the AIRPRO summer campaign is shown in Fig. 14. Consistent with ICOZA and the AIRPRO winter results, the 1 h data are scattered around the 1:1 line, with an overall ODR slope of 1.103±0.017. However, the intercept is more negative than for the other campaigns, which suggests that the O3∕H2O interference may have been overestimated because it is during this campaign that the highest ozone mixing ratios (∼90 ppbv diurnally averaged maximum, Table 1) were encountered. Similarly, an unweighted least-squares linear fit to the data (not shown) yields a slope of 1.111±0.029, an intercept of (7) ×105 molec. cm−3, and an R2 of 0.92 (data not shown).
Again, the two measurements follow the same diurnal profile (Fig. 15), peaking in the afternoon at molec. cm−3 with relatively high night-time levels of ∼1–2×10⁶ molec. cm−3. As with ICOZA and the AIRPRO winter campaign, the OHint diurnal profile does not exhibit any obvious structure, with values scattered around zero and a mean ±2σ difference of () ×105 molec. cm−3. The mean ±2 SE (OHwave – OHchem) ∕ OHwave ratio was . During AIRPRO, measured NO3 mixing ratios reached up to ∼100 pptv, such that the lack of significant night-time OH interference signals is consistent with the results of NO3 interference tests (Sect. 3.2.3).
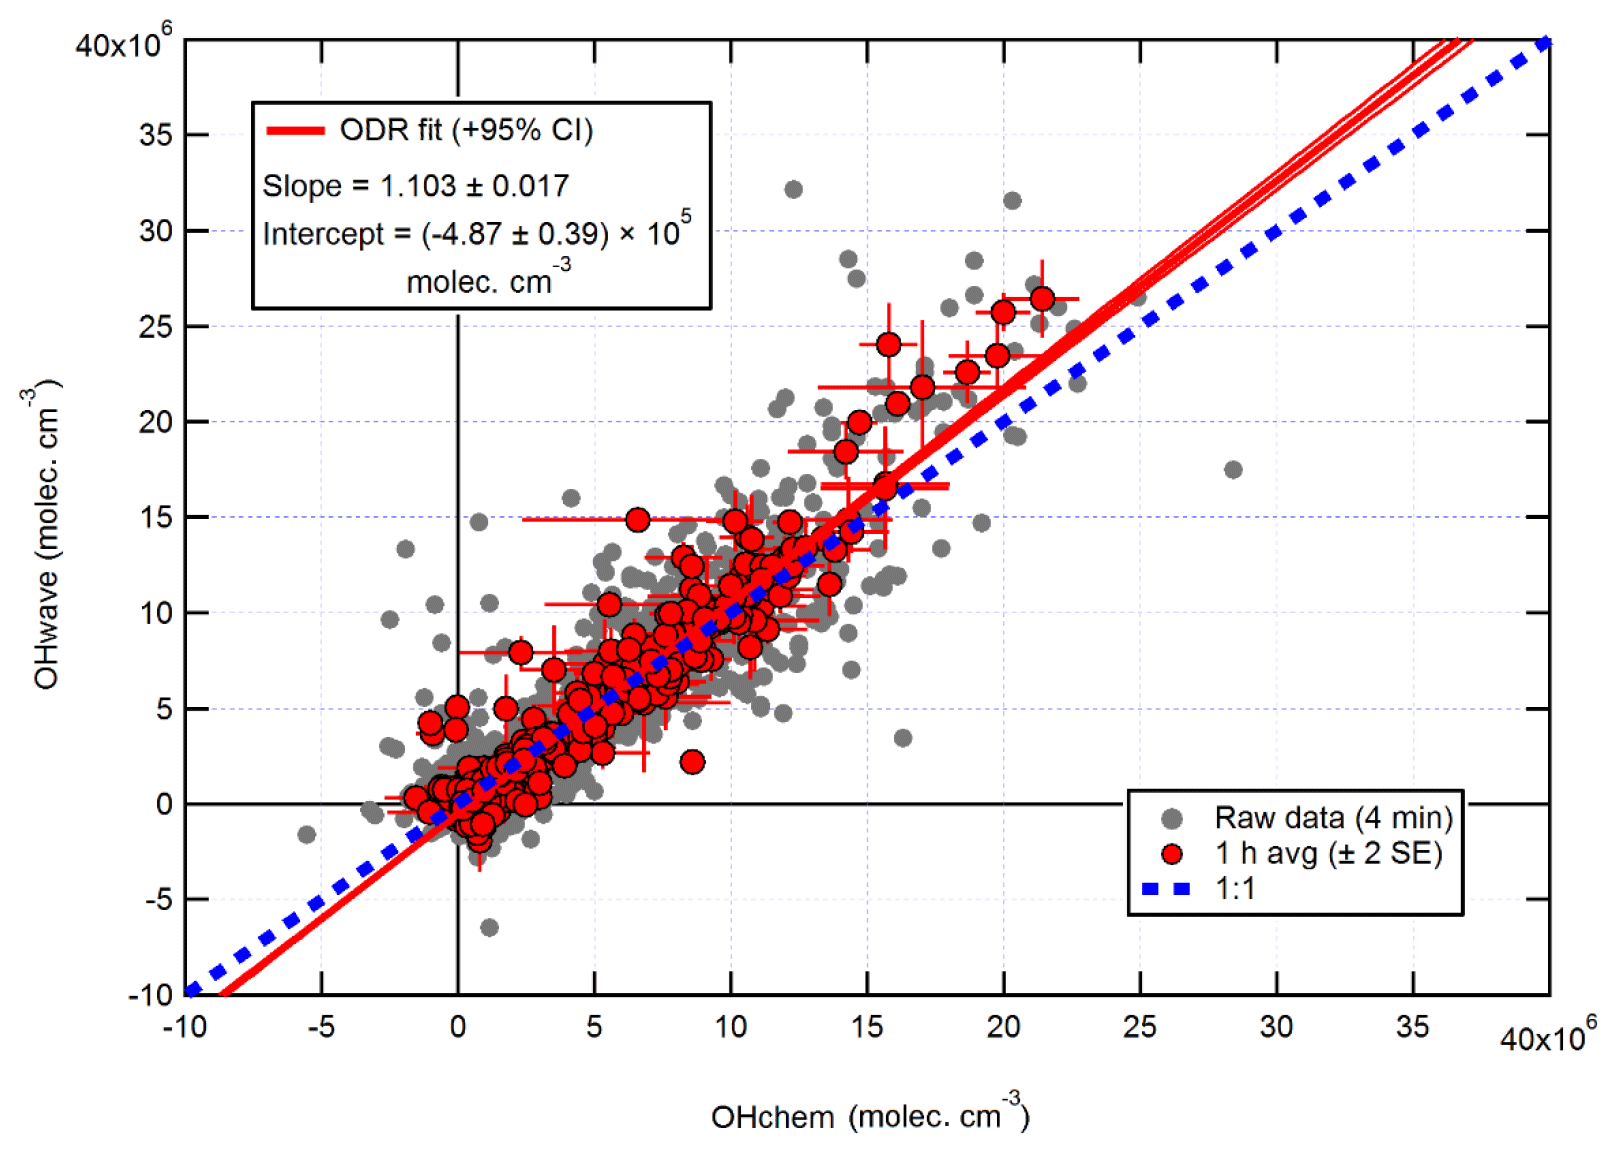
Figure 14Overall intercomparison of OHwave and OHchem observations from the summer 2017 AIRPRO campaign. Grey markers represent raw data (4 min), with 1 h averages (±2 SE) in red. The thick red line is the ODR fit to the hourly data, with its 95 % CI bands given by the thin red lines; fit errors are given at the 2σ level. For comparison, 1:1 agreement is denoted by the dashed blue line. OHwave data were corrected for the known interference from O3+H2O.
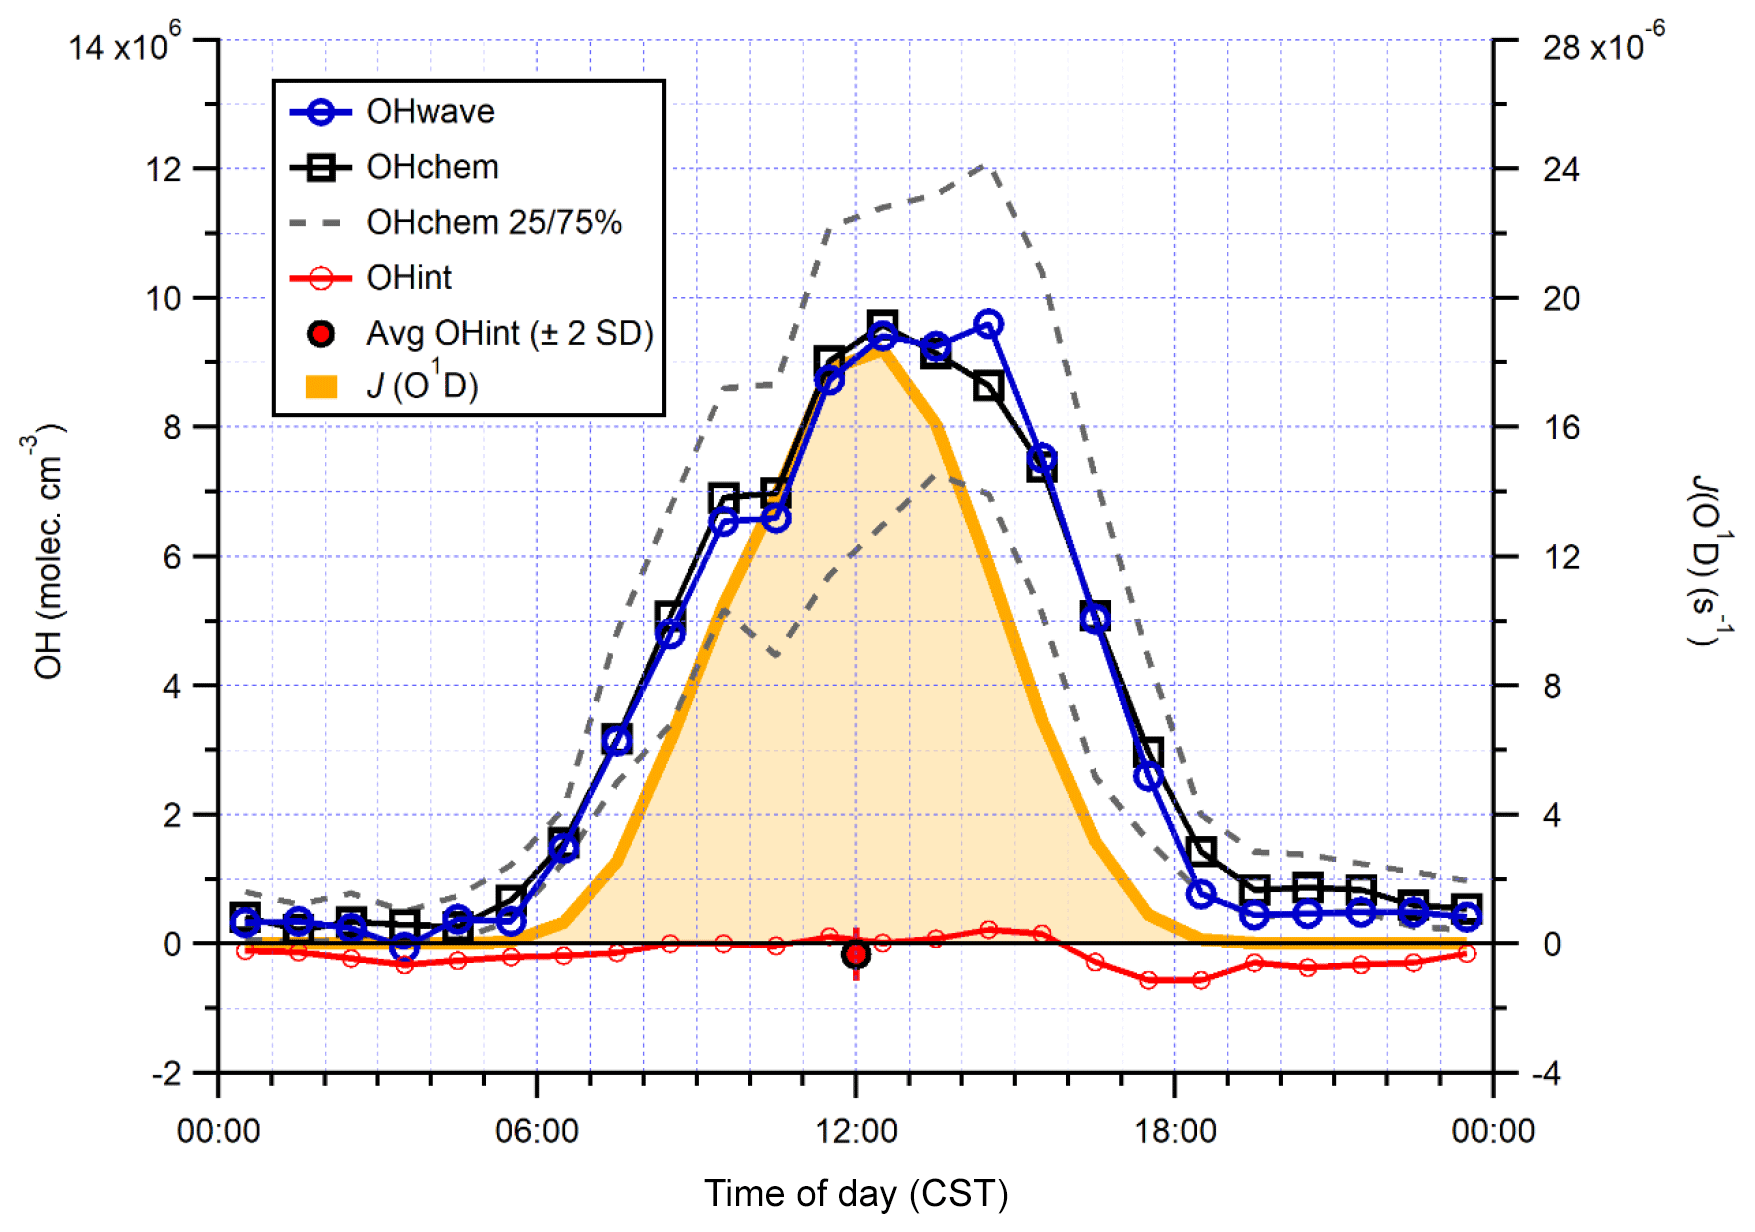
Figure 15Hourly median diurnal profiles of OHwave, OHchem, and J(O1D) (right axis) from the summer 2017 AIRPRO campaign. Also shown (red line and markers) is the hourly median diurnal profile of OHint, calculated from individual 4 min data points; the single red marker corresponds to the average (±2σ) of this trace. The variability (IQR) in OHchem measurements is denoted by the dashed grey lines and is not shown for others for clarity. OHwave data were corrected for the known interference from O3+H2O.
It can be seen from Fig. 14 that there is a small cluster of points that lie significantly away from both the 1:1 and ODR regression lines, which are characterised by high OHwave concentrations of > 1.5×10⁷ molec. cm−3. This finding was investigated further, with the results summarised in Fig. 16. Above an OHchem threshold of ∼1.0–1.5×10⁷ molec. cm−3, the OHint signal becomes significantly greater than zero and the instrument LOD, reaching ∼3–5×10⁶ molec. cm−3 at OHchem levels of around molec. cm−3. However, these results should be treated with caution, since only a few points are available for which OHchem was present at such high concentrations. The same behaviour was not observed for either the AIRPRO winter or ICOZA campaigns, since OHchem levels did not surpass 1×10⁷ molec. cm−3, but the analogous mean values at low OHchem concentrations are in agreement with the AIRPRO summer results.
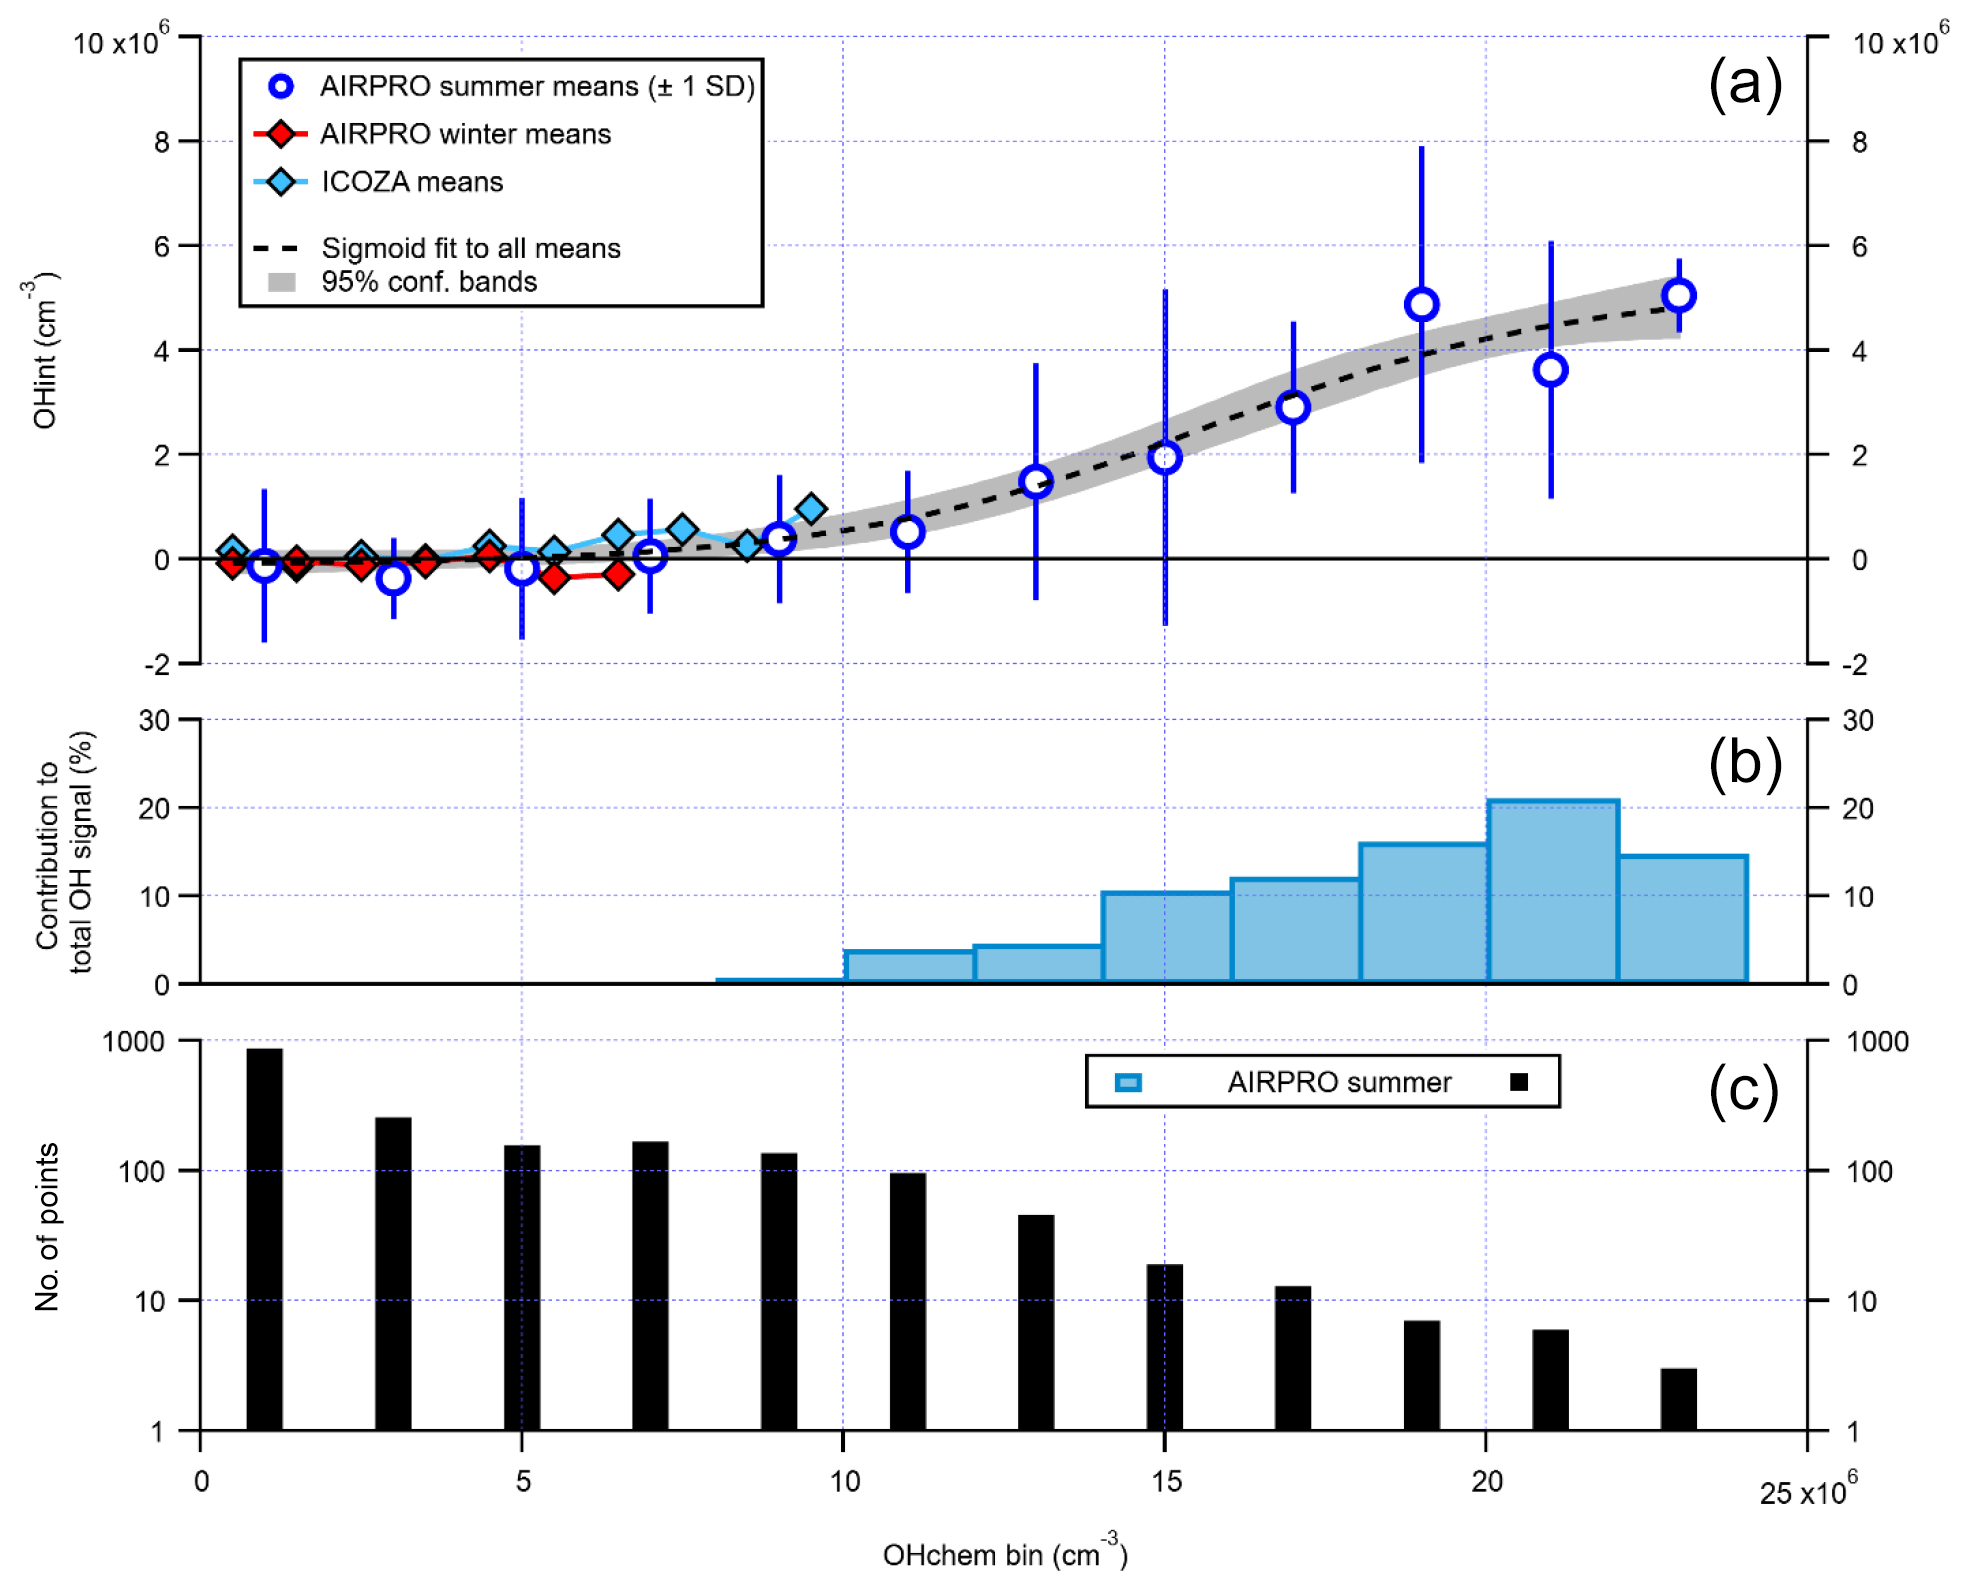
Figure 16The relationship between OHint and OHchem using binned data. The error bars for AIRPRO summer (a, blue markers) denote 1 SD and are not shown for AIRPRO winter and ICOZA for clarity. The dashed black line corresponds to a sigmoid fit and is used to guide the eye only. The contribution of interferences to the total OHwave signal (= OHint ∕ OHwave ×100 %) for the AIRPRO summer campaign is shown in (b), with the number of points in each bin shown in (c). All OHint data used here have been corrected for the known interference from O3+H2O.
The above results suggest that in the Beijing summertime, the Leeds FAGE instrument is subject to an interference(s) at the highest OH levels, although its contribution of ∼15 %–20 % (Fig. 16) is still below the instrumental accuracy of 26 % at 2σ. This finding is consistent with the suggestion of Fittschen et al. (2019) that ROOOH species, formed from RO2+OH reactions, generate an OH interference in LIF–FAGE instruments, since high OH levels would generate high RO2 concentrations and favour this class of reaction. It is also possible that, for high ambient OH production rates, the scavenger cannot react with the sampled OH sufficiently quickly, leading to elevated but spurious OHchem background signals. Although a modelling study of the inlet chemistry would be required to fully assess this hypothesis, it is likely not the case considering that the propane concentration used during AIRPRO results in an OH lifetime of ∼0.03 ms in the IPI flow tube, in comparison to a residence time of ∼20 ms (i.e. ∼700 OH lifetimes).
No clear dependences were found when OHint was binned against various parameters previously implicated in OH measurement interferences (Fig. S2), although it can be seen that OHint was marginally higher in the highest temperature, J(O1D), and isoprene bins.
Table 4Average contributions of FAGE background signals to the total OH measured (= (OHwave – OHchem) ∕ OHwave) during ambient air studies where a chemical modulation technique was employed.

a MBO =2-methyl-3-buten-2-ol, a biogenic volatile organic compound. b Consistent with known O3+H2O interference.
The results from the three field campaigns that feature in this work demonstrate that, in moderately to highly polluted conditions, the Leeds ground-based FAGE instrument does not suffer from substantial interferences in the measurement of OH using the conventional, wavelength modulation background technique, OHwave. This is illustrated best by the slopes of the overall measurement intercomparison plots (Figs. 10, 12, and 14), which ranged from 1.05 to 1.16. However, while the deviations of these slopes from 1 are small, they are still significant, suggesting the presence of unknown OH interferences. Nonetheless, such unknown interferences are well within the instrumental uncertainty of ∼26 % at 2σ.
With respect to previous studies during which OH has been measured by a LIF instrument equipped with a scavenger injector, the significance of interferences during the campaigns that feature in this work are amongst the lowest observed (Table 4). This can likely be attributed to two main factors: environment and instrumental. In terms of the former, none of the field campaigns described in the present study took place in forested environments, where the most significant interferences have been observed (Mao et al., 2012; Novelli et al., 2014a; Feiner et al., 2016). However, as mentioned previously, the AIRPRO summer campaign did share some characteristics, in that high BVOC and low NO mixing ratios were observed in the afternoon. Despite this, OHwave and OHchem were in good agreement. Although AIRPRO summer took place in a city, its results do provide confidence in previous measurements of OH using the same instrument, and support the hypothesis that there are unknown OH sources in the atmosphere.
The insignificance of daytime interferences during the AIRPRO campaigns is consistent with results of another urban study, CalNex-LA (Research in California at the Nexus of Air Quality and Climate Change) (Griffith et al., 2016). The O3∕H2O interference is much higher (up to molec. cm−3 OH equivalent during CalNex-LA) in the Indiana University (IU) LIF instrument (Dusanter et al., 2009), such that the daytime contributions of ∼33 % can be explained entirely by this known interference. However, measurements made at a nearby site during the same study (CalNex-SJV) showed daytime contributions of ∼20 % (Brune et al., 2016), although this may be related to instrumental differences, as discussed below. On average, interferences were not observed in the daytime during ICOZA, but they were observed in other coastal campaigns, namely DOMINO (Diel Oxidants Mechanisms In relation to Nitrogen Oxide), HOx (∼50 %) (Novelli et al., 2014a), and CYPHEX (CYprus PHotochemistry EXperiment, ∼45 %) (Mallik et al., 2018), as well as in rural regions, such as HOPE (Hohenpeißenberg Photochemistry Experiment, 20 %–40 %) (Novelli et al., 2014a). Studies of the North China Plain have revealed small interferences on the order of 0 %–10 % (Tan et al., 2017, 2018), with slightly higher but variable contributions of 0 %–20 % in the Pearl River Delta (Tan et al., 2019).
The second major reason for the differences in contributions between the studies listed in Table 4 is likely instrumental effects. For the campaigns in which the highest OH interferences have been observed (Mao et al., 2012; Novelli et al., 2014b; Feiner et al., 2016), OH measurements were made using the Max Planck Institute (MPI) (Martinez et al., 2010) and PSU (Faloona et al., 2004) LIF instruments. These instruments feature laser multi-pass detection cells, which give rise to larger detection volumes and increased UV fluence, although this may not be relevant considering that the interference signals did not display any laser power dependence for these instruments. The Leeds instrument also differs in terms of cell geometry, where the HOx cell is composed of a short (5 cm) turreted inlet on top of a large fluorescence cell (additional ∼8 cm to laser axis, ∼13 cm total length, and a cell diameter of 25 cm). In contrast, the MPI and PSU instruments feature flow-tube-like inlets (14–17 cm from the pinhole to laser axis) mounted on smaller fluorescence cells, facilitating the interaction of sampled gas with the cell walls, which may promote the generation of internal OH. For the measurements listed in Table 4, the Peking University (PKU) instrument (Tan et al., 2017) is most similar to the Leeds FAGE (i.e. single-pass detection, ∼10 cm total length from sampling inlet to laser axis), for which similar daytime interferences on the order of ∼0 %–20 % were observed.
For the ICOZA campaign, nothing could be inferred about the origin of the OH interference signal when one was observed, as it did not exhibit any characteristic diurnal profile (Fig. 11), and showed no obvious dependences on a variety of meteorological and chemical parameters. This finding is in contrast to previous studies in which diel profiles (Mao et al., 2012; Feiner et al., 2016) and dependences (Mao et al., 2012; Feiner et al., 2016; Novelli et al., 2017) of the interference have been observed. The occurrence of large (i.e. > 1×10⁶ molec. cm−3) background OH signals (OHint = OHwave − OHchem) after instrumental problems (e.g. power cuts, data not shown) implies that the differences may have been instrumental rather than as a result of a species present in ambient air, although the data at these times did pass all quality control filters and therefore could not be rejected. Nonetheless, any differences are still a concern, regardless of their cause; the IPI system thus serves as an additional check on measurement accuracy and operational stability, and is perhaps most useful for fieldwork sites where power supplies are unreliable, for example in more remote areas.
It is possible that, even though the background OH had a flat diurnal profile in each field campaign, the species responsible for any interference observed were different between daytime and night-time periods. Thus, analysis of the daytime and night-time data separately, as a function of the same parameters, might reveal more information. Considering the recent identification of NO3 radicals as an internal OH source in LIF instruments (Fuchs et al., 2016), and that OH concentrations have often been under-predicted at night (Faloona et al., 2001; Mao et al., 2012; Ren et al., 2013; Hens et al., 2014; Lu et al., 2014; Tan et al., 2017), this is perhaps the most interesting period for further study. However, for the data presented in this work, robust quantitative night-time analyses are not possible due to OH measurements being below or close to the instrument LOD.
In this work, there are several key findings that stand out. First, OHwave and OHchem were in good agreement even at the very low NO concentrations of < 100 pptv during ICOZA and the moderate afternoon levels (∼500 pptv on average but often < 100 pptv; Shi et al., 2019) during the AIRPRO summer campaign. While the role of isoprene could not be assessed for ICOZA, due to the limited range of concentrations observed (< 0.2 ppbv), it reached high levels during AIRPRO summer (up to 7.9 ppbv, larger than seen in some forested regions) but did not seem to perturb the agreement between the two measurements. In addition, very high levels of aromatic VOCs were observed during both AIRPRO winter and summer, where the agreement between OHwave and OHchem suggests that the intermediates of aromatic oxidation, such as exotic bicyclic species (Birdsall et al., 2010) and highly oxygenated molecules (HOMs) (Wang et al., 2017; Molteni et al., 2018; Tsiligiannis et al., 2019), do not give rise to OH interferences, which is postulated to be the case for intermediates (SCIs) in the ozone-oxidation of alkenes (Novelli et al., 2014b, 2017; Rickly and Stevens, 2018). However, the large alkene and ozone concentrations observed during AIRPRO summer should favour the formation of these SCIs, but significant interferences were not observed, consistent with laboratory investigations of the isoprene interference and casting doubt on the SCI hypothesis. Although, the AIRPRO SCI concentrations also depend on the magnitude of the SCI loss rates, which could be high if elevated levels of SO2 (Welz et al., 2012; Sheps et al., 2014) or organic acids (Welz et al., 2014) were present.
Considering the success of the first three field deployments of the IPI system and given that it does not reduce the instrument sensitivity towards OH, it is suggested that the system is adopted for permanent use in ambient studies, although conventional sampling should still be performed from time-to-time to check for potential artefacts caused by the IPI system itself. Another advantage of the IPI system is that it reduces the amount of solar light entering the pinhole, which reduces the size and variability of daytime background signals and therefore improves signal-to-noise and hence detection limits. It is recommended that the IPI propane concentration is kept the same as the summer AIRPRO campaign, as it is possible that the slightly poorer agreement between OHwave and OHchem during ICOZA was because of the lower propane flow used (i.e. the flow was not sufficient to ensure that OH generated from all steady-state sources was removed), although this cannot be verified.
Future field campaigns using the IPI will allow for the assessment of interferences in the Leeds FAGE instrument for a range of different environments. From these, the contribution of interferences for previous studies in similar environments, where measurements were made prior to the discovery of significant interferences in the LIF measurement of OH reported by others, may be inferred. The measurement–model comparisons may then be reassessed in light of any new information regarding the accuracy of OH measurements. Regardless of the reasons for any differences between the two measures of OH (i.e. chemical interferences or instrumental problems such as during recovery periods after power cuts), the IPI system serves as an additional check on OH observations, increasing confidence in the validity of the data obtained.
The addition of an IPI system to the Leeds ground-based FAGE instrument allowed for a comprehensive investigation of OH measurement interferences in both the laboratory and the field. Following its optimisation and thorough characterisation in terms of sensitivity and external and internal OH removal efficiency, laboratory experiments were conducted to assess potential interferences from (1) the photolysis of O3 in the presence of H2O vapour, (2) the intermediates and products of isoprene ozonolysis, and (3) NO3 radicals. For O3+H2O, a small but potentially significant interference (at high O3 levels) was found, but interferences from isoprene ozonolysis products and NO3 radicals were shown to be insignificant under typical atmospheric conditions.
Field campaigns conducted in the UK and China showed that, on average, the Leeds ground-based FAGE instrument does not suffer from significant interferences in the detection of OH. It was only under the very high OH levels of > 1.5×10⁷ molec. cm−3 sometimes observed during the AIRPRO summer campaign that interferences were found consistently, although their contributions (∼15 %–20 %) were smaller than the instrumental accuracy of 26 % at 2σ. Large interference signals (> 1×10⁶ molec. cm−3) were occasionally observed during the ICOZA campaign but always after instrumental problems such as power cuts, suggesting that the OHchem method serves as an additional tool for verifying instrument stability and validating measurements. The Leeds IPI system will find continued use in future fieldwork.
Data presented in this study are available from the authors upon request (l.k.whalley@leeds.ac.uk and d.e.heard@leeds.ac.uk).
The supplement related to this article is available online at: https://doi.org/10.5194/amt-13-3119-2020-supplement.
RWM, TI, LKW, and DEH designed the IPI system. RWM, EJS, JA, LMS, CY, and LKW performed laboratory experiments. RWM, EJS, DRC, CY, LKW, and DEH were responsible for field measurements. RWM, EJS, and LKW analysed the data. RWM wrote the manuscript with input from all co-authors.
The authors declare that they have no conflict of interest.
Robert Woodward-Massey, Danny R. Cryer, and Eloise J. Slater are grateful to NERC for funding PhD studentships. We would like to acknowledge Brian Bandy, Grant Forster, David Oram, and Claire Reeves (University of East Anglia); William Bloss, Leigh Crilley, and Louisa Kramer (University of Birmingham); and Rachel Dunmore, Jacqui Hamilton, James Hopkins, James Lee, Chris Reed, and Freya Squires (University of York) for the provision of some of the data used to generate the averages in Table 1. We would also like to thank other participants in the ICOZA and AIRPRO field campaigns. We are grateful for technical support from the University of Leeds mechanical and electronics workshops. Robert Woodward-Massey is grateful to Hans Osthoff (University of Calgary) for the provision of Igor functions.
This research has been supported by the NERC (grant nos. NE/K012029/1, NE/K012169/1, NE/N007115/1, and NE/N006895/1).
This paper was edited by Anna Novelli and reviewed by two anonymous referees.
Birdsall, A. W., Andreoni, J. F., and Elrod, M. J.: Investigation of the role of bicyclic peroxy radicals in the oxidation mechanism of toluene, J. Phys. Chem. A, 114, 10655–10663, https://doi.org/10.1021/jp105467e, 2010.
Bloss, W. J., Lee, J. D., Heard, D. E., Salmon, R. A., Bauguitte, S. J.-B., Roscoe, H. K., and Jones, A. E.: Observations of OH and HO2 radicals in coastal Antarctica, Atmos. Chem. Phys., 7, 4171–4185, https://doi.org/10.5194/acp-7-4171-2007, 2007.
Boggs, P. T., Byrd, R. H., and Schnabel, R. B.: A Stable and Efficient Algorithm for Nonlinear Orthogonal Distance Regression, Siam J. Sci. Stat. Comp., 8, 1052–1078, https://doi.org/10.1137/0908085, 1987.
Bohn, B., Corlett, G. K., Gillmann, M., Sanghavi, S., Stange, G., Tensing, E., Vrekoussis, M., Bloss, W. J., Clapp, L. J., Kortner, M., Dorn, H.-P., Monks, P. S., Platt, U., Plass-Dülmer, C., Mihalopoulos, N., Heard, D. E., Clemitshaw, K. C., Meixner, F. X., Prevot, A. S. H., and Schmitt, R.: Photolysis frequency measurement techniques: results of a comparison within the ACCENT project, Atmos. Chem. Phys., 8, 5373–5391, https://doi.org/10.5194/acp-8-5373-2008, 2008.
Brune, W. H., Baier, B. C., Thomas, J., Ren, X., Cohen, R. C., Pusede, S. E., Browne, E. C., Goldstein, A. H., Gentner, D. R., Keutsch, F. N., Thornton, J. A., Harrold, S., Lopez-Hilfiker, F. D., and Wennberg, P. O.: Ozone production chemistry in the presence of urban plumes, Faraday Discuss., 189, 169–189, https://doi.org/10.1039/c5fd00204d, 2016.
Carslaw, N., Creasey, D. J., Harrison, D., Heard, D. E., Hunter, M. C., Jacobs, P. J., Jenkin, M. E., Lee, J. D., Lewis, A. C., Pilling, M. J., Saunders, S. M., and Seakins, P. W.: OH and HO2 radical chemistry in a forested region of north-western Greece, Atmos. Environ., 35, 4725–4737, https://doi.org/10.1016/S1352-2310(01)00089-9, 2001.
Cazorla, M. and Brune, W. H.: Measurement of Ozone Production Sensor, Atmos. Meas. Tech., 3, 545–555, https://doi.org/10.5194/amt-3-545-2010, 2010.
Cazorla, M., Brune, W. H., Ren, X., and Lefer, B.: Direct measurement of ozone production rates in Houston in 2009 and comparison with two estimation methods, Atmos. Chem. Phys., 12, 1203–1212, https://doi.org/10.5194/acp-12-1203-2012, 2012.
Chao, W., Hsieh, J. T., Chang, C. H., and Lin, J. J.: Atmospheric chemistry. Direct kinetic measurement of the reaction of the simplest Criegee intermediate with water vapor, Science, 347, 751–754, https://doi.org/10.1126/science.1261549, 2015.
Chen, W., Tang, H. Z., and Zhao, H. M.: Diurnal, weekly and monthly spatial variations of air pollutants and air quality of Beijing, Atmos. Environ., 119, 21–34, https://doi.org/10.1016/j.atmosenv.2015.08.040, 2015.
Creasey, D. J., HalfordMaw, P. A., Heard, D. E., Pilling, M. J., and Whitaker, B. J.: Implementation and initial deployment of a field instrument for measurement of OH and HO2 in the troposphere by laser-induced fluorescence, J. Chem. Soc.-Faraday T., 93, 2907–2913, https://doi.org/10.1039/a701469d, 1997a.
Creasey, D. J., Heard, D. E., Pilling, M. J., Whitaker, B. J., Berzins, M., and Fairlie, R.: Visualisation of a supersonic free-jet expansion using laser-induced fluorescence spectroscopy: Application to the measurement of rate constants at ultralow temperatures, Appl. Phys. B, 65, 375–391, https://doi.org/10.1007/s003400050285, 1997b.
Creasey, D. J., Heard, D. E., and Lee, J. D.: OH and HO2 measurements in a forested region of north-western Greece, Atmos. Environ., 35, 4713–4724, https://doi.org/10.1016/S1352-2310(01)00090-5, 2001.
Creasey, D. J., Evans, G. E., Heard, D. E., and Lee, J. D.: Measurements of OH and HO2 concentrations in the Southern Ocean marine boundary layer, J. Geophys. Res.-Atmos., 108, 4475, 10.1029/2002JD003206, 2003.
Crounse, J. D., Paulot, F., Kjaergaard, H. G., and Wennberg, P. O.: Peroxy radical isomerization in the oxidation of isoprene, Phys. Chem. Chem. Phys., 13, 13607–13613, https://doi.org/10.1039/c1cp21330j, 2011.
Crounse, J. D., Knap, H. C., Ornso, K. B., Jorgensen, S., Paulot, F., Kjaergaard, H. G., and Wennberg, P. O.: Atmospheric fate of methacrolein. 1. Peroxy radical isomerization following addition of OH and O2, J. Phys. Chem. A, 116, 5756–5762, https://doi.org/10.1021/jp211560u, 2012.
Cryer, D. R.: Measurements of hydroxyl radical reactivity and formaldehyde in the atmosphere, PhD thesis, School of Chemistry, University of Leeds, 2016.
da Silva, G., Graham, C., and Wang, Z. F.: Unimolecular beta-hydroxyperoxy radical decomposition with OH recycling in the photochemical oxidation of isoprene, Environ. Sci. Technol., 44, 250–256, https://doi.org/10.1021/es900924d, 2010.
Dillon, T. J. and Crowley, J. N.: Direct detection of OH formation in the reactions of HO2 with CH3C(O)O2 and other substituted peroxy radicals, Atmos. Chem. Phys., 8, 4877–4889, https://doi.org/10.5194/acp-8-4877-2008, 2008.
Dubey, M. K., Hanisco, T. F., Wennberg, P. O., and Anderson, J. G.: Monitoring potential photochemical interference in laser-induced fluorescence measurements of atmospheric OH, Geophys. Res. Lett., 23, 3215–3218, https://doi.org/10.1029/96gl03008, 1996.
Dusanter, S., Vimal, D., Stevens, P. S., Volkamer, R., and Molina, L. T.: Measurements of OH and HO2 concentrations during the MCMA-2006 field campaign – Part 1: Deployment of the Indiana University laser-induced fluorescence instrument, Atmos. Chem. Phys., 9, 1665–1685, https://doi.org/10.5194/acp-9-1665-2009, 2009.
Edwards, G. D., Cantrell, C. A., Stephens, S., Hill, B., Goyea, O., Shetter, R. E., Mauldin, R. L., Kosciuch, E., Tanner, D. J., and Eisele, F. L.: Chemical ionization mass spectrometer instrument for the measurement of tropospheric HO2 and RO2, Anal. Chem., 75, 5317–5327, https://doi.org/10.1021/ac034402b, 2003.
Emmerson, K. M., Carslaw, N., Carslaw, D. C., Lee, J. D., McFiggans, G., Bloss, W. J., Gravestock, T., Heard, D. E., Hopkins, J., Ingham, T., Pilling, M. J., Smith, S. C., Jacob, M., and Monks, P. S.: Free radical modelling studies during the UK TORCH Campaign in Summer 2003, Atmos. Chem. Phys., 7, 167–181, https://doi.org/10.5194/acp-7-167-2007, 2007.
Faloona, I., Tan, D., Brune, W., Hurst, J., Barket, D., Couch, T. L., Shepson, P., Apel, E., Riemer, D., Thornberry, T., Carroll, M. A., Sillman, S., Keeler, G. J., Sagady, J., Hooper, D., and Paterson, K.: Nighttime observations of anomalously high levels of hydroxyl radicals above a deciduous forest canopy, J. Geophys. Res.-Atmos., 106, 24315–24333, https://doi.org/10.1029/2000jd900691, 2001.
Faloona, I. C., Tan, D., Lesher, R. L., Hazen, N. L., Frame, C. L., Simpas, J. B., Harder, H., Martinez, M., Di Carlo, P., Ren, X. R., and Brune, W. H.: A laser-induced fluorescence instrument for detecting tropospheric OH and HO2: Characteristics and calibration, J. Atmos. Chem., 47, 139–167, https://doi.org/10.1023/B:JOCH.0000021036.53185.0e, 2004.
Feiner, P. A., Brune, W. H., Miller, D. O., Zhang, L., Cohen, R. C., Romer, P. S., Goldstein, A. H., Keutsch, F. N., Skog, K. M., Wennberg, P. O., Nguyen, T. B., Teng, A. P., DeGouw, J., Koss, A., Wild, R. J., Brown, S. S., Guenther, A., Edgerton, E., Baumann, K., and Fry, J. L.: Testing Atmospheric Oxidation in an Alabama Forest, J. Atmos. Sci., 73, 4699–4710, https://doi.org/10.1175/Jas-D-16-0044.1, 2016.
Fittschen, C., Al Ajami, M., Batut, S., Ferracci, V., Archer-Nicholls, S., Archibald, A. T., and Schoemaecker, C.: ROOOH: a missing piece of the puzzle for OH measurements in low-NO environments?, Atmos. Chem. Phys., 19, 349–362, https://doi.org/10.5194/acp-19-349-2019, 2019.
Fuchs, H., Holland, F., and Hofzumahaus, A.: Measurement of tropospheric RO2 and HO2 radicals by a laser-induced fluorescence instrument, Rev. Sci. Instrum., 79, 084104, https://doi.org/10.1063/1.2968712, 2008.
Fuchs, H., Bohn, B., Hofzumahaus, A., Holland, F., Lu, K. D., Nehr, S., Rohrer, F., and Wahner, A.: Detection of HO2 by laser-induced fluorescence: calibration and interferences from RO2 radicals, Atmos. Meas. Tech., 4, 1209–1225, https://doi.org/10.5194/amt-4-1209-2011, 2011.
Fuchs, H., Hofzumahaus, A., Rohrer, F., Bohn, B., Brauers, T., Dorn, H. P., Haseler, R., Holland, F., Kaminski, M., Li, X., Lu, K., Nehr, S., Tillmann, R., Wegener, R., and Wahner, A.: Experimental evidence for efficient hydroxyl radical regeneration in isoprene oxidation, Nat. Geosci., 6, 1023–1026, https://doi.org/10.1038/Ngeo1964, 2013.
Fuchs, H., Acir, I.-H., Bohn, B., Brauers, T., Dorn, H.-P., Häseler, R., Hofzumahaus, A., Holland, F., Kaminski, M., Li, X., Lu, K., Lutz, A., Nehr, S., Rohrer, F., Tillmann, R., Wegener, R., and Wahner, A.: OH regeneration from methacrolein oxidation investigated in the atmosphere simulation chamber SAPHIR, Atmos. Chem. Phys., 14, 7895–7908, https://doi.org/10.5194/acp-14-7895-2014, 2014.
Fuchs, H., Tan, Z., Hofzumahaus, A., Broch, S., Dorn, H.-P., Holland, F., Künstler, C., Gomm, S., Rohrer, F., Schrade, S., Tillmann, R., and Wahner, A.: Investigation of potential interferences in the detection of atmospheric ROx radicals by laser-induced fluorescence under dark conditions, Atmos. Meas. Tech., 9, 1431–1447, https://doi.org/10.5194/amt-9-1431-2016, 2016.
Fuchs, H., Tan, Z., Lu, K., Bohn, B., Broch, S., Brown, S. S., Dong, H., Gomm, S., Häseler, R., He, L., Hofzumahaus, A., Holland, F., Li, X., Liu, Y., Lu, S., Min, K.-E., Rohrer, F., Shao, M., Wang, B., Wang, M., Wu, Y., Zeng, L., Zhang, Y., Wahner, A., and Zhang, Y.: OH reactivity at a rural site (Wangdu) in the North China Plain: contributions from OH reactants and experimental OH budget, Atmos. Chem. Phys., 17, 645–661, https://doi.org/10.5194/acp-17-645-2017, 2017.
Fuchs, H., Albrecht, S., Acir, I., Bohn, B., Breitenlechner, M., Dorn, H.-P., Gkatzelis, G. I., Hofzumahaus, A., Holland, F., Kaminski, M., Keutsch, F. N., Novelli, A., Reimer, D., Rohrer, F., Tillmann, R., Vereecken, L., Wegener, R., Zaytsev, A., Kiendler-Scharr, A., and Wahner, A.: Investigation of the oxidation of methyl vinyl ketone (MVK) by OH radicals in the atmospheric simulation chamber SAPHIR, Atmos. Chem. Phys., 18, 8001–8016, https://doi.org/10.5194/acp-18-8001-2018, 2018.
Griffith, S. M., Hansen, R. F., Dusanter, S., Stevens, P. S., Alaghmand, M., Bertman, S. B., Carroll, M. A., Erickson, M., Galloway, M., Grossberg, N., Hottle, J., Hou, J., Jobson, B. T., Kammrath, A., Keutsch, F. N., Lefer, B. L., Mielke, L. H., O'Brien, A., Shepson, P. B., Thurlow, M., Wallace, W., Zhang, N., and Zhou, X. L.: OH and HO2 radical chemistry during PROPHET 2008 and CABINEX 2009 – Part 1: Measurements and model comparison, Atmos. Chem. Phys., 13, 5403–5423, https://doi.org/10.5194/acp-13-5403-2013, 2013.
Griffith, S. M., Hansen, R. F., Dusanter, S., Michoud, V., Gilman, J. B., Kuster, W. C., Veres, P. R., Graus, M., de Gouw, J. A., Roberts, J., Young, C., Washenfelder, R., Brown, S. S., Thalman, R., Waxman, E., Volkamer, R., Tsai, C., Stutz, J., Flynn, J. H., Grossberg, N., Lefer, B., Alvarez, S. L., Rappenglueck, B., Mielke, L. H., Osthoff, H. D., and Stevens, P. S.: Measurements of hydroxyl and hydroperoxy radicals during CalNex-LA: Model comparisons and radical budgets, J. Geophys. Res.-Atmos., 121, 4211–4232, https://doi.org/10.1002/2015jd024358, 2016.
Hansen, R. F., Lewis, T. R., Graham, L., Whalley, L. K., Seakins, P. W., Heard, D. E., and Blitz, M. A.: OH production from the photolysis of isoprene-derived peroxy radicals: cross-sections, quantum yields and atmospheric implications, Phys. Chem. Chem. Phys., 19, 2332–2345, https://doi.org/10.1039/c6cp06718b, 2017.
Hard, T. M., Obrien, R. J., Chan, C. Y., and Mehrabzadeh, A. A.: Tropospheric Free-Radical Determination by fluorescence by gas expansion, Environ. Sci. Technol., 18, 768–777, https://doi.org/10.1021/es00128a009, 1984.
Heard, D. E., Carpenter, L. J., Creasey, D. J., Hopkins, J. R., Lee, J. D., Lewis, A. C., Pilling, M. J., Seakins, P. W., Carslaw, N., and Emmerson, K. M.: High levels of the hydroxyl radical in the winter urban troposphere, Geophys. Res. Lett., 31, L18112, https://doi.org/10.1029/2004GL020544, 2004.
Hens, K., Novelli, A., Martinez, M., Auld, J., Axinte, R., Bohn, B., Fischer, H., Keronen, P., Kubistin, D., Nölscher, A. C., Oswald, R., Paasonen, P., Petäjä, T., Regelin, E., Sander, R., Sinha, V., Sipilä, M., Taraborrelli, D., Tatum Ernest, C., Williams, J., Lelieveld, J., and Harder, H.: Observation and modelling of HOx radicals in a boreal forest, Atmos. Chem. Phys., 14, 8723–8747, https://doi.org/10.5194/acp-14-8723-2014, 2014.
Hewitt, C. N., Lee, J. D., MacKenzie, A. R., Barkley, M. P., Carslaw, N., Carver, G. D., Chappell, N. A., Coe, H., Collier, C., Commane, R., Davies, F., Davison, B., DiCarlo, P., Di Marco, C. F., Dorsey, J. R., Edwards, P. M., Evans, M. J., Fowler, D., Furneaux, K. L., Gallagher, M., Guenther, A., Heard, D. E., Helfter, C., Hopkins, J., Ingham, T., Irwin, M., Jones, C., Karunaharan, A., Langford, B., Lewis, A. C., Lim, S. F., MacDonald, S. M., Mahajan, A. S., Malpass, S., McFiggans, G., Mills, G., Misztal, P., Moller, S., Monks, P. S., Nemitz, E., Nicolas-Perea, V., Oetjen, H., Oram, D. E., Palmer, P. I., Phillips, G. J., Pike, R., Plane, J. M. C., Pugh, T., Pyle, J. A., Reeves, C. E., Robinson, N. H., Stewart, D., Stone, D., Whalley, L. K., and Yin, X.: Overview: oxidant and particle photochemical processes above a south-east Asian tropical rainforest (the OP3 project): introduction, rationale, location characteristics and tools, Atmos. Chem. Phys., 10, 169–199, https://doi.org/10.5194/acp-10-169-2010, 2010.
Hofzumahaus, A. and Heard, D. E.: Assessment of Local HOx and ROx Measurement Techniques: Achievements, Challenges, and Future Directions – Outcomes of the 2015 International HOx Workshop, IGAG News, 55, 20–21, 2015.
Hofzumahaus, A., Rohrer, F., Lu, K., Bohn, B., Brauers, T., Chang, C. C., Fuchs, H., Holland, F., Kita, K., Kondo, Y., Li, X., Lou, S., Shao, M., Zeng, L., Wahner, A., and Zhang, Y.: Amplified trace gas removal in the troposphere, Science, 324, 1702–1704, https://doi.org/10.1126/science.1164566, 2009.
Lee, J. D., Whalley, L. K., Heard, D. E., Stone, D., Dunmore, R. E., Hamilton, J. F., Young, D. E., Allan, J. D., Laufs, S., and Kleffmann, J.: Detailed budget analysis of HONO in central London reveals a missing daytime source, Atmos. Chem. Phys., 16, 2747–2764, https://doi.org/10.5194/acp-16-2747-2016, 2016.
Lelieveld, J., Butler, T. M., Crowley, J. N., Dillon, T. J., Fischer, H., Ganzeveld, L., Harder, H., Lawrence, M. G., Martinez, M., Taraborrelli, D., and Williams, J.: Atmospheric oxidation capacity sustained by a tropical forest, Nature, 452, 737–740, https://doi.org/10.1038/nature06870, 2008.
Lew, M. L., Rickly, P. S., Bottorff, B. P., Sklaveniti, S., Léonardis, T., Locoge, N., Dusanter, S., Kundu, S., Wood, E., and Stevens, P. S.: OH and HO2 radical chemistry in a midlatitude forest: Measurements and model comparisons, Atmos. Chem. Phys. Discuss., https://doi.org/10.5194/acp-2019-726, in review, 2019.
Lewis, T. R., Blitz, M. A., Heard, D. E., and Seakins, P. W.: Direct evidence for a substantive reaction between the Criegee intermediate, CH2OO, and the water vapour dimer, Phys. Chem. Chem. Phys., 17, 4859–4863, https://doi.org/10.1039/c4cp04750h, 2015.
Lin, L. C., Chao, W., Chang, C. H., Takahashi, K., and Lin, J. J.: Temperature dependence of the reaction of anti-CH3CHOO with water vapor, Phys. Chem. Chem. Phys., 18, 28189–28197, https://doi.org/10.1039/c6cp05171e, 2016.
Lu, K. D., Rohrer, F., Holland, F., Fuchs, H., Brauers, T., Oebel, A., Dlugi, R., Hu, M., Li, X., Lou, S. R., Shao, M., Zhu, T., Wahner, A., Zhang, Y. H., and Hofzumahaus, A.: Nighttime observation and chemistry of HOx in the Pearl River Delta and Beijing in summer 2006, Atmos. Chem. Phys., 14, 4979–4999, https://doi.org/10.5194/acp-14-4979-2014, 2014.
Mallik, C., Tomsche, L., Bourtsoukidis, E., Crowley, J. N., Derstroff, B., Fischer, H., Hafermann, S., Hüser, I., Javed, U., Keßel, S., Lelieveld, J., Martinez, M., Meusel, H., Novelli, A., Phillips, G. J., Pozzer, A., Reiffs, A., Sander, R., Taraborrelli, D., Sauvage, C., Schuladen, J., Su, H., Williams, J., and Harder, H.: Oxidation processes in the eastern Mediterranean atmosphere: evidence from the modelling of HOx measurements over Cyprus, Atmos. Chem. Phys., 18, 10825–10847, https://doi.org/10.5194/acp-18-10825-2018, 2018.
Mao, J., Ren, X., Zhang, L., Van Duin, D. M., Cohen, R. C., Park, J.-H., Goldstein, A. H., Paulot, F., Beaver, M. R., Crounse, J. D., Wennberg, P. O., DiGangi, J. P., Henry, S. B., Keutsch, F. N., Park, C., Schade, G. W., Wolfe, G. M., Thornton, J. A., and Brune, W. H.: Insights into hydroxyl measurements and atmospheric oxidation in a California forest, Atmos. Chem. Phys., 12, 8009–8020, https://doi.org/10.5194/acp-12-8009-2012, 2012.
Martinez, M., Harder, H., Ren, X., Lesher, R. L., and Brune, W. H.: Measuring atmospheric naphthalene with laser-induced fluorescence, Atmos. Chem. Phys., 4, 563–569, https://doi.org/10.5194/acp-4-563-2004, 2004.
Martinez, M., Harder, H., Kubistin, D., Rudolf, M., Bozem, H., Eerdekens, G., Fischer, H., Klüpfel, T., Gurk, C., Königstedt, R., Parchatka, U., Schiller, C. L., Stickler, A., Williams, J., and Lelieveld, J.: Hydroxyl radicals in the tropical troposphere over the Suriname rainforest: airborne measurements, Atmos. Chem. Phys., 10, 3759–3773, https://doi.org/10.5194/acp-10-3759-2010, 2010.
Molteni, U., Bianchi, F., Klein, F., El Haddad, I., Frege, C., Rossi, M. J., Dommen, J., and Baltensperger, U.: Formation of highly oxygenated organic molecules from aromatic compounds, Atmos. Chem. Phys., 18, 1909–1921, https://doi.org/10.5194/acp-18-1909-2018, 2018.
Newland, M. J., Rickard, A. R., Vereecken, L., Muñoz, A., Ródenas, M., and Bloss, W. J.: Atmospheric isoprene ozonolysis: impacts of stabilised Criegee intermediate reactions with SO2, H2O and dimethyl sulfide, Atmos. Chem. Phys., 15, 9521–9536, https://doi.org/10.5194/acp-15-9521-2015, 2015.
Nguyen, T. L., Vereecken, L., and Peeters, J.: HOx regeneration in the oxidation of isoprene III: theoretical study of the key isomerisation of the Z-delta-hydroxy-peroxy isoprene radicals, Chemphyschem, 11, 3996–4001, https://doi.org/10.1002/cphc.201000480, 2010.
Novelli, A., Hens, K., Tatum Ernest, C., Kubistin, D., Regelin, E., Elste, T., Plass-Dülmer, C., Martinez, M., Lelieveld, J., and Harder, H.: Characterisation of an inlet pre-injector laser-induced fluorescence instrument for the measurement of atmospheric hydroxyl radicals, Atmos. Meas. Tech., 7, 3413–3430, https://doi.org/10.5194/amt-7-3413-2014, 2014a.
Novelli, A., Vereecken, L., Lelieveld, J., and Harder, H.: Direct observation of OH formation from stabilised Criegee intermediates, Phys. Chem. Chem. Phys., 16, 19941–19951, https://doi.org/10.1039/c4cp02719a, 2014b.
Novelli, A., Hens, K., Tatum Ernest, C., Martinez, M., Nölscher, A. C., Sinha, V., Paasonen, P., Petäjä, T., Sipilä, M., Elste, T., Plass-Dülmer, C., Phillips, G. J., Kubistin, D., Williams, J., Vereecken, L., Lelieveld, J., and Harder, H.: Estimating the atmospheric concentration of Criegee intermediates and their possible interference in a FAGE-LIF instrument, Atmos. Chem. Phys., 17, 7807–7826, https://doi.org/10.5194/acp-17-7807-2017, 2017.
Novelli, A., Kaminski, M., Rolletter, M., Acir, I.-H., Bohn, B., Dorn, H.-P., Li, X., Lutz, A., Nehr, S., Rohrer, F., Tillmann, R., Wegener, R., Holland, F., Hofzumahaus, A., Kiendler-Scharr, A., Wahner, A., and Fuchs, H.: Evaluation of OH and HO2 concentrations and their budgets during photooxidation of 2-methyl-3-butene-2-ol (MBO) in the atmospheric simulation chamber SAPHIR, Atmos. Chem. Phys., 18, 11409–11422, https://doi.org/10.5194/acp-18-11409-2018, 2018.
Paulot, F., Crounse, J. D., Kjaergaard, H. G., Kurten, A., St Clair, J. M., Seinfeld, J. H., and Wennberg, P. O.: Unexpected epoxide formation in the gas-phase photooxidation of isoprene, Science, 325, 730–733, https://doi.org/10.1126/science.1172910, 2009.
Peeters, J. and Muller, J. F.: HO(x) radical regeneration in isoprene oxidation via peroxy radical isomerisations. II: experimental evidence and global impact, Phys. Chem. Chem. Phys., 12, 14227–14235, https://doi.org/10.1039/c0cp00811g, 2010.
Peeters, J., Nguyen, T. L., and Vereecken, L.: HOx radical regeneration in the oxidation of isoprene, Phys. Chem. Chem. Phys., 11, 5935–5939, https://doi.org/10.1039/b908511d, 2009.
Peeters, J., Muller, J. F., Stavrakou, T., and Nguyen, V. S.: Hydroxyl radical recycling in isoprene oxidation driven by hydrogen bonding and hydrogen tunneling: the upgraded LIM1 mechanism, J. Phys. Chem. A, 118, 8625–8643, https://doi.org/10.1021/jp5033146, 2014.
Praske, E., Crounse, J. D., Bates, K. H., Kurten, T., Kjaergaard, H. G., and Wennberg, P. O.: Atmospheric fate of methyl vinyl ketone: peroxy radical reactions with NO and HO2, J. Phys. Chem. A, 119, 4562–4572, https://doi.org/10.1021/jp5107058, 2015.
Ren, X. R., Harder, H., Martinez, M., Faloona, I. C., Tan, D., Lesher, R. L., Di Carlo, P., Simpas, J. B., and Brune, W. H.: Interference testing for atmospheric HOx measurements by laser-induced fluorescence, J. Atmos. Chem., 47, 169–190, https://doi.org/10.1023/B:Joch.0000021037.46866.81, 2004.
Ren, X. R., Olson, J. R., Crawford, J. H., Brune, W. H., Mao, J. Q., Long, R. B., Chen, Z., Chen, G., Avery, M. A., Sachse, G. W., Barrick, J. D., Diskin, G. S., Huey, L. G., Fried, A., Cohen, R. C., Heikes, B., Wennberg, P. O., Singh, H. B., Blake, D. R., and Shetter, R. E.: HOx chemistry during INTEX-A 2004: Observation, model calculation, and comparison with previous studies, J. Geophys. Res.-Atmos., 113, D05310, https://doi.org/10.1029/2007jd009166, 2008.
Ren, X. R., van Duin, D., Cazorla, M., Chen, S., Mao, J. Q., Zhang, L., Brune, W. H., Flynn, J. H., Grossberg, N., Lefer, B. L., Rappengluck, B., Wong, K. W., Tsai, C., Stutz, J., Dibb, J. E., Jobson, B. T., Luke, W. T., and Kelley, P.: Atmospheric oxidation chemistry and ozone production: Results from SHARP 2009 in Houston, Texas, J. Geophys. Res.-Atmos., 118, 5770–5780, https://doi.org/10.1002/jgrd.50342, 2013.
Rickly, P. and Stevens, P. S.: Measurements of a potential interference with laser-induced fluorescence measurements of ambient OH from the ozonolysis of biogenic alkenes, Atmos. Meas. Tech., 11, 1–16, https://doi.org/10.5194/amt-11-1-2018, 2018.
Sander, S. P., Abbatt, J., Barker, J. R., Burkholder, J. B., Friedl, D. M., Golden, D. M., Huie, R. E., Kolb, C. E., Kurylo, M. J., Moortgat, G. K., Orkin, V. L., and Wine, P. H.: Chemical Kinetics and Photochemical Data for Use in Atmospheric Studies, Evaluation No. 17, 2011.
Sheps, L., Scully, A. M., and Au, K.: UV absorption probing of the conformer-dependent reactivity of a Criegee intermediate CH3CHOO, Phys. Chem. Chem. Phys., 16, 26701–26706, https://doi.org/10.1039/c4cp04408h, 2014.
Shi, Z., Vu, T., Kotthaus, S., Harrison, R. M., Grimmond, S., Yue, S., Zhu, T., Lee, J., Han, Y., Demuzere, M., Dunmore, R. E., Ren, L., Liu, D., Wang, Y., Wild, O., Allan, J., Acton, W. J., Barlow, J., Barratt, B., Beddows, D., Bloss, W. J., Calzolai, G., Carruthers, D., Carslaw, D. C., Chan, Q., Chatzidiakou, L., Chen, Y., Crilley, L., Coe, H., Dai, T., Doherty, R., Duan, F., Fu, P., Ge, B., Ge, M., Guan, D., Hamilton, J. F., He, K., Heal, M., Heard, D., Hewitt, C. N., Hollaway, M., Hu, M., Ji, D., Jiang, X., Jones, R., Kalberer, M., Kelly, F. J., Kramer, L., Langford, B., Lin, C., Lewis, A. C., Li, J., Li, W., Liu, H., Liu, J., Loh, M., Lu, K., Lucarelli, F., Mann, G., McFiggans, G., Miller, M. R., Mills, G., Monk, P., Nemitz, E., O'Connor, F., Ouyang, B., Palmer, P. I., Percival, C., Popoola, O., Reeves, C., Rickard, A. R., Shao, L., Shi, G., Spracklen, D., Stevenson, D., Sun, Y., Sun, Z., Tao, S., Tong, S., Wang, Q., Wang, W., Wang, X., Wang, X., Wang, Z., Wei, L., Whalley, L., Wu, X., Wu, Z., Xie, P., Yang, F., Zhang, Q., Zhang, Y., Zhang, Y., and Zheng, M.: Introduction to the special issue “In-depth study of air pollution sources and processes within Beijing and its surrounding region (APHH-Beijing)”, Atmos. Chem. Phys., 19, 7519–7546, https://doi.org/10.5194/acp-19-7519-2019, 2019.
Smith, S. C., Lee, J. D., Bloss, W. J., Johnson, G. P., Ingham, T., and Heard, D. E.: Concentrations of OH and HO2 radicals during NAMBLEX: measurements and steady state analysis, Atmos. Chem. Phys., 6, 1435–1453, https://doi.org/10.5194/acp-6-1435-2006, 2006.
Stevens, P. S., Mather, J. H., and Brune, W. H.: Measurement of Tropospheric OH and HO2 by Laser-Induced Fluorescence at Low-Pressure, J. Geophys. Res.-Atmos., 99, 3543–3557, https://doi.org/10.1029/93jd03342, 1994.
Stone, D., Evans, M. J., Edwards, P. M., Commane, R., Ingham, T., Rickard, A. R., Brookes, D. M., Hopkins, J., Leigh, R. J., Lewis, A. C., Monks, P. S., Oram, D., Reeves, C. E., Stewart, D., and Heard, D. E.: Isoprene oxidation mechanisms: measurements and modelling of OH and HO2 over a South-East Asian tropical rainforest during the OP3 field campaign, Atmos. Chem. Phys., 11, 6749–6771, https://doi.org/10.5194/acp-11-6749-2011, 2011.
Stone, D., Whalley, L. K., Ingham, T., Edwards, P. M., Cryer, D. R., Brumby, C. A., Seakins, P. W., and Heard, D. E.: Measurement of OH reactivity by laser flash photolysis coupled with laser-induced fluorescence spectroscopy, Atmos. Meas. Tech., 9, 2827–2844, https://doi.org/10.5194/amt-9-2827-2016, 2016.
Taatjes, C. A., Welz, O., Eskola, A. J., Savee, J. D., Scheer, A. M., Shallcross, D. E., Rotavera, B., Lee, E. P., Dyke, J. M., Mok, D. K., Osborn, D. L., and Percival, C. J.: Direct measurements of conformer-dependent reactivity of the Criegee intermediate CH3CHOO, Science, 340, 177–180, https://doi.org/10.1126/science.1234689, 2013.
Tan, Z., Fuchs, H., Lu, K., Hofzumahaus, A., Bohn, B., Broch, S., Dong, H., Gomm, S., Häseler, R., He, L., Holland, F., Li, X., Liu, Y., Lu, S., Rohrer, F., Shao, M., Wang, B., Wang, M., Wu, Y., Zeng, L., Zhang, Y., Wahner, A., and Zhang, Y.: Radical chemistry at a rural site (Wangdu) in the North China Plain: observation and model calculations of OH, HO2 and RO2 radicals, Atmos. Chem. Phys., 17, 663–690, https://doi.org/10.5194/acp-17-663-2017, 2017.
Tan, Z., Rohrer, F., Lu, K., Ma, X., Bohn, B., Broch, S., Dong, H., Fuchs, H., Gkatzelis, G. I., Hofzumahaus, A., Holland, F., Li, X., Liu, Y., Liu, Y., Novelli, A., Shao, M., Wang, H., Wu, Y., Zeng, L., Hu, M., Kiendler-Scharr, A., Wahner, A., and Zhang, Y.: Wintertime photochemistry in Beijing: observations of ROx radical concentrations in the North China Plain during the BEST-ONE campaign, Atmos. Chem. Phys., 18, 12391–12411, https://doi.org/10.5194/acp-18-12391-2018, 2018.
Tan, Z., Lu, K., Hofzumahaus, A., Fuchs, H., Bohn, B., Holland, F., Liu, Y., Rohrer, F., Shao, M., Sun, K., Wu, Y., Zeng, L., Zhang, Y., Zou, Q., Kiendler-Scharr, A., Wahner, A., and Zhang, Y.: Experimental budgets of OH, HO2, and RO2 radicals and implications for ozone formation in the Pearl River Delta in China 2014, Atmos. Chem. Phys., 19, 7129–7150, https://doi.org/10.5194/acp-19-7129-2019, 2019.
Teng, A. P., Crounse, J. D., and Wennberg, P. O.: Isoprene Peroxy Radical Dynamics, J. Am. Chem. Soc., 139, 5367–5377, https://doi.org/10.1021/jacs.6b12838, 2017.
Tsiligiannis, E., Hammes, J., Salvador, C. M., Mentel, T. F., and Hallquist, M.: Effect of NOx on 1,3,5-trimethylbenzene (TMB) oxidation product distribution and particle formation, Atmos. Chem. Phys., 19, 15073–15086, https://doi.org/10.5194/acp-19-15073-2019, 2019.
Wang, S., Wu, R., Berndt, T., Ehn, M., and Wang, L.: Formation of Highly Oxidized Radicals and Multifunctional Products from the Atmospheric Oxidation of Alkylbenzenes, Environ. Sci. Technol., 51, 8442–8449, https://doi.org/10.1021/acs.est.7b02374, 2017.
Welz, O., Savee, J. D., Osborn, D. L., Vasu, S. S., Percival, C. J., Shallcross, D. E., and Taatjes, C. A.: Direct kinetic measurements of Criegee intermediate (CH2OO) formed by reaction of CH2I with O2, Science, 335, 204–207, https://doi.org/10.1126/science.1213229, 2012.
Welz, O., Eskola, A. J., Sheps, L., Rotavera, B., Savee, J. D., Scheer, A. M., Osborn, D. L., Lowe, D., Murray Booth, A., Xiao, P., Anwar, H. K. M., Percival, C. J., Shallcross, D. E., and Taatjes, C. A.: Rate coefficients of C(1) and C(2) Criegee intermediate reactions with formic and acetic Acid near the collision limit: direct kinetics measurements and atmospheric implications, Angew. Chem. Int. Edit., 53, 4547–4550, https://doi.org/10.1002/anie.201400964, 2014.
Whalley, L. K., Furneaux, K. L., Goddard, A., Lee, J. D., Mahajan, A., Oetjen, H., Read, K. A., Kaaden, N., Carpenter, L. J., Lewis, A. C., Plane, J. M. C., Saltzman, E. S., Wiedensohler, A., and Heard, D. E.: The chemistry of OH and HO2 radicals in the boundary layer over the tropical Atlantic Ocean, Atmos. Chem. Phys., 10, 1555–1576, https://doi.org/10.5194/acp-10-1555-2010, 2010.
Whalley, L. K., Edwards, P. M., Furneaux, K. L., Goddard, A., Ingham, T., Evans, M. J., Stone, D., Hopkins, J. R., Jones, C. E., Karunaharan, A., Lee, J. D., Lewis, A. C., Monks, P. S., Moller, S. J., and Heard, D. E.: Quantifying the magnitude of a missing hydroxyl radical source in a tropical rainforest, Atmos. Chem. Phys., 11, 7223–7233, https://doi.org/10.5194/acp-11-7223-2011, 2011.
Whalley, L. K., Blitz, M. A., Desservettaz, M., Seakins, P. W., and Heard, D. E.: Reporting the sensitivity of laser-induced fluorescence instruments used for HO2 detection to an interference from RO2 radicals and introducing a novel approach that enables HO2 and certain RO2 types to be selectively measured, Atmos. Meas. Tech., 6, 3425–3440, https://doi.org/10.5194/amt-6-3425-2013, 2013.
Whalley, L. K., Stone, D., Bandy, B., Dunmore, R., Hamilton, J. F., Hopkins, J., Lee, J. D., Lewis, A. C., and Heard, D. E.: Atmospheric OH reactivity in central London: observations, model predictions and estimates of in situ ozone production, Atmos. Chem. Phys., 16, 2109–2122, https://doi.org/10.5194/acp-16-2109-2016, 2016.
Whalley, L. K., Stone, D., Dunmore, R., Hamilton, J., Hopkins, J. R., Lee, J. D., Lewis, A. C., Williams, P., Kleffmann, J., Laufs, S., Woodward-Massey, R., and Heard, D. E.: Understanding in situ ozone production in the summertime through radical observations and modelling studies during the Clean air for London project (ClearfLo), Atmos. Chem. Phys., 18, 2547–2571, https://doi.org/10.5194/acp-18-2547-2018, 2018.
Winiberg, F. A. F., Smith, S. C., Bejan, I., Brumby, C. A., Ingham, T., Malkin, T. L., Orr, S. C., Heard, D. E., and Seakins, P. W.: Pressure-dependent calibration of the OH and HO2 channels of a FAGE HOx instrument using the Highly Instrumented Reactor for Atmospheric Chemistry (HIRAC), Atmos. Meas. Tech., 8, 523–540, https://doi.org/10.5194/amt-8-523-2015, 2015.
Wolfe, G. M., Thornton, J. A., Bouvier-Brown, N. C., Goldstein, A. H., Park, J.-H., McKay, M., Matross, D. M., Mao, J., Brune, W. H., LaFranchi, B. W., Browne, E. C., Min, K.-E., Wooldridge, P. J., Cohen, R. C., Crounse, J. D., Faloona, I. C., Gilman, J. B., Kuster, W. C., de Gouw, J. A., Huisman, A., and Keutsch, F. N.: The Chemistry of Atmosphere-Forest Exchange (CAFE) Model – Part 2: Application to BEARPEX-2007 observations, Atmos. Chem. Phys., 11, 1269–1294, https://doi.org/10.5194/acp-11-1269-2011, 2011.
Wolfe, G. M., Crounse, J. D., Parrish, J. D., St Clair, J. M., Beaver, M. R., Paulot, F., Yoon, T. P., Wennberg, P. O., and Keutsch, F. N.: Photolysis, OH reactivity and ozone reactivity of a proxy for isoprene-derived hydroperoxyenals (HPALDs), Phys. Chem. Chem. Phys., 14, 7276–7286, https://doi.org/10.1039/c2cp40388a, 2012.