the Creative Commons Attribution 4.0 License.
the Creative Commons Attribution 4.0 License.
 | 03 Jul 2020
Optimisation of a thermal desorption–gas chromatography–mass spectrometry method for the analysis of monoterpenes, sesquiterpenes and diterpenes
Aku Helin
Hannele Hakola
Heidi Hellén
In this study, a thermal desorption–gas chromatography–mass spectrometry (TD–GC–MS) method following sorbent tube sampling was developed for the determination of monoterpenes (MTs), sesquiterpenes (SQTs) and diterpenes (DTs) in gas-phase samples. The analytical figures of merit were determined, and the method performance was tested by conducting experiments related to, for example, sampling recovery, storage stability and ozone reactivity. The limit-of-quantification values were 13–518 pg (0.5–9.3 pptv), intermediate precision was in the range of 3 %–10 % and the expanded measurement uncertainty was in the range of 16 %–55 % for terpenes. The sampling recoveries of terpenes were approximately within 100±20 % with different inlet lines (15 m long Teflon and 1 m long heated stainless steel) and branch enclosure cuvette (6 L Teflon bag) tested. Ozone is an important factor causing losses of the studied compounds during sampling. Therefore, losses of terpenes upon ozone exposure were studied and the reaction rate coefficients were estimated. The ozone reaction rate coefficient () of ent-kaurene was experimentally estimated to be 2 orders of magnitude greater than the respective literature value, demonstrating the potential underestimation of DT contribution to atmospheric reactivity. The preliminary comparison between offline- and online-mode TD–GC–MS sampling and analysis revealed that diterpenes and oxygenated sesquiterpenes are lost in excessive amounts in online-mode sampling, hindering the online-mode applicability for the quantitative analysis of these compounds. A few applications to real samples were tested to identify DTs potentially emitted by boreal forest tree species. In dynamic headspace samples of pine needles and spruce twigs heated to 60 ∘C, five DTs and 13 DTs could be detected in emissions, respectively. The semi-quantitatively estimated emission rates of DTs were roughly 1 to 3 orders of magnitude lower than those of MTs and SQTs. Similarly, in spruce branch enclosure emissions from a living tree, six DTs were detected once the enclosure was heated to ca. 60 ∘C. In summary, the developed analytical procedure was demonstrated to be applicable for the analysis of MTs, SQTs and DTs. In addition, DTs could be detected in needles, twigs and branch enclosure emissions; however, high temperatures were required to promote the emissions and for obtaining detectable concentrations.
- Article
(7338 KB) - Full-text XML
-
Supplement
(4092 KB) - BibTeX
- EndNote


Biogenic volatile organic compounds (BVOCs) are directly emitted from the biosphere into the atmosphere. Globally, BVOC emissions are estimated to reach ca. 760 Tg (C) yr−1 and chemically consist mainly of isoprene, monoterpenes (MTs, C10), sesquiterpenes (SQTs, C15), methanol and acetone (Guenther et al., 1995, 2012; Sindelarova et al., 2014). Most of the emitted BVOCs have high reactivity in the atmosphere and their lifetimes vary from minutes to hours (Atkinson and Arey, 2003). Therefore, they strongly affect the oxidative capacity of the atmosphere both regionally and globally. In the reactions, BVOCs form less volatile compounds and participate in secondary organic aerosol (SOA) formation, thus also affecting Earth's radiative budget (Ehn et al., 2014; Hoffmann et al., 1997; Jimenez et al., 2009).
During the last decade, a new technique to measure atmospheric total hydroxyl (OH) radical reactivity has been introduced to indirectly study the volatile organic compound (VOC) content of the atmospheric air (Sinha et al., 2008; Yang et al., 2016). By measuring how many OH radicals are consumed in the reactions and by comparing this amount with the known amount of VOCs obtained from chemical composition measurements, it can be evaluated how many unknown reactive compounds there are in the atmosphere. Several studies have shown that the gap between known and unknown compounds can be fairly large (Yang et al., 2016); for example, in boreal forest the missing fraction is approximately 50 % to 90 % (Nölscher et al., 2012; Praplan et al., 2019; Sinha et al., 2010). Therefore, there is a need to identify compounds responsible for this missing atmospheric OH reactivity.
Terpenoids, mostly isoprene and MTs, have been studied quite intensively during past decades in boreal forest areas (Eerdekens et al., 2009; Hakola et al., 1998, 2003, 2009; Kontkanen et al., 2016; Rinne et al., 2007; Vanhatalo et al., 2018). While there are also studies on SQTs (Hakola et al., 2001, 2006, 2017; Hellén et al., 2018; van Meeningen et al., 2017; Yassaa et al., 2012), no atmospheric observations of diterpenes (DTs, C20) yet exist in the boreal forest areas. However, DTs have been found in essential oils of some boreal forest tree species (Judžentienė et al., 2006; Kanerva et al., 2008; Kupcinskiene et al., 2008; Tumen et al., 2010). For example, in Scots pine needles grown in northern Europe the DTs comprised 6 %–14 % of the essential oil content (Judzentiene and Kupcinskiene, 2008). Even though diterpenes have not been detected (or specifically studied) in boreal forest air, they have been recently observed in atmospheric air and branch enclosure emissions in other environments (Chan et al., 2016; Haberstroh et al., 2018; Li et al., 2020; Matsunaga et al., 2012; Yáñez-Serrano et al., 2018; Yee et al., 2018). For example, at a rural site in Brazil the mean concentrations of DTs in air varied between 10 and 86 ppqv (Yee et al., 2018), and in a Mediterranean gum rockrose enclosure the emission rates of DTs were in the range of – µg g−1 h−1 (Haberstroh et al., 2018). Therefore, it could be that DTs are one of the compounds included in the missing OH reactivity group. In addition, DTs are potentially contributing in secondary organic aerosol formation (Yee et al., 2018).
Diterpenes have fairly low vapour pressures and they can be categorised as semi-volatile or low-volatility organic compounds. The determination of DTs in atmospheric gas-phase samples can be challenging due to their low volatility and high reactivity, which might cause sampling line losses and emphasise the need for high-sensitivity detection methods (Yáñez-Serrano et al., 2018; Yee et al., 2018). In previous atmospheric studies, DTs and their derivatives have been analysed by using either conventional chromatographic techniques or online mass spectrometric techniques (such as proton-transfer-reaction mass spectrometry) (Chan et al., 2016; Haberstroh et al., 2018; Li et al., 2020; Matsunaga et al., 2012; Yáñez-Serrano et al., 2018; Yee et al., 2018). Many of those chromatographic studies targeting DTs used traditional sorbent tubes for sampling prior to thermal desorption (or solvent desorption)–gas chromatography–mass spectrometry (TD–GC–MS) analysis (Haberstroh et al., 2018; Matsunaga et al., 2012; Yáñez-Serrano et al., 2018). In general, previously the offline (and online) TD–GC–MS technique was mainly used for the analysis of MTs and SQTs (e.g. Hellén et al., 2018; Mermet et al., 2019; Pankow et al., 2012), but the above-mentioned branch enclosure and ambient air studies indicate that this analytical technique is also applicable for the analysis of DTs (Haberstroh et al., 2018; Matsunaga et al., 2012; Yáñez-Serrano et al., 2018). Unfortunately, most of those studies did not present any detailed method-descriptive performance parameters for DTs (e.g. detection limits, reproducibility, selectivity or sampling recovery), making it difficult to critically evaluate the suitability of the analytical procedures for the analysis of low-volatility DTs (Haberstroh et al., 2018; Matsunaga et al., 2012; Yáñez-Serrano et al., 2018). In general, sorbent tube sampling followed by TD–GC–MS analysis methods has been demonstrated to be suitable for the analysis of MTs; however, there is very little detailed information about the suitability for the analysis of SQTs (Bouvier-Brown et al., 2009; Helmig et al., 2004; Jones et al., 2014; Mermet et al., 2019; Pankow et al., 2012), and data related to DTs are currently lacking.
In this study, sorbent tube sampling followed by TD–GC–MS analysis for the determination of MTs, SQTs and especially DTs in gas-phase samples was developed and evaluated. The TD–GC–MS method was partially incorporated from our group's previous studies (see e.g. Hellén et al., 2018) and modified accordingly to fit the needs for the analysis of low-volatility diterpenes. In principle, similar analytical procedures have been used previously in both ambient air and enclosure emission studies for the analysis of relatively volatile and semi-volatile MTs and SQTs in multiple field campaigns (Aaltonen et al., 2011; Hellén et al., 2018; Joensuu et al., 2016; Mäki et al., 2017; Vanhatalo et al., 2018). In this work, we build on our previous knowledge of the TD–GC–MS technique and developed our core TD–GC–MS method further to allow the analysis of the fairly low-volatility DTs. In this study, the method development and applicability-related experiments done in view of the analysis of DTs included, for example, desorption efficiency, sampling recovery, stability tests, comparison of online and offline sampling modes, and ozone reactivity tests. The method analytical figures of merit were also determined, including the quantification limits, intermediate precisions and measurement uncertainties for the terpenes. In addition, qualitative and semi-quantitative experiments were conducted in laboratory and in field conditions to characterise the DTs potentially emitted by boreal forest tree species.
Table 1List of analytes, corresponding retention indices (RIs) and analytical figures of merit.
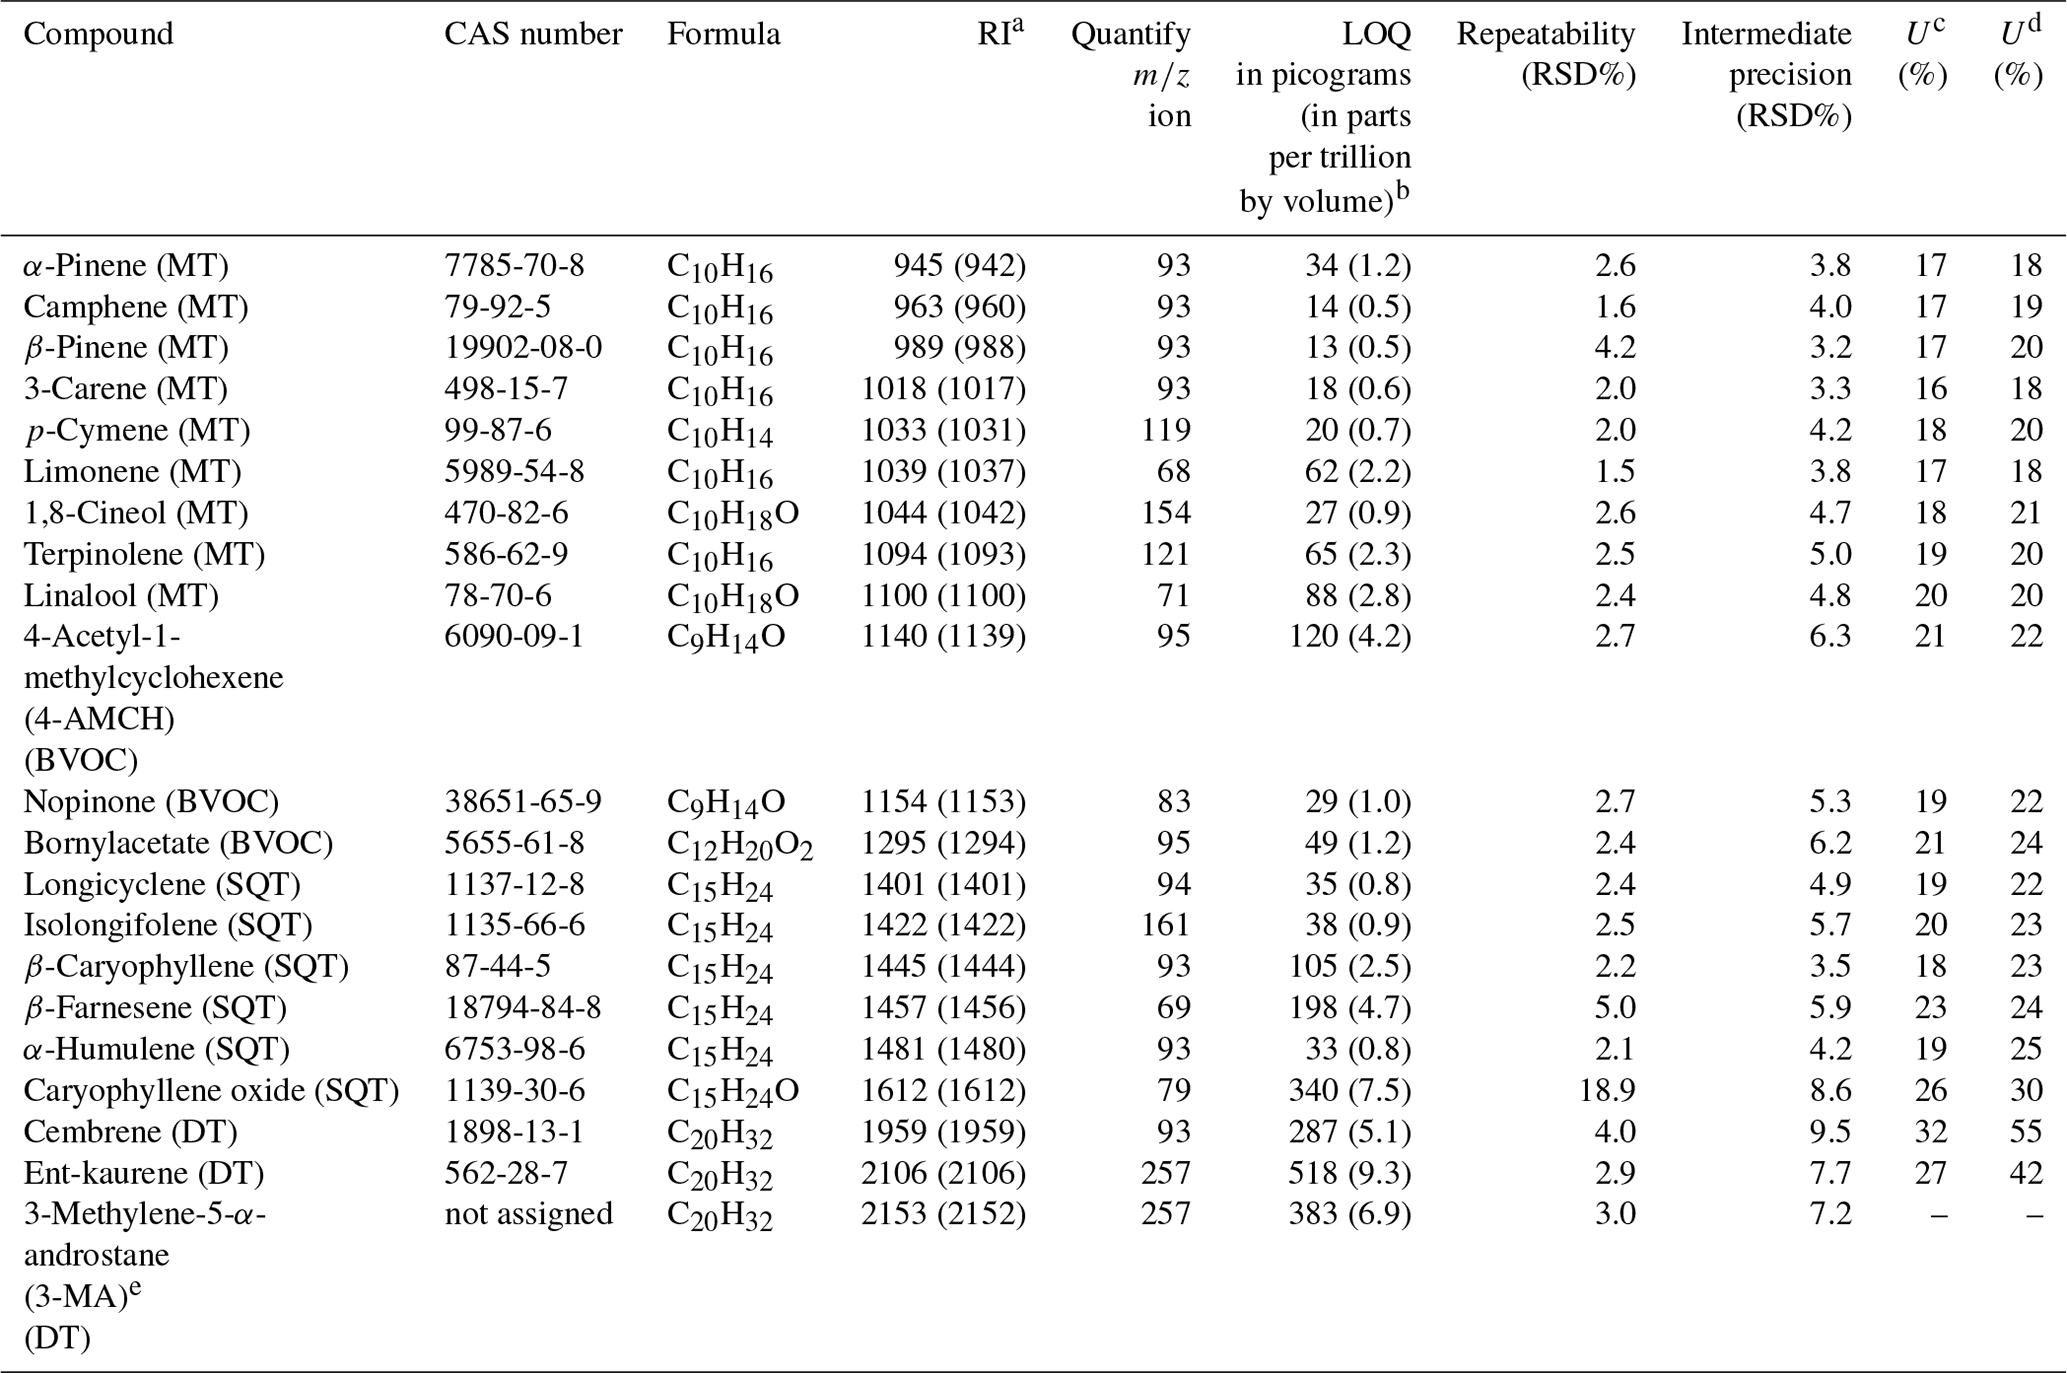
a RI as Kovats indices (and arithmetic indices in brackets). b LOQ in parts per trillion by volume calculated by using sample volume of 5 L (at T=298 K and p=1 atm). c U (%) for ambient air application. d U (%) for branch enclosure emissions application. e The purity of this crude standard was set to 100 % (allowing the determination of LOQ, but unknown uncertainty).
2.1 Chemicals and materials
Detailed information on chemicals is presented in the Supplement Table S1. The standard analytes list is presented in Table 1. The analyte included nine MTs (both hydrocarbon and oxygenated MTs), six SQTs (both hydrocarbon and oxygenated SQTs), three diterpenes (all hydrocarbon DTs) and three other compounds that were categorised here as BVOCs. Unfortunately, only three commercially available DTs were obtained for this study and only two of these were analytically valid in terms of purity and traceability (Tables 1 and S1). The current supply situation of DTs is not optimal for the purpose of comprehensive method development; however, together with the results of MTs and SQTs to compare to, valuable information was expected be obtained even with only a few DTs included as analytes.
Primary standard mix solutions of the target compounds were prepared by weighting and diluting the pure compounds in methanol. The analyte concentrations in primary solution were in the range of 40–200 mg L−1 depending on the compound. Six calibration standard solutions were prepared by pipetting the appropriate amount of primary solution and diluting with methanol. The standard solution concentrations ranged from 40–200 µg L−1 (lowest standard) to 8000–40 000 µg L−1 (highest standard). The primary and standard solutions were stored in the dark at 4 ∘C.
The stainless-steel multiphase adsorbent (Tenax TA/Carbopack B) tubes (o.d. 1∕4 in. × 3 1∕2 in.) used in this study were either purchased directly from PerkinElmer Inc. (Waltham, MA, USA) or prepared manually in the laboratory. The in-house packed sorbent tubes were prepared by packing empty stainless-steel tubes (PerkinElmer Inc., Waltham, MA, USA) with Tenax TA (60–80 mesh) and Carbopack B (60–80 mesh), both materials purchased from Sigma-Aldrich (St. Louis, MO, USA). Silanised glass wool (Phase Separations Ltd., Deeside, UK), stainless-steel mesh (Markes International, Llantrisant, UK) and gauze-retaining spring (Markes International, Llantrisant, UK) were used to prevent sorbent phase mixing and exiting. The adsorbent tubes were preconditioned at 300 ∘C for 150 min under helium flow. Prior to each use, the sorbent tubes were always conditioned for a minimum of 10 min at 300 ∘C. With these sorbent tubes, the sampling flow rate used throughout this study was typically 80–100 mL min−1. The commercially and in-house-prepared tubes were used collectively and randomly in this work.
The sorbent tubes were also used for TD–GC–MS calibration. Calibration tubes were prepared by injecting 5 µL of individual standard solution into the tube and simultaneously applying 80 mL min−1 flow of nitrogen (≥99.9999 % AGA, Espoo, Finland). The tubes were purged for 10 min in order to evaporate the excess methanol (Hakola et al., 2003). The calibration concentration ranges were 0.2–55.8 ng for MTs, 0.2–61.2 ng for SQTs, 0.4–200 ng for DTs and 0.2–43.2 ng for other BVOCs (expressed as absolute amount (ng) in the sorbent tube).
2.2 Thermal desorption–gas chromatography–mass spectrometry
As mentioned before in the Introduction, the TD–GC–MS method used here was partially applied from a previously developed and validated in-house method that has been used in our group's previous studies for the analysis of MTs and SQTs (see e.g. Hellén et al., 2012, 2018). In this current work, the analytical GC column stationary phase (nonpolar 1,4-bis(dimethylsiloxy)phenylene polydimethylsiloxane) film thickness was decreased from a previously used thick phase 1.0 µm column to a 0.25 µm column as a compromise to maintain proper selectivity between the terpenes and to elute the DTs in reasonable time (chromatograms presented later on). It was expected that the DTs might retain too strongly in the 1.0 µm film thickness column and that the column bleed could become a problem in long-term use since high temperatures are required to elute the DTs. Thus, the analytical column was replaced, the GC oven temperature programme was modified, and the MS scan settings were updated and modified. For the most part, the TD unit parameters were kept as in the previously optimised in-house method; however, the desorption efficiency was separately tested and verified in this work.
The analyses were performed by using two different thermal desorption–gas chromatography–mass spectrometry (TD–GC–MS) instruments, which are identified and abbreviated hereafter as TD–GC–MS1 and TD–GC–MS2. Most of the analytical method development and performance tests were conducted with TD–GC–MS1, whereas TD–GC–MS2 was used mainly for real sample applications. The details of both instruments and methods are presented in Table S2 and mentioned here briefly. The TD–GC–MS1 consisted of an automatic TD unit (TurboMatrix 350) connected to a GC instrument (Clarus 680) coupled to a quadrupole MS instrument (Clarus SQ 8 T), all units purchased from PerkinElmer Inc. (Waltham, MA, USA). The cold trap in the TD and column in the GC instruments were Tenax TA/Carbopack B and Elite-5MS (60 m×0.25 mm (i.d.), film thickness 0.25 µm), respectively (both from PerkinElmer Inc., Waltham, MA, USA). The TD–GC–MS2 consisted of an automatic TD unit (TurboMatrix 650) connected to a GC instrument (Clarus 600) coupled to a quadrupole MS instrument (Clarus 600 T), all purchased from PerkinElmer Inc. (Waltham, MA, USA). In this TD–GC–MS2, the cold trap in the TD and column in the GC instruments were Tenax TA (PerkinElmer Inc., Waltham, MA, USA) and DB-5MS (50 m×0.25 mm (i.d.), film thickness 0.25 µm, from Agilent Technologies, Palo Alto, CA, USA), respectively. The main differences in these TD–GC–MS instruments were the models of units, different cold traps and columns (same stationary phases, but 10 m shorter column in TD–GC–MS2) installed. Also, the TD–GC–MS1 has an online sampling feature in the TD unit (discussed later on), whereas the TD–GC–MS2 can be used only for offline sorbent tube analysis.
With both instruments, the optimised offline TD–GC–MS analysis was performed fundamentally in a similar manner, although the duration of different steps differed slightly (for details, see Table S2). Briefly, the sorbent tube was first dry purged in the TD unit for either 1 min or 5 min at room temperature at a flow rate of 50 mL min−1 of helium (≥99.9996 %, AGA, Espoo, Finland). In the primary desorption, the sorbent tube was desorbed for 5 min at 300 ∘C at a flow rate of 50 mL min−1 of helium. The desorbed compounds were trapped into a cold trap held at 20 ∘C during the primary desorption. Then, in the secondary desorption, the cold trap was rapidly heated to 300 ∘C and held for either 1 or 5 min. The helium flow rate during the cold trap desorption was either 10 or 30 mL min−1, of which 1 mL min−1 was entering the GC column and the rest was passed to the outlet split. The temperature of the heated valve in the TD was 220 ∘C. The heated line temperature between the TD and GC instruments was set to 200 ∘C. With TD–GC–MS1, the oven temperature programme was as follows: 60 ∘C (held for 2 min), then 300 ∘C at 8 ∘C min−1 and 300 ∘C (held for 15 min). With the TD–GC–MS2, the oven temperature programme was otherwise similar to that with TD–GC–MS1, except the final step of 300 ∘C was held only for 3 min. The flow rate of helium carrier gas into the analytical column was 1.0 mL min−1 with both instruments. The GC–MS transfer line temperature was 220 ∘C with both TD–GC–MS instruments. In the MS unit, electron ionisation at 70 eV was used. A total ion chromatogram (TIC) was scanned in the m∕z range 50–350, and selected ion recording (SIR) time windows with quantifier and qualifier ions were applied for the target analytes. The selected quantification m∕z ions were typically base peaks or molecular ion peaks (Table 1).
2.3 Method development and experiments
2.3.1 Desorption efficiency
Desorption efficiency was tested by doing two consecutive desorptions from the same sorbent tube loaded with analytes (c=40–200 ng). Triplicate measurements were done. Desorption efficiency was calculated by dividing the amount detected in the first desorption by the total amount detected in both desorption cycles.
2.3.2 Stability in storage
The stability of the analytes in the sorbent tube (c=40–200 ng) was evaluated by storing the tubes (n=2–6) sealed with brass Swagelok caps and PTFE ferrules at 4 ∘C in the dark for ca. 1 week (5 d), 1 month (32–33 d) and 2 months (62 d). The stability after storage was compared to sorbent tubes analysed immediately after standard preparation.
2.3.3 Sampling recovery
The inlet sampling line recovery tests were done by using two different commonly used inlets and at two different relative humidity (RH) levels. The inlet recovery experiments were done in a similar manner as Hellén et al. (2012). The schematic illustrations of the setups used in the experiments are presented in Fig. S1 in the Supplement. Briefly, analyte solution was injected into a zero-air stream via a heated (ca. 60±5 ∘C) Teflon PTFE T-piece by using an automatic syringe pump (at injection flow rate of 15 µL h−1). The zero air was produced either by using a zero air generator (HPZA-7000, Parker Balston, Lancaster, NY, USA) or by passing laboratory room air through a carbon cartridge (100 g active carbon from Pall Life Sciences, Ann Arbor, MI, USA). The main flow rate was 0.8–1.0 L min−1. The volatilised analytes passed through a 4 m long Teflon fluorinated ethylene propylene (FEP) tubing (i.d. 1∕8 in.), which was used as a mixing line, after which the first sorbent tube sample was taken. The second sorbent tube sample was taken after the inlet line under investigation. Inlet line recovery was calculated simply by the relationship of analytes found in the second tube divided by the amounts in the first tube.
The inlets tested were a 15 m long Teflon FEP tubing (i.d. 1∕8 in.) and a 1 m long heated stainless-steel (grade 304) tube (i.d. 1∕16 in., heated to ca. 150 ∘C), of which the latter is normally used for ozone removal purposes (Hellén et al., 2012). Both inlet lines tested here are typically used in BVOC studies (Hakola et al., 2017; Hellén et al., 2018). The RH levels were controlled to close to 0 % and 100 % to cover the extremes, but in reality these were roughly 13±5 % (RH =0 %) and 87±6 % (RH =100 %). The RH was measured with a Vaisala HMI 33 device (probe HMP 35, Vaisala, Helsinki, Finland). All experiments were performed at room temperature ( ∘C).
In addition to inlet sampling line recoveries, an enclosure cuvette recovery was tentatively tested. The cuvette was a ca. 6.2 L bag made of Teflon FEP (wall thickness 50 µm); a similar cuvette was used previously in branch enclosure studies (Hakola et al., 2017). The cuvette recovery was tested in a similar manner as the inlet line recovery: the first sorbent tube was placed at the inlet end of the cuvette and the second tube at the outlet end of the cuvette (Fig. S1c). Three different flow rate combinations were tested: 1.0, 2.0 and 6.7 L min−1 at the inlet end and 0.7, 1.7 and 6.4 L min−1 at the outlet end of the cuvette, respectively. The cuvette bag was not airtight, so excess flow leaked out freely.
2.3.4 Comparison between online- and offline-mode sampling
As mentioned earlier, the TD–GC–MS1 has an online sampling feature in the TD unit. In online sampling mode, the air sample is drawn through an empty tube onto the cold trap where the analytes are trapped and preconcentrated. This online-mode sampling feature has been used previously in field studies for the analysis of MTs and SQTs, e.g. in Hellén et al. (2018). The online sampling mode was compared to the offline sampling mode with the TD–GC–MS1. A known amount of standard solution was injected into a 1.0 L min−1 flow rate of the zero-air stream. After a ca. 4 m long Teflon FEP mixing line, both the offline sorbent tube sample (at 100 mL min−1) and the online sample (at 40 mL min−1) were taken concurrently (for 30 min) as illustrated in Fig. S2. A more detailed explanation of the experiments is presented later on.
2.3.5 Analytical figures of merit
The limit-of-quantification (LOQ) values for the TD–GC–MS method were determined by analysing multiple blank sorbent tubes (n=10). The LOQ was calculated following Eq. (1):
where A is the average peak area and SD is the standard deviation. Repeatability was calculated by analysing standard samples (n=6) during 1 d, and intermediate precision (or reproducibility within-laboratory) was obtained from analysing standard samples (n=22) during a 4.5-month period (c=10–50 ng in sorbent tube). The expanded measurement uncertainty (U) was estimated from partial uncertainties by following ACTRIS (Aerosol Clouds Trace gases Research InfraStructure) guidelines (ACTRIS, 2018). The U (%) was estimated for two analytical procedures: (i) offline sorbent tube sampling of ambient air followed by TD–GC–MS analysis and (ii) offline sorbent tube sampling of emissions from a branch enclosure cuvette followed by TD–GC–MS analysis. The intermediate precision and recovery experiment results were included in the calculations of U. In the ambient air sampling procedure, the ozone removal inlet recovery results were used in the calculations, whereas in the branch enclosure emissions procedure the cuvette recovery results were used in the calculations. A more detailed description of the uncertainty calculations can be found in Supplement Sect. S1.
2.3.6 Ozone reactivity tests
It is well-known that compounds can be lost during sampling due to reactions with ozone. Since some terpenes are highly reactive towards ozone and the ozone reaction rate coefficients () of diterpenes are uncertain (Haberstroh et al., 2018; Yáñez-Serrano et al., 2018; Yee et al., 2018), experiments focusing on analyte stability upon ozone exposure were conducted. The sorbent tube was loaded with a known amount of analytes (c=40–200 ng), and the tube was flushed with either 0 or 40 ppb of ozone during different times (from 0 to 240 min at 100 mL min−1 flow rate). The total purge volume of the sorbent tube was 0–24 L. The ozone concentration of 40 ppb was selected since it represents a typical upper concentration level in background air in southern Finland (Anttila and Tuovinen, 2010). Ozone was produced by using an ozone generator (model 49C O3 Calibrator, Thermo Environmental Instruments Inc., Franklin, MA, USA). The schematic illustration of the setup is presented in Fig. S3.
2.4 Applications to real samples
Two types of real sample applications were selected in order to test the analytical method performance, to identify compounds emitted by boreal forest tree species and to quantify the emissions from a branch enclosure. The first sample application was a dynamic headspace sampling of compounds emitted by needles/twigs in a closed chamber upon heating, and the second sample application was a study of emissions from a branch enclosure in field conditions. The main emphasis on real sample applications was set on the identification and study of DTs, although MTs and SQTs were also monitored. Based on previous studies, it was considered that since the DTs seem to be emitted from plant storage pools and since temperature has been shown to be a driving force for DT emissions (Haberstroh et al., 2018; Matsunaga et al., 2012; Yáñez-Serrano et al., 2018), heating of the plant materials would be an efficient way for releasing the DTs into the gas phase. Thus, the studied plant material samples were firstly heated to temperatures ranging from 30 to up to 70 ∘C in order to obtain presumably detectable amounts of DTs to allow their identification and quantification.
Pine (Pinus sylvestris) needles and spruce (Picea abies) twigs were collected during early September 2018 in a boreal forest at the SMEAR II station (Station for Measuring Forest Ecosystem-Atmosphere Relations) in Hyytiälä, Finland (Hari and Kulmala, 2005). These plant material samples were qualitatively and semi-quantitatively analysed for diterpene content. The samples were stored in the dark at −18 ∘C for a maximum of 2 months prior to analysis. In a set of experiments, approximately 5–7 g of frozen pine needles or small spruce twigs was placed inside a screw-capped 500 mL Duran bottle. The bottle was equilibrated at room temperature for 30 min prior to starting headspace purge-and-trap extraction experiments. The flow in and out of the chamber were set to 200 and 100 mL min−1, respectively. During the dynamic sampling, the bottle was placed inside an oven and heated in 5–10 ∘C steps from room temperature to up to 70 ∘C. The sorbent tube samples were collected outside the oven at room temperature for 20 min (sampling volume 2 L). The schematic illustration of the setup is presented in Fig. S4. The dry weight of the sample needles was 1.66–2.70 g (drying at 70 ∘C for 24–48 h). These samples were analysed with emphasis solely on the identification of DTs. Blank samples (empty chamber heated) were collected prior to experiments.
Branch enclosure emissions were studied on-site at the SMEAR II station as a proof-of-concept type of experiment on two different days (i.e. to test and to demonstrate that the analytical procedure is suitable for the purpose it was intended for). Spruce (Picea abies) branch with needles was placed inside a ca. 1.2 L Teflon bag cuvette, which was connected to a fixed plate with inlet and outlet ports. The incoming air (at a flow rate of 8.2 L min−1) was purified with a high-capacity gas purifier (Supelco, Bellefonte, PA, USA) and passed through a ca. 1 m long copper tube (o.d. 12 mm) wrapped with a heating wire and insulator cover (copper tubing was used for improving heat transfer). The incoming air was heated to increase the cuvette inside temperature in order to promote the emissions of DTs. A data logger with a temperature sensor was used for monitoring the cuvette inside temperature. The cuvette was additionally covered with aluminium foil for further insulation in order to achieve sufficiently high temperatures. The cuvette inside temperature ranged from 14 to 61 ∘C and the heating gradients are presented in Fig. S5. Sorbent tube samples were collected either directly from the outlet port of the cuvette or from a bypass flow (outlet flow rate 1.0 L min−1). The schematic illustration of the setup is presented in Fig. S6. The branch enclosure experiment sampling dates were 6 and 10 August 2019. On the former date, the samples were collected from a bypass flow and on the latter day directly from the cuvette outlet port. The branch was cut immediately after the sampling was completed; thus, it is plausible that the tree was under stress on the latter day experiments. The dry weight of the needles was 6.35–6.75 g (drying at 70 ∘C for 24–48 h). Blank samples (empty cuvette heated) were collected prior to the experiment.
2.5 Chromatographic data analysis
The non-target compounds in real sample applications were tentatively identified based on both retention index (RI) values and mass spectra comparison to the NIST mass spectral library and/or Adams (2007) library. The n-alkane-based RI values were calculated based on both the Kovats index (KI) and arithmetic index (AI) as shown in Adams (2007). If an unknown compound could not be tentatively identified (either too high RI difference or not adequately matching mass spectra), a proposed compound formula was deduced based on the mass spectra. The non-target compounds that were either tentatively identified or assigned with a formula were then categorised as MTs, SQT and DTs when applicable; the others were categorised as BVOCs. For example, if the non-target compound had the characteristic m∕z 272, 257, 243 and 229 ions of DTs and the RI value was representative of DTs (Adams, 2007), the compound was assigned in this study to the plausible DT category. A similar identification procedure of non-target compounds has also been used in previous BVOC studies (e.g. Chan et al., 2016; Hellén et al., 2018; Kännaste et al., 2013; Yee et al., 2018). The compounds were marked here as tentatively identified since authentic standards were not available; thus the final verification is lacking. The analysed blank samples were used to exclude possible contaminant peaks.
The non-target compounds detected in real samples were quantified by using a compound from the standard analytes list (α-pinene, limonene or linalool were used for MTs and for close eluting BVOCs, β-caryophyllene or caryophyllene oxide for SQTs and for close eluting BVOCs, and cembrene or ent-kaurene for DTs and close eluting BVOCs). Since the non-target compounds were quantified in this manner, the mass concentration results are merely semi-quantitative. A signal-to-noise (S ∕ N) ratio of 10 criteria was used in non-target compound quantification. A similar quantification procedure for non-target compounds has also been used in previous BVOC studies (e.g. Bouvier-Brown et al., 2009; Haberstroh et al., 2018; Hellén et al., 2018).
Emission rate (E) was calculated by using Eq. (2):
where Cout is the concentration in the outlet flow, Cin is the concentration in the inlet flow, F is the flow rate into the cuvette and m is the dry weight of the needles (Ortega and Helmig, 2008). In both real sample applications, the Cin was negligible (or < LOQ) for all compounds and was subsequently set to zero in the calculations. No blank subtraction was needed in the calculations since most analytes were absent in blank samples.
The first part of this section covers the TD–GC–MS performance evaluation experiments, and in the latter part the qualitative and semi-quantitative results from the real sample applications are presented.
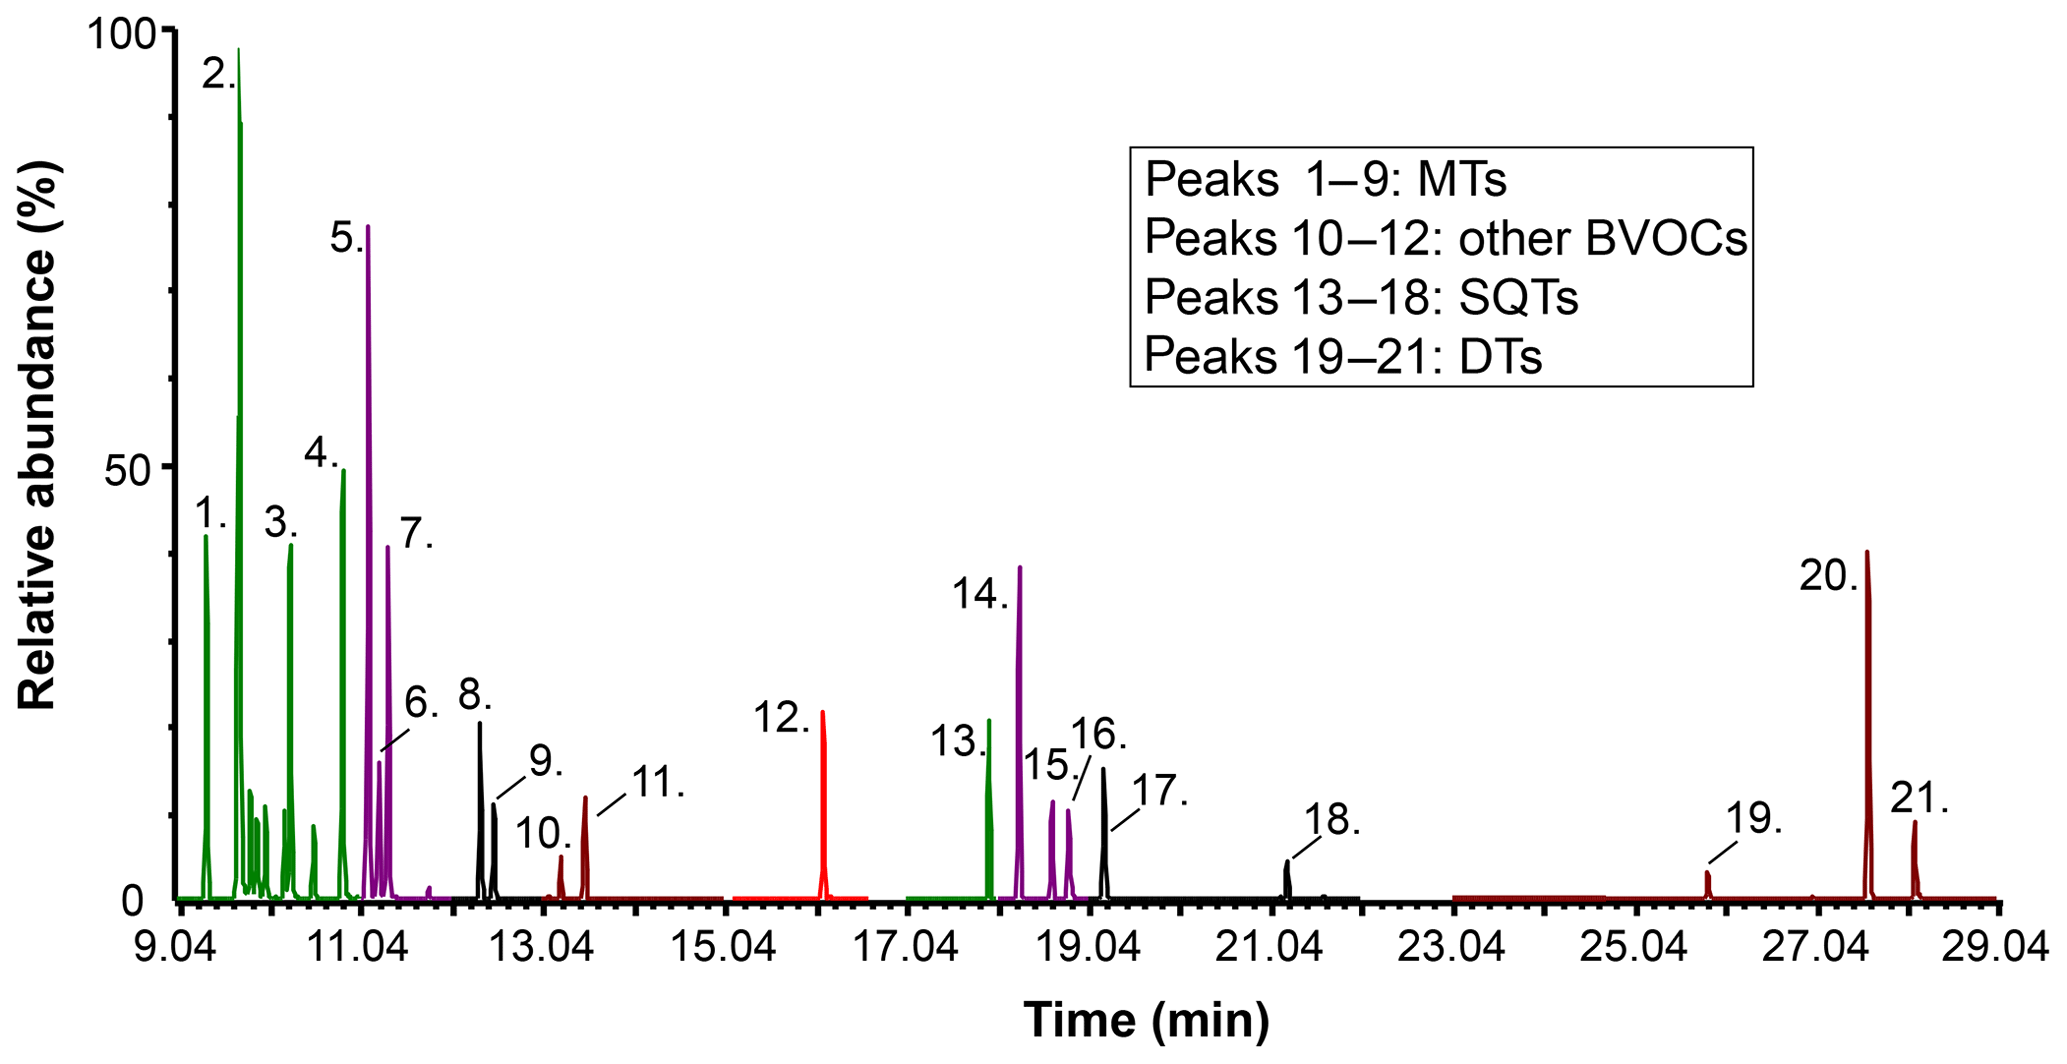
Figure 1Overlaid selected ion recording (SIR) chromatograms of a standard solution (c=10–50 ng in sorbent tube) analysed by TD–GC–MS1. The analysis conditions are presented in Table S2. Peak identification can be made based on Table 1, from low RI (peak 1. α-pinene) to high RI (peak 21. 3-MA).
3.1 Method performance results
3.1.1 Desorption and chromatographic separation
The desorption efficiency was ≥99.8 % for all compounds with the TD–GC–MS1 at 300 ∘C for 5 min. With the TD–GC–MS2 desorption time needed to be increased from 1 to 5 min at 300 ∘C (both sorbent and cold trap) to minimise the carryover, which arises from either the sorbent tube or cold trap, and to obtain sufficient desorption efficiency (≥99.7 %). Higher desorption temperatures were not tested to avoid sorbent deterioration in long-term use.
The chromatogram from a standard solution analysis with TD–GC–MS1 is shown in Fig. 1, and more detailed versions are shown in Figs. S7–S8 for both TD–GC–MS instruments. The separation was considered to be adequate since all compounds could be baseline separated. The RI values for each compound are presented in Table 1 (according to run with TD–GC–MS1).
3.1.2 Compound stability in storage
The stability was still acceptable (> 80 %) with most of the compounds after the 2-month storage period (Fig. S9). On average, MTs were recovered at 101±2 %, 93±5 % and 97±4 % after 5 d, 1 month and 2 months of storage, respectively. Similarly, SQTs were recovered on average at 104±2 %, 89±3 % and 94±5 % after 5 d, 1 month and 2 months of storage, respectively. Of the diterpenes, ent-kaurene and 3-MA were recovered even after the 2 months of storage within acceptable limits (roughly 80±25 %, Fig. S9); however, cembrene had been lost to 49±18 % already after 1 month of storage. It is unknown why cembrene seems to have decomposed during the first month of storage, yet then stayed relatively stable until the next month (Fig. S9, from 49±18 % to 52±33 %). No decomposition product of cembrene could be identified in the chromatograms.
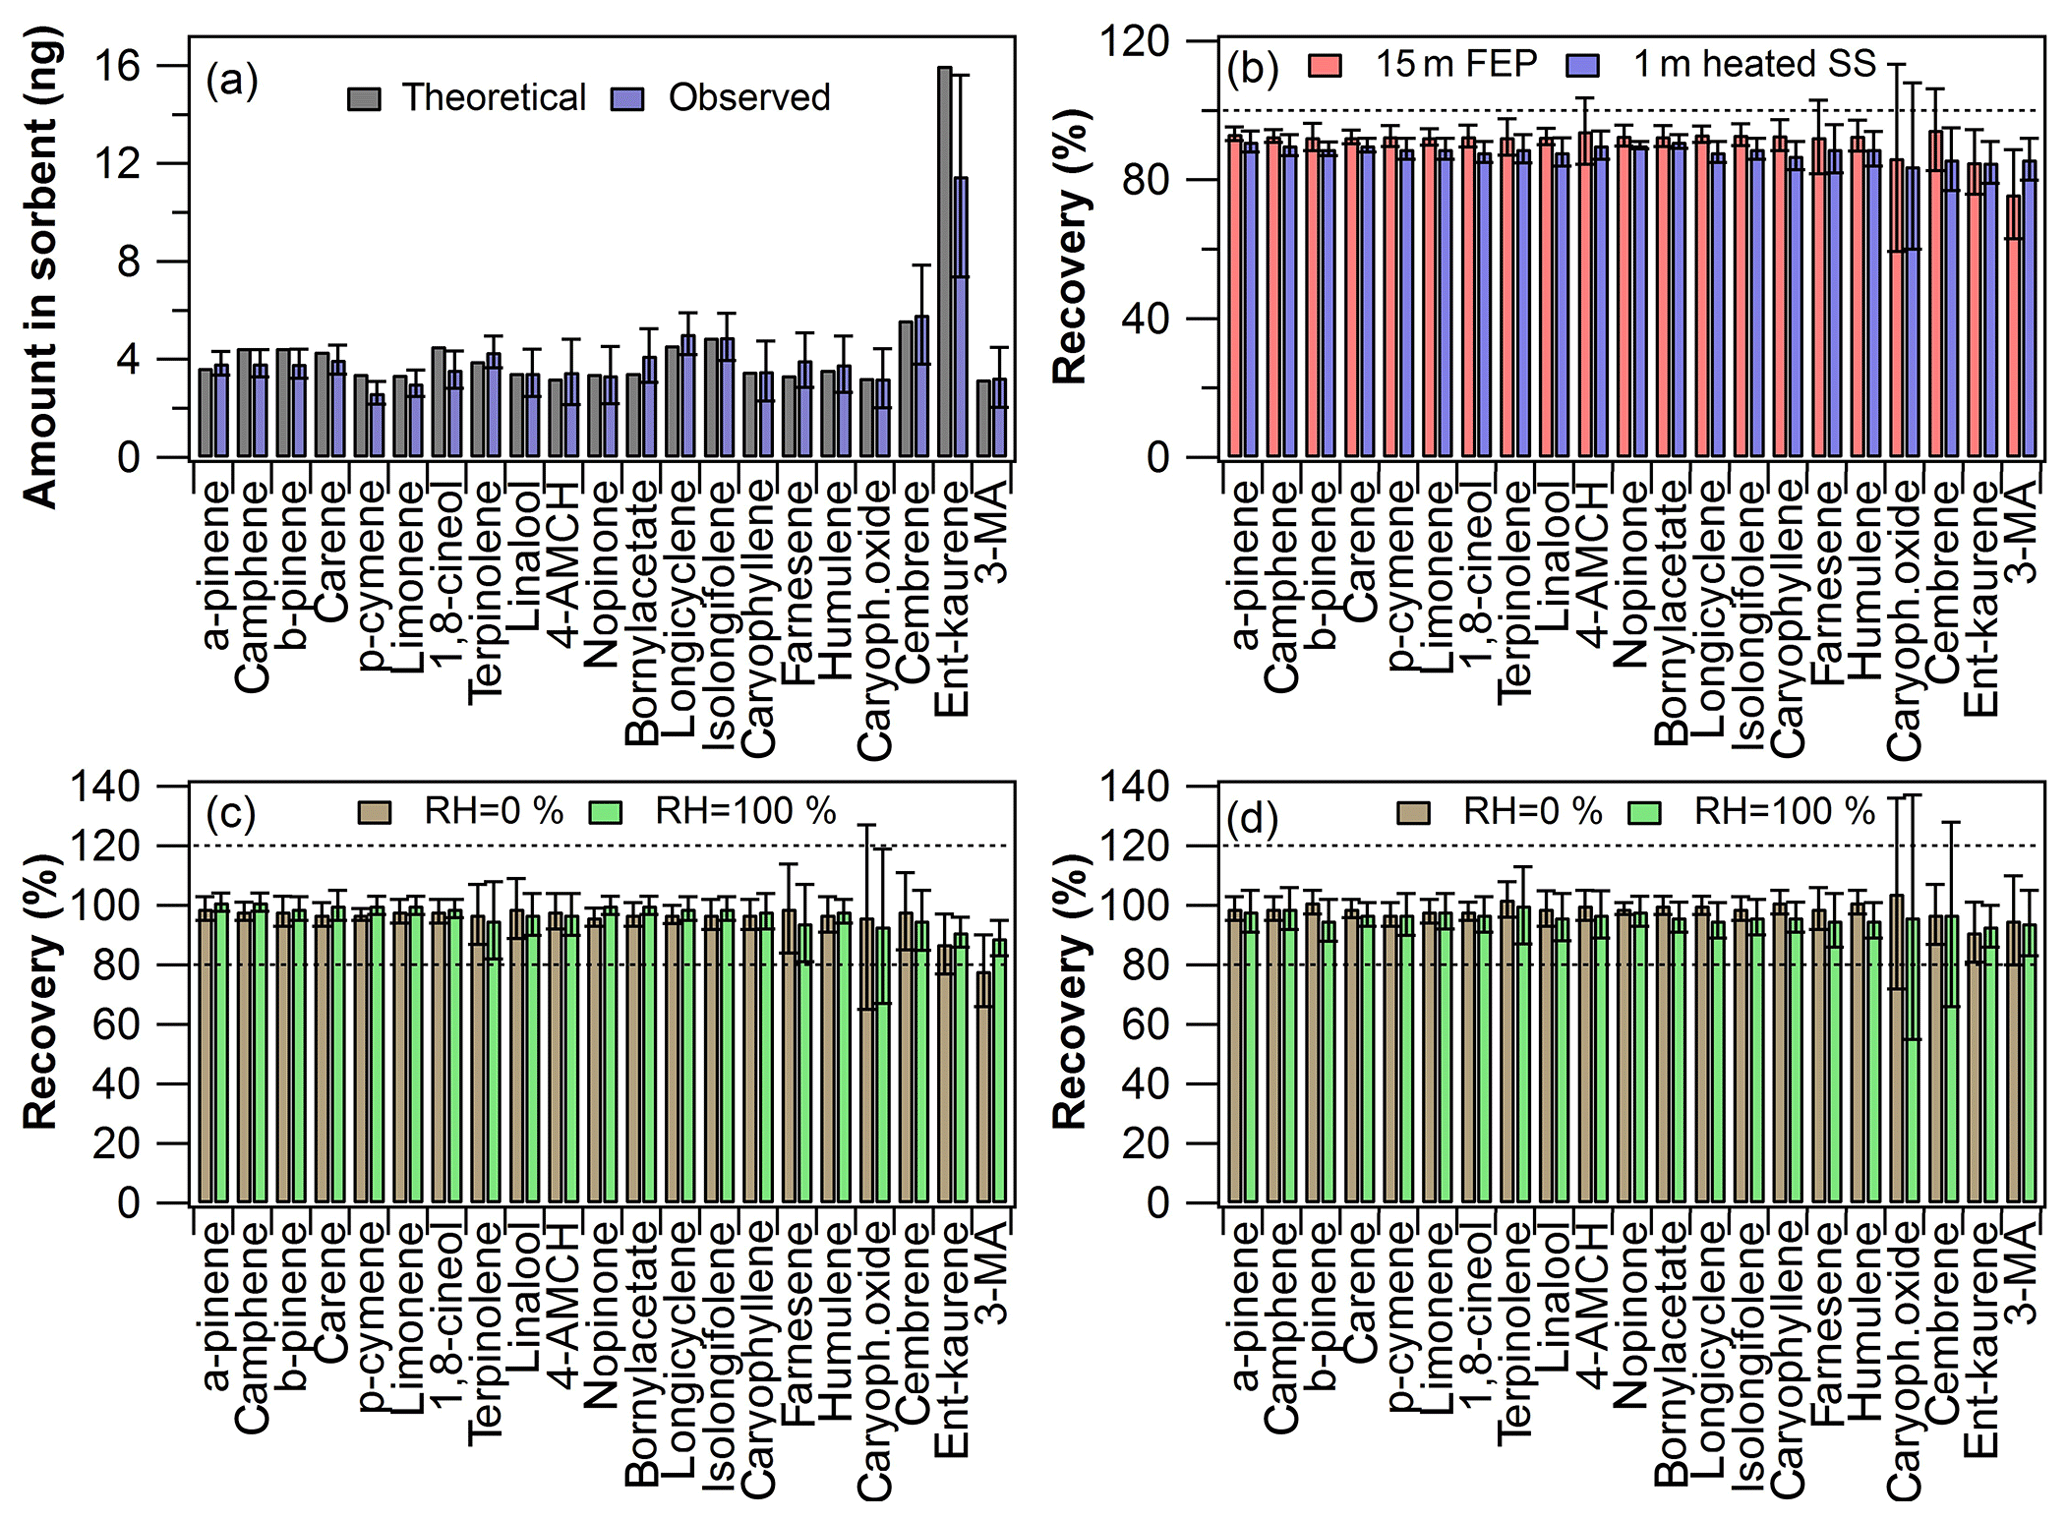
Figure 2Inlet recovery experiment results: (a) calculated theoretical amount and observed amount in the first sorbent tube (n=18); (b) inlet recovery levels at laboratory room conditions (n=9 with both inlets); (c) inlet recovery levels at different RH levels with the Teflon FEP inlet (n=8–10) and (d) with the heated stainless-steel inlet (n=9–10). The error bars represent reproducibility (n=8–18).
3.1.3 Recovery results
In Fig. 2a are shown the amount of each compound detected in the first sorbent tube (after the mixing line, Fig. S1a) and the expected theoretical amount calculated based on the experimental conditions used. As can be seen in Fig. 2a, the observed amounts were mostly in close agreement with the expected amounts. Although this was not a prerequisite for the recovery experiments, the relative recovery was calculated based on amounts found in tubes before and after the sampling line, which demonstrates that the experimental setup was working adequately in practice (although the reproducibility was a bit poor for some compounds; see Fig. 2a). The injection T-piece needed to be heated to 60 ∘C in order to increase the volatilisation of the diterpenes. If there was no heating applied, then, for example, ent-kaurene yield in the first tube was less than 20 % of the expected amount (data not shown). The diterpenes were observed to stick to the walls of the injection PTFE T-piece if it was not heated. Thus heating is recommended to be used in similar experiments. Higher temperatures were not tested here in order to avoid the possible PTFE contamination peaks.
In Fig. 2b are shown the inlet recovery results for both Teflon FEP and ozone removal inlet lines. The recovery results were at an acceptable level (100±20 %) for most of the compounds with both inlets. Interestingly, even though heating was required for volatilisation at the injection point, DTs passed the sampling lines completely in the gas phase as demonstrated by the acceptable recoveries. This could have been expected in the case of the heated stainless-steel line (which certainly maintains the compounds in gas phase), but especially the recoveries obtained with the 15 m long Teflon line were very promising in view of real applications. The results indicate that under the applied conditions the Teflon FEP sampling lines do not need to be heated excessively above room temperature (22±1 ∘C).
In Fig. 2c–d are shown the recovery values obtained with both inlets at the different RH levels tested. The RH did not affect the recovery levels dramatically with either inlet tested. Only 3-MA had a slightly worse recovery (78±12 %) when the Teflon inlet was used at a low RH level, but it was acceptable when the RH was high (recovery 89±6 %). The standard deviation was fairly large for some of the least-volatile compounds (ent-kaurene, cembrene, 3-MA and caryophyllene oxide) and occasionally for β-farnesene and terpinolene, which might be due to a combination of the compound properties and experimental variation.
The cuvette recovery results showed some variability (Fig. 3). As mentioned in Sect. 2.3.3, three different flow rates were tested (inlet flows 6.7, 2.0 and 1.0 L min−1). The recovery values were acceptable at all flow rates tested for all other compounds except for the diterpenes (Fig. 3). The recoveries of MTs and SQTs were on average 95±1 % and 94±2 % at 1.0 L min−1 and 96±1 % and 93±3 % at 6.7 L min−1 flow rates, respectively. However, the recoveries of DTs were on average 44±11 %, 80±6 % and 76±4 % at flow rates of 1.0, 2.0 and 6.7 L min−1. The poor recoveries of DTs observed at the lowest flow rate tested indicate that the residence time inside the cuvette was likely too long for these low volatility compounds (note that for MTs and SQTs the recoveries were acceptable). The DT recoveries were seemingly adequate with the other flow rates tested, indicating that the set flow rate range of ca. 2–7 L min−1 would be suitable for sampling. However, with the highest flow rate tested, the absolute mass concentrations of DTs were very close to LOQ values (Fig. 3). This was likely related to an experimental problem in the analyte volatilisation setup. The injection T-piece heating was not efficient enough to allow complete volatilisation of the DTs, since the high flow rate rapidly cooled the T-piece. Therefore, these DT cuvette recoveries need to be considered tentative results, since the concentration levels were not systematic between the different flow rates tested (Fig. 3). A better sample introduction system would be needed to make the volatilisation more systematic at all flow rates under investigation.
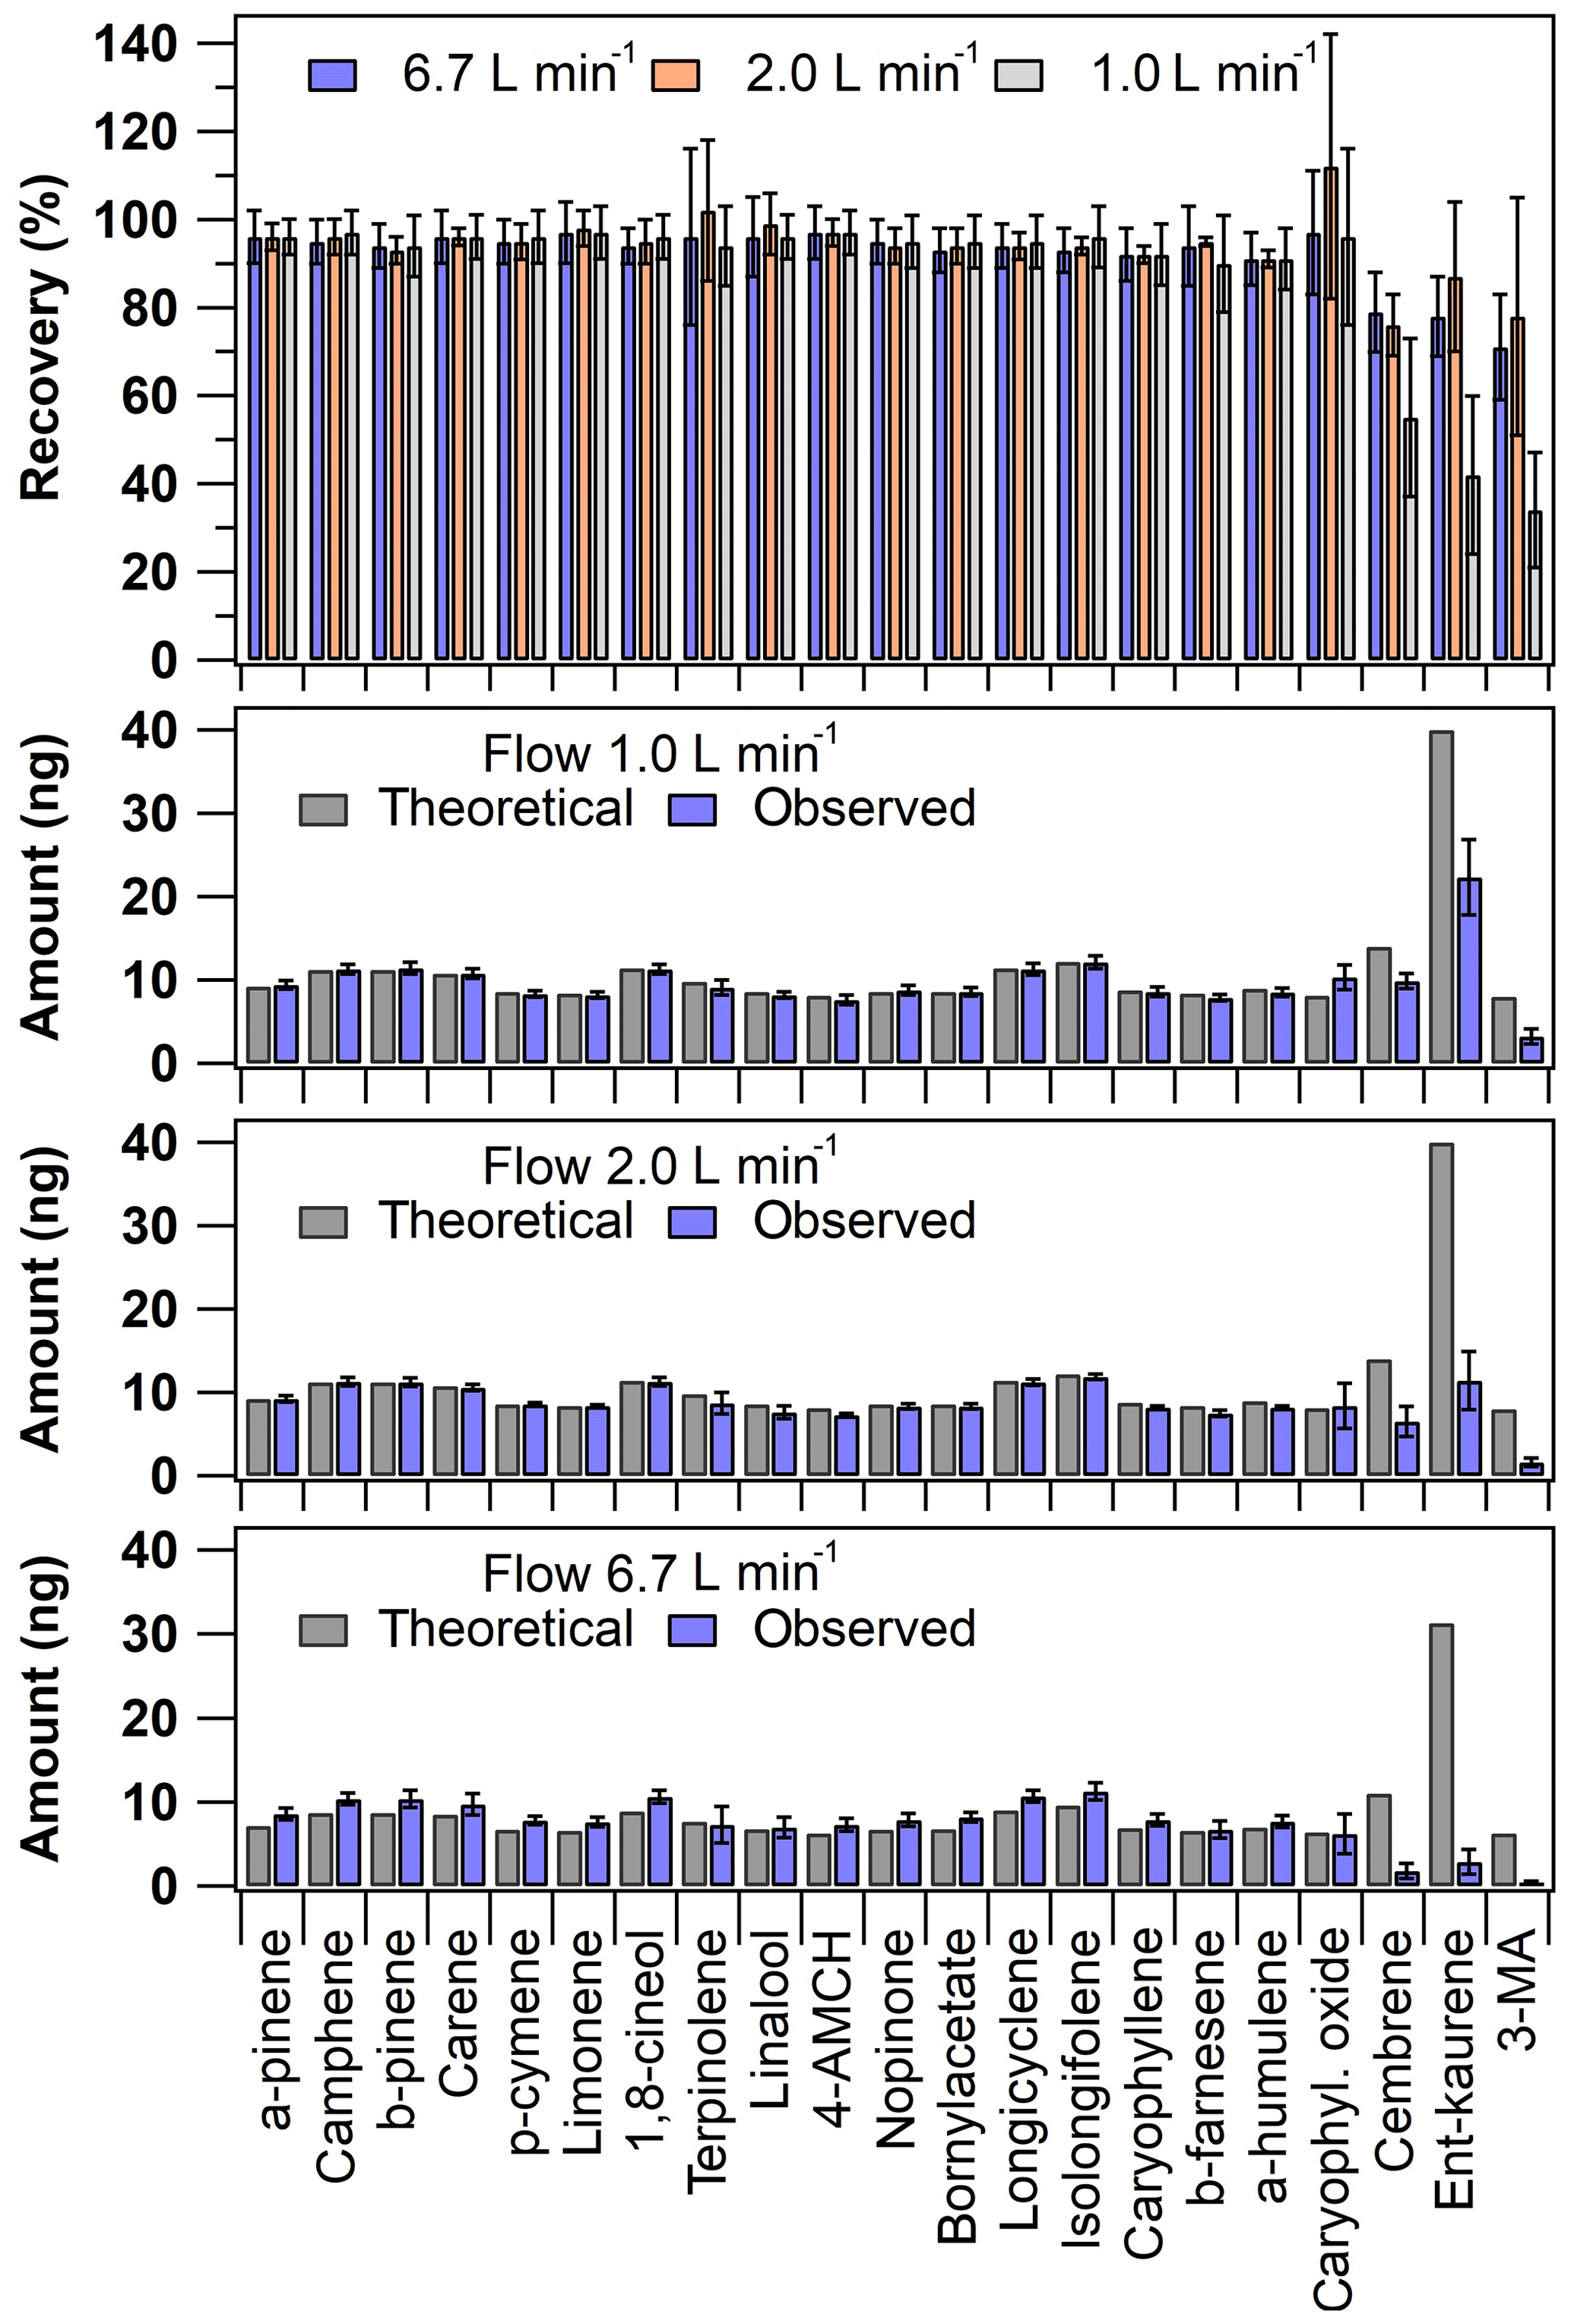
Figure 3Cuvette recovery results (top panel) and the absolute amount detected in the first sampling sorbent tube presented according to the different inlet flow rates used (the lowest three panels). The theoretical expected amount was calculated based on the used experimental conditions. The error bars represent reproducibility (n=3–9).
3.1.4 Analytical figures of merit of the developed TD–GC–MS method
The analytical figures of merit are shown in Table 1. The within-day repeatability (n=6) was fairly good for all compounds (relative standard deviation, RSD < 5 %), except for caryophyllene oxide which had a fairly high variation (≈19 %). The intermediate precision (n=22 during 4.5-month period) was acceptable for all compounds (RSD < 10 %), when calculated based on the quantified mass concentrations in the sorbent tube (Table 1). The expanded measurement uncertainty (U) at the 95 % confidence level for terpenes varied between 16 % and 32 % and between 18 % and 55% with the ambient air sampling and branch enclosure emission procedures, respectively.
In general, the LOQ values (expressed as absolute amount in sorbent tube) were the lowest for monoterpenes (13–88 pg) and for sesquiterpenes (33–198 pg) and the highest for caryophyllene oxide (340 pg) and diterpenes (287–518 pg). The highest LOQ values were observed in the case of DTs likely because the baseline was the noisiest at the end of the chromatogram and because these compounds had minor contaminant peaks in some of the blank sorbent tubes. When converted to parts per trillion by volume by using a sampling volume of 5 L, the LOQ values were approximately 0.5–2.8 pptv for MTs, 0.8–7.5 pptv for SQTs and 5.1–9.3 pptv for DTs. These are on a similar level as the method detection limits reported for MTs and SQTs in previous GC–MS studies (Bouvier-Brown et al., 2009; Hellén et al., 2018; Jones et al., 2014; Mermet et al., 2019; Sheu et al., 2018); for example Pankow et al. (2012) reported detection limits (S ∕ N ratio of 10) of 0.7–2.1 pptv for MTs and 0.9–1.4 pptv for SQTs. In addition, the LOQ values obtained in this study by TD–GC–MS were better than the detection limits recently reported by proton-transfer-reaction time-of-flight mass spectrometry (PTR-TOF-MS), which were approximately 90 pptv for MTs, 200 pptv for SQTs and 510 pptv for DTs (Yáñez-Serrano et al., 2018).
The calibration curve ranges were approximately 0.2–55.8 ng for MTs, 0.2–61.2 ng for SQTs and 0.4–200.0 ng for DTs. A fairly high concentration range was used in order to cover both the low (atmospheric air) and high (enclosure emissions) concentration applications with a single method. A quadratic fit and intercept set to zero were used in calibration for all compounds. The regression fit of the calibration curves was evaluated based on residual analysis. The calibration curve correlation coefficient was typically ≥0.998 for all compounds.
3.1.5 Online vs. offline sampling with TD–GC–MS1
A detailed version of the results from the comparison between offline- and online-mode sampling with TD–GC–MS1 is presented in Sect. S2 (Figs. S10–S16). Here, a short summary of the observations is presented. In online sampling mode, samples are collected through the TD unit sampling lines, valves and an empty sorbent tube directly onto the cold trap (Fig. S10).
Collectively, the results indicated that some of the analytes are lost in excessive amounts in the online sampling mode. For example, when the material of the empty tube used in online sampling was stainless steel, the concentrations of β-farnesene, caryophyllene oxide and DTs were below LOQ in online-mode results. Yet, the recoveries () of MTs and other sesquiterpenes were acceptable, on average 96±6 % and 84±10 %, respectively. Interestingly, a substantial portion of the compound losses could be explained by the losses onto the empty tube used in online sampling; e.g. the amount of β-farnesene lost in the empty tube was ca. 44 %. However, simultaneously a substantial portion of the losses could not be explained by losses onto the empty tube; e.g. up to 98 % of the ent-kaurene losses could not be accounted for. Somewhat similar observations have been made in previous studies, e.g. Arnts (2010) observed significant SQT losses on stainless-steel tubes (about 60 % was missing), and Helmig et al. (2003) found that high sampling system temperatures (110–170 ∘C) were needed to prevent SQT losses in their setup. Heating to such high temperatures was not feasible in our setup and was not tested.
The online-mode sampling efficiency of β-farnesene, caryophyllene oxide and DTs could be increased by changing the empty tube material from stainless steel to glass and by adjusting the sample air relative humidity (Fig. 4). Increasing the sample air RH improved the recoveries of the aforementioned compounds no matter the tube material; however, the absolute recoveries were otherwise better with the glass tube than with the stainless-steel tube. Most notably, β-farnesene results were consistent and the recovery was good (92±5 %) when the glass tube was used in the online mode. Caryophyllene oxide and diterpenes could be detected, but recoveries were fairly poor and had a high uncertainty.
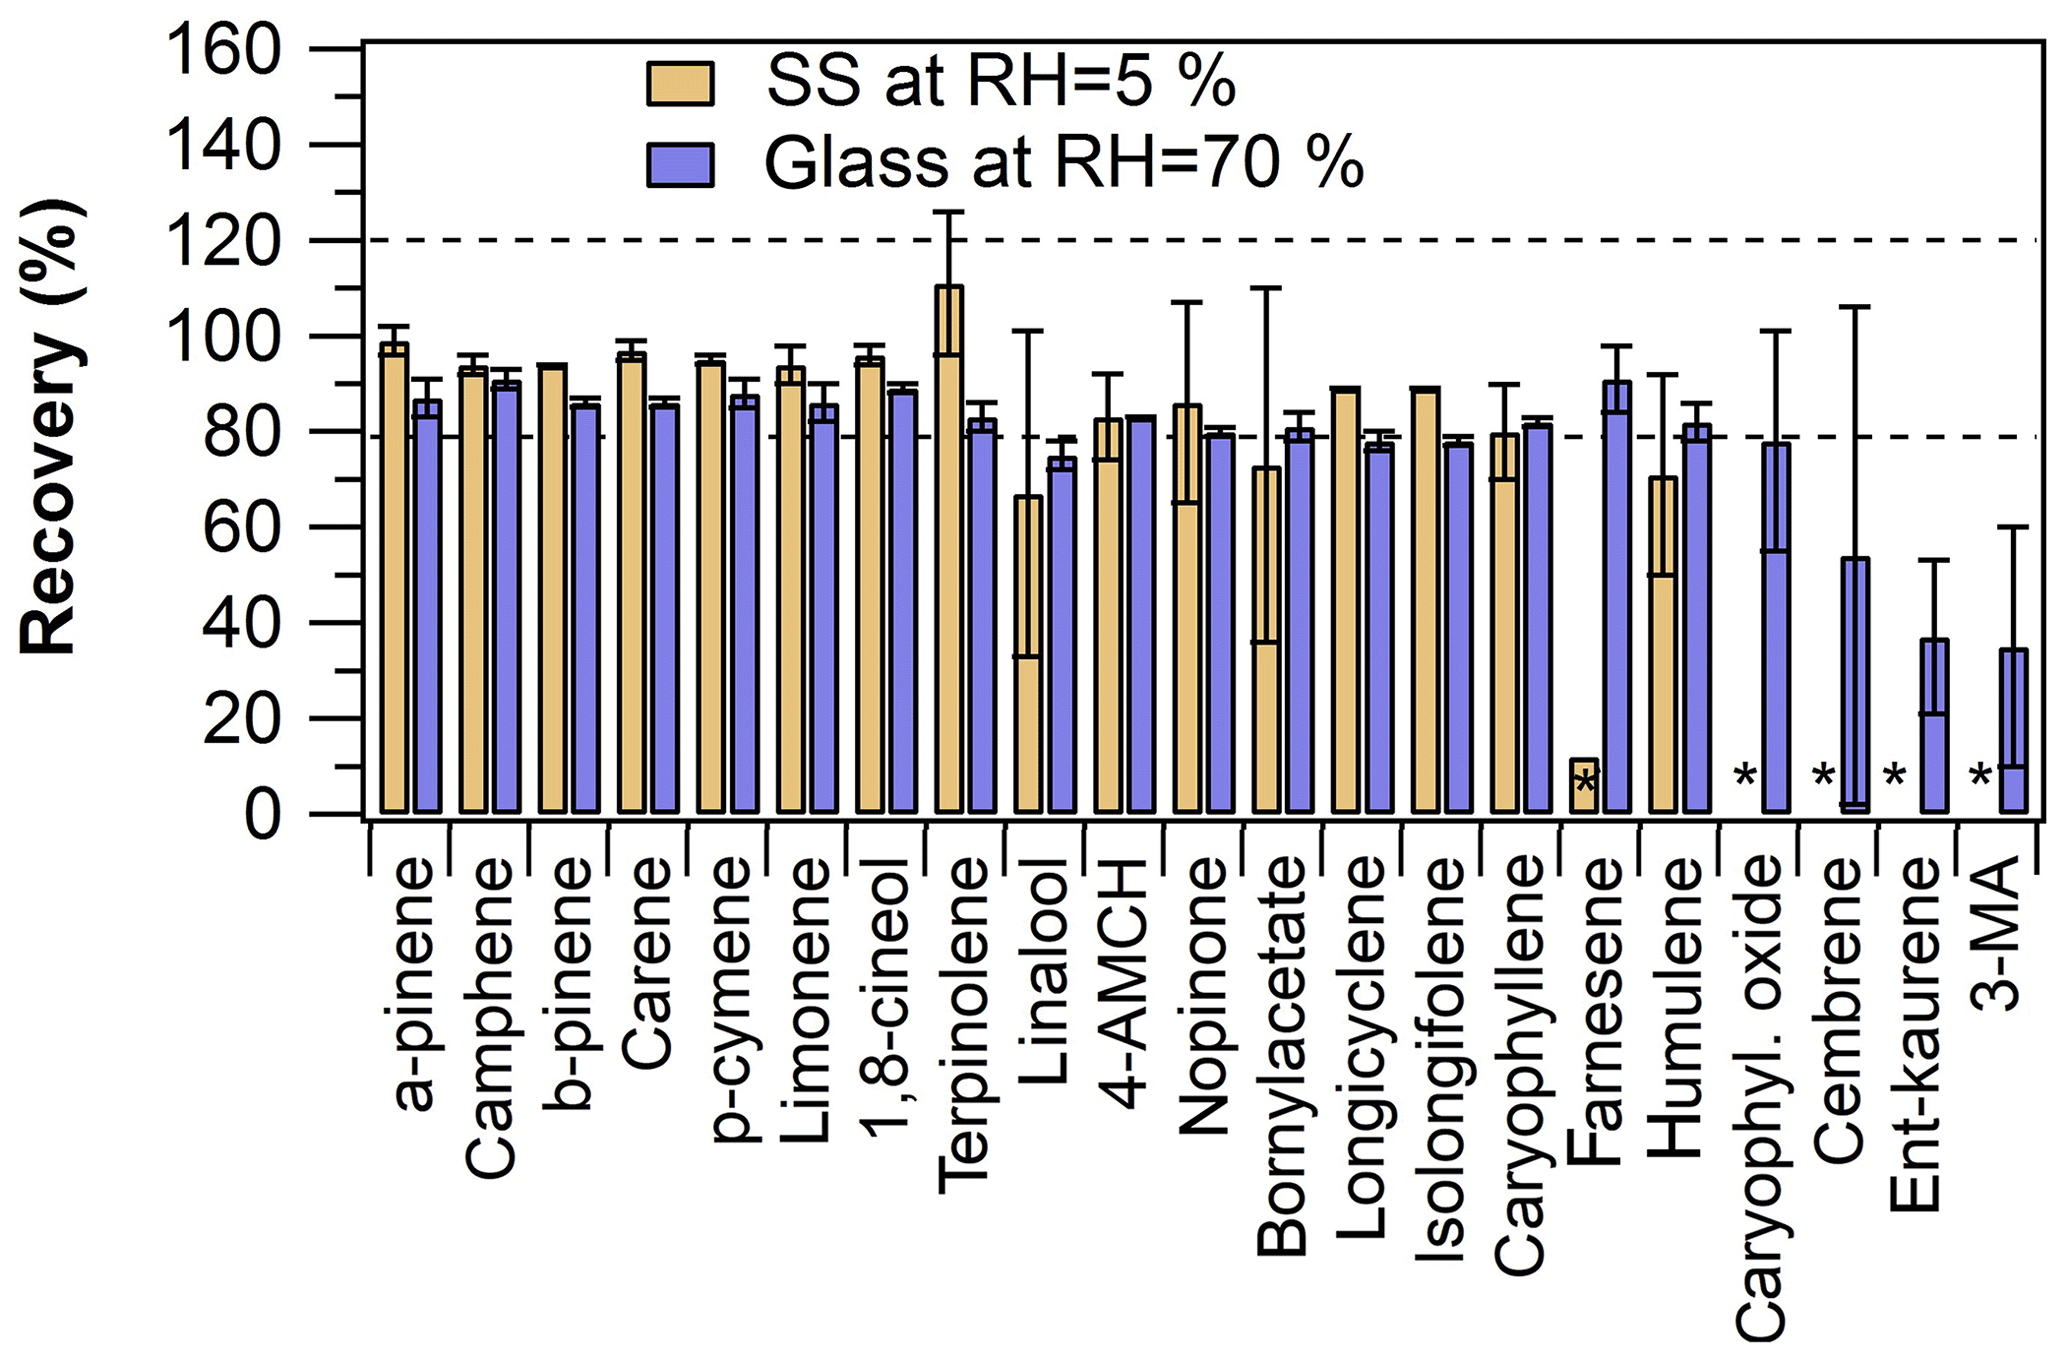
Figure 4Comparison of online sampling mode recoveries obtained by using either the empty stainless-steel (SS) tube (at RH =5 %) or the empty glass tube (at RH =70 %) in online sampling. The empty spaces marked with an asterisk indicate < LOQ results in online sampling. The error bars represent repeatability (n=2).
In summary, the online sampling results were in close agreement with the offline sampling results for most of the analytes, demonstrating the online TD–GC–MS method applicability for the quantitative analysis of MTs and SQTs. However, a large discrepancy and poor repeatability were observed between online- and offline-mode sampling results in the case of diterpenes and caryophyllene oxide. By using glass tubes (or glass-coated stainless-steel tubes, Sect. S2) and humidified air, the recoveries improved, but further development (e.g. heating of all lines, valves and the sorbent tube in the TD unit) would be needed for quantitative analysis of diterpenes and caryophyllene oxide. Since the RH was shown to have an effect on the recoveries, humidity monitoring of the sample air stream is recommended.
3.1.6 Ozone exposure and losses of terpenes
As explained in Sect. 2.3.6, sorbent tubes containing the analytes were purged with either 0 or 40 ppb of ozone from 0 to 24 L of total purge volume. In theory, the absolute amount of a compound should stay constant in the sorbent tube if the compound is not reacting with ozone or if breakthrough volume is not reached. The zero experiments (O3=0 ppb) were used as a reference to estimate the possible breakthrough, although it was not expected that the terpene amounts would decrease dramatically due to breakthrough (Sheu et al., 2018). The ozone exposure experiments (O3=40 ppb) were done in order to estimate the possible losses caused by ozone, and the results were also applied to estimate ozone reaction rate coefficients () for the analyte diterpenes. The results for all compounds are shown in the Fig. S18 and a few selected plots are presented in Fig. 5.
Based on the O3=0 ppb purging results, breakthrough volume (50 % lost, BTV50 %) was not reached with any of the compounds under the applied experimental conditions (Fig. S17). At the highest purge volume of 24 L, the relative amounts of all compounds were higher than 0.87 and on average 0.97±0.05 for MTs, 0.96±0.05 for SQTs and 0.98±0.02 for DTs. Thus, any decrease observed in the following O3=40 ppb results was attributed to be due to ozone reaction losses.
The O3=40 ppb purging results seemed reasonable for most of the compounds when considering the compound-specific values (Fig. S17 and Table S3). In general, the linear regression fit (relative amount in sorbent as a function of purge volume) slopes were declining the fastest with compounds that had the largest values (i.e. compounds which react the fastest with ozone are subsequently lost rapidly from the sorbent tube). However, this trend analysis also revealed that the literature-reported predicted diterpene values might be slightly misleading (Haberstroh et al., 2018). For example, as can be seen in Fig. 5 upper panels, the slope declined the fastest as the increased in the order of camphene, limonene and β-caryophyllene; however, the ent-kaurene value is somewhat lower than would be expected based on the slope decline.
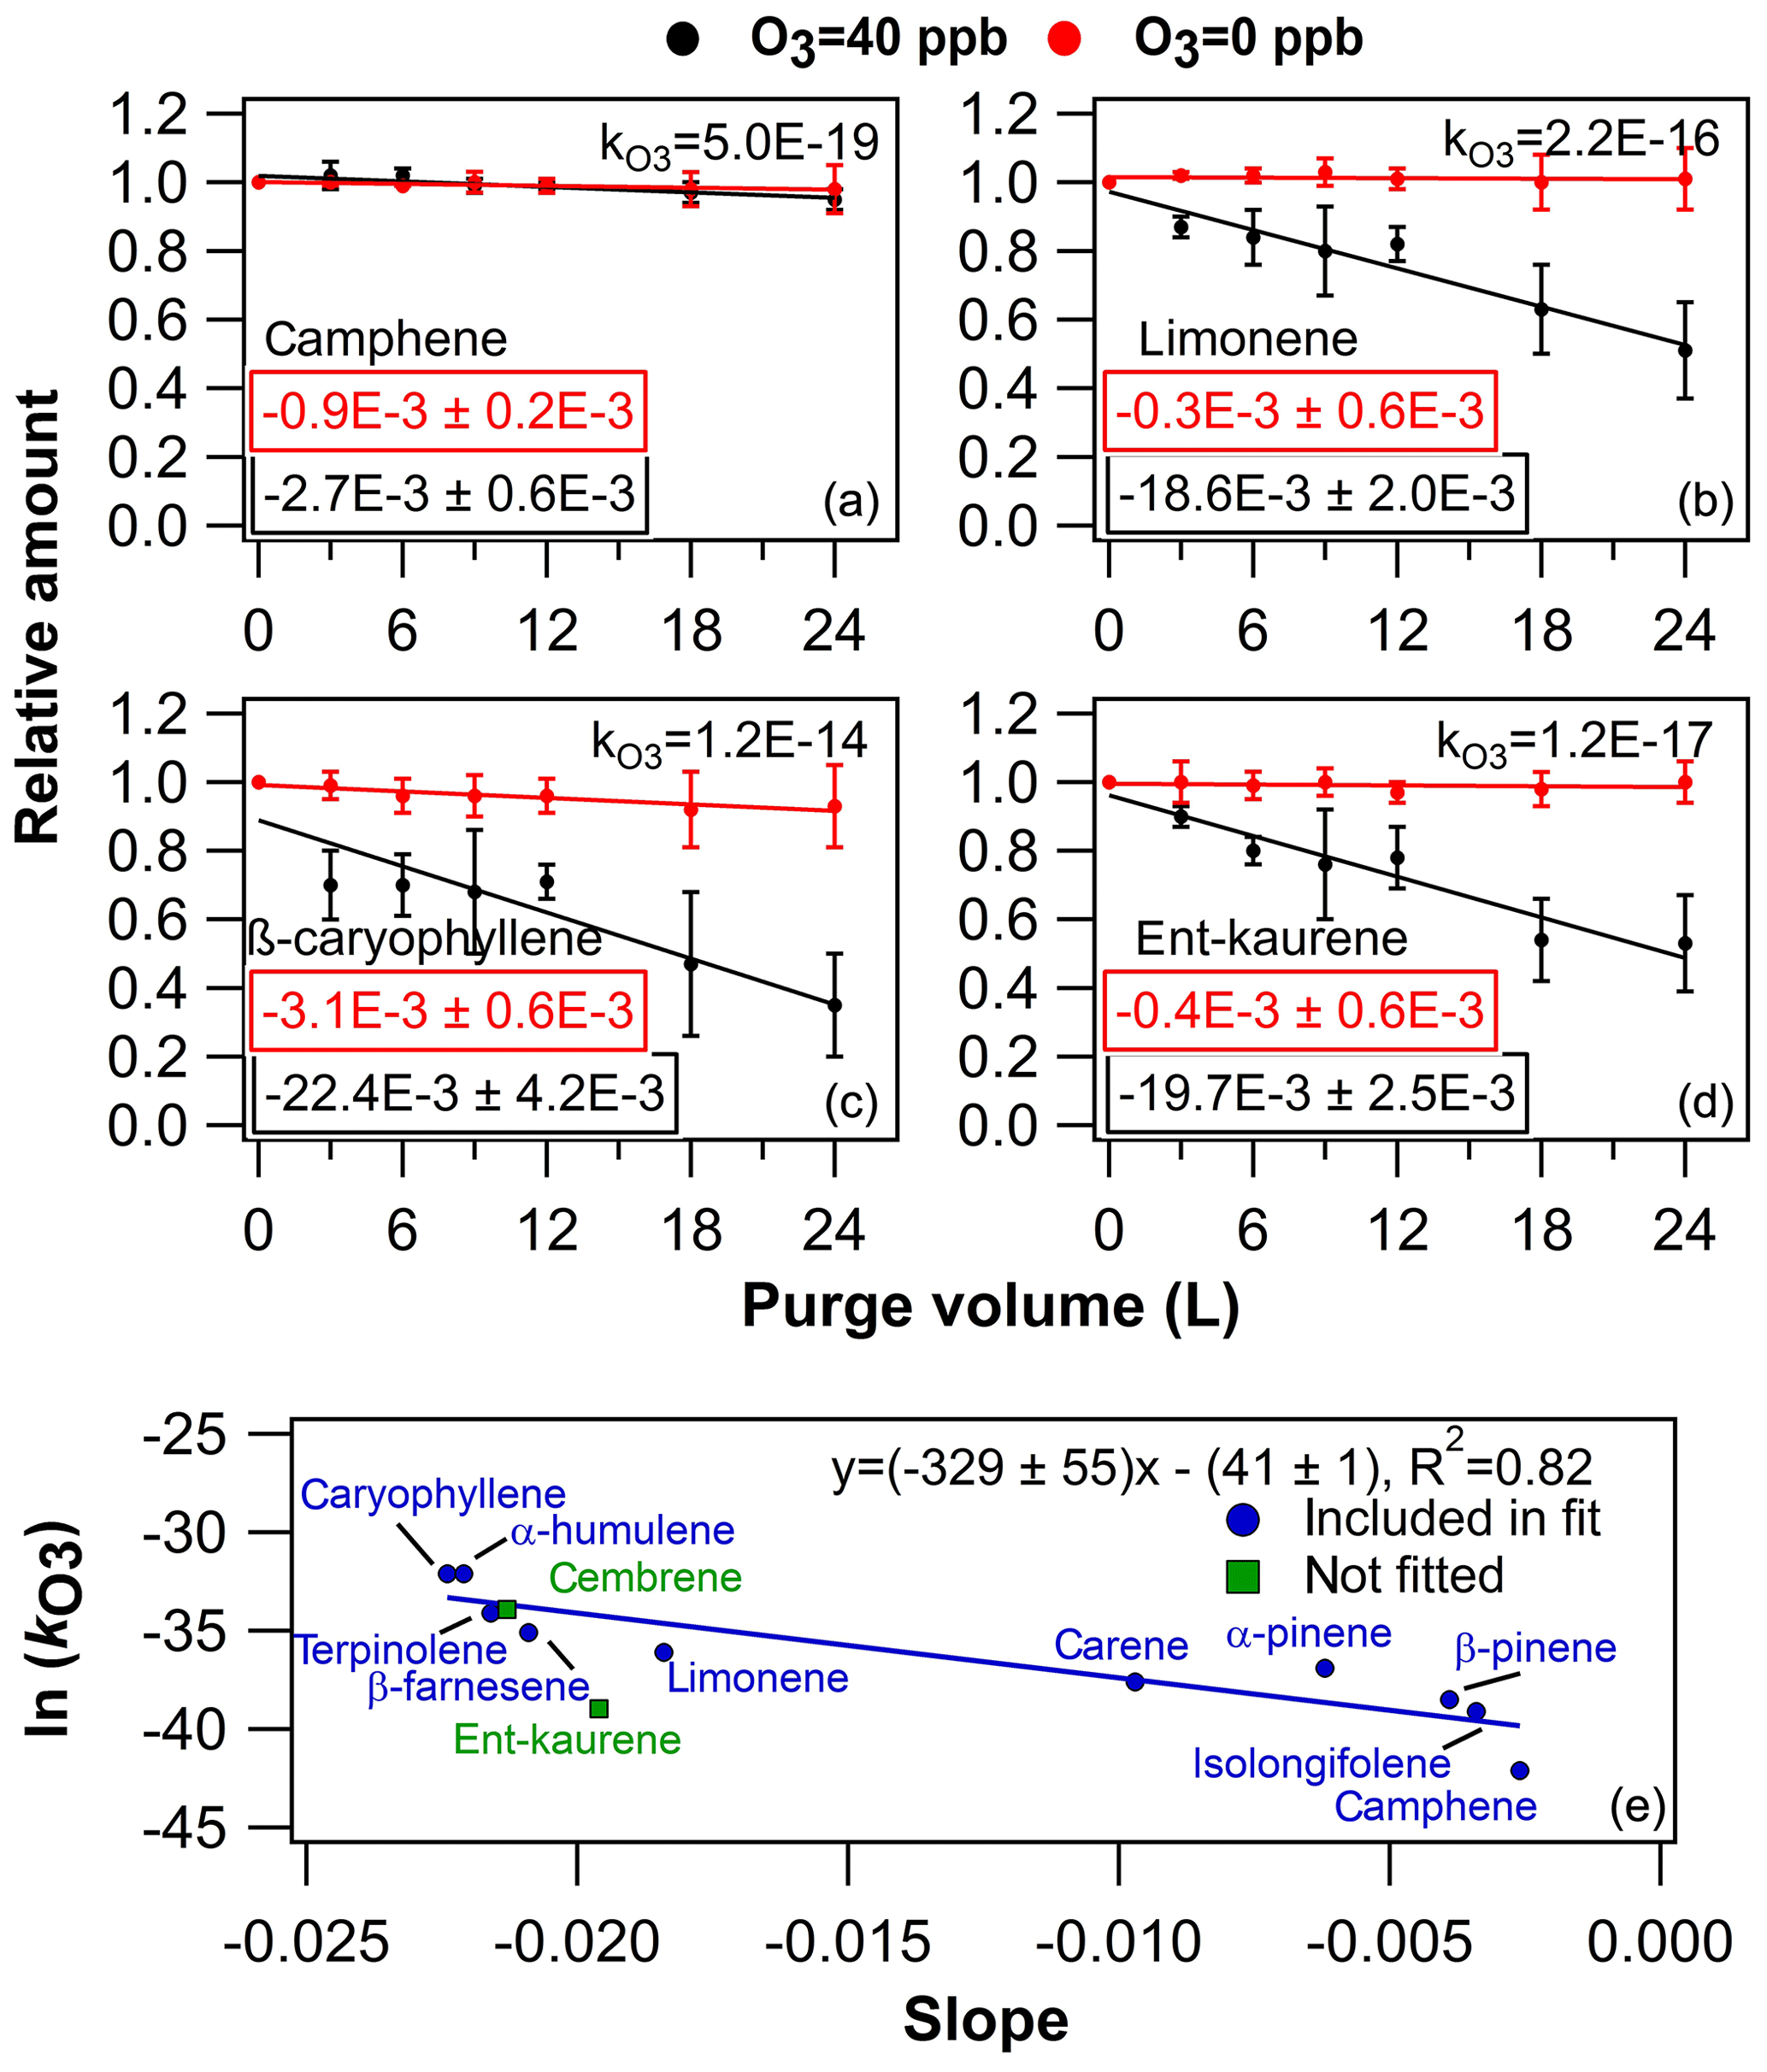
Figure 5Results from ozone exposure experiments. In (a), (b), (c) and (d) examples from the ozone exposure experiments are presented as the relative amount of compound in the sorbent tube as a function of purge volume. The values embedded into the plots are the linear regression fit slopes (± uncertainty) of corresponding conditions (either O3=0 or O3=40 ppb). The compound-specific values are presented in the plots as well. The error bars represent reproducibility (n=3). In (e) is presented the literature-retrieved ln () values (see Table S3) as a function of the linear regression fit slopes.
In the lower panel of Fig. 5, literature-retrieved ln () values were plotted as a function of the slopes obtained from the ozone purging experiments (Table S3 and Fig. S18), similar to in Pollmann et al. (2005). As can be seen in Fig. 5 and Table S3, the predicted literature value of cembrene is in close agreement with the obtained experimental value, whereas the corresponding ent-kaurene value would actually be 2 orders of magnitude higher based on the linear regression fit. Based on this simple estimation process, the ozone reaction rate coefficients for ent-kaurene and cembrene were (1.4±8.2) and (2.4±15.5) cm3 molec.−1 s−1, respectively. Consequently, the estimated lifetimes of DTs were on average 11±4 min, whereas the estimated lifetimes of MTs and SQTs were in the range of 6–4800 and 5–3800 min, respectively (calculated by assuming atmospheric concentration of O3=40 ppb).
These ozone exposure results indicate that ozone removal should be used prior to sampling of terpenes. Several different kinds of ozone traps and filters have been used to trap ozone, but some of them are not suitable even for MTs and SQTs (Calogirou et al., 1996; Mermet et al., 2019; Pollmann et al., 2005). In addition, some of the ozone removal techniques have a very short ozone removal capacity and they have to be changed frequently and are therefore not ideal for online sampling (Bouvier-Brown et al., 2009; Fick et al., 2001; Mermet et al., 2019). Based on the ozone removal results presented in Hellén et al. (2012) and the inlet recovery results presented in this study (Fig. 2d), a heated stainless-steel line could be a good solution for ozone removal, especially in online sampling. Alternatively, Mermet et al. (2019) proposed that results comparable to a heated stainless-steel line could be obtained with the use of copper tubes coated with potassium iodide (KI) for some MTs and SQTs; however, the performance of the KI scrubber was not evaluated with regards to DTs.

Figure 6Selected ion recording (SIR) chromatograms from the TD–GC–MS1 analysis of pine needles and blank dynamic headspace sorbent tube samples (sampling at 60 ∘C for 20 min at a flow rate of 100 mL min−). The five m∕z ions included in the SIR were m∕z 93, 229, 257, 272 and 275. The chromatogram is scaled for presentation purposes; peak number 9 is not shown in full height in order to visualise the other peaks more clearly. Peak identification is as follows. 1. Unknown (C19H30, BVOC). 2. Unknown (C19H28, BVOC). 3. Unknown (C18H26O, BVOC). 4. Unknown (, BVOC). 5. Unknown (C20H32, DT). 6. Sandaracopimaradiene (C20H32, DT). 7. Unknown (, BVOC). 8. Unknown (, BVOC). 9. 13-epi-Manool oxide (C20H34O,DT). 10. Unknown (, BVOC). 11. Unknown (, BVOC). 12. Unknown (C20H34O, DT). 13. Abietadiene (C20H32, DT). See Table S4 for further information on peak identification.
3.2 Real sample application results
As explained in Sect. 2.4., in the following experiments the plant material samples were heated in order to characterise the DTs potentially emitted by the studied tree species and to further test the TD–GC–MS method performance in view of real sample analysis. The plant material samples were heated to facilitate the release of DTs from the plant storage pools into the gas phase.
3.2.1 Headspace extraction of heated pine needles and spruce twigs
From the dynamic headspace sampling of heated pine needles and spruce twigs, several diterpenes could be detected; however, these compounds were detected mainly at the highest temperatures tested and eventually in quite low concentrations. The chromatograms of pine needle and spruce twig samples are shown in Figs. 6 and 7 and the detected peaks are outlined in Table S4.
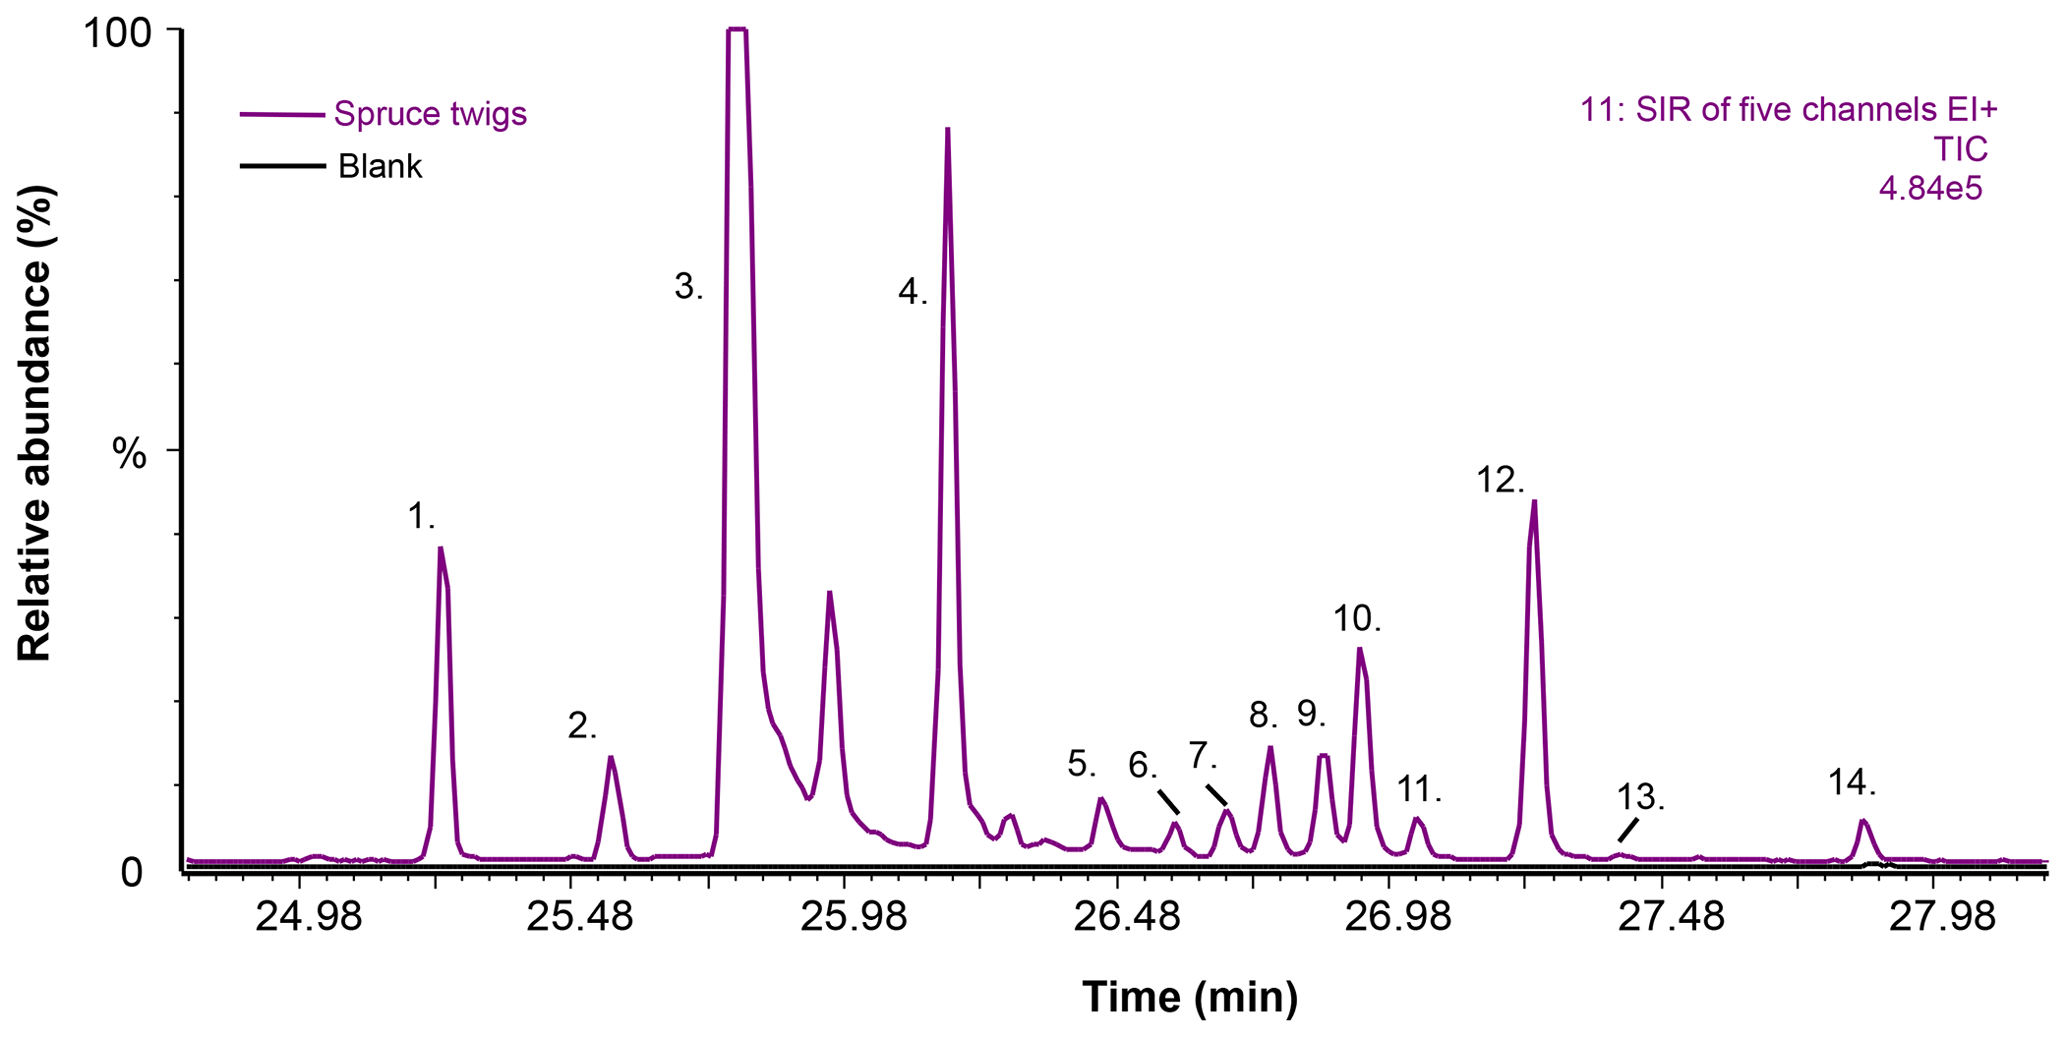
Figure 7Selected ion recording (SIR) chromatograms from the TD–GC–MS1 analysis of spruce twigs and blank dynamic headspace sorbent tube samples (sampling at 60 ∘C for 20 min at a flow rate of 100 mL min−1). The five m∕z ions included in the SIR were m∕z 93, 229, 257, 272 and 275. The TIC is scaled for presentation purposes; peak number 3 is not shown in full height in order to visualise the other peaks more clearly. Peak identification is as follows. 1. Rimuene (C20H32, DT). 2. Unknown (C20H32, DT). 3. Cembrene (C20H32, DT). 4. Cembrene A (C20H32, DT). 5. Unknown (C20H32, DT). 6. Unknown (C20H32, DT). 7. Unknown (C20H32, DT). 8. 13-epi-Manool oxide (C20H34O, DT). 9. Unknown (C20H32, DT). 10. Unknown (, BVOC). 11. Unknown (C20H34O, DT). 12. Unknown (C20H32, DT). 13. Abietatriene (C20H30, DT). 14. Unknown (C20H32, DT). See Table S4 for further information on peak identification.
In total, 11 hydrocarbon diterpenes (C20H32), two oxygenated diterpenes (C20H340) and one unknown BVOC () were detected in the headspace samples of spruce twigs (Fig. 7 and Table S4). Of these 14 compounds, only five could be tentatively identified based on mass spectra and retention index matches. The identified compounds were rimuene, cembrene, cembrene A, 13-epi-manool oxide and abietatriene. Most of these compounds have been detected previously in spruce essential oil samples (Norin and Winell, 1972; Wajs et al., 2006), with the exception of rimuene which, however, has been observed recently in ambient air in the Amazon (Yee et al., 2018).
In the pine needle samples, only a few DTs could be detected; however, several other similar type of BVOCs were observed (Fig. 6 and Table S4). Overall, three hydrocarbon diterpenes, two oxygenated diterpenes and eight other similar high-molecular-weight compounds (with potential formulas of e.g. C19H30, C18H26O and C20H28O) were detected. Of the 13 compounds observed, only three could be tentatively identified. These identified compounds were sandaracopimaradiene, 13-epi-manool oxide and abietadiene. Of these DTs, only abietadine has also previously been found in pine essential oil samples (Judzentiene and Kupcinskiene, 2008; Judžentienė et al., 2006; Kupcinskiene et al., 2008; Tumen et al., 2010). Most of those previous studies have also detected manool oxide, which is a stereoisomer of 13-epi-manool oxide that we observed here. Interestingly, sandaracopimaradiene has also been observed in ambient air in the Amazon (Yee et al., 2018).
Unfortunately, some of the peaks that had the same (or almost the same) retention index values in spruce and pine samples (Table S4) could not be assigned to be the same compound based on mass spectra. Therefore, it is possible that there might be overlapping compounds in the chromatograms. However, since the mass spectra were different, it is equally possible that the overlapping compounds do not affect the quantification since they seemed to be species specific.
Emission rate coefficients (Figs. S18–S19) were calculated in order to evaluate specifically the relative amount of DTs emitted in comparison to MTs and SQTs. These results are merely semi-quantitative and the uncertainties might be fairly high (e.g. all detected diterpenes were quantified based on either ent-kaurene or cembrene, and some MTs had higher concentrations in samples than in standards, so the calibration needed to be extrapolated for obtaining mass concentrations). Only the standard analyte MTs and SQTs found in samples were quantified. The results from spruce twigs at 70 ∘C are not presented due to moisture-related problems in the experiments.
As can be seen in Fig. 8, the emission rates were generally roughly 1 to 3 orders of magnitude lower for DTs when compared to MTs and SQTs (see also Figs. S18–S19 for individual compound plots). In general, the emission rates increased as the temperature increased with all compounds. At 30 ∘C, MT and SQT emission rates from pine needles were on average 464±431 and 50±71 ng g h−1, respectively. At the same conditions, the emission rates of DTs were on average only 1±1 ng g h−1, and of the five DTs detected in total, only three were above LOQ at 30 ∘C. Similarly, the emission rates at 30 ∘C from spruce twigs were 1052±825 and 164±97 ng g h−1 for MTs and SQTs, respectively. Of the 12 DTs observed in spruce twig emissions, only one was above LOQ at 30 ∘C (at an emission rate of 1 ng g h−1). At 60 ∘C the emission rates of MTs and SQTs were roughly 2-fold higher than those observed at 30 ∘C in both pine needle and spruce twig samples; however, the corresponding increases in the emission rates of DTs were roughly a factor of 30 to 85 (up to 70±129 ng g h−1). Clearly the increase in DT emissions was more drastic than the increase in MT and SQT emissions as the temperature increased (Fig. 8).
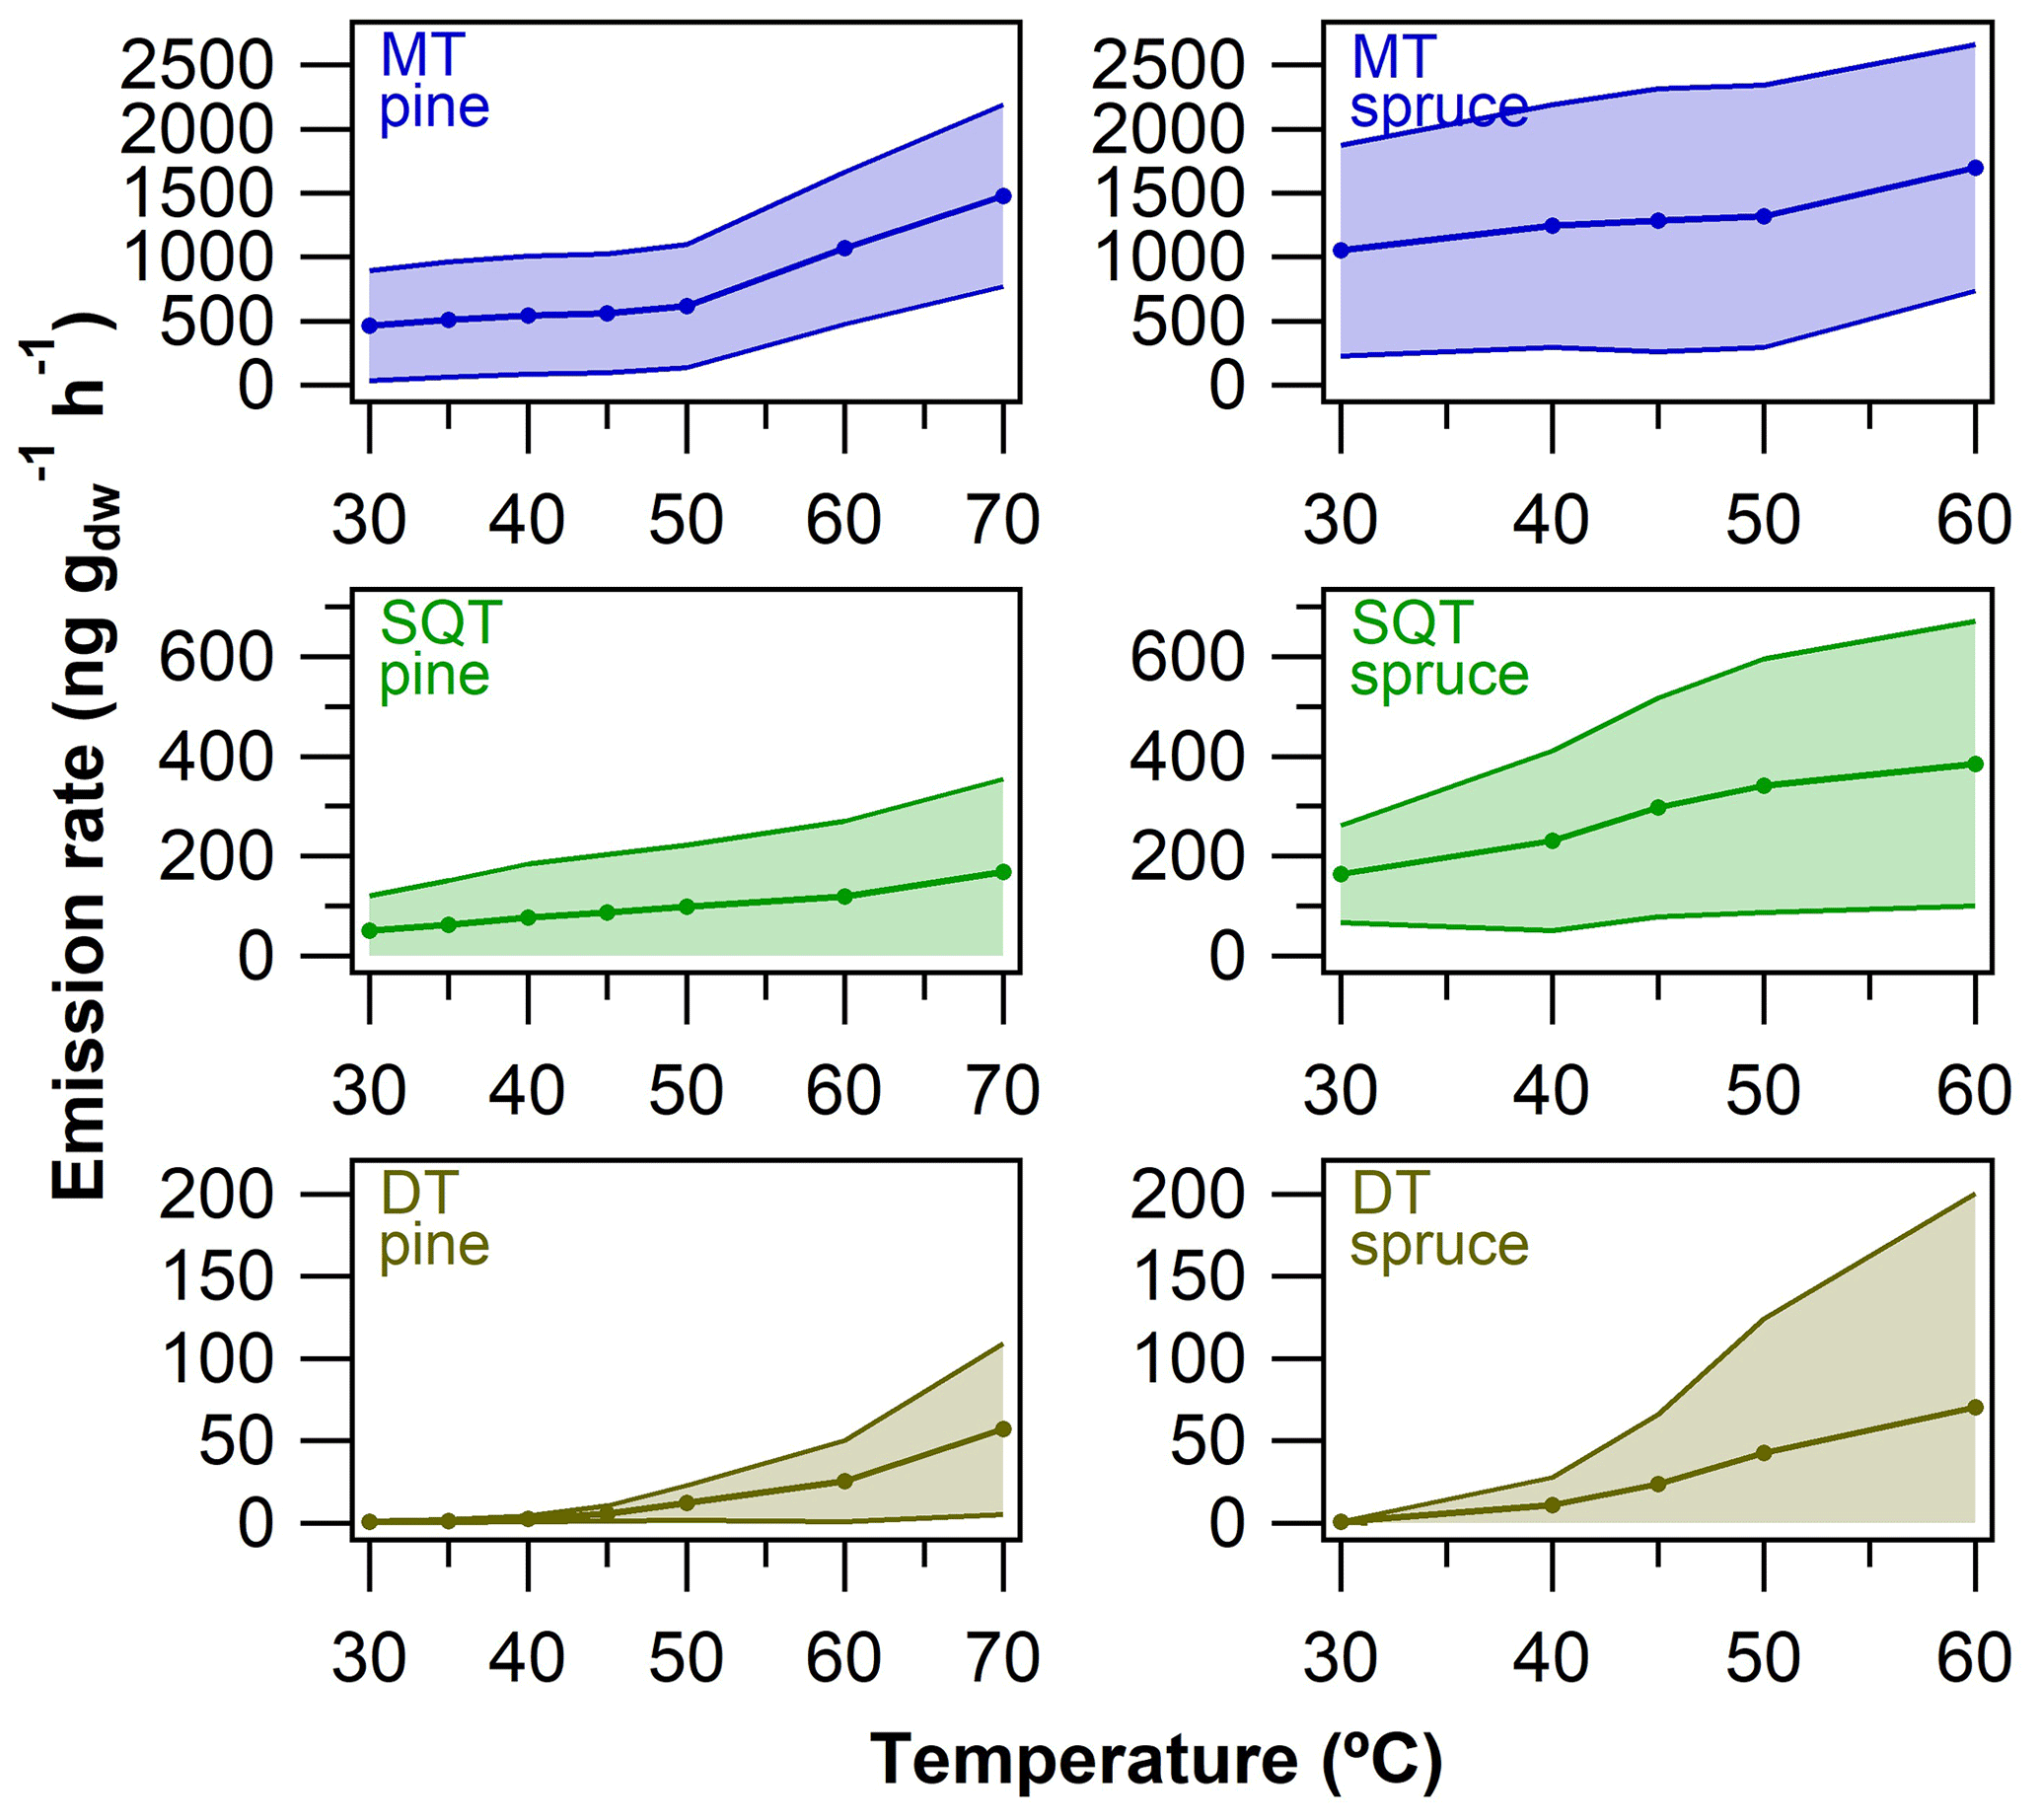
Figure 8Terpenoid semi-quantitative emission rates from pine needles and spruce twigs as a function of oven temperature in the dynamic headspace extraction experiments. The average (± standard deviation) emission rates of MTs, SQTs and DTs were calculated based on data presented in Figs. S21–S22.
3.2.2 Branch enclosure experiments
The branch enclosure experiments of a living tree in a boreal forest were conducted in view of the results obtained in the previous section. Since the DT emissions would need drastic conditions (e.g. drought, warm temperatures, direct sunlight, pest stress) to be emitted in detectable amounts, the cuvette was heated to high temperatures to promote the DT emissions in order to swiftly test the method in practice. The cuvette inside temperature was heated from ca. 14 to 61 ∘C in the course of the day (from morning to afternoon, Fig. S5). As mentioned in Sect. 2.4, the sorbent tube sampling was performed either from a bypass flow or directly from the cuvette outlet port on two different sampling dates. These experiments were conducted in a proof-of-concept type of approach. TD–GC–MS2 was used for analysis since the TD–GC–MS1 was not available at the time of these experiments.
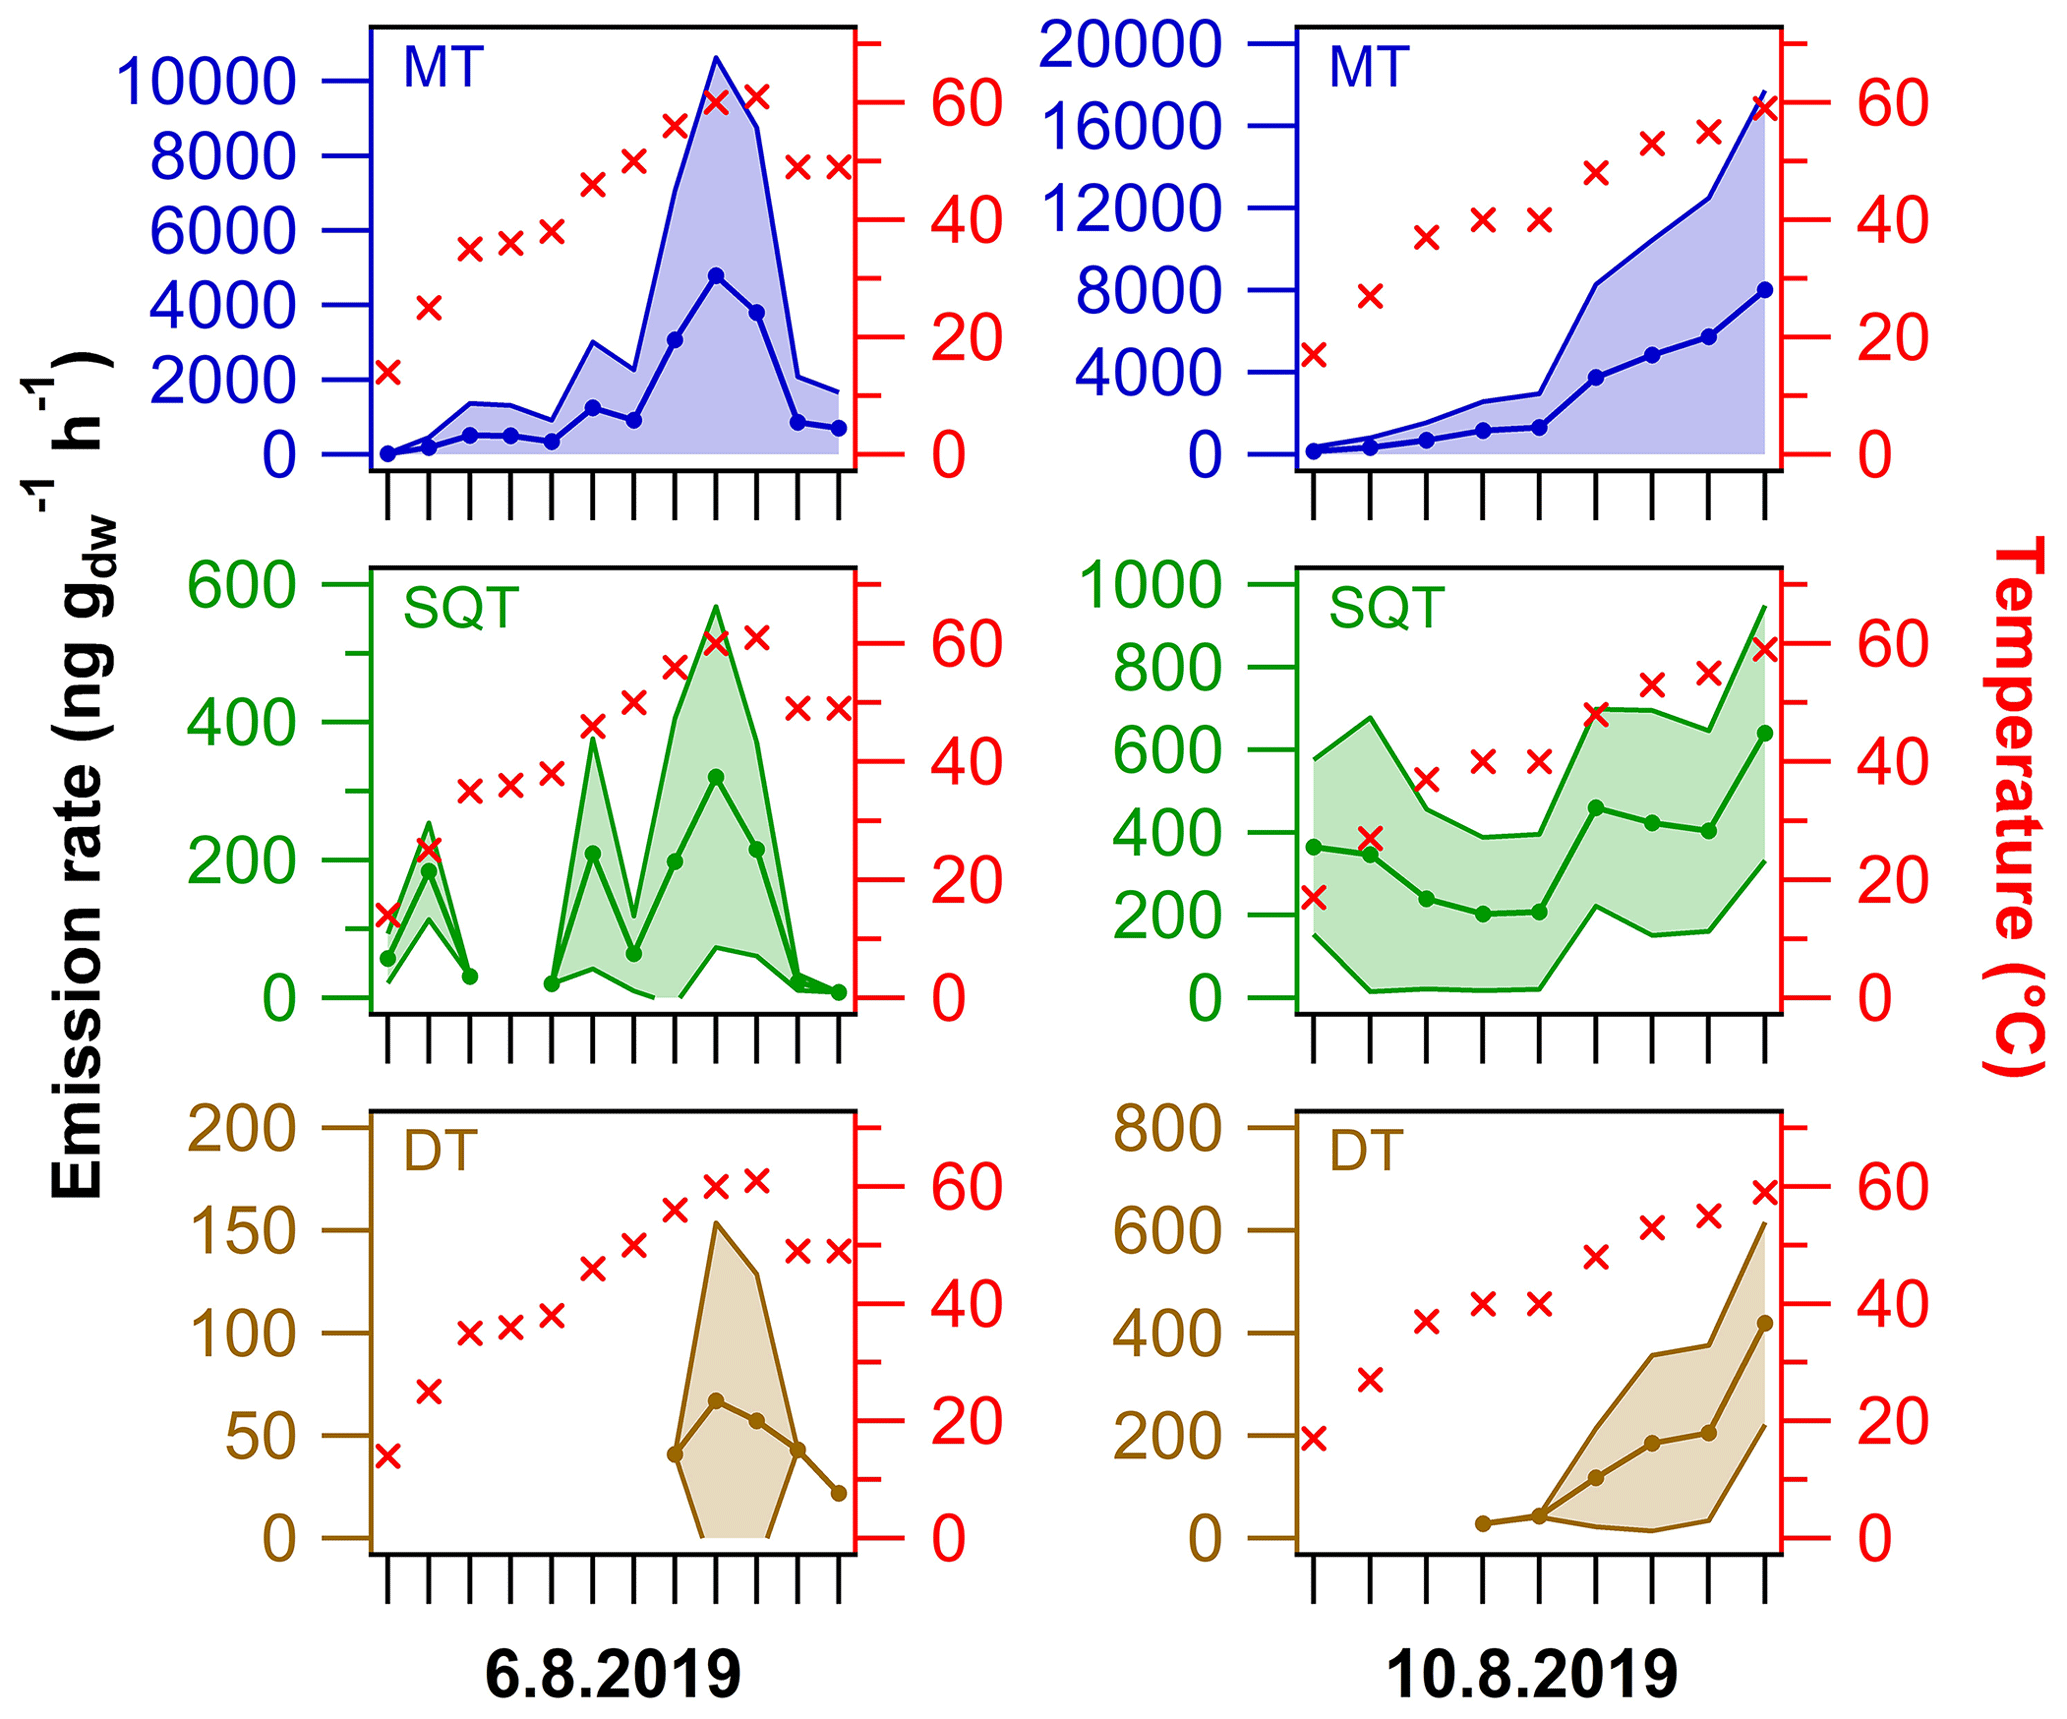
Figure 9Semi-quantitative average (± standard deviation) emission rates of MTs, SQTs and DTs from the living spruce branch enclosure experiments on two different sampling dates. The cuvette inside temperature is shown on the right y axis (for details see Fig. S5). For details on the terpenes included, see Table S5.
A full list of compounds detected in the spruce emissions is shown in Table S5, and an example chromatogram from a sample analysis is shown in Fig. S20. In total, 25 MTs, 14 SQTs, six DTs and 10 other BVOCs were detected (Table S5). The DTs were mainly detected once the enclosure temperature was higher than 40 ∘C and most DTs were detected only at ca. 60 ∘C. Most of the here tentatively identified compounds have been observed previously in essential oil samples, headspace samples or branch enclosure emissions from spruce (Hakola et al., 2017; Kännaste et al., 2013; Radulescu et al., 2011; Wajs et al., 2006). Similar to the results of spruce twigs in Sect. 3.2.1, the DTs rimuene and cembrene were identified in these branch enclosure experiments. However, the other DTs and similar compounds could not be verified to be matching between the different spruce sample types. This lack of similarity might be simply due to chemotypic variability between the trees (Bäck et al., 2012; Hakola et al., 2017). The one tentatively identified DT was assigned to be 13-epi-manool, although it might also be manool (the difference in RI and mass spectra is not that evident between these two stereoisomers), which has been detected previously in spruce samples (Kanerva et al., 2008; Radulescu et al., 2011).
Similar to in the previous section, DT emission rates were calculated for the relative comparison to MT and SQT values. These emission rate results are merely semi-quantitative and have high uncertainty (e.g. some MT concentrations were above the calibration range); thus the results should be evaluated with caution. The emission rates were quite different on the two sampling dates tested (Fig. 9). On the first sampling date, the MT, SQT and DT emission rates were on average 4784±5845, 321±247 and 67±87 ng g h−1 at 60±1 ∘C, respectively. On the latter date, the emission rates at 59±1 ∘C were on average 8024±9712, 641±308 and 419±197 ng g h−1 for MTs, SQTs and DTs, respectively. The MT and SQT emission rates were roughly 2-fold higher on the latter day, whereas the DT emission rates were then approximately 10 times higher than on the first sampling day. In relative terms, the DT emissions were significantly higher on the latter day; for example, the respective DT ∕ SQT ratio increased from 9 % to 48 % between the sampling dates. It is likely that the difference observed in results between the two sampling dates is due to the stress induced by cutting the branch and the related experimental work on the first sampling date. Nonetheless, in field conditions the difference in DT emission rates in comparison to MT and SQT emission rates was similar to in the laboratory headspace sample (roughly 2- to 70-fold difference on average at ca. 60 ∘C).
An analytical method using sorbent tube sampling followed by TD–GC–MS analysis for the determination of monoterpenes (MTs, C10), sesquiterpenes (SQTs, C15) and diterpenes (DTs, C20) in gas-phase samples was developed. The intermediate precision (3 %–10 %) and expanded measurement uncertainties (16 %–55 %) for terpenes were considered to be adequate and fit for purpose. The LOQ values for MTs, SQTs and DTs were 13–88, 33–340 and 287–518 pg, respectively. If using a sample volume of 5 L in offline sampling, the LOQ values would be approximately 0.5–2.8 pptv for MTs, 0.8–7.5 pptv for SQTs and 5.1–9.3 pptv for DTs.
The sampling recovery results (15 m long Teflon FEP line, 1 m heated stainless-steel line and a Teflon cuvette bag) were mostly acceptable (within 100±20 %) for all studied compounds. For example, the recoveries of DTs were on average 86±1% and 85±6% when the 1 m heated stainless-steel and 15 m Teflon FEP sampling lines were tested, respectively. These sampling recovery results of DTs were promising, since they demonstrated that the DTs were not lost in excessive amounts in the sampling lines tested.
Comparison of online-mode sampling and offline-mode sampling with TD–GC–MS1 revealed that some of the terpenes are lost in excessive amounts in the online sampling mode. The online-mode sampling efficiency could be improved by changing the stainless-steel surface to glass in the sample path and by increasing the sample air relative humidity. However, based on the tentative experiments, the online-mode TD–GC–MS sampling is only valid quantitatively for monoterpenes and some sesquiterpenes. Diterpene and caryophyllene oxide results were poor in online sampling mode even with the best possible setup tested (recoveries typically < 70 %), limiting the applicability to only semi-quantitative or qualitative analysis. These online-mode recovery results highlight the importance of testing each experimental setup in practise prior to conducting campaign measurements.
Based on the ozone reactivity experiments conducted, the literature-reported predicted ozone reaction rate coefficients () of some diterpenes might be underestimated. Our results indicated that the experimentally derived value of ent-kaurene was approximately 2 orders of magnitude higher than the literature-predicted value. Consequently, the role of diterpenes in atmospheric oxidation reactions could be more profound than predicted. In addition, the results also highlight the difficulties related to the determination of DTs in ambient air. Theoretically, the emissions of DTs are very low to begin with and the high reactivity decreases the concentrations even further, making the time frame of DT analysis extremely short.
Based on the real sample application results, we could characterise the DTs emitted by Norway spruce and Scots pine. Multiple DTs and similar high-molecular-weight BVOCs () could be detected in the emissions; however, only a few could be tentatively identified. Of the DTs tentatively identified in this study (e.g. rimuene, cembrene, sandaracopimaradiene, 13-epi-manool oxide and abietadiene), many have been detected previously in essential oil samples and/or even in atmospheric air elsewhere. The DTs emitted by different tree species were partly species specific (e.g. cembrene and rimuene were observed in spruce emissions, but not in pine emissions). It would be beneficial to perform similar experiments with other tree species for comparability, and in order to identify the possible common and specific DT traces.
In general, the semi-quantitatively estimated DT emission rates were roughly 1 to 3 orders of magnitude lower than the MT and SQT emission rates. Diterpenes were mostly emitted at high temperatures (typically ≥35 ∘C) and the temperature dependence in emissions of DTs was relatively more profound than in those of MTs and SQTs. In principle, the results indicated that high temperatures are needed for instrumentally detectable levels of DTs to be emitted in branch enclosure measurements. These conditions could be met, for example, during direct sunlight exposure and on sunny warm days. In addition, the highest temperatures tested in this study (up to 60 ∘C) might be reached under extreme situations during atmospheric measurements, such as in the surroundings of forest fires. Long-term measurements in real-life field conditions would be required to truly study the emissions of DTs (in addition to other terpenes and BVOCs) and their atmospheric relevancy.
Data are available upon request by contacting the corresponding author (aku.helin@fmi.fi).
The supplement related to this article is available online at: https://doi.org/10.5194/amt-13-3543-2020-supplement.
AH, HaH and HeH designed the experiments, and AH and HeH carried them out. AH and HeH performed the data analysis. AH prepared the manuscript with contributions from all co-authors.
The authors declare that they have no conflict of interest.
The staff of the SMEAR II station are thanked for their collaboration. Toni Tykkä and Anne-Mari Mäkelä are thanked for help in the laboratory.
This research has been supported by the Academy of Finland (grant no. 316151), the Academy of Finland (grant no. 275608), and the Centre of Excellence in Atmospheric Sciences (grant no. 307331).
This paper was edited by Anna Novelli and reviewed by Therese Salameh and two anonymous referees.
Aaltonen, H., Pumpanen, J., Pihlatie, M., Hakola, H., Hellén, H., Kulmala, L., Vesala, T., and Bäck, J.: Boreal pine forest floor biogenic volatile organic compound emissions peak in early summer and autumn, Agr. Forest Meteorol., 151, 682–691, https://doi.org/10.1016/j.agrformet.2010.12.010, 2011.
ACTRIS: Deliverable 3.17. Updated Measurement Guideline for NOx and VOCs, available at: https://www.actris.eu/Portals/46/Documentation/actris2/Deliverables/public/WP3_D3.17_M42.pdf?ver=2018-11-12-143115-077 (last access: 27 March 2020), 2018.
Adams, R. P.: Identification of essential oil components by gas chromatography/mass spectrometry, Allured Publishing Corporation, Carol Stream, IL, USA, 2007.
Anttila, P. and Tuovinen, J.-P.: Trends of primary and secondary pollutant concentrations in Finland in 1994–2007, Atmos. Environ., 44, 30–41, https://doi.org/10.1016/j.atmosenv.2009.09.041, 2010.
Arnts, R. R.: Evaluation of adsorbent sampling tube materials and Tenax-TA for analysis of volatile biogenic organic compounds, Atmos. Environ., 44, 1579–1584, https://doi.org/10.1016/j.atmosenv.2010.01.004, 2010.
Atkinson, R. and Arey, J.: Gas-phase tropospheric chemistry of biogenic volatile organic compounds: a review, Atmos. Environ., 37, 197–219, https://doi.org/10.1016/S1352-2310(03)00391-1, 2003.
Bäck, J., Aalto, J., Henriksson, M., Hakola, H., He, Q., and Boy, M.: Chemodiversity of a Scots pine stand and implications for terpene air concentrations, Biogeosciences, 9, 689–702, https://doi.org/10.5194/bg-9-689-2012, 2012.
Bouvier-Brown, N. C., Goldstein, A. H., Gilman, J. B., Kuster, W. C., and de Gouw, J. A.: In-situ ambient quantification of monoterpenes, sesquiterpenes, and related oxygenated compounds during BEARPEX 2007: implications for gas- and particle-phase chemistry, Atmos. Chem. Phys., 9, 5505–5518, https://doi.org/10.5194/acp-9-5505-2009, 2009.
Calogirou, A., Larsen, B. R., Brussol, C., Duane, M., and Kotzias, D.:. Decomposition of terpenes by ozone during sampling on Tenax, Anal. Chem., 68, 1499–1506, 1996.
Chan, A. W. H., Kreisberg, N. M., Hohaus, T., Campuzano-Jost, P., Zhao, Y., Day, D. A., Kaser, L., Karl, T., Hansel, A., Teng, A. P., Ruehl, C. R., Sueper, D. T., Jayne, J. T., Worsnop, D. R., Jimenez, J. L., Hering, S. V., and Goldstein, A. H.: Speciated measurements of semivolatile and intermediate volatility organic compounds (S/IVOCs) in a pine forest during BEACHON-RoMBAS 2011, Atmos. Chem. Phys., 16, 1187–1205, https://doi.org/10.5194/acp-16-1187-2016, 2016.
Eerdekens, G., Yassaa, N., Sinha, V., Aalto, P. P., Aufmhoff, H., Arnold, F., Fiedler, V., Kulmala, M., and Williams, J.: VOC measurements within a boreal forest during spring 2005: on the occurrence of elevated monoterpene concentrations during night time intense particle concentration events, Atmos. Chem. Phys., 9, 8331–8350, https://doi.org/10.5194/acp-9-8331-2009, 2009.
Ehn, M., Thornton, J. A., Kleist, E., Sipilä, M., Junninen, H., Pullinen, I., Springer, M., Rubach, F., Tillmann, R., Lee, B., Lopez-Hilfiker, F., Andres, S., Acir, I.-H., Rissanen, M., Jokinen, T., Schobesberger, S., Kangasluoma, J., Kontkanen, J., Nieminen, T., Kurtén, T., Nielsen, L. B., Jørgensen, S., Kjaergaard, H. G., Canagaratna, M., Maso, M. D., Berndt, T., Petäjä, T., Wahner, A., Kerminen, V.-M., Kulmala, M., Worsnop, D. R., Wildt, J., and Mentel, T. F.: A large source of low-volatility secondary organic aerosol, Nature, 506, 476–479, https://doi.org/10.1038/nature13032, 2014.
Fick, J., Pommer, L., Andersson, B., and Nilsson, C.: Ozone removal in the sampling of parts per billion levels of Terpenoid compounds: an evaluation of different scrubber materials, Environ. Sci. Technol., 35, 1458–1462, 2001.
Guenther, A., Hewitt, C. N., Erickson, D., Fall, R., Geron, C., Graedel, T., Harley, P., Klinger, L., Lerdau, M., and McKay, W.: A global model of natural volatile organic compound emissions, J. Geophys. Res.-Atmos., 100, 8873–8892, 1995.
Guenther, A. B., Jiang, X., Heald, C. L., Sakulyanontvittaya, T., Duhl, T., Emmons, L. K., and Wang, X.: The Model of Emissions of Gases and Aerosols from Nature version 2.1 (MEGAN2.1): an extended and updated framework for modeling biogenic emissions, Geosci. Model Dev., 5, 1471–1492, https://doi.org/10.5194/gmd-5-1471-2012, 2012.
Haberstroh, S., Kreuzwieser, J., Lobo-do-Vale, R., Caldeira, M. C., Dubbert, M., and Werner, C.: Terpenoid emissions of two Mediterranean woody species in response to drought stress, Front. Plant Sci., 9, 1071, https://doi.org/10.3389/fpls.2018.01071, 2018.
Hakola, H., Rinne, J., and Laurila, T.: The hydrocarbon emission rates of tea-leafed willow (Salix phylicifolia), silver birch (Betula pendula) and European aspen (Populus tremula), Atmos. Environ., 32, 1825–1833, 1998.
Hakola, H., Laurila, T., Lindfors, V., Hellén, H., Gaman, A., and Rinne, J.: Variation of the VOC emission rates of birch species during the growing season, Boreal Environ. Res., 6, 237–249, 2001.
Hakola, H., Tarvainen, V., Laurila, T., Hiltunen, V., Hellén, H., and Keronen, P.: Seasonal variation of VOC concentrations above a boreal coniferous forest, Atmos. Environ., 37, 1623–1634, 2003.
Hakola, H., Tarvainen, V., Bäck, J., Ranta, H., Bonn, B., Rinne, J., and Kulmala, M.: Seasonal variation of mono- and sesquiterpene emission rates of Scots pine, Biogeosciences, 3, 93–101, https://doi.org/10.5194/bg-3-93-2006, 2006.
Hakola, H., Hellén, H., Tarvainen, V., Bäck, J., Patokoski, J., and Rinne, J.: Annual variations of atmospheric VOC concentrations in a boreal forest, Boreal Environ. Res., 14, 722–730 2009.
Hakola, H., Tarvainen, V., Praplan, A. P., Jaars, K., Hemmilä, M., Kulmala, M., Bäck, J., and Hellén, H.: Terpenoid and carbonyl emissions from Norway spruce in Finland during the growing season, Atmos. Chem. Phys., 17, 3357–3370, https://doi.org/10.5194/acp-17-3357-2017, 2017.
Hari, P. and Kulmala, M.: Station for Measuring Ecosystem-Atmosphere Relations (SMEAR II), Boreal Environ. Res., 10, 315–322, 2005.
Hellén, H., Kuronen, P., and Hakola, H.: Heated stainless steel tube for ozone removal in the ambient air measurements of mono-and sesquiterpenes, Atmos. Environ., 57, 35–40, https://doi.org/10.1016/j.atmosenv.2012.04.019, 2012.
Hellén, H., Praplan, A. P., Tykkä, T., Ylivinkka, I., Vakkari, V., Bäck, J., Petäjä, T., Kulmala, M., and Hakola, H.: Long-term measurements of volatile organic compounds highlight the importance of sesquiterpenes for the atmospheric chemistry of a boreal forest, Atmos. Chem. Phys., 18, 13839–13863, https://doi.org/10.5194/acp-18-13839-2018, 2018.
Helmig, D., Revermann, T., Pollmann, J., Kaltschmidt, O., Hernandez, A. J., Bocquet, F., and David, D.: Calibration system and analytical considerations for quantitative sesquiterpene measurements in air, J. Chromatogr. A, 1002, 193–211, 2003.
Helmig, D., Bocquet, F., Pollmann, J., and Revermann, T.: Analytical techniques for sesquiterpene emission rate studies in vegetation enclosure experiments, Atmos. Environ., 38, 557–572, https://doi.org/10.1016/j.atmosenv.2003.10.012, 2004.
Hoffmann, T., Odum, J. R., Bowman, F., Collins, D., Klockow, D., Flagan, R. C., and Seinfeld, J. H.: Formation of organic aerosols from the oxidation of biogenic hydrocarbons, J. Atmos. Chem., 26, 189–222, https://doi.org/10.1023/A:1005734301837, 1997.
Jimenez, J. L., Canagaratna, M. R., Donahue, N. M., Prevot, A. S. H., Zhang, Q., Kroll, J. H., DeCarlo, P. F., Allan, J. D., Coe, H., Ng, N. L., Aiken, A. C., Docherty, K. S., Ulbrich, I. M., Grieshop, A. P., Robinson, A. L., Duplissy, J., Smith, J. D., Wilson, K. R., Lanz, V. A., Hueglin, C., Sun, Y. L., Tian, J., Laaksonen, A., Raatikainen, T., Rautiainen, J., Vaattovaara, P., Ehn, M., Kulmala, M., Tomlinson, J. M., Collins, D. R., Cubison, M. J., Dunlea, J., Huffman, J. A., Onasch, T. B., Alfarra, M. R., Williams, P. I., Bower, K., Kondo, Y., Schneider, J., Drewnick, F., Borrmann, S., Weimer, S., Demerjian, K., Salcedo, D., Cottrell, L., Griffin, R., Takami, A., Miyoshi, T., Hatakeyama, S., Shimono, A., Sun, J. Y., Zhang, Y. M., Dzepina, K., Kimmel, J. R., Sueper, D., Jayne, J. T., Herndon, S. C., Trimborn, A. M., Williams, L. R., Wood, E. C., Middlebrook, A. M., Kolb, C. E., Baltensperger, U., and Worsnop, D. R.: Evolution of Organic Aerosols in the Atmosphere, Science, 326, 1525–1529, https://doi.org/10.1126/science.1180353, 2009.
Joensuu, J., Altimir, N., Hakola, H., Rostás, M., Raivonen, M., Vestenius, M., Aaltonen, H., Riederer, M., and Bäck, J.: Role of needle surface waxes in dynamic exchange of mono- and sesquiterpenes, Atmos. Chem. Phys., 16, 7813–7823, https://doi.org/10.5194/acp-16-7813-2016, 2016.
Jones, C. E., Kato, S., Nakashima, Y., and Kajii, Y.: A novel fast gas chromatography method for higher time resolution measurements of speciated monoterpenes in air, Atmos. Meas. Tech., 7, 1259–1275, https://doi.org/10.5194/amt-7-1259-2014, 2014.
Judzentiene, A. and Kupcinskiene, E.: Chemical composition on essential oils from needles of Pinus sylvestris L. grown in northern Lithuania, J. Essent. Oil Res., 20, 26–29, https://doi.org/10.1080/10412905.2008.9699413, 2008.
Judžentienė, A., Šližytė, J., Stiklienė, A., and Kupčinskienė, E.: Characteristics of essential oil composition in the needles of young stand of Scots pine (Pinus sylvestris L.) growing along aerial ammonia gradient, Chemija, 17, 67–73, 2006.
Kanerva, S., Kitunen, V., Loponen, J., and Smolander, A.: Phenolic compounds and terpenes in soil organic horizon layers under silver birch, Norway spruce and Scots pine, Biol. Fert. Soils, 44, 547–556, https://doi.org/10.1007/s00374-007-0234-6, 2008.
Kännaste, A., Zhao, T., Lindström, A., Stattin, E., Långström, B., and Borg-Karlson, A.-K.: Odors of Norway spruce (Picea abies L.) seedlings: differences due to age and chemotype, Trees, 27, 149–159, https://doi.org/10.1007/s00468-012-0783-7, 2013.
Kontkanen, J., Paasonen, P., Aalto, J., Bäck, J., Rantala, P., Petäjä, T., and Kulmala, M.: Simple proxies for estimating the concentrations of monoterpenes and their oxidation products at a boreal forest site, Atmos. Chem. Phys., 16, 13291–13307, https://doi.org/10.5194/acp-16-13291-2016, 2016.
Kupcinskiene, E., Stikliene, A., and Judzentiene, A.: The essential oil qualitative and quantitative composition in the needles of Pinus sylvestris L. growing along industrial transects, Environ. Pollut., 155, 481–491, https://doi.org/10.1016/j.envpol.2008.02.001, 2008.
Li, H., Riva, M., Rantala, P., Heikkinen, L., Daellenbach, K., Krechmer, J. E., Flaud, P.-M., Worsnop, D., Kulmala, M., Villenave, E., Perraudin, E., Ehn, M., and Bianchi, F.: Terpenes and their oxidation products in the French Landes forest: insights from Vocus PTR-TOF measurements, Atmos. Chem. Phys., 20, 1941–1959, https://doi.org/10.5194/acp-20-1941-2020, 2020.
Mäki, M., Heinonsalo, J., Hellén, H., and Bäck, J.: Contribution of understorey vegetation and soil processes to boreal forest isoprenoid exchange, Biogeosciences, 14, 1055–1073, https://doi.org/10.5194/bg-14-1055-2017, 2017.
Matsunaga, S. N., Chatani, S., Nakatsuka, S., Kusumoto, D., Kubota, K., Utsumi, Y., Enoki, T., Tani, A., and Hiura, T.: Determination and potential importance of diterpene (kaur-16-ene) emitted from dominant coniferous trees in Japan, Chemosphere, 87, 886–893, https://doi.org/10.1016/j.chemosphere.2012.01.040, 2012.
Mermet, K., Sauvage, S., Dusanter, S., Salameh, T., Léonardis, T., Flaud, P.-M., Perraudin, É., Villenave, É., and Locoge, N.: Optimization of a gas chromatographic unit for measuring biogenic volatile organic compounds in ambient air, Atmos. Meas. Tech., 12, 6153–6171, https://doi.org/10.5194/amt-12-6153-2019, 2019.
Nölscher, A. C., Williams, J., Sinha, V., Custer, T., Song, W., Johnson, A. M., Axinte, R., Bozem, H., Fischer, H., Pouvesle, N., Phillips, G., Crowley, J. N., Rantala, P., Rinne, J., Kulmala, M., Gonzales, D., Valverde-Canossa, J., Vogel, A., Hoffmann, T., Ouwersloot, H. G., Vilà-Guerau de Arellano, J., and Lelieveld, J.: Summertime total OH reactivity measurements from boreal forest during HUMPPA-COPEC 2010, Atmos. Chem. Phys., 12, 8257–8270, https://doi.org/10.5194/acp-12-8257-2012, 2012.
Norin, T. and Winell, B.: Extractives from the bark of common spruce, Picea abies L. karst, Acta Chem. Scand., 26, 2289–2296, 1972.
Ortega, J. and Helmig, D.: Approaches for quantifying reactive and low-volatility biogenic organic compound emissions by vegetation enclosure techniques–Part A, Chemosphere, 72, 343–364, 2008.
Pankow, J. F., Luo, W., Melnychenko, A. N., Barsanti, K. C., Isabelle, L. M., Chen, C., Guenther, A. B., and Rosenstiel, T. N.: Volatilizable Biogenic Organic Compounds (VBOCs) with two dimensional Gas Chromatography-Time of Flight Mass Spectrometry (GC × GC-TOFMS): sampling methods, VBOC complexity, and chromatographic retention data, Atmos. Meas. Tech., 5, 345–361, https://doi.org/10.5194/amt-5-345-2012, 2012.
Pollmann, J., Ortega, J., and Helmig, D.: Analysis of atmospheric sesquiterpenes: Sampling losses and mitigation of ozone interferences, Environ. Sci. Technol., 39, 9620–9629, 2005.
Praplan, A. P., Tykkä, T., Chen, D., Boy, M., Taipale, D., Vakkari, V., Zhou, P., Petäjä, T., and Hellén, H.: Long-term total OH reactivity measurements in a boreal forest, Atmos. Chem. Phys., 19, 14431–14453, https://doi.org/10.5194/acp-19-14431-2019, 2019.
Radulescu, V., Saviuc, C., Chifiriuc, C., Oprea, E., Ilies, D. C., Marutescu, L., and Lazar, V.: Chemical composition and antimicrobial activity of essential oil from shoots spruce (Picea abies L.), Rev. Chim.-Bucharest, 62, 69–72, 2011.
Rinne, J., Taipale, R., Markkanen, T., Ruuskanen, T. M., Hellén, H., Kajos, M. K., Vesala, T., and Kulmala, M.: Hydrocarbon fluxes above a Scots pine forest canopy: measurements and modeling, Atmos. Chem. Phys., 7, 3361–3372, https://doi.org/10.5194/acp-7-3361-2007, 2007.
Sheu, R., Marcotte, A., Khare, P., Charan, S., Ditto, J. C., and Gentner, D. R.: Advances in offline approaches for chemically speciated measurements of trace gas-phase organic compounds via adsorbent tubes in an integrated sampling-to-analysis system, J. Chromatogr. A, 1575, 80–90, https://doi.org/10.1016/j.chroma.2018.09.014, 2018.
Sindelarova, K., Granier, C., Bouarar, I., Guenther, A., Tilmes, S., Stavrakou, T., Müller, J.-F., Kuhn, U., Stefani, P., and Knorr, W.: Global data set of biogenic VOC emissions calculated by the MEGAN model over the last 30 years, Atmos. Chem. Phys., 14, 9317–9341, https://doi.org/10.5194/acp-14-9317-2014, 2014.
Sinha, V., Williams, J., Crowley, J. N., and Lelieveld, J.: The Comparative Reactivity Method – a new tool to measure total OH Reactivity in ambient air, Atmos. Chem. Phys., 8, 2213–2227, https://doi.org/10.5194/acp-8-2213-2008, 2008.
Sinha, V., Williams, J., Lelieveld, J., Ruuskanen, T. M., Kajos, M. K., Patokoski, J., Hellen, H., Hakola, H., Mogensen, D., Boy, M., Rinne, J., and Kulmala, M.: OH Reactivity Measurements within a Boreal Forest: Evidence for Unknown Reactive Emissions, Environ. Sci. Technol., 44, 6614–6620, https://doi.org/10.1021/es101780b, 2010.
Tumen, I., Hafizoglu, H., Kilic, A., Dönmez, I. E., Sivrikaya, H., and Reunanen, M.: Yields and constituents of essential oil from cones of Pinaceae spp. natively grown in Turkey, Molecules, 15, 5797–5806, https://doi.org/10.3390/molecules15085797, 2010.
Wajs, A., Pranovich, A., Reunanen, M., Willför, S., and Holmbom, B.: Characterisation of volatile organic compounds in stemwood using solid-phase microextraction, Phytochem. Analysis, 17, 91–101, 2006.
van Meeningen, Y., Wang, M., Karlsson, T., Seifert, A., Schurgers, G., Rinnan, R., and Holst, T.: Isoprenoid emission variation of Norway spruce across a European latitudinal transect, Atmos. Environ., 170, 45–57, https://doi.org/10.1016/j.atmosenv.2017.09.045, 2017.
Vanhatalo, A., Ghirardo, A., Juurola, E., Schnitzler, J.-P., Zimmer, I., Hellén, H., Hakola, H., and Bäck, J.: Long-term dynamics of monoterpene synthase activities, monoterpene storage pools and emissions in boreal Scots pine, Biogeosciences, 15, 5047–5060, https://doi.org/10.5194/bg-15-5047-2018, 2018.
Yáñez-Serrano, A., Fasbender, L., Kreuzwieser, J., Dubbert, D., Haberstroh, S., Lobo-do-Vale, R., Caldeira, M., and Werner, C.: Volatile diterpene emission by two Mediterranean Cistaceae shrubs, Sci. Rep.-UK, 8, 6855, https://doi.org/10.1038/s41598-018-25056-w, 2018.
Yang, Y., Shao, M., Wang, X., Nölscher, A. C., Kessel, S., Guenther, A., and Williams, J.: Towards a quantitative understanding of total OH reactivity: A review, Atmos. Environ., 134, 147–161, https://doi.org/10.1016/j.atmosenv.2016.03.010, 2016.
Yassaa, N., Song, W., Lelieveld, J., Vanhatalo, A., Bäck, J., and Williams, J.: Diel cycles of isoprenoids in the emissions of Norway spruce, four Scots pine chemotypes, and in Boreal forest ambient air during HUMPPA-COPEC-2010, Atmos. Chem. Phys., 12, 7215–7229, https://doi.org/10.5194/acp-12-7215-2012, 2012.
Yee, L. D., Isaacman-VanWertz, G., Wernis, R. A., Meng, M., Rivera, V., Kreisberg, N. M., Hering, S. V., Bering, M. S., Glasius, M., Upshur, M. A., Gray Bé, A., Thomson, R. J., Geiger, F. M., Offenberg, J. H., Lewandowski, M., Kourtchev, I., Kalberer, M., de Sá, S., Martin, S. T., Alexander, M. L., Palm, B. B., Hu, W., Campuzano-Jost, P., Day, D. A., Jimenez, J. L., Liu, Y., McKinney, K. A., Artaxo, P., Viegas, J., Manzi, A., Oliveira, M. B., de Souza, R., Machado, L. A. T., Longo, K., and Goldstein, A. H.: Observations of sesquiterpenes and their oxidation products in central Amazonia during the wet and dry seasons, Atmos. Chem. Phys., 18, 10433–10457, https://doi.org/10.5194/acp-18-10433-2018, 2018.