the Creative Commons Attribution 4.0 License.
the Creative Commons Attribution 4.0 License.
 | 08 Jul 2020
Use of automatic radiosonde launchers to measure temperature and humidity profiles from the GRUAN perspective
Rigel Kivi
Jean-Charles Dupont
Bruce Ingleby
Masatomo Fujiwara
Gonzague Romanens
Miguel Hernandez
Xavier Calbet
Marco Rosoldi
Aldo Giunta
Tomi Karppinen
Masami Iwabuchi
Shunsuke Hoshino
Christoph von Rohden
Peter William Thorne
In the last two decades, technological progress has not only seen improvements to the quality of atmospheric upper-air observations but also provided the opportunity to design and implement automated systems able to replace measurement procedures typically performed manually. Radiosoundings, which remain one of the primary data sources for weather and climate applications, are still largely performed around the world manually, although increasingly fully automated upper-air observations are used, from urban areas to the remotest locations, which minimize operating costs and challenges in performing radiosounding launches. This analysis presents a first step to demonstrating the reliability of the automatic radiosonde launchers (ARLs) provided by Vaisala, Meteomodem and Meisei. The metadata and datasets collected by a few existing ARLs operated by the Global Climate Observing System (GCOS) Reference Upper-Air Network (GRUAN) certified or candidate sites (Sodankylä, Payerne, Trappes, Potenza) have been investigated and a comparative analysis of the technical performance (i.e. manual versus ARL) is reported. The performance of ARLs is evaluated as being similar or superior to those achieved with the traditional manual launches in terms of percentage of successful launches, balloon burst and ascent speed. For both temperature and relative humidity, the ground-check comparisons showed a negative bias of a few tenths of a degree and % RH, respectively. Two datasets of parallel soundings between manual and ARL-based measurements, using identical sonde models, provided by Sodankylä and Faa'a stations, showed mean differences between the ARL and manual launches smaller than ±0.2 K up to 10 hPa for the temperature profiles. For relative humidity, differences were smaller than 1 % RH for the Sodankylä dataset up to 300 hPa, while they were smaller than 0.7 % RH for Faa'a station. Finally, the observation-minus-background (O–B) mean and root mean square (rms) statistics for German RS92 and RS41 stations, which operate a mix of manual and ARL launch protocols, calculated using the European Centre for Medium-Range Weather Forecasts (ECMWF) forecast model, are very similar, although RS41 shows larger rms(O–B) differences for ARL stations, in particular for temperature and wind. A discussion of the potential next steps proposed by GRUAN community and other parties is provided, with the aim to lay the basis for the elaboration of a strategy to fully demonstrate the value of ARLs and guarantee that the provided products are traceable and suitable for the creation of GRUAN data products.
- Article
(20783 KB) - Full-text XML
- BibTeX
- EndNote


Radiosondes are one of the primary sources of upper-air data for weather and climate monitoring. Despite the advent and the fast integration of Global Navigation Satellite System Radio Occultation (GNSS-RO) as an effective source of upper-air temperature data (Ho et al., 2017), radiosondes will likely remain an indispensable source of free-atmosphere observational data into the future. Radiosonde observations are applied to a broad spectrum of applications, being input data for weather prediction models and global reanalysis, nowcasting, pollution and radiative transfer models, monitoring data for weather and climate change research, and ground reference for satellite and also for other in situ and remote sensing profiling data.
The analysis of historical radiosonde data archives has repeatedly highlighted that changes in operational radiosondes introduce clear discontinuities in the collected time series (Thorne et al., 2005; Sherwood et al., 2008; Haimberger et al., 2011). Moreover, where radiosonde observations have been used in numerical weather prediction, systematic errors have sometimes been disregarded and the instrumental uncertainties have been estimated in a non-rigorous way (Carminati et al., 2019). Nowadays, there is a broad consensus on the need to have reference measurements with quantified traceable uncertainties for scientific and user-oriented applications. The Global Climate Observing System (GCOS) Reference Upper-Air Network (GRUAN) provides fundamental guidelines for establishing and maintaining reference-quality atmospheric observations which are based on principal concepts of metrology, in particular, traceability (Bodeker et al., 2016).
Apart from direct instrument performance aspects of the radiosounding equipment and radiosonde model, it must be acknowledged that there are many challenges in performing radiosounding launches. During the preparation and launch phase, many circumstances may interfere with the smooth operation of radiosoundings, such as undertaking launches at night, harsh meteorological conditions for balloon train preparation, if any, and safe handling when using hydrogen as balloon gas, and last but not least the risk of errors/mishandling by the operators. Additional expenditure may be required when observations are performed in remote regions of the globe, including the polar regions, deserts or remote islands.
Since the start of radiosounding efforts in the early to mid-20th century, the radiosounding systems and the radiosondes themselves have radically changed in size, weight and performance. For example, a very important innovation was the automation of the data processing and message production from about 1980. Of particular note is that thanks to new technologies, over recent decades, three manufacturers have developed and deployed fully automatic radiosonde launchers (ARLs) able to perform unmanned soundings.
ARLs are robotic systems able to complete in an automatic fashion almost all of the operations performed manually by an operator during radiosounding launch preparation and release, including the implementation of ground-check procedures. The advantages of ARLs are in the reduction of the challenges described above as well as in the reduced running costs of a sounding station (e.g. reduction in the need for trained staff and the trend of automating hydrogen production due to cost reasons and to the helium international crisis) and in ameliorating problems of recruiting long-term operators for remote locations. Nevertheless, it must be also stressed that the system must be regularly stocked and maintained to avoid major issues and high repair costs being incurred. In addition, with changes in the radiosonde technology, updates of the systems might be required to enable the use of a new radiosonde type, with periodical costs (variable, every 3–6 years) which might be substantial for a station. In 2018, the National Oceanic and Atmospheric Administration – National Centers for Environmental Information (NOAA-NCEI) published stories on its website which show the potential benefits of using ARLs (http://www.noaa.gov/stories/up-up-and-away-6-benefits-of-automated, last access: 7 May 2018). Within these stories as well as from the feedback collected within the GRUAN community, several radiosonde stations have reported benefits from the use of ARLs and an increase in the percentage of successful soundings with a potential reduction of missing data in the collected data records.
Using recent European Centre for Medium-Range Weather Forecasts (ECMWF) statistics on the number of stations transmitting data to the World Meteorological Organization (WMO) Information System (WIS) and information provided by the GRUAN community and others, there are about 90 ARLs (Fig. 1) providing data for about 700 manual stations. ARL stations cover many countries and remote regions, including Arctic and Antarctic locations, as well as a broad suite of remote Pacific and other island locations. As far as is known, many of the ARL stations only make automated launches. In addition, there are a few more stations, used by research institutions or environmental agencies, not transmitting data via the Global Telecommunication System (GTS) of WIS. The total number of stations operating an ARL worldwide has increased within the last decade (see Tables A1 and A2 in Appendix A).
Vaisala introduced its first automatic system in 1990, Meisei in 2006 and Meteomodem in 2009. Despite their relatively recent development and deployment, ARLs appear to be successful, and the number of deployed systems will likely increase in the future. However, to date, there are very few peer-reviewed papers in the literature dealing with ARLs or comparing ARL versus manual data (often limited to specific examples, e.g. Madonna et al., 2011, 2014). More specifically, there is currently no side-by-side assessment of quality in comparison to manually launched sondes. The aim of this paper is thus to quantify the reliability and stability of ARLs and assess the accuracy of their data compared to the traditional manual systems. A discussion of the measurement traceability and the feasibility to use ARLs in a regular way in GRUAN (http://www.gruan.org, last access: 3 July 2020) is also provided. At present, traceability to SI standards is quantified at several GRUAN sites by the use of a standard humidity chamber (SHC), which can be used for an ARL before the launcher loading only. The SHC is a simple ventilated chamber (∼4–5 m s−1) using distilled water which, during the ground-check procedure, is first heated a few degrees above ambient temperature and then cooled to saturate air at 100 % relative humidity. The SHC allows a check of each radiosonde at 100 % RH using distilled water (or other RH values using solutions with specific salts although these are generally only used at the GRUAN Lead Centre and for sonde characterization and not operational sounding preparation purposes).
The comparison reported in this paper focuses exclusively on temperature and relative humidity profiles and relies upon manufacturer's products (i.e. GRUAN data processing based on the raw data collected by the sonde, described in Dirksen et al., 2014, and Kobayashi et al., 2019, is not used).
The remainder of the paper is structured as follows. In Sect. 2, a short description of the three ARLs is provided. In Sect. 3, the technical performance of the ARLs is investigated on the basis of statistics comparing the technical efficiency of the ARLs versus the manual sounding stations as well as reporting an analysis of the feedback from station operators collected at the GRUAN sites on the advantages, limitations and technical issues faced to maintain and ensure continuity of ARL operations. Section 4 reports on the effect of the usage of ARLs on the stability and the accuracy of ground-check calibration procedures. Section 5 provides statistics obtained from parallel soundings at different sites for both temperature and humidity profiles. Section 6 discusses the comparison between observation-minus-background (O–B) statistics obtained from ARL data and manually launched data, respectively, using the ECMWF short-range forecast fields. Finally, Sect. 7 provides a summary and a description of the experiments which might be performed to design future ARL setups to enable full measurement system traceability to SI units and therefore meet GRUAN requirements for long-term reference climate data.
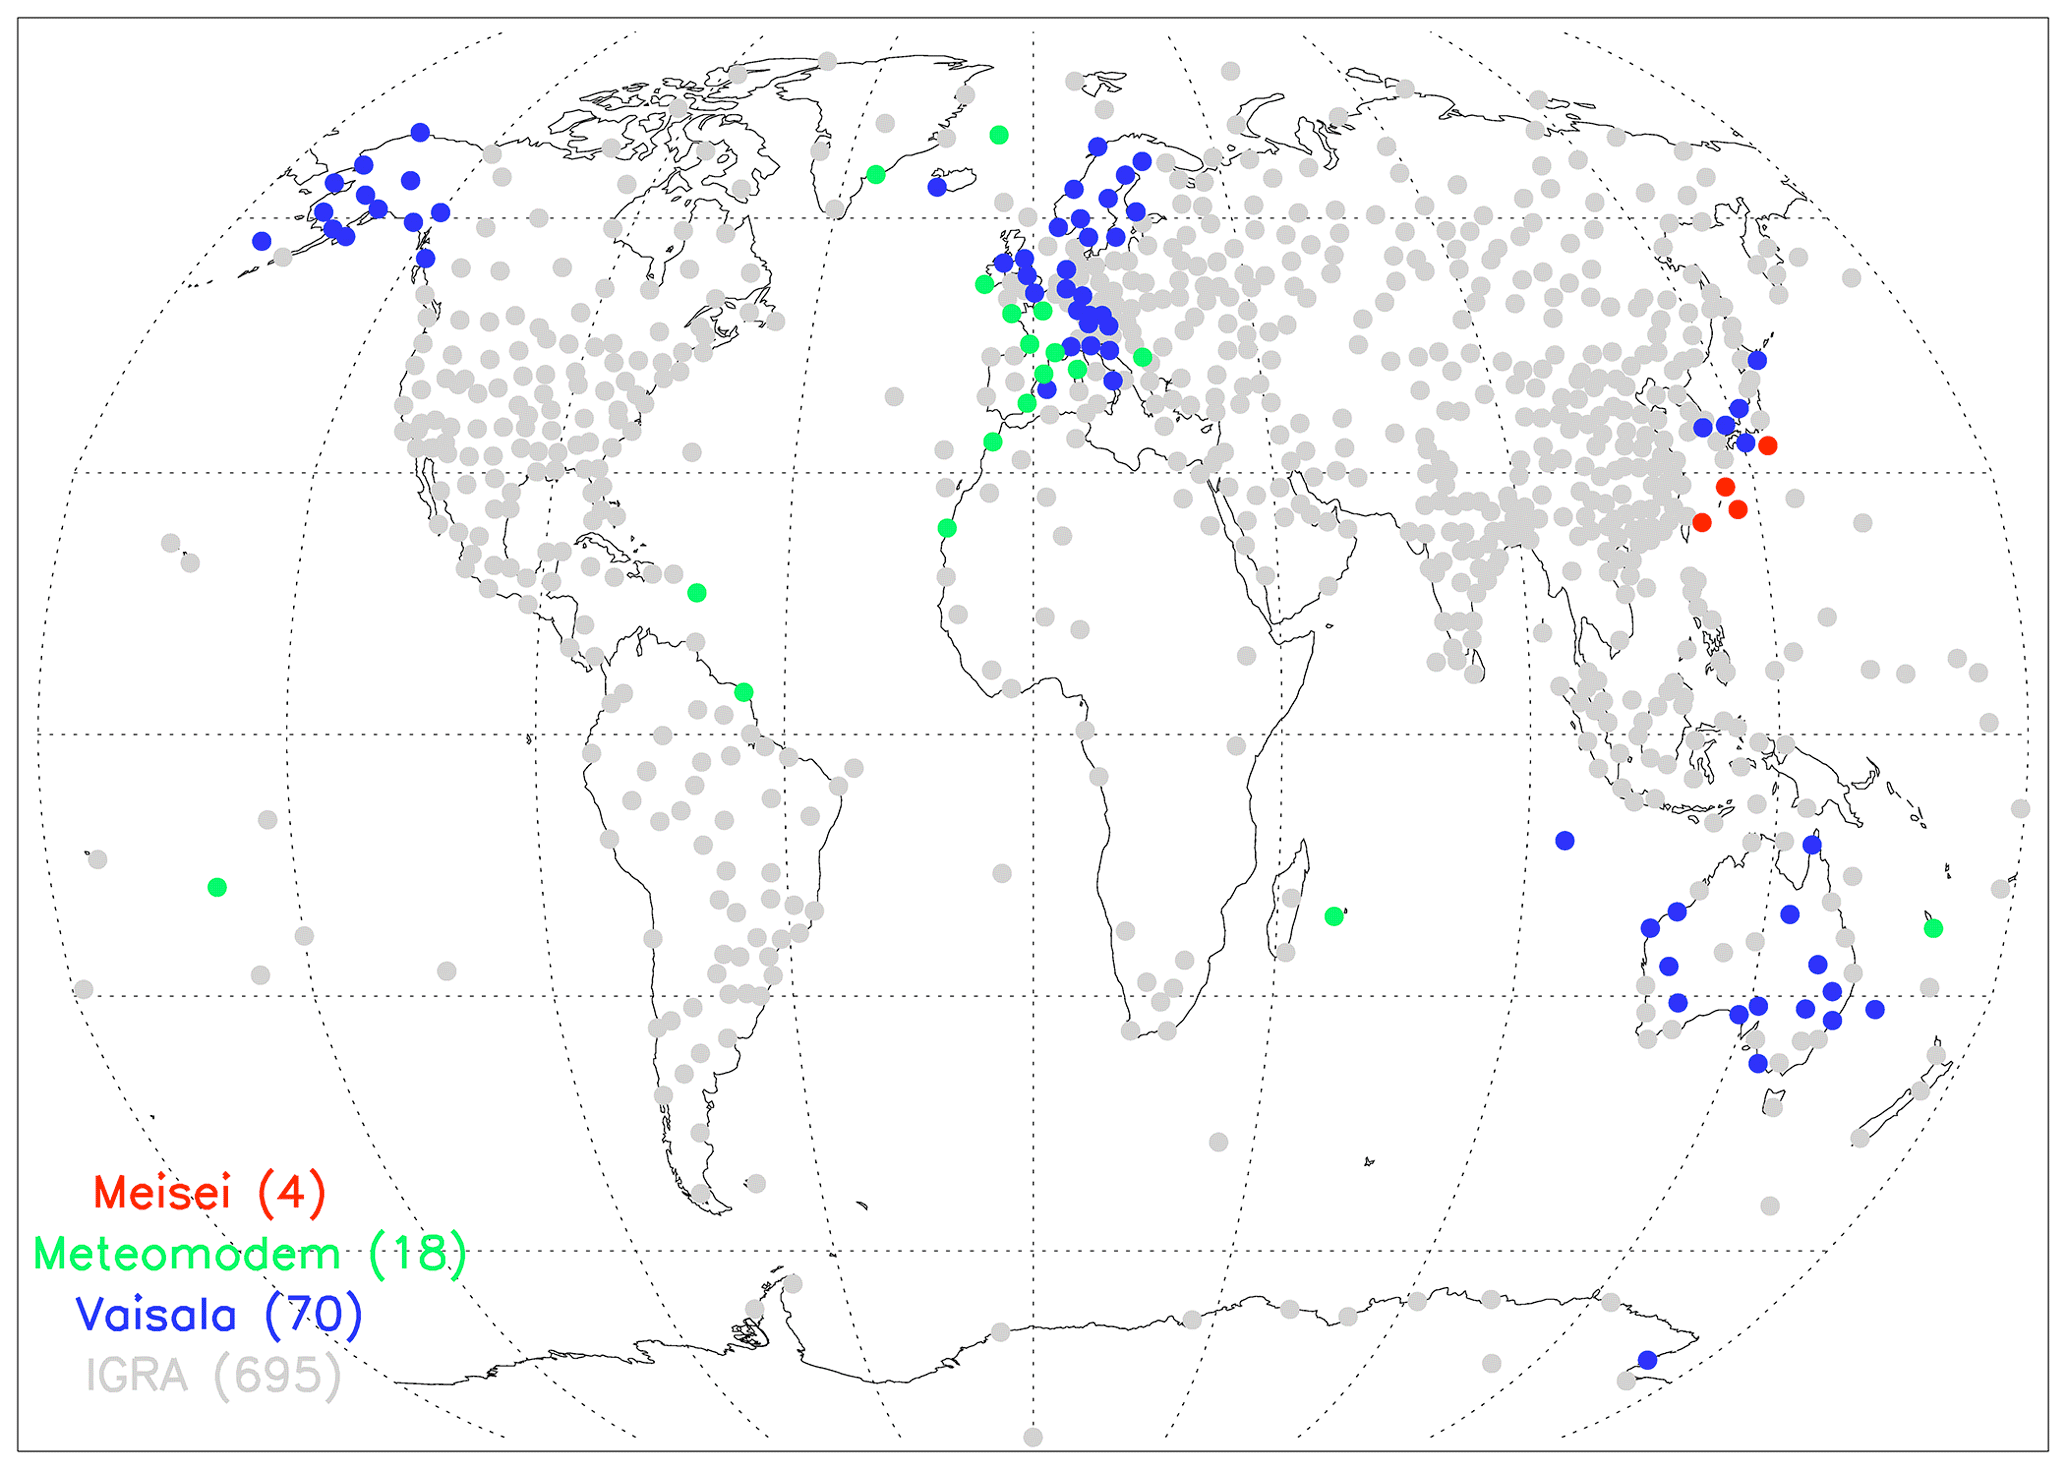
Figure 1Map of stations running an ARL and transmitting the data to the WIS in late 2019 (see also Appendix A). Blue dots indicate the Vaisala ARL, green the Meteomodem and red the Meisei. In light grey, the manual stations providing data to the WIS in September are also reported. The number of stations for each colour is reported in brackets.
2.1 Vaisala Autosonde: brief history and recent system configurations
Automation of upper-air sounding data processing has been making steady progress since the early 1970s and is now widespread (Kostamo, 1992). The Vaisala Autosonde project was started in late 1992 and a working prototype was presented at CIMO, Vienna, in 1993. The prototype was tested in Norway and Sweden in 1993 and 1994. This coincided with the replacement of manual balloon-tracking systems by the Omega and Loran networks. It was provided by Vaisala Oy (Finland) and was permanently installed at the Landvetter station in Sweden in 1994. As of today, about 80 Vaisala ARLs have been installed worldwide and the number of soundings performed has exceeded 800 000, while the annual number of new soundings will soon exceed 70 000 (Lilja et al., 2018). With the newest Autosonde model, it is possible to perform 60 soundings without replenishment, while the earlier models allowed up to 24 soundings.
The first radiosonde type used for an automatic launch was the RS80-15N (during 1994–2006). The RS80 radiosonde was followed by the RS92 (manufactured 2005–2017) and RS41 (available since late 2013) models. The RS92 radiosonde (Dirksen et al., 2014) performs measurements with a nominal measurement uncertainty (provided by the manufacturer) of 0.5 ∘C for temperature, 1.0 hPa for pressure below 100 and 0.6 hPa above, 0.15 m s−1 for wind speed and 5 % RH for relative humidity (https://www.vaisala.com/sites/default/files/documents/RS92SGP-Datasheet-B210358EN-F-LOW.pdf, last access: 3 July 2020). RS41 sonde specifications for nominal measurement uncertainties (provided by the manufacturer) are 0.3 ∘C for temperatures below 16 km and 0.4 ∘C above, 0.01 hPa for pressure sensor, 0.15 m s−1 for wind speed and 4 % RH for relative humidity (https://www.vaisala.com/sites/default/files/documents/RS41-SGP-Datasheet-B211444EN.pdf, last access: 3 July 2020). Note that the Vaisala RS41 radiosondes are of two different types: RS41-SG which is equipped with a pressure sensor and using the GNSS-based method to infer pressure (Lehtinen et al., 2014), and RS41-SGP which uses a pressure sensor as the default. More stations use the RS41-SGP than the RS41-SG; in November 2019, 158 stations were using type RS41-SGP versus 66 stations using type RS41-SG.
To launch the RS41 sondes, the Autosonde ground-check (GC) procedure has been updated. The GC device of the RS41 sondes consists of a wall-mounted box and an activator that contains a wireless reader for the radiosonde. The device is designed to automatically activate the radiosonde and to enable wireless data transfer. An activator is connected to the reader box with a coaxial cable. The ground-check device also includes a barometer, while the surface pressure used as a reference for the launch is obtained from a separate co-located automatic weather station. However, the ground-check pressure device can be used as a backup for the weather station sensor. The GC performs a temperature check where the actual temperature sensor is compared with the one integrated on the humidity sensor chip. In contrast to the RS92 GC, a pre-flight fine tuning of the temperature measurement is no longer applied to the RS41 because the manufacturer found that the performance of the RS41 temperature measurement is practically unchanged during storage.
Humidity is also checked in the GC. The RS41 humidity check consists of two main steps – the sensor reconditioning phase and the 0 % RH check. In the reconditioning phase, the sensor is heated to remove possible contaminants that might affect the measurement results and cause a slight degradation of the sensitivity of the humidity sensor. Then, the humidity sensor is checked and then corrected against a dry humidity condition. Specifically, the dry reference condition of the new zero humidity check is generated in open air by heating the sensor using the integrated heating element on the sensor chip. The procedure is based on the decrease of relative humidity towards zero as the temperature rises high enough (Vaisala, 2013, 2015). This method differs from the RS92 GC where the correction was based on a dry condition generated with desiccants, whose drying capacity gradually fades with time.
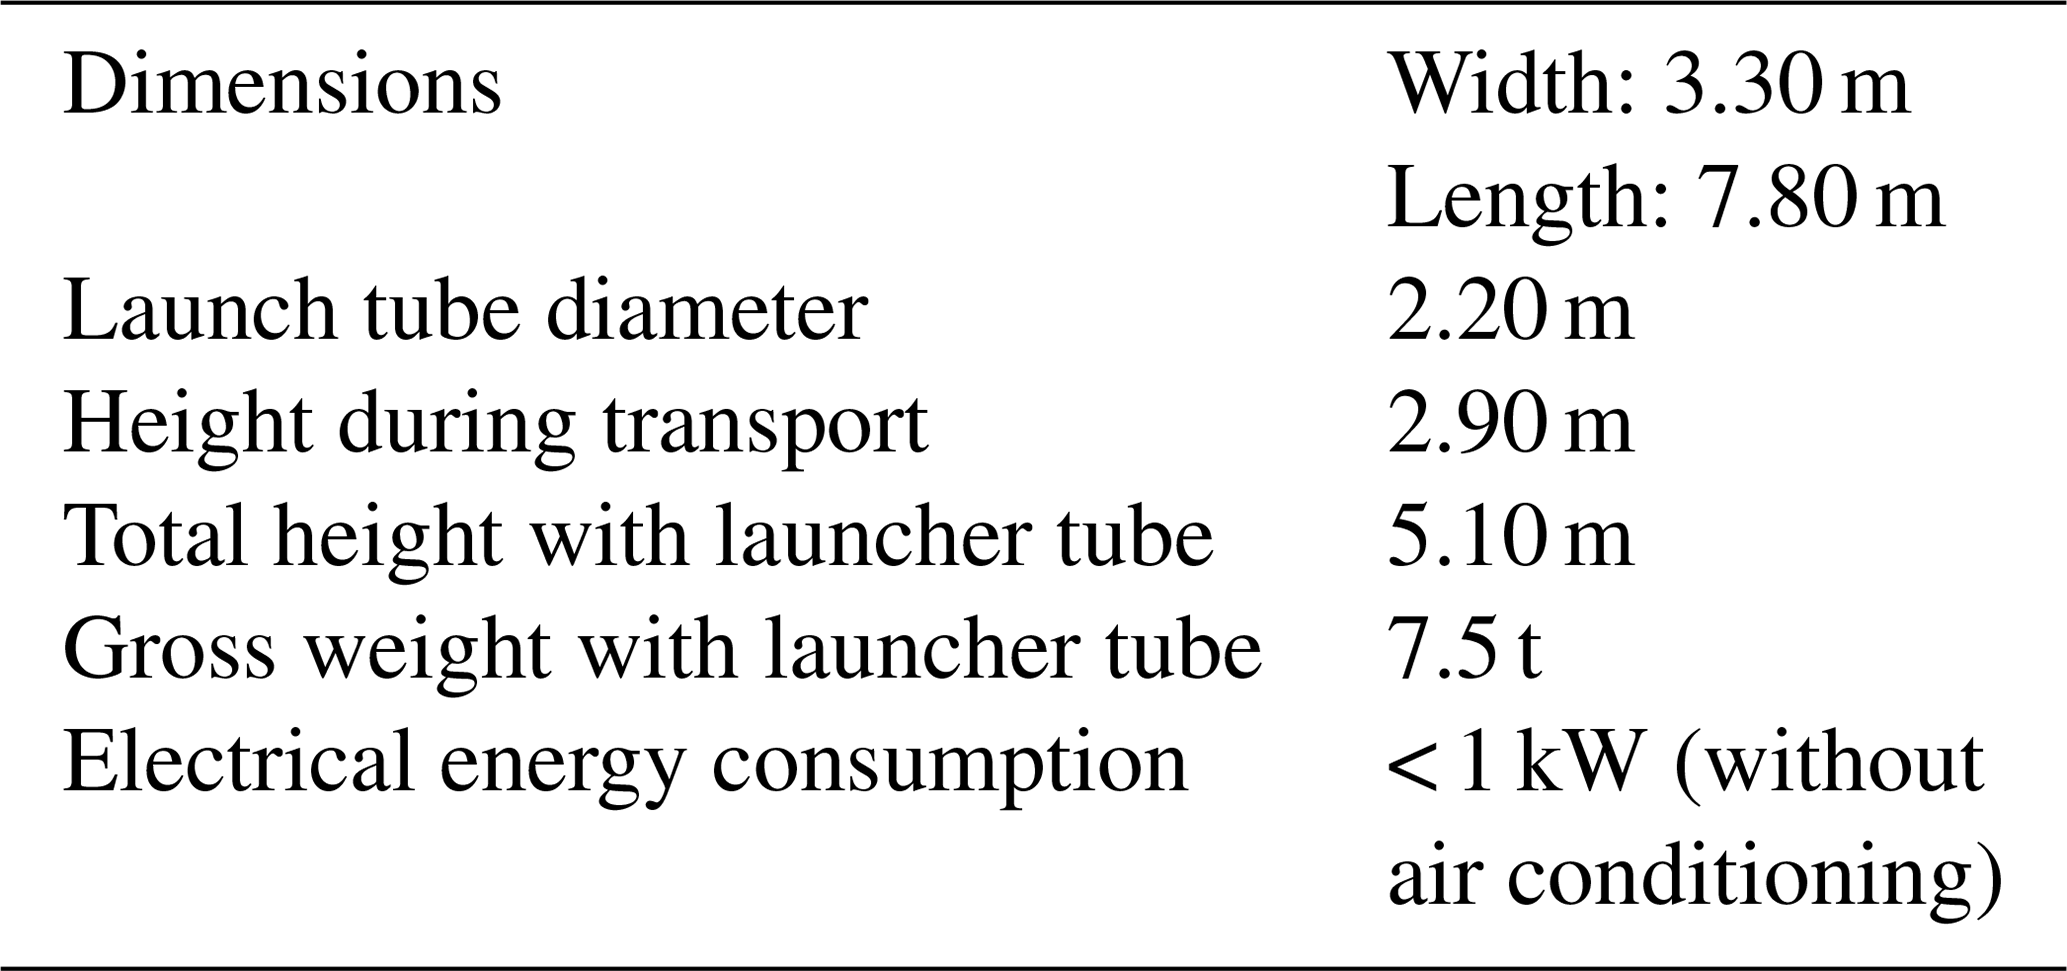
The radiosonde's humidity sensor is reconditioned and ground check is performed during the automated launch preparation in order to ensure similar performance as in manual stations (Lilja et al., 2018). Figure 2a provides a schematic picture of the most recent Vaisala AS41 Autosonde system configuration, while Fig. 2b shows a photograph of the Autosonde system operational at the Finnish Meteorological Institute GRUAN site in Sodankylä (WMO Integrated Global Observing System (WIGOS) station identifier 0-20000-0-02836; 67.34∘ N, 26.63∘ E; 179 m a.s.l.). In Table 1, the basic technical data of the AS41 Autosonde are reported. More details on the specifications of the Vaisala AS41 Autosonde can be found in the data sheet (B211636EN-A_2 pages.pdf) available on the Vaisala website (https://www.vaisala.com, last access: 3 July 2020).
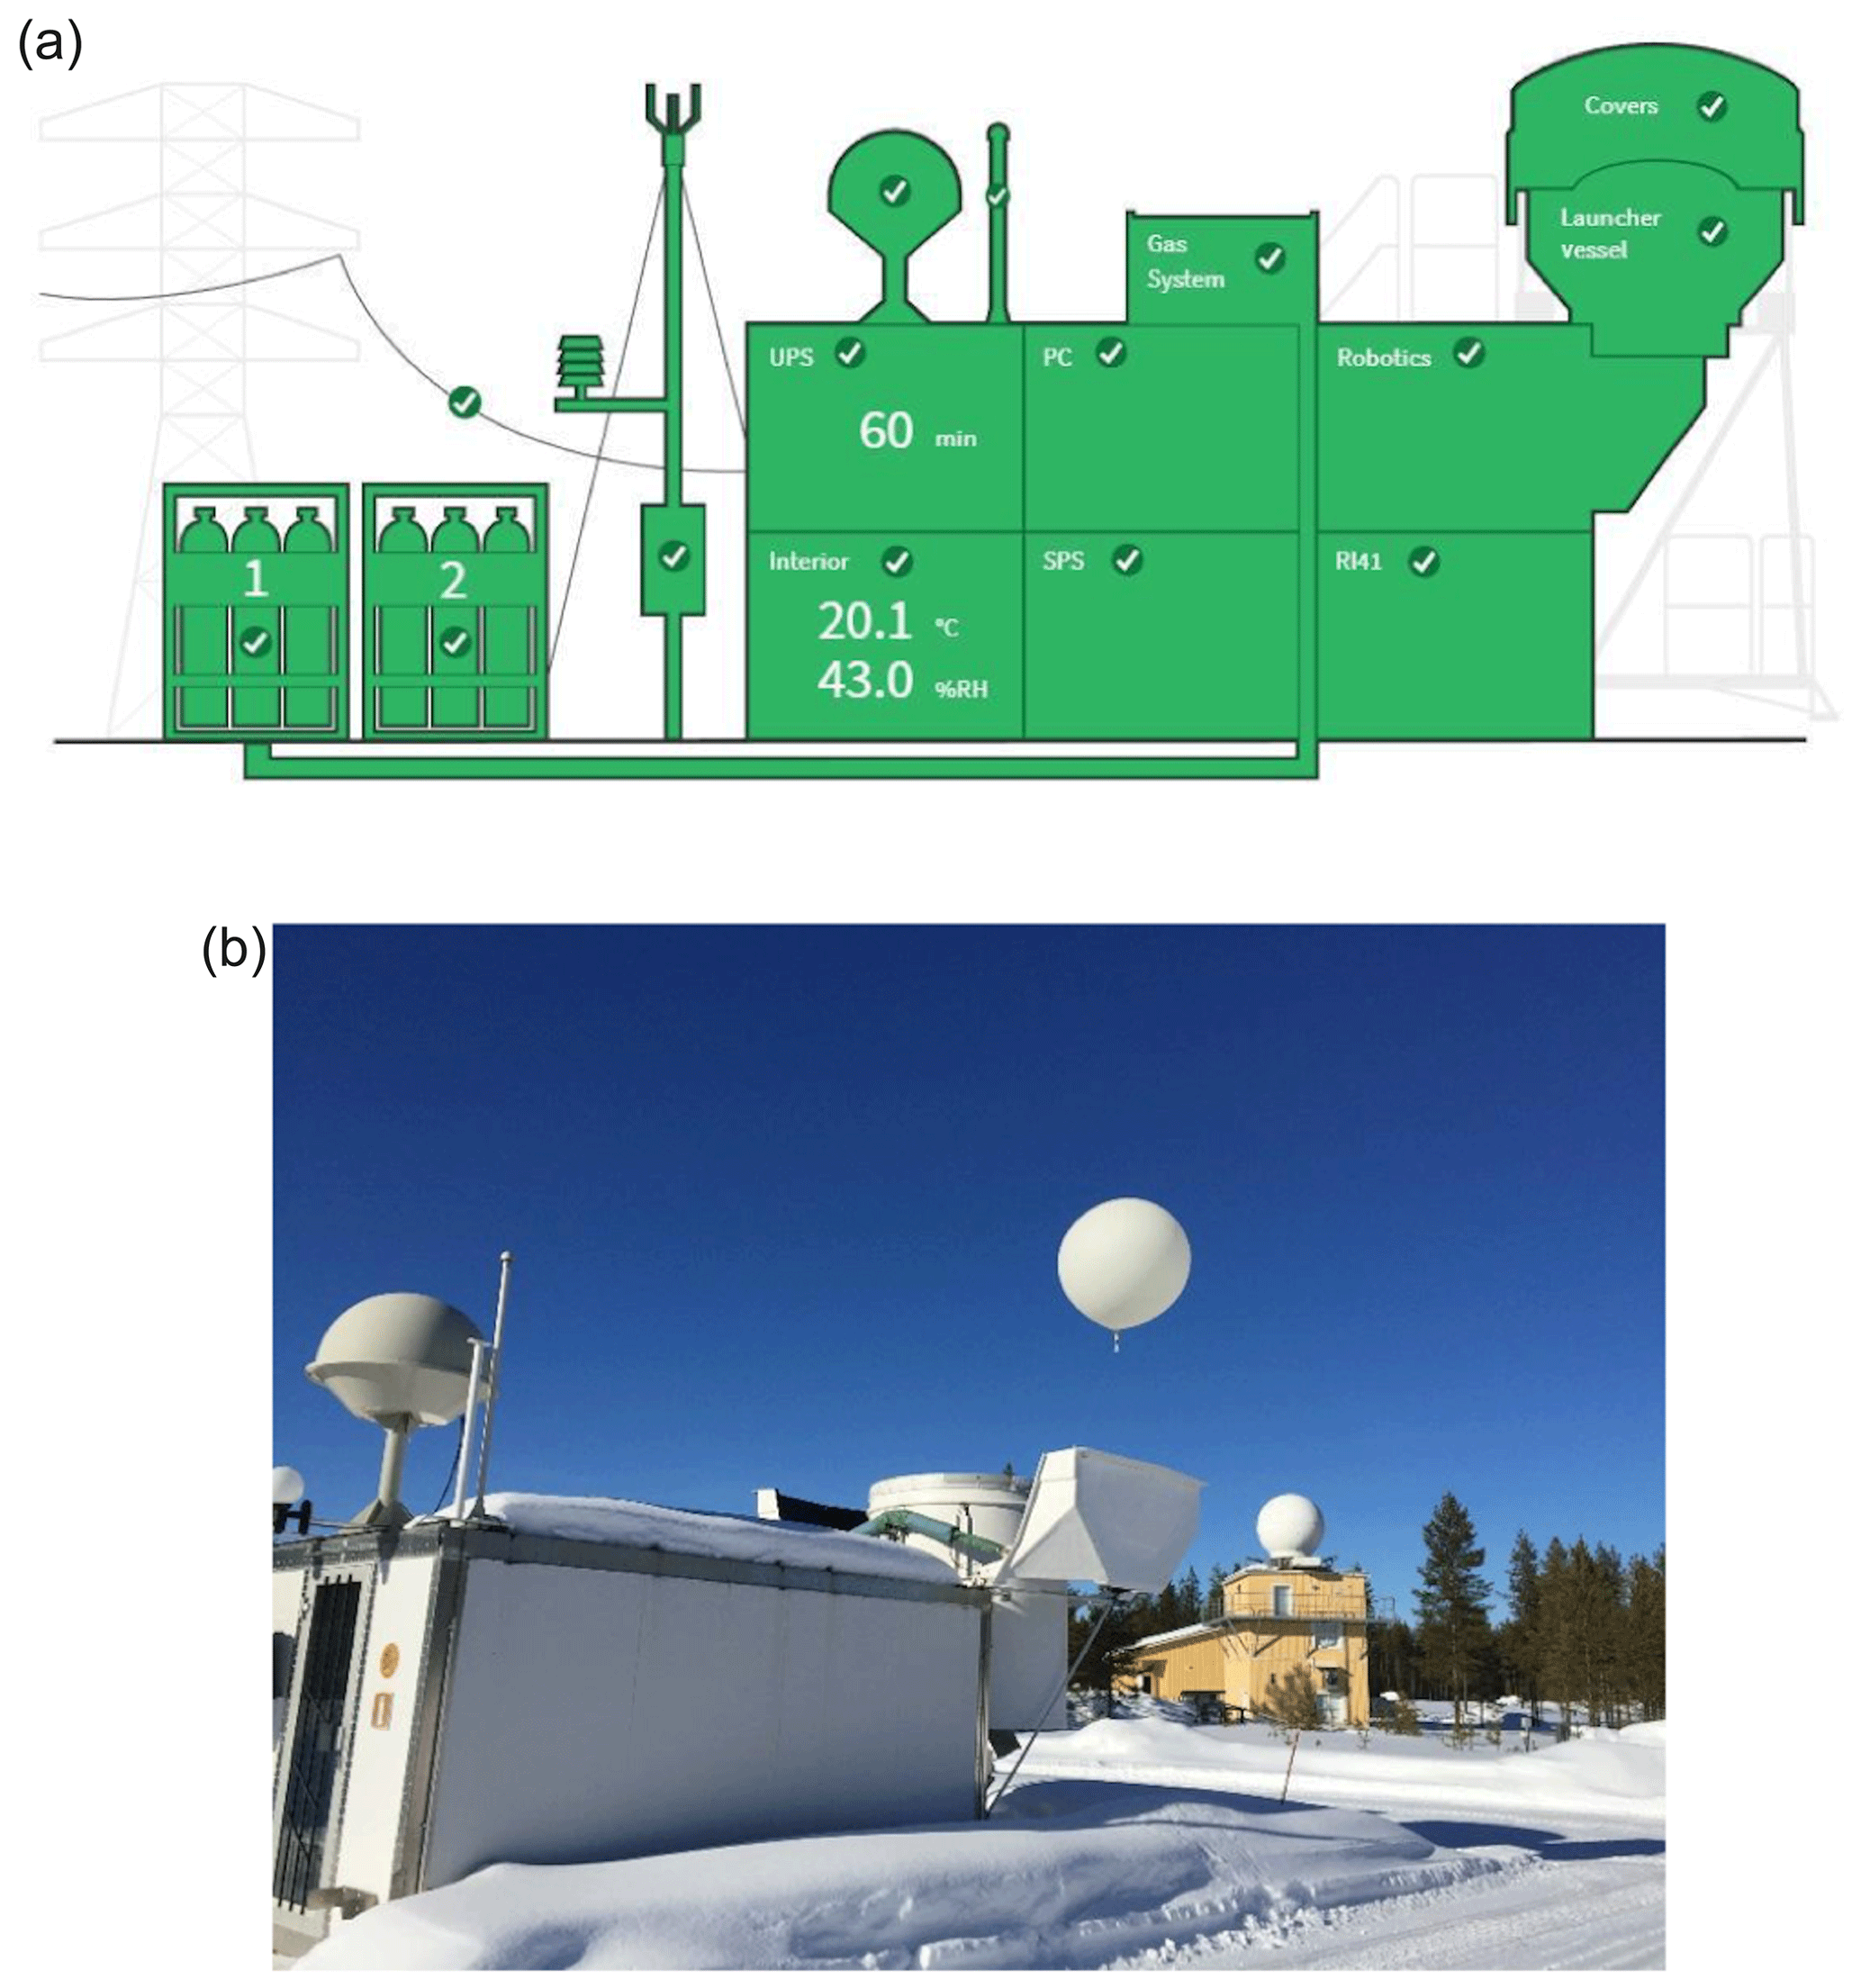
Figure 2Schematics of the Vaisala AS41 Autosonde system in its most recent configuration (a) and photo of the AS15 Autosonde system (b) operational at the Finnish Meteorological Institute GRUAN site in Sodankylä (WIGOS station identifier 0-20000-0-02836; 67.34∘ N, 26.63∘ E; 179 m a.s.l.; see Vaisala (2018); https://www.vaisala.com/sites/default/files/documents/AUTOSONDE AS41 Datasheet B211636EN-A_2 pages.pdf, last access: 3 July 2020).
2.2 Meteomodem Robotsonde
The Meteomodem ARL is an automatic balloon launcher system that can perform up to 12 or 24 soundings without any manual control (http://www.Meteomodem.com/docs/en/Leaflet-robotsonde.pdf, last access: 3 July 2020). The system is compatible with M10 and M20 Meteomodem radiosonde types. It is built in a robust dry maritime container and composed of the following subsystems (Fig. 3):
-
operator room with electronic control unit and PC workstation, isolated from the launch tube by an air-tight safety door, and used only during radiosonde setup and restocking;
-
carousel with 12 or 24 removable containers for balloon trains, and with individual flexible cover on balloon locations which preserve balloons from desiccation;
-
launch tube for balloon inflation and release and pneumatic equipment or pressurized air network; and
-
optionally, a double-door entrance to protect from strong winds, rain, drifting snow or sandstorms.
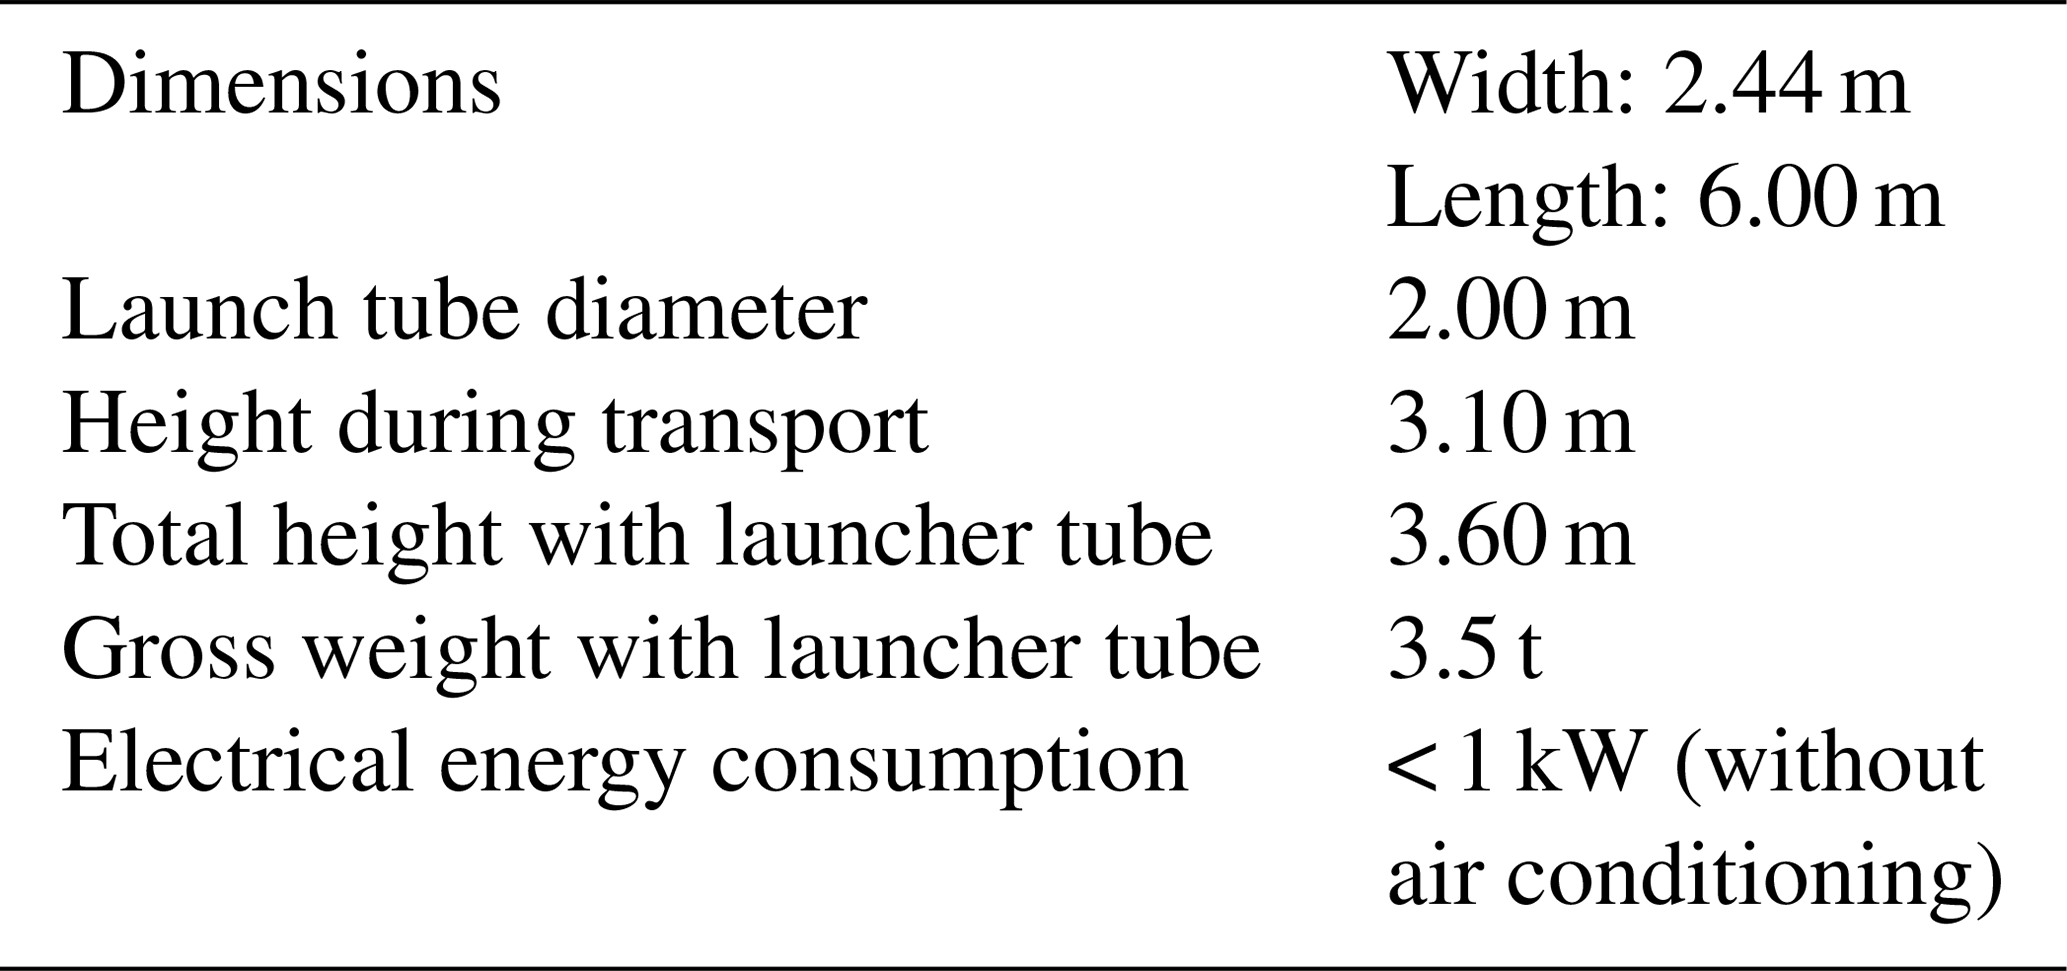
The Meteomodem ARL main specifications are reported in Table 2. Worldwide there are 19 Meteomodem ARL systems automatically launching Meteomodem M10 radiosondes. The specifications for nominal measurement uncertainties (provided by the manufacturer) are 0.58 ∘C for temperature, 1 hPa for pressure, 0.15 m s−1 for wind speed and 5 % RH for relative humidity (http://www.Meteomodem.com/docs/en/Leaflet-m10.pdf, last access: 3 July 2020).
For each launch, there is a preparation phase which comprises the radiosonde GC and the loading of the balloon train (with the radiosonde, the unwinder, the parachute and the balloon) into individual bins before finally sounding parameters (e.g. launch time schedule, inflation volume) are set up.
During the launch phase, before powering on the sonde, the system performs a scan of the bandwidth in order to detect possible radio interference, then the radiosonde battery pack is powered on through an infrared link. According to the scan result, the system sets up the new frequency through an infrared link, and GNSS signal collection is initialized. Then, the system loads the calibration data of the relevant radiosonde stored during the preparation phase and checks consistency with PTU criteria. The Meteomodem ARL GC is a standard Meteomodem GC which consists of a sealed box enclosing a reference and a fan which homogenizes the inside temperature and relative humidity. It is recommended to return the Meteomodem GC every 3 years for calibration. The calibration is made with a certified Rotronic HC2A-S probe (https://www.rotronic.com/en/hc2a-s.html, last access: 3 July 2020).
Then, the ARL records the ground-check data and the metadata. Balloon inflation starts accordingly: the system monitors a flowmeter to inflate the balloon to the specified volume. The ARL may use either helium or hydrogen gas. Finally, the balloon is released at the specified launch time. In the event of launch failure before balloon release or during the flight, the procedure will restart for a new sounding immediately or can alternatively be manually launched according to a preset time schedule. At any time, an immediate start of the launch procedure can be initiated by an operator (locally or remotely).

Figure 3Meteomodem Robotsonde (a) launching a balloon at Trappes station (WIGOS station identifier 0-20000-0-07145; 48.77∘ N, 2.01∘ E; 168 m a.s.l.; http://www.meteomodem.com/robotsonde.html, last access: 3 July 2020) and photograph of the carousel of Meteomodem Robotsonde with the balloon location (b).
For those stations operating an ARL and adopting a protocol based on GRUAN recommendations (Dirksen et al., 2014), as at Trappes station (WIGOS station identifier 0-20000-0-07145; 48.77∘ N, 2.02∘ E; 168 m a.s.l.; top panel of Fig. 3a), the GRUAN M10 ground-check procedure is performed in two steps: 5 min in a ventilated hut in ambient conditions together with calibrated T and RH sensors and, further, another 5 min to test the radiosonde performance in the SHC. Then each radiosonde is loaded in the ARL carousel (Fig. 3b).
A technical document describing the M10 sensor, corrections and uncertainties for both the temperature and relative humidity sensors will become available through the GRUAN community as soon as a Meteomodem M10 GRUAN data product is available.
2.3 Meisei automated radiosonde system
The Meisei ARL, named “automated radiosonde system” is designed for fail-safe operation and high remote operability. Compared to the previous version developed in 2006, the new system, still under improvement, is able to load more radiosondes thanks to the development of the Meisei “canister type”. The operator can pre-load a maximum number of 40 sondes in the so-called “canister modules”. The canister has been recently implemented to reduce failures. Once the launch procedure has started, the respective canister fills a balloon independently. The right canister module and the left canister module are independent systems. It realizes high observation continuity by duplicating gas, air and electric systems. The canister module on one side can be moved to the preparation room to load the sonde and facilitate the operator's work. The new ARL version can also recover from balloon bursts without human intervention at the site by using a balloon from another canister. In the previous version, an operator had to visit the ARL to remove broken balloons and restart the ARL during the observation window in such cases.
The new system is also equipped with a new simplified wind shield for launches in strong wind conditions. All information and data are stored in a database available for each ARL. Various central monitoring/control functions are provided by using application software and a web browser to access the database on the workstation installed in the ARL. The Meisei ARL GC consists of a temperature and humidity reference sensor and an inspection box. The GC is performed before the sonde loading. The results from the GC are not used in the data processing but only to check if there are anomalies in the radiosondes.
In Table 3, the Meisei automated radiosonde system specifications are provided. Figure 4 shows a photo of the system along with a sketch of the interior of the system container. For more details on the Meisei ARL experimental setup, visit the Meisei website (http://www.meisei.jp/ars, last access: 3 July 2020). The Japan Meteorological Agency (JMA) has used Meisei ARL data since 2006. Parallel radiosoundings of auto launch and manual launch have not been done yet. This is the reason why this paper does not show additional datasets or comparisons involving Meisei ARL; therefore, the description of the Meisei ARL is the only information which can be shared with readers, according to recommendations provided by Meisei.

Beyond the automation of the radiosonde launch procedure, there are two main differences between an ARL and a manual launch:
-
Ground-check procedures may be performed only during the sonde loading in the carousel chamber, days or weeks before the sonde launch, though there is a trend towards less frequent stocking.
-
The use of independent and traceable calibration standards like the SHC is possible but only before the launcher loading (also in this case 1 or more days before the launch).
Both of these aspects will be discussed in the following sections which provide potential technical solutions to address the gaps between manual and automatic launch procedures in terms of performance and traceability.

Figure 4Picture of a Meisei automatic balloon launcher (a) and sketch of the interior of an ARL container in its most updated configuration (b).
This section aims to provide a classification of the main challenges met by the stations which have operated ARLs over several years and to assess the technical performance of the ARLs compared to manual launches. The section is built upon the feedback provided by the GRUAN sites in response to a survey for the collection of ARL information. Most of the ARLs at GRUAN sites are from Vaisala (thus, the analysis is not representative of Meisei and Meteomodem systems due to the very limited feedback available for these systems). Given the small sample size, this is presented qualitatively rather than quantitatively and it is anonymized. Examples of technical performance in the field are then provided for a Vaisala and a Meteomodem ARL operating the most recent updated version of the respective manufactured systems (at Payerne and Trappes stations).
A conceptual diagram to represent a generic ARL is provided in Fig. 5: each ARL can be schematically divided into four areas as follows:
-
the operator's area, where the operators can manage the system and prepare radiosondes and balloons to be uploaded, and where the station reception and processing units are located;
-
the ready-to-launch sondes storage area, built around the ARL rotating trays, where most of the automated technologies are implemented to allow a completely unmanned launch;
-
the launching vessel area, where the balloon is filled and becomes ready for the launch; and
-
external area, where all the ancillary instruments, such as the weather station and GNSS antenna, are located along with gas tanks.
For each area, the weakest points identified from the GRUAN sites operating an ARL are as follows:
-
In the operator's area, most of the issues are related to the not-infrequent failure of power supply system or of the air-conditioning system, often related to a major failure of the power supply at the measurement station itself. This represents a particular weakness in the use of ARLs in remote areas where power supply is generally less stable and where logically the ARL might be an obvious choice. A few sites also reported issues in the software and logic controllers.
-
The ready-to-launch sonde storage area is assessed as the most efficient part of ARLs, where few issues reported. The most critical issue identified in this area is the infrequent failure of the air compressor.
-
The launching vessel area is where the balloon is filled and launched and where, therefore, we have a high exposure to many environmental factors like harsh climate, dust, animals, etc., which can strongly affect a successful launch also with later effects to the balloon and early burst. Several issues were raised by the stations related to challenges in the balloon inflation process, failure of balloon presence sensor allowing launch of under-inflated balloons, gas tubes bent and frozen gas hoses, balloon blocked on the tray, failure of the rams which open vessel cover doors (this concerns Vaisala or Meisei, and not the Meteomodem ARL). Other issues noted were delays in launch detection time compared to the actual launch time and the occasional break of the radiosonde string at launch (for Meisei).
-
The external area is another critical area where several problems have been reported about the gas flow meter and the switching between the gas tanks (one close to empty and the other fully filled). Extreme weather conditions (e.g. very strong winds) can make the launch more difficult, despite the additional screens protecting the balloon flight in the first 2–3 m above the ARL (only for Vaisala and Meisei).
The problems listed above are not common to all the ARLs; each system has its own specific issues. While the feedback reported from GRUAN stations can provide a first assessment of the challenges in operating an ARL, this study cannot assess challenges in the operation of each specific model and it cannot quantify the improvements of each ARL with the time. The issues discussed above could be used as recommendations to the manufacturers to foster further improvements of the systems. The ARLs are typically maintained by the manufacturers on an annual check up (performed remotely) and major maintenance approximately every 3 years. This maintenance schedule, if applied at each station, can increase the reliability of the systems over both the short and long term, although it generates additional costs.
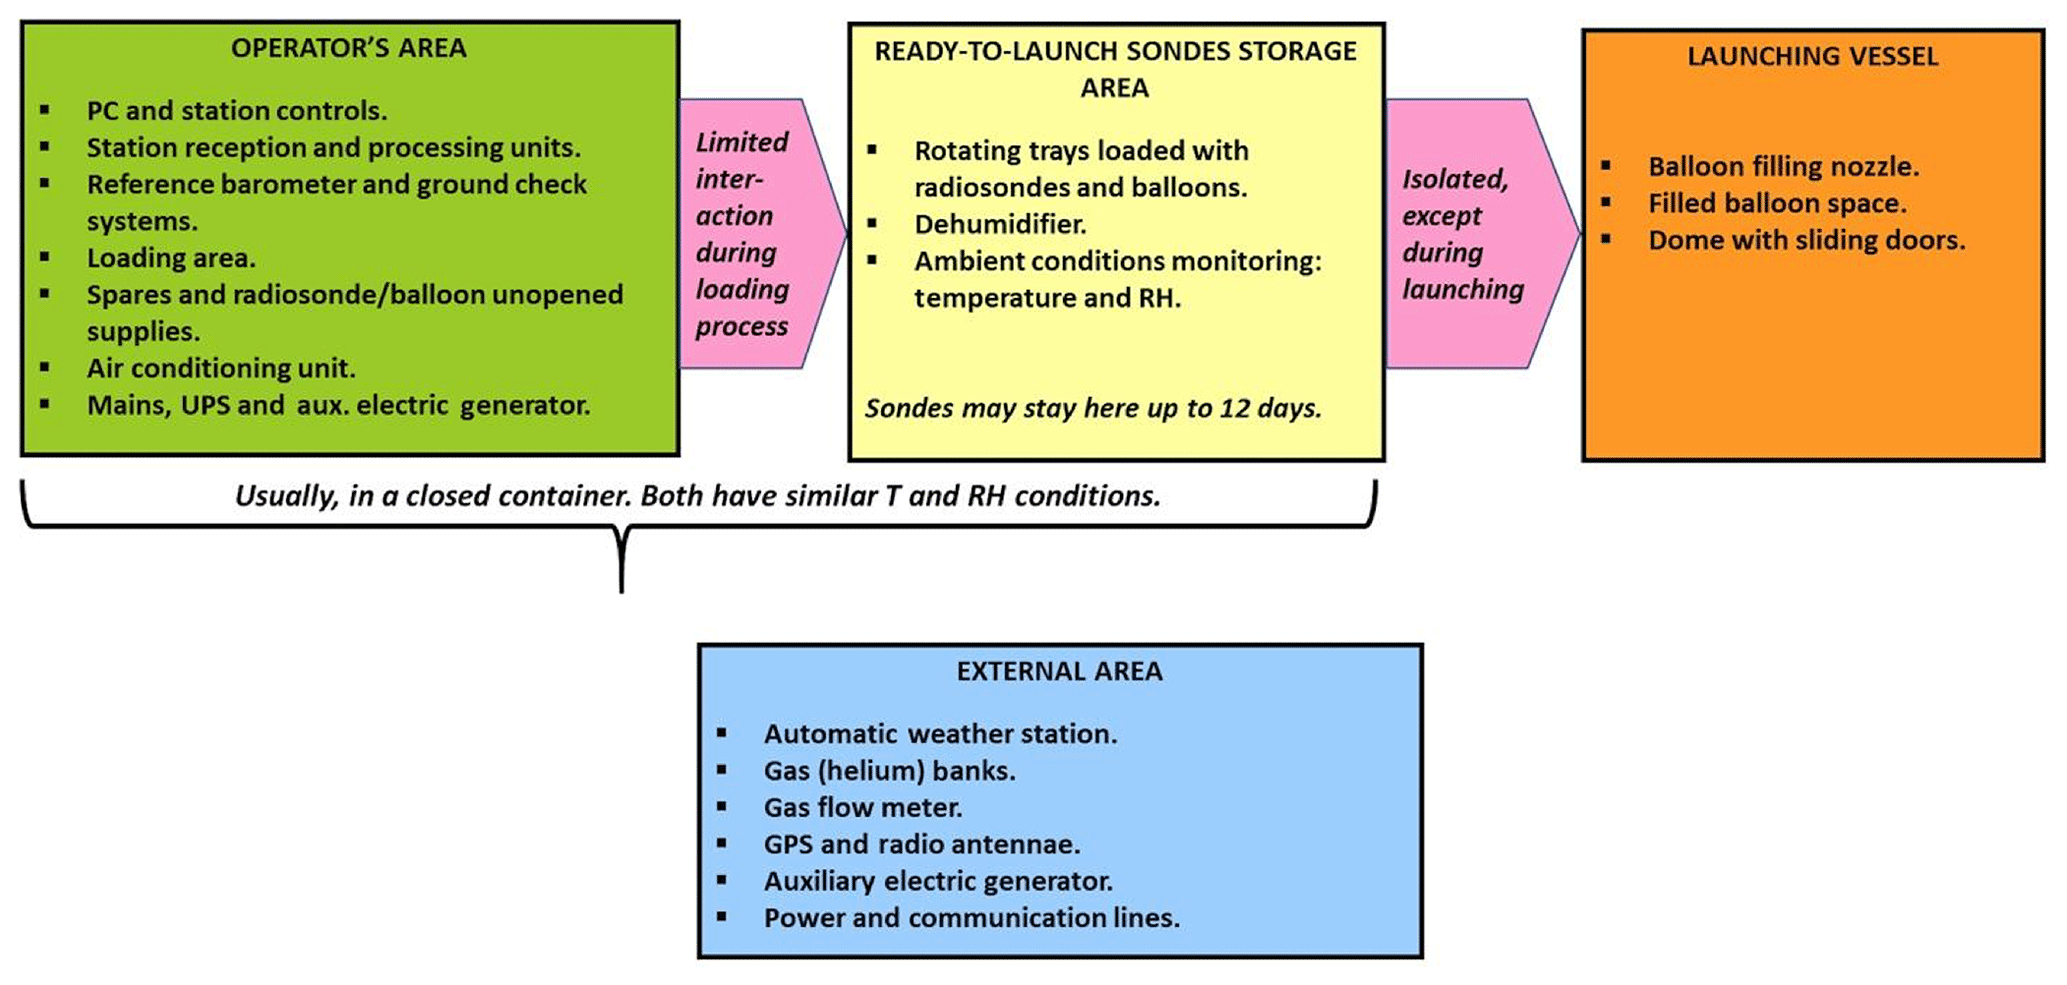
Figure 5Conceptual diagram of a typical automatic radiosonde launcher divided into four main areas: operator's area (green), ready-to-launch sonde storage area (yellow), launching vessel area (orange) and external area (cyan).
To assess the effective technical performance of the ARL launches versus manual launches, in Tables 4 and 5, examples of the statistics collected at two GRUAN sites running an ARL – Payerne (WIGOS station identifier 0-20000-0-06610; 46.82∘ N, 6.93∘ E; 490 m a.s.l.), operated by MeteoSwiss, and Trappes, operated by Météo-France, respectively – are reported. The table provides a summary of pertinent characteristics of the ARL versus manual launches. For Payerne, statistics are related only to the automatic and manual launches performed since April 2018 (on average, for ARL, nine per week and manually five per week) using the Vaisala AS15 ARL. For Trappes, manual launches were performed in the period 2012–2014, while the Meteomodem Robotsonde has been operated in the period 2016–2018; in both cases, two launches per day were performed with similar daily scheduling.
At Payerne, since April 2018, the Vaisala ARL has realized 470 successful flights per year, according to MeteoSwiss standards1, while manual launches have been 260 per year. Despite the use of different balloon sizes due to the fact that for manual launches bigger balloons are often used to perform ozone soundings, the percentage of successful launches as well the percentage of sondes reaching 10 hPa pressure level is indistinguishable between the ARL and the manual launches, with a limited use of spare sondes due to the failure of scheduled launches for the ARL (4 %). Ascent speed statistics are very close, with better performance of the ARL in preventing very low balloon gas filling and thus slow ascents.
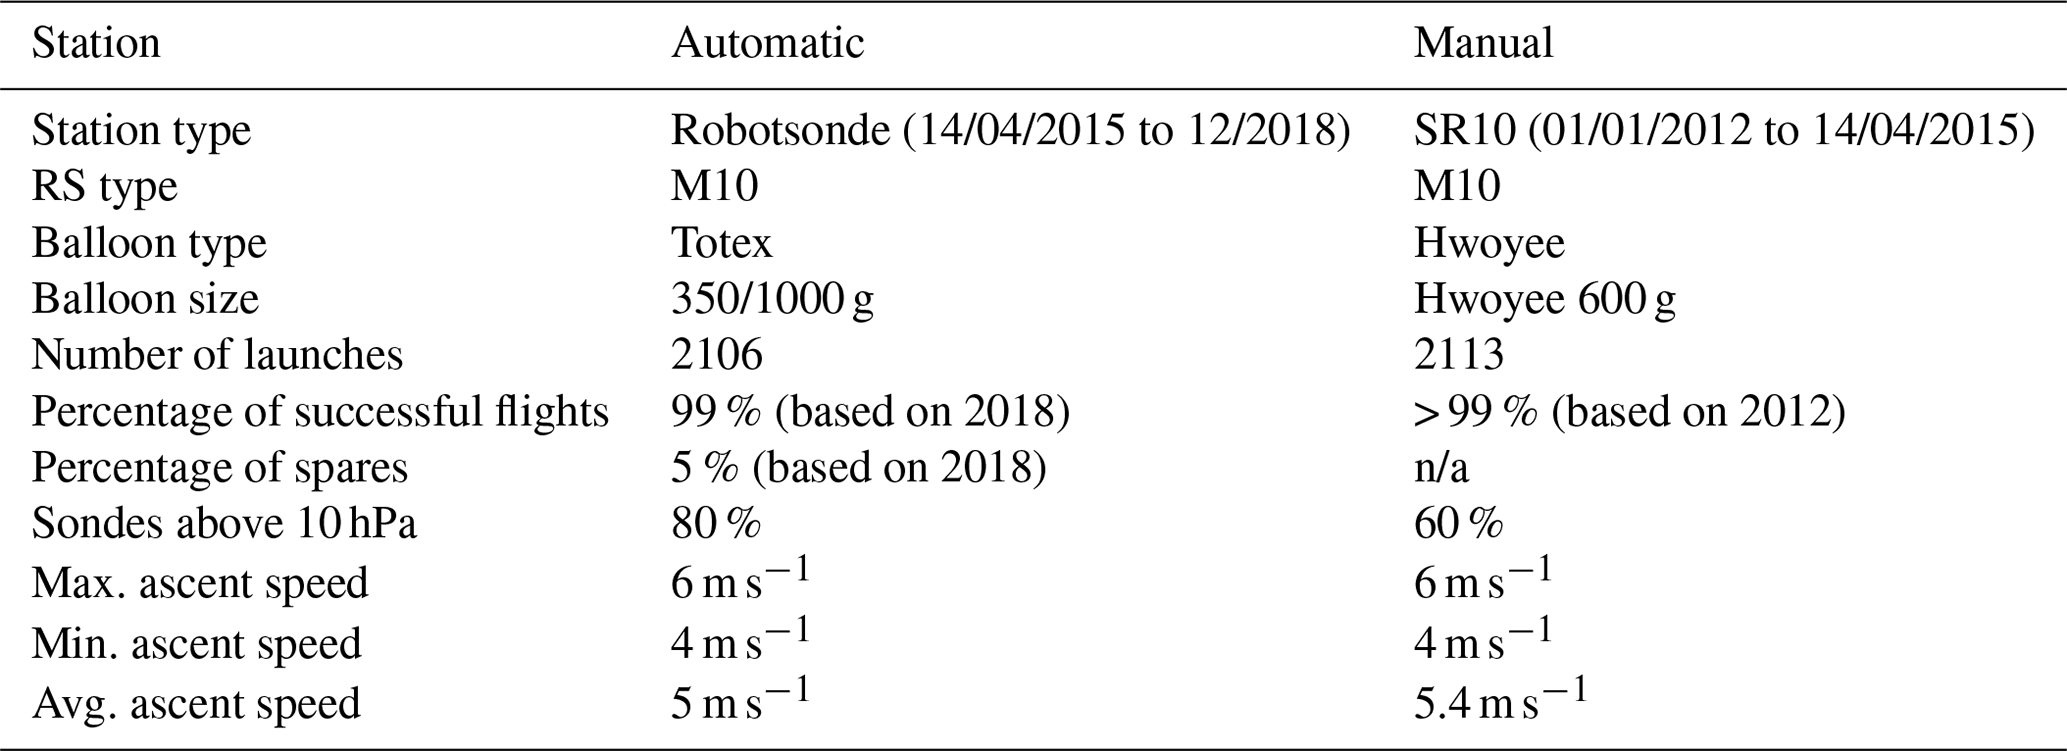
At Trappes station (Table 5), during the period of January 2016 to December 2018, the Meteomodem ARL Robotsonde has carried out 1908 successful flights, according to Météo-France standards2, out of a total of 1956. For each of the remaining 48 flights, a spare automatic launch was performed which fulfilled the requirements of Météo-France. The mean percentage of successful launches is 97.9 % (2016: 95.5 %, 2017: 98.2 %, 2018: 99.1 %, 2019 (January–October): 98.6 %; see Fig. 6) with an evident improvement using ARL in the percentage of sondes reaching 10 hPa pressure level (80 %) compared to the manual launches (60 %). The use of Totex balloons is one of the reasons for the improvement and further improvement was achieved by increasing the size of the balloon. Moreover, since November 2016, Meteomodem has installed a flexible cover which assures that during the storage the balloon is less exposed to contact with the air-conditioned environment. This seems to reduce the effects of drier air on the balloon and improve its performance in terms of burst altitude (standard deviation of burst altitude is reduced after the installation of the cover – not shown). For the balloon ascent speed, comparison statistics between ARL and manual launches also show similar results. According to the information shared by Meteomodem, it is also possible to add that, compared to all the ARLs operated at other sites during the same period reported in Table 5, the Trappes ARL has typically similar failure statistics. The time evolution of the failure (Fig. 6) shows that the number of spares and the number of failures by type halved in 3 years to reach less than 2 % relative to the number of successful flights. For the 716 flights performed during 2018, the absolute number of failures is two for the ARL (which was a radio loss and an inflation problem), one failure due to sensor break, no failure from the software, one failure which is not classified by their automated failure identification and one failure due to the use of ARL which can be an operator stop or an obstructed inflation tube.
Table 4Technical performance of automatic versus manual launches performed at Payerne station during 2018 for a Vaisala AS15 ARL. Metadata related to the sonde and balloon types are shown alongside the percentage of success for the launches performed during the reported period, the percentage of spare sondes used, the balloons bursting before reaching 10 hPa, and the maximum, minimum and average ascent speeds. ECC is an electrochemical cell; n/a – not applicable.
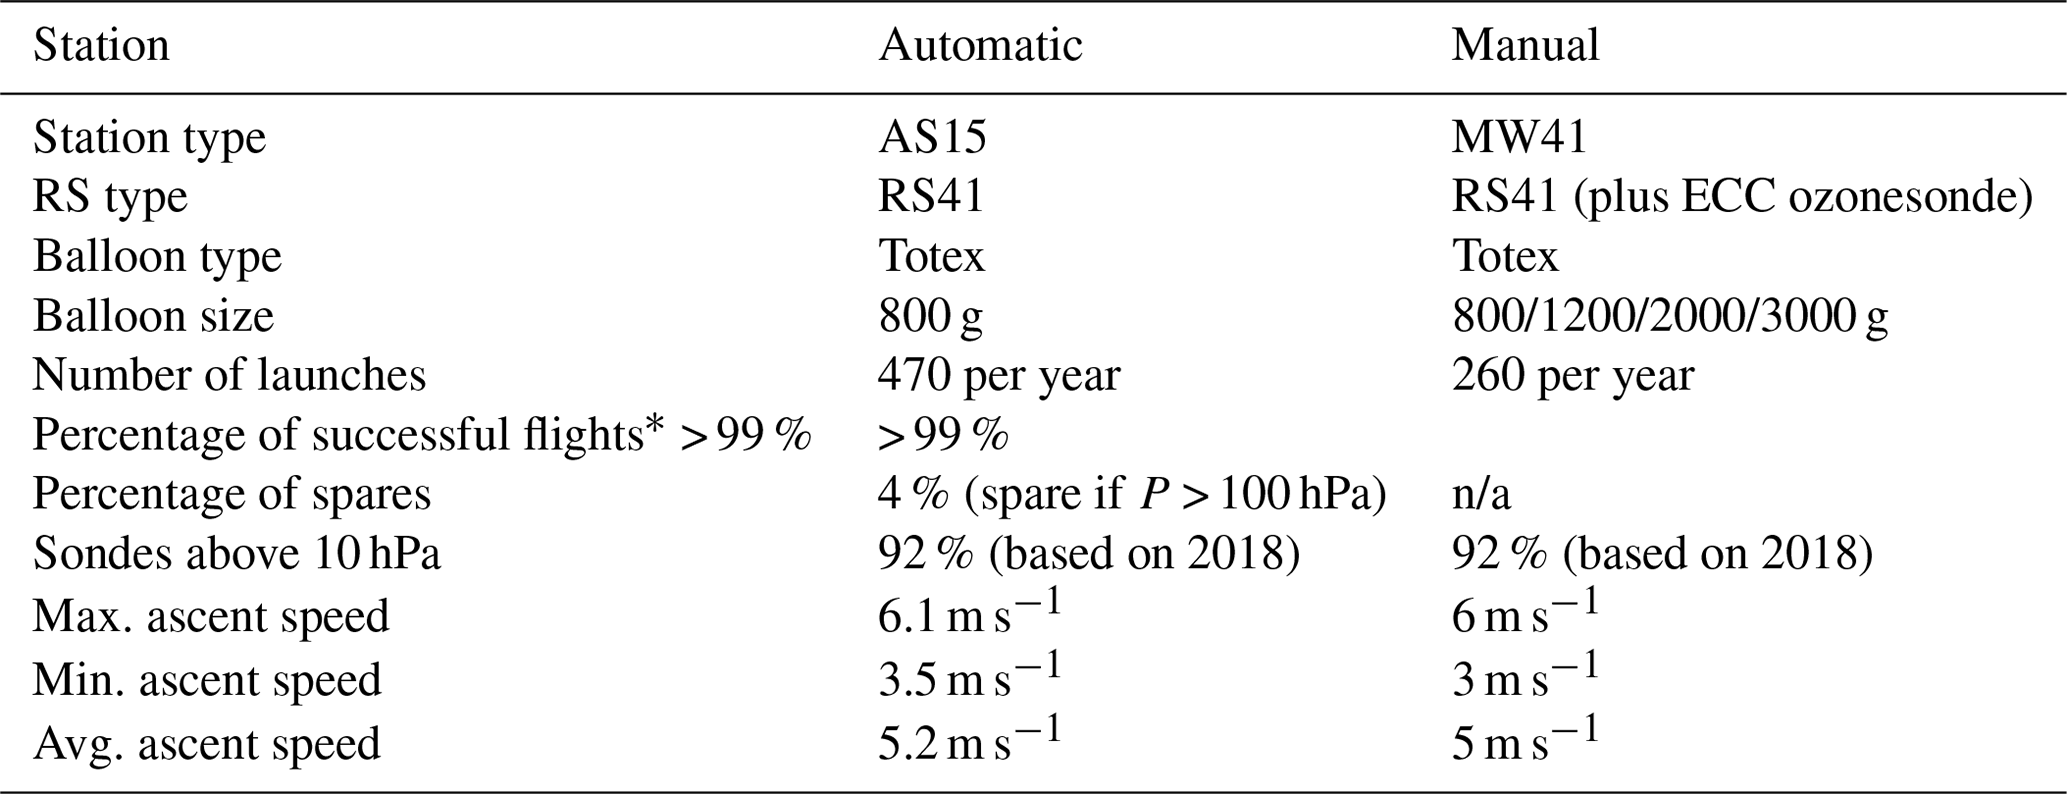
* Percentage of successful flights out of successful launches.
Table 5Same as Table 4 for the Trappes site for the periods of 2016–2018 and 2012–2014, respectively, for a Meteomodem ARL. n/a – not applicable.
It is worthwhile to add that ECMWF noted in some reports that some stations using Meteomodem Robotsondes had anomalously dry, and sometimes warm, values just above the surface relative to the background field. In cool, moist atmospheric conditions, the anomalies can be 2–3 ∘C for temperature and larger for dew-point temperature. “For technical reasons the launcher has to be kept warm and dry internally, which means that the humidity sensor is initially reading quite low and a bubble of warm/dry air escapes with the balloon at launch – the net effect is that the first few decametres the dew-point reading is too low.” (Ray McGrath, personal communication, 2015). The issue described above does not affect the profile at higher levels. A similar issue has also been reported for data taken during the first few seconds with Meisei ARL, and this is suspected to be due again to the influence of the air inside the launcher.
The Meteomodem has recently implemented a new software, EOSCAN, not yet implemented at all the stations, which improves the ARL dataset quality with a number of corrections such as
-
eliminating the GPS disturbances at the end of the tube that can persist in the first 20 s after the release; and
-
adjusting for the systematic bias introduced by the fact that the ARL Meteomodem is air conditioned and affecting the first 150 m of the radiosounding profiles.
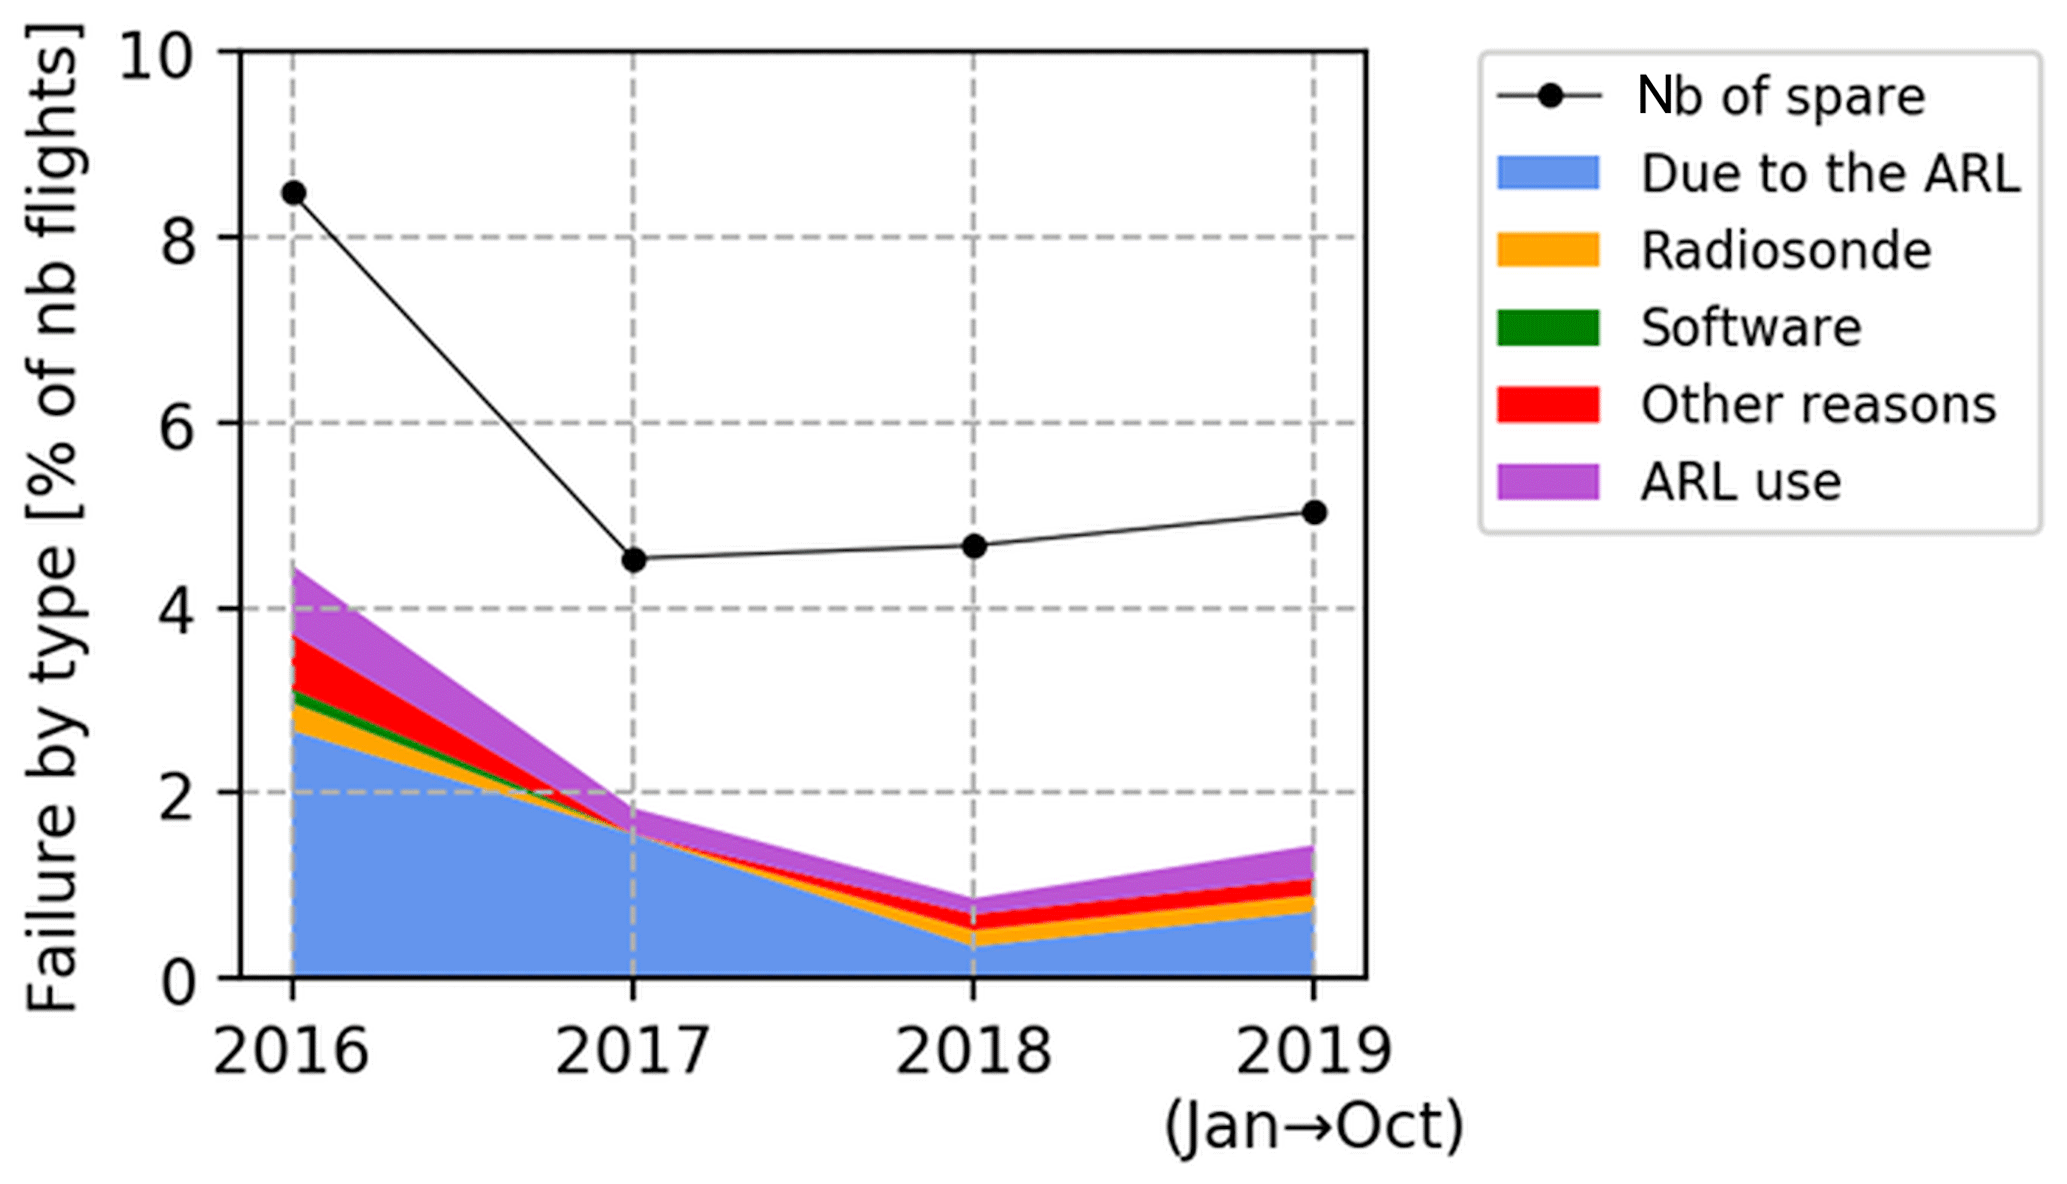
Figure 6Cause of failure for the Meteomodem ARL in Trappes as a function of time since the installation date. The black dots are the values of the number (nb) of spares used after the launch failure.
4.1 Performance of the Vaisala ARL
The performance of the Vaisala ARL has been evaluated through the analysis of a dataset collected at Sodankylä station. The Sodankylä Vaisala ARL was used to regularly launch RS92 radiosondes at 11:30 and 23:30 UTC over 2006 to 2012. Manual soundings were periodically performed in parallel using a similar Vaisala DigiCora-3 sounding system throughout this period. Parallel soundings have been selected with launch time difference between 2 and 20 min. A total of 283 parallel soundings have been considered: these are distributed evenly across the period, with the exception of 2006, which has more parallel soundings than other years, and most of these are daytime comparisons. In addition, two Vaisala ARL datasets from the Potenza GRUAN station (40.60∘ N, 15.72∘ E; 760 m a.s.l.) and the Minamidaitōjima station, run by JMA (WIGOS station identifier 0-20000-0-47945; 25.79∘ N, 131.22∘ E; 15 m a.s.l.), covering a similar time period, though much smaller sample sizes than in Sodankylä, have been used for comparison. Despite the less intensive sampling, Potenza and Minamidaitōjima data are useful data sources to compare with Sodankylä and, specifically, to check consistency of the GC correction across different stations and different batches of Vaisala sondes.
The availability of long time series of parallel sounding for the Sodankylä station permits investigation of the system performance also in the pre-launch phase. Two main aspects are evaluated: stability of the ground-check correction on temperature and potential effects related to the time periods the sondes were stored in before launch.
Figure 7 summarizes the temperature correction applied during the GC procedure for the RS92 sondes of the above-described datasets using the Vaisala GC25 ground-check device, with most of the launches performed since 2006. Figure 7 shows similar GC values at Sodankylä, Potenza and Minamidaitōjima stations despite the very different locations and launch scheduling, with a negative adjustment of between smaller than −0.5 K before 2010 and smaller than −0.3 K typically applied to most of the RS92 sondes with an improvement of the differences over the time in the batches launched after 2009. The results shown in Fig. 7 are based on the assumption that all the reported ARL GC temperature sensors were maintained according to recommendations described in the previous section.
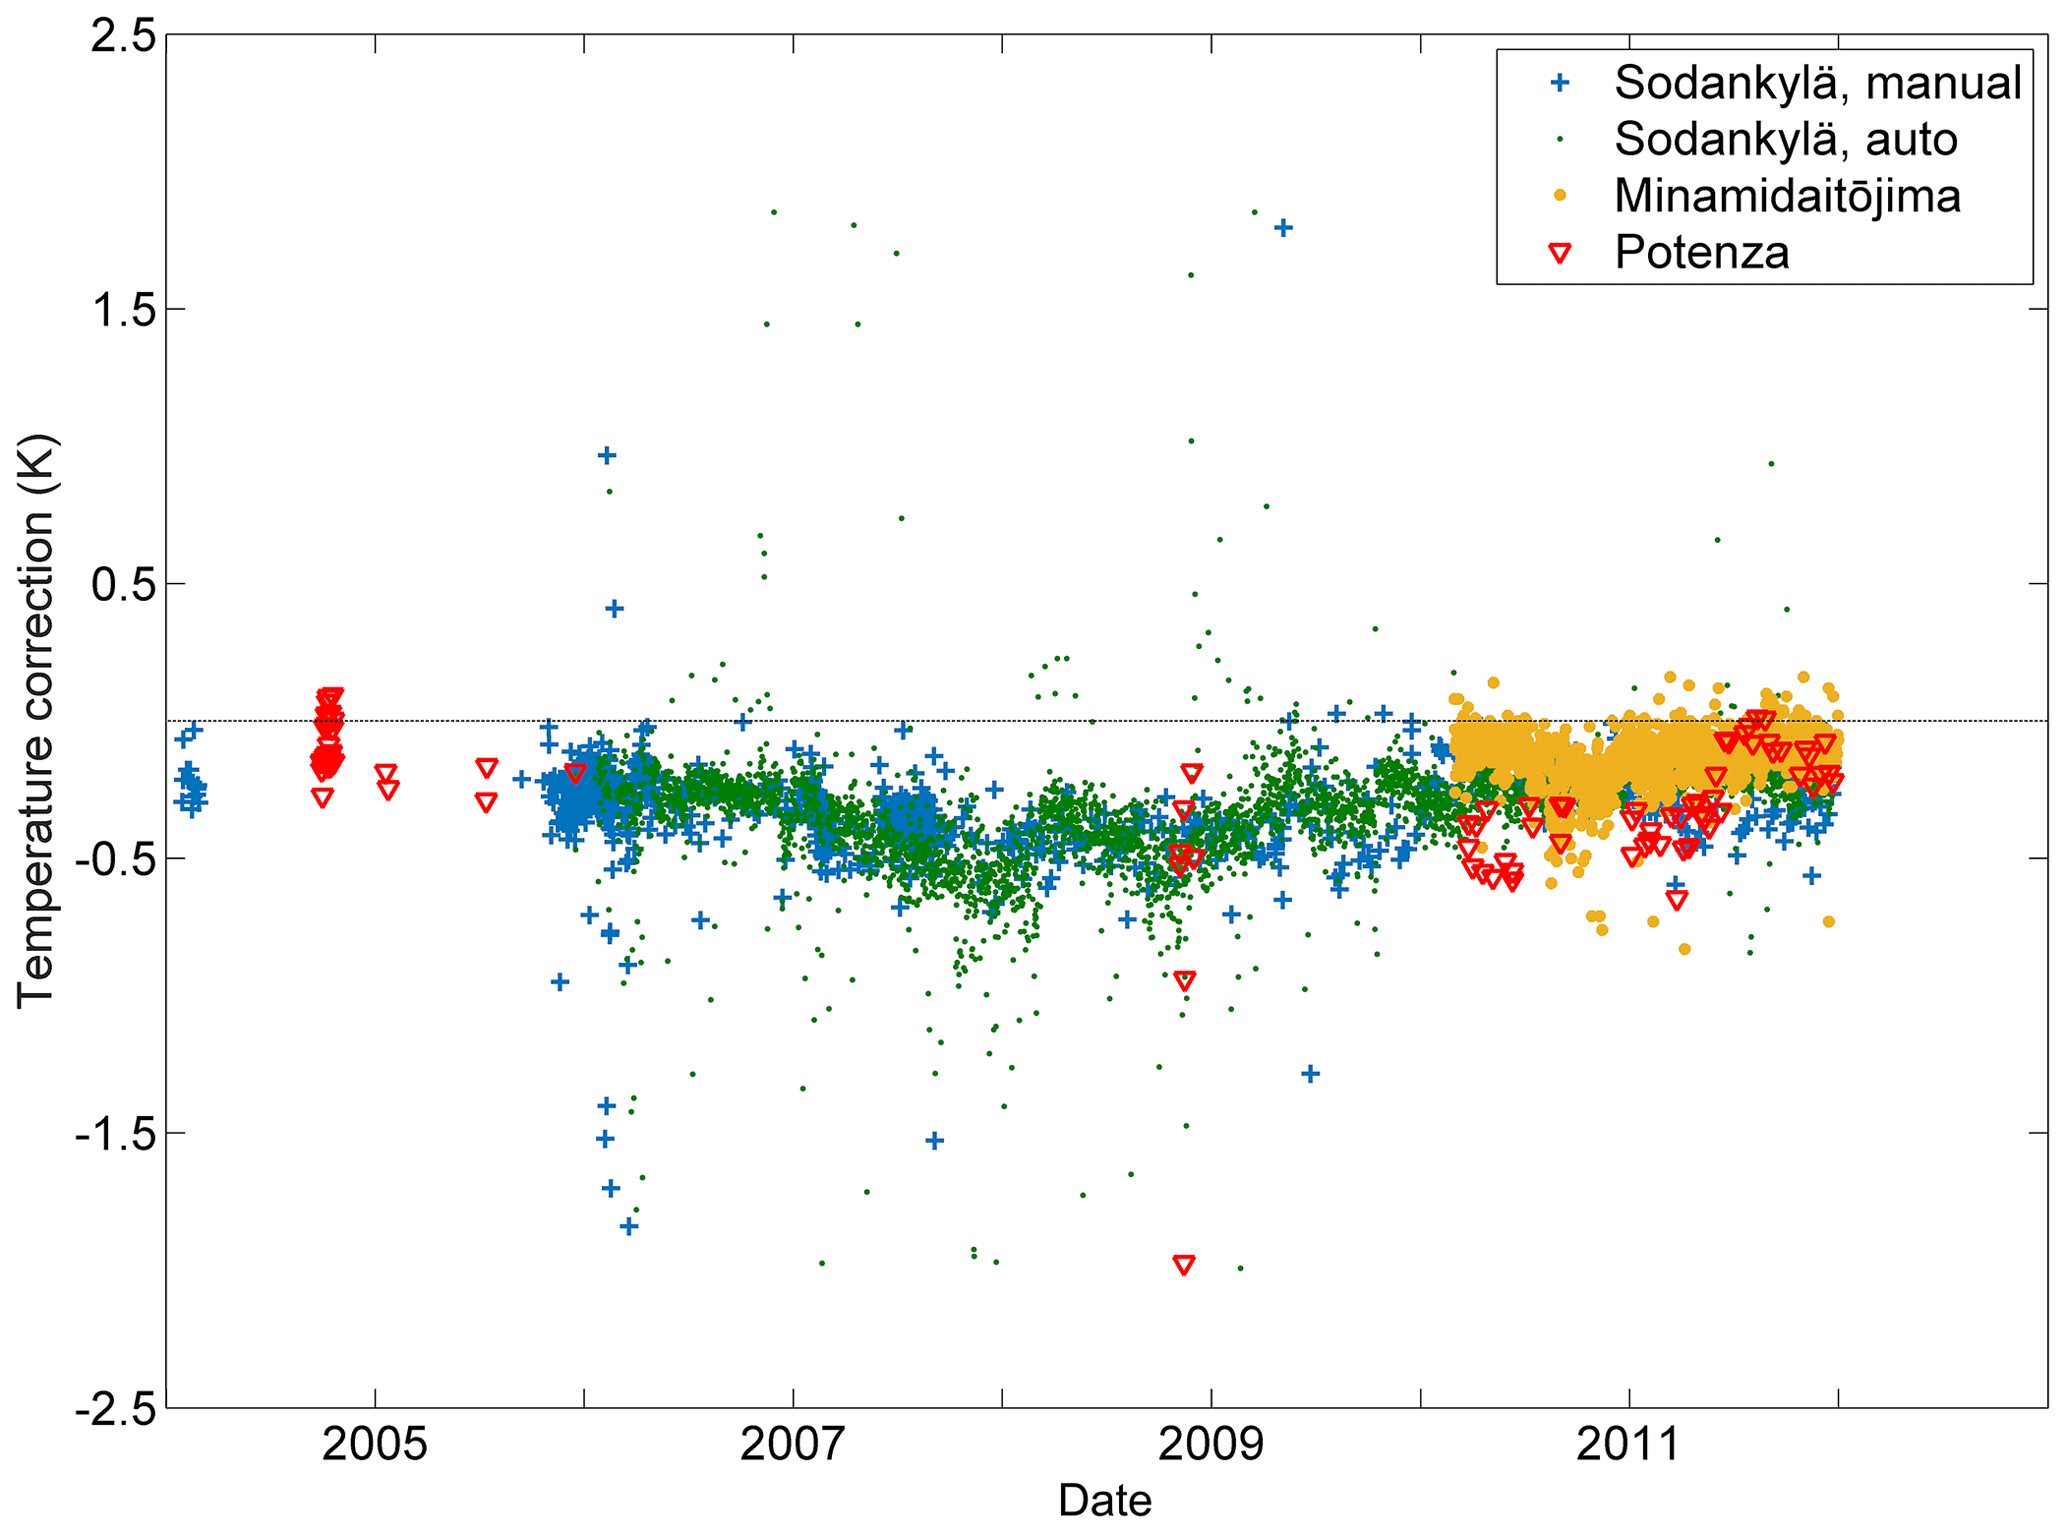
Figure 7Time series of the temperature correction (temperature measured by the GC reference sensor minus temperature measured by the sonde) applied during the GC procedure for the RS92 sondes launched at Sodankylä, both manually (blue crosses) and automatically (green dots), and at Minamidaitōjima (yellow dots) and Potenza (red triangles, automatically) from 2004 to 2012.

Figure 8Distribution of temperature and relative humidity corrections found during the Vaisala GC process for the automatic and the manual soundings operated at Payerne station using the RS41 radiosonde.
Results similar to those from Sodankylä and Potenza GRUAN stations are reported by Payerne GRUAN station (Fig. 8) using the RS41 since April 2018 and operating the Vaisala AS15 ARL. Figure 8 shows that the distribution of temperature and relative humidity corrections have negative skewness with the GC adjustments within a few tenths of a degree, and the average adjustment is smaller than 0.1 K and 0.1 % RH, respectively. These results show an average negative GC corrections for the ARL in analogy to the results reported above for RS92 sondes at Sodankylä and Potenza, where also the old Vaisala ARL version was operated. Comparisons with the broader statistics collected by GRUAN stations launching manually (not shown) reveal results consistent with the GC time series shown in Figs. 7 and 8, thus excluding the presence of clear systematic effects in the GC corrections due to the use of ARLs. Nevertheless, the small differences observed between the ARL and manual GC corrections warrant further investigation to understand if performing the GC in a controlled temperature and humidity environment may generally improve or worsen the calibration in the long term.
In an operational station like Sodankylä, the time between balloon loading and ground check can vary from day to day. At Sodankylä, average loading time was 2–3 d prior to launch for regular soundings. The ARL software allows also longer times in the tray. Figure 9 shows, at different altitude ranges, the mean differences of simultaneous RH profiles (top panel) measured using the ARL and the manual soundings as a function of the number of days a sonde stays on a tray before launch, from 1 to more than 5 d. The corresponding mean standard deviations are also shown (bottom panel), while in brackets within the colour legend, the number of parallel soundings for each time period is reported. To calculate the statistics shown in Sects. 4 and 5, radiosounding temperature and RH from parallel soundings have been interpolated to a 100 m vertical grid. Figure 9 shows that there are no RH systematic differences when parallel launches are grouped according to the tray time, except for the launches with a tray time of 5 d or more at altitude levels above 6 km a.g.l., where a mean difference smaller than −2.0 % RH is obtained up to 10–12 km a.g.l. Nevertheless, it must be noted that the size of the sample investigated for these tray time options (5 and > 5 d) is much smaller than for other tray times, and these launches also include parallel sounding with longer differences in the respective balloon release time.
To test if the estimated RH differences are meaningful, the Wilcoxon rank sum test has been applied. This test is a non-parametric test of the null hypothesis that it is equally likely that a randomly selected value from one population will be less than or greater than a randomly selected value from a second population. If the null hypothesis is rejected, then there is evidence that the medians of the two populations differ. In this study, the Wilcoxon rank sum test has been used instead of the z test because of its robustness in the event of a small observations sample (i.e. small number of parallel launches) and to avoid assumptions on the underlying data distribution (e.g. data distribution skewed or non-normal). For the RH profiles reported in Fig. 9, the probability computed using the Wilcoxon rank sum test ranges within 0.4–0.5, with smaller values only above 12 km a.g.l., where the probability becomes greater than 0.2. For the time-in-tray classes with a smaller sample of parallel soundings (1, 5 and > 5 d), the probability oscillates between 0.05 and 0.10. Therefore, it is possible to conclude that we cannot reject the hypothesis that the two data distributions (ARL and manual launches) have the same median value and the reported comparisons are consistent. Finally, the bottom panel of Fig. 9 shows that the standard deviations are substantially smaller than 5 % RH at all altitude levels without any evident correlation with tray time.
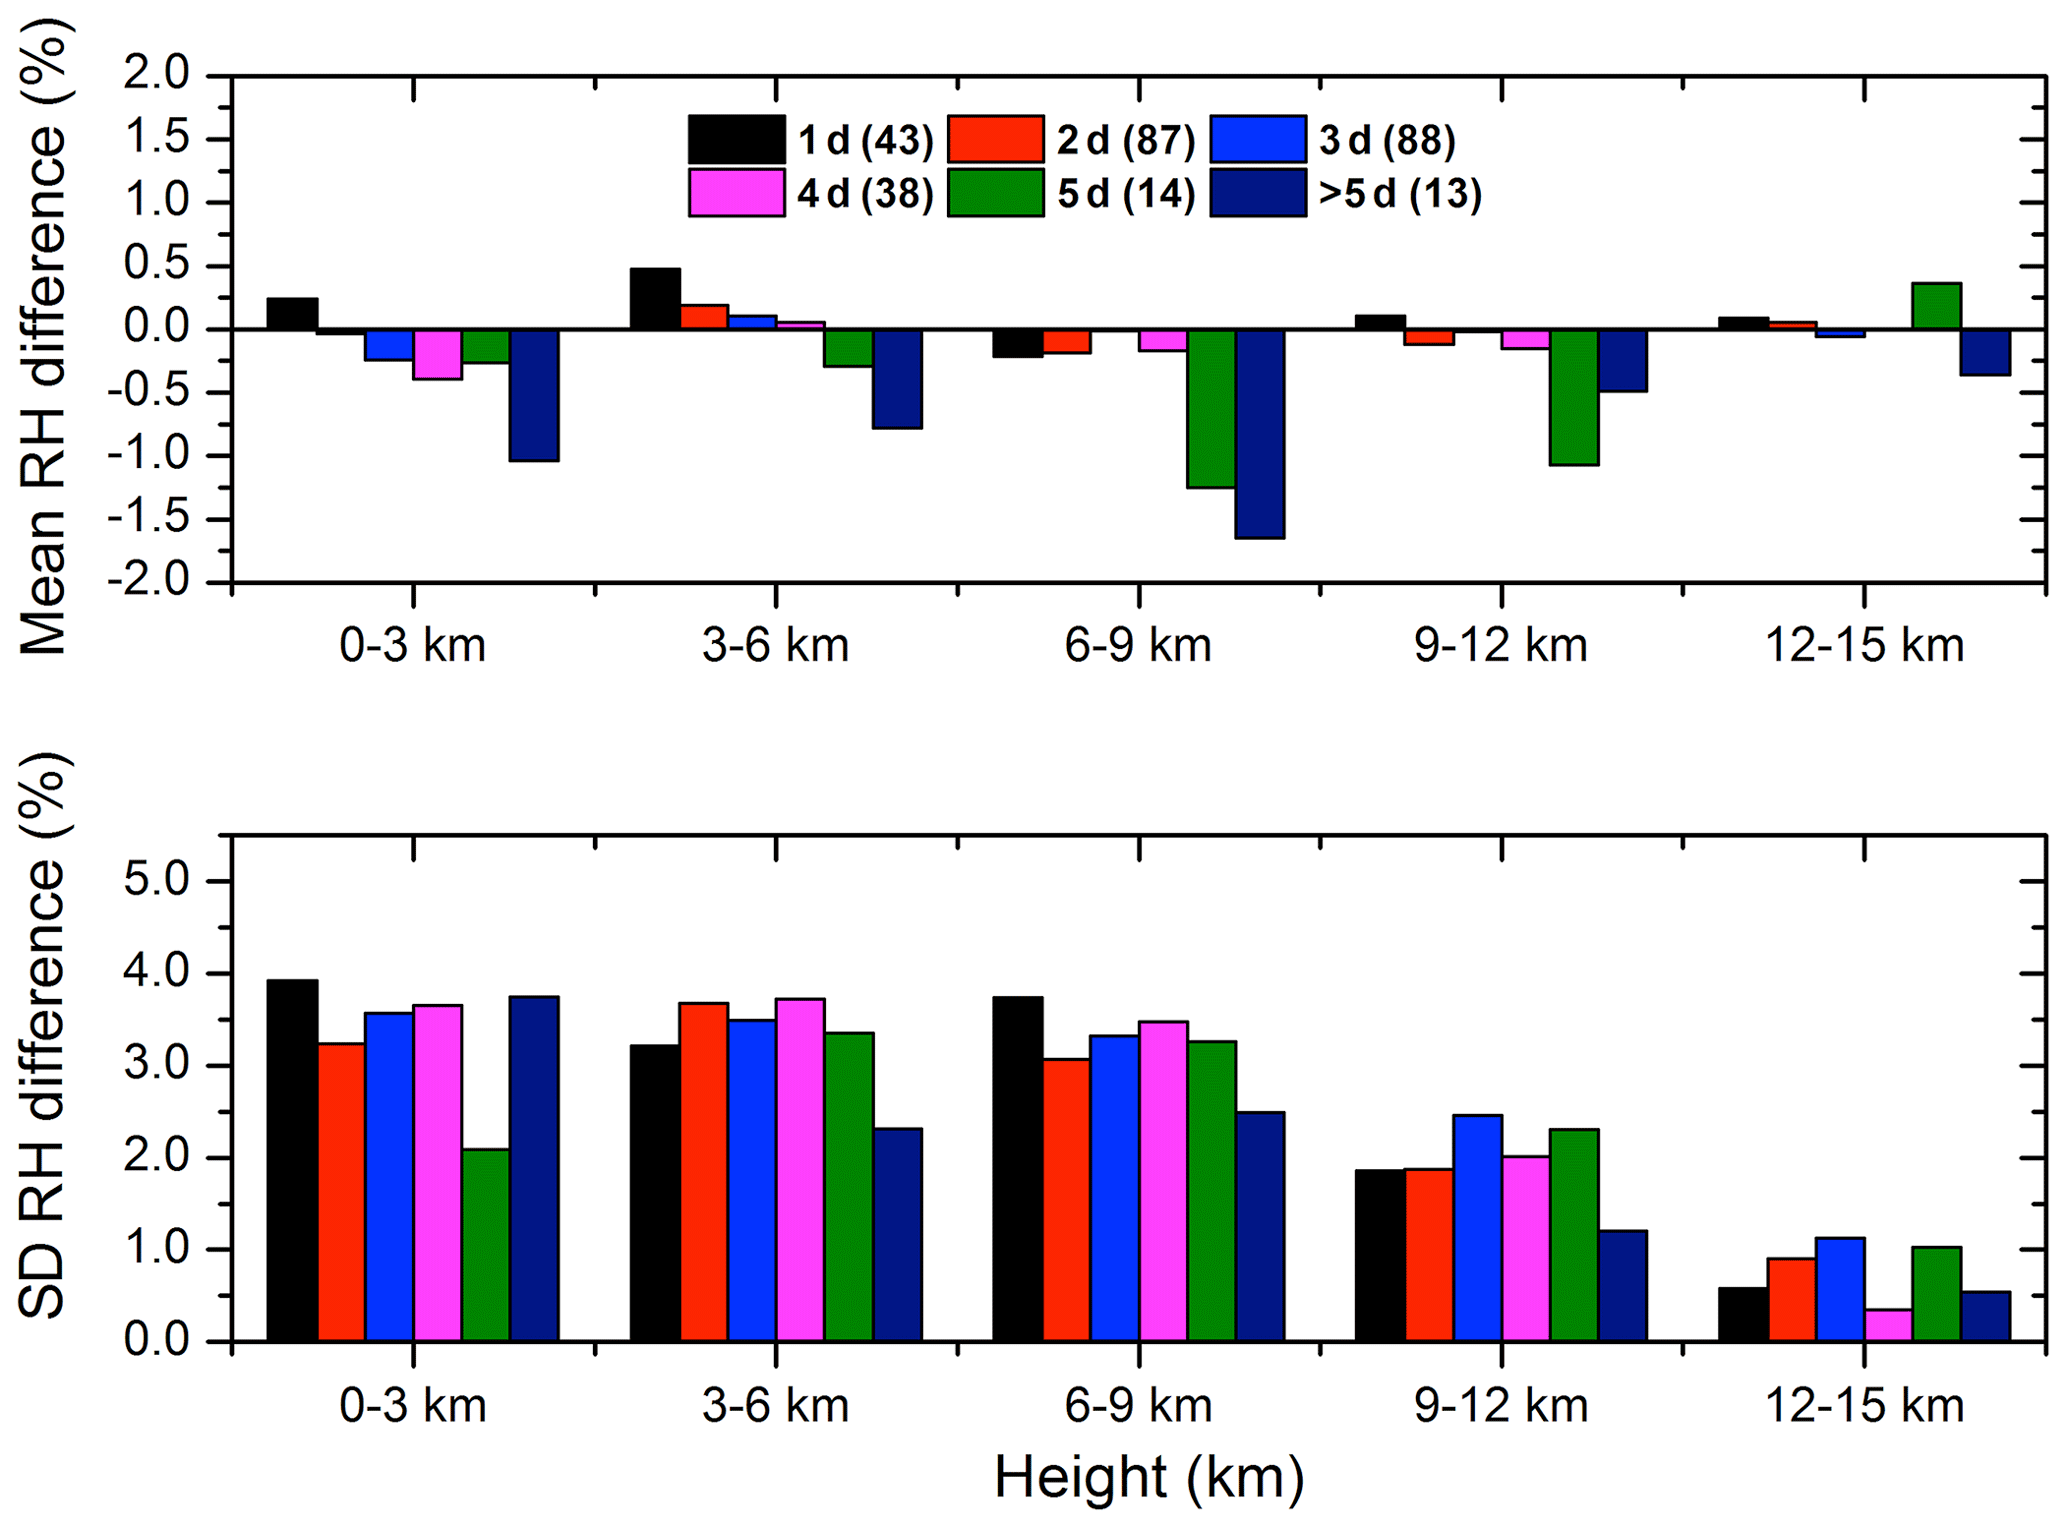
Figure 9Mean difference and standard deviation of the RH measured with the manual and automatic system in Sodankylä at different height intervals, from the ground to 15 km a.g.l., as a function of the time period between GC and launch; from left to the right, the time period increases from 1 to more than 5 d. In brackets within the legend, the number of parallel soundings considered for each time period is reported.
In Fig. 10, another way to study GC data is presented for the Payerne station. In this case, the average difference and the standard deviation of temperature and relative humidity found during the GC using Vaisala RS41 radiosondes into the Vaisala AS15 versus the ageing (up to 9 d into tray from the loading until launch) are shown. For both temperature and relative humidity, excluding only the launches which occurred within 24 h of the radiosonde loading, the bias is negative and independent of any further ageing. Until 1 d after loading, the bias is stable close to zero and thereafter it increases to about −0.14 K and −0.1 % over the following days. These results show how the use of ARLs also in remote places or where it is required to upload in advance a large number of radiosondes, to launch with a few days of delay, does not appreciably lead to changes in the Vaisala GC.
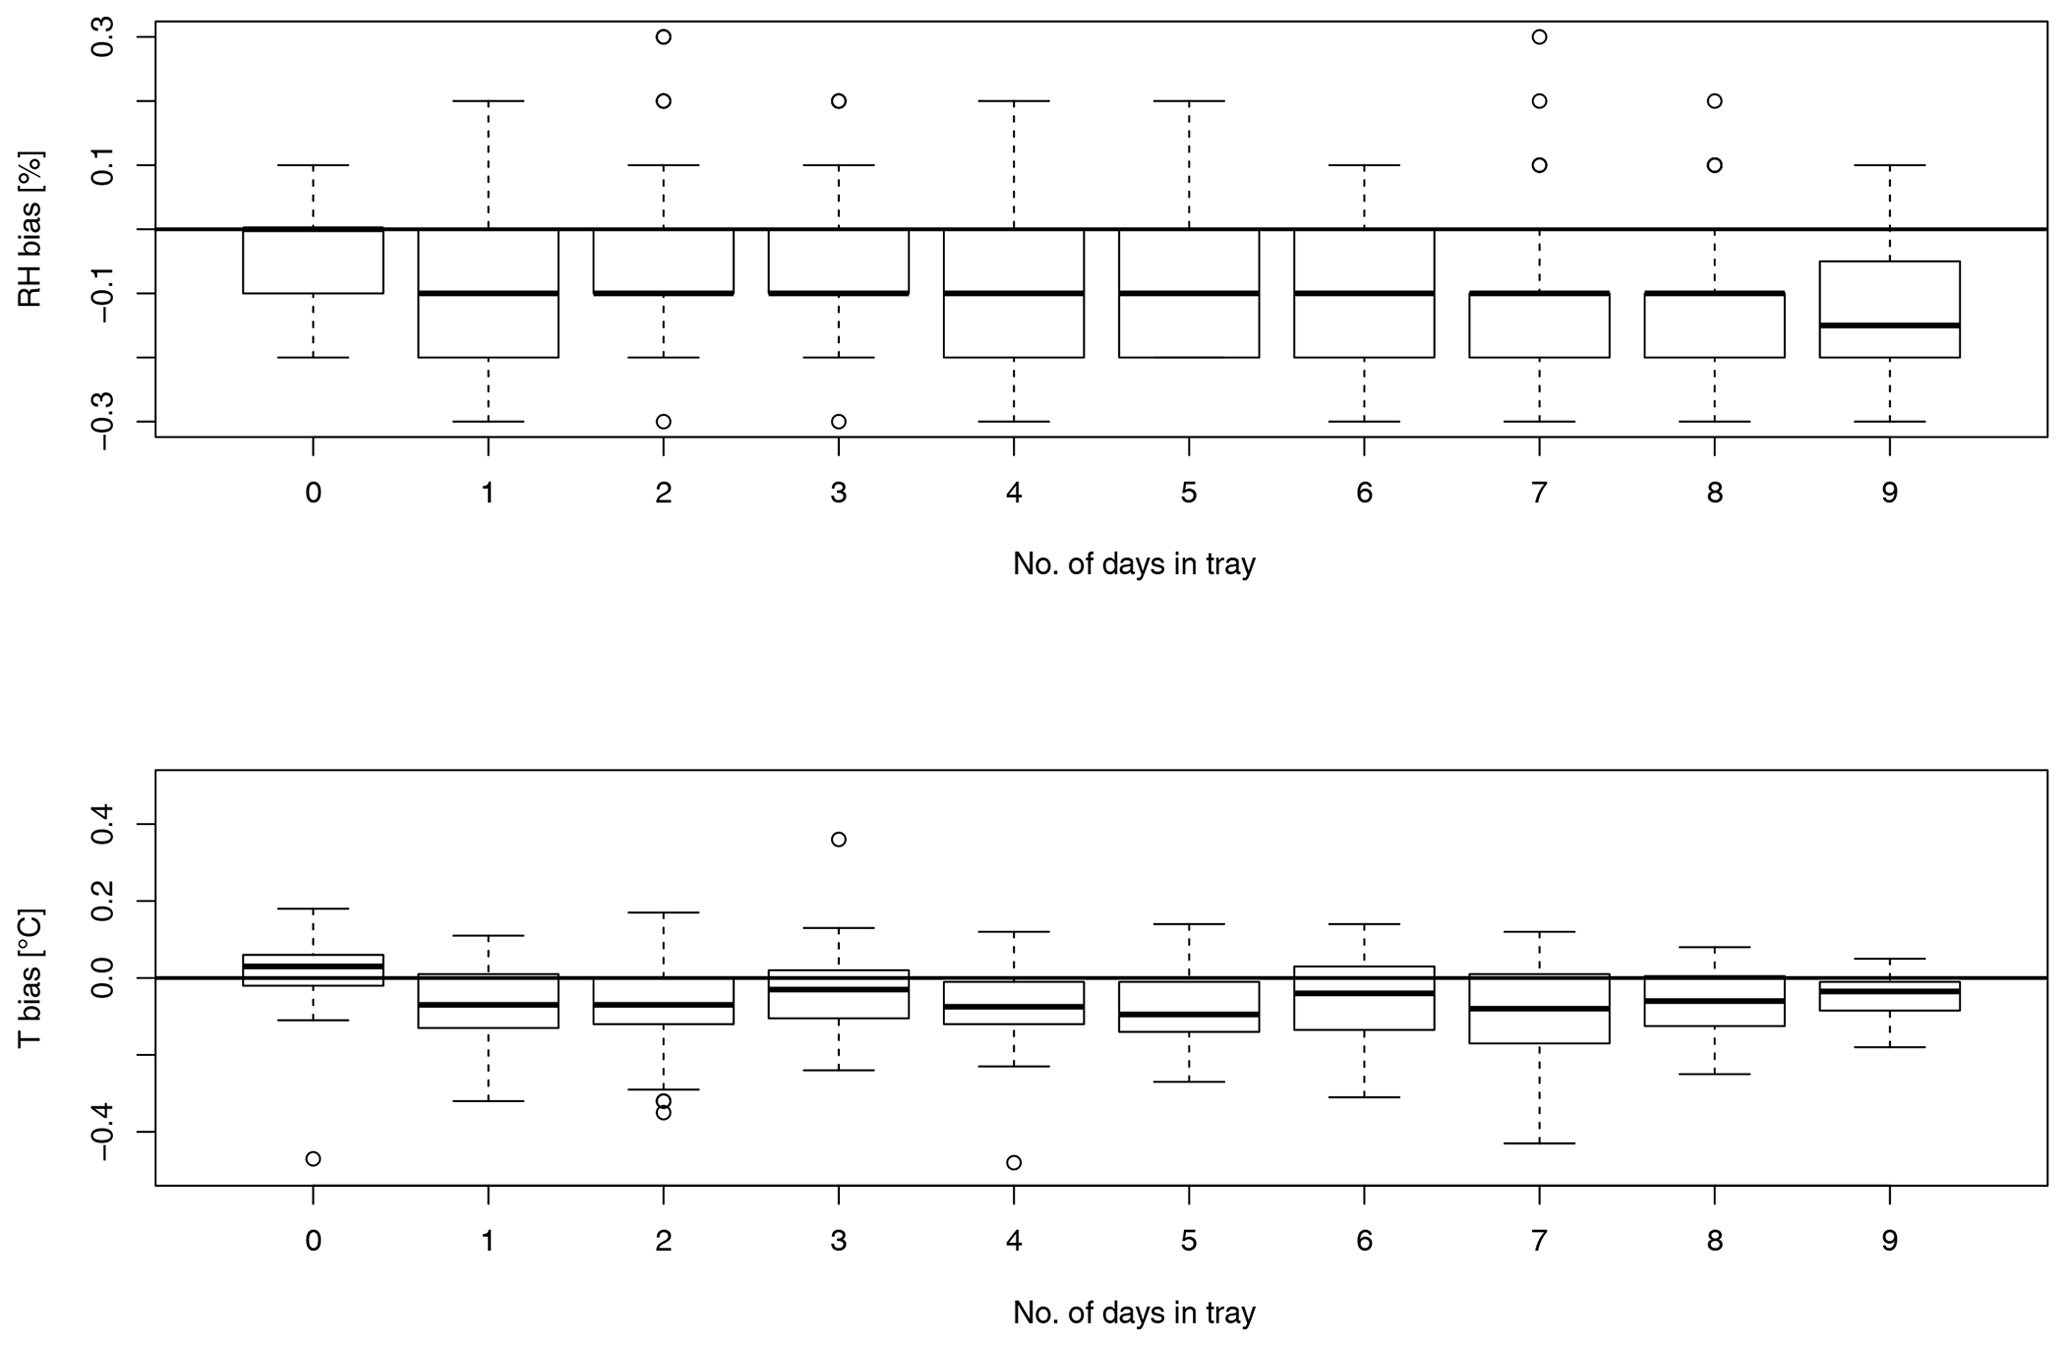
Figure 10Average difference and standard deviation of temperature and relative humidity found during the Vaisala GC process versus the ageing (number of days into tray from the loading until launch) of the RS41 radiosonde into the Payerne ARL (Vaisala AS15).
4.2 Performance of the Meteomodem ARL
The performance of the Meteomodem ARL ground check has been evaluated through the analysis of a dataset collected at the Météo-France Trappes station, where M10 radiosondes have been launched regularly at 11:30 and 23:30 UTC since 2016. The availability of a long time series for the comparison between M10 temperature and humidity sensor and a reference temperature/humidity sensor (Vaisala HMP110; https://www.vaisala.com/sites/default/files/documents/HMP110-Datasheet-B210852EN_1.pdf, last access: 3 July 2020) at ambient conditions, inside a meteorological shelter for the Trappes station, permits the investigation of the system performance also in the pre-launch phase. Since June 2018, this comparison has been carried out during the 5 min before each automatic sounding. Figure 11 summarizes the time series and PDF of the difference between M10 and HMP110 sensor for temperature (black curve, upper panel) and relative humidity (blue curve, lower panel) recorded between June 2018 and June 2019. The relative humidity difference oscillates around 0 % and in more than 75 % of the cases the difference is smaller than 2 % RH in absolute value. For temperature, the observed residual difference around 0.5 ∘C requires further investigation.
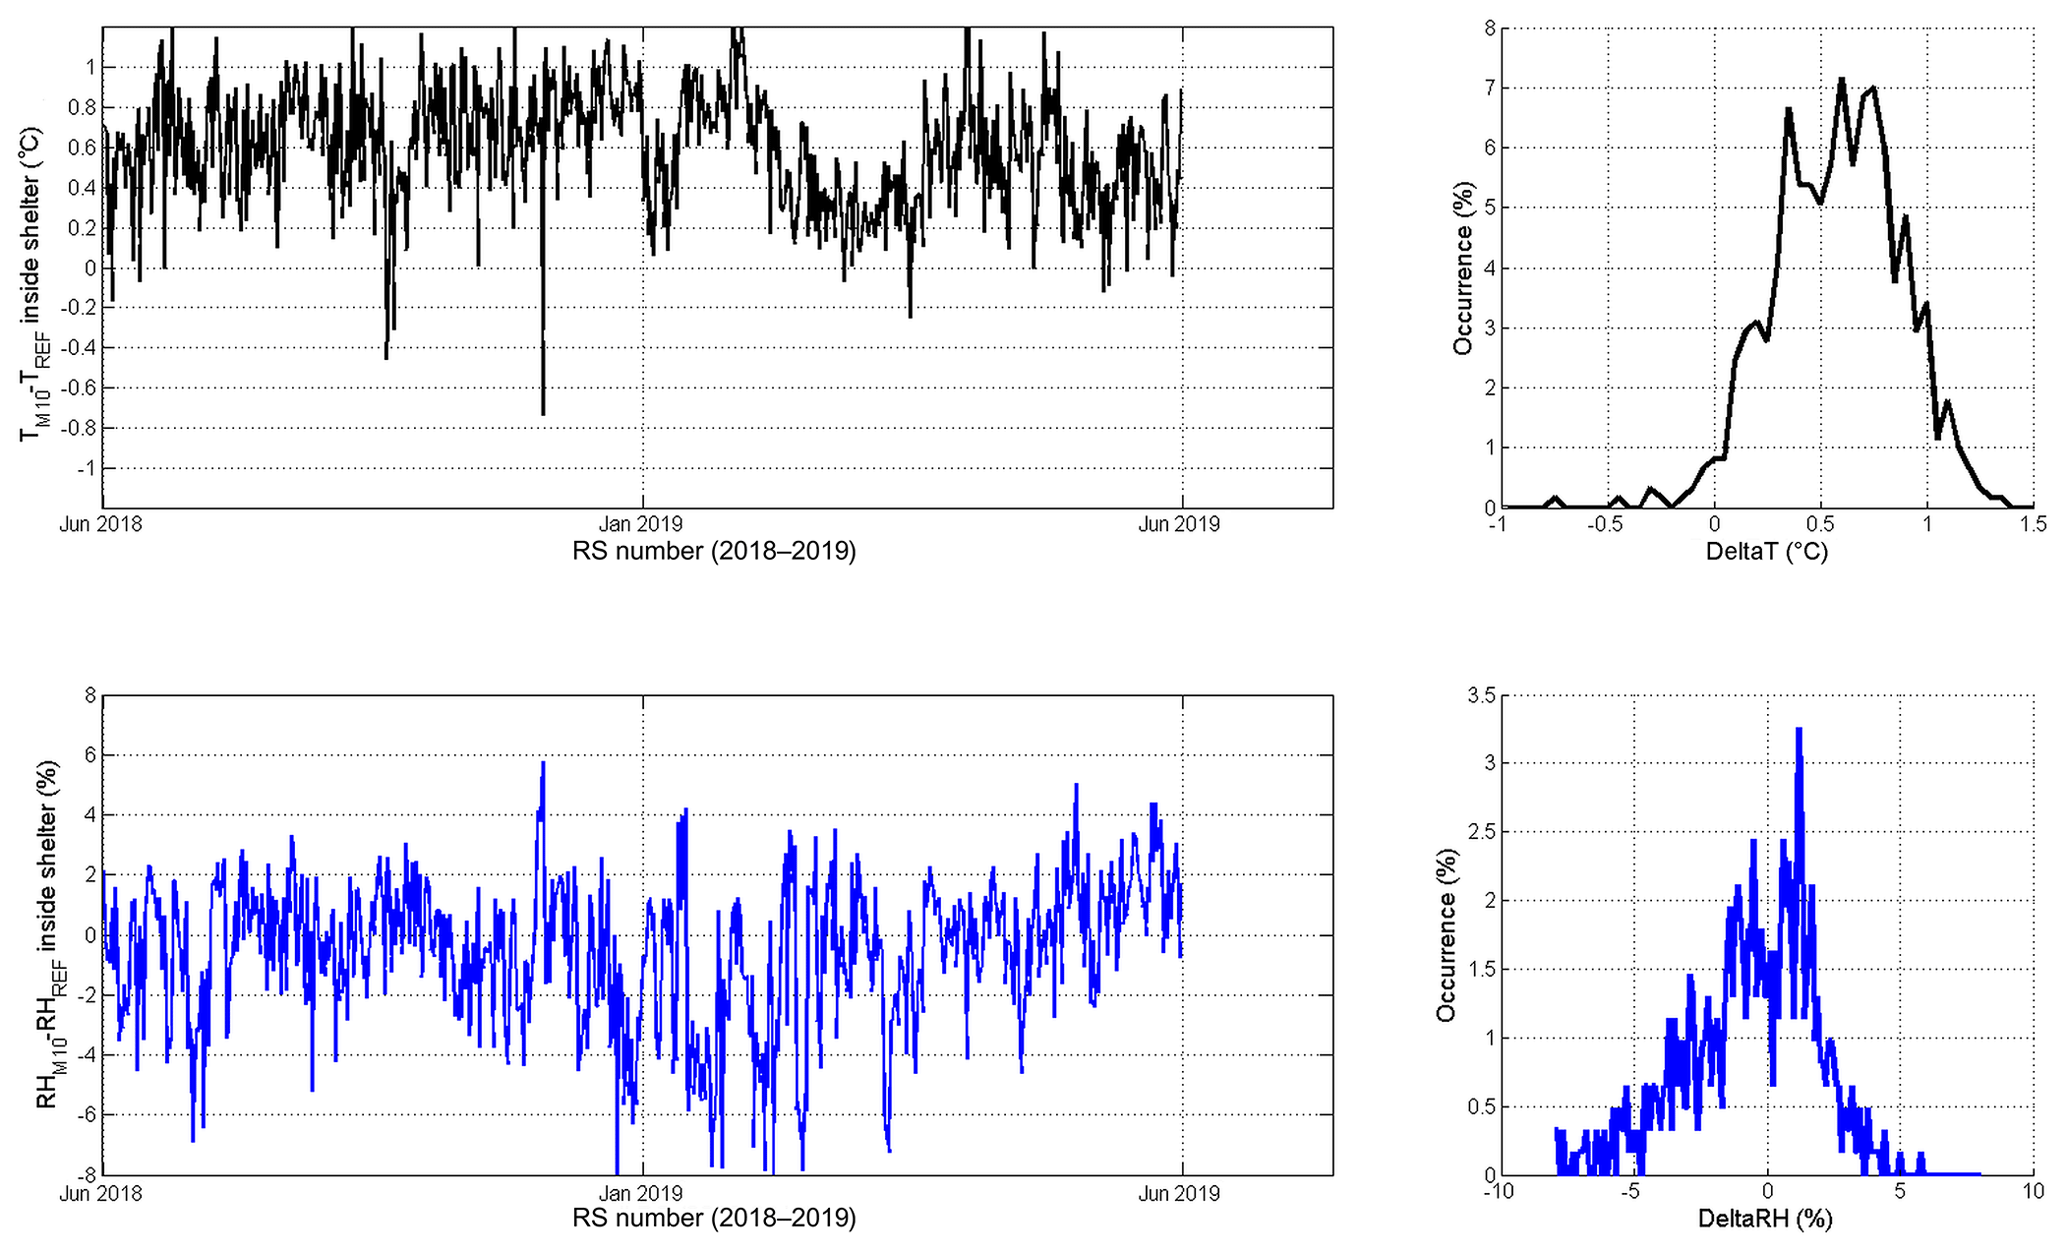
Figure 11Time series and pdf of the difference between M10 and HMP110 sensor for temperature (black curve) and relative humidity (blue curve) between June 2018 and June 2019, measured at ground level inside a meteorological shelter in ambient condition.
Figure 12 provides a picture of the meteorological shelter and the position of the HMP110 and the M10 during the 5 min comparison shown in Fig. 11. These results need further investigation in order to determine if the systematic difference observed on temperature in the meteorological shelter is due to the Meteomodem M10 batches produced in 2018, though Meteomodem did not report similar systematic differences during the production checks, or if this could be due to the need for improvements in the experimental protocol. The meteorological shelter has been improved with the installation of a fan (Fig. 12), which should produce a better homogenization of the temperature and relative humidity around the two sensors. The development of a new experimental protocol is under consideration and should lead to the production of a tube ventilated by a laminar flow in which the Meteomodem M10 and a PTU reference could measure under the same environment, elucidating further upon the characterization of the spatial homogeneity of the temperature and relative humidity.
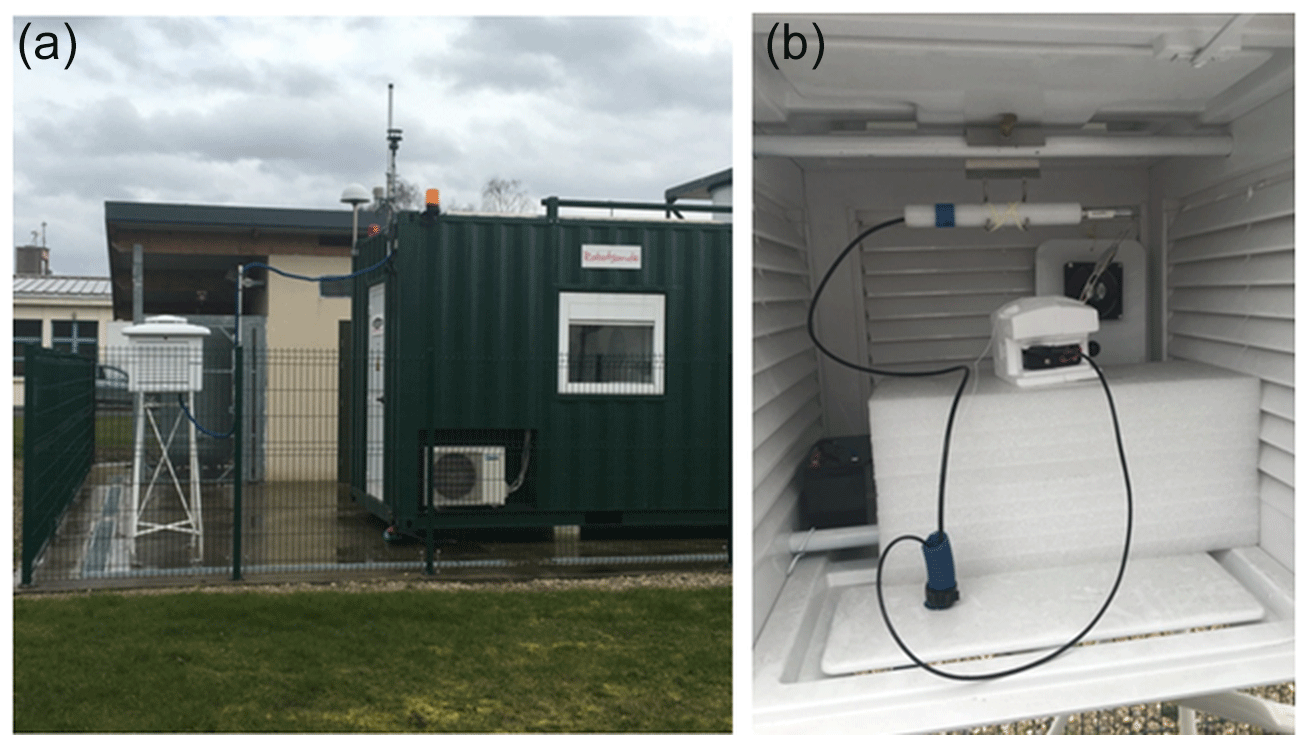
Figure 12Picture of the meteorological shelter in Trappes (a general view: the meteorological shelter is near the Meteomodem ARL entrance for simplicity reasons; b inside of the meteorological shelter).
Finally, the M10 radiosonde is put inside a SHC chamber for 3 min before the sounding (with a relative humidity near 100 %); more than 95 % of the samplings are accepted after the test. For operational reasons, the Meteomodem probes used in the GRUAN protocol are tested in the meteorological shelter and in the 100 % RH test but not necessarily in this order each time. It is not known if the order of the checks makes any difference.
This section reports the statistics for the vertical velocity and the balloon burst altitudes from the datasets collected at Sodankylä and Trappes stations.
5.1 Vertical velocity and balloon burst altitude for Vaisala technology
In Fig. 13, the statistics of the balloon vertical velocity and of the burst altitude for Sodankylä in the period from 2006 to 2012 are shown. In terms of vertical velocity (Fig. 13a), the ARL has a quasi-symmetric frequency distribution peaked around 5.3 m s−1 with a spread mainly between 4.7 and 5.9 m s−1. For the manual launches, the frequency distribution is quite wide, non-symmetric, peaked around 4.5 m s−1 with a larger spread of the values mainly between 3.5 and 5.7 m s−1. The comparison reveals the higher stability of the ARL compared to manual launches in controlling the balloon filling and therefore the sounding vertical velocity which is relevant for the quality of the measured profile. For the balloon burst altitude (Fig. 13b), a like-for-like comparison between the manual launches and the ARL is not feasible at Sodankylä due to the use of different balloon types (typically smaller for the ARL) which causes a strong difference in balloon altitude. Totex Tx800 or Tx600 types of balloons were used in winter and Totex Ta350 or Tx350 types of sounding balloons were flown during all other seasons. Due to smaller balloon volume, the summertime soundings had lower burst heights on average. The burst altitude for the ARL has also in this case a quasi-symmetric frequency distribution, which peaked around 25 km altitude a.g.l. with a spread of the values mainly between 17 km and 28 km a.g.l., while the distribution for manual launches is non-symmetric, with a maximum frequency around 33 km and most of values ranging within 21–35 km a.g.l. Differences between nighttime and daytime soundings were not significant, although nighttime soundings have on average lower burst heights during polar vortex overhead conditions in winter.
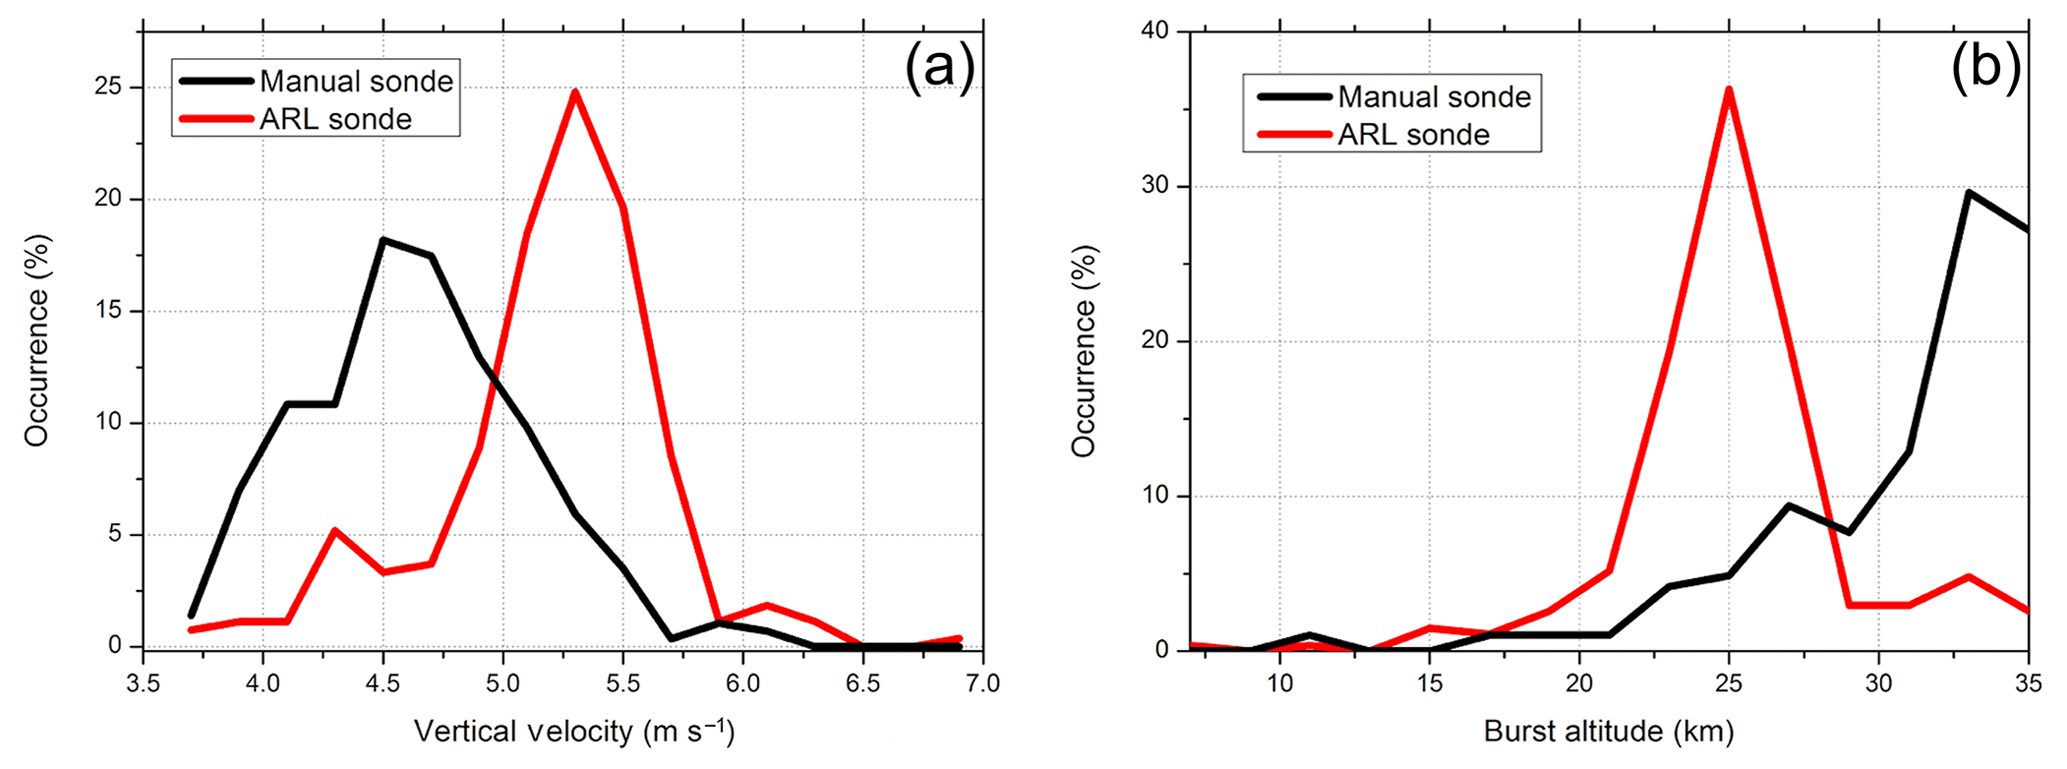
Figure 13Vertical velocity (a) for radiosondes launched manually (black line) and automatically (red line), along with burst altitude (b) at Sodankylä station.
5.2 Vertical velocity and balloon burst altitude for Meteomodem technology
A more interesting comparison to show the eventual positive influence of automation on the burst altitude is those related to the dataset discussed in Sect. 3 and summarized in Table 5, shared by Météo-France for Trappes station (Fig. 14). In terms of vertical velocity (Fig. 14a), both the ARL and the manual launches have a quasi-symmetric frequency distribution peaked around 5.1 and 5.5 m s−1, respectively, with a similar spread of about 1.0 m s−1. For the burst altitude (Fig. 14b), we have for both the datasets a negatively skewed distribution with an evident peak around 33 km for the manual launches and 35 km for the ARL. The comparison reveals that the burst altitude (Fig. 14b) is generally higher for the ARL than for the manual launches, likely due to use of different balloons and the more limited human contact with the balloon which hence likely retains greater structural integrity. ARL frequency distribution has also a more peaked distribution that can be related to a more homogeneous balloon inflation (automatic inflation, same method, constant gas flow, more stable temperature). Furthermore, the vertical velocity of the balloon is stable (Fig. 14a). Overall, 40 % of the balloons burst before 30 km during the manual period, where only 20 % do during the automatic period. This result means that the Meteomodem ARL and/or the operational procedures, elaborated under a joint effort by Meteomodem and Météo-France, has increased by a factor of 2 compared to the number of balloons reaching an altitude higher than 30 km. The burst altitude for both periods (2012–2014 for the manual launches and 2016–2018 for the ARL) shows some seasonal signal. It appears that burst altitude is lower during the winter. A further study could evaluate burst altitude as a function of air temperature or potential vorticity in order to study the influence of polar vortex and its potential impact on the burst altitude.
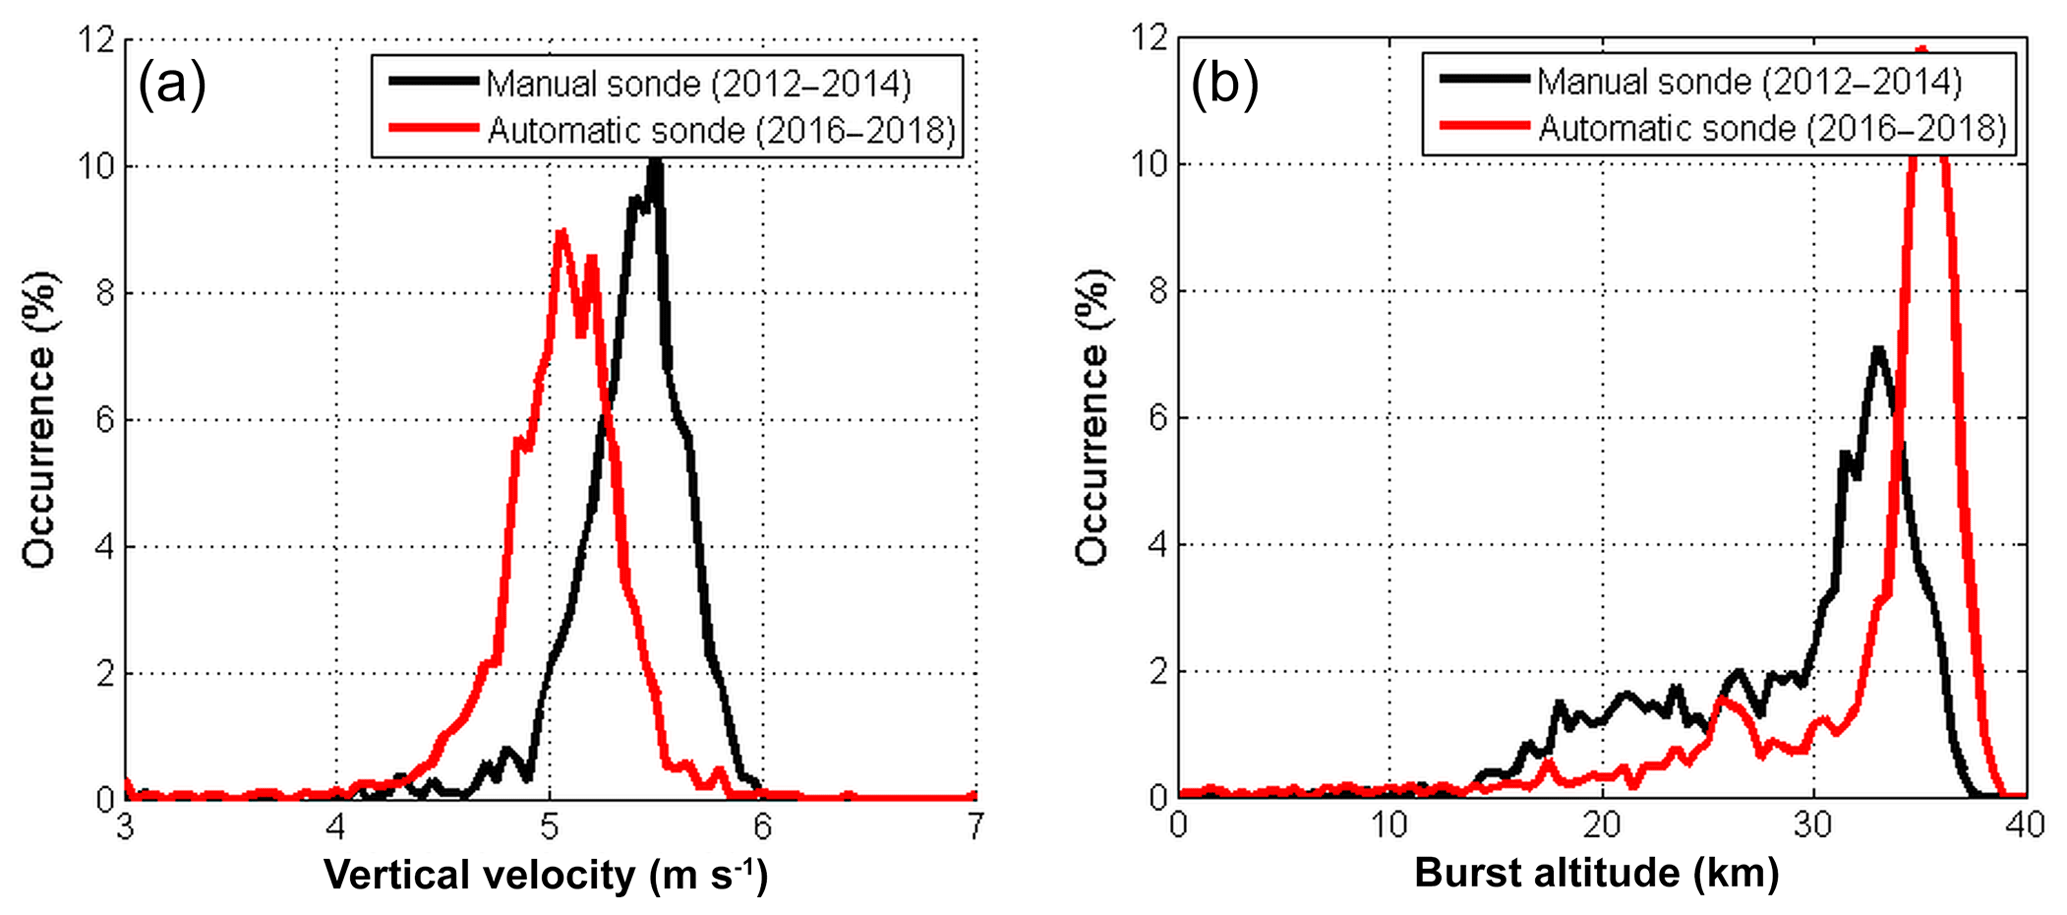
Figure 14Vertical velocity (a) for radiosondes launched manually (black line) and automatically (red line), along with burst altitude (b) at Trappes station.
5.3 Quantifying relative performance
In this section, two datasets are investigated to assess the differences in the vertical profiles of temperature and humidity: the set of RS92 parallel (automatic and manual) soundings performed with the automatic radiosonde launchers at Sodankylä, along with a second set of Meteomodem radiosoundings collected at Faa'a station, French Polynesia. These are near-coincident launches but the instruments are on physically distinct balloons which, as they ascend, likely at somewhat different rates if the balloons are not filled identically, will follow subtly distinct pathways leading to offsets in sampling. In the following analysis, given the latitude φ, the longitude λ, the Earth's radius R (mean radius of 6371 km), the distance between two balloons (1 and 2) has been calculated using the “haversine” formula (Sheppard and Soule, 1922) which provides the great-circle distance between two points (i.e. shortest distance over the Earth's surface):
where
The haversine formula remains particularly well conditioned for numerical computation even at small distances – unlike calculations based on the spherical law of cosines. The function “atan2” is described in Glisson (2011).
The two datasets are also investigated to show the correlation between the difference in the vertical profiles and the distance between the two flying sondes.
5.4 Parallel soundings with Vaisala systems
For the same 6-year dataset collected at Sodankylä discussed in Sect. 4, the vertical profiles of the average differences (automatic minus manual) and standard deviations of the temperature and RH measured during parallel soundings are shown in Fig. 15. Systematic differences in the temperature profile are negligible (on average smaller than 0.01 K) over the entire vertical range up to 25 km a.g.l., while the standard deviation increases with altitude from values smaller than ±0.5 K below 15 km to values larger than 1 K above. The result is in agreement with the increase in mean distance between near-simultaneous sonde paths at higher altitudes (Fig. 16). A subset of the parallel temperature soundings at Sodankylä has previously been analysed by Sofieva et al. (2008). Even though it is hard to separate difference components from non-colocation from those which may arise from instrument-to-instrument differences (e.g. arising from manufacture variations and differences in preparation, storage and launch at the uppermost altitudes), Sofieva et al. found differences in small scale structures in temperature profiles, when the horizontal separation was larger than 20 km. Moreover, to investigate whether the ARL and the manual radiosoundings datasets were selected from populations having the same distribution, i.e. if the calculated mean differences are statistically significant, the Wilcoxon rank sum test has been applied. The test result confirms that the two datasets are samples of the same population, showing a probability larger than 0.5 for temperature at all the altitude levels below 20 km and larger than 0.1 above, while for RH values the probability is larger than 0.3 over the entire range from the surface to 15 km a.g.l.

Figure 15Temperature (a) and RH (b) mean difference between ARL and manual for the 6-year dataset of parallel soundings collected at Sodankylä station at all altitude levels up to 25 km a.g.l. for temperature and up to 15 km a.g.l. for RH. Standard deviation at each pressure level is reported using the grey area.

Figure 16Horizontal distance between the balloons calculated for the 6-year dataset of parallel soundings collected at Sodankylä station for all the altitude levels up to 32 km a.g.l.
For the RH mean difference profile (Fig. 15b), there are no significant systematic differences up to 7 km and then again above 10 km a.g.l., while in between these altitudes a small negative mean difference lower than 1 % RH is found and may be related to the RH variability in the upper troposphere and the increased distance between the two sondes. The increase in standard deviation in the lower troposphere below 5 km a.g.l., with values generally smaller than 5 % RH, is due to the high RH variability which can be significant even for small horizontal distances between the two sondes. Above 5 km, and continuing through the profile to the upper troposphere/lower stratosphere (UT/LS) where the values of RH are on average smaller and less variable, RH difference decreases except when clouds or other uncommon events are detected (e.g. stratospheric–tropospheric exchanges).
In addition, the analysis was re-run after grouping the ARL flights according to the time a sonde had been loaded to the launcher system (see Sect. 4); variations of time period between sonde loading and actual launch time did not influence the comparison results.
Finally, the Wilcoxon rank sum test has been applied to the entire dataset, and the computed probability that the two samples belong to the same population is larger than 0.35 at all altitude levels.
5.5 Parallel soundings at Faa'a with Meteomodem systems
A first evaluation of the performance of Meteomodem ARL is provided by the analysis of the datasets collected over 3–14 October 2018 at Faa'a station (French Polynesia, station identifier 0-20000-0-91938; 17.63∘ S, 149.84∘ W; 21 m a.s.l.), where 21 launches (9 daytime and 12 nighttime) of parallel radiosoundings have been undertaken (a picture is provided in Fig. 17) in order both to compare temperature, relative humidity, wind speed and direction, and to study further characteristics of the flights (burst altitude, ascent speed, for example). Météo-France has conducted the intensive operational period, while Institut Pierre Simon Laplace (IPSL) has produced the NetCDF files (data and metadata) for the analysis. Raw data without any correction for temperature and relative humidity have been considered in this paper. The GRUAN data processing, which remains under development at the present time for this data stream, has not been applied. The manufacturer Meteomodem IR2010 software was used for both manual and automatic launches.
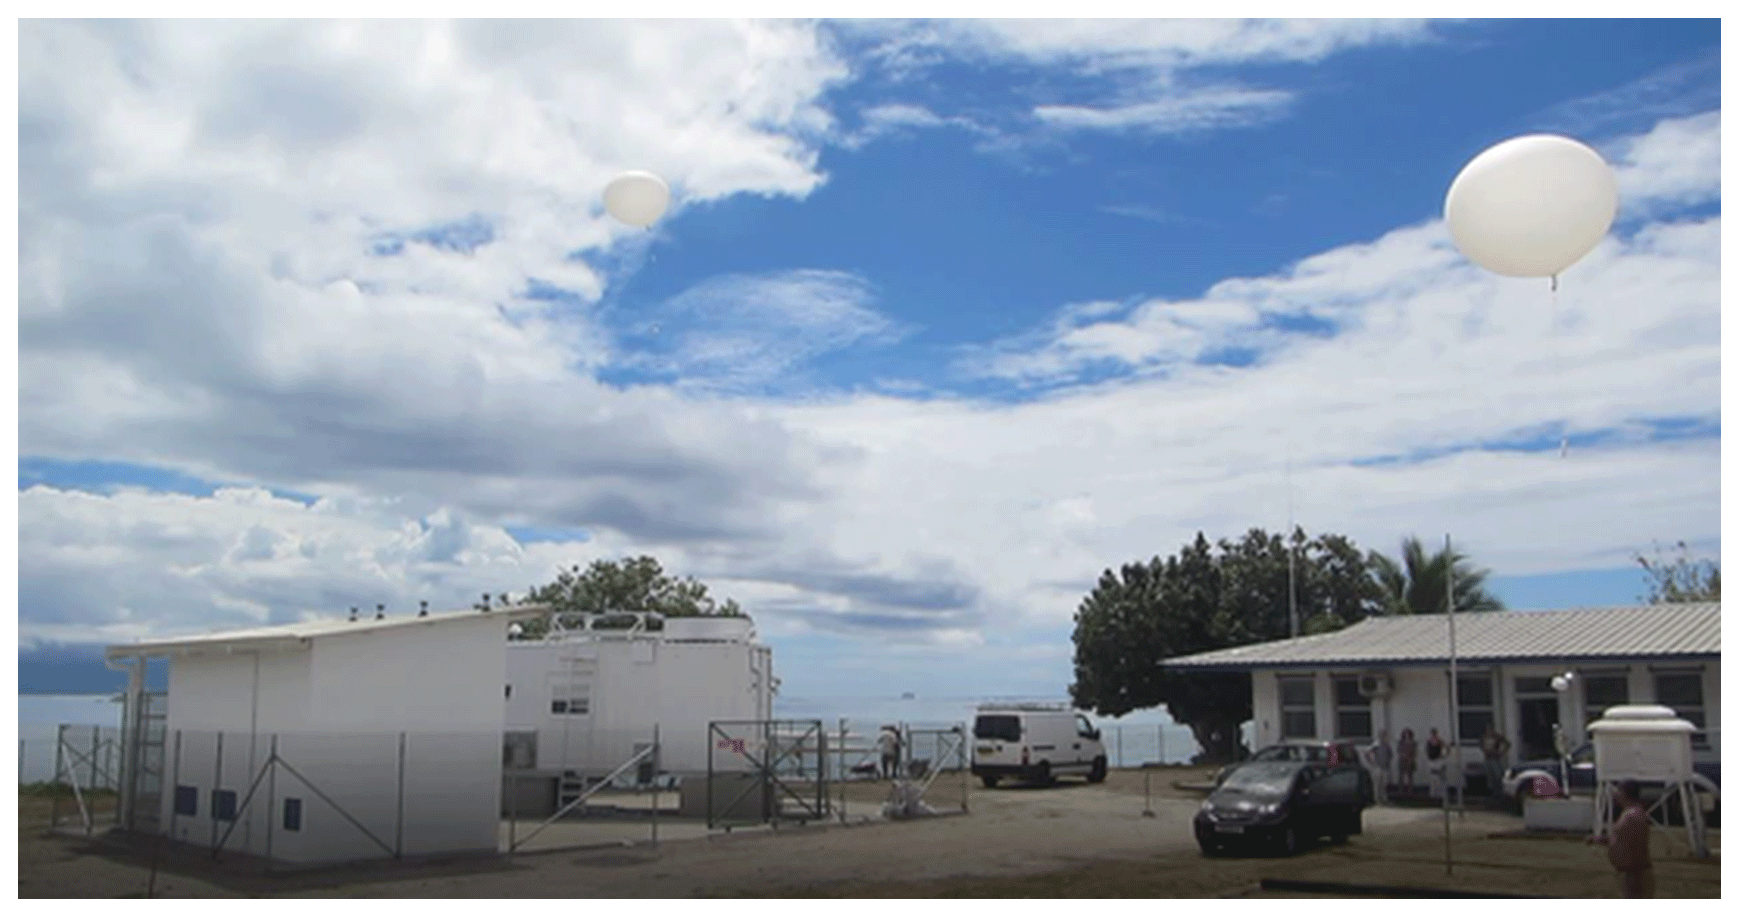
The dataset collected by Météo-France at Faa'a station is not sufficiently large to draw robust statistical inferences. Nevertheless, this dataset is the first ever available to evaluate the performance of the Meteomodem ARL and can provide useful indications of any likely impact upon the data quality of ARL facilities.
Before comparing, the T and RH profiles of the parallel sounding dataset have been interpolated to a resolution of 100 m altitude. The difference between the launch time of the ARL and the manual balloons ranges between 1 and 12 s.
In Fig. 18, the horizontal distance between the pairs of parallel soundings at all the altitude levels up to 25 km a.g.l. is shown; the horizontal distance between the two balloons is typically within about 35 km.
In Fig. 19, the mean difference between the set of ARL and manual parallel soundings profiles of temperature and RH as a function of altitude regardless of time mismatch, along with the corresponding standard deviation is shown. Figure 19a shows the difference for temperature, while Fig. 19b shows it for RH. The mean temperature difference is smaller than ±0.2 K up to 12–13 km a.g.l. and typically smaller than ±0.5 K above. The difference is negative, up to −2.0 K, in the first 50–100 m, and this is probably due to the potential warming effect of the ARL environment on the radiosonde sensor.
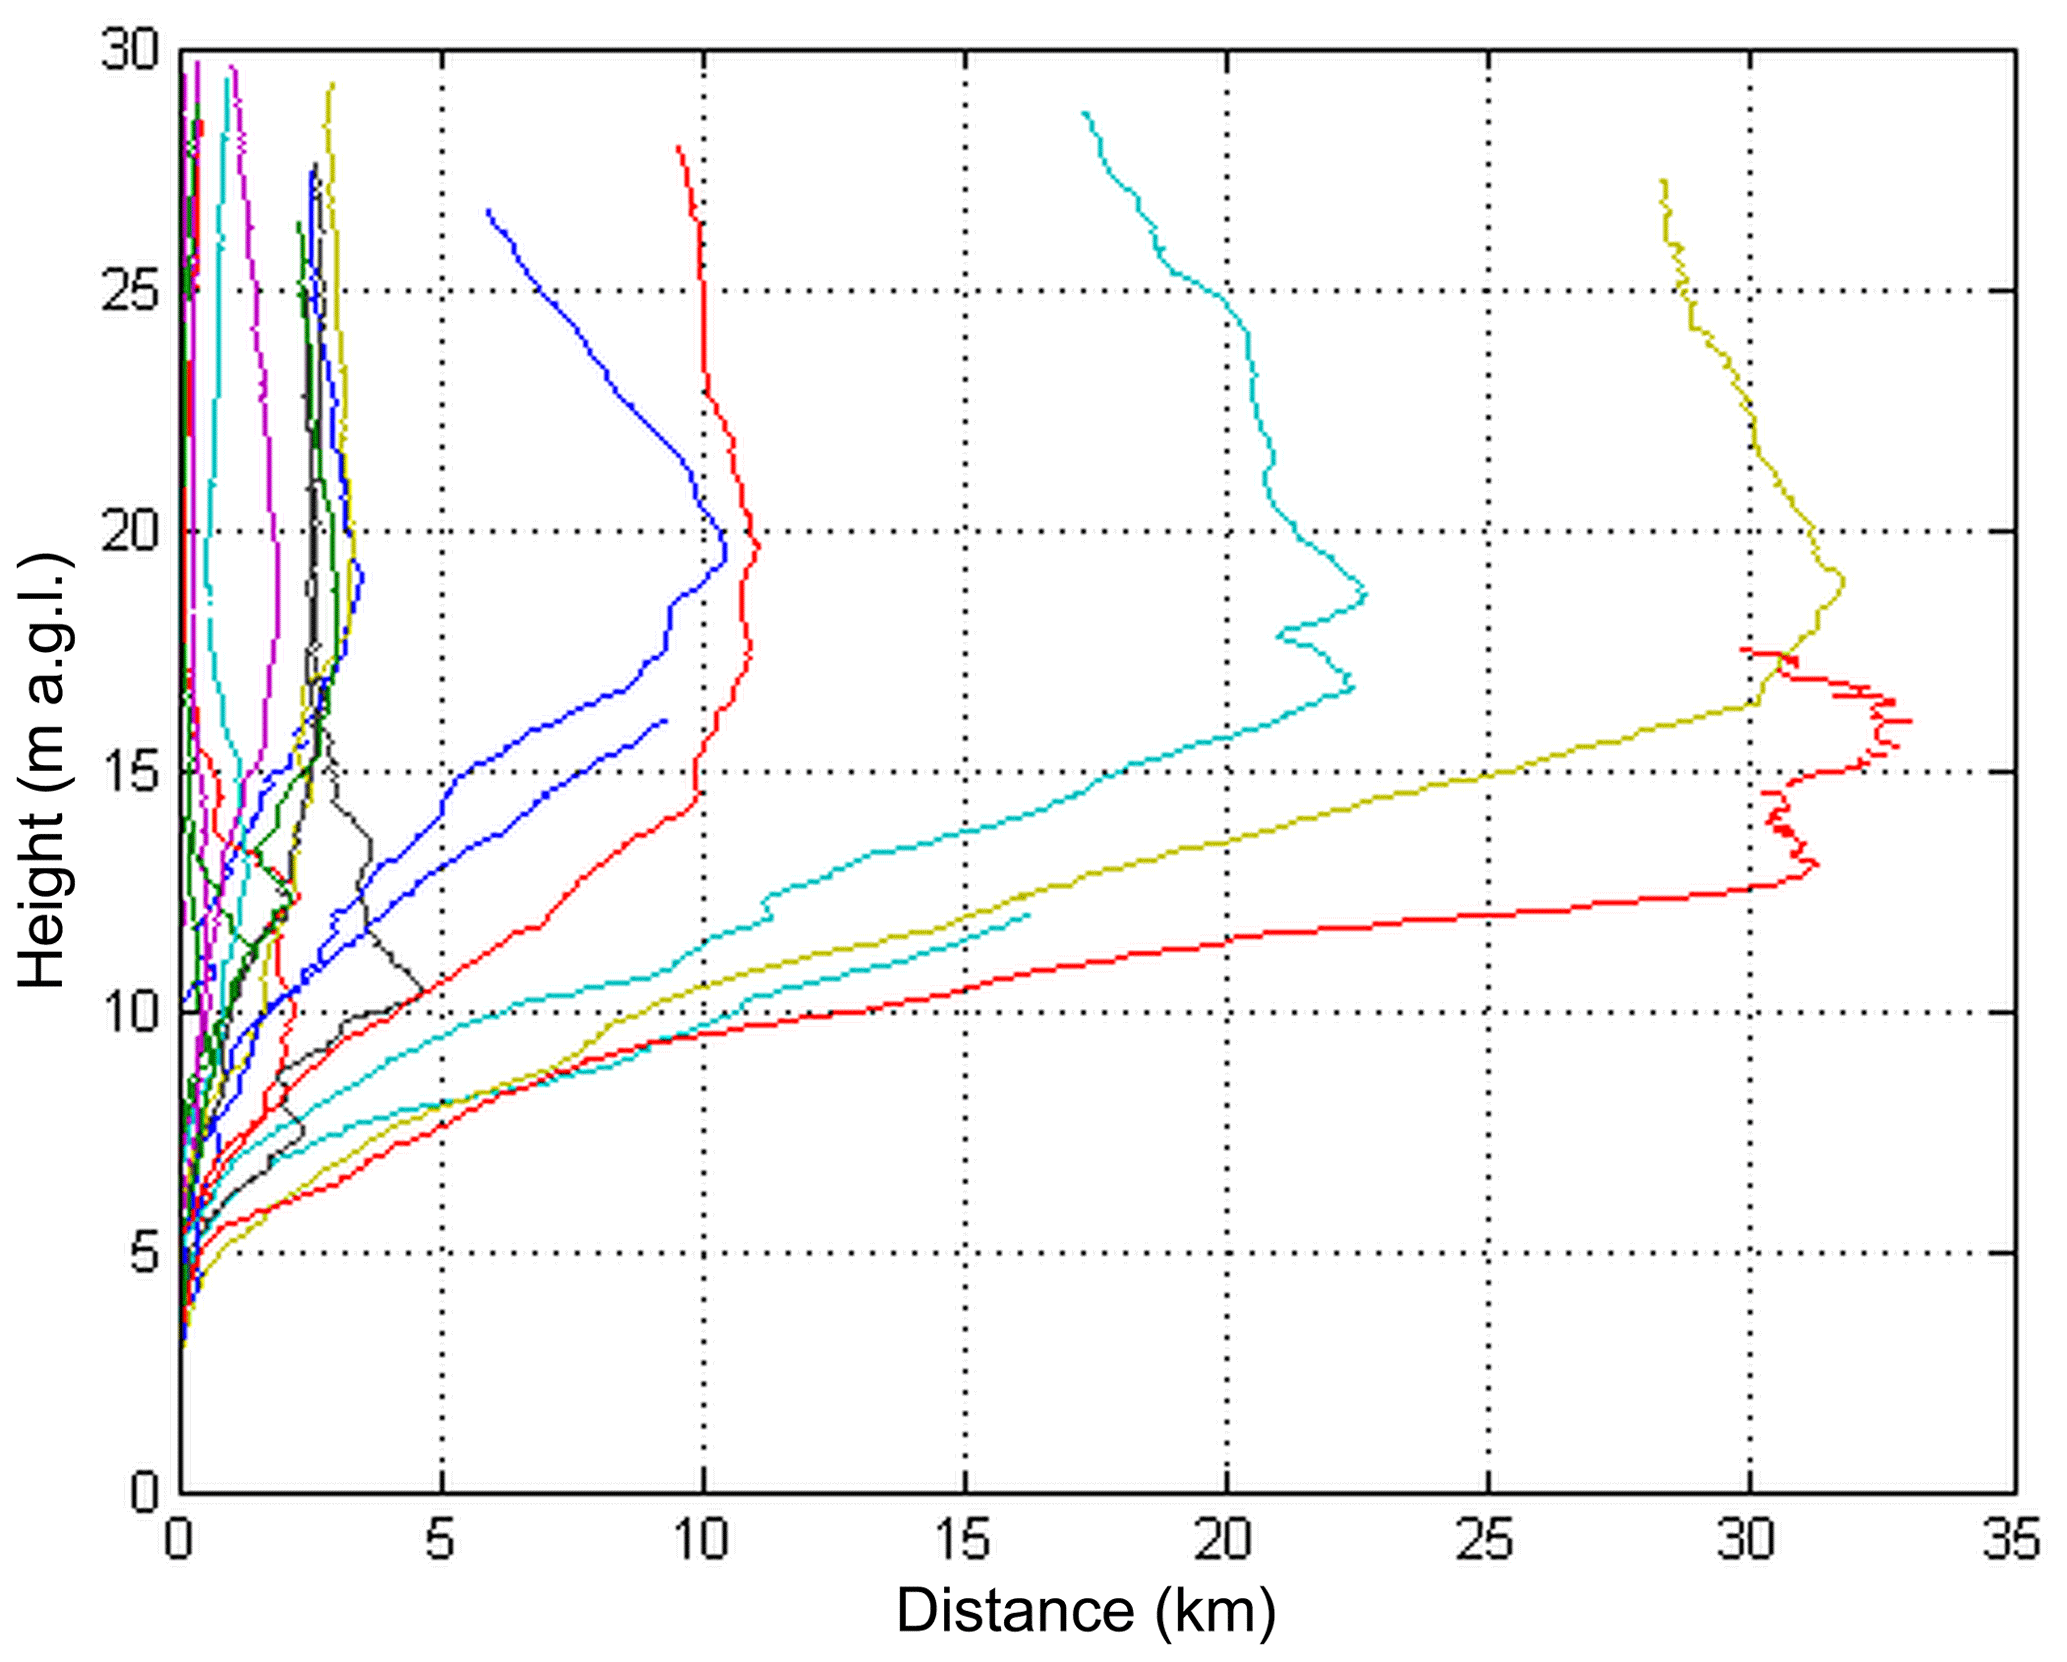
Figure 18Horizontal distance calculated for the balloons of the 21 parallel soundings performed at Faa'a station for all the altitude levels up to 25 km a.g.l. Measurement time between the two sondes at the same altitude levels may differ and at the start time ranges within 1–12 s.
For RH, the mean difference is instead always positive and smaller than 0.7 % RH up to 8 km a.g.l. with a standard deviation smaller than 3 %–4 % RH. Above 8 km, the mean difference becomes larger and less variable with a maximum of about 2 % RH and a standard deviation around 3 %. The Wilcoxon rank sum test has been applied to both temperature and RH. For temperature, the probability is higher than 0.3 until 17 km and higher than 0.2 above, while for RH is larger than 0.2 below 10 km and larger than 0.1 above. Only in the first 40 m for temperature and the first 20 m for RH, the Wilcoxon rank sum test fails with a probability lower than 0.05. The results of the test confirm the null hypothesis of the same median for the ARL and manual data distribution at all the height levels for both temperature and RH, with the only exception of a few decametres above the ground because of the ARL air-conditioned effect. The reason behind this bias could arise from GC effects or differences in the pre-launch procedures between the two systems affecting the performance of one of the two launches in a quasi-systematic manner throughout the vertical profile. This will be further investigated with the support of the manufacturer.
In terms of balloon burst altitude, the ARL proved to be reliable both during the daytime with a burst altitude ranging within 26 688–31 904 m a.g.l.) versus values within 24 970–30 621 m a.g.l. calculated for the manual launches, while during nighttime the burst altitude ranges within 27 587–30 790 m a.g.l. for the automatic launcher versus values within 27 437–30 139 m a.g.l. for the manual launches. Applying the Wilcoxon rank sum test, the computed probability (0.05224) for the entire dataset is slightly greater than the 0.05 significance level, and therefore the two distributions of burst altitudes are not significantly different, indicating that ARL does not lead to significant improvements in the balloon burst altitude.
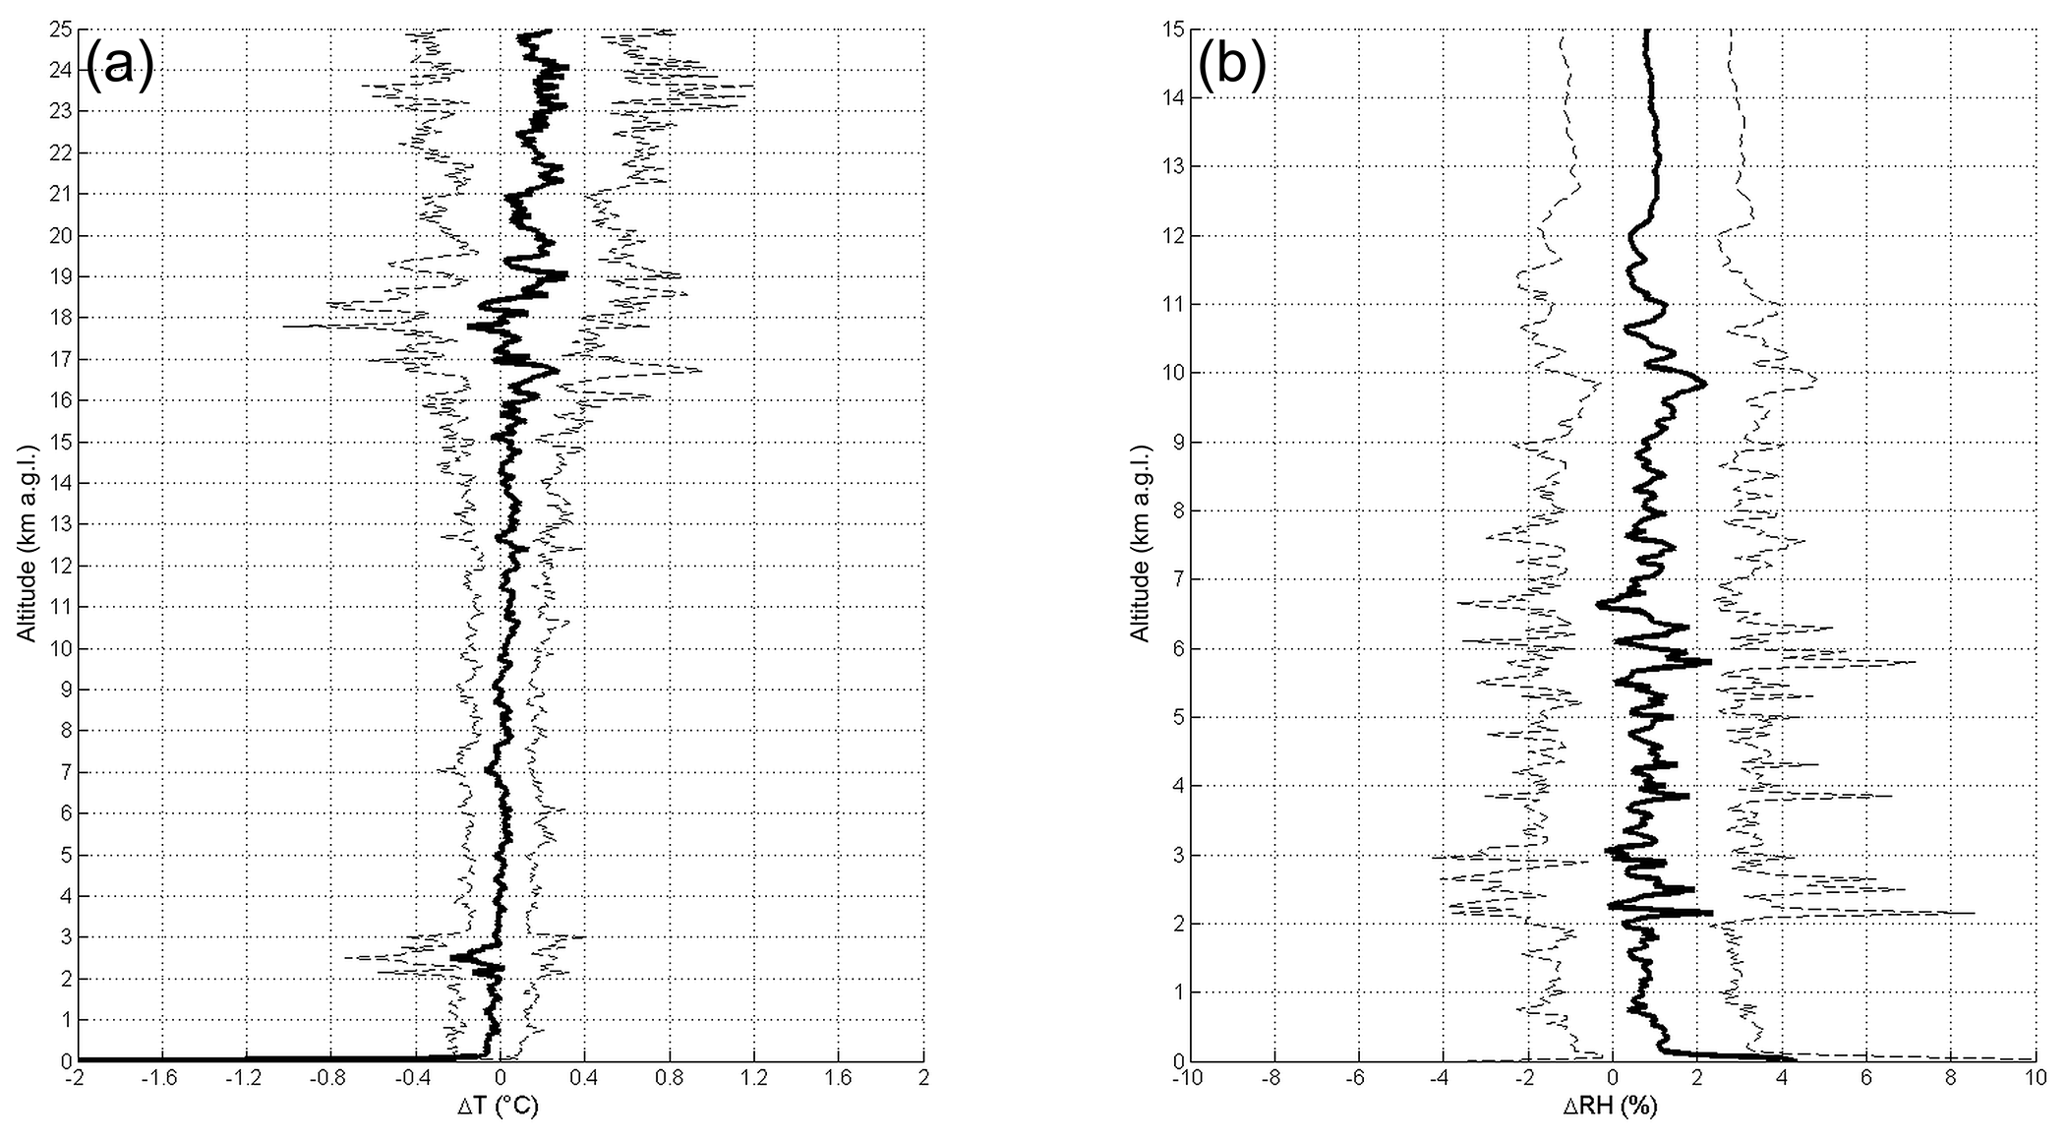
Figure 19Difference between ARL and manual profiles of temperature (a) and RH (b) for 21 parallel soundings performed at Faa'a station up to 25 km a.g.l. for temperature and up to 15 km a.g.l. for relative humidity. Black lines are mean differences; dashed lines are standard deviations. A negative difference up to −2.0 K for temperature and smaller than 3 %–4 % RH is observed in the first 50–100 m, probably due to the potential warming effect of the ARL environment on the radiosonde sensor.
Data assimilation systems compare observations with a short-range forecast (called the background) and use O–B differences in the assimilation to provide improved initial conditions for the next forecast. For some areas/variables, the uncertainties in the background are now similar to, or smaller than, those in the observations, so the background provides a very useful comparator. O–B differences from reanalyses have been also used to homogenize historical radiosonde data (Haimberger et al., 2012). Ingleby (2017) compared different radiosonde types with ECMWF background fields and for temperature and upper-tropospheric humidity found differences in radiosonde performance that are broadly consistent with the results of the last WMO radiosonde intercomparison (Nash et al., 2011) and are dominated by the sonde type.
Statistics for Vaisala and Meteomodem radiosondes (manned and ARL) were produced. For Vaisala we examined the German radiosondes (Fig. 20) which form a relatively dense, well-maintained network with manned and ARL stations interspersed – ideal for this type of comparison. The background uncertainties vary somewhat over time and regionally – they are probably slightly larger over the UK because of the proximity of the North Atlantic. The Meteomodem samples were quite small (from five French stations in total) and inconclusive; therefore, they will not be shown. No attempts to provide a comparison of O–B statistics for Meisei ARL stations were carried out. This is due to the fact that all four Meisei ARLs are on small islands, three to the south of the main islands of Japan and one to the southeast, whereas the manned stations are on the main islands (or two distant islands). Therefore, the O–B comparison could be affected by differences in the background uncertainties over the southern islands relative to the main islands.
Figure 21 shows the numbers of reports at standard levels for German RS92 launches in the period June 2017–2019. There are more than twice as many manned launches as ARL ascents because four of the manned stations usually report four times per day, whereas the other four manned stations and the five ARL stations report twice a day. One interesting feature is that the proportion of ARL ascents reaching 20 hPa is significantly higher than the proportion of manned ascents. A plausible explanation for this is that ARLs put less stress on the neck of the balloon than manual launches (Tim Oakley, personal communication, 2018). During the middle months of 2017, there was a transition from Vaisala RS92 to Vaisala RS41 at German stations – the proportions of RS41 reports at different standard levels (not shown) are very similar to those in Fig. 20.
Figures 22 and 23 compare O–B mean and root mean square (rms) statistics for German RS92 and RS41 reports, respectively (for technical reasons, alphanumeric TEMP reports were used rather than binary BUFR reports; see Ingleby and Edwards, 2014). The RS92 results (Fig. 22) are very similar between manned and ARL stations (small differences at 1000 hPa are presumably due to the proximity of the surface and relatively small samples). The upper-tropospheric humidity has minor systematic differences probably due to humidity time-lag and radiation corrections being introduced at different dates at different stations.
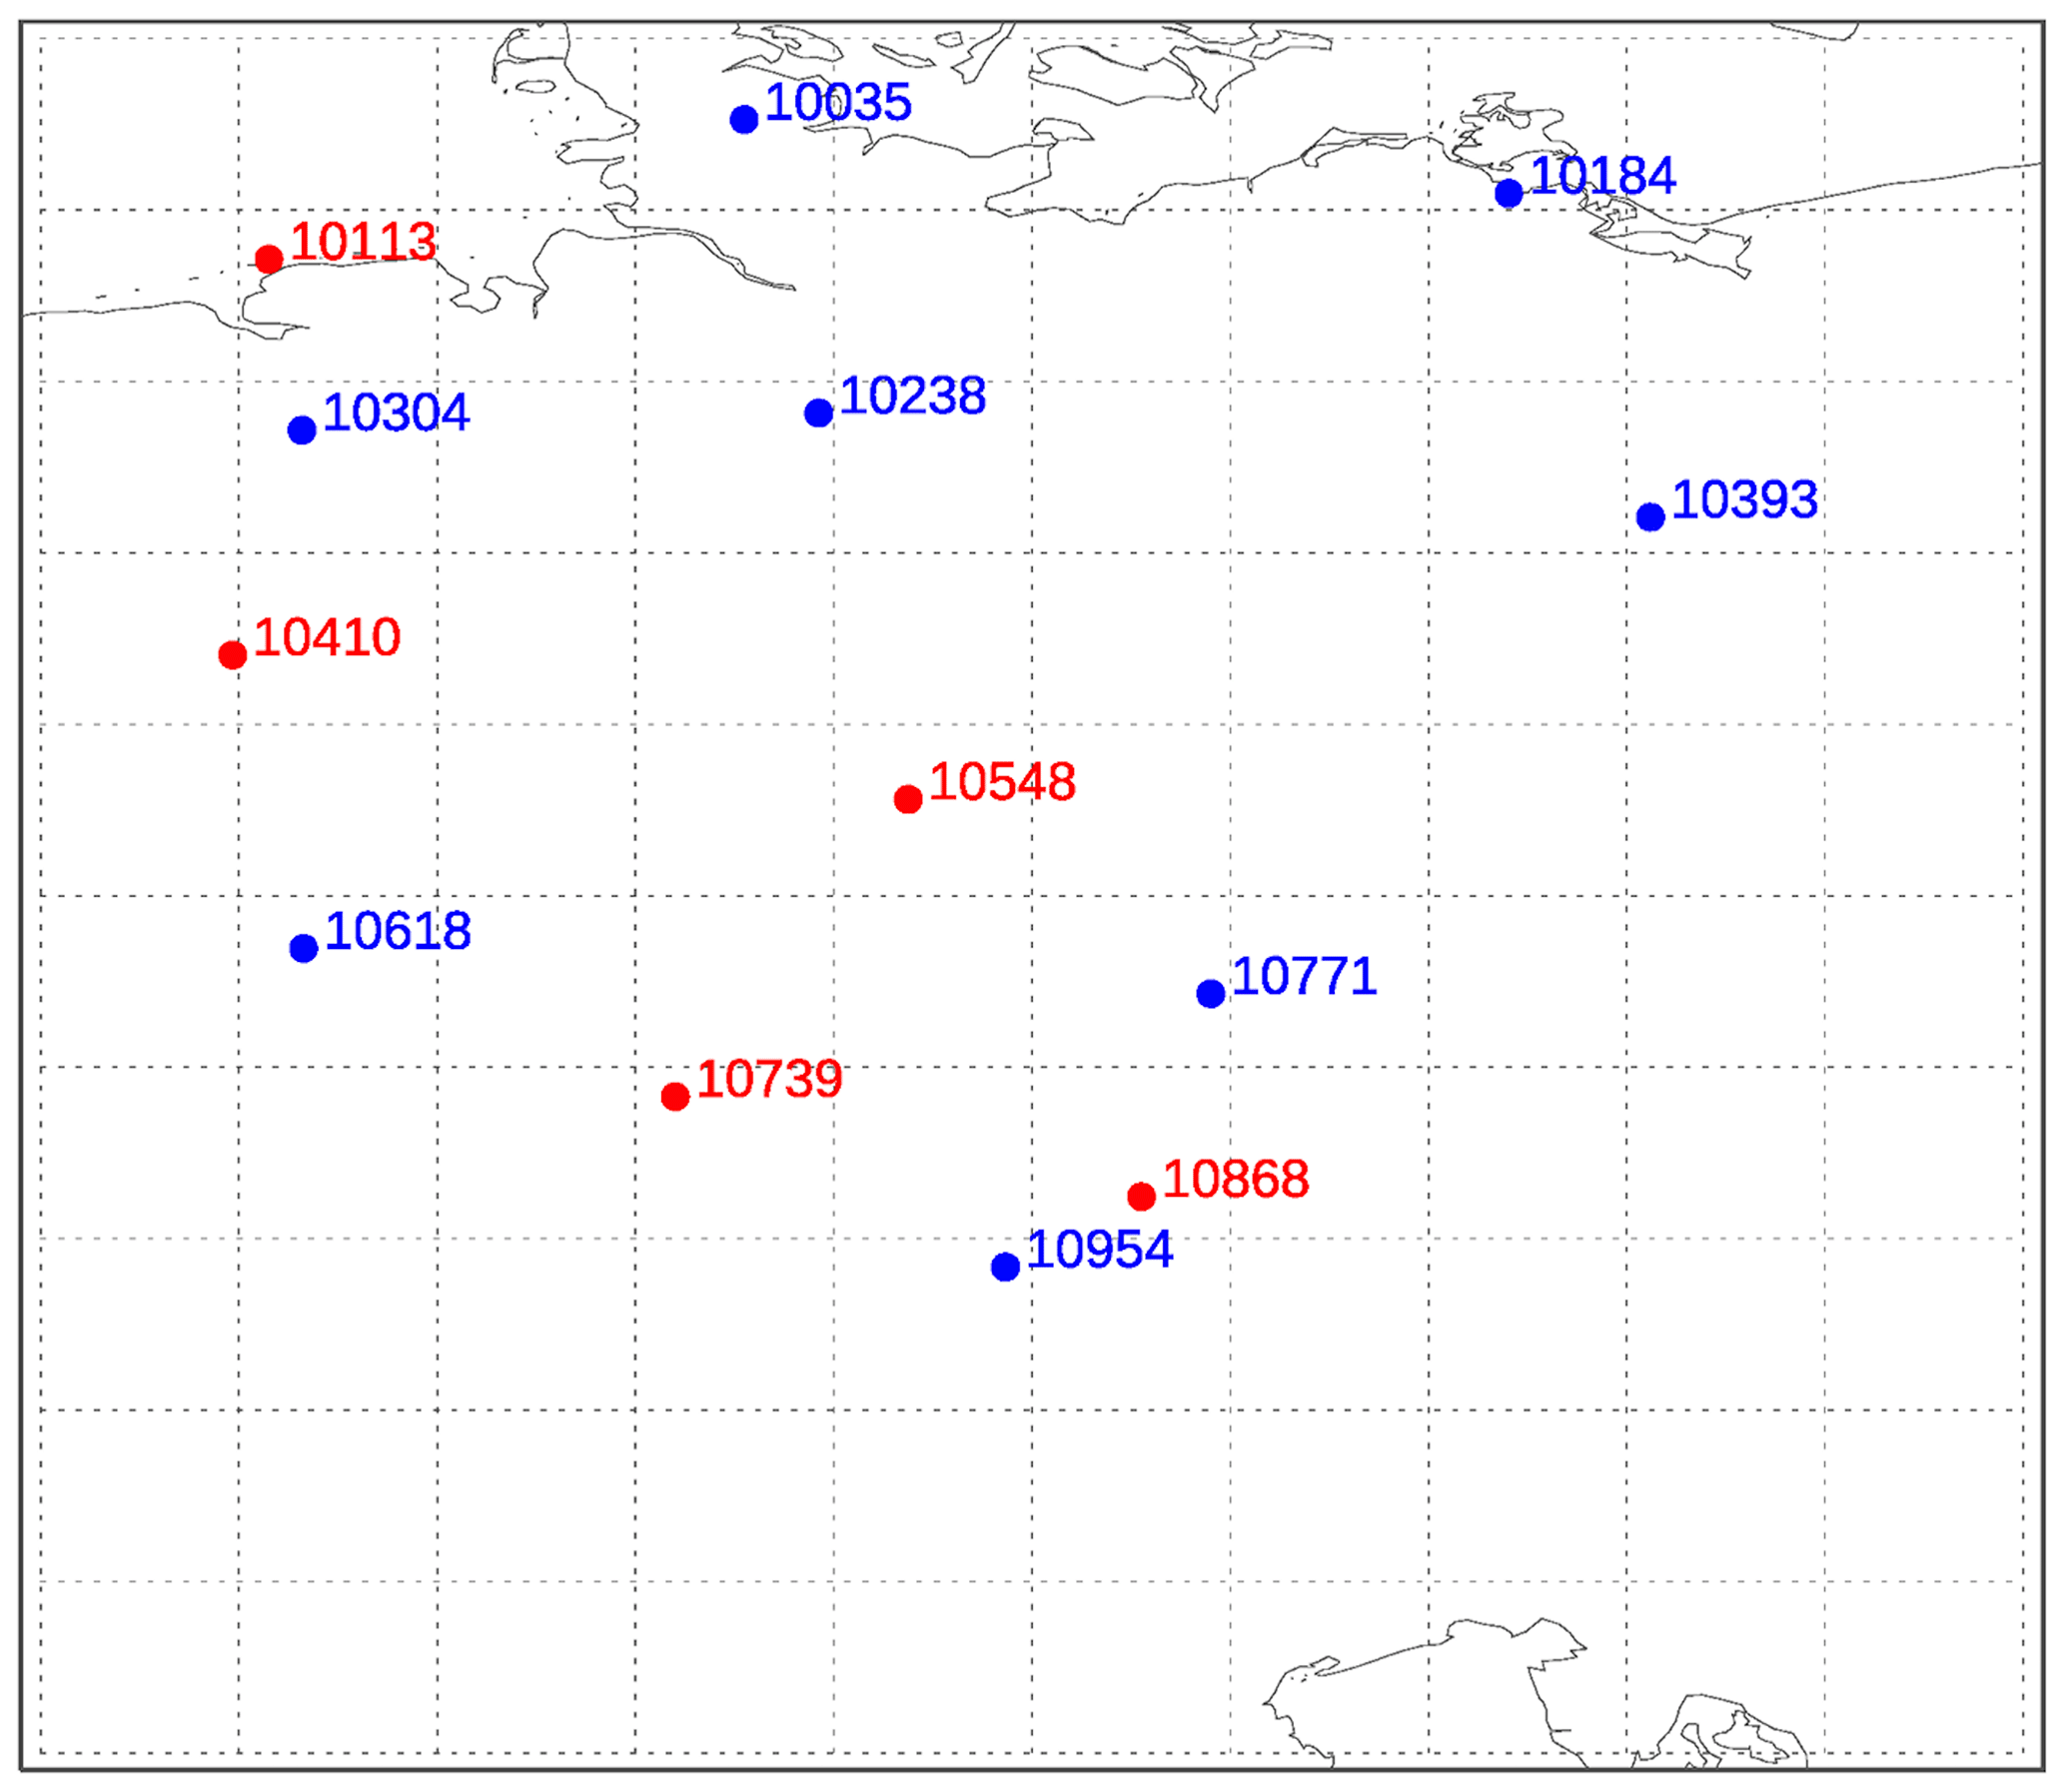
Figure 20The main German radiosonde sites (two training/test sites not shown) and station identifiers: blue indicates manned stations (8); red indicates Autosondes (5), as in early 2019 and for several years before that.
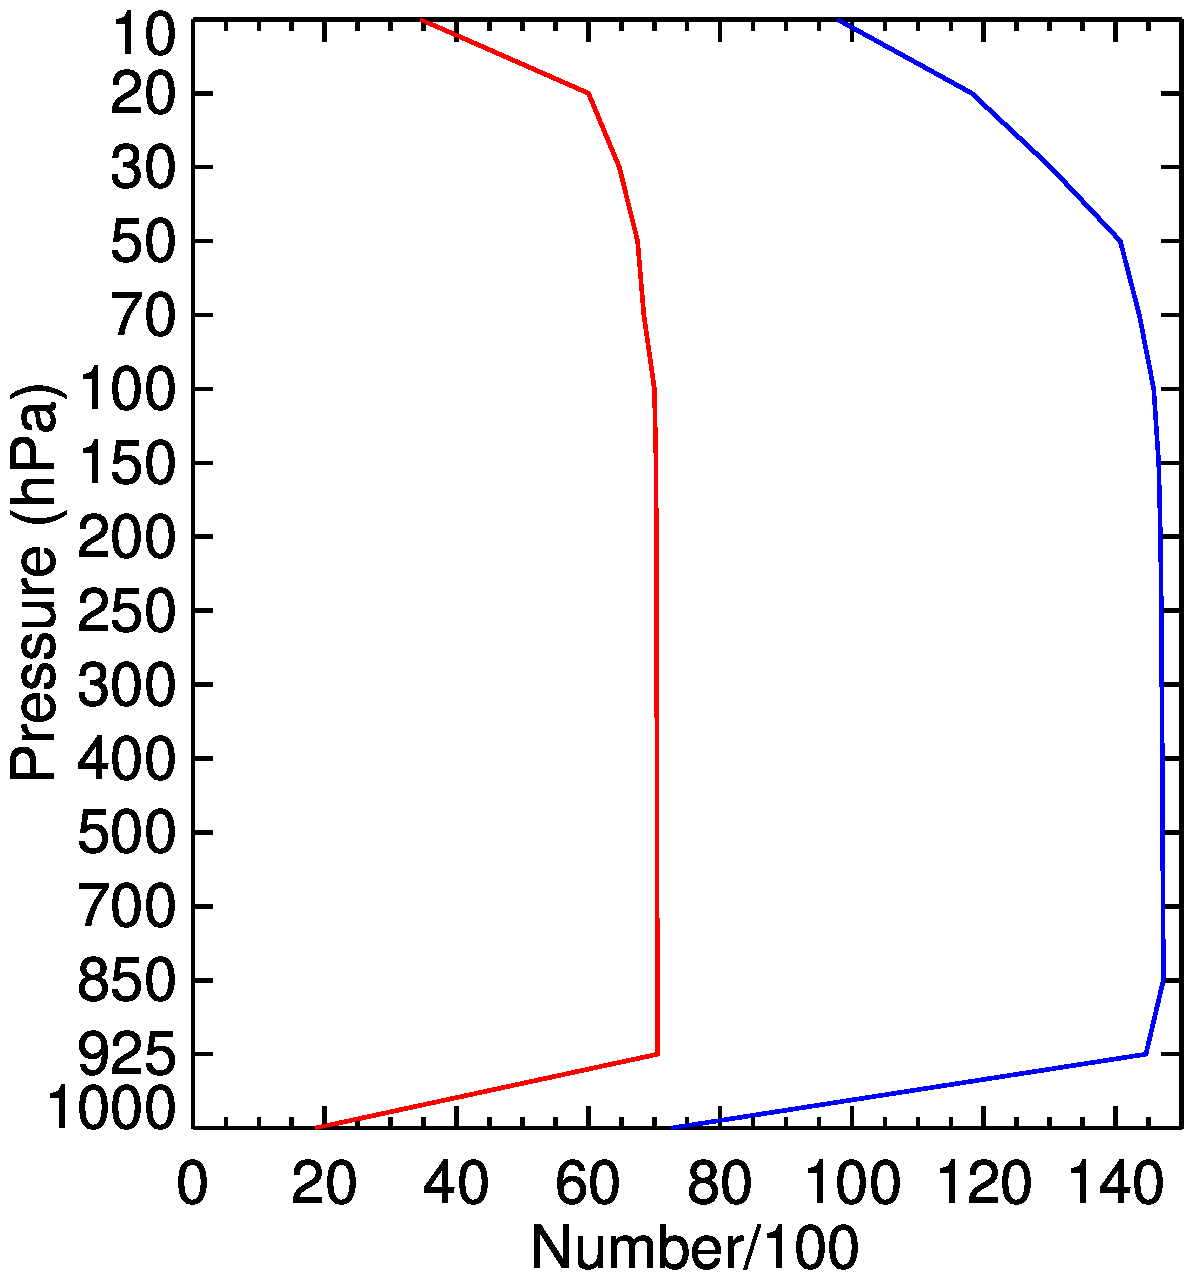
Figure 21The number of temperature reports (hundreds) at standard levels (hPa) from German stations using Vaisala RS92 radiosondes (June 2017–2019): blue indicates manned stations; red indicates Autosondes. The numbers for other variables are very similar. There are fewer reports at 1000 hPa, and to some extent at 925 hPa, because these levels can be below the launch site. The decrease at upper levels is due to balloon burst.
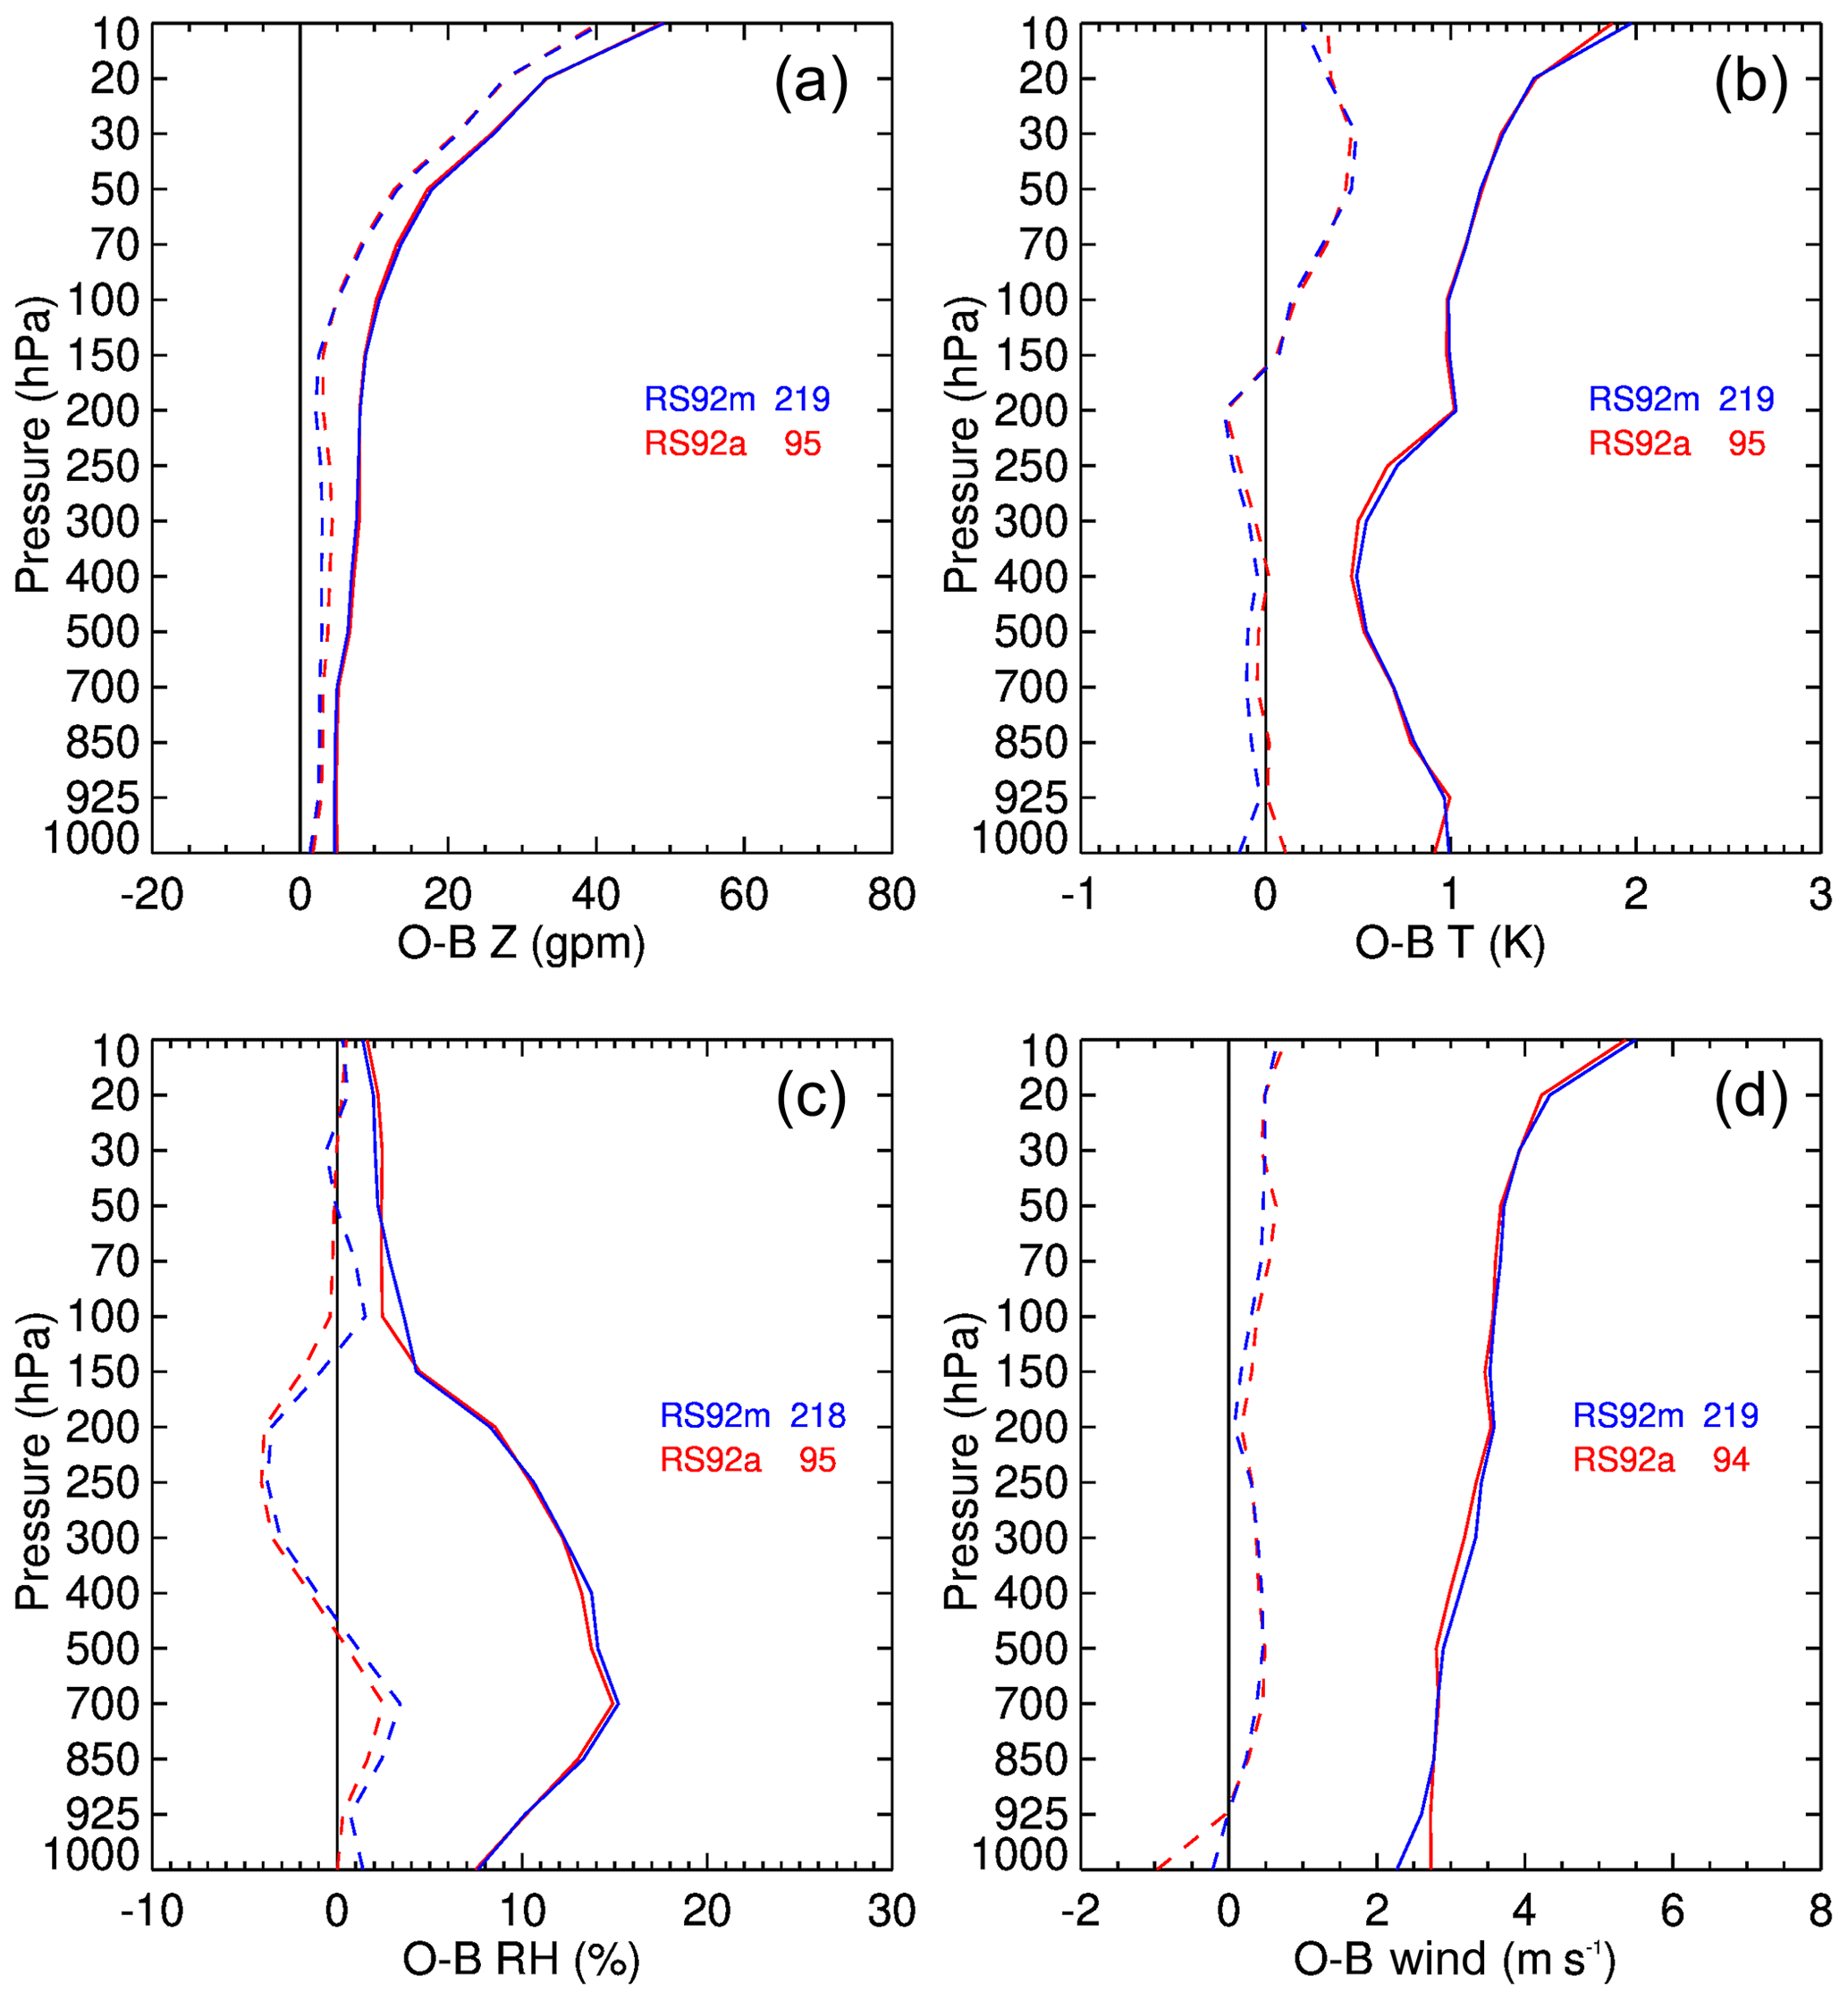
Figure 22Mean (dashed) and rms (solid) O–B statistics for German RS92 ascents (2015–2017): blue indicates manned stations; red indicates ARL. Results for geopotential height (a), temperature (b), relative humidity (c) and wind (mean wind speed and rms vector wind; d). The key gives the radiosonde code (RS92m for manual or RS92a for ARL) and the number of reports in hundreds.
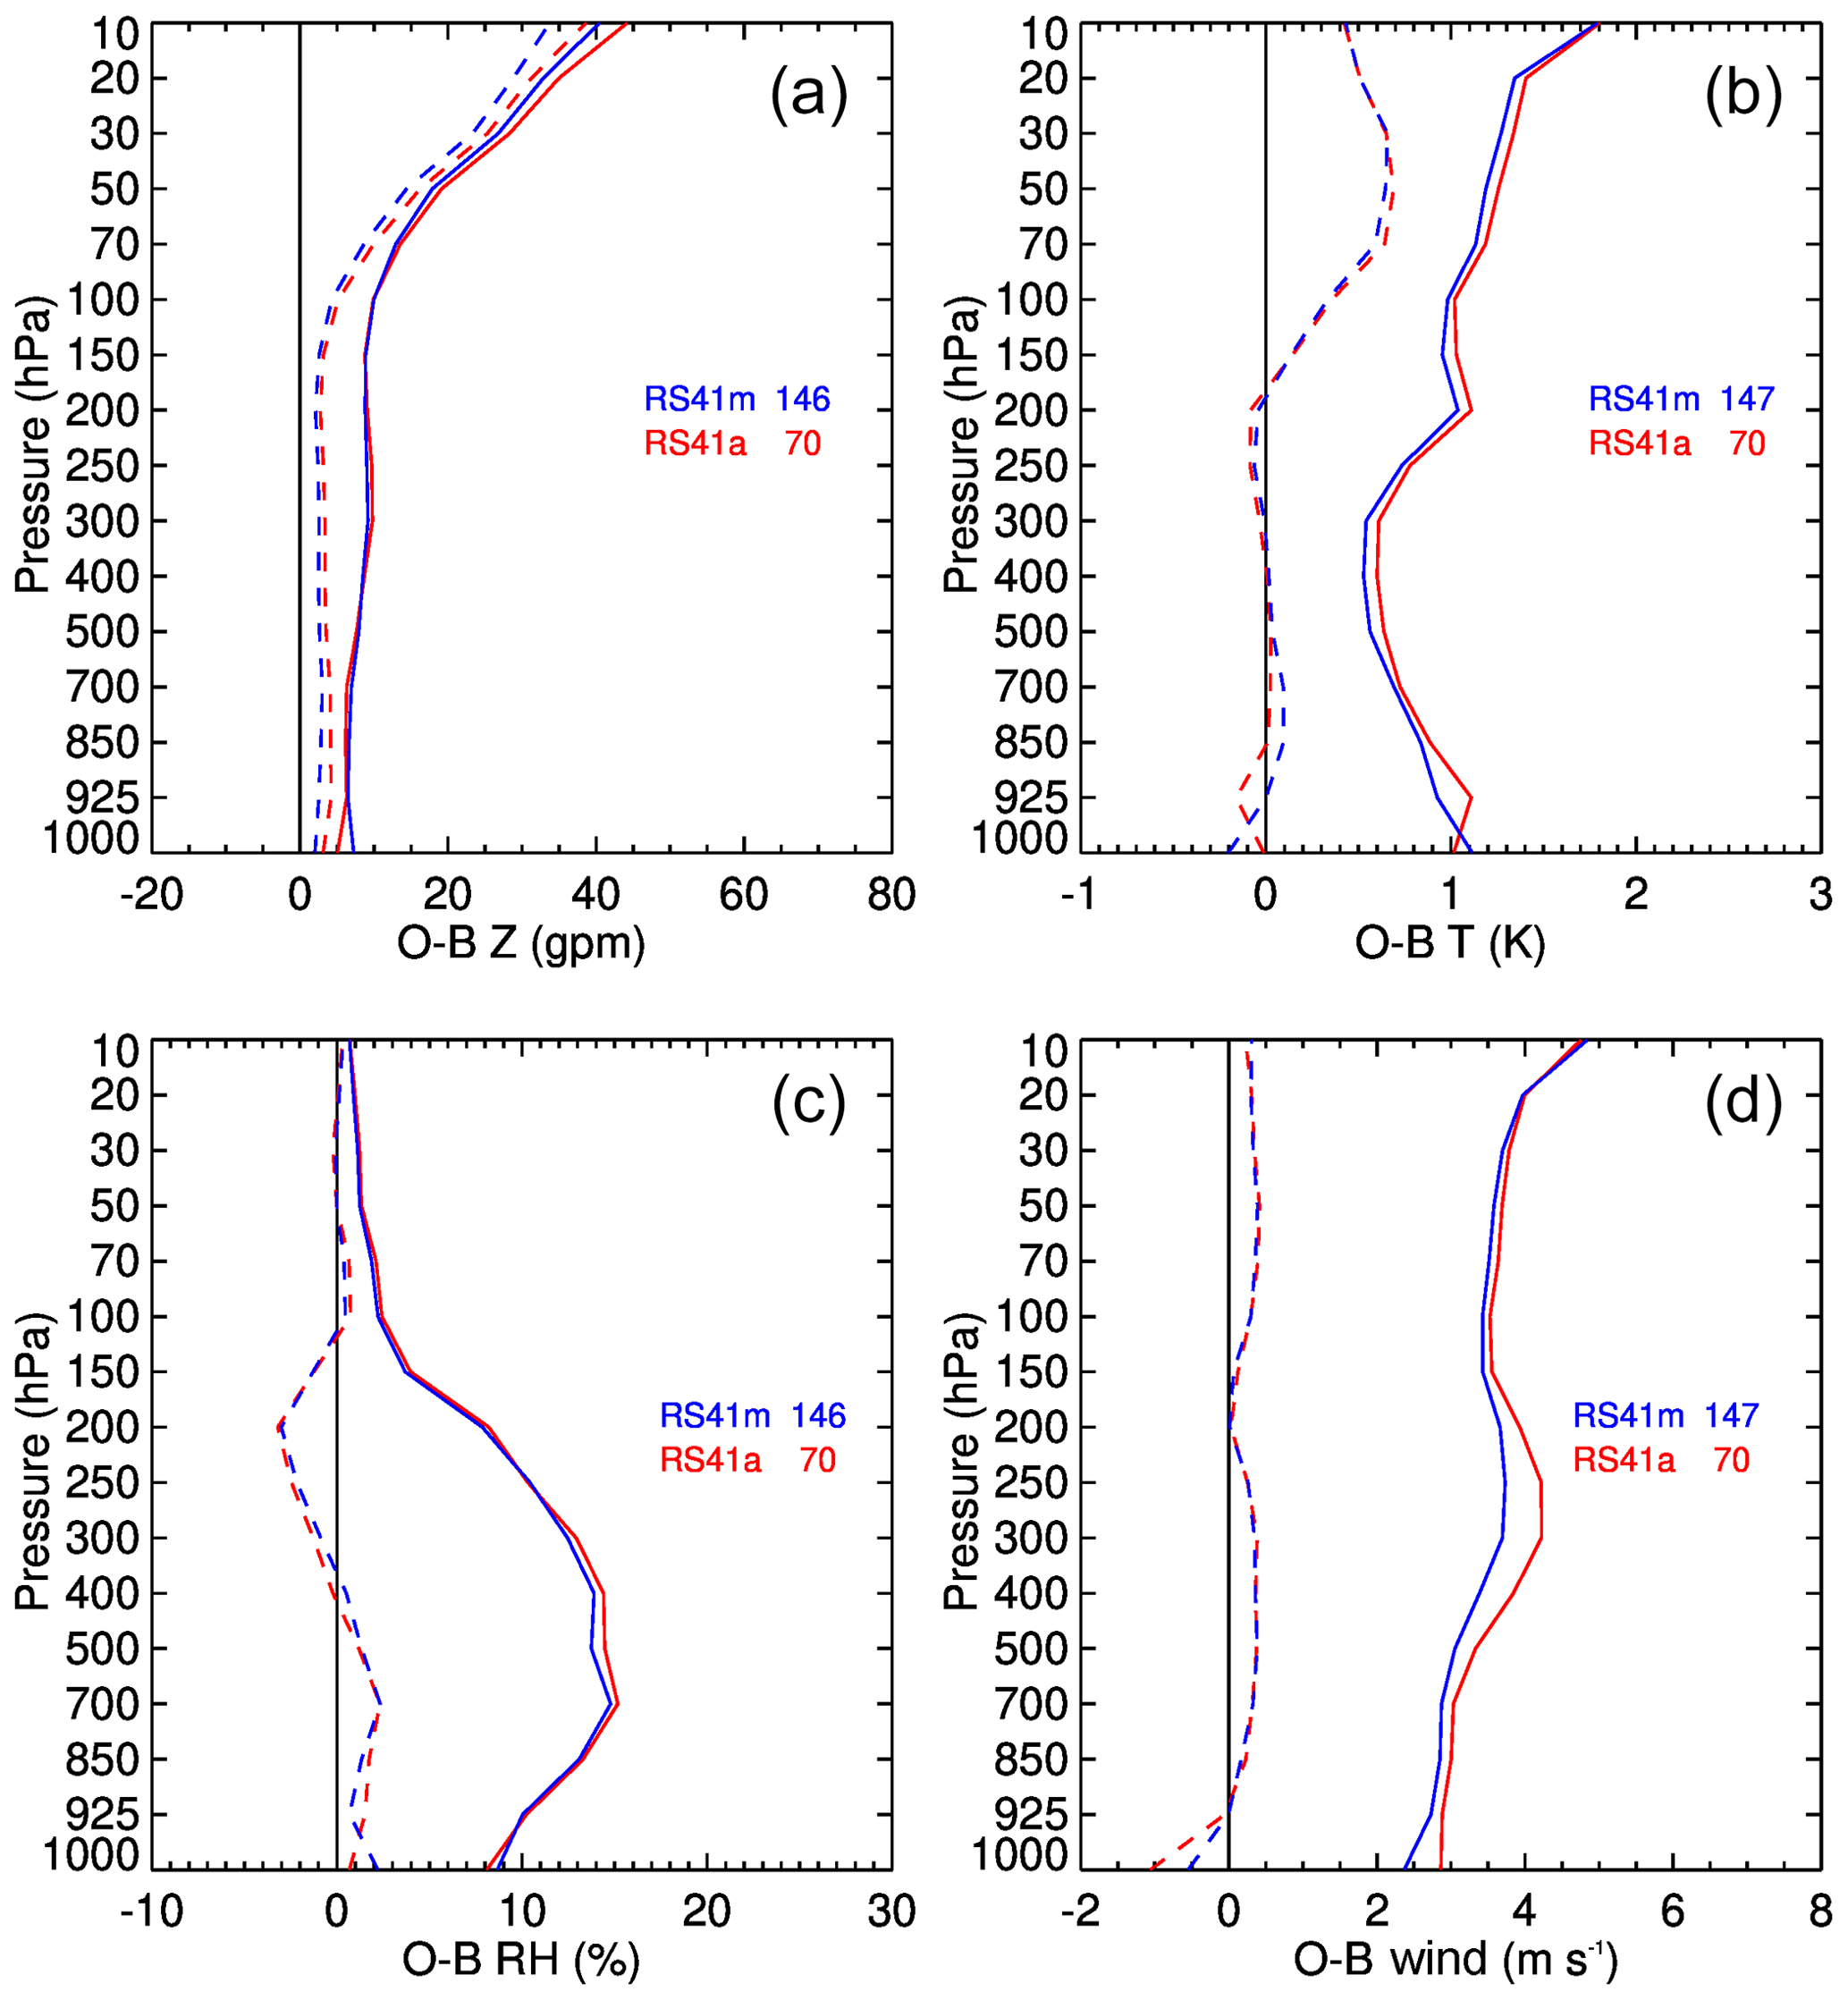
Figure 23As Fig. 22 but for RS41 reports (2017–June 2019). For some months, all stations were reported as type 23 (123 in BUFR) so they had to be separated using the station identifiers.
In contrast and surprisingly, the RS41 results (Fig. 23) show rather larger rms(O–B) differences for ARL stations – especially for temperature and wind. Qualitatively similar results for RS41 are found for subsets of the period considered, confirming the robustness of the results. The reasons for the larger ARL rms differences in Fig. 23 are not clear yet; one possibility is linked to the accuracy of the reported pressure values. Pressure is measured by the RS92. For RS41-SG, the pressure is calculated starting from a surface pressure measurement, but the German stations use RS41-SGP with a pressure sensor. Discussions with Vaisala and DWD (the German weather service) have not so far revealed the cause.
In this paper, the existing automatic radiosonde launchers available on the market (Vaisala, Meteomodem and Meisei) are presented and a first comparative analysis of the performance, relative to the more prevalent practice of manual launches, for the two most mature systems at present (Vaisala and Meteomodem) has been reported. The analysis is limited to the data available from a few GRUAN-certified or candidate sites (Sodankylä, Payerne, Trappes, Potenza, Faa'a) and to the investigation of the O–B bias and rms using the ECMWF forecast model and the Vaisala ARLs and manual stations of the DWD. The data analysis allows us to infer the following principal conclusions:
-
From a technical point of view, the performance of ARL is fully similar or superior to that achieved with the traditional manual launches due to the capability of the automatic launchers to fully control several parameters during the different phases of the radiosonde preparation and balloon launch. This reduces launch-to-launch variability typical in manual launches.
-
Despite having some potential advantages, there are still some issues generating failure in the launches which can be improved according to the feedback provided by the GRUAN sites, operating mainly Vaisala ARLs, such as the not-infrequent failure of the power supply system or of the air-conditioning system, plenty of issues related to the balloon release in the vessel area, likely contributing to early balloon bursts, and to the management of the gas flow to fill the balloon, while the ready-to-launch sondes storage area appears to be the most efficient part of ARLs.
-
For both temperature and relative humidity, the GC correction has been investigated for the Vaisala ARL, finding a negative offset relative to manual launch procedures at different stations and considering different radiosonde types (RS92/RS41) and batches of a few tenths of degree and % RH, respectively. For the Meteomodem ARL at Trappes station, the difference between M10 temperature and humidity sensor and the Vaisala HMP110 housed in the ARL, used as a reference immediately prior to launch shows a few tenths of degree and % RH, respectively. These results need further investigation to understand the underlying reasons and whether manual or ARL operations are closer to the observed atmospheric profiles.
-
Systematic differences in the temperature profile for both Meteomodem and Vaisala are smaller than ±0.2 K up to 10 hPa; RH profile differences are smaller than 1 % RH for the Sodankylä Vaisala dataset up to 300 hPa, while it is constantly positive and smaller than 2 % for Faa'a station Meteomodem series. However, the restricted dataset available at Faa'a station means caution should be applied in generalizing these results as representative of all Meteomodem ARL.
-
O–B mean and rms statistics for German RS92 and RS41 are very similar between manned and ARL stations. The upper tropospheric humidity has minor systematic differences probably due to humidity time-lag and radiation corrections being introduced at different dates at different stations. The RS41 sondes shows larger rms(O–B) differences for ARL stations than RS92, in particular for temperature and wind. The accuracy of the reported pressure values might be a possible reason to explain this difference.
As mentioned at the beginning of Sect. 3, the factor limiting adoption of ARL radiosounding products within the GRUAN reference network is mainly related to the use of independent and traceable calibration standards like the SHC within the ARLs. At present, for the different ARLs, this is possible but only before the sonde loading in the ARL trays. GRUAN data processing (GDP) is currently applied to the ARL soundings performed by the GRUAN stations though the related measurement programmes cannot as yet be certified as GRUAN products. The present analysis has provided a substantive move forwards towards this aim by showing that performance is broadly comparable to manual launches.
In the last 5 years, several discussions within and outside the GRUAN community, involving also the manufactures, allowed to identify a few possibilities to meet the full traceability for the ARLs. Identified solutions to test are related to two main options:
-
use of a SHC (plus a reference thermometer, such as a PT100 sonde) immediately after the manufacturer GC and prior to loading the sondes;
-
use of reference thermometer and hygrometer within the ready-to-launch sondes storage area, as close as possible to the radiosonde sensors, with the optional use of a few additional thermometers and hygrometers within the storage area to monitor the uniformity of the temperature and relative humidity within the same area.
Both approaches have advantages and drawbacks. The first allows use of the SHC as a traceable calibration standard at or around 100 % relative humidity, depending on the solution used in the SHC. Nevertheless, the proposed two-stage procedure can be applied only in advance of the launch and tests are needed to confirm what was already shown in Sect. 4 at Sodankylä and Payerne stations; i.e. a sonde can be launched within a few days from its upload in the ARL without differing significantly from the SHC collected data.
The second approach can instead continuously monitor the radiosonde during the entire launch procedure in the storage area and before the sonde tray is moved out to the vessel area for launch, when temperature and RH within the storage area may rapidly change because of the incoming air from outside the vessel area. This approach cannot directly use traceable calibration standards but it must be based on the comparison with reference thermometers and hygrometers calibrated on a routine and certified basis. In addition, the sonde calibration cannot be monitored at 100 % RH because the air-conditioning system within the ARL keeps stable humidity conditions and cannot be modified to avoid an impact on the ARL operation efficiency.
For both the approaches above, a customized solution to collect the data and use them in the generation of a GDP must be found given the constraints of the ARL software, which does not allow extra calibration or comparison values to be collected or saved in the main radiosonde launch files.
It must be noted that at four JMA stations, not belonging to GRUAN, the Vaisala ARL is used adopting a modified setup of the AS15 system including an additional GC based on reference instruments developed by Vaisala for temperature and humidity, i.e. Vaisala HMP155 with HMT333, lodged in a custom-made chamber. When loading the radiosonde, the JMA-specified GC for temperature and humidity is also performed, in line with JMA's rule for upper-air observations, specifying that the PTU radiosonde sensors should be compared to reference sensors before launch only to confirm that the difference is within a pre-defined threshold, while reference values are not used for any correction of the measured profiles. The JMA additional GC is not a traceable calibration standard and does not allow to perform the 0 % RH and 100 % RH ground calibration immediately before the launch. Instead, it can be made when the radiosonde is uploaded in the ARL using a method to save the measured comparison values.
More details on the JMA-specified ground check for temperature and humidity are available at https://www.vaisala.com/sites/default/files/documents/RI41-Datasheet-B211322EN.pdf (last access: 3 July 2020).
The compilation of the table of ARL systems in Appendix A (also the plot in Fig. 1) brought home that it is not easy for users to know which stations are using ARLs. We recommend that information on automated launchers (type, start date, end date if appropriate) should be included in the OSCAR/Surface catalogue.
Other issues which must be considered and solved to provide a GDP from ARLs are related to the need to supply the manufacturer software with an accurate local pressure measurement and its height at the launch time. Delays between the actual and the reported launch times from the software are another issue which is under investigation by the GRUAN community.
The GRUAN community is discussing a strategy to achieve the full traceability for the ARL products and to ascertain if any of the approaches described above can be tested intensively at one or more sites; unfortunately, many of the GRUAN sites are also operational stations from the Met services and from other research institutions and are not readily available for testing. The next step will be to identify which sites can perform specific tests on the ARL traceability and to collect as much metadata as possible from all the GRUAN sites to report, in following publications, extensive statistics validating the results presented in this paper.
Table A1ARL stations shown in Fig. 1. For each station, the WMO ID, which is also part of the WIGOS code (https://oscar.wmo.int/surface, last access: 3 July 2020), the latitude, the longitude, the country and the period of installation are reported. For the approximate installation date (year or year-month), the metadata have been collected from different sources (IGRA, ECMWF, manufacturers, personal communication from scientists and instrument operators). If the last column is empty, no clear information on the installation period at that station is available. For Vaisala systems, the “radiosonde type” in the reports should indicate if an ARL is being used, but it has been found that this is not always coded correctly. For Meteomodem and Meisei systems, there is no way for the current code formats to indicate that an ARL has been used. The list is ordered according to the WMO ID.
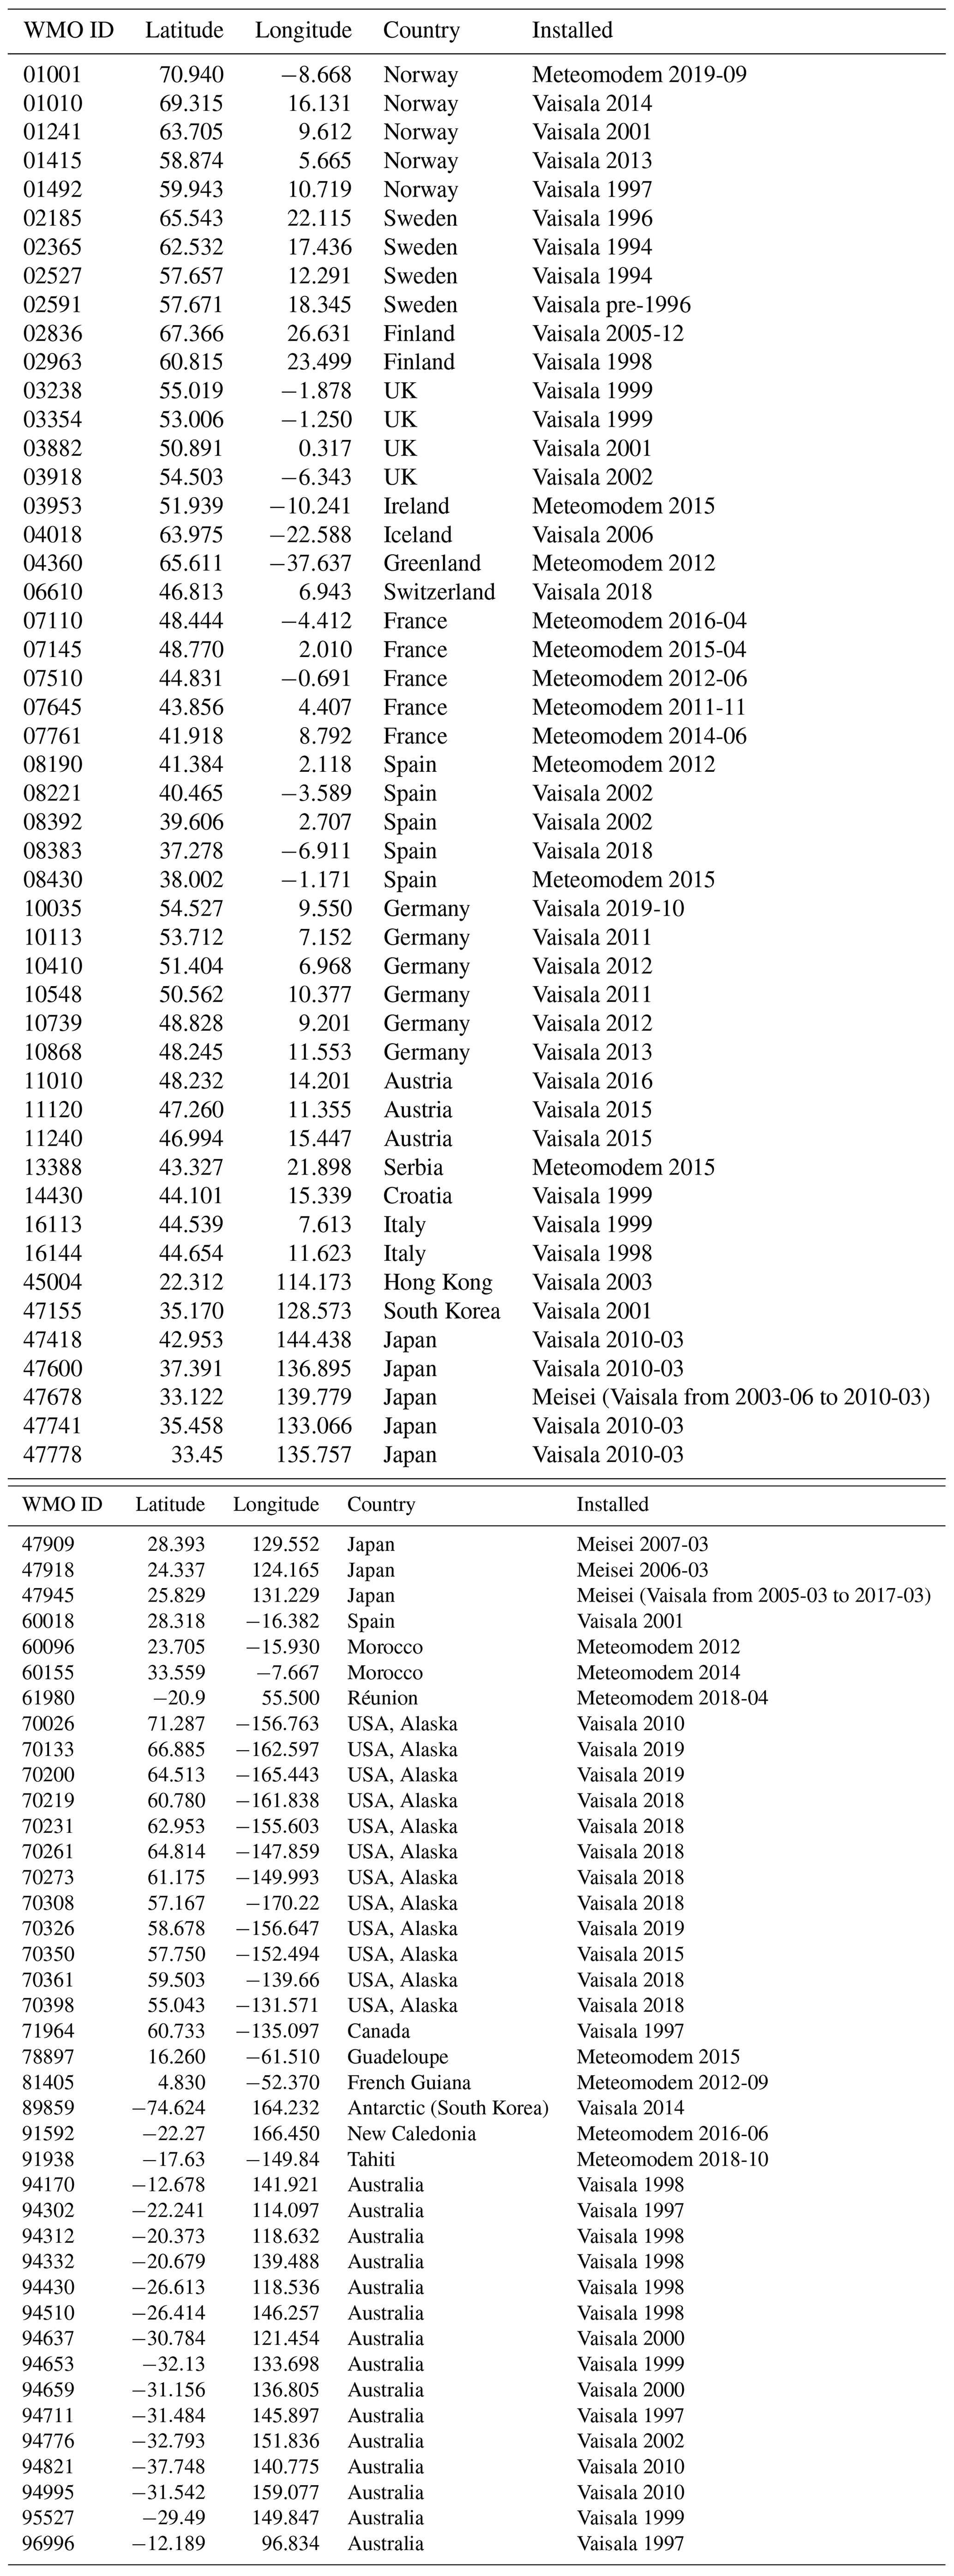
Table A2Additional ARL systems not transmitting data through the WIS in 2019 or used only for tests and short campaign (not shown in Fig. 1). The ARL from 08160 was relocated to 08383.

The Faa'a data discussed in the paper are available at ftp://ftp.lmd.polytechnique.fr/jcdupont/data_m10_gruan_faa (last access: 1 March 2020) and can be used or cited under https://doi.org/10.14768/20181213001.1 (Cloché, 2018).
FM with the help of RK and MF worked on the paper conceptualization and on the methodology. FM, RK, J-CD, BI, GR, MH, MI, SH and PWT have been involved in the formal analysis. All the co-authors contributed to the writing of original draft, review and editing.
The authors declare that they have no conflict of interest.
Much useful information has been provided by the three manufacturers: Vaisala, Meteomodem and Meisei. Information on which stations use Meteomodem ARLs was provided by Adrien Ferreira of Meteomodem in April 2019. Hannu Jauhiainen of Vaisala provided a list of stations using their Autosonde, including several which were not known from the WIS reports. Météo-France and several other national meteorological services have also provided information.
This paper was edited by Karin Kreher and reviewed by two anonymous referees.
Bodeker, G. E., Bojinski, S., Cimini, D., Dirksen, R., Haeffelin, M., Hannigan, J. W., Hurst, D. F., Leblanc, T., Madonna, F., Maturilli, M., Mikalsen, A., Philipona, R., Reale, T., Seidel, D., Tan, D., Thorne, P., Vömel, H., and Wang, J.: Reference upper-air observations for climate: From concept to reality, B. Am. Meteorol. Soc., 97, 123–135, https://doi.org/10.1175/BAMS-D-14-00072.1, 2016.
Carminati, F., Migliorini, S., Ingleby, B., Bell, W., Lawrence, H., Newman, S., Hocking, J., and Smith, A.: Using reference radiosondes to characterise NWP model uncertainty for improved satellite calibration and validation, Atmos. Meas. Tech., 12, 83–106, https://doi.org/10.5194/amt-12-83-2019, 2019.
Cloché, S.: Meteo-France high resolution radiosounding data from Faa'a station (French Polynesia), IPSL catalog, https://doi.org/10.14768/20181213001.1, 2018.
Dirksen, R. J., Sommer, M., Immler, F. J., Hurst, D. F., Kivi, R., and Vömel, H.: Reference quality upper-air measurements: GRUAN data processing for the Vaisala RS92 radiosonde, Atmos. Meas. Tech., 7, 4463–4490, https://doi.org/10.5194/amt-7-4463-2014, 2014.
Glisson, T. H.: Introduction to Circuit Analysis and Design, Springer Science & Business Media, Ed. 1, XV, 768, https://doi.org/10.1007/978-90-481-9443-8, 2011.
Haimberger, L., Tavolato, C., and Sperka, S.: Homogenization of the Global Radiosonde Temperature Dataset through Combined Comparison with Reanalysis Background Series and Neighboring Stations, J. Climate, 25, 8108–8131, https://doi.org/10.1175/JCLI-D-11-00668.1, 2012.
Ho, S.-P., Peng, L., and Vömel, H.: Characterization of the long-term radiosonde temperature biases in the upper troposphere and lower stratosphere using COSMIC and Metop-A/GRAS data from 2006 to 2014, Atmos. Chem. Phys., 17, 4493–4511, https://doi.org/10.5194/acp-17-4493-2017, 2017.
Ingleby, B.: An assessment of different radiosonde types 2015/2016, ECMWF Tech. Memo. 807, 69 pp., available at: https://www.ecmwf.int/sites/default/files/elibrary/2017/17551-assessment-different-radiosonde-types-20152016.pdf (last access: 3 July 2020), 2017.
Ingleby, B. and Edwards, D.: Changes to radiosonde reports and their processing for numerical weather prediction, Atmos. Sci. Lett., 16, 44–49, https://doi.org/10.1002/asl2.518, 2014
Kobayashi, E., Hoshino, S., Iwabuchi, M., Sugidachi, T., Shimizu, K., and Fujiwara, M.: Comparison of the GRUAN data products for Meisei RS-11G and Vaisala RS92-SGP radiosondes at Tateno (36.06° N, 140.13° E), Japan, Atmos. Meas. Tech., 12, 3039–3065, https://doi.org/10.5194/amt-12-3039-2019, 2019.
Kostamo, P.: Advanced automation for upper-air stations, WMO Instruments and Observing Methods Report No. 49 (TECO-92), 104–107, available at: https://library.wmo.int/index.php?lvl=notice_display&id=11254#.Xeo3GS2h01I (last access: 3 July 2020), 1992
Lehtinen, R., Tikkanen, T., Räsänen, J., and Turunen, M.: Factors contributing to RS41 GPS-based pressure and comparison with RS92 sensor-based pressure, WMO Technical Conference (TECO), St. Petersburg, Russia, available at: https://www.wmo.int/pages/prog/www/IMOP/publications/IOM-116_TECO-2014/Session 1/P1_28_Lehtinen_RS41PressCompRS92.pdf (last access: 3 July 2020), 2014.
Lilja, A., Franssila, J., Hautaniemi, P., and Lehmuskero, M.: Review of the History and Future of Automatic Upper Air Soundings, TECO-2018, Amsterdam, the Netherlands, 8–11 October 2018.
Madonna, F., Amodeo, A., Boselli, A., Cornacchia, C., Cuomo, V., D'Amico, G., Giunta, A., Mona, L., and Pappalardo, G.: CIAO: the CNR-IMAA advanced observatory for atmospheric research, Atmos. Meas. Tech., 4, 1191–1208, https://doi.org/10.5194/amt-4-1191-2011, 2011.
Madonna, F., Rosoldi, M., Güldner, J., Haefele, A., Kivi, R., Cadeddu, M. P., Sisterson, D., and Pappalardo, G.: Quantifying the value of redundant measurements at GCOS Reference Upper-Air Network sites, Atmos. Meas. Tech., 7, 3813–3823, https://doi.org/10.5194/amt-7-3813-2014, 2014.
Nash, J., Oakley, T., Vömel, H., and Wei, L.: WMO Intercomparison of High Quality Radiosonde Systems Yangjiang, China, 12 July–3 August 2010, WMO Instruments and Observing Methods Report No. 107, 2011.
Sheppard, W. W. and Soule, C. C.: Practical navigation, World Technical Institute, Jersey City, 1922.
Sherwood, S. C., Meyer, C. L., Allen, R. J., and Titchner, H. A.: Robust tropospheric warming revealed by iterative homogenized radiosonde data, J. Climate, 21, 5336–5352, https://doi.org/10.1175/2008JCLI2320.1, 2008.
Sofieva, V. F., Dalaudier, F., Kivi, R., and Kyrö, E.: On the variability of temperature profiles in the stratosphere: Implications for validation, Geophys. Res. Lett., 35, L23808, https://doi.org/10.1029/2008GL035539, 2008.
Thorne, P. W., Parker, D. E., Tett, S. F. B., Jones, P. D., McCarthy, M., Coleman, H., and Brohan, P.: Revisiting radiosonde upper-air temperatures from 1958 to 2002, J. Geophys. Res., 110, D18105, https://doi.org/10.1029/2004JD005753, 2005.
Vaisala: Vaisala Radiosonde RS41 Measurement Performance White Paper, Ref. B211356EN-A ©Vaisala, 2013.
Vaisala: Comparison of Vaisala Radiosondes RS41 and RS92 White Paper. Ref. B211317EN – B ©Vaisala, Helsinki, Finland, 2014. Vaisala: Vaisala Radiosonde RS41 White Paper – Ground Check Device R141. Ref. B211539EN-A ©Vaisala, 2015.
According to MeteoSwiss, a “successful flight” is a launch with a balloon burst at a pressure lower than 100 hPa, with no telemetry lost or sensor failure.
According to Météo-France, a “successful flight” is a launch with a balloon burst at a pressure lower than 150 hPa, with no telemetry lost or sensor failure.
- Abstract
- Introduction
- Description of existing ARL systems
- Technical performance
- Stability, ground calibration
- Vertical velocity and balloon burst
- Automatic launchers performance evaluated using the ECMWF forecast model
- Summary and discussion
- Appendix A: Table of ARL systems operating around the world
- Data availability
- Author contributions
- Competing interests
- Acknowledgements
- Review statement
- References