the Creative Commons Attribution 4.0 License.
the Creative Commons Attribution 4.0 License.
 | 21 Jul 2020
Atmospheric ammonia (NH3) over the Paris megacity: 9 years of total column observations from ground-based infrared remote sensing
Benoît Tournadre
Pascale Chelin
Mokhtar Ray
Juan Cuesta
Rebecca D. Kutzner
Xavier Landsheere
Audrey Fortems-Cheiney
Jean-Marie Flaud
Frank Hase
Thomas Blumenstock
Johannes Orphal
Camille Viatte
Claude Camy-Peyret
In this paper, we present the first multiyear time series of atmospheric ammonia (NH3) ground-based measurements in the Paris region (Créteil, 48.79∘ N, 2.44∘ E, France) retrieved with the midresolution “Observations of the Atmosphere by Solar absorption Infrared Spectroscopy” (OASIS) ground-based Fourier transform infrared solar observatory. Located in an urban region, OASIS has previously been used for monitoring air quality (tropospheric ozone and carbon monoxide) thanks to its specific column sensitivity across the whole troposphere down to the atmospheric boundary layer. A total of 4920 measurements of atmospheric total columns of ammonia have been obtained from 2009 to 2017, with uncertainties ranging from 20 % to 35 %, and have been compared with NH3 concentrations derived from the Infrared Atmospheric Sounding Interferometer (IASI). OASIS ground-based measurements show significant interannual and seasonal variabilities of atmospheric ammonia. NH3 total columns over the Paris megacity (12 million people) vary seasonally by 2 orders of magnitude from approximately 0.1×10¹⁶ molec. cm−2 in winter to 10×1016 molec. cm−2 for spring peaks, probably due to springtime spreading of fertilizers on surrounding croplands.
- Article
(1990 KB) - Full-text XML
- BibTeX
- EndNote


Ammonia (NH3) is a reactive and volatile chemical species present in the atmosphere as a trace gas. As the main alkaline atmospheric molecule (Behera et al., 2013), it plays a major role in the formation of secondary fine particulate matter of ammonium salts and thus in particle air pollution (Seinfeld and Pandis, 2006). NH3 is heterogeneously distributed in the atmosphere, depending on local and regional sources (including agriculture, urban traffic, particle-to-gas conversion, sewage, and industrial activities) and sinks (wet and dry deposition and gas-to-particle conversion; Galloway et al., 2003; Behera et al., 2013; Chang et al., 2016; Van Damme et al., 2018).
In France, atmospheric ammonia (NH3) is mainly emitted (more than 94 %) by agricultural activities (Ringuet et al., 2016; Genermont et al., 2018) via livestock waste and urine, manure spreading, and the use of synthetic nitrogen fertilizers. Other minor sources exist, including the combustion of biomass and fossil fuels and industrial activity. The source related to motor traffic has increased significantly in recent years due to the increasing use of catalytic (or noncatalytic) NOx reduction systems on light and heavy-duty vehicles. These devices use an injection of urea or ammonia and can give rise to NH3 emissions (Chang et al., 2016). The urban area corresponding to the Paris city and its suburbs is the second-largest megacity in Europe, with more than 12 million people. Ammonia emissions in the Paris region reached nearly 11 kt in 2014 of which 93 % is attributed to agricultural activities, with a negligible contribution from livestock (DRIEE, 2017). The Paris megacity is located in the administrative region Île-de-France, which includes 49 % of agricultural land, with particularly strong activity in the eastern half of the territory. Île-de-France agriculture is mainly dedicated to crops, in particular cereals (with a dominance of wheat), which occupy 67 % of the cultivated area. This sector is described as an agricultural belt, with 59 % in the Seine-et-Marne department. Urban traffic in the Paris region is estimated to be responsible for 5 % of ammonia emissions and industry for 2 % (DRIEE, 2017).
Atmospheric ammonia concentrations vary to a large degree during the day, since the atmospheric lifetime of NH3 is rather short, on the order of hours to a few days (Galloway et al., 2003; Lutsch et al., 2016; Van Damme et al., 2018; Dammers et al., 2019). Wet and dry depositions dominate the atmospheric sink of this inorganic compound. NH3 is also a gaseous precursor of fine particulate matter (particles of an aerodynamic diameter less than 2.5 µm – PM2.5). As the main alkaline molecule in the atmosphere, it reacts rapidly with sulfuric (H2SO4) and nitric (HNO3) acids in the atmosphere to form ammonium sulfate or ammonium nitrate (Behera et al., 2013). These ammonium salts may represent more than 50 % of the PM2.5 fraction during peaks of spring air pollution (Bressi et al., 2013; Petit et al., 2014, 2015), namely periods of fertilizer application by agricultural activities. Concentrations of ammonium nitrate in Île-de-France in the 2009–2010 period can be simulated by the CHIMERE chemistry transport model with only a small bias (< 20 %; Petetin et al., 2016). However, comparisons of the precursors' concentrations measured during the FRANCIPOL (Baudic et al., 2016) campaign (May 2010 to February 2011) show an overestimation of nitric acid and an underestimation of ammonia by the CHIMERE model (Petetin et al., 2016). These differences appear to stem in part from the uncertainties associated with ammonia emissions.
Monitoring the atmospheric concentrations of NH3 is essential for improving air quality models and for quantifying the fluxes characterizing the nitrogen cycle. The measurement of atmospheric ammonia concentrations is not subject to regulation (in the sense of the European directives) and is really challenging for several reasons: (i) high temporal and spatial dependence of ambient concentration levels (Allen et al. al., 1988; Sutton et al., 1998); (ii) rapid conversion of NH3 between gaseous, particulate, and aqueous phases (Warneck, 1988); and (iii) measurement artefacts due to NH3 reactivity with sampling and measurement systems – conversion, adsorption on surfaces, etc. (Sutton et al., 2008; Von Bobrutzki et al., 2010). This is why there are only a few measuring stations for which atmospheric ammonia concentrations are measured with a time resolution finer than a month. Most of the existing observation networks are designed to evaluate long-term trends and are therefore based on sampling techniques accumulating during several weeks (passive samplers, denuders, or liquid bubblers) and offline analysis in the laboratory.
Other in situ methods enable us to estimate surface atmospheric concentrations of NH3 (e.g., by cavity ring-down spectroscopy (CRDS) techniques; Sun et al., 2015) or even in the lower atmosphere (airborne campaigns; Leen et al., 2013; Shephard et al., 2015; Sun et al., 2015). Hourly measurements are very rare at present, are mainly available during intensive short-term measurement campaigns, and are limited to a small number of measurement sites of several established networks such as the European Monitoring and Evaluation Programme (EMEP; EMEP/EEA, 2016) used by the French Centre interprofessionnel technique d'études de la pollution atmosphérique (CITEPA; CITEPA, 2015) or the Dutch National Air Quality Monitoring Network (Landelijk Meetnet Luchtkwaliteit – LML) from the Netherlands (Volten et al., 2012).
An innovative and very promising alternative for monitoring atmospheric ammonia is infrared remote sensing. This approach exploits the ammonia absorption spectral signatures of thermal infrared radiation measured by Fourier transform infrared spectroscopy (FTIR) instruments. These methods are free from sampling problems and are noticeably less influenced by local sources than in situ observations. A few observations were first reported from space using an advanced infrared (IR) sounder (Beer et al., 2008) which enables retrievals of atmospheric NH3. Current or very recent space-based NH3 data are available from the Infrared Atmospheric Sounding Interferometer sounder (IASI, on board the Metop satellites; Clerbaux et al., 2009; Clarisse et al., 2009), Tropospheric Emission Spectrometer (TES, embedded on the Aura satellite; Shephard et al., 2015; TES's mission ended in January 2018 after nearly a 14-year career of discovery), Cross-track Infrared Sounder (CrIS, embedded in the Suomi National Polar-orbiting Partnership satellite; Shephard and Cady-Pereira, 2015; Dammers et al., 2017), Thermal And Near-infrared Sensor for Carbon Observation–Fourier Transform Spectrometer (TANSO–FTS) on the Greenhouse Gases Observing Satellite (GOSAT; Someya et al., 2020), and Atmospheric InfraRed Sounder (AIRS; Warner et al., 2016; here, a grating spectroscopy instrument installed on the Aqua satellite). These measurements allow for the retrieval of total columns of NH3 as vertically integrated concentrations between the Earth's surface and the top of the atmosphere. In particular, for the IASI instrument observation processing algorithms have evolved considerably in recent years (Van Damme et al., 2014, 2015; Whitburn et al., 2016) into a data product that we hereafter call NH3–IASI. These currently available satellite data also feature indicators of the quality of the space-based observations and retrievals and have been validated (Dammers et al., 2016). Even though the observations from space remain complex due to the weak absorption of this species, the availability of a global distribution of NH3 twice a day (e.g., over Europe) is an important achievement.
In addition, the high-resolution FTIR solar stations of the Network for the Detection of Atmospheric Composition Change (NDACC) measure, from the ground, the total ammonia columns but are also capable of providing information on its vertical distribution (Dammers et al., 2015). Spectroscopic measurements from the ground have been used for decades in the validation of satellite measurements for different trace species (Griesfeller et al., 2006; Strong et al., 2008; Buchholz et al., 2017) and also recently for ammonia (Dammers et al., 2016, 2017). The diurnal variability is observed directly from the ground, with a temporal resolution of a few minutes. The high temporal resolution of these ground-based solar measurements can help us to understand the nature of ammonia sources, especially in urban environments where there is a crucial lack of observations of this short-lived and spatially highly disperse pollutant. A better knowledge of NH3 emissions and associated atmospheric processes thus requires extended observational networks able to assess high temporal and spatial variabilities of the atmospheric content of ammonia. Such networks still need to be built – especially in France where NH3 measurements are extremely rare.
In this study, we present the first multiyear time series of atmospheric NH3 ground-based measurements over a European megacity (Paris) retrieved with the moderate-cost midresolution Observations of the Atmosphere by Solar absorption Infrared Spectroscopy (OASIS) FTIR solar observatory located in the Paris suburbs (Créteil, France). Given its good sensitivity to surface pollutant concentrations, it has been used previously for monitoring urban pollution (tropospheric ozone and carbon monoxide; Viatte et al., 2011; Chelin et al., 2014). A total of 4920 measurements of NH3 total columns have been obtained between 2009 and 2017, with uncertainties ranging from 20 % to 35 % (1 standard deviation), using the retrieval code PROFFIT (Hase et al., 2004) adapted for our medium spectral resolution and based on the NDACC stations' methodology. The data are compared with NH3 concentrations from IASI measurements for verifying consistency with the NH3–OASIS retrievals.
The paper is organized as follows. First, we present in detail the NH3–OASIS data by describing the site, the retrieval strategy, and uncertainties (Sect. 2). The atmospheric NH3 time series focusing on seasonal variability is provided in Sect. 3.1, while Sect. 3.2 gives a comparison between the NH3–OASIS columns and the NH3–IASI satellite data. Finally, in Sect. 3.3, a few tests are performed using an NH3 profile-retrieval scheme applied to OASIS spectra with a Tikhonov–Phillips regularization to show the vertical sensitivity to NH3 provided by OASIS measurements.
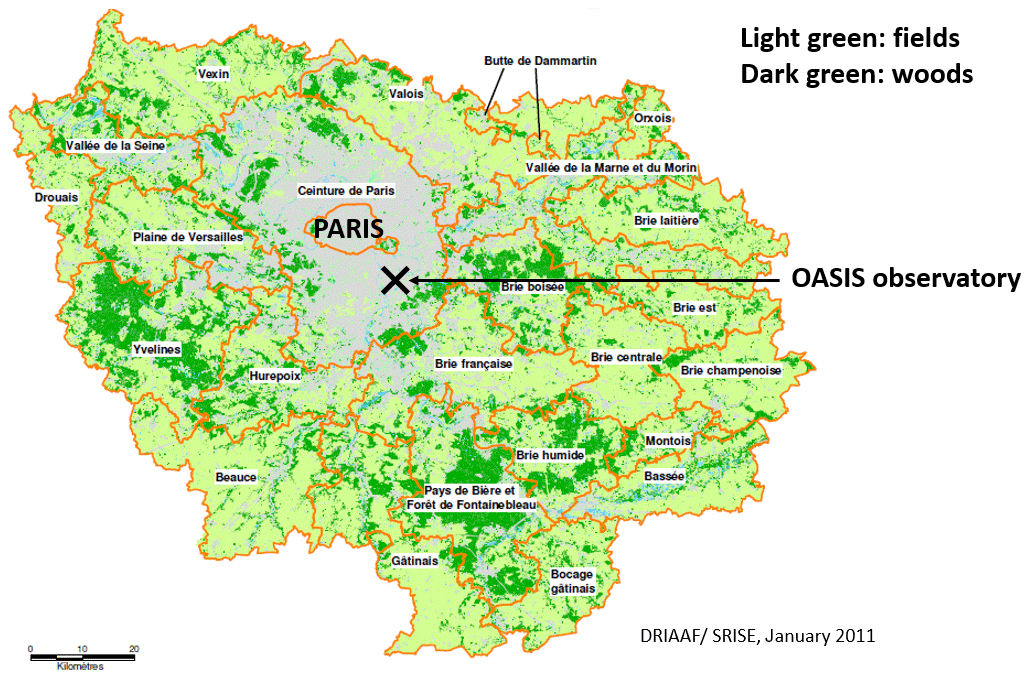
Figure 1Location of the FTIR–OASIS observatory providing NH3 total columns in the Paris region (France). One can see that the Paris megacity is very urbanized close to the city center and is surrounded by a large rural belt with 49 % agriculture surfaces (Direction Régionale de l'Agriculture et de la Forêt, DRIAAF, http://driaaf.ile-de-france.agriculture.gouv.fr/IMG/pdf/RA_R11_cle4ce9b1.pdf, last access: 11 July 2020).
2.1 The FTIR–OASIS observatory
The “Observations of the Atmosphere by Solar Infrared Spectroscopy” (OASIS; 48.79∘ N, 2.44∘ E; 56 m above sea level) observatory is located in the Paris region, which is a European megacity (12 million inhabitants) surrounded by a large rural region and relatively flat terrain (Fig. 1). It has routinely performed solar absorption measurements since 2009 under clear-sky conditions, using a midspectral resolution spectrometer (Bruker Vertex 80, with a spectral resolution of 0.06 cm−1 and maximum optical path difference of 12 cm). In order to carry out air quality research, we have assessed the capability of a medium-resolution FTIR solar absorption spectrometer to monitor pollutants, especially O3 and CO. We have demonstrated that OASIS is able to continuously monitor tropospheric ozone over Créteil with good accuracy and sufficient information content (Viatte et al., 2011). A 5-year analysis of ozone in the lower troposphere and carbon monoxide has also been made (Chelin et al., 2014). Given the moderate cost and compactness of OASIS, deployment of analogous systems nearby or in large megacities might be useful in support of satellite and air quality studies in other regions of the world.
The observatory comprises an automatized cupola (Sirius 3.5 “School Model” observatory, 3.25 m high and 3.5 m in diameter) in which the upper part (a dome equipped with a mobile aperture) rotates to track the Sun. The alt-azimuthal solar tracker in OASIS is the A547N model manufactured by Bruker Optics, using bare, gold-coated mirrors which are less sensitive to corrosion and pollution than the original Al mirrors. Infrared solar absorption spectra are nominally recorded on a deuterated triglycine sulfate (DTGS) detector using a potassium bromide (KBr) beam splitter, in order to cover the spectral region from 700 to 11 000 cm−1 (0.9 to 14.3 µm) without any optical filter, so that column abundances of many different atmospheric trace gases can be retrieved simultaneously.
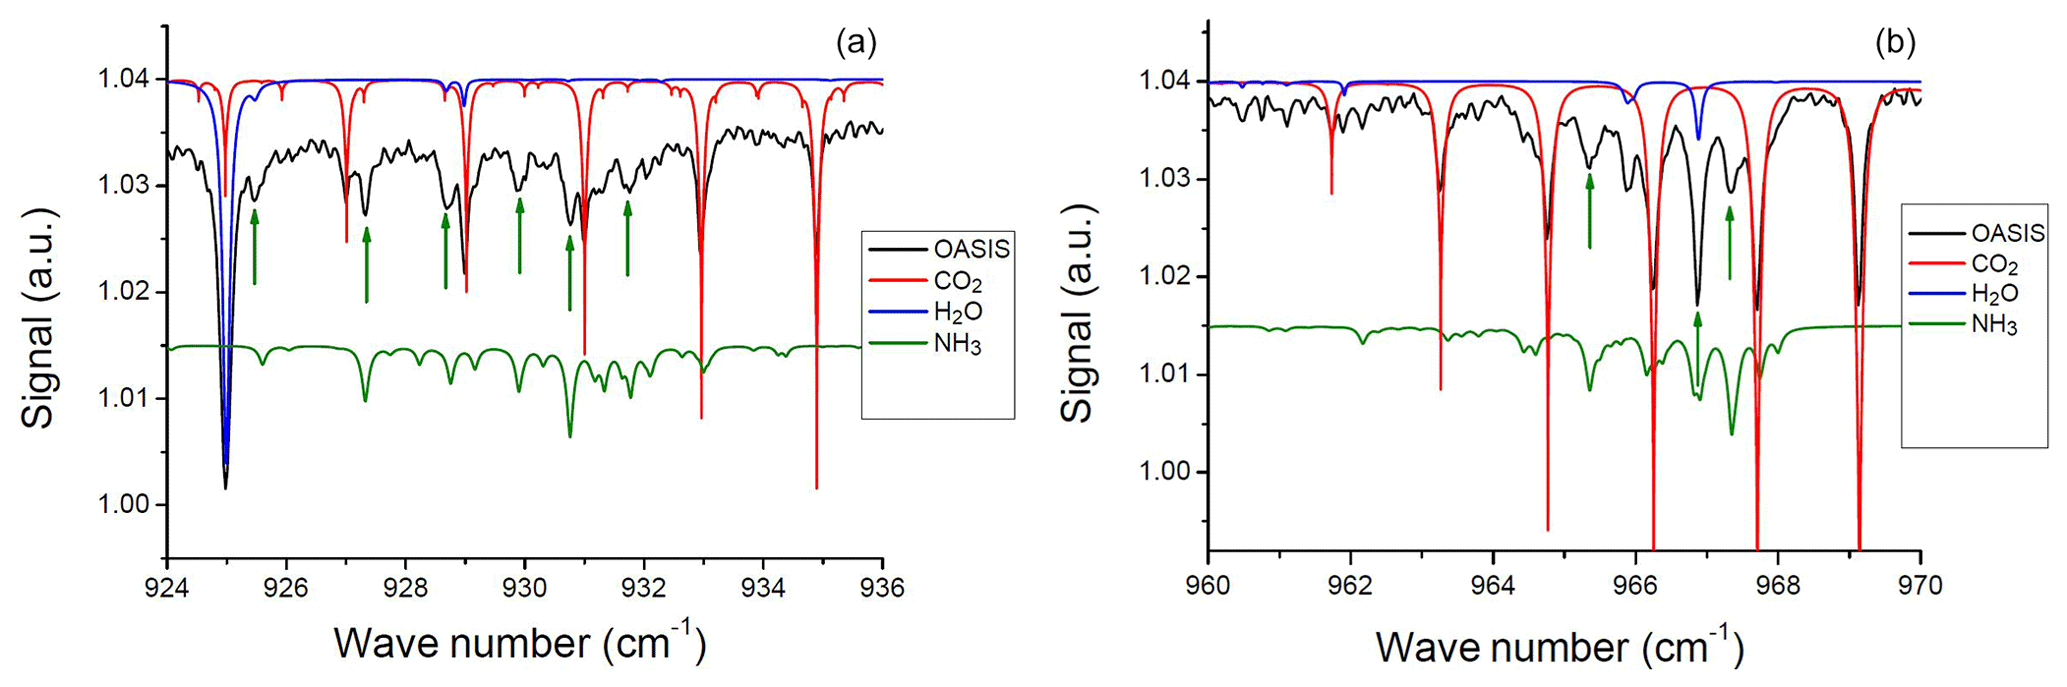
Figure 2Measured spectrum for both spectral windows obtained with the Bruker Vertex 80 at Créteil on 21 March 2012, with individual contributions of the main absorbing species represented from the atlas by Meier et al. (2004) in the first (a) and second (b) spectral windows. Green arrows point out the strong ammonia signatures.
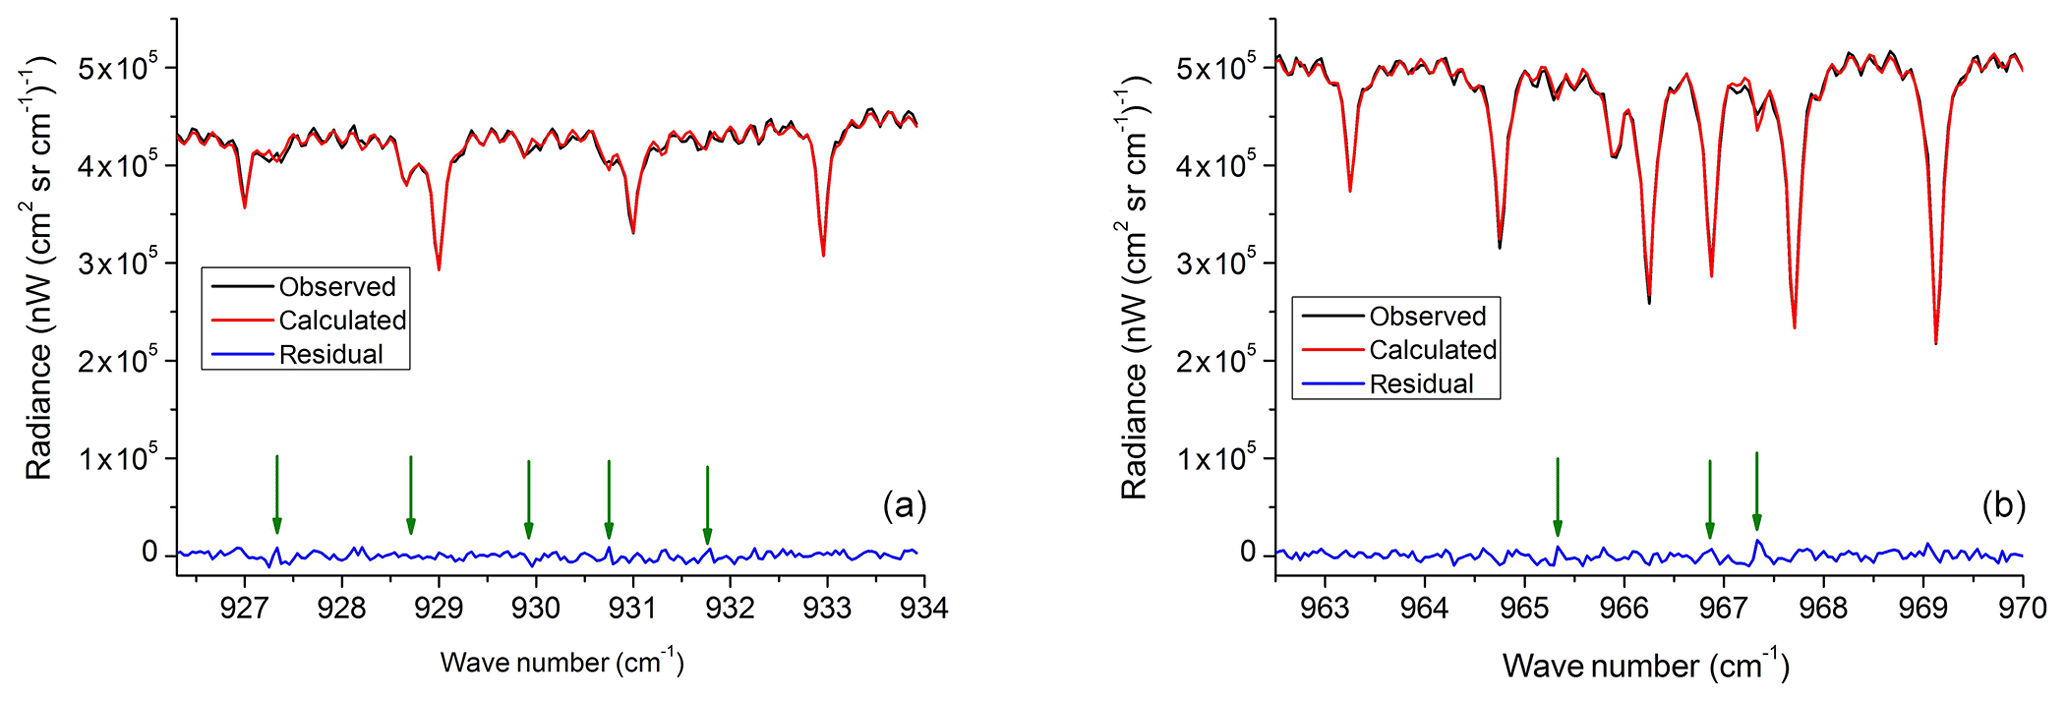
Figure 3Observed (black line) and calculated spectrum (red line) in radiance unit (nW(cm2 sr cm−1)−1) for both spectral windows measured with the Bruker Vertex 80 in Créteil on 21 March 2012, with the fitting residuals (blue line). Green arrows indicate locations of the strong ammonia features in the residual.
2.2 Ground-based NH3 retrievals
The ammonia spectral signatures used in this study are observed in the 10.6 µm spectral region and belong to the ν2 vibrational band (Dhib et al., 2007). To achieve a sufficiently high signal-to-noise ratio, each spectrum is produced by coadding 30 scans at the highest spectral resolution, resulting in one interferogram recorded over a period of approximately 10 min. Each coadded interferogram is Fourier transformed to obtain a spectrum without further numerical apodization (i.e., unapodized/boxcar apodization). Carbonyl sulfide (OCS) cell measurements are regularly performed to verify the alignment of the instrument (Chelin et al., 2014). Ammonia absorption lines from the ν2 vibrational band are also used for satellite-based estimates (Clarisse et al., 2009; Whitburn et al., 2016) and in the first retrievals of ammonia from high-resolution ground-based NDACC–FTIR stations (Dammers et al., 2015). Atmospheric transmission spectra from two spectral microwindows are used in this work (926.3–933.9 and 962.5–970 cm−1). They are slightly larger than those for the Bremen and Lauder NDACC stations (Dammers et al., 2015) because of the coarser spectral resolution of OASIS atmospheric spectra (0.06 cm−1). The choice of using large microwindows aims at retrieving NH3 abundances from the intensity contrast between the target gas signature and the surrounding continuum. We account for this last one by fitting an empirical background polynomial function with respect to wavelength with 4 degrees of freedom. The main interfering species in these windows are H2O, CO2, and O3 which are simultaneously retrieved together with NH3. Minor interfering species are HNO3, SF6, C2H4, and CFC-12. Figure 2 shows an example of a measured spectrum on 21 March 2012, with contributions of all main species, here calculated using the spectral atlas by Meier at al. (2004). The strong spectral signatures of ammonia (pointed out by green arrows in Figs. 2 and 3) are seen in both microwindows even when observed with the medium spectral resolution of the Vertex 80 spectrometer. Note that the NH3 concentrations of this day were particularly higher than on average, resulting in very strong NH3 features.
The retrievals are performed using the PROFFIT 9.6 code (Hase et al., 2004), widely used by the NDACC community to retrieve trace gases from high-resolution FTIR measurements, but adapted for the medium resolution. The software is capable of including spectral channeling in the fitting process and for the estimation of error budgets. Channeling is caused by the presence of optical resonators such as filters or windows in the measurement beam. Here, the ability of the code to handle spectral channeling in the fit is of relevance because we intend to quantify a minor absorber, and some channeling was detected in the measured spectra. For this purpose, the channeling frequency is determined from a Fourier transform of the residual of an auxiliary fit. A neighboring spectral section containing few absorption lines and being wide enough to encompass many cycles of the channeling signal is selected for this purpose. For the chosen frequency, a sine and a cosine amplitude are subsequently included in the fit of the NH3 target windows. Daily temperature and pressure profiles for the meteorological variables are obtained from the Goddard Space Flight Center National Centers for Environmental Prediction (NCEP). For radiative transfer calculations, profiles at 44 altitude levels, from 50 m up to 70 km, are set. Spectroscopic data are taken from the HITRAN 2008 database (which does not include ad hoc changes on line parameters added in HITRAN 2012; Rothman et al., 2009), except for CO2 lines from the HITRAN 2012 database (Rothman et al., 2013). As for satellite retrievals, and in consistency with the moderate spectral resolution of OASIS, we derive total columns of NH3 from each radiance spectrum. A scaling factor of a climatological vertical profile of NH3 is adjusted in order to minimize the difference between measured and simulated spectra, so the degree of freedom for the ammonia retrievals is 1. As the radiance values are rather small below 1000 cm−1, a quality criterion was introduced to select only spectra with a signal-to-noise ratio higher than 30, as measured between 960 and 990 cm−1, covering lines of a weak CO2 band. Figure 3 shows a measured spectrum (black line), the corresponding simulated spectrum (red line), and the difference between observation and simulation (blue line) in both microwindows. The fits are excellent, with a standard deviation of 2 % in both microwindows.
Table 1Random and systematic errors according to NH3 total columns. The total errors, combining the systematic and random errors, vary from 20 % up to 35 %. Note that 9.1×10¹⁶ molec. cm2 is the maximum ammonia column measured over Paris during the 2009–2017 period (which occurred exactly in March 2012).

2.3 A priori profiles and uncertainty
A climatological a priori profile of NH3 that assumes vertically homogenous NH3 concentrations (0.1 ppb) in the troposphere is taken from the Michelson Interferometer for Passive Atmospheric Sounding (MIPAS) project (Remedios et al., 2007). The a priori profiles of the interfering species (H2O, CO2, and O3) are taken from the Whole Atmosphere Community Climate Model (WACCM version 6; Chang et al., 2008). We consider the a posteriori errors calculated by PROFFIT 9.6. This calculation is based on the error estimation method by Rodgers (2000). For the uncertainty in the NH3 line parameters, we assume values as stated in the HITRAN 2008 database (Rothman et al., 2009). We assume a conservative value of 20 % for the integrated intensities and of 10 % for the pressure-broadening coefficients. The total errors are dominated by the combination of uncertainties in the spectroscopic parameters (including also the interfering species), the noise in the spectra, and the hypotheses on the retrieval (an a priori profile of NH3; forward model uncertainties). They are comparable to those estimated by Dammers et al. (2015) for a high-resolution ground-based station at Bremen (Germany). Complementary to these, according to a review paper on NH3 spectroscopic parameters (Down et al., 2013), the uncertainty of 20 % on line intensities is probably a worst-case estimate. Table 1 summarizes the results of total errors according to the different ammonia total columns, which vary from 20 % to 35 %. Another a priori was tested with higher concentrations of NH3 in the atmospheric boundary layer (with fixed concentrations up to 900 m, then decreasing NH3 concentrations until 4 km). Using this a priori profile reduces the mean squared difference between measured and simulated spectra by about 60 %. However, both retrievals with homogenous and sloped a priori profiles show rather similar results, with the same relative evolution in time and differences in absolute terms in the order of magnitude of the total column retrieval error (the use of the sloped a priori profile increases the retrieved NH3 abundances by 20 % with respect to those using a homogenous a priori).
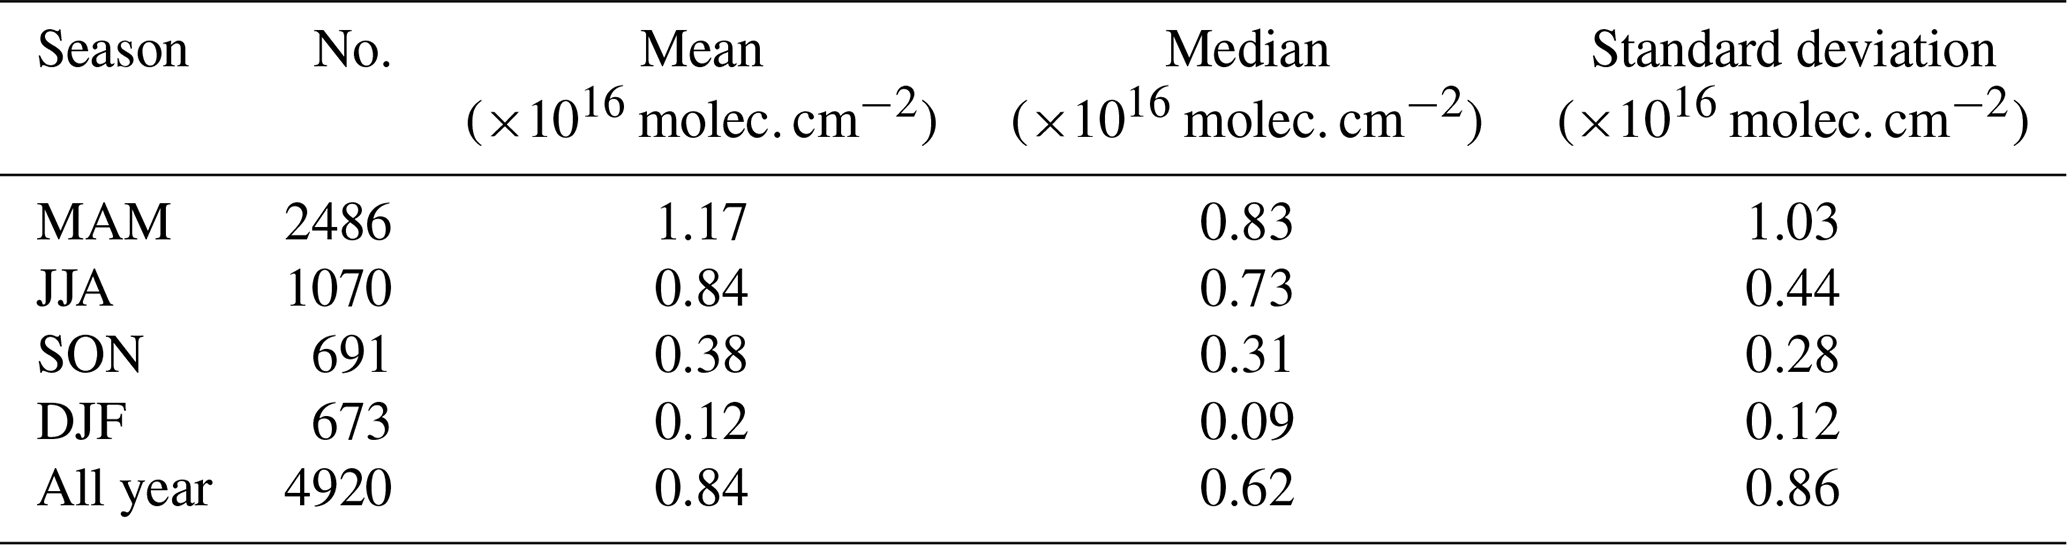
Table 2Statistics of the retrieved NH3–OASIS measurements depending on the season (MAM – March, April, and May; JJA – June, July, and August; SON – September, October, and November; DJF – December, January, and February) and for the whole calendar year. (No. refers to number of spectra, mean, median, and standard deviation.) Total columns are given in 1×10¹⁶ molec. cm−2.
3.1 Seasonal variability of NH3 ground-based data
Figure 4 shows the multiyear time series of NH3 total columns derived from FTIR ground-based OASIS measurements retrieved from all of the 4920 available spectra in 2009–2017 resulting from 234 measurement days. Table 2 gives a summary of statistics of the retrieved NH3 measurements versus the four seasons. Individual measurements with an overall mean total column of 0.84×10¹⁶ molec. NH3 cm−2 and a standard deviation of 0.86×10¹⁶ molec. NH3 cm−2 indicate a large variability in the observations. They highlight peak abundances in spring (March, April, and May), more precisely in March. The amplitude of the spring peaks varies throughout the years, with maxima in March 2012, reaching about 9×10¹⁶ molec. NH3 cm−2. The occurrence of the highest NH3 concentrations in March is particularly noticeable as all measurements are above 2×10¹⁶ molec. NH3 cm−2, which corresponds to the mean of data plus 1 standard deviation over the springtime period (March, April, and May). They are measured for this calendar month for almost every year (2011 – 2 d, 2012 – 11 d, 2014 – 6 d, 2015 – 4 d, 2016 – 4 d, and 2017 – 1 d). March 2012 is therefore a month that is particularly polluted in terms of atmospheric NH3. In addition to many days with more than 2×10¹⁶ molec. NH3 cm−2, a peak reaching the quadruple of that threshold on 21 March 2012 represents the maximum retrieved ammonia total column.
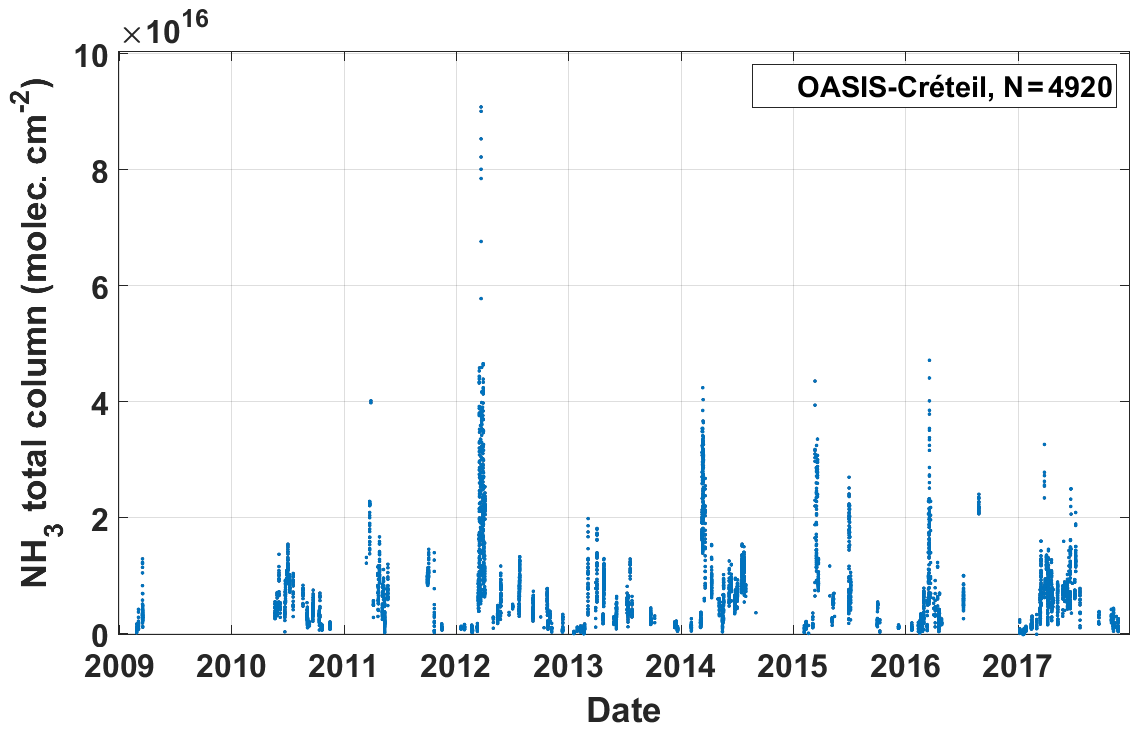
Figure 4First multiyear time series of NH3 total columns derived from OASIS measurements over Paris and retrieved from 4920 infrared atmospheric transmission spectra measured during 234 d between 2009 and 2017.
The seasonal variability is analyzed in Fig. 5 in terms of monthly averages over the 2009–2017 period. The mean NH3 column in March is 1.65×10¹⁶ molec. NH3 cm−2, which is 2 times higher than the overall mean total column over the 4920 measurements in 9 years.
As for many other regions, NH3 seasonality is well marked with high values that might be connected with the timing of agricultural manure spreading. As shown by both approaches of Ramanantenasoa et al. (2018) for 2005–2006, mineral fertilizers are mainly used in the Île-de-France region because they are major arable crop (especially cereals) farming areas. They account for 59 % of NH3 emissions according to the CADASTRE_NH3 framework based on the process-based Volt'Air model (Garcia et al., 2011, 2012). These fertilizers are mostly spread during springtime. In Bremen, NH3 atmospheric total columns have a similar seasonal cycle with highest levels during spring. The maximum values occur around April, which is consistent with temporal emission patterns for manure application reported for this region (Dammers et al., 2015). Note that, for example, the highest levels in Bremen were observed during springtime with total columns reaching up to 9.3×10¹⁶ molec. NH3 cm−2, which is close to the maximum peak observed by OASIS in March 2012.
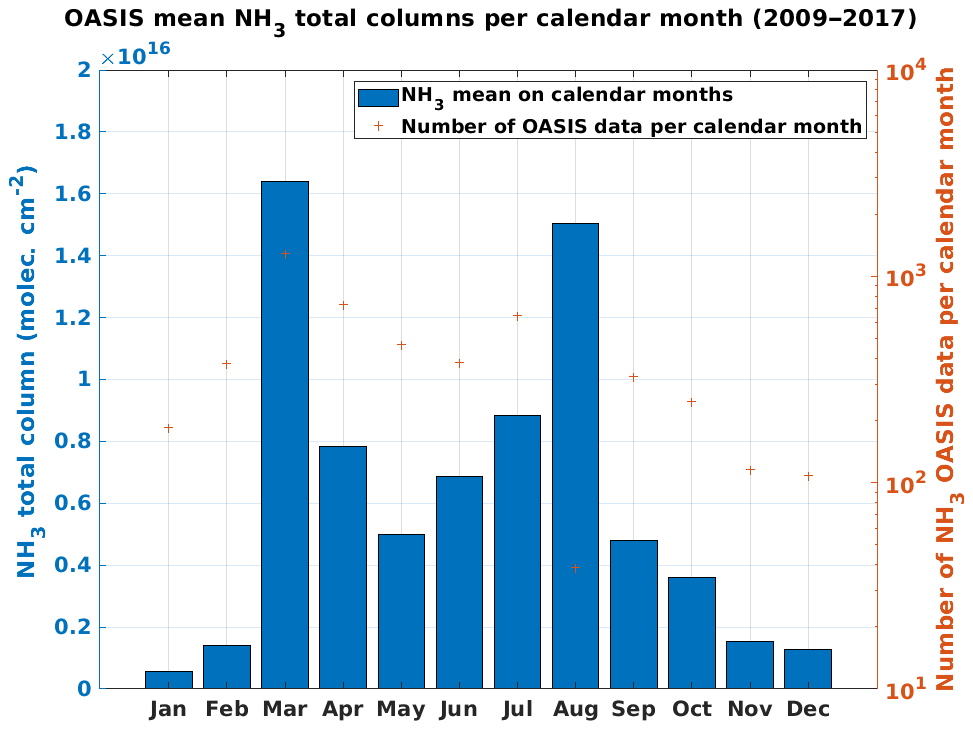
Figure 5Average annual cycle of monthly NH3 total columns (molec. cm−2), observed by OASIS over Paris, averaged over the 2009–2017 period. The red crosses represent the number of OASIS data per calendar month on a log scale (right axis).
One can observe also in Fig. 4 significant concentrations in June (2017), July (2010, 2012, 2013, 2014, 2015, and 2017) and in August 2016, with another threshold of 1.5×10¹⁶ molec. NH3 cm−2, which corresponds roughly to the mean of data plus 1 standard deviation over the summer time period (June, July, and August). This shows a second seasonal peak for the summer period. On the contrary, during winter months (December, January, and February) the NH3 total columns have a pronounced minimum (mean total column of 0.12×10¹⁶ molec. NH3 cm−2 and a standard deviation of 0.12×10¹⁶ molec. NH3 cm−2). It is worth noting that fewer observations are available during this season due to frequent overcast conditions.
This evolution during early winter and, to a lesser extent, summer are also observed in the Bremen measurements, emphasizing some similarities between both the Paris and Bremen station environments. Such seasonal behavior is found not only in Europe but also in other megacities such as Seoul (South Korea), where surface ammonia concentrations exhibit higher values during spring and in the warm season (summer), while dropping to a minimum in the cold season (winter; Phan et al., 2013). One possible explanation is the increased volatility of ammonia in agricultural soils and ammonium particles (in the atmosphere in aqueous or solid phase) under warm meteorological conditions.
3.2 Comparison between NH3–OASIS and NH3–IASI
The validation of the satellite products of IASI (Van Damme et al., 2014) is limited by the scarcity of a long-term series of atmospheric ammonia measurements. A first attempt to validate NH3–IASI measurements was made with correlative data from surface in situ and airplane-based measurements (Van Damme et al., 2015). They confirmed consistency between the NH3–IASI data set and the available in situ observations and showed promising results for validation by using independent airborne data from the California Research at the Nexus of Air Quality and Climate Change (CalNex) campaign. Nevertheless, that study was limited by the availability of independent measurements and suffered from representativeness issues when comparing satellite observations to surface concentration measurements. Recently, Dammers et al. (2016) reported a first step in the validation of NH3–IASI products by comparing ammonia columns with high-resolution FTIR measurements from several NDACC stations around the world. They concluded that IASI reflects similar pollution levels and seasonal cycles as shown by FTIR observations, and the best correlation (R=0.83 and a slope of 0.60) was obtained with the NDACC Bremen station. Bremen is located in the northwest of Germany, which is characterized by intensive agriculture. It is most suitable for comparisons with IASI given the very high atmospheric concentrations of NH3 observed there. Compared to this work over Bremen, our analysis is the first comparison of ground-based NH3 measurements performed in a megacity (Paris) with NH3–IASI and covers 9 years of data. In this study, we consider NH3 total columns retrieved from the IASI-A instrument (aboard the Metop-A platform) observations along with those retrieved from the IASI-B instrument (aboard the Metop-B platform) observations, with IASI-B data being available only for the period from 8 March 2013. Average and median errors of these satellite measurements used in this study are 89 % and 60 %, respectively, which are coherent with uncertainties for most of the NH3–IASI data listed in Van Damme et al. (2014, 2017) because of small absorption features by ammonia observed with the relatively coarse spectral resolution of IASI as compared to ground-based instruments. The sensitivity of IASI retrievals to surface concentrations of NH3 is also limited, and the time of IASI overpasses (early morning and early evening) is not coincident with the typical early afternoon peaks of NH3 concentrations.
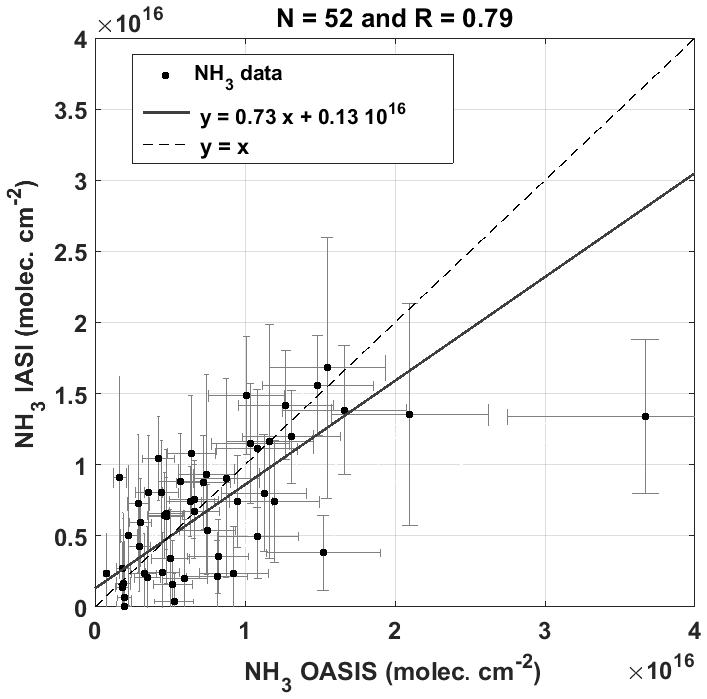
Figure 6Correlations between the FTIR–OASIS and NH3–IASI total columns fulfilling the following temporal and spatial coincidence criteria: a time difference smaller than 30 min and a 15 km radius centered on the ground-based FTIR station. The broken line is the straight equation with slope 1.
For the comparison, only morning overpass (AM) satellite observations (i.e., 09:30 local time) are considered here as they are generally more sensitive to NH3 owing to more favorable thermal contrast in the daytime (Van Damme et al., 2014) and better temporal coincidence (OASIS observations are only carried out during daytime). The satellite data have a circular footprint of 12 km diameter at the nadir and an ellipsoid-shaped footprint of up to 20 km×39 km at the outermost angles (Clarisse et al., 2009). We use raw observations from 1 January 2009 to 31 December 2016 from the most recent version of NH3–IASI retrievals (the near-real-time neural network retrieval version 2 with reanalyzed meteorological inputs called ANNI-NH3-v2.2R; Van Damme et al., 2017).
Note that the lifetime of atmospheric NH3 is rather short, on the order of hours not being uncommon (Galloway et al., 2003; Lutsch et al., 2016; Van Damme et al., 2018), up to a few days, due to efficient deposition and fast conversion to particulate matter. Thus, NH3 concentrations vary strongly as a function of emission strengths and meteorological conditions (such as temperature, precipitation, wind, and vertical mixing in the atmospheric boundary layer).
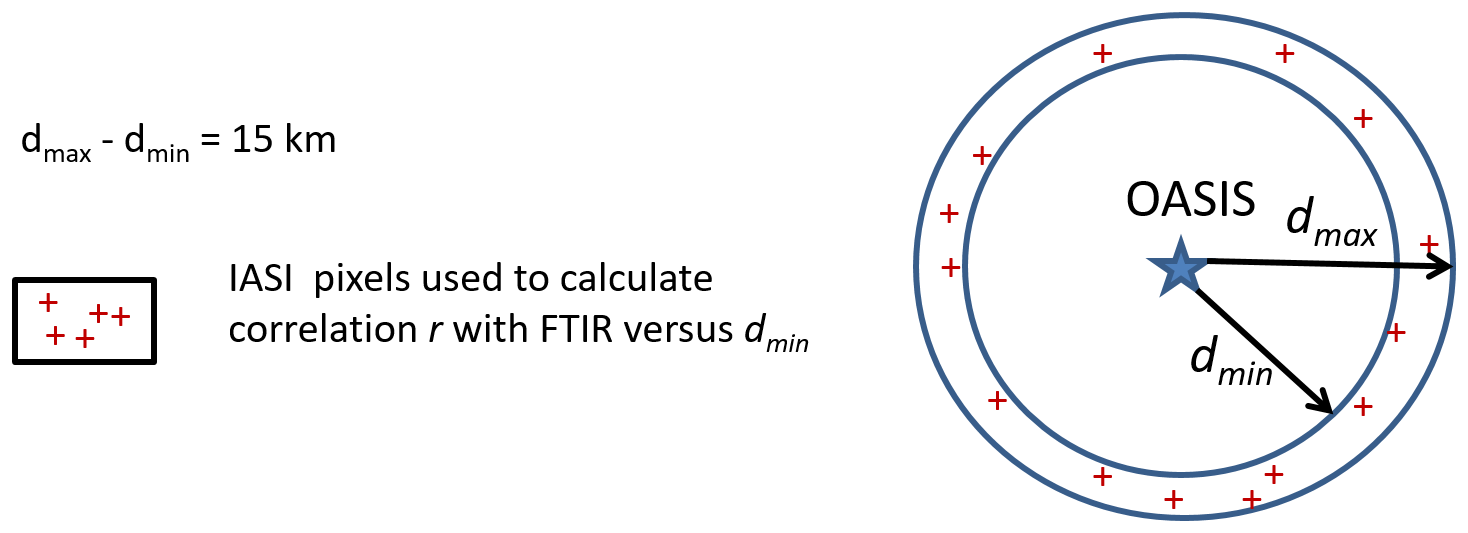
Figure 7Description of the 15 km rings centered on OASIS observatory that were used to select different IASI pixels for the correlation with FTIR data.
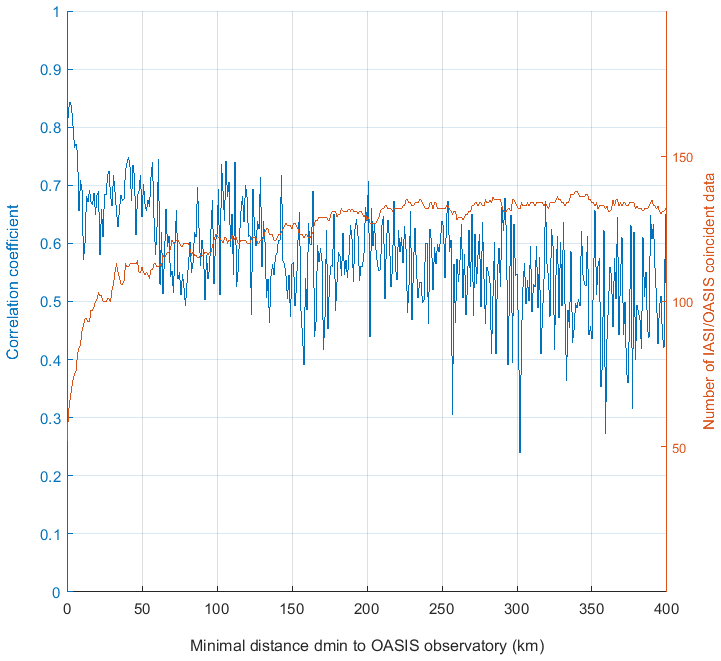
Figure 8Correlation coefficients R (blue lines, left axis) between IASI and ground-based FTIR observations with temporal sampling difference smaller than 30 min, as a function of dmin to OASIS observatory, considered for the calculation of the 15 km wide rings. The data (orange lines, right axis) show the total number of IASI–OASIS coincident observations.
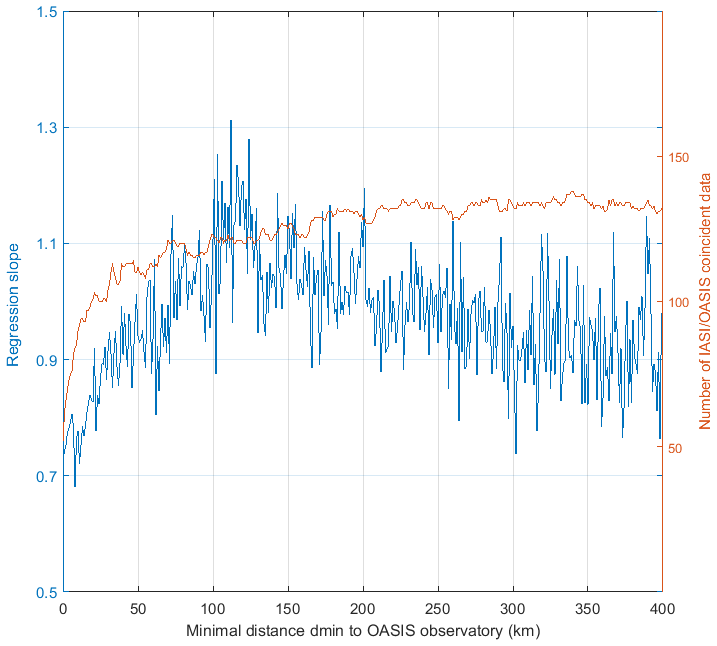
Figure 9Regression slope (blue lines, left axis) between IASI and ground-based FTIR observations with temporal sampling difference smaller than 30 min, as a function of dmin to OASIS observatory, considered for the calculation of the 15 km wide rings. The data (orange lines, right axis) show the total number of IASI–OASIS coincident observations.
In order to minimize differences associated with the temporal variability of NH3, we only consider NH3 measurements from OASIS performed within ±30 min with respect to the IASI morning overpass. The spatial coincidence criterion is 15 km between the center of IASI pixels and OASIS. Tests with wider coincidence criteria (50 km and ±90 min) do not show significant differences (similar correlations are obtained despite a greater number of coincidences). We also exclude NH3–IASI data with relative errors higher than 100 %, except for those with absolute errors lower than 0.5×10¹⁶ molec. cm−2 and retrievals with no physical sense (negative values). The majority of IASI retrievals corresponding to weak NH3 abundances are screened out by the relative error criterion; thus the exclusion of negative values has a negligible effect in the comparisons.
Figure 6 shows a scatterplot comparison between NH3–OASIS and NH3–IASI data. We obtain a very good correlation of R=0.79 and a slope of 0.73 for a total of 52 coincidences. These results are similar to those from a comparison between a ground-based FTIR at Bremen and NH3–IASI lookup table version R=0.83 and a slope of 0.60 for a total of 53 coincidences (Dammers et al., 2016), and NH3–IASI neural network version R=0.67 and a slope of 0.96 for 802 coincidences from several ground-based FTIR stations (Dammers et al., 2017). Here, for Paris, we used stricter spatiotemporal collocation criteria for the comparison as we have more data than the Bremen study. For this correlation, we calculated the absolute differences (AD) between satellite (y axis) and FTIR–OASIS NH3 total columns (x axis), which are defined here as follows:
The average of the absolute differences is molec. cm−2, with a root mean square error (RMSE) equal to 0.49×10¹⁶ molec. cm−2 and a standard deviation of error (STDE) equal to 0.48×10¹⁶ molec. cm−2. The mean absolute difference is a factor of 10 smaller than the average values of the NH3 abundances (0.78×10¹⁶ and 0.70×10¹⁶ molec. cm−2, respectively, for OASIS and IASI) and also smaller than OASIS total retrieval errors (20 % to 35 %). This reveals a very good consistency between NH3–IASI and NH3–OASIS, with this last one being analyzed during 9 years (2009–2017) in Sect. 3.1.
We further investigate the representativeness of the OASIS site for the Île-de-France region by comparing NH3–OASIS data with that from IASI at different distances from the ground-based site. We use 15 km wide rings (Fig. 7) centered on the OASIS observatory and increase the minimal distance (dmin) of the rings from OASIS observatory with a 1 km step. The 15 km width of the rings is chosen to minimize the impact of ammonia spatial variability and to consider a sufficient number of coincidences for statistics. The minimal distance (dmin) varies from 0 up to 400 km. Figures 8 and 9 show, respectively, the correlation and regression slope as a function of dmin using a maximum allowed sampling time difference of 30 min. The numbers on the right axis of each of the figures show the number of coincident observations used in the comparison. An increasing dmin shows a decreasing correlation (blue lines) and a changing slope (increasing with distance up to 120 km, then decreasing). One can distinguish three different regimes in the plot of Fig. 8. For dmin between 0 and 12 km, the highest correlations are seen with R varying from 0.84 down to 0.57, then between 12 and 120 km R is around 0.6 despite lots of noise, and then we get decreasing correlations for dmin between 120 and 400 km. This comparison underlines that measurements from OASIS observatory provide information about atmospheric NH3 variability on a regional scale, up to 120 km away from the site, but might also be affected by more local processes and/or emissions.
For dmin between 0 and 12 km regression slopes vary between 0.73 and 0.81, revealing an underestimation of observed columns by IASI compared to OASIS (Fig. 9) as already mentioned by Dammers et al. (2016) when evaluating IASI with some high-resolution NDACC stations. This underestimation may be explained by IASI's lower sensitivity to surface ammonia concentrations due to the coarse spectral resolution and weak thermal contrast between the surface and the lower troposphere and to the spatial heterogeneity of ammonia within the IASI footprint. The regression slope increases until 120 km for dmin and decreases beyond. This might be linked to the fact that the main surrounding agricultural regions (e.g., Picardie and Champagne) are located up to about 120 km away from OASIS, and therefore NH3 sources (Clarisse et al., 2019; Van Damme et al., 2018), and these sources are more heterogenous beyond this distance.
3.3 Vertical distribution of sensitivity of the NH3–OASIS approach
As mentioned in Sect. 2.2, the NH3–OASIS data set presented in Figs. 4, 8, and 9 is derived from a scaling factor retrieval scheme whose state vector has only one scalar value associated with the NH3 abundance. Therefore, this approach does not provide an averaging kernel matrix as optimal estimation or Tikhonov schemes do but only a single value of degrees of freedom (DOF) without any information on the vertical distribution of the retrieval sensitivity. In order to estimate the vertical sensitivity to NH3 provided by OASIS measurements, we have performed a few tests using an NH3 profile-retrieval scheme applied to OASIS spectra with a Tikhonov–Phillips regularization (as similarly implemented for ozone profiles by Viatte et al., 2011). Figure 10 presents examples of averaging kernel diagonals for NH3 profile retrievals based on OASIS spectra measured on 13 March 2014 at different times of the day and thus different solar zenith angles (SZAs). We remark that OASIS measurements may provide information on the abundance of NH3 located around 500 m, with maximum sensitivity for smaller solar zenith angles corresponding to thicker air masses (occurring in the early morning or late afternoon). These OASIS averaging kernel diagonals peak at similar altitudes as those estimated by Dammers et al. (2017) for a high spectral resolution Fourier thermal infrared spectrometer at the Pasadena site (peaking around 940 hPa, thus approximately at 600 m above sea level). These altitudes are typically located within the atmospheric boundary layer during springtime and summer at midlatitudes where most of the atmospheric NH3 column variability is expected to occur. Additional tests (not shown) using different spectroscopic databases (HITRAN 2008 and HITRAN 2012) change the estimation of the sensitivity of the OASIS retrieval very little.
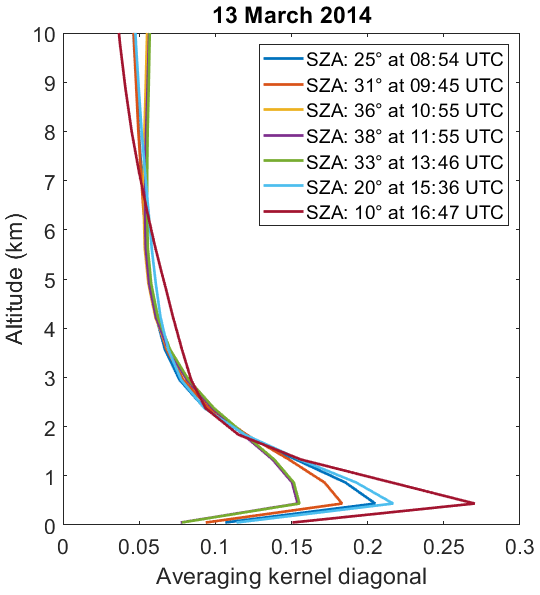
Figure 10Typical NH3–OASIS averaging kernel diagonal elements illustrated on the 13 March 2014 at different times of the day, and solar zenith angles (SZAs in degrees) using spectroscopic data from the HITRAN 2008 (HIT08) database (except for CO2 lines).
Ground-based infrared remote sensing is undoubtedly a promising and powerful spectroscopic technique to retrieve ammonia columns, even when using FTIR instruments with a moderate spectral resolution such as OASIS. Recording one spectrum over a period of approximately 10 min, the OASIS instrument can provide over 40 spectra per day over the Paris region and allows for the observations of the diurnal cycle of ammonia. In this paper, we presented the first multiyear time series (2009–2017) of atmospheric NH3 total column measurements from ground-based infrared remote sensing over the Paris megacity. NH3 total columns vary seasonally by 2 orders of magnitude, approximately from 0.1×10¹⁶ molec. cm−2 in winter to 10×1016 molec. cm−2 for spring peaks. Error estimations show random errors of about 10 % and systematic errors less than 25 % for individual observations, mainly due to the combination of uncertainties in the spectroscopic parameters (including also the interfering species).
This study is based on the 9-year NH3–OASIS time series in order to analyze the seasonal variability of atmospheric NH3 in the Paris region. The predominance of NH3 peaks occurring in March is particularly noticeable: all measurements are greater than 2×10¹⁶ molec. of NH3 cm−2, which corresponds to the average values of the data set plus 1 standard deviation over the springtime period (March, April, and May) and are coincident with manure-spreading time periods (Ramanantenasoa et al., 2018). Mineral fertilizers are mainly applied in the Île-de-France region because they are major arable crop (especially cereals) farming areas, which may volatilize and can generate high ammonia concentrations under sunny conditions. This study also finds high summer values for NH3–OASIS total columns greater than 1.5×10¹⁶ molec. cm−2, which corresponds roughly to the average value of the data set plus 1 standard deviation over the June, July, and August time period. This is likely linked to an increase in the volatility of ammonia under warm meteorological conditions.
Satellite remote sensing instruments such as the Infrared Atmospheric Sounding Interferometer (IASI) on board the Metop platforms provide global distributions of atmospheric NH3 relying on valuable information (Van Damme et al., 2018). We have compared NH3–IASI data with our measurements from OASIS over the 2009–2016 time period. We show a very good correlation of 0.79 and a mean bias of molec. cm−2 between the two data sets, which represents 10 % of the average of the values in the range of 0–1.5×10¹⁶ molec. cm−2. Besides the space instrument's lower sensitivity to the surface ammonia concentrations, spatial heterogeneity of ammonia within the IASI footprint can lead to lower values. Furthermore, OASIS observatory measurements of NH3 are representative of the variability at a 100 km regional scale.
This study also illustrates that ground-based stations like OASIS may play a key role in validating current (e.g., IASI) and future satellite observations (e.g., Infrared Atmospheric Sounder Interferometer coupled with the New Generation, IASI–NG, and the Meteosat Third Generation coupled with the InfraRed Sounder, MTG–IRS) of ammonia in the infrared for a better understanding of the space and time variability of this major source of nitrogen species in the troposphere.
Since ammonia is a major precursor of PM2.5 over Europe, as shown by, e.g., Fortems-Cheiney et al. (2016) during a European spring haze episode, we expect a link between high ammonia concentrations and inorganic salts such as ammonium nitrate. That period during late winter 2012 (documented by Petit et al., 2014) was probably the most polluted month of March of the last 10 years in the Paris region (Petit et al., 2017), with the highest NH3–OASIS total columns in the period 2009–2017 over the Paris region. The link between ammonia concentrations and the formation and volatilization of fine particles such as ammonium salts is beyond the scope of this paper and will be discussed in a future study on the diurnal analysis of total and surface ammonia measurements from the Paris region during a high spring pollution event. Moreover, future versions of the NH3–OASIS approach will be based on vertical profile retrieval using a Tikhonov–Phillips-type regularization. Tests of different a priori NH3 profiles will also be performed for reducing the spectral residuals between measured and simulated spectra, while providing accurate retrievals of NH3 abundances. First tests with a different a priori profile for NH3 show a significant reduction of the residuals between the radiance spectra measured by OASIS and those simulated by PROFFIT.
The NH3–OASIS data used in this study are available on request from the corresponding author. The near-real-time NH3–IASI (ANNI-NH3-v2.2R) data used in this study are freely available from the AERIS database https://iasi.aeris-data.fr/nh3r-i/ (IASI data, 2019; Van Damme et al., 2017).
PC wrote the paper, with contributions from all coauthors, and designed the study. PC, MR, and XL ran the OASIS measurements and made the instrumental settings (calibration, etc.). FH, PC, and TB adapted the PROFFIT code for ammonia, and BT performed NH3–OASIS retrievals. PC, BT, and JC analyzed the data. RDK ran the tests using a Tikhonov–Phillips-type regularization to provide the vertical distribution of sensitivity of the NH3–OASIS approach. CV and AFC helped with downloading and analyzing the NH3–IASI data. PC, JMF, JO, and CCP analyzed the spectroscopic issues. All authors discussed the results and contributed to the final paper.
The authors declare that they have no conflict of interest.
The authors from LISA acknowledge the support from the University of Paris-Est Créteil and from the Observatoire des Sciences de l'Univers–Enveloppes Fluides de la Ville à l'Exobiologie (OSU–EFLUVE) for making the observatory still operational. IASI is a joint mission of EUMETSAT and the Centre National d'Etudes Spatiales (CNES, France). The authors acknowledge the support of the Centre National des Etudes Spatiales (CNES) via the project IASI–Terre-Ocean-Surface-Continentale-Atmosphère (TOSCA). The authors also acknowledge the AERIS data infrastructure for providing access to the IASI data in this study, and ULB–LATMOS for the development of the NH3–IASI retrieval algorithms. The authors wish to thank the NASA Goddard Space Flight Center for providing the temperature and pressure profiles from the National Center for Environmental Prediction (NCEP). The research was also funded by DIM Qi2 (Region Île-de-France) for the internship financial support and also by LEFE–CHAT. Work at IMK has been funded by the ATMO program of the Helmholtz Association of Germany Research Centres.
This paper was edited by Helen Worden and reviewed by two anonymous referees.
Allen, A. G., Harrison, R. M., Wake, and M. T.: A meso-scale study of the behaviour of atmospheric ammonia and ammonium, Atmos. Environ., 22, 1347–1353, 1988.
Baudic, A., Gros, V., Sauvage, S., Locoge, N., Sanchez, O., Sarda-Estève, R., Kalogridis, C., Petit, J.-E., Bonnaire, N., Baisnée, D., Favez, O., Albinet, A., Sciare, J., and Bonsang, B.: Seasonal variability and source apportionment of volatile organic compounds (VOCs) in the Paris megacity (France), Atmos. Chem. Phys., 16, 11961–11989, https://doi.org/10.5194/acp-16-11961-2016, 2016.
Beer, R., Shephard, M. W., Kulawik, S. S., Clough, S. A., Eldering, A., Bowman, K. W., Sander, S. P., Fisher, B. M., Payne, V. H., Luo, M., Osterman, G. B., and Worden, J. R.: First satellite observations of lower tropospheric ammonia and methanol, Geophys. Res. Lett., 35, 1–5, https://doi.org/10.1029/2008GL033642, 2008.
Behera, S. N., Sharma, M., Aneja, V. P., and Balasubramanian, R.: Ammonia in the atmosphere: a review on emission sources, atmospheric chemistry and deposition on terrestrial bodies, Environ. Sci. Pollut. R., 20, 8092–8131, https://doi.org/10.1007/s11356-013-2051-9, 2013.
Bressi, M., Sciare, J., Ghersi, V., Bonnaire, N., Nicolas, J. B., Petit, J.-E., Moukhtar, S., Rosso, A., Mihalopoulos, N., and Féron, A.: A one-year comprehensive chemical characterisation of fine aerosol (PM2.5) at urban, suburban and rural background sites in the region of Paris (France), Atmos. Chem. Phys., 13, 7825–7844, https://doi.org/10.5194/acp-13-7825-2013, 2013.
Buchholz, R. R., Deeter, M. N., Worden, H. M., Gille, J., Edwards, D. P., Hannigan, J. W., Jones, N. B., Paton-Walsh, C., Griffith, D. W. T., Smale, D., Robinson, J., Strong, K., Conway, S., Sussmann, R., Hase, F., Blumenstock, T., Mahieu, E., and Langerock, B.: Validation of MOPITT carbon monoxide using ground-based Fourier transform infrared spectrometer data from NDACC, Atmos. Meas. Tech., 10, 1927–1956, https://doi.org/10.5194/amt-10-1927-2017, 2017.
Chang, L., Palo, S., Hagan, M., Richter, J., Garcia, R., Riggin, D., and Fritts, D.: Structure of the migrating diurnal tide in the Whole Atmosphere Community Climate Model (WACCM), Adv. Space Res., 41, 1398–1407, https://doi.org/10.1016/j.asr.2007.03.035, 2008.
Chang, Y., Zou, Z., Deng, C., Huang, K., Collett, J. L., Lin, J., and Zhuang, G.: The importance of vehicle emissions as a source of atmospheric ammonia in the megacity of Shanghai, Atmos. Chem. Phys., 16, 3577–3594, https://doi.org/10.5194/acp-16-3577-2016, 2016.
Chelin, P., Viatte, C., Ray, M., Eremenko, M., Cuesta, J., Hase, F., Orphal, J., and Flaud, J.-M.: The OASIS observatory using ground-based solar absorption Fourier transform infrared spectroscopy in the suburbs of Paris (Créteil-France), edited by: Jiménez, E., Cabañas, B., and Lefebvre G., Environment, Energy and Climate Change I: Environmental Chemistry of Pollutants and Wastes, Hdb Env Chem, https://doi.org/10.1007/698_2014_270, Springer-Verlag, Berlin, Heidelberg, 2014.
CITEPA: Inventaire des émissions de polluants atmosphériques et de gaz à effet de serre en France – Séries sectorielles et analyses étendues – Format SECTEN. Centre Interprofessionnel Technique d'Etude de la Pollution Atmosphérique, 2015.
Clarisse, L., Clerbaux, C., Dentener, F., Hurtmans, D., and Coheur, P.-F.: Global ammonia distribution derived from infrared satellite observations, Nat. Geosci., 2, 479–483, https://doi.org/10.1038/NGEO551, 2009.
Clarisse, L., Van Damme, M., Clerbaux, C., and Coheur, P.-F.: Tracking down global NH3 point sources with wind-adjusted superresolution, Atmos. Meas. Tech., 12, 5457–5473, https://doi.org/10.5194/amt-12-5457-2019, 2019.
Clerbaux, C., Boynard, A., Clarisse, L., George, M., Hadji-Lazaro, J., Herbin, H., Hurtmans, D., Pommier, M., Razavi, A., Turquety, S., Wespes, C., and Coheur, P.-F.: Monitoring of atmospheric composition using the thermal infrared IASI/MetOp sounder, Atmos. Chem. Phys., 9, 6041–6054, https://doi.org/10.5194/acp-9-6041-2009, 2009.
Dammers, E., Vigouroux, C., Palm, M., Mahieu, E., Warneke, T., Smale, D., Langerock, B., Franco, B., Van Damme, M., Schaap, M., Notholt, J., and Erisman, J. W.: Retrieval of ammonia from ground-based FTIR solar spectra, Atmos. Chem. Phys., 15, 12789–12803, https://doi.org/10.5194/acp-15-12789-2015, 2015.
Dammers, E., Palm, M., Van Damme, M., Vigouroux, C., Smale, D., Conway, S., Toon, G. C., Jones, N., Nussbaumer, E., Warneke, T., Petri, C., Clarisse, L., Clerbaux, C., Hermans, C., Lutsch, E., Strong, K., Hannigan, J. W., Nakajima, H., Morino, I., Herrera, B., Stremme, W., Grutter, M., Schaap, M., Wichink Kruit, R. J., Notholt, J., Coheur, P.-F., and Erisman, J. W.: An evaluation of IASI-NH3 with ground-based Fourier transform infrared spectroscopy measurements, Atmos. Chem. Phys., 16, 10351–10368, https://doi.org/10.5194/acp-16-10351-2016, 2016.
Dammers, E., Shephard, M. W., Palm, M., Cady-Pereira, K., Capps, S., Lutsch, E., Strong, K., Hannigan, J. W., Ortega, I., Toon, G. C., Stremme, W., Grutter, M., Jones, N., Smale, D., Siemons, J., Hrpcek, K., Tremblay, D., Schaap, M., Notholt, J., and Erisman, J. W.: Validation of the CrIS fast physical NH3 retrieval with ground-based FTIR, Atmos. Meas. Tech., 10, 2645–2667, https://doi.org/10.5194/amt-10-2645-2017, 2017.
Dammers, E., McLinden, C. A., Griffin, D., Shephard, M. W., Van Der Graaf, S., Lutsch, E., Schaap, M., Gainairu-Matz, Y., Fioletov, V., Van Damme, M., Whitburn, S., Clarisse, L., Cady-Pereira, K., Clerbaux, C., Coheur, P. F., and Erisman, J. W.: NH3 emissions from large point sources derived from CrIS and IASI satellite observations, Atmos. Chem. Phys., 19, 12261–12293, https://doi.org/10.5194/acp-19-12261-2019, 2019.
Dhib, M., Ibrahim, N., Chelin, P., Echargui, M. A., Aroui, H., and Orphal, J.: Diode-laser measurements of O2, N2 and air-pressure broadening and shifting of NH3 in the 10 µm spectral region, J. Mol. Spectrosc., 242, 83–89, https://doi.org/10.1016/j.jms.2007.02.013, 2007.
Down, M. J., Hill, C., Yurchenko, S. N., Tennyson, J., Brown, L., and Kleiner, I.: Re-analysis of ammonia spectra: Updating the HITRAN 14NH3 database, J. Quant. Spectrosc. Ra., 130, 260–272, https://doi.org/10.1016/j.jqsrt.2013.05.027, 2013.
DRIEE: Plan de protection de l'atmosphère d'Île-de-France, Direction Régionale et Interdépartementale de l'Environnement et de l'Energie, available at: http://www.maqualitedelair-idf.fr/w2020/wp-content/uploads/2017/03/PPA-7mars.pdf (last access: 15 July 2018), 2017.
EMEP/EEA: The European Monitoring and Evaluation Programme EMEP Status Report, 2016.
Fortems-Cheiney, A., Dufour, G., Hamaoui-Laguel, L., Foret, G., Siour, G., Van Damme, M., Meleux, F., Coheur, P.-F., Clerbaux, C., Clarisse, L., Wallash, M., and Beekmann, M.: Unaccounted variability in NH3 agricultural sources detected by IASI contributing to European spring haze episode, Geophys. Res. Lett., 43, 5475–5482, https://doi.org/10.1002/2016GL069361, 2016.
Galloway, J. N. Aber, J. D., Erisman, J. W., Seitzinger, S. P., Howarth, R. W., Cowling, E. B., and Cosby, B. J.: The Nitrogen Cascade, BioScience, 53, 341–356, https://doi.org/10.1641/0006-3568(2003)053[0341:TNC]2.0.CO;2, 2013.
Garcia, L., Bedos, C., Genermont, S., Braud, I., and Cellier, P.: Assessing the ability of mechanistic volatilization models to simulate soil surface conditions: a study with the Volt'Air model, Sci. Total Environ., 409, 3980–3992, https://doi.org/10.1016/j.scitotenv.2011.05.003, 2011.
Garcia, L., Génermont, S., Bedos, C., Simon, N. N., Garnier, P., Loubet, B., and Cellier, P.: Accounting for surface cattle slurry in ammonia volatilization models: the case of Volt'Air, Soil Sci. Soc. Am. J., 76, 2184, https://doi.org/10.2136/sssaj2012.0067, 2012.
Génermont, S., Ramanantenasoa, M. M. J., Dufosse, K., Maury, O., Mignolet, C., and Gilliot, J.-M.: Data on spatio-temporal representation of mineral N fertilization and manure N application as well as ammonia volatilization in French regions for the crop year 2005/06, Data in Brief, 21, 1119–1124, https://doi.org/10.1016/j.scitotenv.2018.06.202, 2018.
Griesfeller, A., Griesfeller, J., Hase, F., Kramer, I., Loës, P., Mikuteit, S., Raffalski, U., Blumenstock, T., and Nakajima, H.: Comparison of ILAS-II and ground-based FTIR measurements of O3, HNO3, N2O, and CH4 over Kiruna, Sweden, J. Geophys.Res., 111, D11S07, https://doi.org/10.1029/2005JD006451, 2006.
Hase, F., Hannigan, J. W., Coffey, M. T., Goldman, A., Höpfner, M., Jones N. B., Rinsland, C. P., and Wood, S. W.: Intercomparison of retrieval codes used for the analysis of high-resolution, ground-based FTIR measurements, J. Quant. Spectrosc. Ra., 87, 25–52, 2004.
IASI data: https://iasi.aeris-data.fr/nh3r-i/, last access: July 2019.
Leen, J. B., Yu, X. Y., Gupta, M., Baer, D. S., Hubbe, J. M., Kluzek, C. D., Tomlinson, J. M., and Hubbell, M. R.: Fast in situ airborne measurement of ammonia using a mid-infrared off-axis ICOS spectrometer, Environ. Sci. Technol., 47, 10446–10453, https://doi.org/10.1021/es401134u, 2013.
Lutsch, E., Dammers, E., Conway, S., and Strong, K.: Long-range Transport of NH3, CO, HCN and C2H6 from the 2014 Canadian Wildfires, Geophys. Res. Lett., 43, 8286–8297, https://doi.org/10.1002/2016GL070114, 2016.
Meier, A., Toon, G. C., Rinsland, C. P., Goldman, A., and Hase, F.: A spectroscopic atlas of atmospheric microwindows in the middle infrared, IRF technical report, Swedish Institute of Space Physics, 2004.
Petetin, H., Sciare, J., Bressi, M., Gros, V., Rosso, A., Sanchez, O., Sarda-Estève, R., Petit, J.-E., and Beekmann, M.: Assessing the ammonium nitrate formation regime in the Paris megacity and its representation in the CHIMERE model, Atmos. Chem. Phys., 16, 10419–10440, https://doi.org/10.5194/acp-16-10419-2016, 2016.
Petit, J.-E., Favez, O., Sciare, J., Canonaco, F., Croteau, P., Močnik, G., Jayne, J., Worsnop, D., and Leoz-Garziandia, E.: Submicron aerosol source apportionment of wintertime pollution in Paris, France by double positive matrix factorization (PMF2) using an aerosol chemical speciation monitor (ACSM) and a multi-wavelength Aethalometer, Atmos. Chem. Phys., 14, 13773–13787, https://doi.org/10.5194/acp-14-13773-2014, 2014.
Petit, J.-E., Favez, O., Sciare, J., Crenn, V., Sarda-Estève, R., Bonnaire, N., Močnik, G., Dupont, J.-C., Haeffelin, M., and Leoz-Garziandia, E.: Two years of near real-time chemical composition of submicron aerosols in the region of Paris using an Aerosol Chemical Speciation Monitor (ACSM) and a multi-wavelength Aethalometer, Atmos. Chem. Phys., 15, 2985–3005, https://doi.org/10.5194/acp-15-2985-2015, 2015.
Petit, J.-E., Amodeo, T., Meleux, F., Bessagnet, B., Menut, L., Grenier, D., Pellan, Y., Ockler, A., Rocq, B., Gros, V., Sciare, J., and Favez, O., Characterising an intense PM pollution episode in March 2015 in France from multi-site approach and near real time data: Climatology, variabilities, geographical origins and model evaluation, Atmos. Environ., 155, 68–84, https://doi.org/10.1016/j.atmosenv.2017.02.012, 2017.
Phan, N.-T. Kim, K.-H., Shon, Z.-H., Jeon, E.-C., Jung, K., and Kim, N.-J., Analysis of ammonia variation in the urban atmosphere, Atmos. Environ., 65, 177–185, https://doi.org/10.1016/j.atmosenv.2012.10.049, 2013.
Ramanantenasoa, M. M. J., Gilliot, J.-M., Mignolet, C., Bedos, C., Mathias, E., Eglin, T., Makowski, D., and Génermont, S.: A new framework to estimate spatio-temporal ammonia emissions due to nitrogen fertilization in France, Sci. Total Environ., 645, 205–219, doi.org/10.1016/j.scitotenv.2018.06.202, 2018.
Remedios, J. J., Leigh, R. J., Waterfall, A. M., Moore, D. P., Sembhi, H., Parkes, I., Greenhough, J., Chipperfield, M. P., and Hauglustaine, D.: MIPAS reference atmospheres and comparisons to V4.61/V4.62 MIPAS level 2 geophysical data sets, Atmos. Chem. Phys. Discuss., 7, 9973–10017, https://doi.org/10.5194/acpd-7-9973-2007, 2007.
Ringuet, J., Andre, J.-M., Bouchard, D., Deflorenne, E., Druart, A., Dulhoste, S., Durand, A., Gavel, A., Gueguen, C., Jeannot, C., Langeron, J., Lemaire, A., Mathias, E., Nicco, L., Serveau, L., Taieb, N., Vieira Da Rocha, T., and Vincent, J.: Inventaire des émissions de polluants atmosphériques en France au titre de la convention sur la pollution atmosphérique transfontalière à longue distance et de la directive européenne relative aux plafonds d'émissions nationaux, Centre Interprofessionel Technique d'Etudes de la Pollution Atmosphérique, 2016.
Rodgers, C. D.: Inverse Methods for Atmospheric Sounding – Theory and Practice, chap. 3, 2, 256, https://doi.org/10.1142/9789812813718, 2000.
Rothman, L. S., Gordon, I. E., Barbe, A., Benner, D. C., Bernath, P. E., Birk, M., Boudon, V., Brown, L. R., Campargue, A., Champion, J. P., Chance, K., Coudert, L. H., Dana, V., Devi, V. M., Fally, S., Flaud, J. M., Gamache, R. R., Goldman, A., Jacquemart, D., Kleiner, I., Lacome, N., Lafferty, W. J., Mandin, J. Y., Massie, S. T., Mikhailenko, S. N., Miller, C. E., Moazzen-Ahmadi, N., Naumenko, O. V., Nikitin, A. V., Orphal, J., Perevalov, V. I., Perrin, A., Predoi-Cross, A., Rinsland, C. P., Rotger, M., Simeckova, M., Smith, M. A. H., Sung, K., Tashkun, S. A., Tennyson, J., Toth, R. A., Vandaele, A. C., and Vander Auwera, J.: The HITRAN 2008 molecular spectroscopic database, J. Quant. Spectrosc. Ra., 110, 533–572, https://doi.org/10.1016/j.jqsrt.2009.02.013, 2009.
Rothman, L. S., Gordon, I. E., Babikov, Y., Barbe, A., Chris Benner, D., Bernath, P. F., Birk, M., Bizzocchi, L., Boudon, V., Brown, L. R., Campargue, A., Chance, K., Cohen, E. A., Coudert, L. H., Devi, V. M., Drouin, B. J., Fayt, A., Flaud, J. M., Gamache, R. R., Harrison, J. J., Hartmann, J. M., Hill, C., Hodges, J. T., Jacquemart, D., Jolly, A., Lamouroux, J., Le Roy, R. J., Li, G., Long, D. a., Lyulin, O. M., Mackie, C. J., Massie, S. T., Mikhailenko, S., Müller, H. S. P., Naumenko, O. V., Nikitin, A. V., Orphal, J., Perevalov, V., Perrin, A., Polovtseva, E. R., Richard, C., Smith, M. A. H., Starikova, E., Sung, K., Tashkun, S., Tennyson, J., Toon, G. C., Tyuterev, V. G., and Wagner, G.: The HITRAN2012 molecular spectroscopic database, J. Quant. Spectrosc. Ra., 130, 4–50, https://doi.org/10.1016/j.jqsrt.2013.07.002, 2013.
Seinfeld, J. H. and Pandis, S. N.: Atmospheric chemistry and physics: from air pollution to climate change, 2nd edn. John Wiley & Sons, New York, 2006.
Shephard, M. W. and Cady-Pereira, K. E.: Cross-track Infrared Sounder (CrIS) satellite observations of tropospheric ammonia, Atmos. Meas. Tech., 8, 1323–1336, https://doi.org/10.5194/amt-8-1323-2015, 2015.
Shephard, M. W., McLinden, C. A., Cady-Pereira, K. E., Luo, M., Moussa, S. G., Leithead, A., Liggio, J., Staebler, R. M., Akingunola, A., Makar, P., Lehr, P., Zhang, J., Henze, D. K., Millet, D. B., Bash, J. O., Zhu, L., Wells, K. C., Capps, S. L., Chaliyakunnel, S., Gordon, M., Hayden, K., Brook, J. R., Wolde, M., and Li, S.-M.: Tropospheric Emission Spectrometer (TES) satellite observations of ammonia, methanol, formic acid, and carbon monoxide over the Canadian oil sands: validation and model evaluation, Atmos. Meas. Tech., 8, 5189–5211, https://doi.org/10.5194/amt-8-5189-2015, 2015.
Strong, K., Wolff, M. A., Kerzenmacher, T. E., Walker, K. A., Bernath, P. F., Blumenstock, T., Boone, C., Catoire, V., Coffey, M., De Mazière, M., Demoulin, P., Duchatelet, P., Dupuy, E., Hannigan, J., Höpfner, M., Glatthor, N., Griffith, D. W. T., Jin, J. J., Jones, N., Jucks, K., Kuellmann, H., Kuttippurath, J., Lambert, A., Mahieu, E., McConnell, J. C., Mellqvist, J., Mikuteit, S., Murtagh, D. P., Notholt, J., Piccolo, C., Raspollini, P., Ridolfi, M., Robert, C., Schneider, M., Schrems, O., Semeniuk, K., Senten, C., Stiller, G. P., Strandberg, A., Taylor, J., Tétard, C., Toohey, M., Urban, J., Warneke, T., and Wood, S.: Validation of ACE-FTS N2O measurements, Atmos. Chem. Phys., 8, 4759–4786, https://doi.org/10.5194/acp-8-4759-2008, 2008.
Someya, Y., Imasu, R., Shiomi, K., and Saitoh, N.: Atmospheric ammonia retrieval from the TANSO-FTS/GOSAT thermal infrared sounder, Atmos. Meas. Tech., 13, 309–321, https://doi.org/10.5194/amt-13-309-2020, 2020.
Sun, K., Cady-Pereira, K., Miller, D. J., Tao, L., Zondlo, M. A., Nowak, J. B., Neuman, J. A., Mikoviny, T., Müller, M., Wisthaler, A., Scarino, A. J., and Hostetler, C. A.: Validation of TES ammonia observations at the single pixel scale in the San Joaquin Valley during DISCOVER-AQ, J. Geophys. Res.-Atmos., 120, 5140–5154, https://doi.org/10.1002/2014JD022846, 2015.
Sutton, M. A., Milford, C., Dragosits, U., Place, C. J., Singles, R. J., Smith, R. I., and Wyers, G. P.: Dispersion, deposition and impacts of atmospheric ammonia: quantifying local budgets and spatial variability, Environ. Pollut., 102, 349–361, https://doi.org/10.1016/S0269-7491(98)80054-7, 1998.
Sutton, M. A., Erisman, J. W., Dentener, F., and Möller, D.: Ammonia in the environment: From ancient times to the present, Environ. Pollut., 156, 583–604, https://doi.org/10.1016/j.envpol.2008.03.013, 2008.
Van Damme, M., Clarisse, L., Heald, C. L., Hurtmans, D., Ngadi, Y., Clerbaux, C., Dolman, A. J., Erisman, J. W., and Coheur, P. F.: Global distributions, time series and error characterization of atmospheric ammonia (NH3) from IASI satellite observations, Atmos. Chem. Phys., 14, 2905–2922, https://doi.org/10.5194/acp-14-2905-2014, 2014.
Van Damme, M., Clarisse, L., Dammers, E., Liu, X., Nowak, J. B., Clerbaux, C., Flechard, C. R., Galy-Lacaux, C., Xu, W., Neuman, J. A., Tang, Y. S., Sutton, M. A., Erisman, J. W., and Coheur, P. F.: Towards validation of ammonia (NH3) measurements from the IASI satellite, Atmos. Meas. Tech., 8, 1575–1591, https://doi.org/10.5194/amt-8-1575-2015, 2015.
Van Damme, M., Whitburn, S., Clarisse, L., Clerbaux, C., Hurtmans, D., and Coheur, P.-F.: Version 2 of the IASI NH3 neural network retrieval algorithm: near-real-time and reanalysed datasets, Atmos. Meas. Tech., 10, 4905–4914, https://doi.org/10.5194/amt-10-4905-2017, 2017.
Van Damme, M., Clarisse, L., Whitburn, S., Hadji-Lazaro, J., Hurtmans, D., Clerbaux, C., and Coheur, P.-F.: Industrial and Agricultural Ammonia Point Sources Exposed, Nature, 564, 99–103, https://doi.org/10.1038/s41586-018-0747-1, 2018.
Viatte, C., Gaubert, B., Eremenko, M., Hase, F., Schneider, M., Blumenstock, T., Ray, M., Chelin, P., Flaud, J.-M., and Orphal, J.: Tropospheric and total ozone columns over Paris (France) measured using medium-resolution ground-based solar-absorption Fourier-transform infrared spectroscopy, Atmos. Meas. Tech., 4, 2323–2331, https://doi.org/10.5194/amt-4-2323-2011, 2011.
Volten, H., Bergwerff, J. B., Haaima, M., Lolkema, D. E., Berkhout, A. J. C., van der Hoff, G. R., Potma, C. J. M., Wichink Kruit, R. J., van Pul, W. A. J., and Swart, D. P. J.: Two instruments based on differential optical absorption spectroscopy (DOAS) to measure accurate ammonia concentrations in the atmosphere, Atmos. Meas. Tech., 5, 413–427, https://doi.org/10.5194/amt-5-413-2012, 2012.
von Bobrutzki, K., Braban, C. F., Famulari, D., Jones, S. K., Blackall, T., Smith, T. E. L., Blom, M., Coe, H., Gallagher, M., Ghalaieny, M., McGillen, M. R., Percival, C. J., Whitehead, J. D., Ellis, R., Murphy, J., Mohacsi, A., Pogany, A., Junninen, H., Rantanen, S., Sutton, M. A., and Nemitz, E.: Field inter-comparison of eleven atmospheric ammonia measurement techniques, Atmos. Meas. Tech., 3, 91–112, https://doi.org/10.5194/amt-3-91-2010, 2010.
Warneck, P.: Chemistry of the natural atmosphere, Academic Press, New York, 1988.
Warner, J. X., Wei, Z., Strow, L. L., Dickerson, R. R., and Nowak, J. B.: The global tropospheric ammonia distribution as seen in the 13-year AIRS measurement record, Atmos. Chem. Phys., 16, 5467–5479, https://doi.org/10.5194/acp-16-5467-2016, 2016.
Whitburn, S., Van Damme, M., Clarisse, L., Bauduin, S., Heald, C. L., Hadji-Lazaro, J., Hurtmans, D., Zondlo, M. A., Clerbaux, C., and Coheur, P.-F.: A flexible and robust neural network IASINH3 retrieval algorithm, J. Geophys. Res.-Atmos., 121, 6581–6599, https://doi.org/10.1002/2016jd024828, 2016.