the Creative Commons Attribution 4.0 License.
the Creative Commons Attribution 4.0 License.
 | 30 Jul 2020
Methane and nitrous oxide from ground-based FTIR at Addis Ababa: observations, error analysis, and comparison with satellite data
Temesgen Yirdaw Berhe
Gizaw Mengistu Tsidu
Thomas Blumenstock
Frank Hase
Gabriele P. Stiller
A ground-based, high-spectral-resolution Fourier transform infrared (FTIR) spectrometer has been operational in Addis Ababa, Ethiopia (9.01∘ N latitude, 38.76∘ E longitude; 2443 m altitude above sea level), since May 2009 to obtain information on column abundances and profiles of various constituents in the atmosphere. Vertical profile and column abundances of methane and nitrous oxide are derived from solar absorption measurements taken by FTIR for a period that covers May 2009 to March 2013 using the retrieval code PROFFIT (V9.5). A detailed error analysis of CH4 and N2O retrieval are performed. Averaging kernels of the target gases shows that the major contribution to the retrieved information comes from the measurement. Thus, average degrees of freedom for signals are found to be 2.1 and 3.4, from the retrieval of CH4 and N2O for the total observed FTIR spectra. Methane and nitrous oxide volume mixing ratio (VMR) profiles and column amounts retrieved from FTIR spectra are compared with data from the reduced spectral resolution Institute of Meteorology and Climate Research/Instituto de Astrofísica de Andalucía (IMK/IAA) MIPAS (Version V5R_CH4_224 and V5R_N2O_224), the Microwave Limb Sounder (MLS) (MLS v3.3 of N2O and CH4 derived from MLS v3.3 products of CO, N2O, and H2O), and the Atmospheric Infrared Sounder (AIRS) sensors on board satellites. The averaged mean relative difference between FTIR methane and the three correlative instruments MIPAS, MLS, and AIRS are 4.2 %, 5.8 %, and 5.3 % in the altitude ranges of 20 to 27 km, respectively. However, the biases below 20 km are negative, which indicates the profile of CH4 from FTIR is less than the profiles derived from correlative instruments by −4.9 %, −1.8 %, and −2.8 %. The averaged positive bias between FTIR nitrous oxide and correlative instrument, MIPAS, in the altitude range of 20 to 27 km is 7.8 %, and a negative bias of −4 % at altitudes below 20 km. An averaged positive bias of 9.3 % in the altitude range of 17 to 27 km is obtained for FTIR N2O with MLS. In all the comparisons of CH4 from FTIR with data from MIPAS, MLS, and AIRS, sensors on board satellites indicate a negative bias below 20 km and a positive bias above 20 km. The mean error between partial-column amounts of methane from MIPAS and the ground-based FTIR is −5.5 %, with a standard deviation of 5 % that shows very good agreement as exhibited by relative differences between vertical profiles. Thus, the retrieved CH4 and N2O VMR and column amounts from Addis Ababa, tropical site, is found to exhibit very good agreement with all coincident satellite observations. Therefore, the bias obtained from the comparison is comparable to the precision of FTIR measurement, which allows the use of data in further scientific studies as it represents a unique environment of tropical Africa, a region poorly investigated in the past.
- Article
(869 KB) - Full-text XML
-
Supplement
(1884 KB) - BibTeX
- EndNote


Methane (CH4), nitrous oxide (N2O), and chlorofluorocarbons (CFCs) are tropospheric species, which are the main source gases for the chemical families NOx, ClOx, and HOx (Jacobson, 2005). The reaction of CH4 with hydroxyl radicals reduces ozone in the troposphere, and it influences the lifetime or production of other atmospheric constituents such as stratospheric water vapor and CO2 (Michelsen et al., 2000; Boucher et al., 2009), whereas the lifetime of N2O is determined by its rate of UV photolysis or reaction with O(1D) (Collins et al., 2010).
Methane retrievals from near-infrared spectra recorded by the SCIAMACHY instrument on board ENVISAT suggested an unexpectedly large tropical CH4 emissions and the impact of water spectroscopy on methane retrievals, with the largest impacts in the tropics (Frankenberg et al., 2008b). The recent increasing impact of CH4 and N2O to global warming has also been assessed by the last AR4 IPCC report (IPCC, 2007; Sussmann et al., 2012). Nitrous oxide (N2O) becomes the dominant ozone-depleting substance emitted in the 21st century (Ravishankara et al., 2009). In 2007 and 2008, The Infrared Atmospheric Sounding Interferometer (IASI) on board METOP-A observed an increase in midtroposphere methane in the tropical region of 9.5±2.8 and 6.3±1.7 ppbv yr−1, respectively (Crevoisier et al., 2013). Long-lived compounds ascend in the tropics, across the tropical tropopause, and are subsequently redistributed by the Brewer–Dobson circulation (Holton, 2004). According to the World Meteorological Organization (WMO), the 2010 report (WMO, 2010), 96 % of the increase in radiative forcing is due to the five long-lived greenhouse gases: carbon dioxide, methane, nitrous oxide, CFC-12, and CFC-11. The sources and sinks of atmospheric methane (CH4) and its budget in the tropics are not yet well quantified and have large uncertainties due to the scarcity of measurements (e.g., Meirink et al., 2008).
The tropics is the location where two important exchange processes in the atmosphere are taking place, the interhemispheric exchange and the entry of tropospheric air mass into the stratosphere (Petersen et al., 2010; Fueglistaler et al., 2009). Moreover, composition of a tropical atmosphere also plays a critical role in the stratospheric chemistry (Solomon, 1999; IPCC, 2007). Measurements and interpretation of atmospheric trace gas composition of the tropics is vital for a better understanding of the budgets, sources, and sinks of trace gases in the atmosphere and their effects on atmospheric chemistry, greenhouse effect, and climate changes globally. Emissions within the tropics contribute substantially to the global budgets of many important trace gases (IPCC, 2007; Frankenberg et al., 2008a).
The ground-based FTIR measurement at the Addis Ababa site was launched in 2009, in collaboration with Karlsruhe Institute of Technology, Germany, to measure concentrations of various trace gases in the lower and middle atmosphere over Addis Ababa. Thus, Addis Ababa FTIR measurements of atmospheric trace gases and their importance to understand various lower and middle atmospheric processes have been reported in a number of previous studies (Takele Kenea et al., 2013; Mengistu Tsidu et al., 2015; Schneider et al., 2015, 2016; Barthlott et al., 2017). H2O volume mixing ratio (VMR) profiles and integrated column amounts from ground-based FTIR measurements of the Addis Ababa site were also compared with the coincident satellite observations of the Tropospheric Emission Spectrometer (TES), Atmospheric Infrared Sounding (AIRS), and Modular Earth Submodel System (MESSy) model, and the result confirmed reasonably good agreement (Samuel, 2014). Laeng et al. (2015) found that the MIPAS CH4 profiles V5R_CH4_222 below 20 to 25 km is biased high by +14 %. For a later and improved data version, namely V5R_CH4_224, Plieninger et al. (2016) found a positive bias between 0.1 and 0.2 ppmv. For the MIPAS N2O data version V5R_N2O_224, Plieninger et al. (2016) determined the bias to be between 0 and +30 ppb.
In this study, previous work on the intercomparison of ozone (Takele Kenea et al., 2013) and water vapor (Samuel, 2014) are extended to source gases CH4 and N2O from ground-based FTIR. Intercomparisons of vertical profiles and column amounts retrieved from solar spectra observed by the Fourier transform spectrometer at the Addis Ababa site with data from MIPAS, MLS, and AIRS sensors on board satellites were made to assess the quality of the data derived from FTIR. The observed differences between ground-based FTIR and satellite observation of CH4 and N2O are analyzed using the statistical tools detailed in von Clarmann (2006). The measurement site and the FTIR spectrometer along with the retrieval approach will be introduced in Sect. 2, and the retrieved information content and spectral analysis will be discussed in Sect. 3. A short description of satellite measurement techniques followed by the detailed intercomparison with those products will be presented in Sects. 4 and 5, respectively. Finally, a summary and conclusions are given in Sect. 6.
2.1 Measurement site
The ground-based FTIR at Addis Ababa was established to acquire high-quality, long-term measurements of trace gases to understand chemical and dynamical processes in the atmosphere and to validate models and satellite measurements of atmospheric constituents. The geographic position of the observatory is 9.01∘ N, 38.76∘ E, 2443 m a.s.l., and its suitability has been confirmed from the measurements of tropical stratospheric ozone, precipitable water vapor, and isotopic composition of water vapor (Takele Kenea et al., 2013; Mengistu Tsidu et al., 2015; Schneider et al., 2015, 2016; Barthlott et al., 2017). Addis Ababa is a tropical high-altitude observing site and as such is important to the understanding of processes near the tropical tropopause. Physical process in the tropics, mainly around tropopause layer, has a vital role in climate change and the general circulation of the tropical troposphere, which would control the transport of energy, water vapor, and trace gases in the climate system derived by the deep convection (Holton and Gettelman, 2001). Thus, the observed variation in the measurement of atmospheric trace gases would help us to understand the effects of tropical dynamics on the site. Besides, it fills a data gap due to the scarcity of ground-based measurements in tropics.
2.2 The FTIR spectrometer and retrieval
Fourier transform spectroscopy has been applied successfully to study trace gases in the atmosphere by examining atmospheric absorption lines in the infrared spectrum from solar radiation. Measurement of the sun's spectra at the Earth's surface provides information about atmospheric composition. This technique uses the sun as a light source in order to quantify molecular absorptions in the atmosphere and then retrieve trace gases abundance. The high-resolution FTIR spectrometer, Bruker IFS120M, upgraded with 125 M electronics, from Bruker Optik GmbH, in Germany, was installed in May 2009 at the Addis Ababa site. This interferometer is equipped with indium–antimonide (InSb) detector, which allows coverage of the 1500–4400 cm−1 spectral interval. In this spectral range, a large number of species that reside in the atmosphere can be detected.
The measured spectra have been analyzed using an algorithm that simulates the spectra and Jacobians by the line-by-line radiative transfer model PRFFWD (PRoFit ForWarD model) to produce the synthesized spectra, and the vertical profiles of CH4 and N2O would be derived by applying a retrieval code PROFFIT (Ver95) (Hase et al., 2004). It has been developed based on semiempirical implementation of the optimal estimation method (Rodgers, 2000) to derive the VMR profiles and column amounts of multiple species. Hence, CH4 and N2O profiles from measured spectra in the microwindows that span a spectral range of 2400–2800 cm−1 have been discussed in this paper. A Tikhonov–Phillips regularization method on a logarithmic scale was used to derive the profiles. Retrieved state vector is related to a priori (xa) and true state vectors (x) by the following mathematical expression:
where is averaging kernel matrix, and ε is the measurement error. Moreover, the actual averaging kernel matrix depends on several parameters including the solar zenith angle, the spectral resolution and signal-to-noise ratio, the choice of retrieval spectral microwindows, and the a priori covariance matrix Sa. The elements of the averaging kernel for a given altitude gives the sensitivity of retrieved profiles at which the real profile is present, and its full width at half maximum is a measure of the vertical resolution of the retrieval at that altitude (Rodgers, 1990). Error estimation analysis is based on the analytical method suggested by Rodgers (2000) as follows:
The averaging kernel matrix can be defined as A=GK; I is the identity matrix, and G is the gain matrix that represents the sensitivity of retrieved parameters to the measurement. Kb is the sensitivity matrix of the spectrum to the forward model parameters b. Since we do not know the true state of the atmosphere, we can not specify the actual retrieval error; we can only make a statistical estimate of it, which is expressed in terms of a covariance matrix. The total error in the retrieved profile can be described as a combination of measurement error and forward model parameter error. It has been suggested by Rodgers (2000) to include smoothing error in the total error budget, but this concept has been revised by von Clarmann (2014).
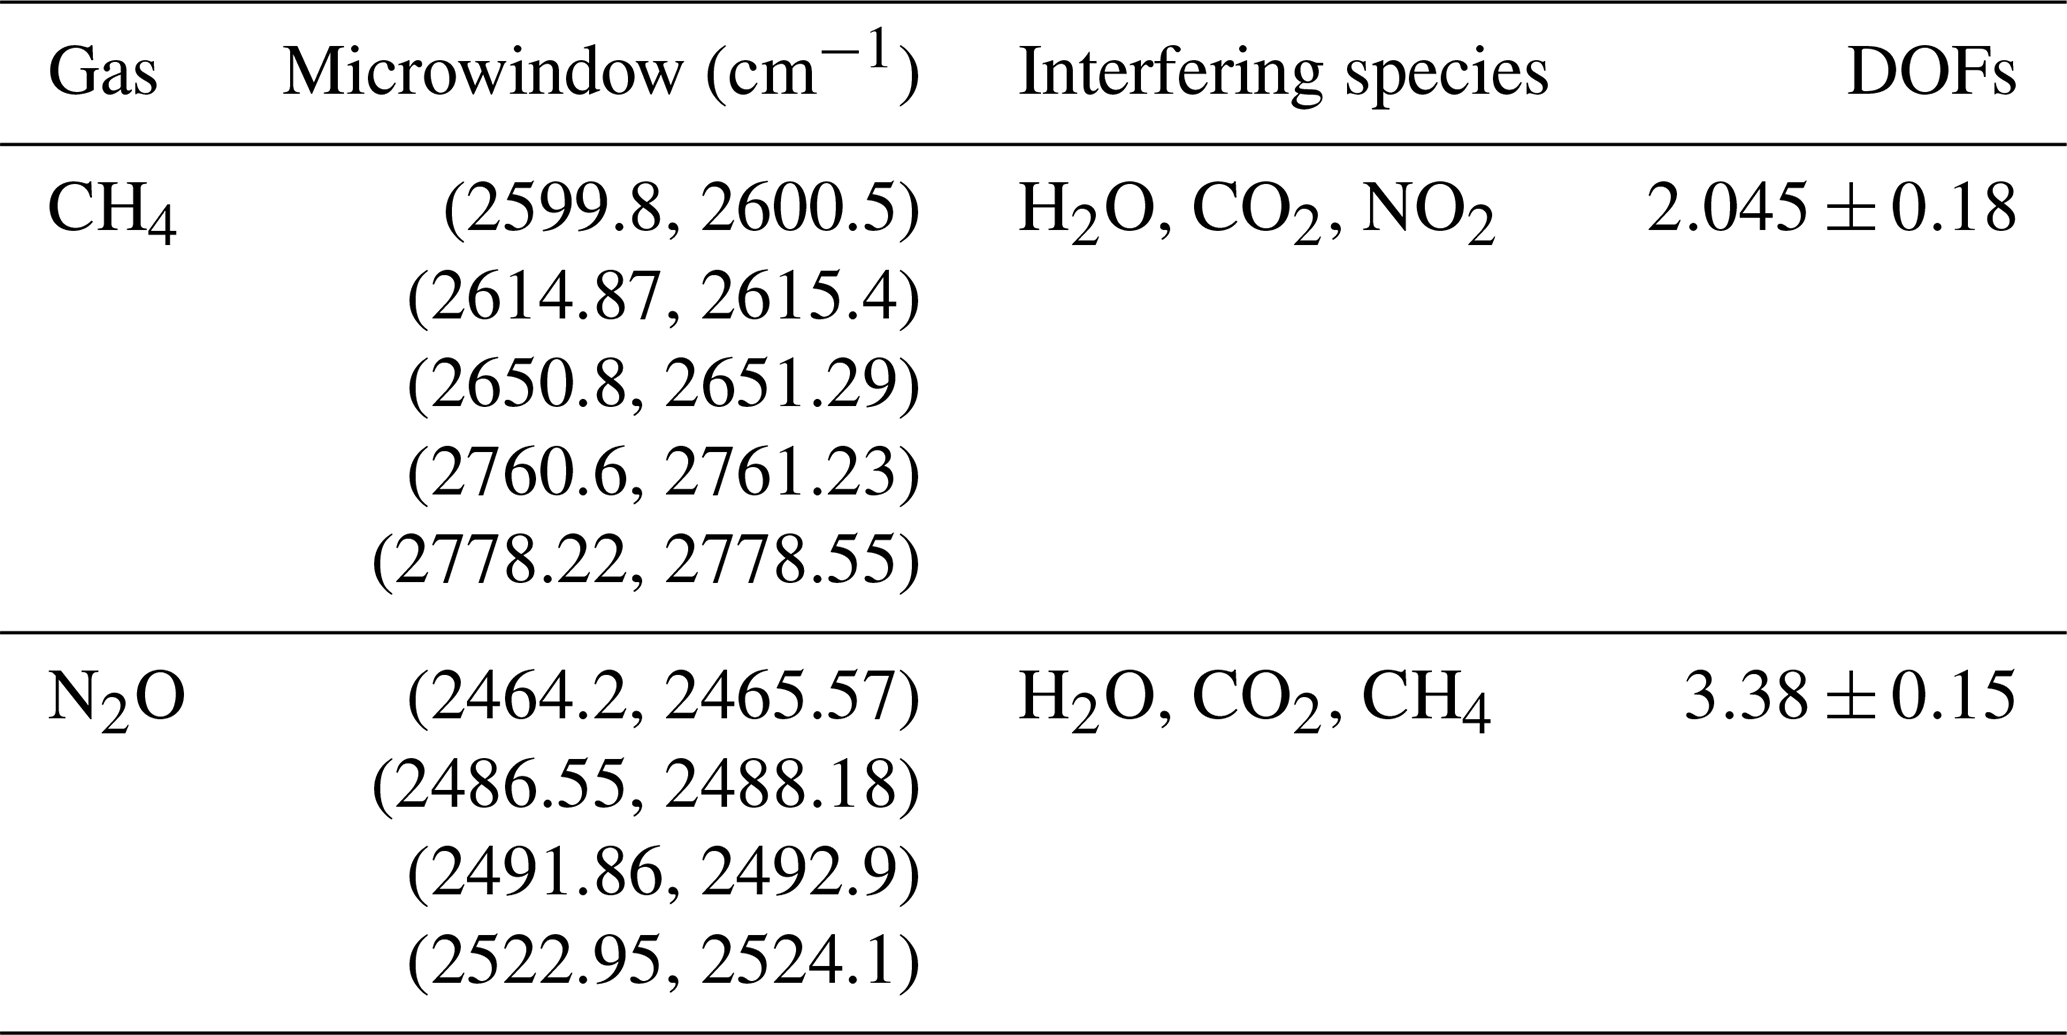
Table 1Microwindows, interfering gases, and their DOFs listed in the table are used for the retrieval of VMR profiles and column amounts of CH4 and N2O from FTIR spectra recorded at Addis Ababa.
3.1 Spectroscopic data and a priori profiles
In our retrieval strategy, the profiles of CH4 and N2O were retrieved, while the profiles of interfering species (see Table 1) were scaled. A prior xa profiles for methane and the interfering species above Addis Ababa were taken from 40-year averages (1980–2020) of the Whole Atmosphere Community Climate Model (WACCM; Garcia et al., 2007). Similarly, the a priori profile for nitrous oxide has also been constructed from monthly average data available from WACCM (e.g., Tilmes et al., 2007), whereas the grid to be used for the Addis Ababa site is found with the WACCM mixing ratio profile data at ftp://ftp.acom.ucar.edu/user/jamesw/IRWG/2013/WACCM/V6/Addis_Ababa/ (last access: 21 July 2020), as recommended by the NDACC/IRWG (Network for the Detection of Atmospheric Composition Change/ Infrared Working Group). WACCM is a numerical model developed at the National Center for Atmospheric Research (NCAR). Daily profiles of pressure and temperature were taken from the National Centers for Environmental Prediction (NCEP) (http://www.cdc.noaa.gov/data/gridded/data.ncep.reanalysis.html) (last access: 21 July 2020) reanalysis and are made available through the NASA Goddard Space Flight Center automailer. The spectroscopic parameters were taken from the HITRAN (high-resolution transmission molecular absorption) database, version 2008, for N2O, and 2009 for H2O (Rothmann et al., 2009), and the updated HITRAN 2012 for CO, CH4, and NO2 (Rothmann et al., 2013) were used during retrieval of CH4 and N2O.
Both methane (CH4) and nitrous oxide (N2O) are well mixed in the troposphere, and their VMR decreases with height and becomes negligible with no variation above 55 km. The vertical variability in N2O and CH4 in the lower stratosphere is characterized by a somewhat higher vertical gradient as compared to the other layers. Both profiles and columns of CH4 and N2O over Addis Ababa have been obtained by fitting five and four selected spectral regions for CH4 and N2O, respectively. Here, spectral microwindows used for the retrieval are selected such that they contain absorption features of the target species along with a minimal number of interfering absorption lines; and they have been adopted from different sources (Senten et al., 2008; Sussmann et al., 2011; Meier et al., 2004). Microwindows, target, and interfering species used in this paper are summarized in Table 1. However, the microwindows are somewhat modified for the Addis Ababa FTIR site from the windows recommended by NDACC, as mentioned in a result of work done within the EU UFTIR projects (http://projects.amap.no/project/uftir-time-series-of-upper-free-troposphere-observations-from -a-european-ground-based-ftir-network/, last access: 21 July 2020). The choice of these microwindows over those recommended by NDACC is due to their improved performance as indicated in the Supplement. The main criterion for selection of these microwindows is high sensitivity to methane and low interference from other gases. Our tests have shown that these windows are still appropriate for the Addis Ababa site. Methane and nitrous oxide vertical profiles over Addis Ababa have been obtained by fitting five and four microwindows, respectively. The retrieved state vector contains volume mixing ratios of the target gas defined in 41 layers of the tropical atmospheric conditions.
PROFFIT includes various retrieval options such as scaling of a priori profile, the Tikhonov–Phillips method (Phillips, 1962; Tikhonov, 1963), or the optimal estimation method (Rodgers, 2000). In this study, an optimized retrieval strategy for Addis Ababa has been established for CH4 and N2O by applying it first to single spectra, as test cases, and later routinely to the full set of measurements. Partly, the strategy to optimally retrieve the total columns of CH4 and N2O is to search for a set of spectra microwindows. A constraint, initial guess, and a priori profile are chosen in such a way that all the structures visible in the retrieved distributions originate from the measurements and are not artifacts due to any constraints. At the Addis Ababa site, we did not use the a priori covariance matrix as an optimal estimation. However, the Tikhonov-type L1 regularization method (Sussmann et al., 2009) on a logarithmic scale is used during the retrieval of CH4 and N2O. The retrieval is performed on a fine vertical grid from 2.45 to 85 km and is stabilized by a first-order Tikhonov constraint, R=αLTL, where α is the strength of the constraint, and L1 is the first-order derivative (Borsdorff et al., 2014), which smooths the solution without biasing it towards the a priori profile. The parameter determines the weight of regularization, and it is also important to choose it to be appropriate to the problem. One way to fix this parameter is the L-curve method (Hansen, 1992). The regularization strength α, is determined by finding a trade-off between the number of degrees of freedom (a measure of the amount of information in methane and nitrous oxide retrieval), which is given by the trace of the averaging kernel matrix and the noise-induced error (Rodgers, 2000). A regularization strength α of 2.5×10⁴ was found optimum for CH4 retrieval.
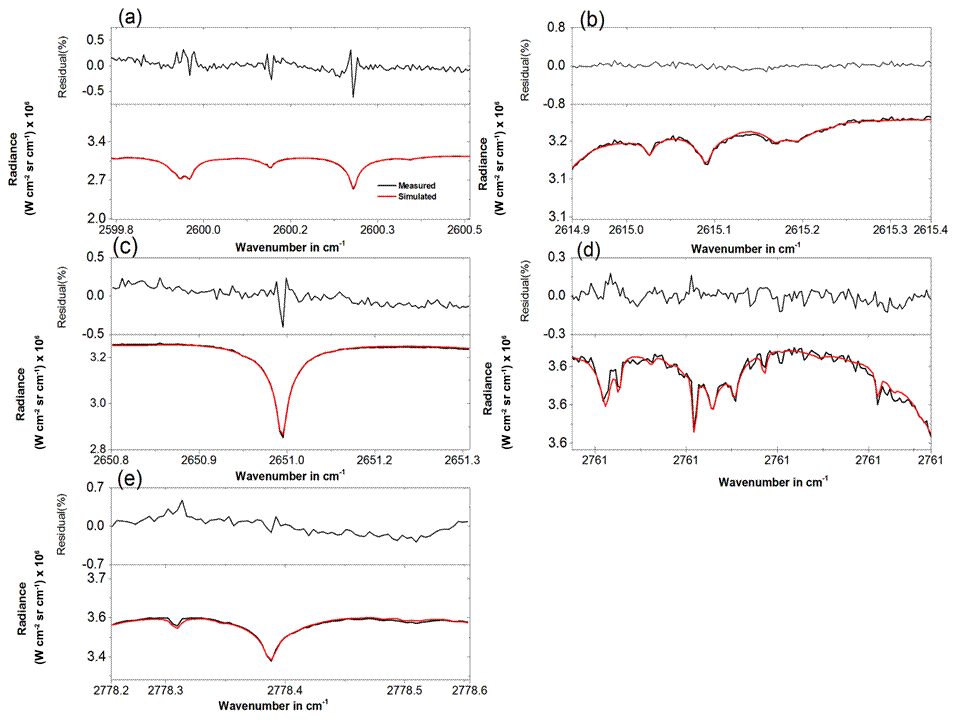
Figure 1The five spectral microwindows used for retrieval of CH4, with the measured spectrum in red, simulated spectrum in black, and residuals on top of the respective microwindow for spectrum recorded on 26 February 2013; time: 10 h 17 m 15 s; root mean square (rms) =0.1189; solar zenith angle (SZA) ; optimal path difference (OPD) =116.1; DOF =2.23; field of view (FOV) =2.27 mrad.
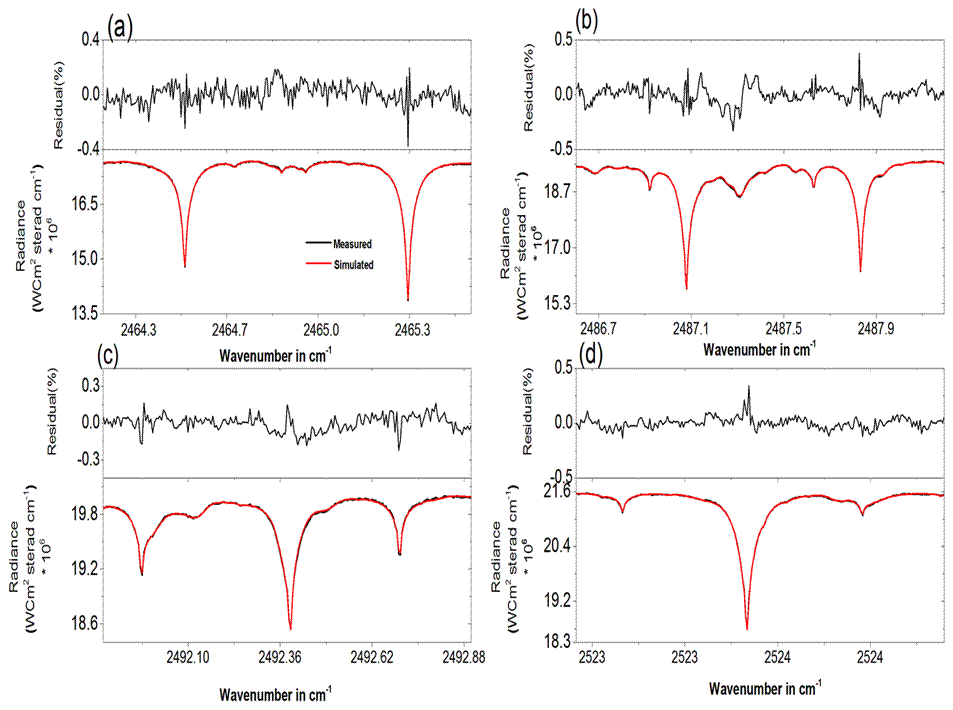
Figure 2 The four spectral microwindows used for retrieval of N2O, with the measured spectrum in red, simulated spectrum in black, and residuals on top of the respective microwindow for spectrum recorded on 31 December 2009; time: 9 h 3 m 27 s; solar zenith angle (SZA) ; optimal path difference (OPD) =100; DOF =3.35.
The spectral fit and residual between measured and simulated spectra at five microwindows for CH4 are shown in Fig. 1 for spectra recorded on 26 February 2013. Four microwindows are used for N2O and depicted in Fig. 2 for spectra recorded on 31 December 2009. The last column of Table 1 provides typical values for the degrees of freedom for signal (DOFs), and it indicates the possible independent pieces of information for the target gases distribution. The magnitude of residuals found from spectral fits span a range from a maximum of +0.25 % to −0.64 % for CH4 and +0.34 % to −0.34 % for N2O. Hence, the residuals indicate systematic errors in the spectroscopic line data used to derive the concentration of CH4 and N2O. Therefore, the fits are good with an averaged root-mean-square residual of 0.12 % for the microwindows selected in the retrieval of CH4.
The quality of FTIR measurements during time period of May 2009–February 2011 for ozone has been revealed by Takele Kenea et al. (2013), whereas the measurements quality for CH4 and N2O has also been assessed through the sensitivity, DOFs, and the contribution of different error sources on measurements, in addition to the spectral residuals that indicate systematic errors in the spectroscopic line data.
3.2 Vertical resolution and sensitivity assessment
The spectral resolution of a measurement affects the amount of vertical information derived from the spectral line shape of a measured species (Livesey et al., 2008). Figure 3 shows averaging kernel matrices for the retrieval of the vertical profiles of CH4 and N2O mixing ratios, respectively, from the FTIR measurements. The rows of the averaging kernel matrices at selected altitudes which indicate the sensitivity of retrieved CH4 and N2O values at the level to true mixing ratios are also presented. The dotted line represents the sum of all the rows of the averaging kernel, which represents the overall sensitivity of the FTIR measurement to observe CH4 and N2O.
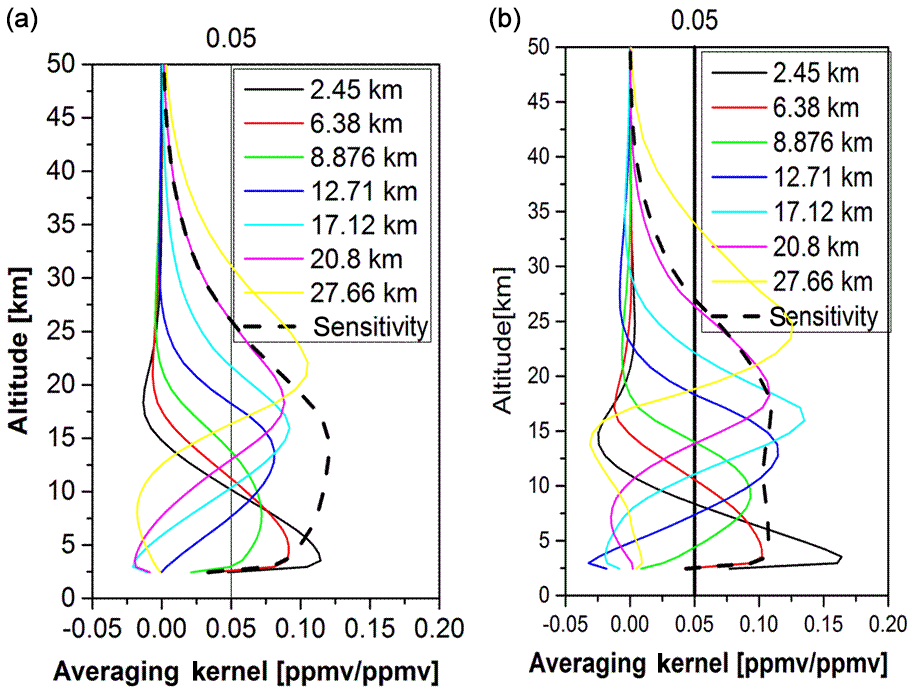
Figure 3 Sensitivity analysis of the retrieved profiles of (a) CH4 and (b) N2O at Addis Ababa using the selected rows of the averaging kernels as a function of altitude. The dotted lines are the sum of the rows of averaging kernels for a spectrum measured on 26 February 2013 for CH4 and 31 December 2009 for N2O.
Figure 3 shows a strong sensitivity in the altitude range of the troposphere and lower stratosphere, i.e., 2.45 up to 27 km for the retrieval of CH4 and N2O. Thus, the sum of rows of A for all the retrieval values of CH4 and N2O is greater than 0.5 up to 27 km. The trace of the row-averaging kernel for CH4, which is 2.25 for the spectra recorded on 26 February 2013 and 2.11±0.06 for all the data, implies that partial columns representing two different altitude ranges in the atmosphere can be obtained from the observations of CH4 in tropical atmospheric conditions. Similarly, the trace of the averaging kernel for N2O is 3.38±0.15 on for all the data.
The amplitude of the averaging kernels indicates the sensitivity of the retrieval, and the full widths at half maximum (FWHM) indicate the vertical resolution of the corresponding layer. We also ignore the altitude range where the resolution of the instrument is beyond 20 km, which has been computed using the reciprocal of the diagonal values of averaging kernels and multiplying by the intervals of the layers as reported in Rinsland et al. (2005). The vertical resolution is less than 20 km for altitudes below around 27 km (not shown).
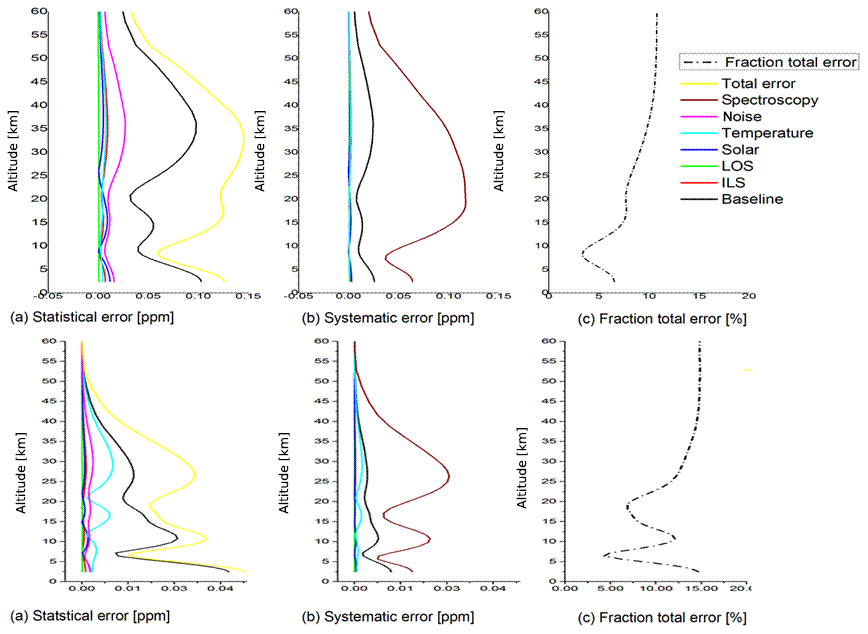
Figure 4 Estimated errors for the profiling retrieval of CH4 (top) and N2O (bottom) over Addis Ababa: (a) statistical (random) errors (b) systematic errors of parameter listed in the legends, and (c) fractional total error (%).
3.3 Error estimation
The error calculations conducted here are based on the error estimation package incorporated in the PROFFIT retrieval algorithm that was developed based on the analytical method suggested by Rodgers (2000). The quantified sources of errors are temperature, measurement noise, instrumental line shape, solar lines, line of sight, zero level baselines offset, and spectroscopy. It has been observed that baseline and atmospheric temperature uncertainties are the leading contribution to the total uncertainty. Details about the evaluation of individual contributions to the error budget are provided in Senten et al. (2008). Figure 4 shows the statistical (random) error, systematic error, and total fractional error (left to right) for CH4 (top) and N2O (bottom) retrieval from a spectrum recorded on 26 February 2013 and 31 December 2009, respectively. It can be noted from Fig. 4 that the main systematic error source is the uncertainty in spectroscopic parameters, whereas the major statistical error source is the baseline. Random errors are dominated by the baseline offset uncertainty and the measurement noise in the troposphere. Total estimated random error due to parameter uncertainties is depicted as a dark-yellow line (see Fig. 4a). The total statistical error of CH4 retrieval is about 0.07 ppmv (4.4 %) in the lower troposphere and about 0.04 ppmv (2.25 %) in the upper troposphere/lower stratosphere (UT/LS) region. Concerning systematic errors, spectroscopic parameters are the dominant uncertainty sources, and estimated total systematic error is about 0.05 ppmv (3.5 %) and 0.1 ppmv (7.2 %) for the lower troposphere and the UT/LS region, respectively.
Figure 4a–c (bottom panels) show the estimated random and systematic errors for the N2O profile retrieved from FTIR. Random errors are dominated by the baseline offset uncertainty and temperature in the troposphere. The total statistical errors in the middle and upper troposphere are between 0.009 (3.5 %) and 0.03 ppmv (9 %), with its major contribution from the baseline. Spectroscopic parameters and baselines are the dominant uncertainty sources for systematic errors. The estimated total systematic error is less than 0.025 ppmv (8 %) at altitudes below 22 km. The total fractional error of CH4 and N2O retrieved from ground-based FTIR has been shown in the last column of Fig. 4. Fractional error of CH4 is less than 10 % at altitudes below 27 km with minimum fractional error of 4 % at middle troposphere. On the other hand, the total fraction error of N2O retrieval is less than 13 % at altitudes below 27 km, with a minimum value of 4 % at 6 km and 7.5 % at 17 km.

Figure 5 Partial columns of (a) CH4 and (b) N2O gases over Addis Ababa in the altitude range of 2.45 to 27 km.
Time series partial-column amount
Concentrations of CH4 and N2O were derived from 166 spectra of NDACC filter 3 recorded from May 2009 to March 2013. Figure 5 shows the time series of the retrieved total column amounts (in molecules cm−2) of CH4 and N2O obtained from the Addis Ababa FTIR measurement site from 2009 to 2013. The mean total column amounts of CH4 and N2O measured at Addis Ababa are 2.9×10¹⁹ molecules cm and 5.23×10¹⁸ molecules cm, respectively. Due to sensitivity of the observation in measuring CH4 and N2O trace gases being limited to an altitude of around 27 km as explained using averaging kernel row of the measurement, the mean partial column of CH4 and N2O within the sensitivity range of the instrument are determined as 2.85×10¹⁹ molecules cm and 5.16×10¹⁸ molecules cm, respectively.
The sensitivity from the averaging kernel analysis is used to determine the upper altitude limit up to which CH4 and N2O data from ground-based FTIR can reasonably be used. The DOFs within these partial-column limits are about 1.03 and 1.27 for CH4 and N2O, respectively. Error analysis indicates that the statistical error accounts for 2.3 % in the total column amounts of CH4 and 2.0 % in total columns of N2O. Similarly, the systematic error accounts for 2.1 % in the total columns of CH4 and 2.26 % in the total columns of N2O. Generally, the overall contribution of both statistical and systematic errors to the total error during the retrieval of CH4 and N2O from ground-based FTIR are 3.1 % and 3 %, respectively.
4.1 Michelson Interferometer for Passive Atmospheric Sounding (MIPAS)
Michelson Interferometer for Passive Atmospheric Sounding (MIPAS) is a Fourier transform spectrometer for the detection of limb emission spectra from the upper atmosphere to the lower thermosphere and is designed for global vertical profile measurement of many atmospheric trace constituents relevant to the atmospheric chemistry, dynamics, and radiation budget of the middle atmosphere. The vertical resolution of MIPAS ranges from 2.5 to 7 km for CH4 and from 2.5 to 6 km for N2O in the reduced-resolution period (Plieninger et al., 2015). In this study, we have used the reduced spectral resolution Institute of Meteorology and Climate Research/Instituto de Astrofísica de Andalucía (IMK/IAA) MIPAS methane and nitrous oxide data products V5R_CH4_224 and V5R_N2O_224 (Plieninger et al., 2016, 2015). MIPAS profile points, with the diagonal element of the averaging kernels above 0.03 and the visibility flag of 1, have been used (Plieninger et al., 2016).
4.2 Microwave Limb Sounder (MLS)
The Earth Observing System (EOS) Microwave Limb Sounder (MLS) is one of four instruments on NASA's EOS Aura satellite, launched on 15 July 2004, into a near-polar, sun-synchronous orbit at 705 km altitude (Schoeberl et al., 2006). It measures N2O in spectral region, 640 GHz from the stratosphere into upper troposphere (Waters, 2006). Moreover, spatial coverage of this instrument is nearly global ( S to 82∘ N), and individual profiles are spaced horizontally by 1.5∘ or 165 km along the orbit track. Roughly, the satellite covers these latitudinal bands with 15 orbits per day or around 3500 profiles per day with vertical resolution of 4–6 km for N2O. This instrument ascends in the equatorial region at local time of around 13:45 LT.
MLS N2O data set has been used to validate the ground-based FTIR measurements. However, methane (CH4) data are derived using coincident measurements of atmospheric water vapor (H2O), carbon monoxide (CO), and nitrous oxide (N2O) from the EOS MLS instrument on the NASA Aura satellite, and details are given in Minschwaner and Manney (2015). Selection criteria were implemented as stated in Livesey et al. (2013). More details regarding the MLS experiment and data screening are provided in the above references in detail and at https://mls.jpl.nasa.gov/data/datadocs.php (last access: 21 July 2020). MLS N2O v2.2 has been validated, and its precision and accuracy is in Lambert et al. (2007). The authors reported that MLS N2O precision is 24–14 ppbv (9 %–41 %) and the accuracy is 70–3 ppbv (9 %–25 %) in the pressure range of 100–4.6 hPa.
4.3 Atmospheric Infrared Sounder (AIRS)
Operating in nadir sounding geometry, the Atmospheric Infrared Sounder (AIRS) on board the Aqua satellite launched into Earth orbit in May 2002 (Chahine et al., 2006). AIRS is a medium-resolution infrared grating spectroradiometer, and a diffraction grating disperses the incoming infrared radiation into 17 linear detector arrays comprising 2378 spectral samples. The satellite crosses the Equator at approximately 01:30 and 13:30 local time, resulting in near-global coverage twice a day. AIRS has 2378 channels that cover from 649 to 1136, 1217 to 1613, and 2169 to 2674 cm−1. It also measures trace gases such as O3, CO, and to some extent CO2. AIRS CH4 and N2O retrievals have been characterized and validated by Xiong et al. (2008, 2014), respectively. Both AIRS and MLS data were obtained through the Goddard Earth Sciences Data and Information Services Center (https://daac.gsfc.nasa.gov/, last access: 21 July 2020).
5.1 Comparison methodology
The quality of FTIR CH4 and N2O for a period that covers May 2009 to March 2013 is assessed through comparison with data from MIPAS (May 2009 to December 2010), MLS (May 2009 to March 2013), and AIRS (May 2009 to March 2013) sensors on board satellites. MIPAS, MLS, and AIRS retrievals were used after averaging data obtained within coincident criteria of of latitude and of longitude from the ground-based FTIR site in Addis Ababa and within time difference of ±24 h. The more stringent latitudinal criterion has proven to be a good choice for all comparisons, since latitudinal variations are, in general, more pronounced than longitudinal ones (Takele Kenea et al., 2013). These criteria yielded 29, 77, and 118 d of coincident measurements between FTIR and MIPAS, MLS, and AIRS, respectively.
The ground-based FTIR measurements of CH4 and N2O have been validated at different locations (e.g., Senten et al., 2008). The satellite data (MIPAS, MLS, and AIRS) have a considerably better vertical resolution than ground-based FTIR profiles due to observation geometry, spectral windows, and measurement techniques. Thus, analysis of the comparison between volume mixing ratio values derived from FTIR and MIPAS were performed for the data sets collected on May 2009 to December 2010. Furthermore, the comparison of FTIR (CH4 and N2O) with MLS (CH4 and N2O) and AIRS (CH4) for the time period of May 2009 to February 2013 has also been applied to assess quality of the data derived from FTIR. Hence, the profiles from MIPAS, MLS, and AIRS have been smoothed to make a comparison with FTIR as satellite observations attain better vertical resolution. Therefore, the satellite measurement profiles are smoothed using the FTIR averaging kernels of individual species obtained from the ground-based FTIR retrieval by applying the procedures reported in Rodgers and Connor (2003) and given as
where xsi is the smoothed profile, xa and A represent the a priori and averaging kernel for CH4 and N2O obtained from the ground-based FTIR instrument, respectively, and xi is the retrieved profile obtained from satellite measurements after we interpolated it to the FTIR grid spacing. We also calculate the following error statistics that can characterize the features of the instruments and parameters to be observed, such as the bias between the instruments using the difference (absolute or relative) in the daily mean profile. The difference (absolute or relative) at each altitude layers of a pair of profile is calculated using
The mean squares error can be expressed as
The mean difference (absolute or relative) for a complete set of coincident pair profiles obtained from the ground-based FTIR and the correlative satellites is expressed as
where δi(z) is the difference (absolute or relative), N(z) is the number of coincidences at z, and FTIRi(z) is the FTIR VMR at z and the corresponding xsi(z) volume mixing ratio derived from satellite instruments. The standard deviation from the mean differences (absolute or relative) σdiff(z) is important to partially characterize the measurement error. As reported in von Clarmann (2006), some use debiased standard deviation, which measures the combined precision of the instruments instead of the standard deviation of the mean differences.
where δi(z) is the difference (absolute or relative) for the ith coincident pair calculated using Eq.( 4). The statistical uncertainty in the mean differences (absolute or relative), which is standard error of the mean (SEM), is the quantity used to judge the statistical significance of the estimated biases, and it can be expressed in terms of the standard deviation of the mean as follows:
One can also conduct the comparison of FTIR and MIPAS using partial columns obtained from both FTIR and smoothed MIPAS CH4 and N2O. Hence, the relative difference between ground-based FTIR and smoothed MIPAS partial columns of CH4 and N2O by taking into account the lower altitude limit of MIPAS observations and upper limit of ground-based FTIR sensitivity has been calculated using
where PC is a partial column of FTIR and the corresponding satellite measurements. Here in this paper coincidence and smoothing errors are not taken into account in the full error analysis of the comparisons between remotely sensed data sets (von Clarmann, 2006). Hence, we focus on the random uncertainties in each instrument (Combined random error) that has been used to evaluate the comparison uncertainty (standard deviation of the difference).
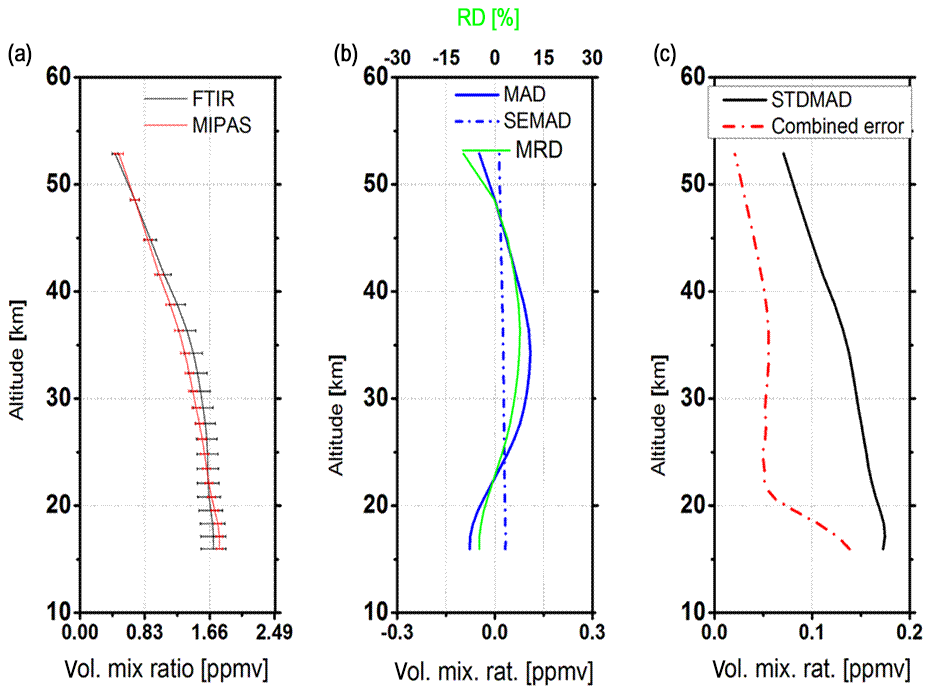
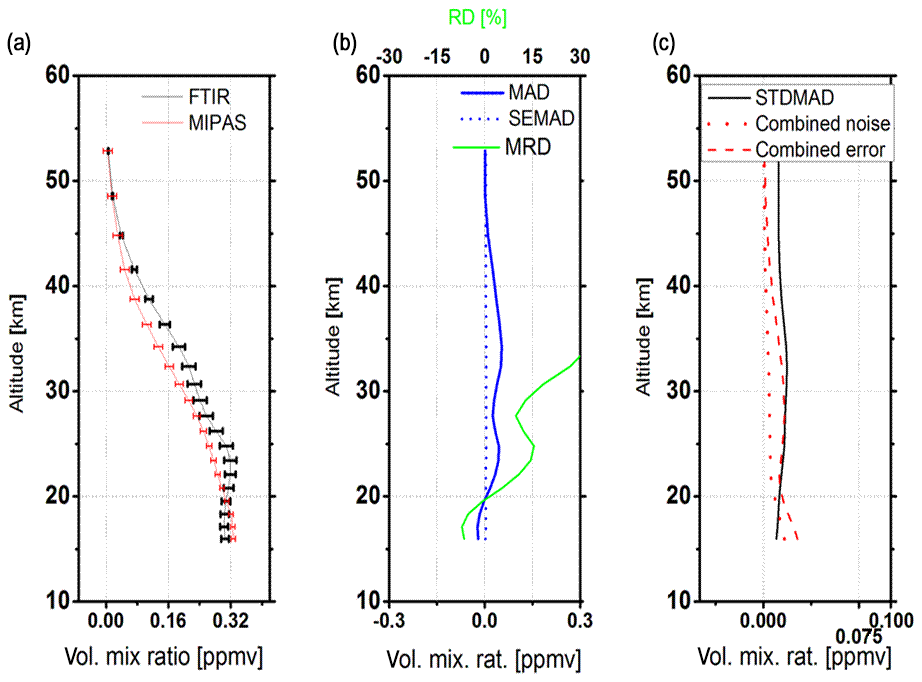
Figure 6 Comparison of CH4 from MIPAS reduced resolution (V5R_CH4_224) and FTIR. (a) Mean profiles of MIPAS (red) and FTIR (black) and their standard deviation (horizontal bars). (b) Mean difference FTIR minus MIPAS (MAD, solid blue), standard error of the difference (SEMAD; dotted blue), and mean relative differences FTIR minus MIPAS relative to their average (MRD; green, upper axis). (c) Combined mean estimated statistical error of the difference (combined error, dotted red, contains MIPAS instrument noise error, and FTIR random error budget) and standard deviation of the difference (STDMAD; solid black).
5.2 Comparison of FTIR CH4
In Fig. 6, mean profiles, mean differences, and estimated errors versus deviations of the difference between FTIR and MIPAS_CH4_224 mixing ratios are shown. The comparison has been made using 29 coincident data for a time period between November 2009 and December 2010. Figure 6b indicates a negative bias of −4.8 % at around 16 km and 2 % at 22 km. Between 23 and 27 km, the FTIR value is higher than MIPAS values. The difference increases with altitude from 23 to 27 km (4.6 %) with a maximum at 27 km. A large negative bias in FTIR CH4 is obtained; i.e., FTIR CH4 values are lower by 0.07 (4.8 %) to 0.04 ppmv (2.2 %).
Figure 6a indicates that the standard deviation of the mean differences is larger than the combined random error of the two instruments throughout the altitude range. For instance, it is twice the combined standard deviation at altitudes above 20 km and less below 20 km, which indicates the underestimation of random errors from one or both of the instruments. In addition, the overestimation of standard deviation of the difference may result from not taking all the error budget of MIPAS into account, and the spatial and temporal criteria sets used to collect the coincidence data of MIPAS can create a discrepancy as well. The natural variations in the methane have also contributed to the overestimation of a standard deviation of the difference, as biases vary with seasons as reported in Payan et al. (2009).
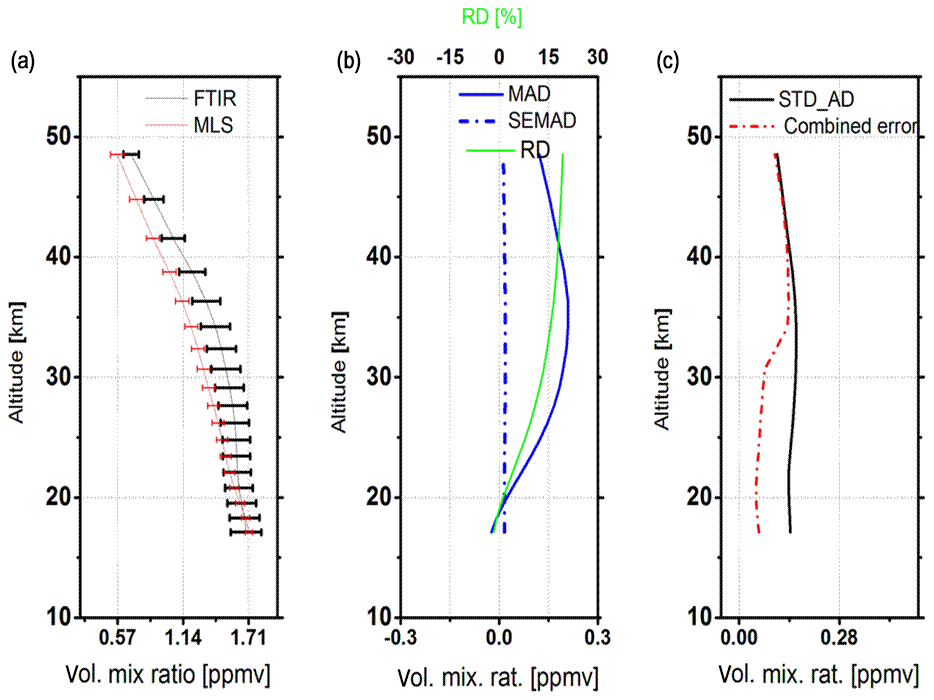
Figure 7b shows the comparison between FTIR CH4 profiles and CH4 derived from MLS measurements of atmospheric water vapor (H2O), carbon monoxide (CO), and nitrous oxide (N2O) and indicates that no significant bias in FTIR CH4 data is present between 18 and 20 km. In the tropopause layer, the comparison indicates a negative bias of −1.7 % at 17 km; i.e., the FTIR value is slightly high. FTIR CH4 values are lower at altitudes between 20 and 27 km with a bias of below 11 %, which is maximum at 27 km or on average by 0.12 ppmv (6.7 %) between 20 and 27 km. The bias below 19 km and above 27 km can not be explained by the systematic errors of FTIR as the bias is larger than the systematic errors of FTIR. However, the latter, which is for altitudes above 27 km, is also out of the sensitivity ranges of FTIR. Furthermore, the standard deviation of the difference is larger than the combined random errors of the instruments. A bias in the altitude range of 20 to 27 km can be explained by the systematic error of FTIR.
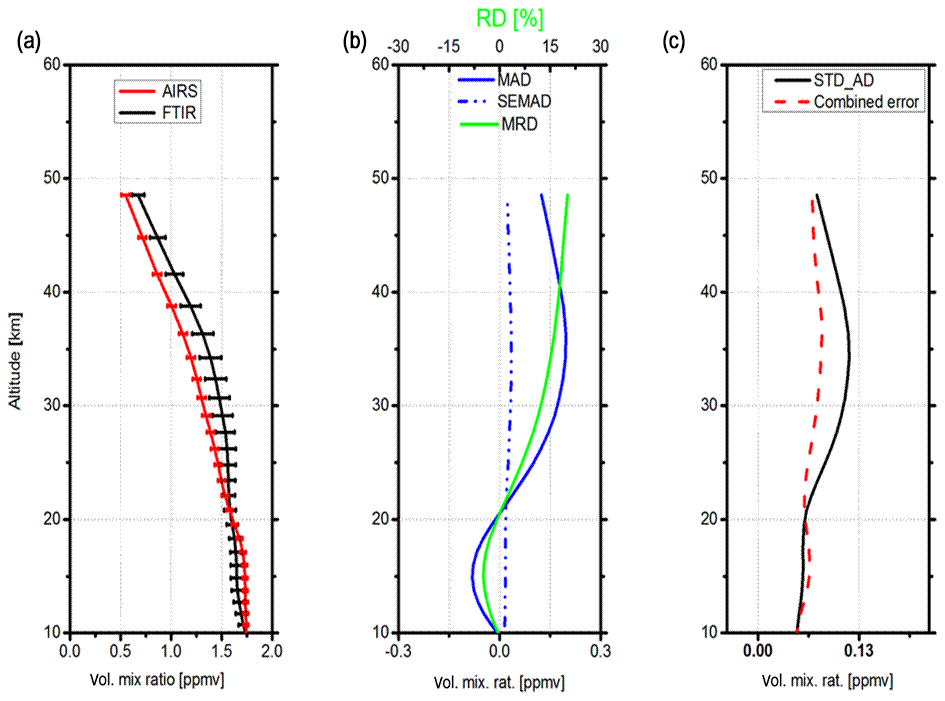
In Fig. 8 mean profiles, differences, and estimated error versus deviation of the difference between FTIR and AIRS mixing ratios are shown. The largest negative bias is found at altitudes between 11 and 19 km, with a maximum difference of −0.08 ppmv at around 15 km. A negative bias of the AIRS mixing ratio of CH4 is higher than that the FTIR as shown in Fig. 8. A positive bias existed at altitudes between 7 and 9 km, and similarly, it also has been shown at altitudes between 21 and 27 km, with a maximum value at around 27 km, and its bias is 0.14 ppmv (9 %). The standard deviation of the difference agrees with the combined random error at altitudes below 20 km, and it overestimates above 20 km.
Table 2Averaged statistical means (M) and standard deviations (SD) of the relative differences (%) defined in the altitude range of 17–20 and 21–27 km. The numbers of coincidences (N) within a spatiotemporal criterion of of latitude and of longitude and time difference of ±24 h are selected for intercomparison. This is for FTIR CH4 and N2O with the corresponding other instruments (stated in second column).
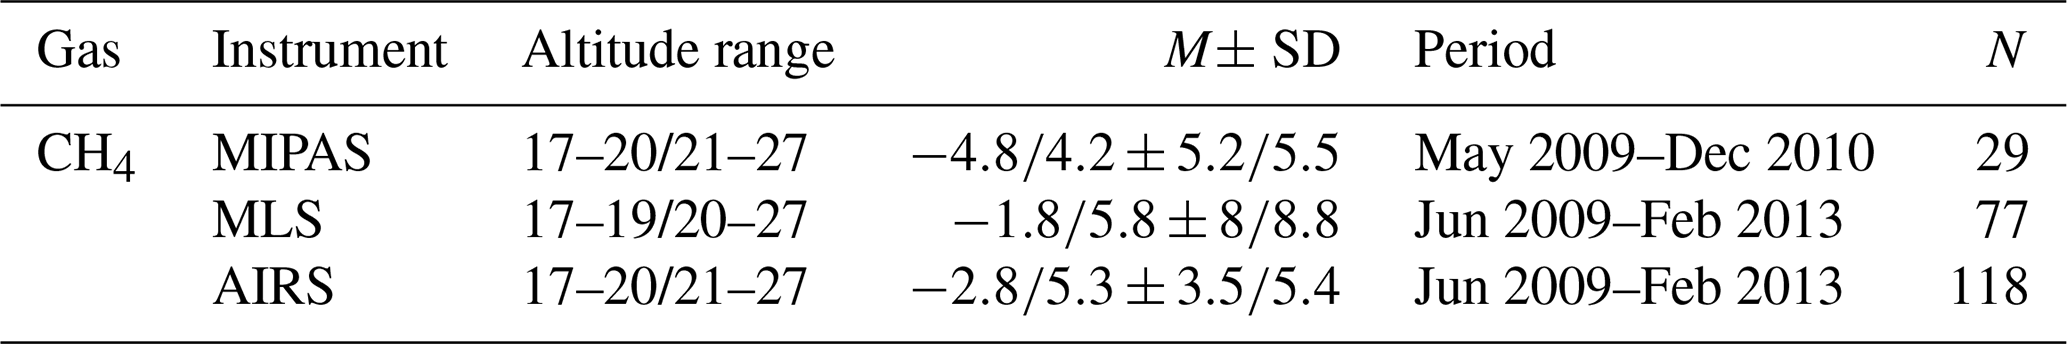
In all the comparisons of FTIR CH4 with data from MIPAS, MLS, and AIRS, sensors on board satellites indicate a negative bias below 21 km and a positive bias above 21 km, with similar bias of not higher than 5.8 % in the altitude range of 21–27 km (see Table 2.). The volume mixing ratios derived from the satellite are higher at altitudes lower than 21 km.
5.3 Comparison of FTIR N2O
FTIR N2O mixing ratio MIPAS comparison results are shown in Fig. 9, where it represents the mean profiles, mean absolute difference, and standard deviation of the mean along with the combined errors of the two instruments. Mean profiles of FTIR show a maximum at around 23 km and decrease smoothly as altitude increases, and that of the MIPAS_N2O_224 value starts to decline starting from the lowermost stratosphere.
Comparison of FTIR N2O profiles to MIPAS (V5R_N2O_224) measurements (see Fig. 9b) indicates that FTIR value is higher than the MIPAS above 20 km, and the maximum mean absolute difference in N2O is 15 % (0.04 ppmv) at around 24 km, while the FTIR value is less at altitudes below 20 km, with a maximum difference of −7 % (−0.02 ppmv) at around 17 km. The bias at 19 km is not statistically significant, as the standard error of the mean is larger than the bias. In the remaining altitudes, standard error of the mean is smaller than the mean bias, and the biases are statistically significant. Since, the bias at altitudes between 20 and 27 km is smaller than the FTIR systematic errors, the bias could be explained in terms of systematic uncertainties in FTIR (see Fig. 4b, bottom panel). The standard deviation of the difference is larger than the combined error of the two instruments at altitudes above 20 km (see Fig. 9c), and the standard deviation of the difference agrees with the estimated combined random error in the altitude ranges between 20 and 27 km. For the altitudes below 20 km, the estimated combined random error is overestimated.
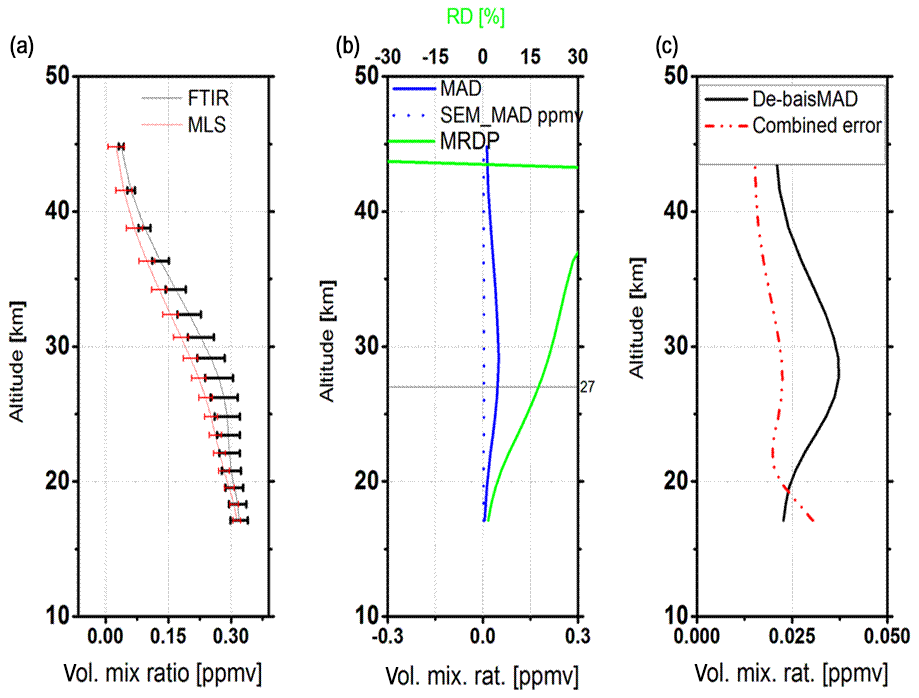
Figure 10a represents the mean profiles of N2O derived from the coincident pairs of FTIR and MLS. Throughout the whole altitude range, the value derived from FTIR is overestimated (relative to MLS). The FTIR values of N2O are larger than the MLS value of N2O by a factor of 1.2 and 1.1 at around 21 and 27 km, respectively. The mean relative difference in FTIR and MLS N2O value increases as altitude increases; its value is less than 18.6 % at altitudes below 27 km, and its bias below 22 km is less than 8 %, which can be explained in terms of the systematic error of FTIR N2O. Thus, the positive bias is statistically significant as the mean difference in the comparison is larger than the standard error of the mean.

Figure 11Time series of (a) CH4 and (b) N2O partial-column comparisons for the altitude range of 15–27 km. Right panels: ground-based FTIR (stars) and MIPAS (V5R_CH4_224 and V5R_N2O_224) (inverted triangles) partial columns. Left panels: relative differences between ground-based FTIR and MIPAS (V5R_CH4_224 and V5R_N2O_224) partial columns.
5.4 Comparisons of partial columns
For the partial-column (PC) comparisons of FTIR with MIPAS, it is vital to take into account the lower altitude limit of MIPAS, which is 15 km for both target gases. The ground-based FTIR sensitivity is used to determine the upper altitude limit, which is reasonable up to ∼27 km for CH4 and N2O in the tropical atmospheric condition. Therefore, the PC that we use in the comparison is limited to the altitude range of 15–27 km. The DOFs within these partial columns' limit are about 1.0 and 1.2 for CH4 and N2O, respectively.
Figure 11 shows the time series of the partial columns and relative differences of CH4 (a) and N2O (b). The partial-column comparison of CH4 between values of FTIR and MIPAS revealed a mean error of −5.5 %, mean squares error of 7.4 %, and standard deviation from the mean error of 5 %. Similarly, N2O values between FTIR and MIPAS revealed a mean error of 0.5 %, mean square error of 3.7 %, and standard deviation from mean error of 3.8 %; in the latter case a significant positive bias is observed, and in CH4 negative bias was obtained.
The vertical profiles and partial columns of CH4 and N2O over Addis Ababa, Ethiopia, were derived from ground-based FTIR. The mean partial column of CH4 and N2O within the sensitivity ranges of the instrument, which is from the surface to around 27 km, is determined as 2.85×10¹⁹ molecules cm and 5.16×10¹⁸ molecules cm, respectively. Furthermore, the overall contribution of both statistical and systematic errors, i.e., a total error of CH4 and N2O from ground-based FTIR, is 3.1 % and 3 %, respectively.
From comparison of FTIR CH4 and MIPAS_CH4_224 products, a statistically significant maximum negative bias of −4.8 % at an altitude of 15 km that extends to 21 km and maximum positive bias of 4.6 % at an altitude 27 km were obtained. The largest negative bias is found at altitudes between 11 and 19 km, with a maximum difference of −0.08 ppmv (−4.8 %) at around 15 km, and a positive bias of less than 0.14 ppmv (9 %) is found at altitudes between 21 and 27 km, with a maximum value at around 27 km in the FTIR CH4 comparison with AIRS. On the other hand, from a comparison of CH4 from ground-based FTIR and MLS version 3.3, we obtained a significant positive average bias of 0.12 ppmv (6.7 %) in the altitude range of 20–27 km and a negative bias of −1.7 % at 17 km. In the case of FTIR N2O and MIPAS_N2O_224, a significant positive bias of less than 15 % in the altitude range of 22–27 km with a maximum value at around 25 km and a negative bias of −7 % at 17 km has been obtained. A positive bias of less than 18.6 % for altitudes below 27 km is noted for N2O between FTIR and MLS, and its bias below 22 km is less than 8 %, which can be explained in terms of the systematic error of FTIR N2O.
In general, the retrieved CH4 and N2O VMR and column amounts from Addis Ababa, tropical site, exhibited very good agreement with all coincident satellite observations in the altitude ranges of 17–27 km with a positive mean relative difference within 20–27 km and negative below 20 km. In addition, the bias obtained from the comparison and precision of the FTIR measurements is also comparable. The intercomparisons of CH4 and N2O VMR from ground-based FTIR with data from MIPAS, MLS, and AIRS sensors on board satellites reported in this work establish main features that characterize the FTIR instruments at Addis Ababa. The FTIR data can be used in further scientific studies as it represents a unique environment of tropical Africa, a region poorly investigated in the past. Furthermore, the results of this intercomparison for FTIR observations with the satellites can ensure that FTIR can now be used to validate satellite missions. Thus, for the FTIR data, it is anticipated that the use of the data in further scientific studies may provide some insight into the processes that govern chemical transport and chemistry in the atmosphere as well as sources of green gases in this part of the globe.
The FTIR Data at Addis Ababa is available on request from the authors. All other data sets are publicly available at archives indicated in the paper.
The supplement related to this article is available online at: https://doi.org/10.5194/amt-13-4079-2020-supplement.
Conceptualization was by TYB and GMT; investigation was by TYB, GMT, TB, FH, and GPS; data processing was done by TYB; the methodology was by TYB, GMT, TB, FH, and GPS; writing and reviewing was done by TYB, GMT, TB, FH, and GPS.
The authors declare that they have no conflict of interest.
We are grateful to Goddard Space Flight Center and WACCM for providing temperature, pressure, and a priori profiles of all molecules. We greatly acknowledge the MIPAS science teams for providing data used in this study. Finally,the first author would like to thank Mekelle and Addis Ababa universities for the sponsorship of PhD study during which this work is conducted.
This paper was edited by Helen Worden and reviewed by two anonymous referees.
Barthlott, S., Schneider, M., Hase, F., Blumenstock, T., Kiel, M., Dubravica, D., García, O. E., Sepúlveda, E., Mengistu Tsidu, G., Takele Kenea, S., Grutter, M., Plaza-Medina, E. F., Stremme, W., Strong, K., Weaver, D., Palm, M., Warneke, T., Notholt, J., Mahieu, E., Servais, C., Jones, N., Griffith, D. W. T., Smale, D., and Robinson, J.: Tropospheric water vapour isotopologue data (, , and HD16O) as obtained from NDACC/FTIR solar absorption spectra, Earth Syst. Sci. Data, 9, 15–29, https://doi.org/10.5194/essd-9-15-2017, 2017. a, b
Borsdorff, T., Hasekamp, O. P., Wassmann, A., and Landgraf, J.: Insights into Tikhonov regularization: application to trace gas column retrieval and the efficient calculation of total column averaging kernels, Atmos. Meas. Tech., 7, 523–535, https://doi.org/10.5194/amt-7-523-2014, 2014. a
Boucher, O., Friedlingstein, P., Collins, B., and Shine, K. P.: The indirect global warming potential and global temperature change potential due to methane oxidation, Environ. Res. Lett., 4, 044007, https://doi.org/10.1088/1748-9326/4/4/044007, 2009. a
Chahine, M., Pagano, T., Aumann, H., Atlas, R., Barnet, C., Chen, L., Divakarla, M., Fetzer, E., Goldberg, M., Gautier, C., Granger, S., Irion, F. W., Kakar, R., Kalnay, E., Lambrigtsen, B., Lee, S., Marshall, J. L., McMillan, W., McMillin, L., Olsen, E. T., Revercomb, H., Rosenkranz, P., Smith, W., Staelin, D., Strow, L., Susskind, J., Tobin, D., and Wolf, W.: The Atmospheric Infrared Sounder (AIRS): improving weather forecasting and providing new insights into climate, B. Am. Meteorol. Soc., 87, 891–894, https://doi.org/10.1175/BAMS-87-7-891, 2006. a
Collins, W. J., Sitch, S., and Boucher, O.: How vegetation impacts affect climate metrics for ozone precursors, J. Geophys. Res., 115, D23308, https://doi.org/10.1029/2010JD014187, 2010. a
Crevoisier, C., Nobileau, D., Armante, R., Crépeau, L., Machida, T., Sawa, Y., Matsueda, H., Schuck, T., Thonat, T., Pernin, J., Scott, N. A., and Chédin, A.: The 2007–2011 evolution of tropical methane in the mid-troposphere as seen from space by MetOp-A/IASI, Atmos. Chem. Phys., 13, 4279–4289, https://doi.org/10.5194/acp-13-4279-2013, 2013. a
Frankenberg, C, Bergamaschi, P., Butz, A., Houweling, S., Meirink, J. F., Notholt, J., Petersen, A. K., Schrijver, H., Warneke, T., and Aben, I.: Tropical methane emissions: A revised view from SCIAMACHY onboard ENVISAT, Geophys. Res. Lett., 35, L15811, https://doi.org/10.1029/2008GL034300, 2008a. a
Frankenberg, C., Warneke, T., Butz, A., Aben, I., Hase, F., Spietz, P., and Brown, L. R.: Pressure broadening in the 2v3 band of methane and its implication on atmospheric retrievals, Atmos. Chem. Phys., 8, 5061–5075, https://doi.org/10.5194/acp-8-5061-2008, 2008b. a
Fueglistaler, S., Dessler, A. E., Dunkerton, T. J., Folkins, I., Fu, Q., and Mote, P. W.: Tropical tropopause layer, Rev. Geophys., 47, RG1004, https://doi.org/10.1029/2008RG000267, 2009. a
Garcia, R. R., Marsh, D. R., Kinnison, D. E., Boville, B. A., and Sassi, F.: Simulation of secular trends in the middle atmosphere, 1950–2003, J. Geophys. Res., 112, D09301, https://doi.org/10.1029/2006JD007485, 2007. a
Hansen, C.: Analysis of discrete ill-posed problems by means of the L-curve, Soc. Indust. Appl. Math., 34, 561–580, 1992. a
Hase, F., Hannigan, J. W., Coffey, M. T., Goldman, A., Höpfner, M., Jones, N. B., Rinsland, C. P., and Wood, S. W.: Intercomparison of retrieval codes used for the analysis of high-resolution, ground-based FTIR measurements, J. Quant. Spectrosc. Ra., 87, 25–52, 2004. a
Holton, J. R.: Introduction to dynamic meteorology, forth edition, Department of Atmospheric Science University of Washington, Elsevier Academic Press, 2004. a
Holton, J. R. and Gettelman, A.: Horizontal transport and the dehydration of the stratosphere, Geophys. Res. Lett., 28, 2799–2802, https://doi.org/10.1029/2001GL013148, 2001. a
IPCC (Intergovernmental Panel on Climate Change): Third Assessment Report: Climate Change 2007: The Scientific Basis, Chapter 4, Cambridge University Press, UK, 2007. a, b, c
Jacobson, M. Z.: Fundamentals of Atmospheric Modeling, second edition, Stanford University, Cambridge University press, 2005. a
Laeng, A., Plieninger, J., von Clarmann, T., Grabowski, U., Stiller, G., Eckert, E., Glatthor, N., Haenel, F., Kellmann, S., Kiefer, M., Linden, A., Lossow, S., Deaver, L., Engel, A., Hervig, M., Levin, I., McHugh, M., Noël, S., Toon, G., and Walker, K.: Validation of MIPAS IMK/IAA methane profiles, Atmos. Meas. Tech., 8, 5251–5261, https://doi.org/10.5194/amt-8-5251-2015, 2015. a
Lambert, A., Read, W. G., Livesey, N. J., Santee, M. L., Manney, G. L., Froidevaux, L., Wu, D. L., Schwartz, M. J., Pumphrey, H. C., Jimenez, C., Nedoluha, G. E., Cofield, R. E., Cuddy, D. T., Daffer, W. H., Drouin, B. J., Fuller, R. A., Jarnot, R. F., Knosp, B. W., Pickett, H. M., Perun, V. S., Snyder, W. V., Stek, P. C., Thurstans, R. P., Wagner, P. A., Waters, J. W., Jucks, K. W., Toon, G. C., Stachnik, R. A., Bernath, P. F., Boone, C. D., Walker, K. A., Urban, J., Murtagh, D., Elkins, J. W., and Atlas, E.: Validation of the Aura Microwave Limb Sounder middle atmosphere water vapor and nitrous oxide measurements, J. Geophys. Res.-Atmos., 112, D24S36, https://doi.org/10.1029/2007JD008724, 2007. a
Livesey, N. J., Filipak, M. J., Froidevaux, L., Read, W. G., Lambert, A., Santee, M. L., Jiang, J. H., Pumphrey, H. C., Waters, J. W., Cofield, R. E., Cuddy, D. T., Daffer, W. H., Drouin, B. J., Fuller, R. A., Jarnot, R. F., Jiang, Y. B., Knosp, B. W., Li, Q. B., Perun, V. S., Schwartz, M. J., Snyder, W. V., Stek, P. C., Thurstans, R. P., Wagner, P. A., Avery, M., Browell, E. V., Cammas, J.P., Christensen, L. E., Diskin, G. S., Gao, R. S., Jost, H.J., Loewenstein, M., Lopez, J. D., Nedelec, P., Osterman, G. B., Sachse, G. W., and Webster, C. R.: Validation of Aura Microwave Limb Sounder O3 and CO observations in the upper troposphere and lower stratosphere, J. Geophys. Res., 113, D15S02, https://doi.org/10.1029/2007JD008805, 2008. a
Livesey, N. J., Read, W. G., Froidevaux, L., Lambert, A., Gloria, L. Manney, H. C. P., Santee, M. L., Schwartz, M. J., Wang, S., Richard, E. Cofield, D. T. C., Fuller, R. A., Jarnot, R. F., Jiang, J. H., Knosp, B. W., Paul, C. Stek, P. A. W., and Wu, D. L.: Earth Observing System(EOS), Aura Microwave Limb Sounder (MLS), Version 3.3 and 3.4 Level 2 data quality and description document, Tech. Rep. JPL D-33509, Jet Propulsion Laboratory, California Institute of Technology, Pasadena, CA, USA, 2013. a
Meier, A., Toon, G. C., Rinsland, C. P., Goldman, A., and Hase, F.: Spectroscopic Atlas of Atmospheric Microwindows in the Middle Infrared; 2nd revised edition; IRF Technical Report 048 ISSN 0284-1738; Swedish Institute of Space Physics Kiruna, 2004. a
Meirink, J. F., Bergamaschi, P., and Krol, M. C.: Four-dimensional variational data assimilation for inverse modelling of atmospheric methane emissions: method and comparison with synthesis inversion, Atmos. Chem. Phys., 8, 6341–6353, https://doi.org/10.5194/acp-8-6341-2008, 2008. a
Mengistu Tsidu, G.: High-Resolution Monthly Rainfall Database for Ethiopia: Homogenization, Reconstruction, and Gridding, J. Climate, 25, 8422–8443, https://doi.org/10.1175/JCLI-D-12-00027.1, 2012.
Mengistu Tsidu, G., Blumenstock, T., and Hase, F.: Observations of precipitable water vapour over complex topography of Ethiopia from ground-based GPS, FTIR, radiosonde and ERA-Interim reanalysis, Atmos. Meas. Tech., 8, 3277–3295, https://doi.org/10.5194/amt-8-3277-2015, 2015. a, b
Michelsen, H. A., Irion, F. W., Manney, G. L., Toon, G. C., and Gunson, M. R.: Features and trends in Atmospheric Trace Molecule Spectroscopy (ATMOS) version 3 stratospheric water vapor and methane measurements, J. Geophys. Res., 105, 22713–22724, 2000. a
Minschwaner, K. and Manney, G. L.: Derived methane in the stratosphere and lower mesosphere from Aura Microwave Limb Sounder measurements of nitrous oxide, water vapor, and carbon monoxide, J. Atmos. Chem., 71, 253–267, https://doi.org/10.1007/s10874-015-9299-z, 2014. a
Payan, S., Camy-Peyret, C., Oelhaf, H., Wetzel, G., Maucher, G., Keim, C., Pirre, M., Huret, N., Engel, A., Volk, M. C., Kuellmann, H., Kuttippurath, J., Cortesi, U., Bianchini, G., Mencaraglia, F., Raspollini, P., Redaelli, G., Vigouroux, C., De Mazière, M., Mikuteit, S., Blumenstock, T., Velazco, V., Notholt, J., Mahieu, E., Duchatelet, P., Smale, D., Wood, S., Jones, N., Piccolo, C., Payne, V., Bracher, A., Glatthor, N., Stiller, G., Grunow, K., Jeseck, P., Te, Y., and Butz, A.: Validation of version-4.61 methane and nitrous oxide observed by MIPAS, Atmos. Chem. Phys., 9, 413–442, https://doi.org/10.5194/acp-9-413-2009, 2009. a
Petersen, A. K., Warneke, T., Frankenberg, C., Bergamaschi, P., Gerbig, C., Notholt, J., Buchwitz, M., Schneising, O., and Schrems, O.: First ground-based FTIR observations of methane in the inner tropics over several years, Atmos. Chem. Phys., 10, 7231–7239, https://doi.org/10.5194/acp-10-7231-2010, 2010. a
Phillips, B. C.: A technique for the numerical solution of certain integral equations of the first kind, J. Ass. Comput. Mach., 9, 84–97, https://doi.org/10.1145/321105.321114, 1962. a
Plieninger, J., von Clarmann, T., Stiller, G. P., Grabowski, U., Glatthor, N., Kellmann, S., Linden, A., Haenel, F., Kiefer, M., Höpfner, M., Laeng, A., and Lossow, S.: Methane and nitrous oxide retrievals from MIPAS-ENVISAT, Atmos. Meas. Tech., 8, 4657–4670, https://doi.org/10.5194/amt-8-4657-2015, 2015. a, b
Plieninger, J., Laeng, A., Lossow, S., von Clarmann, T., Stiller, G. P., Kellmann, S., Linden, A., Kiefer, M., Walker, K. A., Noël, S., Hervig, M. E., McHugh, M., Lambert, A., Urban, J., Elkins, J. W., and Murtagh, D.: Validation of revised methane and nitrous oxide profiles from MIPAS–ENVISAT, Atmos. Meas. Tech., 9, 765–779, https://doi.org/10.5194/amt-9-765-2016, 2016. a, b, c, d
Rinsland, C. P., Boone, C., Nassar, R., Walker, K., Bernath, P., Mahieu, E., Zander, R., J. C. McConnell, J. C., and Chiou, L.: Trends of HF, HCl, CCl2F2, CCl3F, CHClF2 (HCFC-22), and SF6 in the lower stratosphere from Atmospheric Chemistry Experiment (ACE) and Atmospheric Trace Molecule Spectroscopy (ATMOS) measurements near 30∘ N latitude, Geophys. Res. Lett., 32, L16S03, https://doi.org/10.1029/2005GL022415, 2005. a
Rodgers, C. D.: Inverse Methods for Atmospheric Sounding: Theory and Practise, vol. 2 of Series on Atmospheric, Oceanic and Planetary Physics, World Scientific, 2000. a, b, c, d, e, f
Rodgers, C. D.: Characterization and error analysis of profiles retrieved from remote sounding measurements, J. Geophys. Res. 95, 5587–5595, https://doi.org/10.1029/JD095iD05p05587, 1990. a
Rodgers, C. D. and Connor, B. J.: Intercomparison of remote sounding instruments, J. Geophys. Res., 108, 4116, https://doi.org/10.1029/2002JD002299, 2003. a
Ravishankara, A. R., Daniel, J. S., and Portmann, R. W.: Nitrous oxide (N2O): The dominant ozone-depleting substance emitted in the 21st century, Science, 326, 123–125, https://doi.org/10.1126/science.1176985, 2009. a
Rothman, L. S., Gordon, I. E., Barbe, A., Benner, D. C., Bernath, P. F., Birk, M., Boudon, V., Brown, L. R., Campargue, A., Champion, J. P., Chance, K., Coudert, L. H., Dana, V., Devi, V. M., Fally, S., Flaud, J. M., Gamache, R. R., Goldmanm, A., Jacquemart, D., Kleiner, I., Lacome, N., Lafferty, W., Mandin, J. Y., Massie, S. T., Mikhailenko, S. N., Miller, C. E., Moazzen-Ahmadi, N., Naumenko, O. V., Nikitin, A. V., Orphal, J., Perevalov, V. I., A. Perrin, A. P. C., Rinsland, C. P., Rotger, M., S̆imec̆ková, M., Smith, M. A. H., Sung, K., Tashkun, S. A., Tennyson, J., Toth, R. A., Vandaele, A. C., and Auwera, J. V.: The HITRAN 2008 molecular spectroscopic database, J. Quant. Spectrosc. Ra., 110, 533–572, 2009. a
Rothmann L. S., Gordon, I. E., Babikov, Y., Barbe, A., Benner, D. C., Bernath, P. F., Birk, M., Bizzocchi, L., Boudon, V., Brown, L. R., Campargue, A., Chance, K., Coudert, L. H., Devi, V. M., Drouin, B. J., Fayt, A., Flaud, J. M., Gamache, R. R., Harrison, J., Hartmann, J. M., Hill, C., Hodges, J. T., Jacquemart, D., Jolly, A., Lamouroux, J., LeRoy, R. J., Li, G., Long, D., Mackie, C. J., Massie, S. T., Mikhailenko, S., Müller, H. S. P., Naumenko, O. V., Nikitin, A., Orphal, J., Perevalov, V. I., Perrin, A., Polovtseva, E. R., Richard, C., Smith, M. A. H., Starikova, E., Sung, K., Tashkun, S. A., Tennyson, J., Toon, G. C., Tyuterev V. G., and Wagner, G.: The HITRAN 2012 molecular spectroscopic database, J. Quant. Spectrosc. Ra., 130, 4–50, https://doi.org/10.1016/j.Jqsrt.2013.07.002, 2013. a
Samuel, T. K.: Determination of Atmospheric Water Vapour Isotopic Composition using Multi-Platform Instruments and Models over Ethiopia: Implications for Water Cycle, PhD dissertation, Addis Ababa university, department of physics, 2014. a, b
Schneider, M., González, Y., Dyroff, C., Christner, E., Wiegele, A., Barthlott, S., García, O. E., Sepúlveda, E., Hase, F., Andrey, J., Blumenstock, T., Guirado, C., Ramos, R., and Rodríguez, S.: Empirical validation and proof of added value of MUSICA's tropospheric δD remote sensing products, Atmos. Meas. Tech., 8, 483–503, https://doi.org/10.5194/amt-8-483-2015, 2015. a, b
Schneider, M., Wiegele, A., Barthlott, S., González, Y., Christner, E., Dyroff, C., García, O. E., Hase, F., Blumenstock, T., Sepúlveda, E., Mengistu Tsidu, G., Takele Kenea, S., Rodríguez, S., and Andrey, J.: Accomplishments of the MUSICA project to provide accurate, long-term, global and high-resolution observations of tropospheric {H2O,δD} pairs – a review, Atmos. Meas. Tech., 9, 2845–2875, https://doi.org/10.5194/amt-9-2845-2016, 2016. a, b
Schoeberl, M. R., Douglass, A. R., Hilsenrath, E., Bhartia, P. K., Beer, R., Waters, J. W., Gunson, M. R., Froidevaux, L., Gille, J. C., Barnett, J. J., Levelt, P. F., and DeCola, P.: Overview of the EOS Aura mission, IEEE T. Geosci. Remote, 44, 1066–1074, 2006. a
Senten, C., De Mazière, M., Dils, B., Hermans, C., Kruglanski, M., Neefs, E., Scolas, F., Vandaele, A. C., Vanhaelewyn, G., Vigouroux, C., Carleer, M., Coheur, P. F., Fally, S., Barret, B., Baray, J. L., Delmas, R., Leveau, J., Metzger, J. M., Mahieu, E., Boone, C., Walker, K. A., Bernath, P. F., and Strong, K.: Technical Note: New ground-based FTIR measurements at Ile de La Réunion: observations, error analysis, and comparisons with independent data, Atmos. Chem. Phys., 8, 3483–3508, https://doi.org/10.5194/acp-8-3483-2008, 2008. a, b, c
Solomon, S.: Stratopheric Ozone depletion: A review of Concepts and History, Rev. Geophys., 37, 275–315, 1999. a
Stiller, G. P., Kiefer, M., Eckert, E., von Clarmann, T., Kellmann, S., García-Comas, M., Funke, B., Leblanc, T., Fetzer, E., Froidevaux, L., Gomez, M., Hall, E., Hurst, D., Jordan, A., Kämpfer, N., Lambert, A., McDermid, I. S., McGee, T., Miloshevich, L., Nedoluha, G., Read, W., Schneider, M., Schwartz, M., Straub, C., Toon, G., Twigg, L. W., Walker, K., and Whiteman, D. N.: Validation of MIPAS IMK/IAA temperature, water vapor, and ozone profiles with MOHAVE-2009 campaign measurements, Atmos. Meas. Tech., 5, 289–320, https://doi.org/10.5194/amt-5-289-2012, 2012.
Sussmann, R., Borsdorff, T., Rettinger, M., Camy-Peyret, C., Demoulin, P., Duchatelet, P., Mahieu, E., and Servais, C.: Technical Note: Harmonized retrieval of column-integrated atmospheric water vapor from the FTIR network – first examples for long-term records and station trends, Atmos. Chem. Phys., 9, 8987–8999, https://doi.org/10.5194/acp-9-8987-2009, 2009. a
Sussmann, R., Forster, F., Rettinger, M., and Jones, N.: Strategy for high-accuracy-and-precision retrieval of atmospheric methane from the mid-infrared FTIR network, Atmos. Meas. Tech., 4, 1943–1964, https://doi.org/10.5194/amt-4-1943-2011, 2011. a
Sussmann, R., Forster, F., Rettinger, M., and Bousquet, P.: Renewed methane increase for five years (2007–2011) observed by solar FTIR spectrometry, Atmos. Chem. Phys., 12, 4885–4891, https://doi.org/10.5194/acp-12-4885-2012, 2012. a
Takele Kenea, S., Mengistu Tsidu, G., Blumenstock, T., Hase, F., von Clarmann, T., and Stiller, G. P.: Retrieval and satellite intercomparison of O3 measurements from ground-based FTIR Spectrometer at Equatorial Station: Addis Ababa, Ethiopia, Atmos. Meas. Tech., 6, 495–509, https://doi.org/10.5194/amt-6-495-2013, 2013. a, b, c, d, e
Tikhonov, A.: On the regularization of ill-posed problems, Dokl. Acad. Nauk SSSR, 153, 49–52, 1963b. a
Tilmes, S., Kinnison, D. E., Garcia, R. R., Müller, R., Sassi, F., Marsh, D. R., and Boville, B. A.: Evaluation of heterogeneous processes in the polar lower stratosphere in the Whole Atmosphere Community Climate Model, J. Geophys. Res., 112, D24301, https://doi.org/10.1029/2006JD008334, 2007. a
von Clarmann, T.: Validation of remotely sensed profiles of atmospheric state variables: strategies and terminology, Atmos. Chem. Phys., 6, 4311–4320, https://doi.org/10.5194/acp-6-4311-2006, 2006. a, b, c
von Clarmann, T.: Smoothing error pitfalls, Atmos. Meas. Tech., 7, 3023–3034, https://doi.org/10.5194/amt-7-3023-2014, 2014. a
Waters, J. W., Froidevaux, L., Harwood, R. S., Jarnot, R. F., Pickett, H. M., Read, W. G., Siegel, P. H., Cofield, R. E., Filipiak, M. J., Flower, D. A., Holden, J. R., Lau, G. K., Livesey, N. J., Manney, G. L., Pumphrey, H. C., Santee, M. L., Wu, D. L., Cuddy, D. T., Lay, R. R., Loo, M. S., Perun, V. S., Schwartz, M. J., Stek, P. C., Thurstans, R. P., Boyles, M. A., Chandra, K. M., Chavez, M. C., Chen, G.S., Chudasama, B. V., Dodge, R., Fuller, R. A., Girard, M. A., Jiang, J. H., Jiang, Y., Knosp, B. W., LaBelle, R. C., Lam, J. C., Lee, K. A., Miller, D., Oswald, J. E., Patel, N. C., Pukala, D. M., Quintero, O., Scaff, D. M., Snyder, W. V., Tope, M. C., Wagner, P. A., and Walch, M. J.: The Earth Observing System Microwave Limb Sounder (EOS MLS) on the Aura satellite, IEEE T. Geosci. Remote, 44, 1075–1092, https://doi.org/10.1109/tgrs.2006.873771, 2006. a
WMO: Greenhouse Gas Bulletin, The State of Green house Gases in the Atmosphere Based on Global Observations through 2009, No. 6, 24 November 2010. a
Xiong, X., Maddy, E. S., Barnet, C., Gambacorta, A., Patra, P. K., Sun, F., and Goldberg, M.: Retrieval of nitrous oxide from Atmospheric Infrared Sounder: Characterization and validation, J. Geophys. Res.-Atmos., 119, 9107–9122, https://doi.org/10.1002/2013JD021406, 2014. a
Xiong, X. Z., Barnet, C., Maddy, E., Sweeney, C., Liu, X. P., Zhou, L. H., and Goldberg, M.: Characterization and validation of methane products from the Atmospheric Infrared Sounder (AIRS), J. Geophys. Res., 113, G00A01, https://doi.org/10.1029/2007jg000500, 2008. a
- Abstract
- Introduction
- Measurement site and instrumentation
- Information content and error analysis
- Satellite measurements
- Comparison of FTIR with MIPAS, MLS, and AIRS observations
- Summary and conclusions
- Data availability
- Author contributions
- Competing interests
- Acknowledgements
- Review statement
- References
- Supplement