the Creative Commons Attribution 4.0 License.
the Creative Commons Attribution 4.0 License.
 | 04 Aug 2020
Simultaneous leaf-level measurement of trace gas emissions and photosynthesis with a portable photosynthesis system
Mj Riches
Daniel Lee
Delphine K. Farmer
Plants emit considerable quantities of volatile organic compounds (VOCs), the identity and amount of which vary with temperature, light, and other environmental factors. Portable photosynthesis systems are a useful method for simultaneously quantifying in situ leaf-level emissions of VOCs and plant physiology. We present a comprehensive characterization of the LI-6800 portable photosynthesis system's ability to be coupled to trace gas detectors and measure leaf-level trace gas emissions, including limits in flow rates, environmental parameters, and VOC backgrounds. Instrument contaminants from the LI-6800 can be substantial but are dominantly complex molecules such as siloxanes that are structurally dissimilar to biogenic VOCs and thus unlikely to interfere with most leaf-level emissions measurements. We validate the method by comparing CO2 assimilation calculated internally by the portable photosynthesis system to measurements taken with an external CO2 gas analyzer; these assimilation measurements agree within 1 %. We also demonstrate both online and offline measurements of plant trace gas exchange using the LI-6800. Offline measurements by pre-concentration on adsorbent cartridges enable the detection of a broad suite of VOCs, including monoterpenes (e.g., limonene) and aldehydes (e.g., decanal). Online measurements can be more challenging if flow rates require dilution with ultrapure zero air. We use high-resolution time-of-flight chemical ionization mass spectrometry coupled to the LI-6800 to measure the direct plant emission of formic acid.
- Article
(2665 KB) - Full-text XML
-
Supplement
(151 KB) - BibTeX
- EndNote


Non-methane volatile organic compounds (VOCs) are readily oxidized in the atmosphere and thus impact atmospheric composition, climate, and human health. As such, a quantitative understanding of VOC sources is essential for predicting future air quality and climate conditions. VOC oxidation impacts greenhouse gas mixing ratios by producing tropospheric ozone and lowering OH radical mixing ratios, thereby increasing the lifetime of atmospheric methane (Kesselmeier and Staudt, 1999). Oxidized products of VOC precursors contribute to secondary organic aerosol (Faiola et al., 2018), which impacts climate and human health (Davidson et al., 2005; Pope and Dockery, 2006). Biogenic emissions from plants dominate the global VOC source (Guenther et al., 1995; Lamarque et al., 2010; Lathière et al., 2006); terrestrial ecosystems and the ocean emit 1150 Tg C yr−1 of VOCs globally (Guenther et al., 1995) relative to anthropogenic VOC sources, which account for only 142 Tg C yr−1 globally (Singh, 1995). The most abundant group of biogenic VOCs (hereafter “BVOCs”) are isoprenoids (Kesselmeier and Staudt, 1999), molecules comprised of (C5H8)n units. Isoprene (C5H8) contributes to roughly half of global BVOC emissions, while monoterpenes (C10H16) and sesquiterpenes (C15H24) account for an additional 18 % combined (Guenther et al., 2012).
BVOC emissions are affected by a complex combination of factors, including temperature (Tingey et al., 1980; Duhl et al., 2008; Tarvainen et al., 2005; Sharkey and Yeh, 2001), soil moisture (Ebel et al., 1995; Ormeño et al., 2007; Sharkey and Loreto, 1993), light (Tarvainen et al., 2005; Sharkey and Loreto, 1993; Owen et al., 2002; Staudt and Seufert, 1995), CO2 concentration (Wilkinson et al., 2009; Loreto and Schnitzler, 2010), plant developmental stage (Holopainen, 2004; Kim et al., 2005; Zhang and Chen, 2009; Guenther, 1997), mechanical stress (Kaser et al., 2013a; Markovic et al., 2016), and biotic stress (Mauck et al., 2010; Niinemets et al., 2013; Scala et al., 2013). While the effects of some environmental factors, such as temperature, are well-understood, the effects of other factors, such as CO2 concentration, are less clear. Different VOCs also have different temperature responses, and different plant species have different temperature responses for the same VOC. While most VOC emissions increase exponentially with a linear increase in temperature (Tingey et al., 1990; Peñuelas and Llusià, 2001; Niinemets et al., 2004) before reaching a maximum and rapidly decreasing (Grote et al., 2013), others are not sensitive to temperature (e.g., cis-β-ocimene) (Loreto et al., 1998). Temperature effects on VOC emissions are included in emission models, typically based on the results of short-term exposure experiments (Guenther et al., 1993, 2012). Unlike temperature, the effect of changing CO2 concentrations on BVOC emissions is under debate, even among plants of the same species (Loreto and Schnitzler, 2010). Under elevated CO2 conditions, some studies observe no change in emissions (Constable et al., 1999; Kainulainen et al., 1998; Räisänen et al., 2008; Rapparini et al., 2004), while others observe a decrease (Scholefield et al., 2004; Sallas et al., 2003; Snow et al., 2003) or increase (Staudt et al., 2001a) in VOC emissions relative to ambient CO2. Despite its importance to atmospheric composition, the biogenic VOC emission response to environmental change remains poorly understood.
Global emission inventories of BVOCs vary across models (Arneth et al., 2008; Grote et al., 2013). Monoterpenes are treated less consistently than isoprene: the standard deviation of monoterpene emissions across multiple emission models is 40 % of the mean compared to 10 % for isoprene (Arneth et al., 2008). Emission models that group several VOCs together, such as the monoterpene isomers, may simplify the model, but this approach assumes that emissions are similar across the isomeric class and neglects differences in the atmospheric reactivities of compounds. For example, the lifetime for reaction with ozone between α-pinene and β-pinene differs from a few hours to a day (Atkinson and Arey, 2003), which consequently affects the secondary organic aerosol (SOA) yield (Friedman and Farmer, 2018). Some models use plant photosynthesis to predict VOC emissions (Grote et al., 2013, 2014), though the correlation between plant physiology and VOC emissions – let alone the response of these parameters to external environmental stressors – is not well-understood. Model limitations are due, in part, to the limited availability of measurements, particularly simultaneous measurements of plant physiology and speciated VOC emissions.
VOC emissions are commonly quantified through canopy measurements (e.g., Goldstein et al., 2004; Rinne et al., 2007; Kaser et al., 2013b; Ciccioli et al., 1999) and leaf or branch chamber headspace measurements (e.g., Kessler and Baldwin, 2001; Llusià et al., 2002; Komenda et al., 2001; Guenther et al., 2000). One approach to leaf-level studies couples a portable photosynthesis system (PPS) with a trace gas analyzer, thus enabling simultaneous physiology and VOC emissions measurements (e.g., Lerdau and Keller, 1997; Brilli et al., 2007; Singsaas et al., 1999; Loreto and Velikova, 2001; Geron et al., 2006b; Brilli et al., 2011; Harley et al., 2014). The user can clamp the cuvette of the PPS onto a leaf and thereby control leaf-level parameters such as light wavelength and intensity, leaf temperature, humidity, airflow, and CO2. Within the PPS, two infrared gas analyzers (IRGAs) determine the difference in the gas concentration of CO2 and water before and after the leaf cuvette. The system calculates physiological parameters including CO2 assimilation rate (A), transpiration, and stomatal conductance (for detailed calculations, refer to LI-COR, 2017). The CO2 assimilation rate refers to the rate of photosynthetic CO2 uptake into the leaf, transpiration is the rate at which water vapor is released from a leaf, and stomatal conductance is the rate at which CO2 and water pass through the stomata of a leaf. Diverting the PPS airflow to an external gas analyzer enables users to sample leaf emissions. Emissions analysis can be both in situ and real time if online detection techniques are available, such as proton transfer reaction mass spectrometry (PTR-MS; e.g., Brilli et al., 2011, 2007; Harley et al., 2014) or portable gas chromatography (e.g., Geron et al., 2006b; Lerdau and Keller, 1997; Singsaas et al., 1999; Loreto and Velikova, 2001). However, gas samples can also be collected for offline analysis by thermal desorption gas chromatography mass spectrometry (e.g., Geron et al., 2006b; Harley et al., 2014) and gas chromatography mass spectrometry canister analysis (e.g., Geron et al., 2006a). These PPS coupled techniques allow users to simultaneously obtain plant photosynthesis metrics and leaf-level VOC emissions.
While the PPS VOC sampling technique has been used for decades, recent developments in PPSs provide new opportunities for leaf-level BVOC emission studies. The expanded ability to control environmental parameters, including leaf vapor pressure deficit, provides ample opportunity to study the connection between plant physiology and emission. However, PPSs have not been rigorously evaluated in the literature for leaf-level emissions. Here, we characterize the recently developed LI-6800 portable photosynthesis system for leaf-level emissions by quantifying the capabilities and limitations of this method. We investigate the instrumental limits of this approach, including acceptable flow rates and best practices. We demonstrate the utility of this technique for offline measurements using thermal desorption gas chromatography mass spectrometry and online measurements using time-of-flight chemical ionization mass spectrometry.
We use a commercial portable photosynthesis system (LI-6800) with a Multiphase Flash™ Fluorometer (LI-COR, Nebraska) for CO2 and H2O gas exchange measurements. The PPS consists of two major components: the console, which includes the digital interface and the chemical columns for control of air composition, and the head, which contains the 6 cm2 leaf chamber and controls leaf temperature. The LI-6800 PPS controls environmental conditions at the leaf level, including temperature, humidity, light intensity and wavelength, and CO2. The PPS also controls airflow and fan speed. As described in the Introduction, the PPS uses IRGAs to detect gas concentrations of CO2 and water from before (reference, REF) and after (sample, SAM) the leaf chamber. The LI-6800 PPS has ports on both of these sample lines; air collected from the REF subsampling port can be used as a system background for emissions that do not occur within the PPS itself, while air collected from the SAM port is representative of leaf emissions and the system background. In instances in which the analytes of interest are only emitted by plant tissue and not by the PPS, measurements taken from the REF port can be used to subtract the background from the SAM port samples.
Table 1User-defined standard, tested, and operating conditions of environmental controls using the LI-6800.
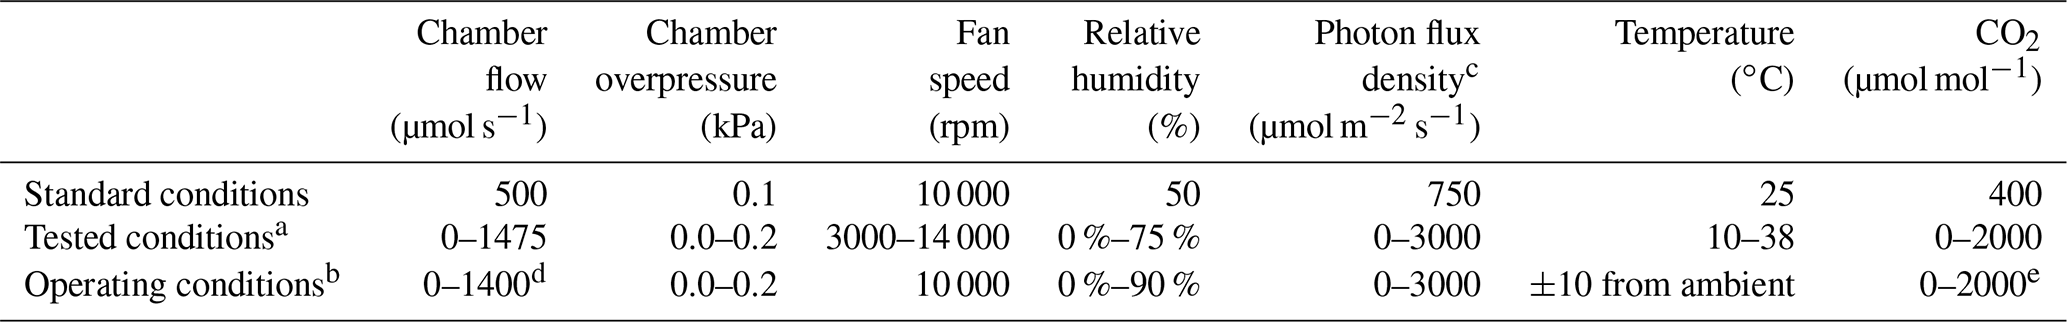
a Provided values indicate the range at which the instrument functioned
properly in conditions tested at 1.5 km above sea level, ∼0.84 atm (8.6 kPa).
b Recommended operating
values from LI-COR (2017).
c Saturating light conditions recommended for most uses. Operating
range dependent on temperature; values shown are for 25 ∘C.
d At standard
ambient temperature (25 ∘C) and pressure (100 kPa, 0.99 atm).
e Exact values limited on bulk flow rate; review LI-COR (2017) for further details.
We define our standard operating conditions in Table 1, along with the technical capabilities of the instrument and the acceptable range determined herein. We acquired response curves by altering a single environmental parameter (e.g., temperature), waiting for leaf photosynthesis (i.e., CO2 assimilation) to stabilize to new conditions, and then collecting gas exchange and VOC measurements. To determine the parameters for photosynthesis stabilization, we monitored a leaf using the PPS for 20 min and determined the natural variability in stomatal conductance and CO2 assimilation. A standard deviation limit can be set for the stability parameters, but we found that the natural variability in our citrus plants changes daily. Therefore, we determined stability using a limit on the slope of stomatal conductance (0.01 mol m−2 s−1 min−1) and CO2 assimilation (0.5 µmol m−2 s−1 min−1) measurements over a 15 s period. Photosynthesis stabilization took anywhere from 30 s to 15 min, depending on how close the set environmental conditions were to ambient or prior conditions. Unless otherwise noted, we controlled the LI-6800 input gas stream with a CO2 scrubber (soda lime, LI-COR 9964-090), desiccant (blue-indicating Drierite, LI-COR 622-04299), humidifier (Stuttgarter Masse, LI-COR 9968-165), and CO2 (8 g cartridges, LI-COR 9968-227 and Leland 30404). The values for flow rate and chemical conditions are in Table 1; further details on the instrument specifications, including component precision, can be found in the instrument manual (LI-COR, 2017).
Note that the LI-6800 denotes flow in terms of micromoles per second (µmol s−1). All flows are given in liters per minute (L min−1); we performed experiments at 1525 m above sea level and use an air pressure of 0.844 atm for conversion calculations when necessary.
The flow path of the PPS subsampling system is shown in Fig. 1. Ambient air is pulled into the PPS through the air inlet between 1.18 and 2.96 L min−1 (680–1700 µmol s−1) and is then treated for humidity and CO2. The bulk flow is automatically calculated by the PPS software to control the user-defined parameter for chamber airflow (described in Table 1). A subsample of this ambient air flows through the REF IRGA and, when in use, the REF subsampling port, while the remaining air enters the leaf chamber. Air exiting the leaf chamber is split between the SAM subsampling port and the second SAM IRGA. Air from the SAM and REF IRGAs is removed as exhaust through the main exhaust line. During emissions sampling, the subsampling ports of the PPS can be simultaneously connected to trace gas analyzers or alternated between a single analyzer with the other subsampling port closed. The airflow drawn out of the subsampling ports varies depending on the emission sampling technique and is described in more detail in Sect. 2.2.
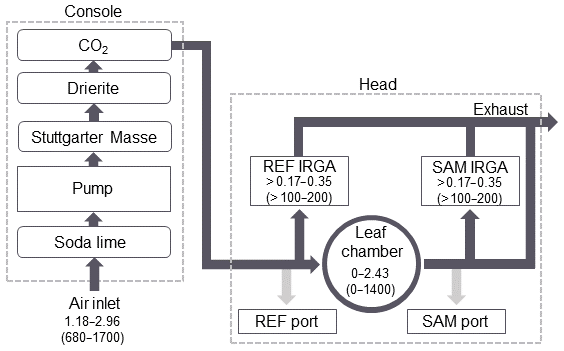
Figure 1Flowchart of airflow through the PPS during emissions sampling. Dashed lines delineate flow through the PPS console and the head. Dark grey lines show the flow through the PPS during photosynthesis measurements. Light grey lines indicate the additional flow path during emissions sampling. Values for flow rate are given in liters per minute (L min−1), with micromoles per second (µmol s−1) in parentheses. The order of the chemical treatment of air is shown for the console.
The LI-6800 can be used with both online and offline emission sampling techniques. We use a chemical ionization mass spectrometer (CIMS) and an external CO2 detector for online sampling, but we note that the principles of flow rate control are easily generalized for other trace gas analysis including PTR-MS. We use thermal desorption gas chromatography mass spectrometry for offline analysis. These systems are described in detail below.
2.1 Portable photosynthesis system
The PPS consists of the head (i.e., the device which clamps onto a leaf) (Fig. 2) and the console (i.e., the device which regulates environmental conditions and chemical use). The leaf chamber (Fig. 2A) was left unchanged while trace gas detector manifolds were connected to the SAM and REF subsampling ports (Fig. 2B and C, respectively). A 3.175 mm brass hose barb fitting is attached to each of the subsampling ports, followed by a 38 mm piece of flexible tubing (Tygon™, 6.35 mm o.d., 3.175 mm i.d.) that connects to a stainless-steel tee (Ultra-Torr). On each of the remaining ports (one perpendicular in Fig. 2B2, C2 and one lateral in Fig. 2B1, C1), a 38 mm piece of polytetrafluoroethylene (PTFE) tubing (6.35 mm o.d., 3.175 mm i.d.) connects to a 6.35 mm perfluoroalkoxy alkane (PFA) fitting. The PFA fittings are capped unless actively used. For sorbent tube sampling, a cap on the lateral port (Fig. 2B1 for SAM, C1 for REF) is replaced with a 6.35 mm fitting, and the sorbent tube (Fig. 2D) is fit directly in line. The external pump (Fig. 2E) is placed downstream of the tube and ensures constant flow through the sorbent tube.
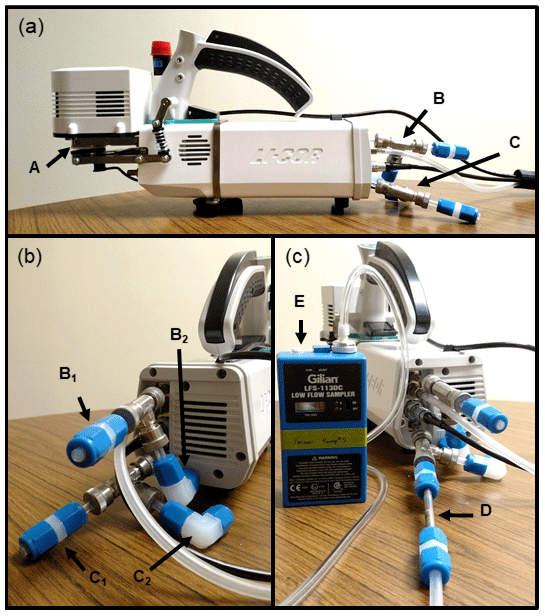
Figure 2Photograph of the emissions subsampling manifold for the LI-6800. The profile view (a) highlights the leaf chamber (A), SAM subsampling port (B), and REF subsampling port (C). The back view (b) highlights the SAM and REF sampling ports (B1 and C1, respectively) and overflow ports (B2 and C2, respectively). Panel (c) shows an example setup of sorbent tube (D) emission collection with an external pump (E) sampling the REF subsampling port.
When subsampling the PPS air for BVOC emissions, an external pump subsamples air through the REF and/or SAM subsampling ports. The external pump ensures constant flow through the BVOC measurement system. The bulk flow through the system (FI) is controlled by an internal pump in the console and any additional pumps used by trace gas analyzers on the REF or SAM subsampling ports. Thus, the total air inlet flow is the sum of flows through the REF port (FR), SAM port (FS), and the exhaust (FE):
where FE includes flow from the internal REF and SAM IRGAs. The IRGAs each require at least 0.17 L min−1 (100 µmol s−1) – though a flow above 0.35 L min−1 (200 µmol s−1) is preferential – and the inlet flow can be a maximum of 2.96 L min−1 (1700 µmol s−1). Due to the instrumental limitations of these flows, sampling flows (FR and FS) must not reach so high as to interfere with PPS function. For thermal desorption sampling, whereby flow rates typically reach 0.2 L min−1, samples can simultaneously be collected through both subsampling ports. The instrument will automatically calculate the split of flows between the IRGAs to account for system requirements. While higher flows (e.g., 1 L min−1) can be sampled via the subsampling ports, the user will need to manually adjust the flow splits using the digital user interface on the console (LI-COR, 2017). Using higher flow rates to accommodate sampling from the SAM port will impact the flow through the leaf chamber and thus the conditions experienced by the leaf tissue. The impact of increased flow rates should be investigated for individual species.
2.2 Online measurements: TOF-CIMS
The PPS trace gas sampling scheme described above is well-suited for online trace gas detection. Here, we use two systems: (1) a CO2 analyzer and (2) a high-resolution time-of-flight chemical ionization mass spectrometer (TOF-CIMS; Aerodyne Research Inc. and Tofwerk AG) (Brophy and Farmer, 2015) coupled to iodide reagent ions (Lee et al., 2014) to detect gas-phase formic acid. Details of the TOF-CIMS are in Sect. S1 in the Supplement.
For external comparison of leaf CO2 exchange with the internal IRGAs, we use an external CO2 analyzer (LI-840A, LI-COR, Nebraska), which was alternately connected to the REF and the SAM subsampling ports. The LI-840A analyzer requires 1 L min−1 of flow.
The TOF-CIMS pulls 1.9 L min−1, exceeding the maximum threshold for the PPS subsampling ports. To decrease the flow, we dilute the subsampled air with 2.00±0.05 L min−2 of ultrahigh-purity zero air (UZA; Airgas) at the inlet to the CIMS. The diluting flow is controlled by a mass flow controller (MKS Instruments, Mass Flo® Controller, 1179B).
We calculate formic acid emission rates as follows:
where CP is the mixing ratio of the VOC coming from the PPS (mol mol−1), CC is the mixing ratio of the VOC identified by the CIMS (mol mol−1), QC is the total flow pulled by the CIMS (L min−1), and QP is the flow taken from the PPS subsampling port (L min−1). To get CC, a calibration is used to convert integrated peak area into concentration; the resulting value is then divided by the time over which the integration occurred.
We then convert the leaf chamber flow (QL) from liters per minute (L min−1) to moles per minute (mol min−1) using
where P is atmospheric pressure, R is the gas constant, and T is air temperature. Using Eqs. (2) and (3), we obtain
where EVOC is the VOC emission rate (mol m−2 min−1), and S is the leaf area (m2).
2.3 Offline detection: sorbent tubes
Thermal desorption (TD) gas chromatography mass spectrometry (GC/MS) is an offline sampling technique commonly used to sample atmospheric volatile and semi-volatile organic compounds (Harper, 2000). This technique pre-concentrates trace gases on sorbent tubes, which are stainless steel or glass tubes of specific dimensions that are filled with adsorbent materials. Different adsorbents target different analytes. Tenax TA is a general adsorbent, which has a sampling range of 7 to 26 carbons (C7–C26) and is relatively hydrophobic (Dettmer and Engewald, 2002). Other adsorbents, such as carbon molecular sieves (e.g., Carboxen 563), collect smaller molecules (C2–C5) but are sensitive to atmospheric humidity (Dettmer and Engewald, 2002). As air flows through the sorbent tubes, atmospheric constituents adsorb onto the surface. The tubes are then rapidly heated and the compounds thermally desorbed into an airstream for analysis by GC/MS. Here we use an autosampler (Ultra-xr, Markes Intl.) and thermal desorption unit (Unity-xr, Markes Intl.) coupled to a gas chromatograph (TRACE 1310, Thermo Scientific) mass spectrometer (TSQ 8000 Evo Triple Quadrupole GC-MS/MS, Thermo Scientific).
Details of the TD-GC/MS method are in Sect. S2. Briefly, we use the TD-GC/MS with Tenax adsorbent cartridges to quantify seven monoterpenes, summarized in Table 2.
Table 2Summary of monoterpenes quantified using TD GC/MS.
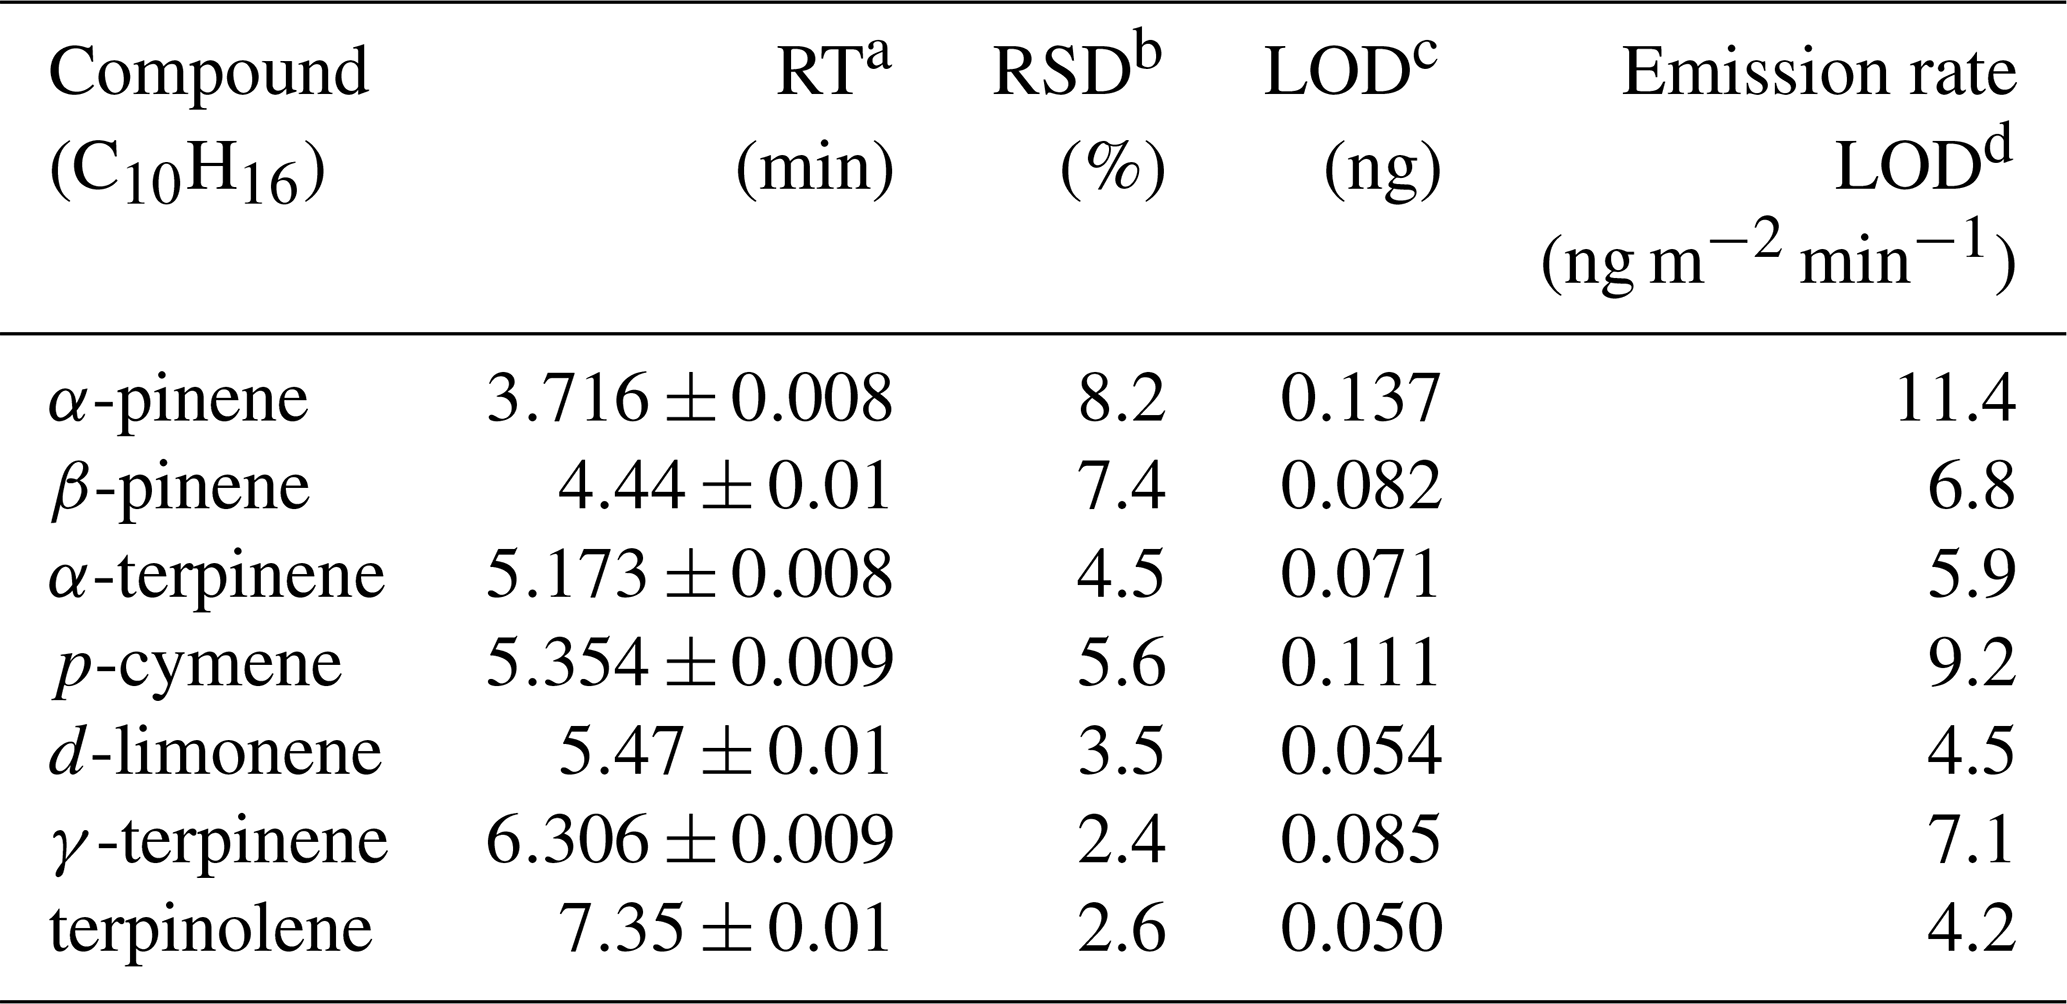
a Retention time.
b Relative standard deviation (n=10).
c Limit of detection,
calculated using the propagation of errors
approach (Bernal, 2014).
d Based on a
20 min sampling time.
We calculate leaf-level VOC emissions from the cartridge samples as follows:
where EVOC is the VOC emission rate (ng m−2 min−1); mVOC is the mass of the VOC (ng), as determined by the thermal desorption calibration; QL is the flow through the leaf chamber (L min−1); V is the total volume of air sampled with the sorbent tube (L), sampling flow multiplied by sampling time; and S is the leaf surface area (m2). For all measurements in this paper, we selected leaves that filled the chamber for a total measured leaf area of 6 cm2. However, this technique is still applicable for leaves that do not fill the chamber due to size or shape; for such leaves, leaf area must be determined separately (e.g., via image processing as in Chaudhary et al., 2012, or via calculations based on geometric measurements as in Sellin, 2000).
2.4 Sampling protocol
The sampling protocol involves clamping the PPS leaf chamber onto a leaf, waiting for the leaf to adapt to the leaf chamber conditions, collecting trace gas measurements from the SAM and REF subsampling ports, and then either removing the leaf chamber and moving to a new leaf (single emission point) or changing the environmental conditions to investigate leaf-level emission responses to temperature, light, relative humidity, or CO2 (Table 1). Photosynthesis may be measured simultaneously at any point in the sampling protocol and is independent of emission measurements.
Once the PPS has undergone its standard warm-up (≤ 45 min), we set the PPS to the standard environmental conditions and allow the instrument to equilibrate without a leaf present, with the leaf chamber closed (<15 min; the further the ambient conditions deviate from standard conditions, the longer the instrument takes to equilibrate). We match the IRGAs to one another (LI-COR, 2017) prior to collecting an emissions measurement when the CO2 or humidity values change or within an hour since the last match. To collect a system background (“system blank”), we connect a sorbent tube to the SAM subsampling port and use an external handheld pump to sample emissions (0.2 L min−1; 20 min). The tube is then removed and the subsampling port capped. To sample leaf emissions, we enclose a leaf in the PPS chamber and allow the leaf to acclimate at standard conditions (30 s to 35 min). A sorbent tube and external pump connected to the SAM subsampling port sample the leaf emissions (0.2 L min−1; 20 min). For CIMS measurements, we collect a system blank from the PPS (no leaf) by sampling the SAM subsample port for at least 5 min (at 1 Hz). After enclosing the leaf in the PPS chamber, we monitor the stability of both photosynthesis and volatile emissions. We typically find that the leaf and detector system require at least 5 min to stabilize.
If there are no internal sources or sinks to the VOCs of interest (or these interactions are quantifiable), gas measurements may be simultaneously taken from both the REF and SAM subsample ports (with flow considerations, as described in Sect. 2.1). With this method, REF measurements provide the background for subtraction from the SAM emissions measurements.
At this point, users may make continuous measurements, survey measurements, or response measurements. A continuous measurement allows for the subsequent measurement of the same leaf tissue at the same environmental conditions (i.e., one leaf throughout the day). A survey measurement allows for the measurement of multiple leaves under one set of environmental conditions (i.e., sampling emissions from multiple leaves on the same plant). Importantly, each time a leaf is physically placed in the PPS chamber, it requires time (30 s–35 min, depending on environmental conditions) to acclimate. A response measurement allows for the measurement of a single leaf at different environmental conditions (e.g., sampling emissions as a function of temperature).
Leaves must acclimate to new environmental conditions. However, the time required for a leaf to adapt to placement in the chamber or changing environmental conditions is inconsistently reported in leaf-level photosynthesis studies. Some studies allow leaves to acclimate until photosynthesis reaches stability or steady state (e.g., Bunce, 2008; Domurath et al., 2012), though those terms are often undefined. Some studies use an upper (e.g., Yang et al., 2010) or a lower (e.g., Lang et al., 2013) time limit to allow photosynthesis to reach stability. When exact equilibration times are mentioned, they vary greatly between perturbations and between studies. For emissions measurements, equilibration times of both photosynthesis and BVOC emission must be considered. Using the CIMS, we determined that it takes 10–15 min for both photosynthesis and formic acid to reach stability after being clamped or after an environmental change.
We investigated the potential for VOCs in the leaf chamber to persist from one experiment to another, after the leaf has been removed, through adsorption on gaskets or chamber surfaces (“carryover”). Carryover can cause spuriously high emission measurements. To investigate carryover, we collected a system blank (no leaf present; SAM port) before introducing a ponderosa lemon (Citrus limon × Citrus medica) leaf into the chamber for the next 8 h at varying temperatures. We observe no consistent evidence that longer periods in the leaf chamber impact photosynthesis or VOC emissions. Citrus is believed to influence regional atmospheric chemistry due to its VOC emissions (Hodges and Spreen, 2012; Park et al., 2013). As a cocktail-sized, slow-growing plant with large leaves, this species was suitable for laboratory and greenhouse experiments. Immediately after removing the leaf at the end of the day, we collected a second system blank (no leaf present; SAM port).
We observed no carryover of monoterpenes (α-pinene, β-pinene, limonene, cis-β-ocimene, or γ-terpinene) or caryophyllene. The only identifiable plant emissions with an observable signal (% of initial, i.e., leaf in chamber) that persisted after the leaf was removed were citral (27 %) and 2-ethyl-1-hexanol (92 %).
We also observed carryover of long-chain acids including palmitoleic acid (49 %), pentadecanoic acid (47 %), hexadecanoic acid (85 %), and oleic acid (88 %). Squalene (89 %) also had substantial carryover. These compounds could have been introduced via the cuticular wax of leaves (Fernandes et al., 1964) or through human contact. However, these signals appear at retention times between 15 and 17 min and are thus unlikely to interfere with the signals of more volatile species.
Volatility likely plays a role in the carryover of compounds. Squalene, citral, and the long-chain acids have lower volatility than the monoterpenes. However, 2-ethyl-1-hexanol is of similar volatility to the monoterpenes, yet it persists after the leaf has been removed. Carryover should thus be investigated for specific compounds prior to extensive studies.
2.5 Leaf chamber conditions
The PPS control of environmental conditions enables the acquisition of short-term response curves for trace gas emissions, which are typically used to parameterize biogenic VOC emissions in atmospheric chemical transport models. Table 1 summarizes the ranges in parameters we find to be feasible for each environmental parameter.
The PPS regulates CO2 and light well. However, both temperature and humidity regulation in the PPS depend on the balance between the ambient and desired conditions. Relative humidity is constrained so as to not reach condensing conditions, so the extent of relative humidity (RH) control depends on the temperature of the leaf chamber. For example, when aiming for high PPS temperatures (>30 ∘C), the PPS can have difficulty simultaneously maintaining high (>50 %) RH. When ambient temperatures are low (<4 ∘C), the PPS is challenged to maintain RH >35 %. This instrumental challenge occurs because temperature control in the PPS is limited by the heat exchanger; as the heat exchanger approaches the dew point, the PPS takes proactive measures and slows the heating or cooling of the system. We find two approaches to deal with PPS temperature and RH problems: (i) temperature may be set independently of humidity, or (ii) temperature may be ramped slowly while humidity is maintained.
Of all of the controllable environmental conditions, temperature takes the longest for the PPS to regulate (10±2 min to warm an empty chamber from 18 to 33 ∘C). Cooling takes twice as long as heating, and introducing a leaf into the chamber increases the time necessary to cool by 35 % and time necessary to heat by 26 %. External fans improved the chamber temperature control at higher ambient temperatures, as did placing ice packs beside the air inlet, around the chemical tubes, beside the leaf chamber, and on the side of the head.
The LI-6800 also enables direct control of the leaf vapor pressure deficit, but achieving a large dynamic range in vapor pressure deficit is subject to the same constraints as simultaneously changing temperature and RH in the PPS.
The LI-6800 PPS internally measures leaf-level CO2 exchange with the SAM and REF IRGAs as a core measurement, providing CO2 assimilation (µmol m−2 s−1). Assimilation provides a useful metric of validation against external leaf-level emissions, and we compare leaf-level CO2 assimilation measured internally by the LI-6800 PPS and externally through the subsampling manifold and an external CO2 analyzer. Here, we used the CO2 assimilation of a basil leaf (Ocimum basilicum) to verify that the use of an external subsampling port supports the same values as the PPS's internal IRGA systems.
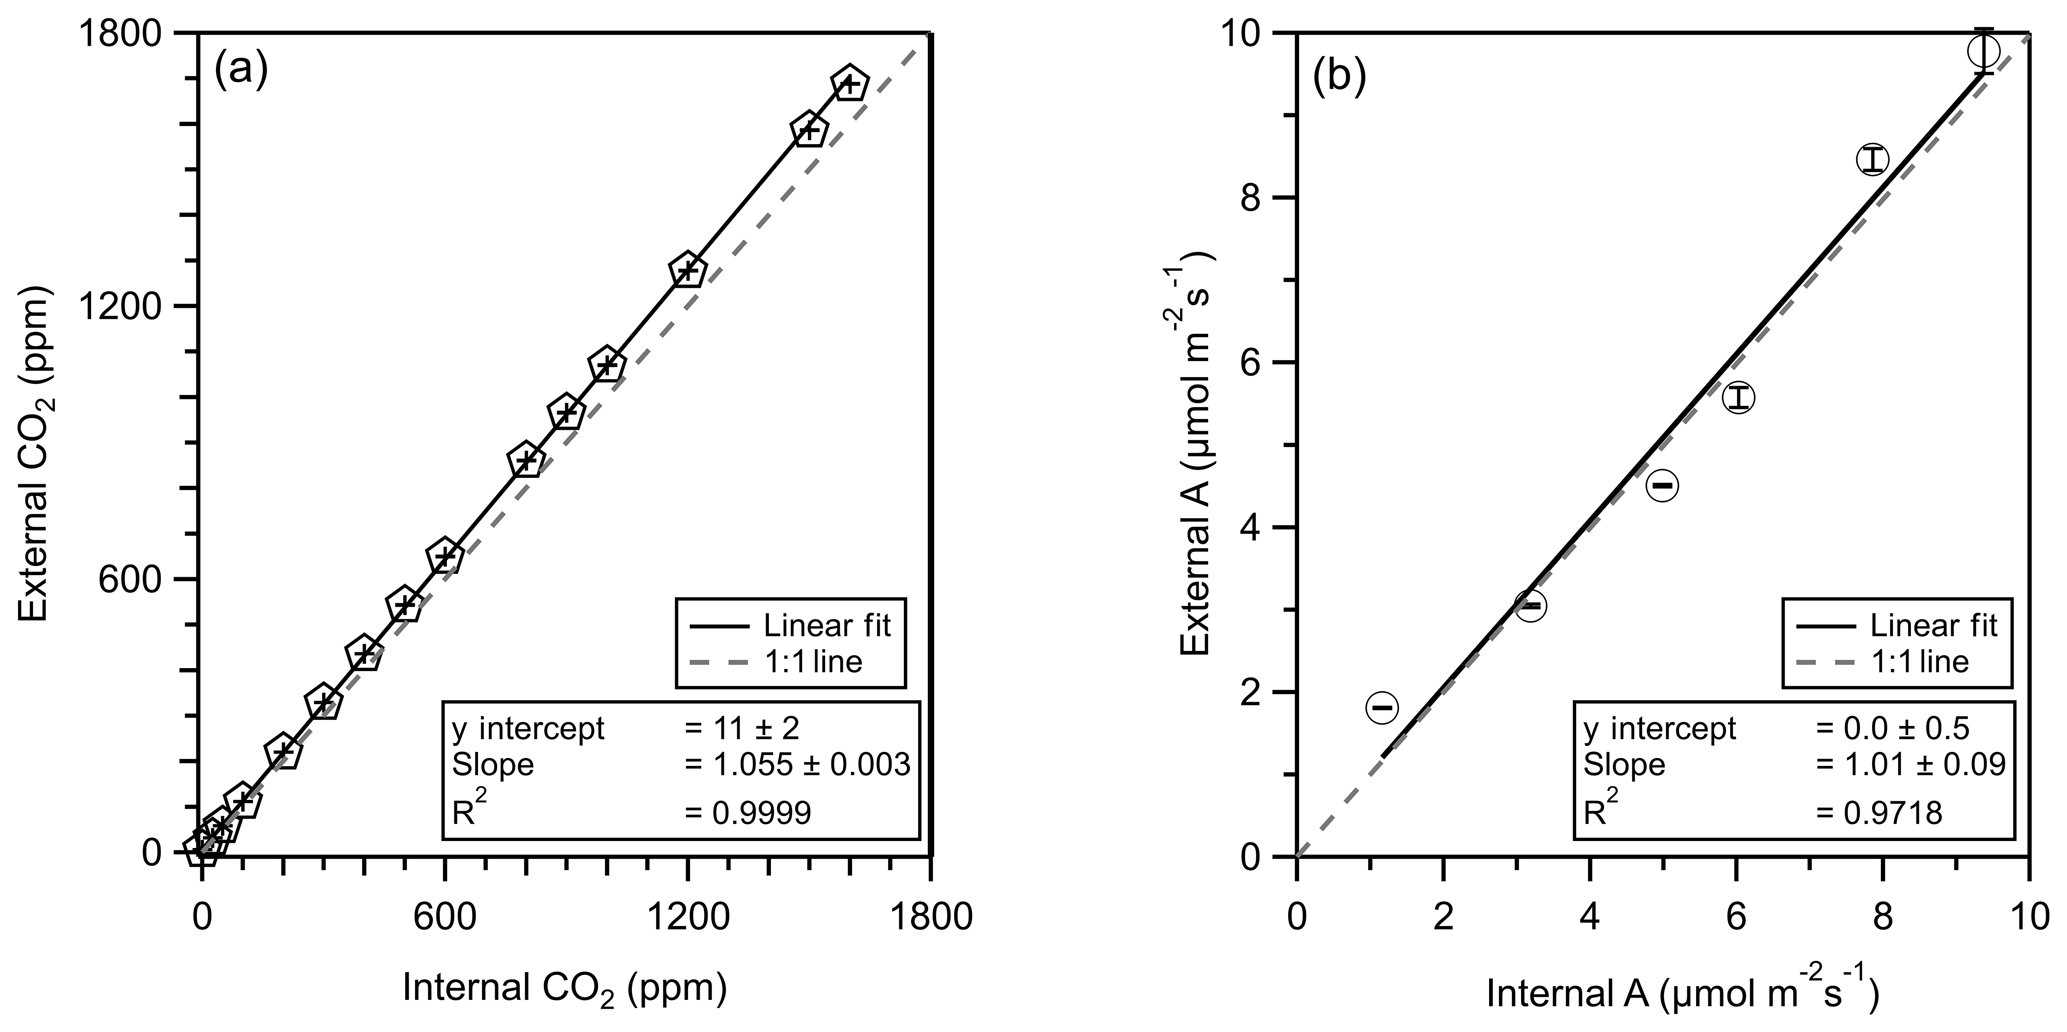
Figure 3Correlation plots of CO2 mixing ratio (pentagons, a) and CO2 assimilation (A, circles, b) as calculated internally by the PPS (x axis) and externally by the CO2 analyzer (y axis). A 1 : 1 line is presented as a grey dashed line. The linear regression fit is shown with a solid line, and fit parameters can be found in the text plus or minus the standard error of the fit. Error bars represent the standard deviation of values.
We connected an external CO2 analyzer (LI-840A, LI-COR, Nebraska) to the PPS (no leaf) and varied the CO2 mixing ratio to determine the sensitivity of external CO2 measurements (using the LI-840A) with the internal LI-6800 CO2 measurements. The LI-6800 can control the CO2 mixing ratio in one of two locations: before (REF) or in (SAM) the leaf chamber. First, we compare CO2 measurements between the internal (LI-6800) and external (LI-840A) CO2 analyzers. We internally controlled the REF CO2 mixing ratio and measured the subsequent CO2 mixing ratio externally though each subsampling port. We then controlled the SAM CO2 mixing ratio and repeated the external measurements. All comparison experiments showed a strong correlation between internal and external CO2 measurements (r2>0.9999). The controlled CO2 mixing ratio for both experiments ranged from 0 to 1600 ppm. We found that the external CO2 measurement was 5.5 % higher than the internal measurement, which we attribute to systematic differences in instrument calibration (Fig. 3). We find no evidence of leaks at below-ambient CO2 mixing ratios.
We then compared CO2 assimilation (sampling with leaf) between the internal PPS determination and the external measurements accounting for observed flows. This external CO2 assimilation measurement and calculation approach parallels our coupled PPS + online sampling trace gas measurement and provides validation of the sampling approach. For CO2 assimilation comparisons, we controlled the SAM CO2 mixing ratios and monitored the REF CO2 mixing ratios externally. We accounted for the calibration offset between internal and external CO2 detectors. With the external CO2 analyzer connected to the REF subsampling port and a leaf in the chamber, we set the PPS CO2 mixing ratio to 200, 400, 600, 800, and 1000 µmol CO2 mol−1. The PPS measured photosynthesis 10 times within 10 min while we externally monitored CO2 mixing ratios from the REF port (1 Hz).
We calculate CO2 assimilation (A) as
(adapted from LI-COR, 2017) where QL,c is the flow through the leaf chamber (µmol s−1) multiplied by the leak correction factor (unitless, provided by the PPS); [CO2]R and [CO2]S are the mixing ratios of CO2 (µmol mol−1), as determined by the REF and SAM infrared gas analyzers, respectively; [H2O]R,c and [H2O]S,c are the mixing ratios of H2O (mol mol−1), as determined by the REF and SAM infrared gas analyzers, respectively; and S is the leaf area (m2). We take [H2O]R,c and [H2O]S,c from the LI-6800.
The internally and externally calculated CO2 assimilations correlate well (r2=0.97), with 1 % difference between the two approaches (Fig. 3).
Background contamination reduces analyte signal accuracy. Co-eluting peaks in a gas chromatogram add additional difficulty in determining the exact peak area of a VOC analyte. When a chromatogram features heavy background contamination from a system, the chromatograms can become busy, challenging untargeted peak identification. Here we investigate the background VOCs in the PPS.
The REF port can be measured simultaneously with the SAM port to provide a background measurement of air entering the leaf chamber but not any internal PPS sources of interference in the leaf chamber.
The PPS is made of materials that can emit volatile compounds. While the PPS background may not contribute substantial background signals when using certain targeted analytical techniques (e.g., selected ion monitoring GC/MS), untargeted techniques, such as full scan GC/MS, are susceptible to background interference. TD-GC/MS chromatograms of the PPS (no leaf, 30 ∘C) revealed substantial background contamination, especially compared to the background of the Tenax tubes themselves (Figs. 4 and 6). The total integrated ion counts of identifiable peaks were 49 % higher background from the SAM port versus the REF, highlighting the problem of only using the REF port as a background for VOC analysis. These peak counts are substantially higher (by ∼80 %) than the blank Tenax sorbent tube itself. The primary differences in the integrated peak area between SAM and REF are due to the five largest peaks, three of which are siloxanes. Siloxanes are commonly used in consumer products, including textiles, cosmetics, paint, and electronics (Fromme, 2018; Tilley and Fry, 2015), and were 41 % higher in the SAM than REF ports. The other two largest peaks are isobornyl acrylate (a film-forming agent) and n-octyl acrylate (an adhesive and coating component). While unlikely to interfere with leaf VOC emissions, co-elution with these peaks may lead to unidentified emissions in untargeted approaches. As a result of this work, we recommend taking frequent backgrounds from the SAM port to ensure no chamber background interference for analytes of interest.
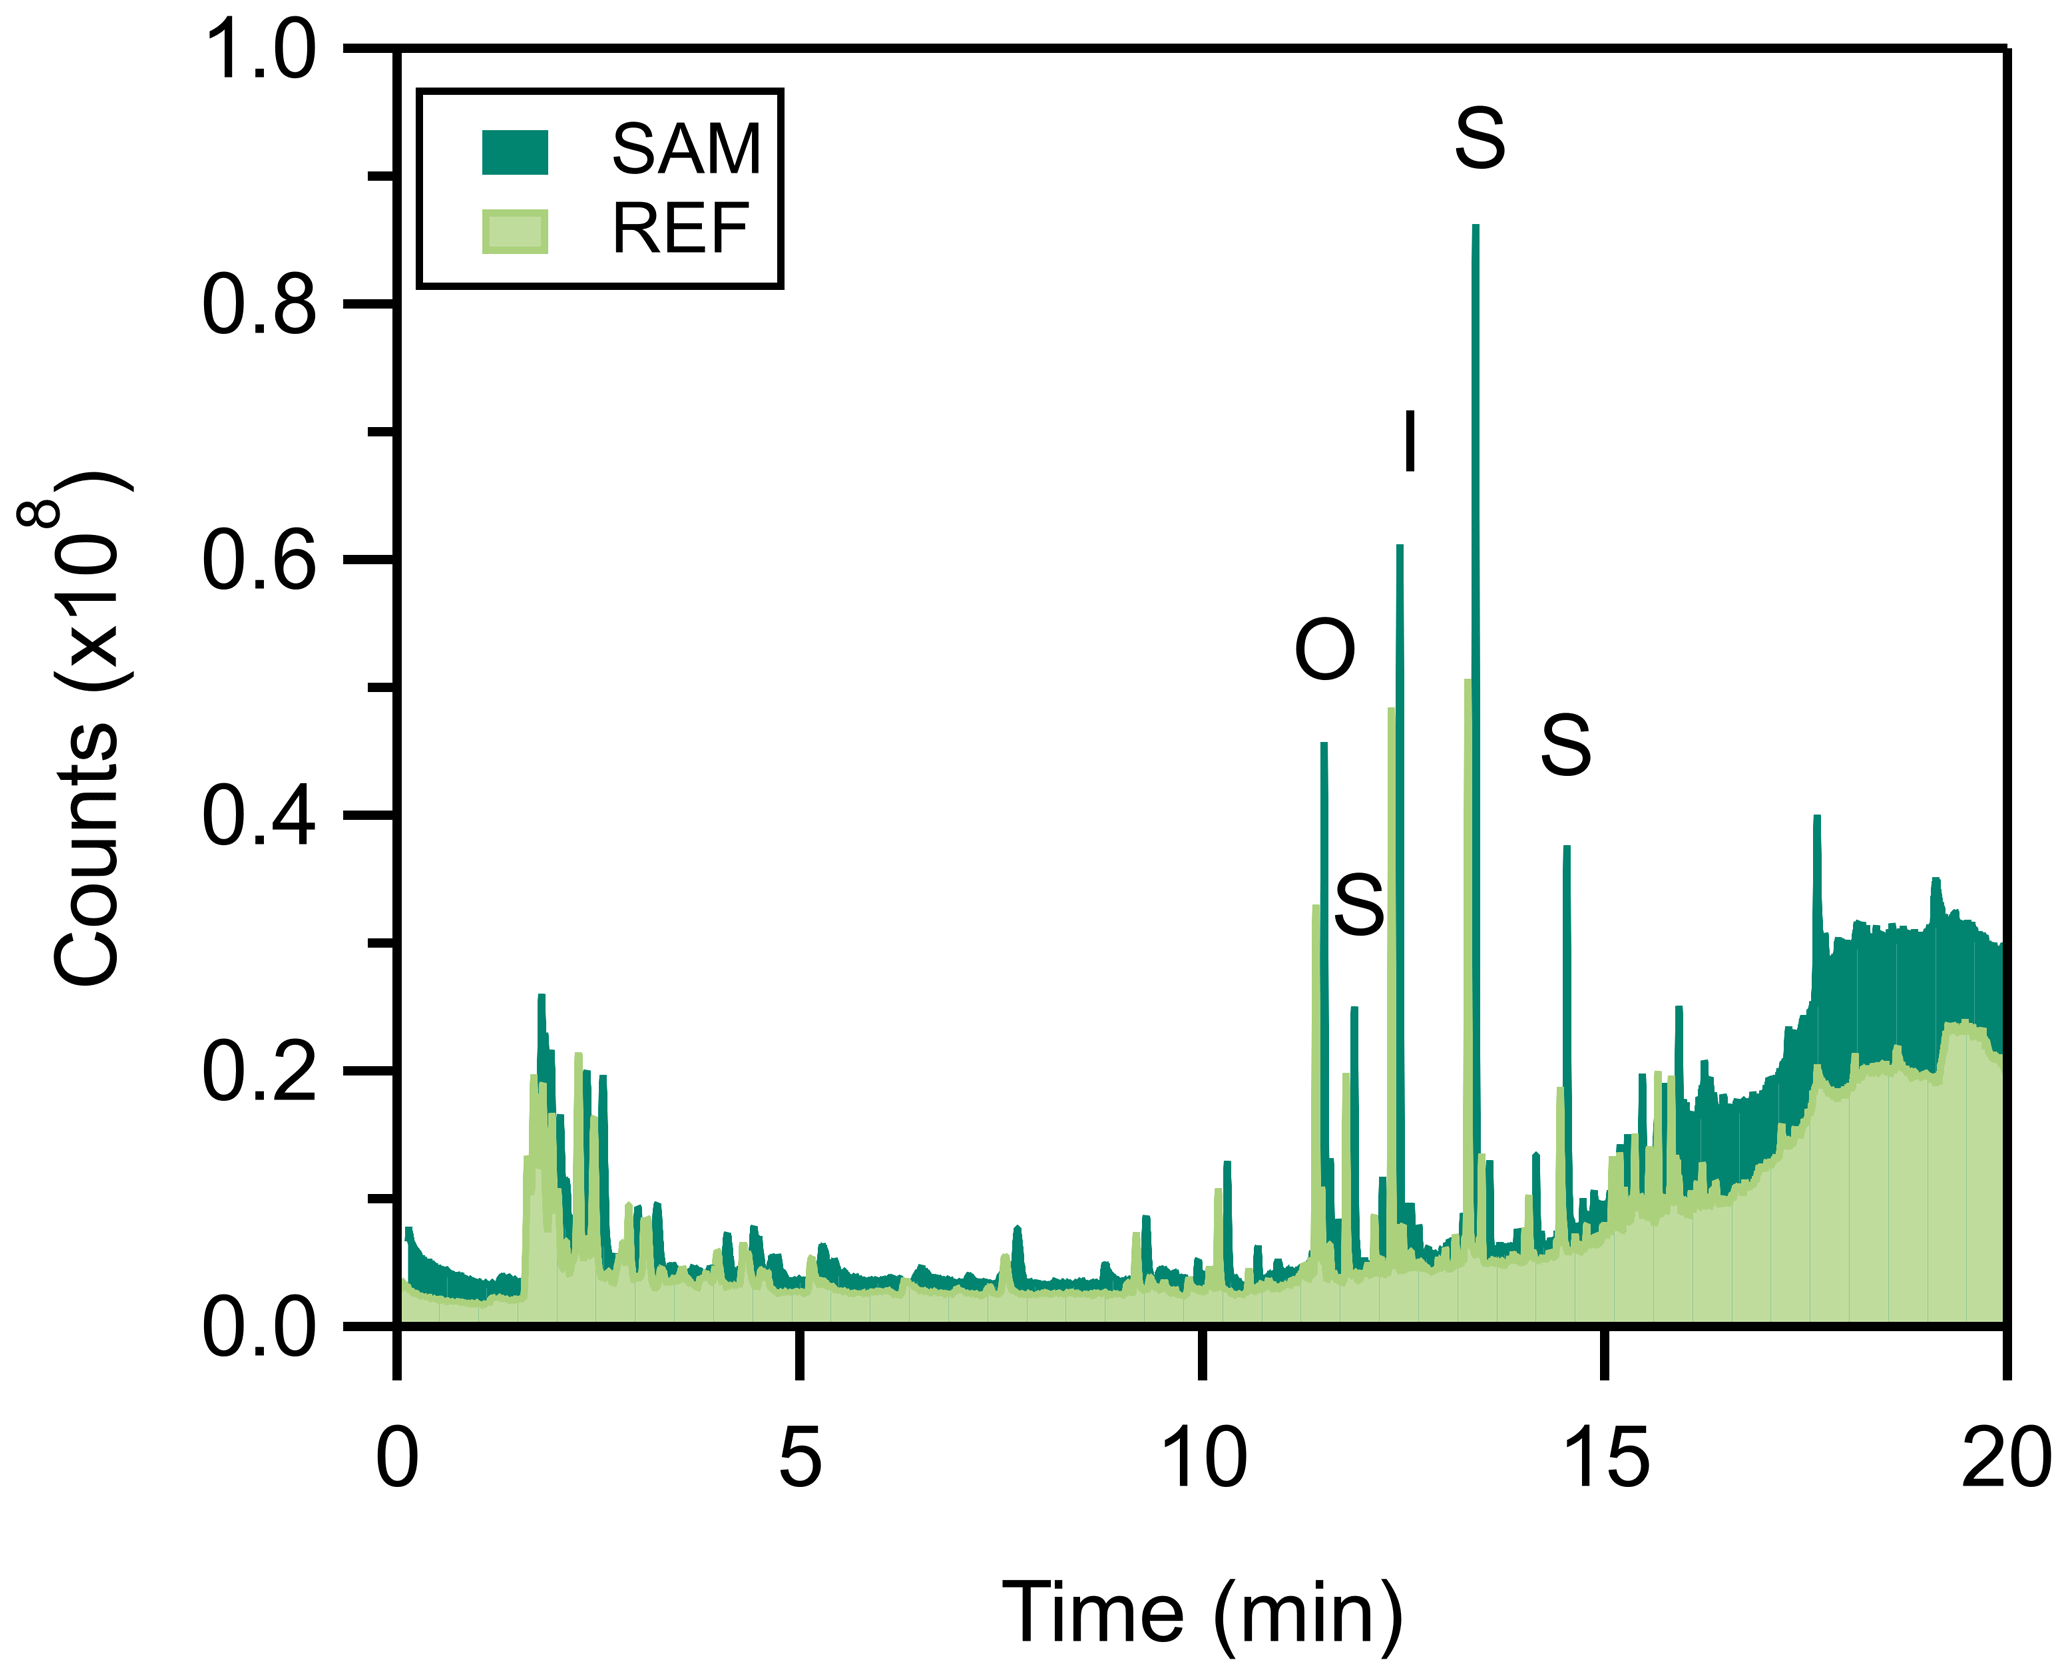
Figure 4Stacked chromatograms of the background composition of the LI-6800, comparing measurements taken from the REF (light green) and SAM (dark green) ports as sampled by TD-GC/MS (20 min at 0.2 L min−1, sampled on Tenax cartridges). The five largest peaks are labeled: S is the result of a siloxane, I is that of isobornyl acrylate, and O is that of n-octyl acrylate.
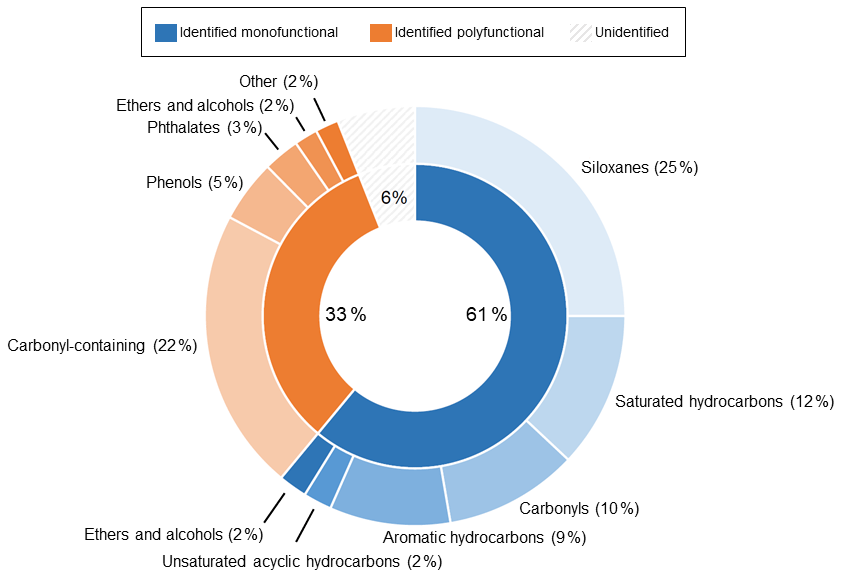
Figure 5Pie chart summarizing the background composition of the LI-6800 with no leaf in the chamber, collected using the SAM port of the PPS. Percentages are provided to indicate the contribution of each class of compounds to the total integrated peak area. The inner pie chart shows the division of total ion counts for identified monofunctional (containing a single functional group), identified polyfunctional (containing multiple functional groups), and unidentified (grey stripes) peaks. Identification required an integrated peak area over 50 000 counts and a NIST library match score of at least 500. The outer pie chart shows the subsequent breakdown of both identified classes.
Figure 5 categorizes the signals from the SAM background by functional groups, highlighting the complexity and potential interference for biogenic trace gas emission analysis. The large background signals caution against using bulk signal measurements (e.g., total observed carbon or total observed reactivity) from the PPS without careful background analysis. Instead, targeted approaches like extracted ion chromatography (EIC) are a promising way to exclude spurious background signals. Figure 6 highlights the differences between the full chromatogram (total ion counts) and an EIC, for which we selected for monoterpenes. This approach clearly separates leaf emissions that are not present in the blank, including β-pinene (4.210 min), limonene (5.175 min), and β-ocimene (5.561 min). By minimizing background contamination with EIC, we clearly observe differences between strongly and weakly emitting leaves (Fig. 6). Therefore, we recommend an EIC approach for the semi-targeted identification and analysis of monoterpenes and aldehydes.
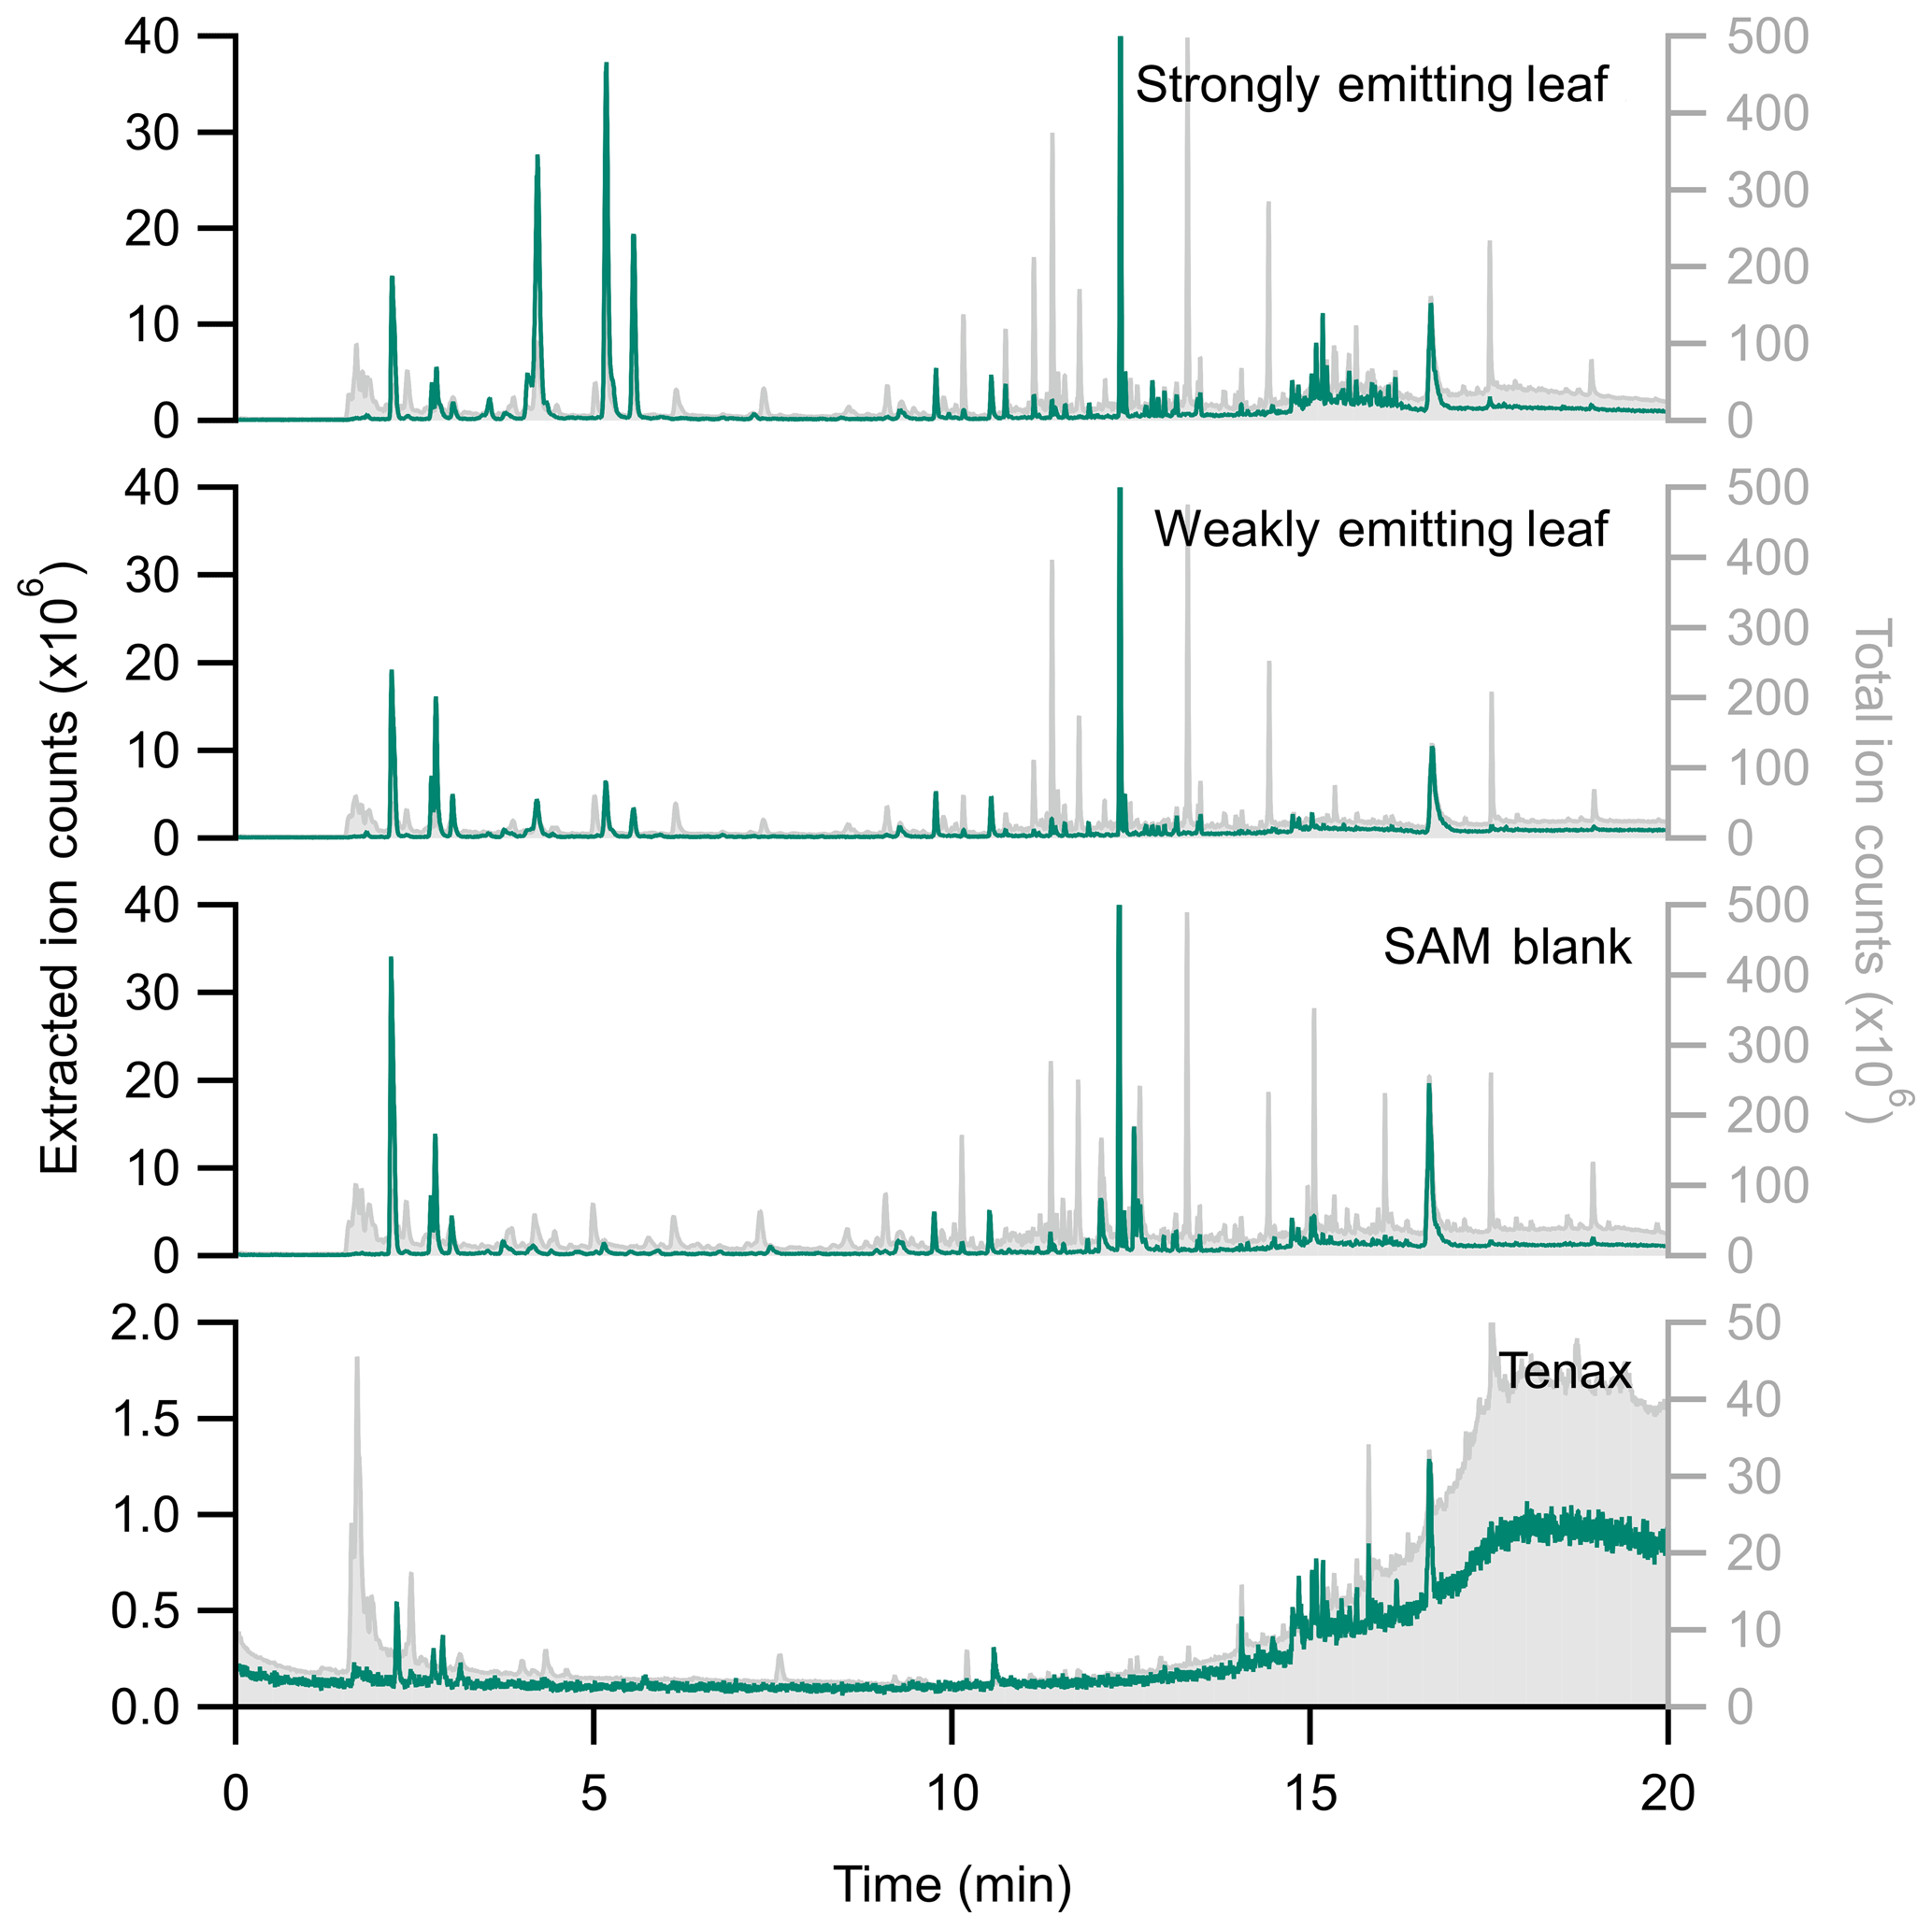
Figure 6Stacked chromatograms comparing extracted ion chromatograms (EIC using m∕z 136, 135, 93, and 91; left, in green) with the total ion chromatogram (TIC, right, in grey) for a Tenax blank, a SAM blank, and a weakly and strongly emitting citrus leaf (Citrus limon × Citrus medica). Note the difference in axis scales between EIC and TIC. While several background peaks remain in the EIC, there are substantially fewer in the 10+ min range. The peak height of EIC isobornyl acrylate (RT =12.3 min) has been truncated. Note that retention times differ from Table 2; the column length had been shortened by the time of these measurements.
We investigated three approaches to minimizing the PPS backgrounds. We replaced the Drierite desiccant with silica gel orange (Sigma-Aldrich, 13767-2.5KG-R) and the Stuttgarter Masse humidifier with Perlite (Miracle Gro®, 74278430). We also installed fresh air filters at each chemical column, IRGA, and the air inlet. After each change, we flushed the system with heated air (35 ∘C at a flow rate of 1300 µmol s−1 for 30 min) before collecting system blanks under standard conditions, but none of these changes substantially decreased the background signals (Fig. S1 in the Supplement).
The air entering the PPS is ambient and thus prone to change throughout the day as sources and sinks vary. While the PPS includes several filters within the system, they do not filter all biogenic hydrocarbons – including monoterpenes. This is a particular problem in greenhouses, where low exchange rates, warm temperatures, and large concentrations of plants lead to high ambient biogenic VOC emissions. We investigated the potential to filter monoterpenes from inlet air at the Plant Growth Facilities at Colorado State University. We added a home-built charcoal filter (a 30.5 cm piece of 85 cm o.d. stainless-steel tubing filled with activated charcoal – Norit®, Sigma-Aldrich, 29204-500G – and filtered with glass wool and stainless-steel mesh on either end) to the air inlet of the PPS. This filter completely removed all background α-pinene from 0.04 ppb to below the detection limit but was less effective in subsequent outdoor experiments. As the ambient concentration of VOCs varies with time of day, we recommend using a charcoal filter and taking simultaneous REF and SAM measurements to account for interference from input air. Alternately, zero air can replace ambient input air at the PPS inlet per the manufacturer's instructions (LI-COR, 2017).
Despite this background interference, the LI-6800 has the potential to investigate plant gas exchange for an array of molecules with an array of trace gas instrumentation. Here, we provide case studies with both online (Sect. 5.1; CIMS) and offline (Sect. 5.2 and 5.3; TD-GC-MS) analysis. TD offers the benefit that the sorbent tubes are easily portable, though sample collection and analysis are time-intensive. CIMS offers the benefit of online, real-time data acquisition; however, the instrument itself is less portable and provides no definitive compound identities. These case studies maintained standard conditions unless otherwise noted, and each study used different plants. Further information on plant growth conditions can be found in Sect. S4.
5.1 Formic acid emissions
Organic acids account for roughly 25 % of global non-methane VOCs (Khare et al., 1999) and contribute to secondary organic aerosol (Yatavelli et al., 2014). Despite their ubiquity, models typically underestimate ambient concentrations of formic acid, even the structurally simplest of organic acids, implying a missing source (Paulot et al., 2011; Alwe et al., 2019). This missing source of formic acid is not soils (Mielnik et al., 2018), but flux studies (Fulgham et al., 2019) and vertical gradient measurements (Mattila et al., 2018) suggest a direct ecosystem source. Here we demonstrate the capacity of the PPS coupled to a CIMS system to investigate leaf-level organic acid sources from Mentha spicata (spearmint), a culinary herb of economic importance due to the production of its essential oil.
We generated a temperature response curve on a spearmint leaf connected to the PPS with a CIMS detector. We generated three temperature response curve replicates, each with temperatures varying from 21 to 35 ∘C. The leaf was acclimated (as described in Sect. 2) at each new temperature for at least 5 min, during which time the CIMS sampled the REF port to determine the system background. We then simultaneously measured leaf-level emissions of formic acid and photosynthetic parameters for 5 min.
CO2 assimilation and formic acid emission both varied with temperature for this leaf (Fig. 7). As temperature increases, CO2 assimilation increases up to a maximum value of 14.2 µmol m−2 s−1 at 26 ∘C. This CO2 assimilation follows the expected cubic fit (Yamori et al., 2010). In contrast, formic acid continues to increase above the photosynthesis maximum, with maximum emission (2.30 µg m−2 min−1) occurring at 29 ∘C. However, we emphasize that this represents a single experiment using the CIMS to demonstrate the utility of coupling the CIMS to the PPS, rather than an extensive or replicated experiment of formic acid emissions. Thus, these observations should be considered a case study, rather than emissions ratios to be used in models. While the terpenoids of the essential oils of spearmint have been investigated (Delfine et al., 2005), stored and emitted compounds may differ. There is a need for studies focusing on the leaf-level emission rate of VOCs, including monoterpenes and formic acid. This case study demonstrates the potential for the PPS to be coupled to real-time measurements in exploring less-studied BVOCs, such as organic acids, at a leaf level.
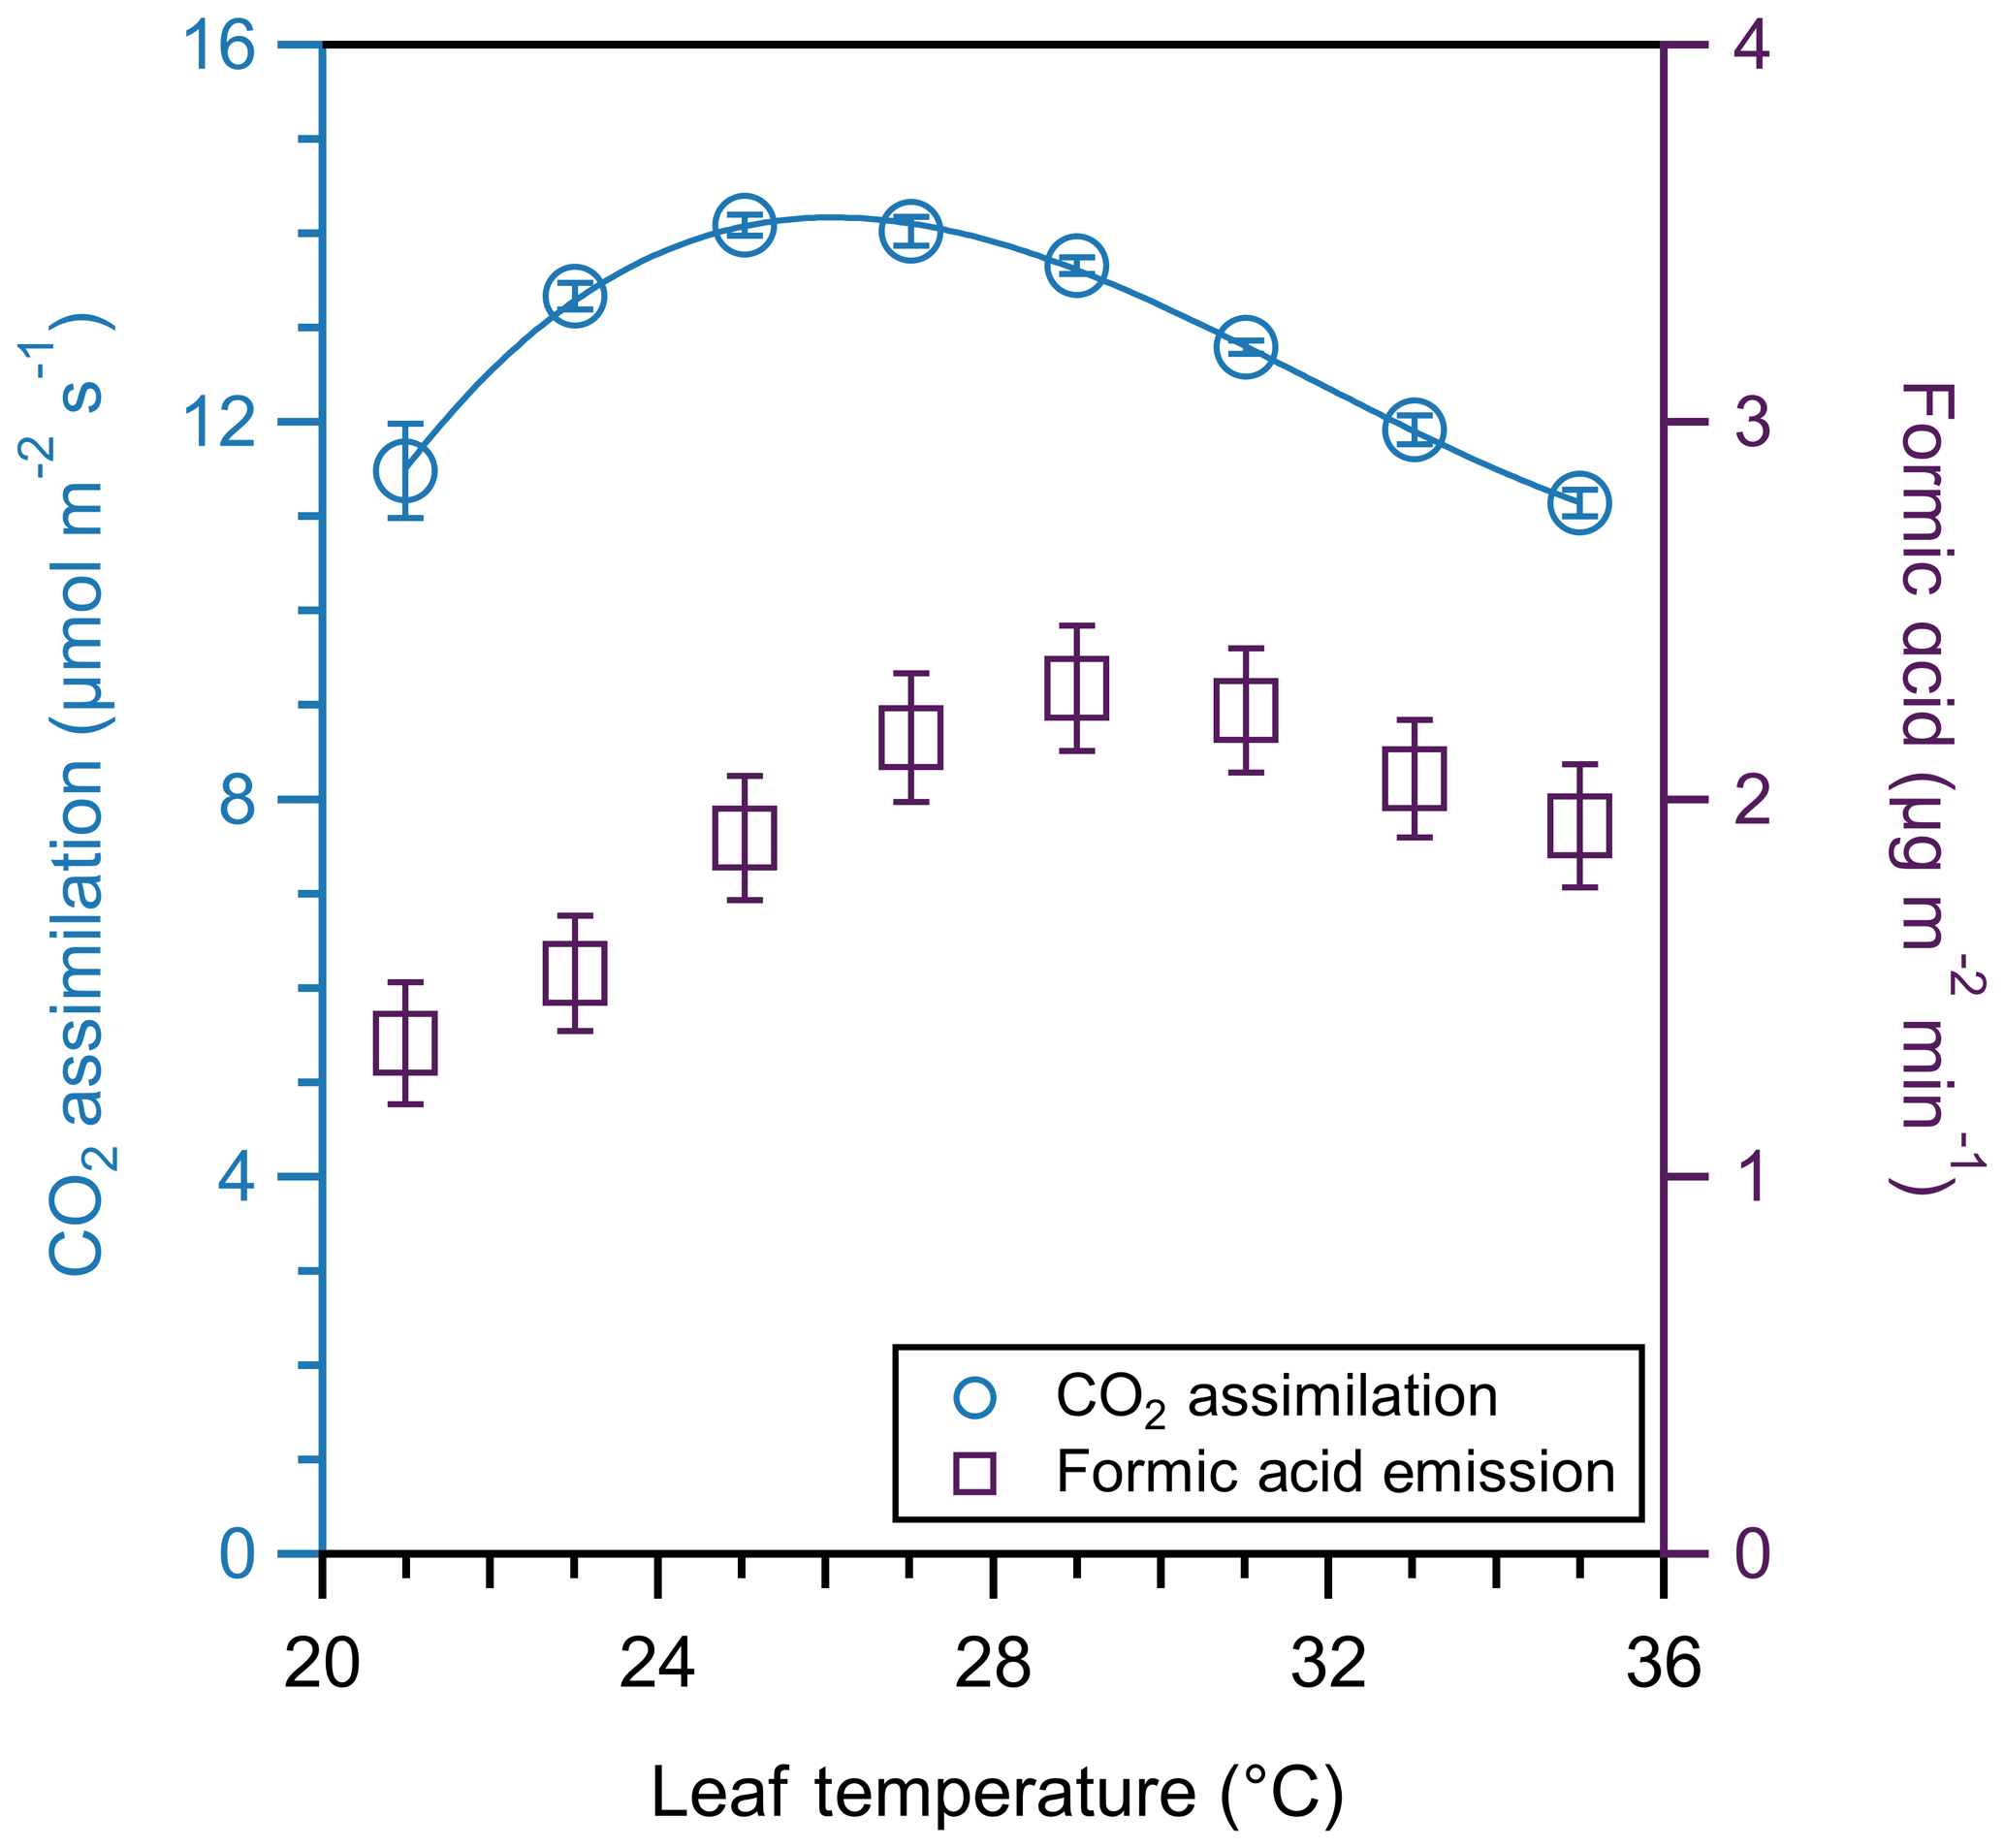
Figure 7CO2 assimilation (blue circles) and formic acid emission (purple squares) temperature response curve of one spearmint leaf. Temperatures varied by 2 ∘C from 21 to 35 ∘C. CO2 assimilation follows the expected cubic fit. We collected assimilation and formic acid emission measurements for 5 min and averaged the values of each; error bars represent the standard deviation of those averages.
5.2 Decanal emissions
C6–C10 aldehydes are an understudied class of plant BVOC emissions (Ciccioli et al., 1993; Wildt et al., 2003; Owen et al., 1997). Aldehydes can contribute to free radical formation in the atmosphere through photolysis or reaction with OH radicals (Atkinson, 1986). Decanal (C10 aldehyde) is present in atmospheric mixing ratios of parts per trillion by volume (pptv) to parts per billion by volume (ppbv) (Ciccioli et al., 1993) and is emitted by plants in response to stress (Wildt et al., 2003). Here, we demonstrate the potential for offline measurements (i.e., the TD-GC/MS) coupled to the PPS to investigate plant emissions of C6–C10 aldehydes. Figure 8 shows the temperature response curve of a single leaf on a basil plant (Ocimum basilicum), a popular culinary herb. We collected single sorbent tubes for 20 min at each point as we varied temperature by ∼3 ∘C from 18 to 35 ∘C. The LI-6800 simultaneously measured photosynthesis every 30 s. Background decanal concentrations in ambient air were 11±1 ppb (average ± standard deviation).

Figure 8CO2 assimilation (blue circles) and decanal emission (purple squares) temperature response curve of one basil leaf. CO2 assimilation is fit to a cubic function. We collected CO2 assimilation values 10 times over 20 min and averaged the values; error bars represent the standard deviation of those measurements. Error bars for decanal emissions represent instrumental error. The dashed line denotes 0 µg m−2 min−1 of decanal emissions.
CO2 assimilation increases over the entire range of temperatures, beginning to stabilize around 33 ∘C. The CO2 assimilation values for this study are within the range of values from previous studies (Golpayegani and Tilebeni, 2011). A cubic fit to assimilation suggests that 35 ∘C was the maxim in assimilation, which would decrease at higher temperatures. In contrast to photosynthesis, decanal exhibits bidirectional exchange. As temperature increases, decanal emissions are initially zero or negative (i.e., lower than the background concentration of input air) and then show enhanced uptake with increasing temperature before a turnover point at which emission rapidly increases. The temperature response is inconsistent with stored pools (Grote et al., 2013), suggesting a more complex biochemical pathway.
The observed uptake of decanal below 27 ∘C supports the idea of a turnover point and bidirectional exchange of VOCs (Niinemets et al., 2014; Millet et al., 2018). Further investigation of turnover points as a function of varying input air VOC concentrations are warranted. Essential oil emissions of monoterpenes are quantified for basil (Tarchoune et al., 2013); however, the leaf-level emission of decanal is understudied and has not yet been investigated for this species. The range of decanal emissions varies greatly in this study, but our findings suggest that, at high temperatures, decanal may be more strongly emitted than previously found. Our highest emissions at 35 ∘C are over 200 times greater than emission rates found from canola plants (Wildt et al., 2003). There is a need for further study investigating the interspecies differences in aldehyde emissions, in addition to the light and temperature dependencies of decanal emissions.
The temperature response of photosynthetic metrics can be used to compare the thermotolerance between species or between plants of the same species. For example, this study suggests that basil has a photosynthetic maximum at temperatures greater than spearmint (35 ∘C, Fig. 8; 26 ∘C Fig. 7, respectively), despite the fact that basil had a lower overall CO2 assimilation rate. At temperatures above the maximum, photosynthesis and plant productivity may be inhibited (Berry and Bjorkman, 1980), suggesting that basil may have a higher thermotolerance than spearmint. We note that this comparison only considers short-term temperature increases, and further investigations would be necessary to determine the acclimation potential of these plant species to higher temperatures. The temperature response of trace gases can be used to further investigate the mechanisms by which different compounds are emitted. Comparing the emission of less-studied compounds like decanal to better-studied compounds like monoterpenes can improve the understanding of the regulating factors in leaf-level BVOC emissions.
5.3 Monoterpene emissions
The PPS coupled emission sampling method is portable, which we take advantage of in our third case study. While BVOC emission studies often quantify emissions in terms of dry leaf weight, in situ measurements enable us to collect data based on leaf area, which is used in many emissions models.
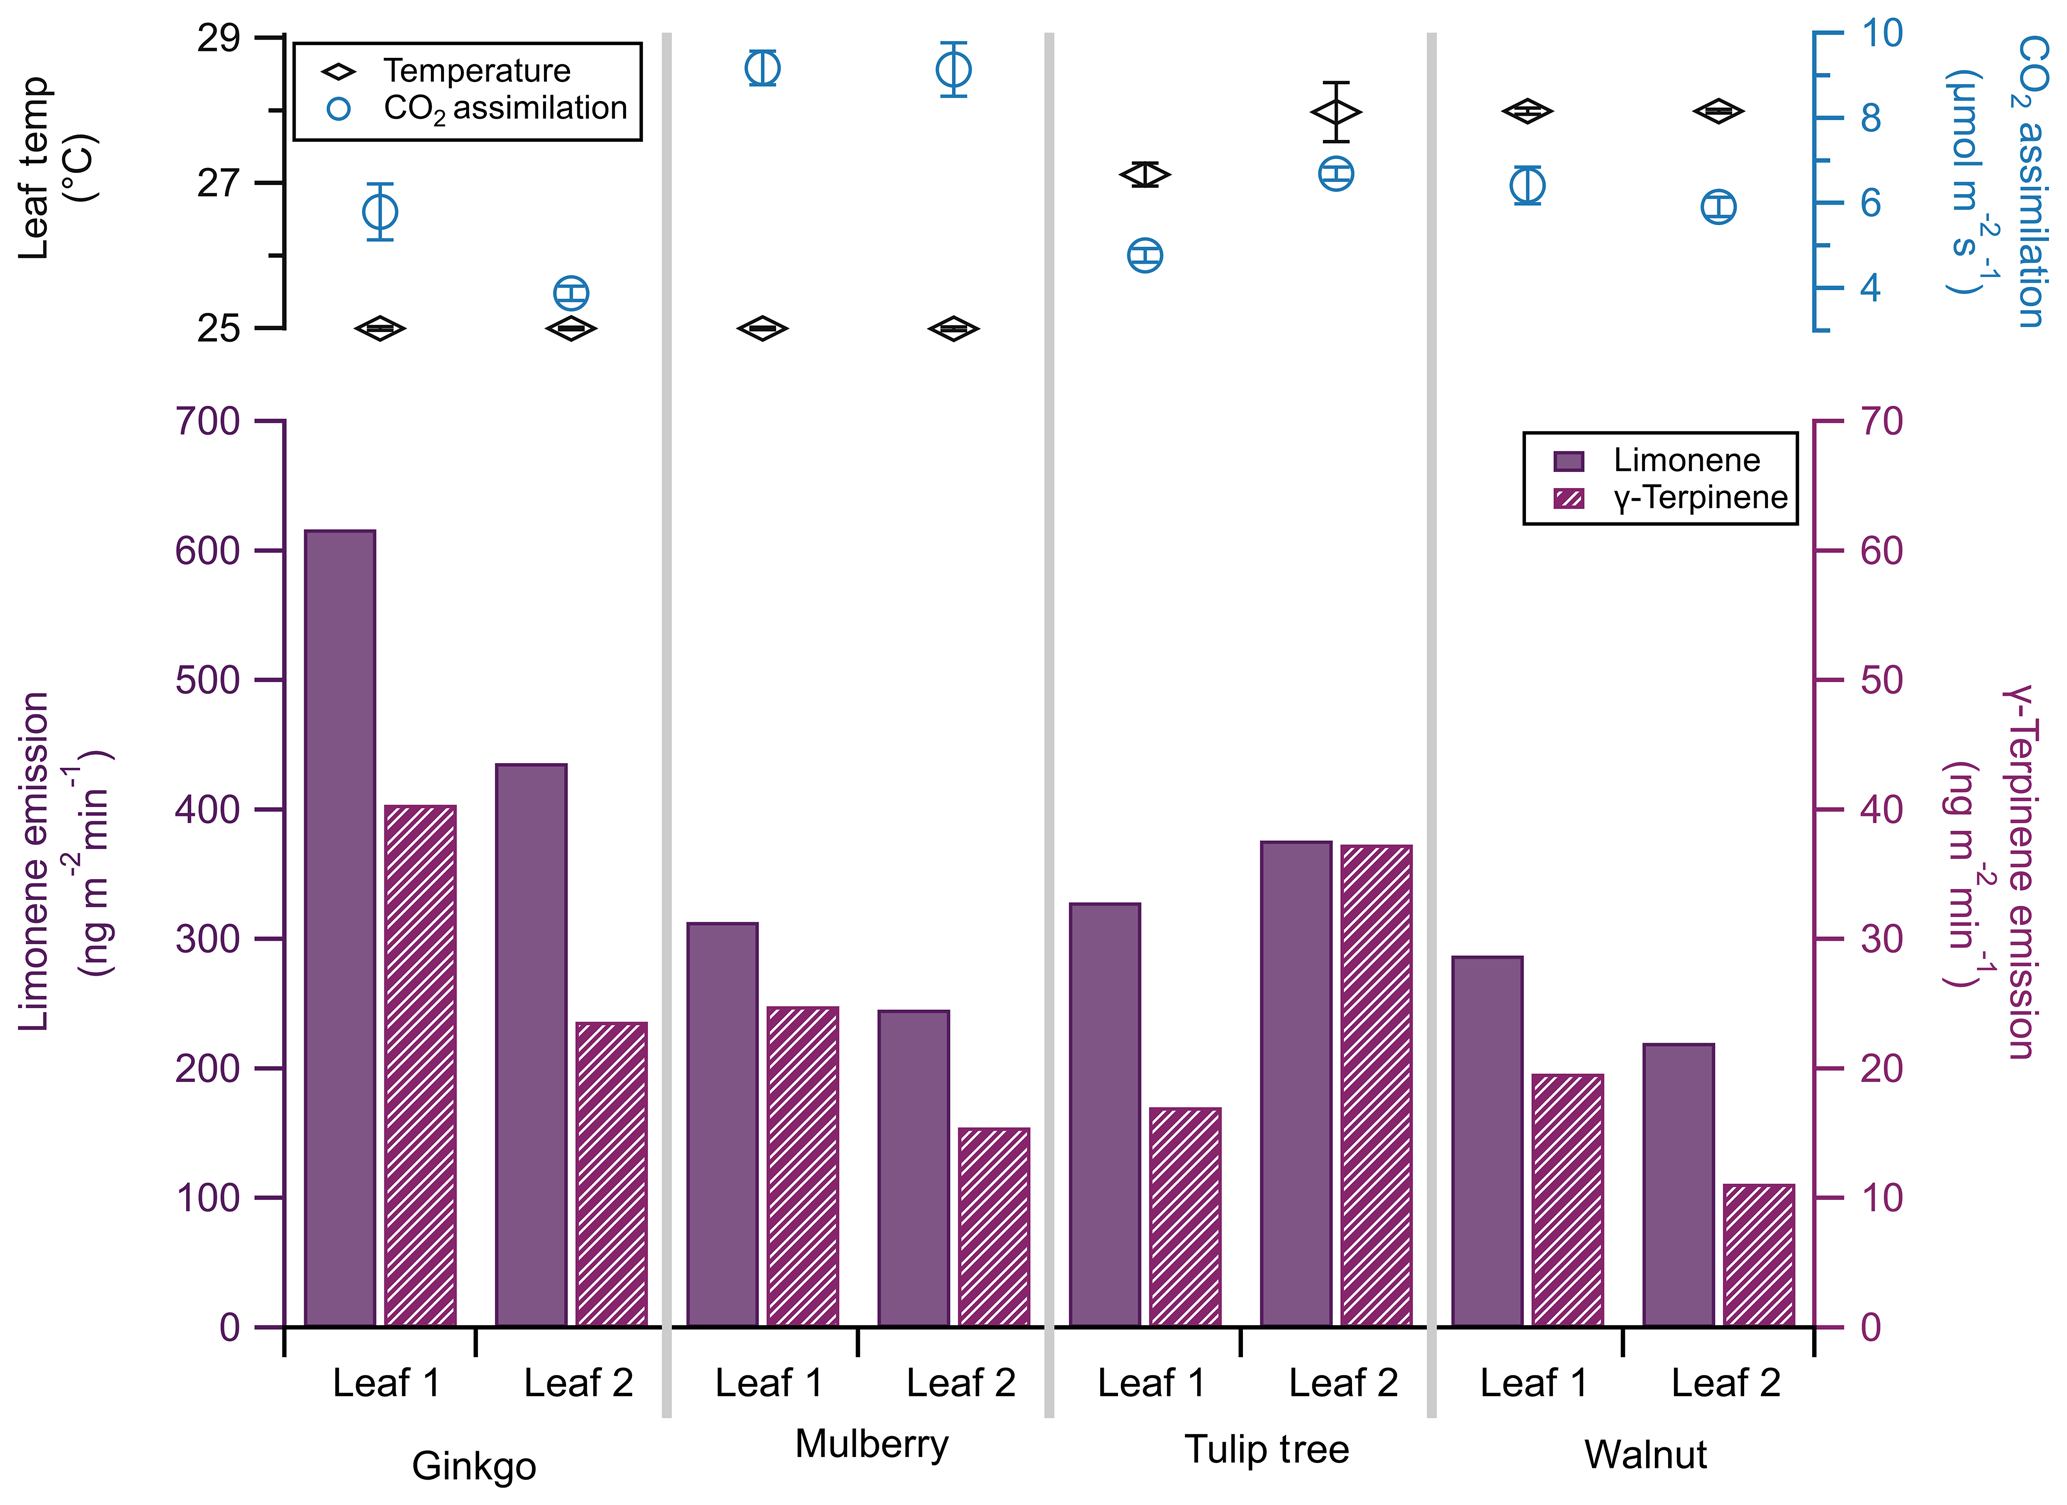
Figure 9Limonene (solid bars, left bottom axis) and γ-terpinene (striped bars, right bottom axis) emissions of two leaves from each of three plant species: ginkgo, mulberry, and walnut. Note that the scale of the limonene emission axis is 10 times that of the γ-terpinene emission axis. Leaf temperature (black diamonds, left top axis) and CO2 assimilation (blue circles, right top axis) are included, with standard deviation bars (n=60).
To investigate the difference in limonene and γ-terpinene emissions between plants of different species, we sampled two shaded leaves of each of three tree species during the summer of 2019 in the Colorado State University Arboretum in Fort Collins, CO. We sampled Ginkgo biloba (ginkgo), Morus alba (mulberry), and Juglans regia (walnut). These species cover a variety of uses: ginkgo is one of the longest-living tree species and is used in dietary supplements (Strømgaard and Nakanishi, 2004); mulberry is a primary food source for silkworms and is used for paper production (He et al., 2013), and walnut is of economic importance as timber (Ares and Brauer, 2004). These three species are considered low emitters of monoterpenes (Benjamin and Winer, 1998); our identification and quantification of their monoterpene emissions highlight the sensitivity of this technique.
Emissions were taken at 27±2 ∘C, near-ambient CO2 (414 ppm), and under saturating light conditions (2000 µmol m−2 s−1). We simultaneously sampled monoterpene emissions using the sorbent cartridges (30 min collection) and photosynthesis (30 s time resolution) at each temperature. Leaf temperature was difficult to regulate in the field. The PPS maintained a 25 ∘C leaf temperature with ambient temperatures up to 29 ∘C, but it could not keep leaf temperatures below 28 ∘C when ambient temperatures increased, even with shading and ice packs.
Previous studies have identified monoterpene emissions in ginkgo (Li et al., 2009), mulberry (Papiez et al., 2009), and walnut (Casado et al., 2008); however, these studies calculate emission rates in units of dry weight. Models that rely on leaf area to calculate monoterpene fluxes must thus account for differences between dry weight and leaf area. Alternatively, emissions collected via this method are already normalized to surface area and do not require a major conversion.
Here, limonene emissions from all species were an order of magnitude greater than γ-terpinene by factors of 10–20 (Fig. 9). This ratio can change based on genotype; for example, the ratio of limonene to γ-terpinene emissions in different black walnut genotypes ranges from 4.1 : 1 to 1 : 1.7 (Blood et al., 2018). Monoterpene emission rates from individual leaves varied, though this variance was more notable for γ-terpinene than limonene, in agreement with previous studies (Blood et al., 2018). For example, we found that limonene emission rates differed by 24 % between the two mulberry leaves, whereas γ-terpinene differed by 46 %.
Within leaves of a single plant, chamber temperature and subsequent CO2 assimilation rates were similar (<0.5 % difference in assimilation between leaves of the same plant), and observed CO2 assimilation rates agreed with previous measurements (Pandey et al., 2003; Baraldi et al., 2019; Nicodemus et al., 2008). This discrepancy in variance between CO2 assimilation and monoterpene emissions on a single plant highlights the limitation of tying modeled photosynthesis rates to VOC emissions and warrants further investigation. We focus on two monoterpenes here; however, this field survey approach to trace gas VOC emissions can provide a species-specific monoterpene emission cassette.
We provide an example monoterpene emission cassette. Figure 10 puts those emissions into an atmospheric context. We show that, although α-pinene contributes to 22 % of the measured emissions, it only contributes to 7 % of overall OH formation and 0.5 % of ozone formation. Although α-terpinene contributes to 20 % of the measured emissions, it is the dominating factor in both OH and ozone formation (44 % and 98 %, respectively). This technique allows for the speciation necessary to understand both the factors which influence emission rates and their subsequent atmospheric impact.
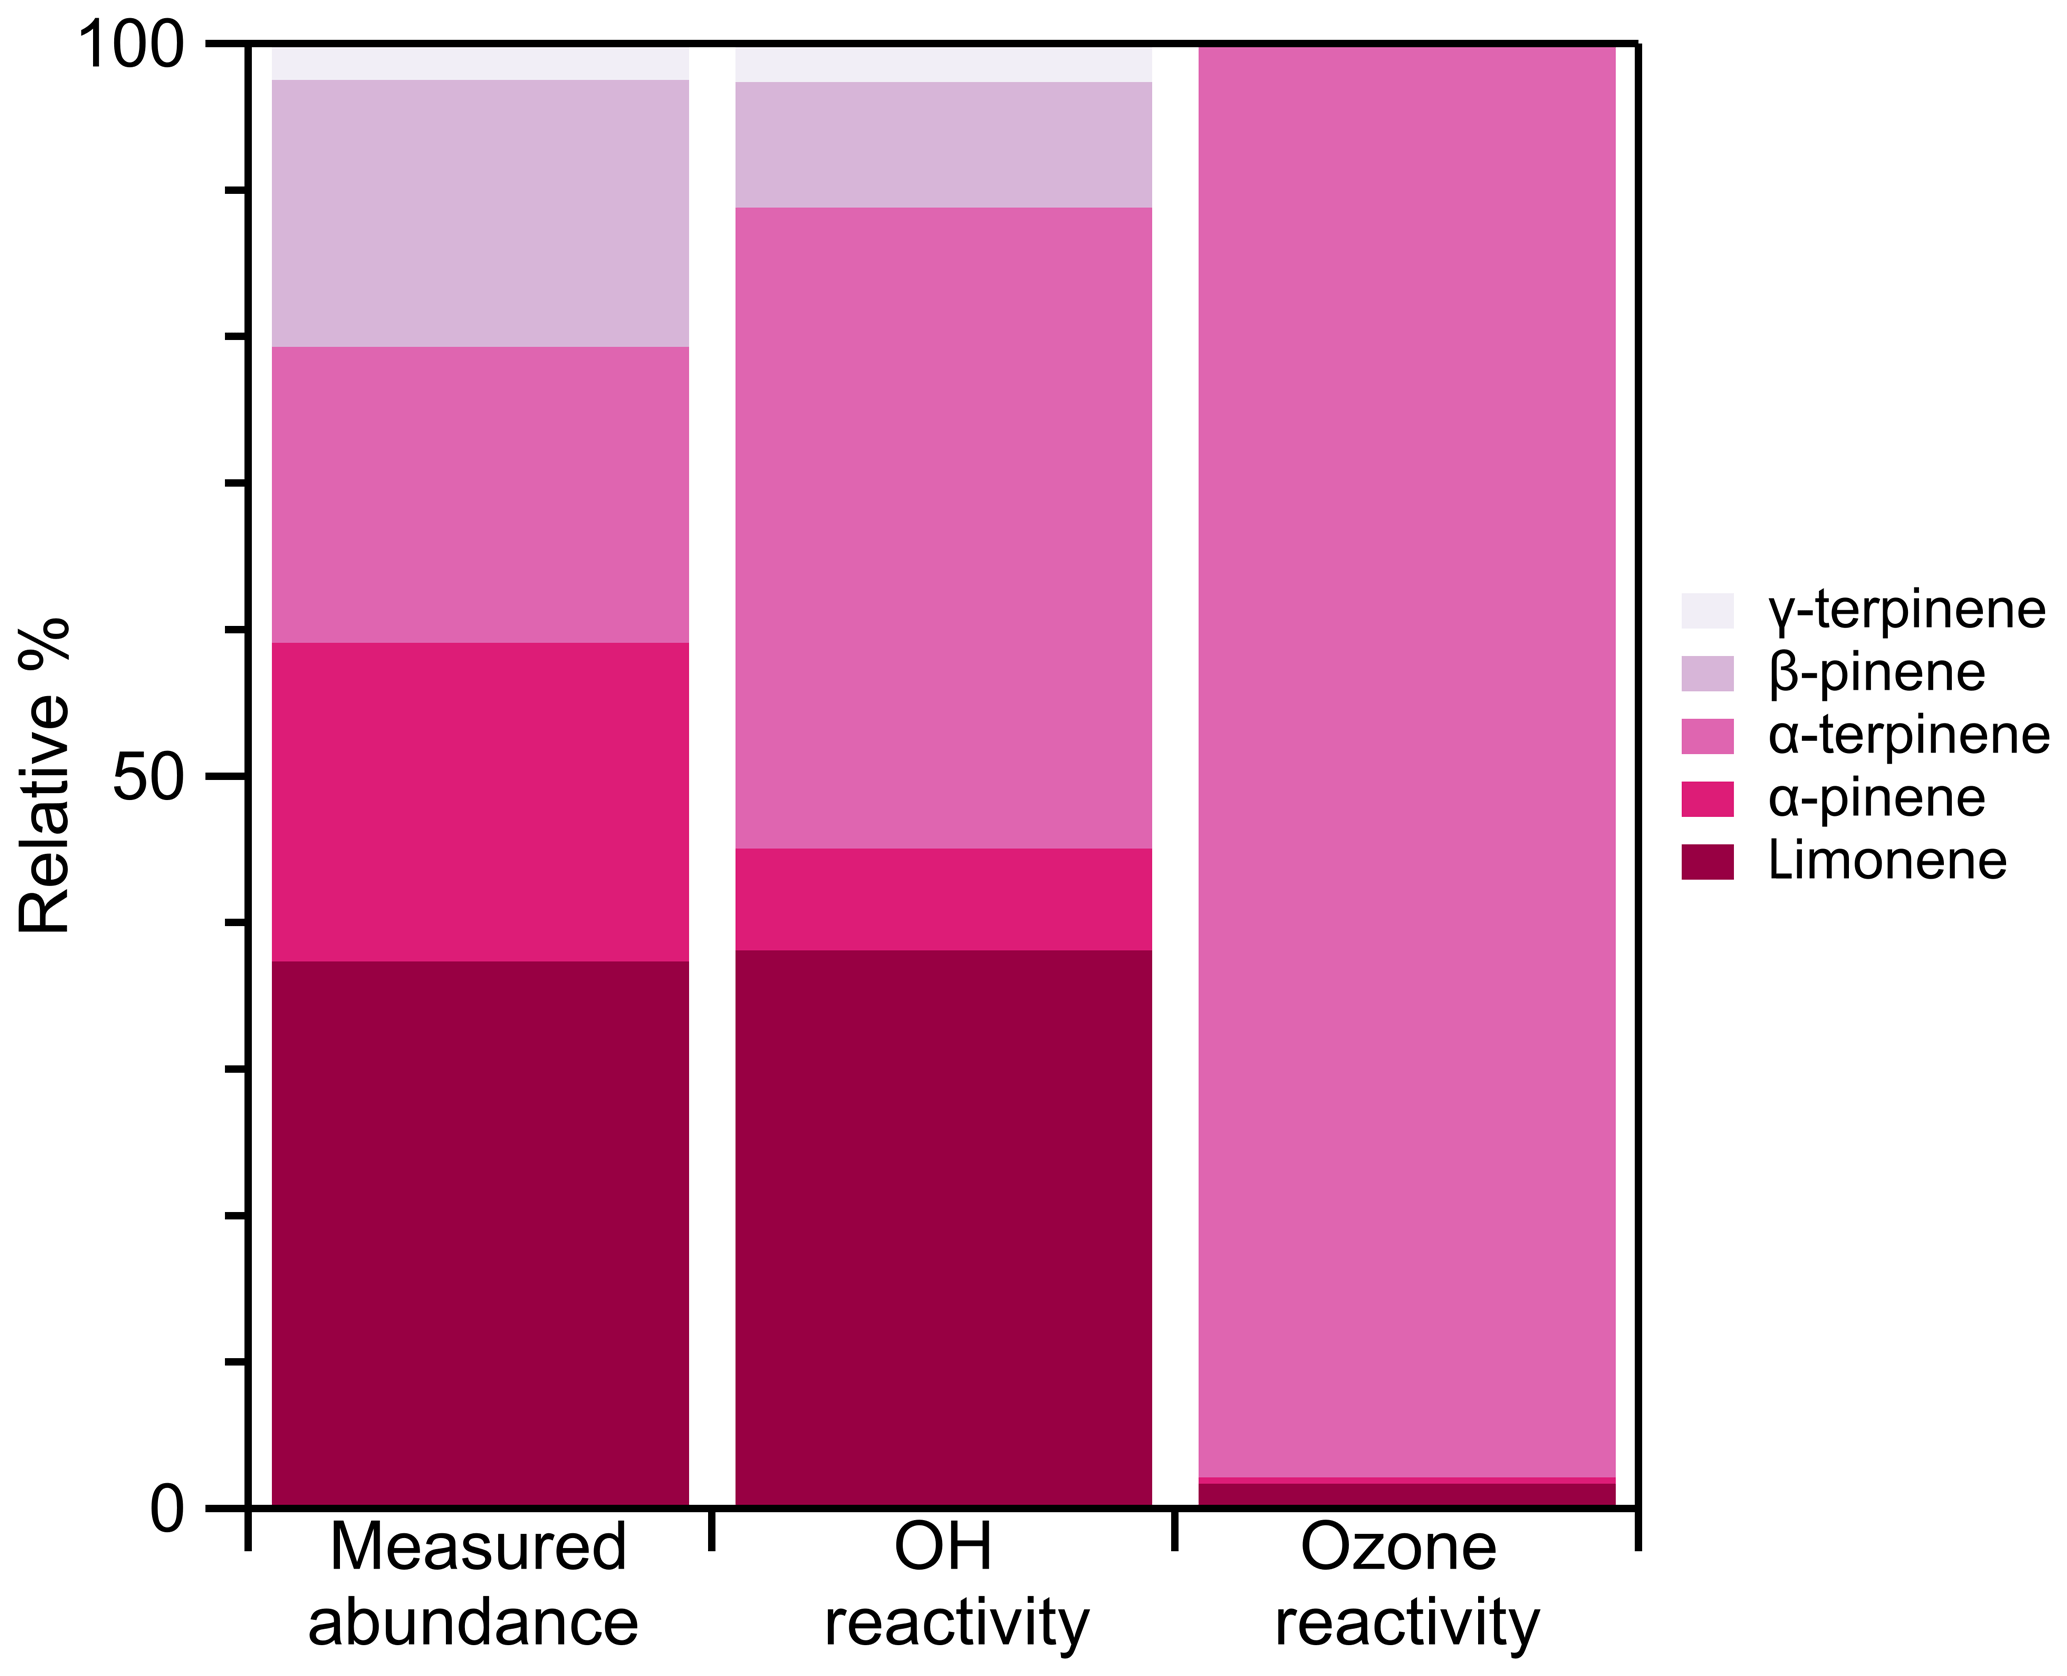
Figure 10Relative measured abundance of all quantified monoterpenes from ginkgo leaf 1 (Fig. 9) and the subsequent relative contribution to both OH reactivity and ozone reactivity. OH and ozone reactivity were calculated using kOH and kozone rate constants from Atkinson (1997).
This case study supports previous findings that leaf emissions can vary between leaves of one tree (Staudt et al., 2001b), between trees of one species (Staudt et al., 2001b), and between trees of different species (Benjamin et al., 1996) – but that trace gas sampling with the PPS is a viable method for investigating these sources of variance. We further highlight the importance of speciated monoterpene analysis and this technique's application for such analyses.
This study shows the utility of a new PPS coupled with both online and offline analysis for the analysis of leaf-level gas emissions, as well as the limitations and caveats associated with those measurements. In particular, trace gas measurements with high airflow needs (>1 L min−1) must be used carefully. Using an external CO2 monitor to calculate CO2 assimilation rates, we verify the integrity of the subsampling manifold and provide relevant equations for calculations of plant gas exchange.
The PPS coupling described herein has substantial potential for improving our understanding of plant emissions. For example, different CIMS ionization sources can target different types of organic molecules (e.g., acetate ionization for organic acids vs. iodide ionization for oxygenated organics), and different sorbent materials in thermal desorption tubes enable the detection of different compounds (i.e., Tenax for monoterpenes vs. graphitic carbon for isoprene). However, we emphasize the importance of carefully considering potential contaminants from the PPS itself and the use of frequent system background measurements through both the SAM port in the absence of a leaf and the REF port in the presence of the leaf. The further potential to control the composition of the airflow into the PPS will enable the investigation of compensation points.
Data presented in figures herein may be accessed online at https://doi.org/10.17605/OSF.IO/8CS75 (Riches, 2020).
The supplement related to this article is available online at: https://doi.org/10.5194/amt-13-4123-2020-supplement.
MR, DL, and DKF designed the experiments, and MR and DL carried them out. MR analyzed the data in consultation with DL and DKF. MR and DKF prepared the paper.
The authors declare that they have no conflict of interest.
We thank Karolien Denef for assistance with the GC/MS in the Central Instrument Facility CORE at Colorado State University and Elizabeth Gordon (LI-COR, Inc.). We thank James Mattila for his assistance with CIMS calculations, as well as Tyson Berg and Jarod Snook for their assistance with data collection.
This research has been supported by the National Science Foundation (grant no. 1614315) and the Eppley Foundation for Research.
This paper was edited by Daniela Famulari and reviewed by two anonymous referees.
Alwe, H. D., Millet, D. B., Chen, X., Raff, J. D., Payne, Z. C., and Fledderman, K.: Oxidation of volatile organic compounds as the major source of formic acid in a mixed forest canopy, Geophys. Res. Lett., 46, 2940–2948, 2019.
Ares, A. and Brauer, D.: Growth and nut production of black walnut in relation to site, tree type and stand conditions in south-central United States, Agroforest. Syst., 63, 83–90, 2004.
Arneth, A., Monson, R. K., Schurgers, G., Niinemets, Ü., and Palmer, P. I.: Why are estimates of global terrestrial isoprene emissions so similar (and why is this not so for monoterpenes)?, Atmos. Chem. Phys., 8, 4605–4620, https://doi.org/10.5194/acp-8-4605-2008, 2008.
Atkinson, R.: Kinetics and mechanisms of the gas-phase reactions of the hydroxyl radical with organic compounds under atmospheric conditions, Chem. Rev., 86, 69–201, 1986.
Atkinson, R.: Gas-phase tropospheric chemistry of volatile organic compounds: 1. Alkanes and alkenes, J. Phys. Chem. Ref. Data, 26, 215–290, https://doi.org/10.1063/1.556012, 1997.
Atkinson, R. and Arey, J.: Gas-phase tropospheric chemistry of biogenic volatile organic compounds: a review, Atmos. Environ., 37, 197–219, 2003.
Baraldi, R., Chieco, C., Neri, L., Facini, O., Rapparini, F., Morrone, L., Rotondi, A., and Carriero, G.: An integrated study on air mitigation potential of urban vegetation: From a multi-trait approach to modeling, Urban For. Urban Green., 41, 127–138, 2019.
Benjamin, M. T., Sudol, M., Bloch, L., and Winer, A. M.: Low-emitting urban forests: a taxonomic methodology for assigning isoprene and monoterpene emission rates, Atmos. Environ., 30, 1437–1452, 1996.
Benjamin, M. T. and Winer, A. M.: Estimating the ozone-forming potential of urban trees and shrubs, Atmo. Environ., 32, 53–68, 1998.
Bernal, E.: Limit of detection and limit of quantification determination in gas chromatography, in: Advances in Gas Chromatography, IntechOpen, https://doi.org/10.5772/57341, 2014.
Berry, J. and Bjorkman, O.: Photosynthetic response and adaptation to temperature in higher plants, Annu. Rev. Plant Physio., 31, 491–543, 1980.
Blood, B., Klingeman, W., Paschen, M., Hadžiabdić, Đ., Couture, J., and Ginzel, M.: Behavioral responses of Pityophthorus juglandis (Coleoptera: Curculionidae: Scolytinae) to volatiles of black walnut and Geosmithia morbida (Ascomycota: Hypocreales: Bionectriaceae), the causal agent of Thousand Cankers Disease, Environ. Entomol., 47, 412–421, 2018.
Brilli, F., Barta, C., Fortunati, A., Lerdau, M., Loreto, F., and Centritto, M.: Response of isoprene emission and carbon metabolism to drought in white poplar (Populus alba) saplings, New Phytol., 175, 244–254, 2007.
Brilli, F., Ruuskanen, T. M., Schnitzhofer, R., Müller, M., Breitenlechner, M., Bittner, V., Wohlfahrt, G., Loreto, F., and Hansel, A.: Detection of plant volatiles after leaf wounding and darkening by proton transfer reaction “time-of-flight” mass spectrometry (PTR-TOF), PLOS One, 6, e20419, https://doi.org/10.1371/journal.pone.0020419, 2011.
Brophy, P. and Farmer, D. K.: A switchable reagent ion high resolution time-of-flight chemical ionization mass spectrometer for real-time measurement of gas phase oxidized species: characterization from the 2013 southern oxidant and aerosol study, Atmos. Meas. Tech., 8, 2945–2959, https://doi.org/10.5194/amt-8-2945-2015, 2015.
Bunce, J.: Acclimation of photosynthesis to temperature in Arabidopsis thaliana and Brassica oleracea, Photosynthetica, 46, 517–524, 2008.
Casado, D., Gemeno, C., Avilla, J., and Riba, M.: Diurnal variation of walnut tree volatiles and electrophysiological responses in Cydia pomonella (Lepidoptera: Tortricidae), Pest Manag. Sci., 64, 736–747, 2008.
Chaudhary, P., Godara, S., Cheeran, A., and Chaudhari, A. K.: Fast and accurate method for leaf area measurement, Int. J. Comput. Appl. T., 49, 22–25, 2012.
Ciccioli, P., Brancaleoni, E., Frattoni, M., Cecinato, A., and Brachetti, A.: Ubiquitous occurrence of semi-volatile carbonyl compounds in tropospheric samples and their possible sources, Atmos. Environ. A-Gen., 27, 1891–1901, 1993.
Ciccioli, P., Brancaleoni, E., Frattoni, M., Di Palo, V., Valentini, R., Tirone, G., Seufert, G., Bertin, N., Hansen, U., and Csiky, O.: Emission of reactive terpene compounds from orange orchards and their removal by within-canopy processes, J. Geophys. Res.-Atmos., 104, 8077–8094, 1999.
Constable, J. V., Litvak, M. E., Greenberg, J. P., and Monson, R. K.: Monoterpene emission from coniferous trees in response to elevated CO2 concentration and climate warming, Glob. Change Biol., 5, 252–267, 1999.
Davidson, C. I., Phalen, R. F., and Solomon, P. A.: Airborne particulate matter and human health: A review, Aerosol Sci. Tech., 39, 737–749, 2005.
Delfine, S., Loreto, F., Pinelli, P., Tognetti, R., and Alvino, A.: Isoprenoids content and photosynthetic limitations in rosemary and spearmint plants under water stress, Agr. Ecosyst. Environ., 106, 243–252, 2005.
Dettmer, K. and Engewald, W.: Adsorbent materials commonly used in air analysis for adsorptive enrichment and thermal desorption of volatile organic compounds, Anal. Bioanal. Chem., 373, 490–500, 2002.
Domurath, N., Schroeder, F.-G., and Glatzel, S.: Light response curves of selected plants under different light conditions, Acta Hortic., 956, 291–298, 2012.
Duhl, T. R., Helmig, D., and Guenther, A.: Sesquiterpene emissions from vegetation: a review, Biogeosciences, 5, 761–777, https://doi.org/10.5194/bg-5-761-2008, 2008.
Ebel, R. C., Mattheis, J. P., and Buchanan, D. A.: Drought stress of apple trees alters leaf emissions of volatile compounds, Physiol. Plantarum, 93, 709–712, 1995.
Faiola, C. L., Buchholz, A., Kari, E., Yli-Pirilä, P., Holopainen, J. K., Kivimäenpää, M., Miettinen, P., Worsnop, D. R., Lehtinen, K. E. J., Guenther, A. B., and Virtanen, A.: Terpene Composition Complexity Controls Secondary Organic Aerosol Yields from Scots Pine Volatile Emissions, Sci. Rep.-UK, 8, 3053, https://doi.org/10.1038/s41598-018-21045-1, 2018.
Fernandes, A. S., Baker, E., and Martin, J.: Studies on plant cuticle: VI. The isolation and fractionation of cuticular waxes, Ann. Appl. Biol., 53, 43–58, 1964.
Friedman, B. and Farmer, D. K.: SOA and gas phase organic acid yields from the sequential photooxidation of seven monoterpenes, Atmos. Environ., 187, 335–345, 2018.
Fromme, H., Witte, M., Fembacher, L., Gruber, L., Hagl, T., Smolic, S., Fiedler, D., Sysoltseva, M., and Schober, W.: Siloxane in baking moulds, emission to indoor air and migration to food during baking with an electric oven, Environ. Int., 126, 145–152, https://doi.org/10.1016/j.envint.2019.01.081, 2019.
Fulgham, S. R., Brophy, P., Link, M., Ortega, J., Pollack, I., and Farmer, D. K.: Seasonal flux measurements over a Colorado pine forest demonstrate a persistent source of organic acids, ACS Earth Space Chem., 3, 2017–2032, 2019.
Geron, C., Guenther, A., Greenberg, J., Karl, T., and Rasmussen, R.: Biogenic volatile organic compound emissions from desert vegetation of the southwestern US, Atmos. Environ., 40, 1645–1660, 2006a.
Geron, C., Owen, S., Guenther, A., Greenberg, J., Rasmussen, R., Bai, J. H., Li, Q.-J., and Baker, B.: Volatile organic compounds from vegetation in southern Yunnan Province, China: Emission rates and some potential regional implications, Atmos. Environ., 40, 1759–1773, 2006b.
Goldstein, A., McKay, M., Kurpius, M., Schade, G., Lee, A., Holzinger, R., and Rasmussen, R.: Forest thinning experiment confirms ozone deposition to forest canopy is dominated by reaction with biogenic VOCs, Geophys. Res. Lett., 31, L22106, https://doi.org/10.1029/2004GL021259, 2004.
Golpayegani, A. and Tilebeni, H. G.: Effect of biological fertilizers on biochemical and physiological parameters of basil (Ociumum basilicm L.) medicine plant, Am. Eurasian J. Agric. Environ. Sci., 11, 411–416, 2011.
Grote, R., Monson, R. K., and Niinemets, Ü.: Leaf-level models of constitutive and stress-driven volatile organic compound emissions, in: Biology, controls and models of tree volatile organic compound emissions, Springer, Dordrecht, the Netherlands, 315–355, 2013.
Grote, R., Morfopoulos, C., Niinemets, Ü., Sun, Z., Keenan, T. F., Pacifico, F., and Butler, T.: A fully integrated isoprenoid emissions model coupling emissions to photosynthetic characteristics, Plant Cell Environ., 37, 1965–1980, 2014.
Guenther, A. B.: Seasonal and spatial variations in natural volatile organic compound emissions, Ecol. Appl., 7, 34–45, 1997.
Guenther, A. B., Zimmerman, P. R., Harley, P. C., Monson, R. K., and Fall, R.: Isoprene and monoterpene emission rate variability: model evaluations and sensitivity analyses, J. Geophys. Res.-Atmos., 98, 12609–12617, 1993.
Guenther, A. B., Hewitt, C. N., Erickson, D., Fall, R., Geron, C., Graedel, T., Harley, P., Klinger, L., Lerdau, M., and McKay, W.: A global model of natural volatile organic compound emissions, J. Geophys. Res.-Atmos., 100, 8873–8892, 1995.
Guenther, A. B., Geron, C., Pierce, T., Lamb, B., Harley, P., and Fall, R.: Natural emissions of non-methane volatile organic compounds, carbon monoxide, and oxides of nitrogen from North America, Atmos. Environ., 34, 2205–2230, 2000.
Guenther, A. B., Jiang, X., Heald, C. L., Sakulyanontvittaya, T., Duhl, T., Emmons, L. K., and Wang, X.: The Model of Emissions of Gases and Aerosols from Nature version 2.1 (MEGAN2.1): an extended and updated framework for modeling biogenic emissions, Geosci. Model Dev., 5, 1471–1492, https://doi.org/10.5194/gmd-5-1471-2012, 2012.
Harley, P., Eller, A., Guenther, A., and Monson, R. K.: Observations and models of emissions of volatile terpenoid compounds from needles of ponderosa pine trees growing in situ: control by light, temperature and stomatal conductance, Oecologia, 176, 35–55, 2014.
Harper, M.: Sorbent trapping of volatile organic compounds from air, J. Chromatogr. A, 885, 129–151, 2000.
He, N., Zhang, C., Qi, X., Zhao, S., Tao, Y., Yang, G., Lee, T.-H., Wang, X., Cai, Q., and Li, D.: Draft genome sequence of the mulberry tree Morus notabilis, Nat. Comm., 4, 1–9, 2013.
Hodges, A. W. and Spreen, T. H.: Economic impacts of citrus greening (HLB) in Florida, 2006/07–20/11, University of Florida, Institute of Food and Agricultural Science, EDIS document FE903, Gainesville, USA, 1–6, available at: https://journals.flvc.org/edis/article/view/119504 (last access: 1 August 2020), 2012.
Holopainen, J. K.: Multiple functions of inducible plant volatiles, Trends Plant Sci., 9, 529–533, 2004.
Kainulainen, P., Holopainen, J., and Holopainen, T.: The influence of elevated CO2 and O3 concentrations on Scots pine needles: changes in starch and secondary metabolites over three exposure years, Oecologia, 114, 455–460, 1998.
Kaser, L., Karl, T., Guenther, A., Graus, M., Schnitzhofer, R., Turnipseed, A., Fischer, L., Harley, P., Madronich, M., Gochis, D., Keutsch, F. N., and Hansel, A.: Undisturbed and disturbed above canopy ponderosa pine emissions: PTR-TOF-MS measurements and MEGAN 2.1 model results, Atmos. Chem. Phys., 13, 11935–11947, https://doi.org/10.5194/acp-13-11935-2013, 2013.
Kaser, L., Karl, T., Schnitzhofer, R., Graus, M., Herdlinger-Blatt, I. S., DiGangi, J. P., Sive, B., Turnipseed, A., Hornbrook, R. S., Zheng, W., Flocke, F. M., Guenther, A., Keutsch, F. N., Apel, E., and Hansel, A.: Comparison of different real time VOC measurement techniques in a ponderosa pine forest, Atmos. Chem. Phys., 13, 2893–2906, https://doi.org/10.5194/acp-13-2893-2013, 2013b.
Kesselmeier, J. and Staudt, M.: Biogenic volatile organic compounds (VOC): an overview on emission, physiology and ecology, J. Atmos. Chem., 33, 23–88, 1999.
Kessler, A. and Baldwin, I. T.: Defensive function of herbivore-induced plant volatile emissions in nature, Science, 291, 2141–2144, 2001.
Khare, P., Kumar, N., Kumari, K., and Srivastava, S.: Atmospheric formic and acetic acids: An overview, Rev. Geophys., 37, 227–248, 1999.
Kim, J.-C., Kim, K.-J., Kim, D.-S., and Han, J.-S.: Seasonal variations of monoterpene emissions from coniferous trees of different ages in Korea, Chemosphere, 59, 1685–1696, 2005.
Komenda, M., Parusel, E., Wedel, A., and Koppmann, R.: Measurements of biogenic VOC emissions: sampling, analysis and calibration, Atmos. Environ., 35, 2069–2080, 2001.
Lamarque, J.-F., Bond, T. C., Eyring, V., Granier, C., Heil, A., Klimont, Z., Lee, D., Liousse, C., Mieville, A., Owen, B., Schultz, M. G., Shindell, D., Smith, S. J., Stehfest, E., Van Aardenne, J., Cooper, O. R., Kainuma, M., Mahowald, N., McConnell, J. R., Naik, V., Riahi, K., and van Vuuren, D. P.: Historical (1850–2000) gridded anthropogenic and biomass burning emissions of reactive gases and aerosols: methodology and application, Atmos. Chem. Phys., 10, 7017–7039, https://doi.org/10.5194/acp-10-7017-2010, 2010.
Lang, Y., Wang, M., Zhang, G., and Zhao, Q.: Experimental and simulated light responses of photosynthesis in leaves of three tree species under different soil water conditions, Photosynthetica, 51, 370–378, 2013.
Lathière, J., Hauglustaine, D. A., Friend, A. D., De Noblet-Ducoudré, N., Viovy, N., and Folberth, G. A.: Impact of climate variability and land use changes on global biogenic volatile organic compound emissions, Atmos. Chem. Phys., 6, 2129–2146, https://doi.org/10.5194/acp-6-2129-2006, 2006.
Lee, B. H., Lopez-Hilfiker, F. D., Mohr, C., Kurtén, T., Worsnop, D. R., and Thornton, J. A.: An iodide-adduct high-resolution time-of-flight chemical-ionization mass spectrometer: Application to atmospheric inorganic and organic compounds, Environ. Sci. Technol., 48, 6309–6317, 2014.
Lerdau, M. and Keller, M.: Controls on isoprene emission from trees in a subtropical dry forest, Plant Cell Environ., 20, 569–578, 1997.
LI-COR Biogeosciences: Using the LI-6800 Portable Photosynthesis System, LI-COR Biosciences, Nebraska, USA, 2017.
Li, D., Chen, Y., Shi, Y., He, X., and Chen, X.: Impact of elevated CO2 and O3 concentrations on biogenic volatile organic compounds emissions from Ginkgo biloba, B. Environ. Contam. Tox., 82, 473–477, 2009.
Llusià, J., Peñuelas, J., and Gimeno, B.: Seasonal and species-specific response of VOC emissions by Mediterranean woody plant to elevated ozone concentrations, Atmos. Environ., 36, 3931–3938, 2002.
Loreto, F., Förster, A., Dürr, M., Csiky, O., and Seufert, G.: On the monoterpene emission under heat stress and on the increased thermotolerance of leaves of Quercus ilex L. fumigated with selected monoterpenes, Plant Cell Environ., 21, 101–107, 1998.
Loreto, F. and Velikova, V.: Isoprene produced by leaves protects the photosynthetic apparatus against ozone damage, quenches ozone products, and reduces lipid peroxidation of cellular membranes, Plant Physiol., 127, 1781–1787, 2001.
Loreto, F. and Schnitzler, J.-P.: Abiotic stresses and induced BVOCs, Trends Plant Sci., 15, 154–166, 2010.
Markovic, D., Nikolic, N., Glinwood, R., Seisenbaeva, G., and Ninkovic, V.: Plant responses to brief touching: a mechanism for early neighbour detection?, PlOS One, 11, e0165742, https://doi.org/10.1371/journal.pone.0165742, 2016.
Mattila, J. M., Brophy, P., Kirkland, J., Hall, S., Ullmann, K., Fischer, E. V., Brown, S., McDuffie, E., Tevlin, A., and Farmer, D. K.: Tropospheric sources and sinks of gas-phase acids in the Colorado Front Range, Atmos. Chem. Phys., 18, 12315–12327, https://doi.org/10.5194/acp-18-12315-2018, 2018.
Mauck, K. E., De Moraes, C. M., and Mescher, M. C.: Deceptive chemical signals induced by a plant virus attract insect vectors to inferior hosts, P. Natl. Acad. Sci. USA, 107, 3600–3605, 2010.
Mielnik, A., Link, M., Mattila, J., Fulgham, S. R., and Farmer, D. K.: Emission of formic and acetic acids from two Colorado soils, Environ. Sci., 20, 1537–1545, 2018.
Millet, D. B., Alwe, H. D., Chen, X., Deventer, M. J., Griffis, T. J., Holzinger, R., Bertman, S. B., Rickly, P. S., Stevens, P. S., and Léonardis, T.: Bidirectional ecosystem–atmosphere fluxes of volatile organic compounds across the mass spectrum: How many matter?, ACS Earth Space Chem., 2, 764–777, 2018.
Nicodemus, M. A., Salifu, F. K., and Jacobs, D. F.: Growth, nutrition, and photosynthetic response of black walnut to varying nitrogen sources and rates, J. Plant Nutr., 31, 1917–1936, 2008.
Niinemets, Ü., Loreto, F., and Reichstein, M.: Physiological and physicochemical controls on foliar volatile organic compound emissions, Trends Plant Sci., 9, 180–186, 2004.
Niinemets, Ü., Kännaste, A., and Copolovici, L.: Quantitative patterns between plant volatile emissions induced by biotic stresses and the degree of damage, Front. Plant Sci., 4, 262, https://doi.org/10.3389/fpls.2013.00262, 2013.
Niinemets, Ü., Fares, S., Harley, P., and Jardine, K. J.: Bidirectional exchange of biogenic volatiles with vegetation: emission sources, reactions, breakdown and deposition, Plant Cell Environ., 37, 1790–1809, 2014.
Ormeño, E., Mevy, J., Vila, B., Bousquet-Mélou, A., Greff, S., Bonin, G., and Fernandez, C.: Water deficit stress induces different monoterpene and sesquiterpene emission changes in Mediterranean species. Relationship between terpene emissions and plant water potential, Chemosphere, 67, 276–284, 2007.
Owen, S., Boissard, C., Street, R., Duckham, S., Csiky, O., and Hewitt, C.: Screening of 18 Mediterranean plant species for volatile organic compound emissions, Atmos. Environ., 31, 101–117, 1997.
Owen, S., Harley, P., Guenther, A., and Hewitt, C.: Light dependency of VOC emissions from selected Mediterranean plant species, Atmos. Environ., 36, 3147–3159, 2002.
Pandey, S., Kumar, S., and Nagar, P.: Photosynthetic performance of Ginkgo biloba L. grown under high and low irradiance, Photosynthetica, 41, 505–511, 2003.
Papiez, M. R., Potosnak, M. J., Goliff, W. S., Guenther, A. B., Matsunaga, S. N., and Stockwell, W. R.: The impacts of reactive terpene emissions from plants on air quality in Las Vegas, Nevada, Atmos. Environ., 43, 4109–4123, 2009.
Park, J.-H., Goldstein, A., Timkovsky, J., Fares, S., Weber, R., Karlik, J., and Holzinger, R.: Active atmosphere-ecosystem exchange of the vast majority of detected volatile organic compounds, Science, 341, 643–647, 2013.
Paulot, F., Wunch, D., Crounse, J. D., Toon, G. C., Millet, D. B., DeCarlo, P. F., Vigouroux, C., Deutscher, N. M., González Abad, G., Notholt, J., Warneke, T., Hannigan, J. W., Warneke, C., de Gouw, J. A., Dunlea, E. J., De Mazière, M., Griffith, D. W. T., Bernath, P., Jimenez, J. L., and Wennberg, P. O.: Importance of secondary sources in the atmospheric budgets of formic and acetic acids, Atmos. Chem. Phys., 11, 1989–2013, https://doi.org/10.5194/acp-11-1989-2011, 2011.
Peñuelas, J. and Llusià, J.: The complexity of factors driving volatile organic compound emissions by plants, Biol. Plantarum, 44, 481–487, 2001.
Pope III, C. A. and Dockery, D. W.: Health effects of fine particulate air pollution: lines that connect, JAPCA J. Air Waste Ma., 56, 709–742, 2006.
Räisänen, T., Ryyppö, A., and Kellomäki, S.: Effects of elevated CO2 and temperature on monoterpene emission of Scots pine (Pinus sylvestris L.), Atmos. Environ., 42, 4160–4171, 2008.
Rapparini, F., Baraldi, R., Miglietta, F., and Loreto, F.: Isoprenoid emission in trees of Quercus ilex with lifetime exposure to naturally high CO2 environment, Plant Cell Environ., 27, 381–391, https://doi.org/10.1111/j.1365-3040.2003.01151.x, 2004.
Riches, M.: Simultaneous leaf-level measurement of trace gas emissions and photosynthesis with a portable photosynthesis system – Data, Open Science Framework, https://doi.org/10.17605/OSF.IO/8CS75, 2020.
Rinne, J., Taipale, R., Markkanen, T., Ruuskanen, T. M., Hellén, H., Kajos, M. K., Vesala, T., and Kulmala, M.: Hydrocarbon fluxes above a Scots pine forest canopy: measurements and modeling, Atmos. Chem. Phys., 7, 3361–3372, https://doi.org/10.5194/acp-7-3361-2007, 2007.
Sallas, L., Luomala, E.-M., Utriainen, J., Kainulainen, P., and Holopainen, J. K.: Contrasting effects of elevated carbon dioxide concentration and temperature on Rubisco activity, chlorophyll fluorescence, needle ultrastructure and secondary metabolites in conifer seedlings, Tree Physiol., 23, 97–108, 2003.
Scala, A., Allmann, S., Mirabella, R., Haring, M., and Schuurink, R.: Green leaf volatiles: a plant's multifunctional weapon against herbivores and pathogens, Int. J. Mol. Sci., 14, 17781–17811, 2013.
Scholefield, P., Doick, K., Herbert, B., Hewitt, C. S., Schnitzler, J. P., Pinelli, P., and Loreto, F.: Impact of rising CO2 on emissions of volatile organic compounds: isoprene emission from Phragmites australis growing at elevated CO2 in a natural carbon dioxide spring, Plant Cell Environ., 27, 393–401, 2004.
Sellin, A.: Estimating the needle area from geometric measurements: application of different calculation methods to Norway spruce, Trees, 14, 215–222, 2000.
Sharkey, T. D. and Loreto, F.: Water stress, temperature, and light effects on the capacity for isoprene emission and photosynthesis of kudzu leaves, Oecologia, 95, 328–333, 1993.
Sharkey, T. D. and Yeh, S.: Isoprene emission from plants, Annu. Rev. Plant Biol., 52, 407–436, 2001.
Singh, H. B. (Ed.): Composition, chemistry, and climate of the atmosphere, Van Nostrand Reinhold Company, New York, USA, 1995.
Singsaas, E. L., Laporte, M. M., Shi, J.-Z., Monson, R. K., Bowling, D. R., Johnson, K., Lerdau, M., Jasentuliytana, A., and Sharkey, T. D.: Kinetics of leaf temperature fluctuation affect isoprene emission from red oak (Quercus rubra) leaves, Tree Physiol., 19, 917–924, 1999.
Snow, M. D., Bard, R. R., Olszyk, D. M., Minster, L. M., Hager, A. N., and Tingey, D. T.: Monoterpene levels in needles of Douglas fir exposed to elevated CO2 and temperature, Physiol. Plantarum, 117, 352–358, 2003.
Staudt, M. and Seufert, G.: Light-dependent emission of monoterpenes by holm oak (Quercus ilex L.), Naturwissenschaften, 82, 89–92, 1995.
Staudt, M., Joffre, R., Rambal, S., and Kesselmeier, J.: Effect of elevated CO2 on monoterpene emission of young Quercus ilex trees and its relation to structural and ecophysiological parameters, Tree Physiol., 21, 437–445, 2001a.
Staudt, M., Mandl, N., Joffre, R., and Rambal, S.: Intraspecific variability of monoterpene composition emitted by Quercus ilex leaves, Can. J. Forest Res., 31, 174–180, 2001b.
Strømgaard, K. and Nakanishi, K.: Chemistry and biology of terpene trilactones from Ginkgo biloba, Angew. Chem. Int. Edit., 43, 1640–1658, 2004.
Tarchoune, I., Baâtour, O., Harrathi, J., Cioni, P. L., Lachaâl, M., Flamini, G., and Ouerghi, Z.: Essential oil and volatile emissions of basil (Ocimum basilicum) leaves exposed to NaCl or Na2SO4 salinity, J. Plant Nutr. Soil Sc., 176, 748–755, 2013.
Tarvainen, V., Hakola, H., Hellén, H., Bäck, J., Hari, P., and Kulmala, M.: Temperature and light dependence of the VOC emissions of Scots pine, Atmos. Chem. Phys., 5, 989–998, https://doi.org/10.5194/acp-5-989-2005, 2005.
Tilley, S. K. and Fry, R. C.: Priority environmental contaminants: understanding their sources of exposure, biological mechanisms, and impacts on health, in: Systems Biology in Toxicology and Environmental Health, Academic Press, UK, 117–169, 2015.
Tingey, D., Turner, D., and Weber, J.: Factors controlling the emissions of monoterpenes and other volatile organic compounds, Trace gas emissions from plants, Academic Press, San Diego, 93–119, 1990.
Tingey, D. T., Manning, M., Grothaus, L. C., and Burns, W. F.: Influence of light and temperature on monoterpene emission rates from slash pine, Plant Physiol., 65, 797–801, 1980.
Wildt, J., Kobel, K., Schuh-Thomas, G., and Heiden, A.: Emissions of oxygenated volatile organic compounds from plants Part II: emissions of saturated aldehydes, J. Atmos. Chem., 45, 173–196, 2003.
Wilkinson, M. J., Monson, R. K., Trahan, N., Lee, S., Brown, E., Jackson, R. B., Polley, H. W., Fay, P. A., and Fall, R.: Leaf isoprene emission rate as a function of atmospheric CO2 concentration, Glob. Change Biol., 15, 1189–1200, 2009.
Yamori, W., Evans, J. R., and Von Caemmerer, S.: Effects of growth and measurement light intensities on temperature dependence of CO2 assimilation rate in tobacco leaves, Plant Cell Environ., 33, 332–343, 2010.
Yang, X., Wang, X., and Wei, M.: Response of photosynthesis in the leaves of cucumber seedlings to light intensity and CO2 concentration under nitrate stress, Turk. J. Bot., 34, 303–310, 2010.
Yatavelli, R. L. N., Stark, H., Thompson, S. L., Kimmel, J. R., Cubison, M. J., Day, D. A., Campuzano-Jost, P., Palm, B. B., Hodzic, A., Thornton, J. A., Jayne, J. T., Worsnop, D. R., and Jimenez, J. L.: Semicontinuous measurements of gas–particle partitioning of organic acids in a ponderosa pine forest using a MOVI-HRToF-CIMS, Atmos. Chem. Phys., 14, 1527–1546, https://doi.org/10.5194/acp-14-1527-2014, 2014.
Zhang, P. and Chen, K.: Age-dependent variations of volatile emissions and inhibitory activity toward Botrytis cinerea and Fusarium oxysporum in tomato leaves treated with chitosan oligosaccharide, J. Plant Biol., 52, 332–339, 2009.