the Creative Commons Attribution 4.0 License.
the Creative Commons Attribution 4.0 License.
 | 19 Aug 2020
MAX-DOAS measurements of tropospheric NO2 and HCHO in Munich and the comparison to OMI and TROPOMI satellite observations
Ka Lok Chan
Matthias Wiegner
Jos van Geffen
Isabelle De Smedt
Carlos Alberti
Zhibin Cheng
Mark Wenig
We present two-dimensional scanning Multi-AXis Differential Optical Absorption Spectroscopy (MAX-DOAS) observations of nitrogen dioxide (NO2) and formaldehyde (HCHO) in Munich. Vertical columns and vertical distribution profiles of aerosol extinction coefficient, NO2 and HCHO are retrieved from the 2D MAX-DOAS observations. The measured surface aerosol extinction coefficients and NO2 mixing ratios derived from the retrieved profiles are compared to in situ monitoring data, and the surface NO2 mixing ratios show a good agreement with in situ monitoring data with a Pearson correlation coefficient (R) of 0.91. The aerosol optical depths (AODs) show good agreement as well (R = 0.80) when compared to sun photometer measurements. Tropospheric vertical column densities (VCDs) of NO2 and HCHO derived from the MAX-DOAS measurements are also used to validate Ozone Monitoring Instrument (OMI) and TROPOspheric Monitoring Instrument (TROPOMI) satellite observations. Monthly averaged data show a good correlation; however, satellite observations are on average 30 % lower than the MAX-DOAS measurements. Furthermore, the MAX-DOAS observations are used to investigate the spatiotemporal characteristic of NO2 and HCHO in Munich. Analysis of the relations between aerosol, NO2 and HCHO shows higher aerosol-to-HCHO ratios in winter, which reflects a longer atmospheric lifetime of secondary aerosol and HCHO during winter. The analysis also suggests that secondary aerosol formation is the major source of these aerosols in Munich.
- Article
(10406 KB) - Full-text XML
- BibTeX
- EndNote


Nitrogen dioxide (NO2) and formaldehyde (HCHO) are important atmospheric constituents that can have a strong influence on air quality and climate. Both play a crucial role in the formation of tropospheric ozone (O3) (Crutzen, 1970) and aerosols (Jang and Kamens, 2001), consequently having a strong impact on the Earth's radiation budget. Moreover, they are toxic to humans in high concentrations. Major sources of NO2 are fossil fuel combustion, biomass burning, lightning and oxidation of ammonia (Bond et al., 2001; Zhang et al., 2003). HCHO is an intermediate product of the oxidation of almost all volatile organic compounds (VOCs), which is why it is widely used as an indicator of nonmethane volatile organic compounds (NMVOCs) (Fried et al., 2011). VOCs also have a significant impact on the atmospheric abundance of hydroxyl (OH) radicals, which are the major oxidants in the troposphere. The main HCHO sources include oxidation of VOCs emitted from plants, biomass burning, traffic and industrial emissions. Despite the importance of HCHO, it is typically not considered a gas that has to be regularly monitored, so more measurements are needed in order to fully examine atmospheric processes involving HCHO.
Spaceborne observations are indispensable tools to monitor the spatiotemporal distribution of atmospheric pollutants like NO2 and HCHO on a global scale (Burrows et al., 1999; Bovensmann et al., 1999; Callies et al., 2000; Levelt et al., 2006; Veefkind et al., 2012). Vertical column densities (VCDs), representing concentrations integrated over vertical atmospheric columns, derived from spectral radiances provide deeper insights into atmospheric dynamics, as well as anthropogenic and natural emissions (Beirle et al., 2003, 2004; Wenig et al., 2003; Richter et al., 2005; Zhang et al., 2007; van der A et al., 2008). However, the accuracy of satellite retrievals strongly depends on a number of assumptions about the surface albedo, cloud and aerosol optical properties, and the vertical distribution of trace gases. Therefore, validation of satellite observations by means of ground-based observations is crucial to determine the influence of those assumptions on the accuracy of the VCDs (Wenig et al., 2008; Chen et al., 2009; Lin et al., 2014; Chan et al., 2015; Jin et al., 2016). Furthermore, the temporal sampling of satellite measurements is typically limited to a small number of overpasses per day, prohibiting observation of diurnal cycles. In order to derive a complete picture of spatiotemporal variability, the combination of spaceborne and ground-based observations is useful.
The Multi-AXis Differential Optical Absorption Spectroscopy (MAX-DOAS) technique measures the vertical distribution of NO2, HCHO and aerosols. This passive remote sensing technique uses spectroscopic observations of scattered sunlight under different viewing directions and the differential optical absorption spectroscopy (DOAS) technique (Platt and Stutz, 2008) to derive column densities from molecular absorption in ultraviolet and visible spectral bands. Because of its compact experimental setup, it has been widely used for ground-based observations (Hönninger and Platt, 2002; Hönninger et al., 2004; Wittrock et al., 2004; Frieß et al., 2006; Irie et al., 2008; Li et al., 2010, 2013; Clémer et al., 2010; Halla et al., 2011; Ma et al., 2013; Chan et al., 2015; Wang et al., 2016) as well as for satellite validation (Jin et al., 2016; Chan et al., 2018).
Although the NO2 load in many parts of the world including Germany shows decreasing trends, concentrations in many cities in Germany still exceed the World Health Organization (WHO) annual average limit of 40 µg m−3. Such exceedances are recorded at about 40 % of the traffic-oriented monitoring stations (UBA, 2019), constituting one of the most severe air pollution problems in Germany. One example of high concentrations of pollutants is Munich, the German city with the highest NO2 value in 2017 and second highest in 2018 (UBA, 2019). Munich is the third largest city in Germany with a population of around 1.5 million. Traffic and industrial emissions are the major anthropogenic sources of air pollution in Munich.
Ground-based MAX-DOAS measurements are performed since October 2016. The MAX-DOAS experimental setup, the spectral analysis as well as the retrieval of the aerosol extinction coefficients, and NO2 and HCHO concentration profiles are described in Sect. 2. The results of our retrievals for Munich include the spatial distribution of NO2 and HCHO; their weekly pattern; and the relationships between aerosols, NO2, and HCHO. These are presented in Sect. 3. Comparisons with independent measurements are discussed in Sect. 4: aerosol extinction and NO2 mixing ratios at the lowest layer of the MAX-DOAS profile are compared to ground-based in situ data, and aerosol optical depth (AOD) data are compared to sun photometer measurements. Validation of Ozone Monitoring Instrument (OMI) and TROPOspheric Monitoring Instrument (TROPOMI) satellite observations in terms of NO2 and HCHO vertical column densities (VCDs) is the subject of Sect. 5. Section 6 concludes our study.
2.1 2D MAX-DOAS measurements
2.1.1 Experimental setup
A 2D MAX-DOAS instrument was set up on the roof of a university building of the Ludwig-Maximilians-Universität München (48.148∘ N, 11.573∘ E), which is about 25 m above ground level (515 m above sea level). The site is located 1.2 km north of Munich city center. The locations of the MAX-DOAS and the Lothstraße ambient-air-quality monitoring station (48.155∘ N, 11.555∘ E) in Munich are indicated in Fig. 1. The 2D MAX-DOAS instrument measuring scattered sunlight consists of a scanning telescope, two stepping motors controlling the viewing azimuth (0) and elevation angle (), and two spectrometers covering the ultraviolet (UV) and visible (VIS) wavelength ranges. Scattered sunlight collected by the telescope is redirected by a prism reflector and quartz fibers to the spectrometers for spectral analysis. The field of view of the instrument is about 0.4∘. Two Avantes AvaBench-75 spectrometers equipped with back-thinned Hamamatsu charge-coupled device (CCD) detectors are used to cover the UV (305–460 nm) and VIS (430–650 nm) wavelength ranges. The full width half maximum (FWHM) spectral resolutions of the UV and VIS spectrometers are 0.62 and 0.87 nm, respectively.
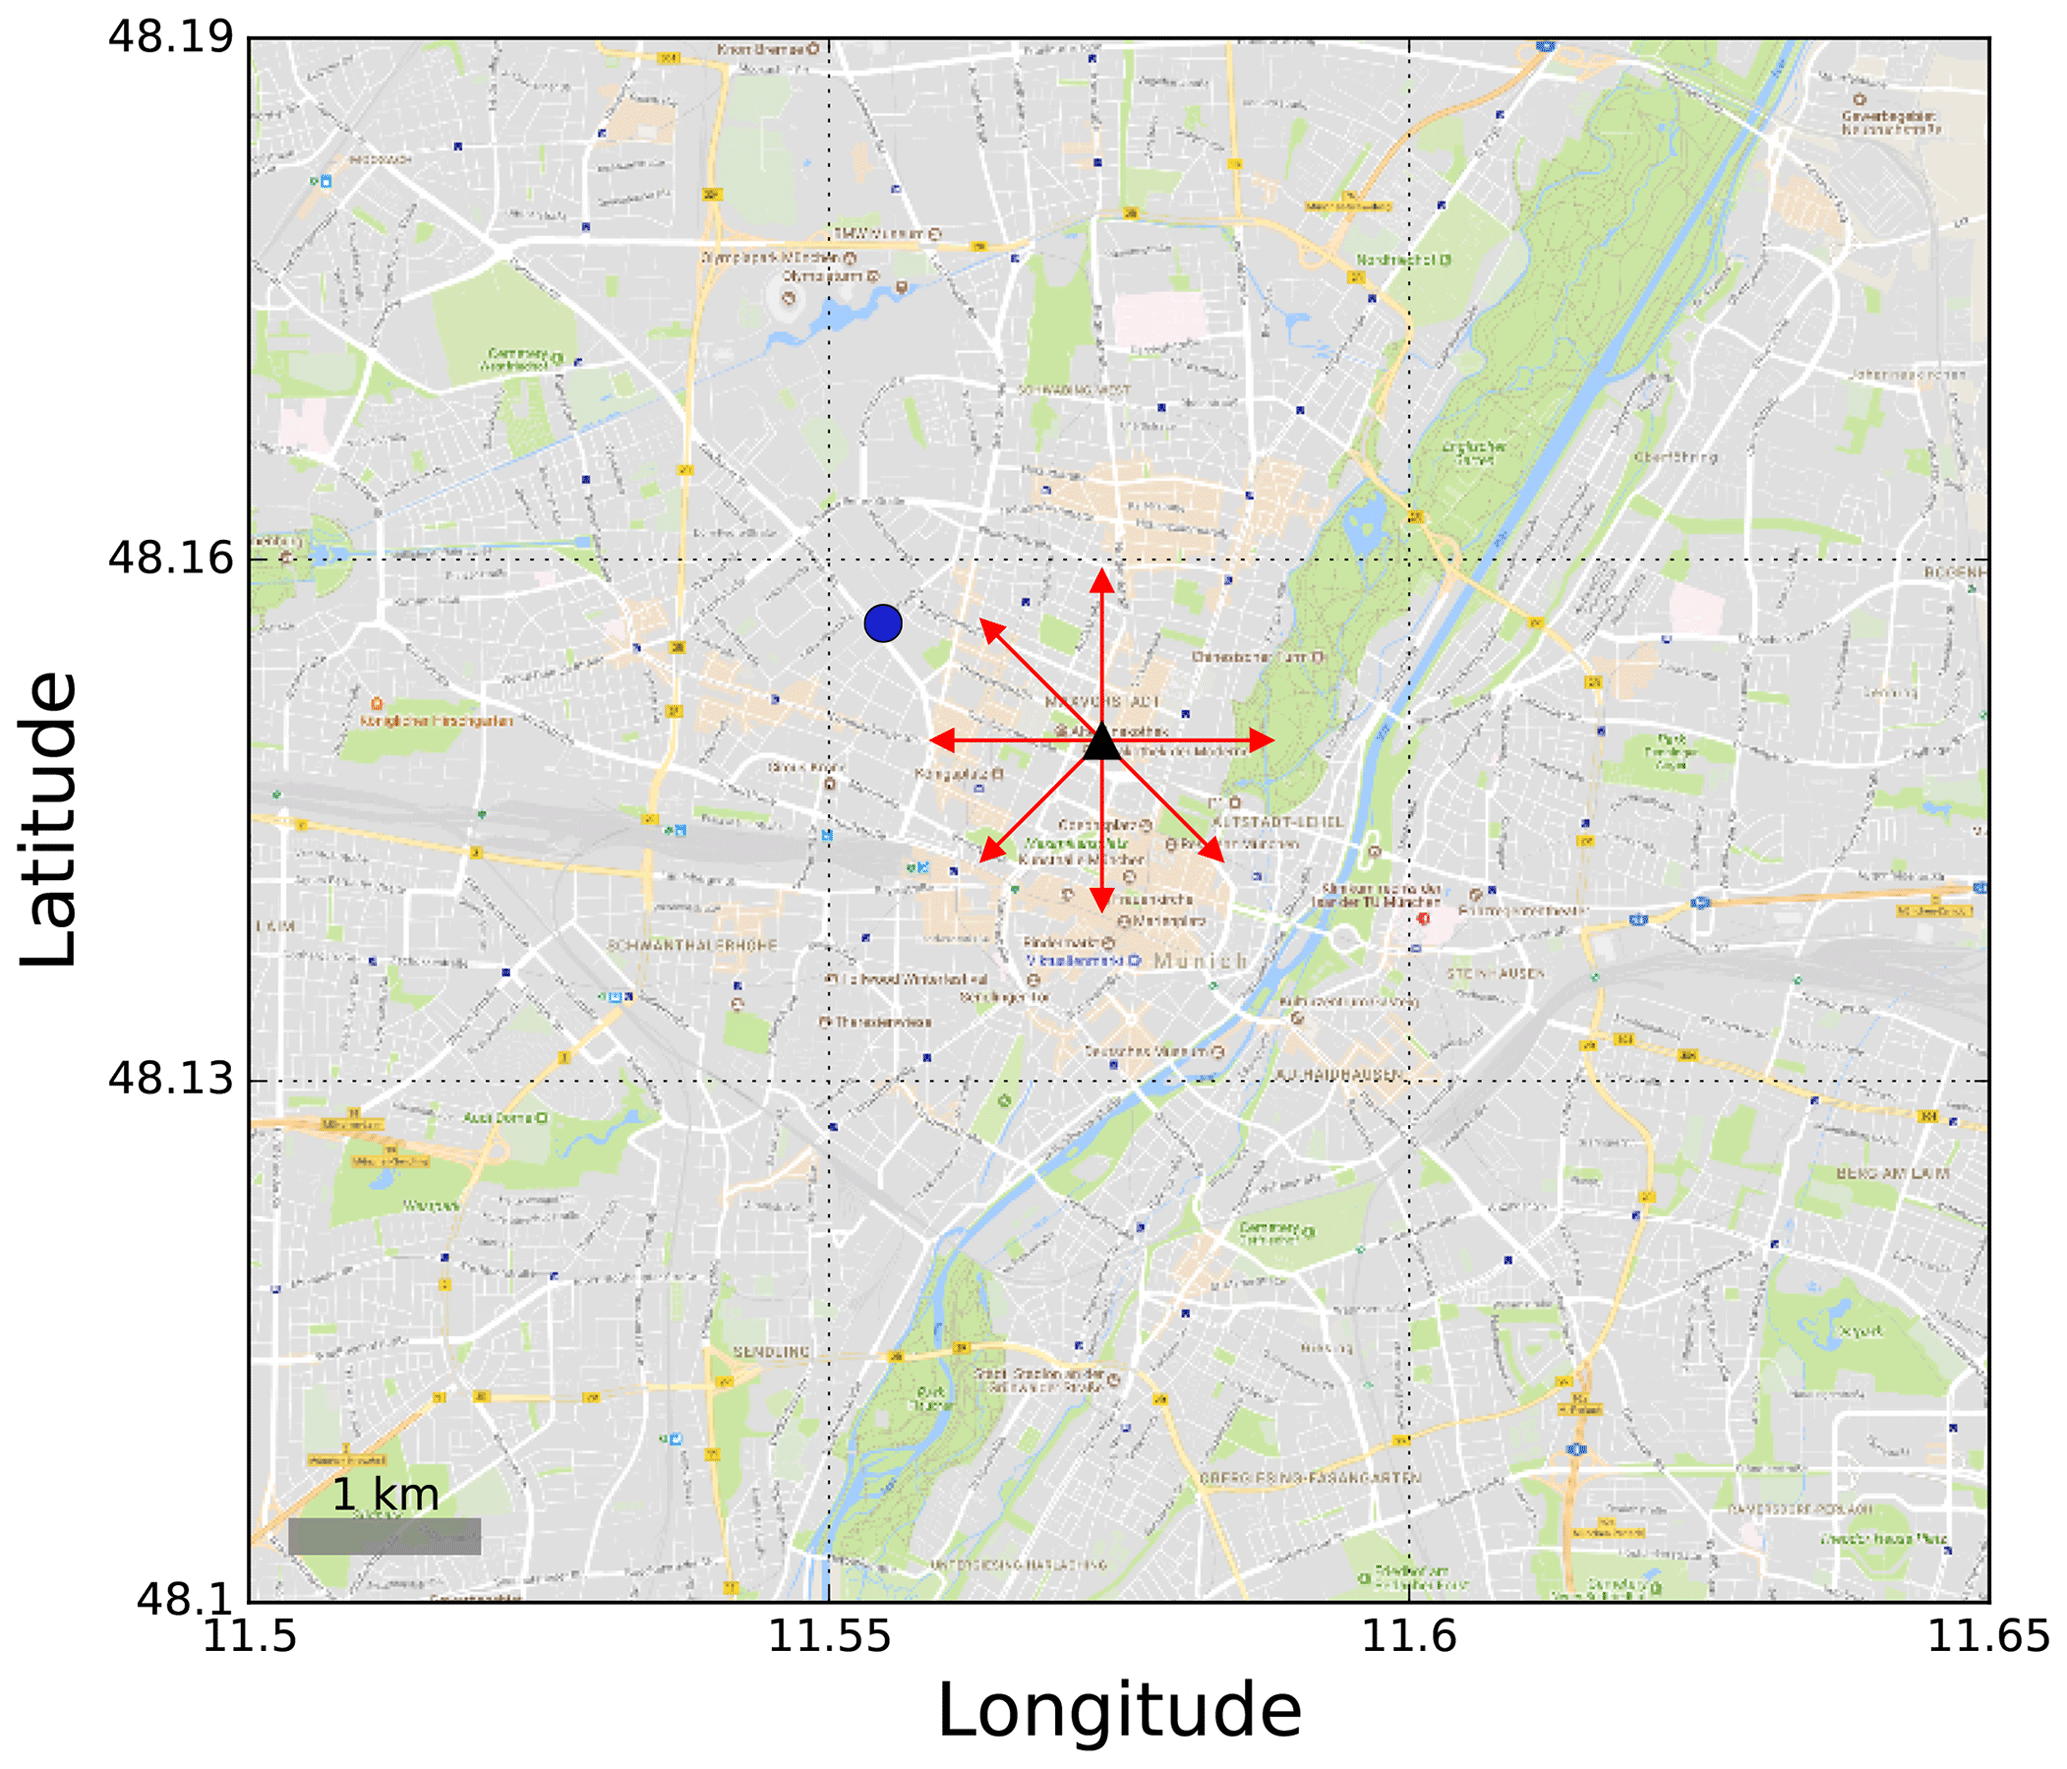
Figure 1Locations of the MAX-DOAS measurement site (black triangle) and the ambient-air-quality monitoring station (blue dot). The red arrows indicate the azimuth viewing directions, ϕ, of the MAX-DOAS observations. The base map is taken from © Google Maps (https://www.google.com/maps/ (last access: 1 August 2020)).
A measurement cycle starts with measuring scattered sunlight spectra at elevation angles (α) of 2, 3, 4, 5, 6, 8, 15, 30 and 90∘ (zenith) for each azimuth angle (ϕ). For this study, the MAX-DOAS was configured to measure seven consecutive azimuth angles of 0, 90, 135, 180, 225, 270 and 315∘. Measurements with were omitted, because a building close by was blocking the lower elevation angles. The exposure time and the number of scans of each individual measurement are adjusted automatically depending on the intensity of the received scattered sunlight in order to have a similar integration time of 1 min for all the measurements. A full measurement sequence for all azimuth directions takes about an hour.
2.1.2 Spectral retrieval

Figure 2An example of the DOAS retrieval of NO2 and HCHO DSCDs from a MAX-DOAS spectrum taken on 4 November 2016 at 10:02 LT (local time) with viewing elevation angle of . The left panels show the DOAS fit in the wavelength range 338–370 nm, while the right panels show the DOAS fit in the wavelength range 324.5–359 nm.
All measurement spectra were corrected for the spectrometer CCD nonlinearity, as well as for offset and dark current. The DOAS technique (Platt and Stutz, 2008) is then applied to the measurement spectra to derive slant column densities (SCDs) of the trace gases. In this study, the measurement spectra are evaluated using the spectral analyzing software QDOAS version 3.2. The spectral fit is performed at two different wavelength bands of 338–370 and 324.5–359 nm. Differential slant column densities (DSCDs) of oxygen collision complex (O4), which are defined as the difference between the SCDs of off-zenith spectra and the corresponding zenith reference spectrum, used for aerosol extinction profile retrieval and NO2 DSCDs used for NO2 profile retrieval were taken from the former fitting band (338–370 nm). Due to the stronger absorption structure of HCHO at shorter wavelengths, HCHO DSCDs used for the retrieval of HCHO profiles were taken from the latter fitting window (324.5–359 nm). The detailed procedure of the combined retrieval of aerosol and trace gas profiles is presented in Sect. 2.1.3. A fifth-order polynomial in the DOAS fit is responsible for removing broadband spectral structures caused by Rayleigh and Mie scattering. The absorption cross section of several trace gases used in the retrieval are listed in Table 1 for both wavelength ranges. These settings are based on the results from previous studies (Pinardi et al., 2013; Peters et al., 2017; Kreher et al., 2020). In order to compensate for possible instabilities due to small thermal variations of the spectrograph, shift and squeeze parameters of the spectra are included in the fitting process as well. An example of the DOAS retrieval of NO2 and HCHO DSCDs from a MAX-DOAS spectrum taken on 4 November 2016 at 10:02 LT (local time) with is shown in Fig. 2.
Fleischmann et al. (2003)Meller and Moortgat (2000)Vandaele et al. (1998)Vandaele et al. (1998)Serdyuchenko et al. (2014)Serdyuchenko et al. (2014)Thalman and Volkamer (2013)Chance and Kurucz (2010)Table 1The DOAS retrieval settings for different wavelength bands.
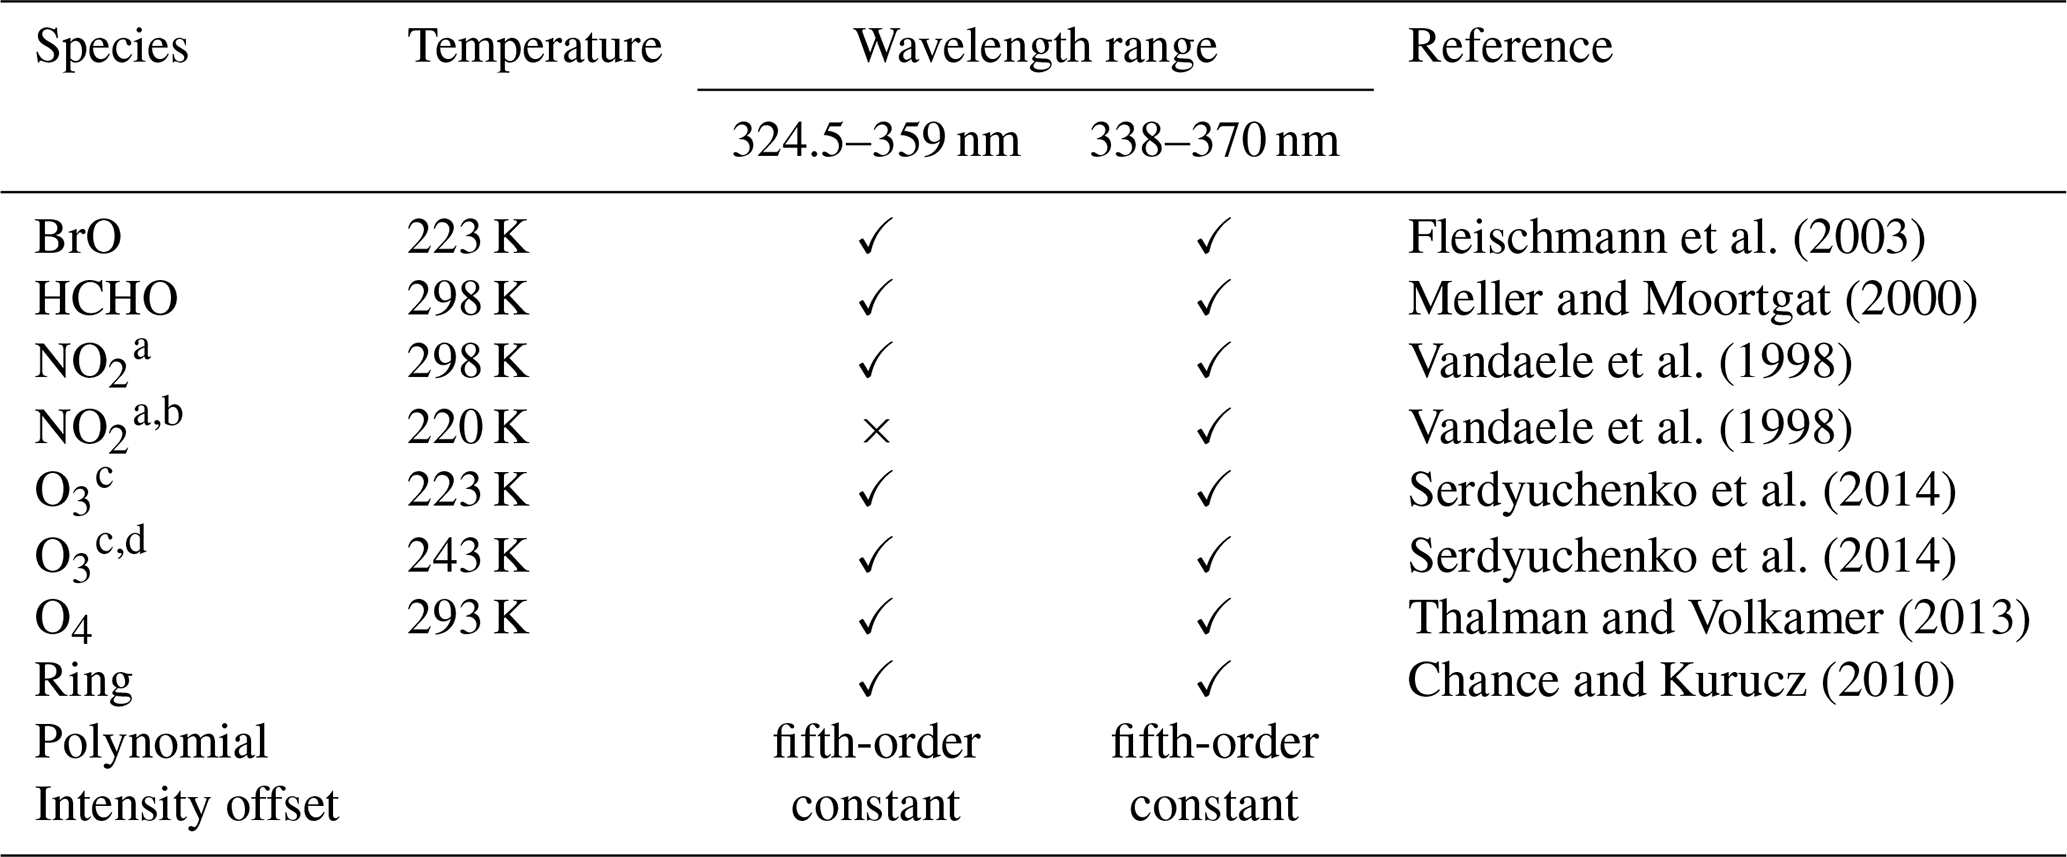
a I0 correction is applied with SCD of 1017 molec. cm−2 (Aliwell et al., 2002).
b Orthogonalized to NO2 cross section at 298 K (Vandaele et al., 1998).
c I0 correction is applied with SCD of 1020 molec. cm−2 (Aliwell et al., 2002).
d Orthogonalized to O3 cross section at 223 K (Serdyuchenko et al., 2014).
Several previous studies have shown that there is a systematic discrepancy between observation and model simulation of O4 DSCDs (Wagner et al., 2009, 2011; Clémer et al., 2010; Chan et al., 2015; Wang et al., 2016; Chan et al., 2018; Zhang et al., 2018). However, other studies found that the modeled and measured O4 DSCDs match with each other without applying any correction (Spinei et al., 2015; Ortega et al., 2016; Wagner et al., 2019). The discrepancies can be related to the systematic error of the O4 absorption cross section, model error, optical properties of aerosols and aerosols above the retrieval height (Ortega et al., 2016; Wagner et al., 2019). Wagner et al. (2009) and Clémer et al. (2010) suggested to apply a correcting scaling factor to the measured O4 DSCDs in order to bring measured and modeled results into agreement. However, the physical meaning of this scaling factor is still not fully understood (Wagner et al., 2019). Theoretically, the optical path should be the longest under aerosol free conditions for the off-zenith measurement. Thus, the MAX-DOAS measurement of O4 DSCDs should be smaller or equal to the one simulated with a pure Rayleigh atmosphere. Following the approach mentioned in Chan et al. (2019), we compared the forward simulation of O4 DSCDs assuming a Rayleigh atmosphere to the MAX-DOAS observations to determine the O4 scaling factor. The result shows that the MAX-DOAS measurements occasionally exceeded the forward simulations. The monthly statistics of measured O4 DSCDs exceeding the pure Rayleigh simulation are shown in Fig. A1. The ratio between simulated and measured O4 DSCD can be as low as 0.70 (2nd percentile). The exceedances are more frequent during winter, which is mainly related to the lower aerosol optical depths in winter (see Sect. 4.2), while the uncertainty of surface albedo and temperature dependency of O4 absorption cross section are known to be small (Wagner et al., 2019; Wang et al., 2019). In order to avoid over-correction due to outliers, we take the 10th percentile instead of the minimum value of the simulated and measured O4 DSCD ratio as the correction factor and multiply all MAX-DOAS observations of O4 DSCDs with a correction factor of 0.8. Hereafter, all O4 DSCDs refer to the corrected O4 DSCDs.
2.1.3 Aerosols and trace gases retrieval
In this study, aerosol extinction coefficient profiles are retrieved from the observations of O4 DSCD at the 338–370 nm band using the Munich Multiple wavelength MAX-DOAS retrieval algorithm (M3). As the O4 DSCDs are retrieved within a relatively narrow spectral band, we can assume that the wavelength dependency of the optical path within the fitting window is negligible. Thus, the forward radiative transfer simulation can be calculated at a representative wavelength of 360 nm, where the strongest O4 absorption is located. A brief description of the aerosols and trace gases retrieval is presented below; a more detailed description can be found in Chan et al. (2018, 2019). The conversion of MAX-DOAS observations to aerosol extinction and trace gas profiles requires an inversion of the underlying radiative transfer equation (Wagner et al., 2004; Hönninger et al., 2004; Sinreich et al., 2005; Frieß et al., 2006; Hartl and Wenig, 2013). O4 has several absorption bands in the UV and VIS spectral ranges. Due to its known vertical distribution, the absorption signal of O4, which is a combination of the concentration profile and the photon paths, which in turn are influenced by the aerosol distribution and can be used for the aerosol retrieval.
The vertical profile of the aerosol extinction coefficient is retrieved from a set of MAX-DOAS observations with different viewing directions, y(α,ϕ). A set of MAX-DOAS observations, y(α,ϕ), is defined as the O4 DSCD observations at the same scanning azimuth angle ϕ with different elevation angles α within a single measurement cycle. These observations of O4 DSCD are grouped together for the aerosol vertical profile retrieval. We assume that the set of measurements (y) can be reproduced by forward radiative transfer simulations and the forward simulations of O4 DSCD are dependent on the aerosol extinction profile (x) and aerosol optical properties. Assuming aerosols are horizontally and homogeneously distributed within the MAX-DOAS measurement range, the observation vector (y) can be described by Eq. (1).
where ϵ and δ are the observation and simulation uncertainties, respectively. The aerosol extinction profile can be retrieved by fitting the forward simulations to the O4 DSCD observations. In this study, all forward radiative transfer simulations were carried out using the library for radiative transfer (libRadtran) (Mayer and Kylling, 2005; Emde et al., 2016). The U.S. Standard Atmosphere (Anderson et al., 1986) midlatitude profiles for winter (January) and summer (July) are temporally interpolated to each month of the year for the radiative transfer calculations.
As the information contained in the observation vector y is not sufficient to retrieve a unique aerosol extinction profile, the optimal estimation method is employed for the aerosol inversion. The optimal estimation approach supplemented the necessary information to the inversion in a form of an a priori aerosol profile (xa). The cost function χ2 of the retrieval can be defined by Eq. (2).
where Sϵ represents the observation uncertainty matrix, and Sa is the a priori uncertainty covariance matrix. We assume that the observations at different elevation angles are independent so that Sϵ is a diagonal matrix. The aerosol extinction is assumed to be correlated with the neighboring layers, so that Sa is defined by Eq. (3).
where z is the altitude of the center of the layer. Since, in urban areas, aerosols are typically emitted and formed close to the surface, we assume an a priori aerosol extinction profile following an exponentially decreasing function with a scale height of 0.5 km. The aerosol optical depth of the a priori aerosol profile is set to 0.2, which is the average AOD measured by the co-located sun photometer at 340 nm. The uncertainty of the a priori aerosol profile is set to 50 %, and the correlation length, ηcorr, of the aerosol inversion is assumed to be 0.5 km. As MAX-DOAS measurements are more sensitive to the aerosol and trace gases close to the instrument, we divide the lowest 3.0 km of the troposphere unevenly into 20 layers. The lowest 1 km is divided into 10 layers with the thickness of each layer of 100 m, while the thickness of the layers between 1 km and 3 km is set to 200 m. Furthermore, we assume a fixed value of single scattering albedo of 0.95, an asymmetry parameter of 0.70 and a ground albedo of 0.04 for the radiative transfer calculations. Previous studies have shown that a variation of surface albedo of 0.1 shows only a small effect (∼2 %) on the radiative transfer simulation of O4 DSCDs (Frieß et al., 2006; Wagner et al., 2019; Wang et al., 2020), a fixed albedo is used for the retrieval of all measurements. Single scattering albedo and asymmetry parameter of aerosol are the long-term averages taken from the co-located sun photometer. As the radiative transfer in the atmosphere is nonlinear, the inversion of the aerosol extinction is solved iteratively by using the Gauss–Newton method.
The M3 profile retrieval algorithm is featured with a dynamic a priori module to avoid over-regularizing the retrieval under extreme conditions and to reduce the dependency on a priori information (Chan et al., 2019). The algorithm first uses a fixed initial a priori (as mentioned above) to retrieve an initial aerosol profile. The fixed a priori profile is then scaled to have the same aerosol optical depth retrieved from the initial run. The scaled a priori is then used in the next retrieval to derive a new aerosol extinction profile. This procedure repeats until the difference in aerosol optical depth between the new and previous result is less than 10 % or the number of iterations reaches the limit, which is set to 5 in this study.
The aerosol information obtained from the procedure described above is used for the calculation of the differential box air mass factors ΔDAMF values, required for the trace gas profile inversion. The ΔDAMF values are calculated at a single wavelength for the retrieval of trace gas profiles using libRadtran with the Monte Carlo simulation module MYSTIC (Emde et al., 2016), assuming them to be constant within the rather narrow DOAS spectral fitting window. The relationship between ΔDAMF and DSCD can be described by the following equations.
where ΔSCDij is the partial SCD measured with elevation angle i within the vertical layer j, while represents the partial SCD measured at zenith within the vertical layer j. ΔVCDj indicates the partial column of the vertical layer j; cj is the concentration of the corresponding trace gas at the vertical layer j. As NO2 DSCDs are retrieved at the same spectral band as O4, the forward simulation of ΔDAMF values for NO2 profile retrieval are also calculation at the O4 absorption bands of 360 nm. HCHO DSCDs are retrieved at a slightly shorter wavelength band than O4. Therefore, aerosol extinction profiles obtained at 360 nm are converted to 340 nm by assuming a fixed Ångström exponent (Ångström, 1929) of 1.05 for the HCHO vertical profile retrieval. This value is the annual averaged Ångström exponent calculated from the co-located sun photometer. The single scattering albedo (0.95), asymmetry parameter (0.70) and ground albedo (0.04) at 340 nm used for the radiative transfer calculations are assumed to be the same as at 360 nm. The ΔDAMF values for the HCHO profile retrieval are then calculated using the converted aerosol profile at 340 nm. The layer settings of the trace gas profile retrieval are the same as the one used in the aerosol profile retrieval.
Following Eqs. (4) and (5), a set of linear equations can be formulated by considering the measurements at different elevation angles αi. Similar to the aerosol profile retrieval, the information contained in the MAX-DOAS observation is not sufficient to derive a unique solution. Therefore, the M3 algorithm uses the optimal estimation method (Rodgers, 2000) with a dynamic a priori approach for the trace gas profile inversion (Chan et al., 2019). The algorithm first uses a fixed initial a priori to retrieve an initial trace gas profile. The fixed a priori profile is then scaled to the vertical column derived in the first retrieval. The scaled a priori is subsequently used in the next retrieval. The process iterates until the difference between retrieved and previous trace gas column is less than 10 % or the number of iterations reaches the limit, which is set to 5 in this study.
The atmospheric layer settings of the trace gas profile retrieval are identical to the ones used in the aerosol profile retrieval. In this study, the a priori NO2 and HCHO profiles are assumed to be also exponentially decreasing with a scale height of 0.5 km. The NO2 vertical column density (VCD) of the a priori is set to 1 × 10¹⁶ molec. cm−2, whereas the a priori HCHO VCD is set to 8 × 10¹⁵ molec. cm−2. The vertical distribution of NO2 and HCHO above the retrieval height (3 km) is assumed to follow the U.S. Standard Atmosphere (Anderson et al., 1986).
2.2 Air quality monitoring network data
Ambient NO2 and PM10 (particulate matter with diameter smaller than 10 µm, typically given as mass concentration in microgram per cubic meter, µg m−3) data in Munich are acquired from an ambient-air-quality monitoring station operated by the Bavarian State Ministry of the Environment and Consumer Protection. The station is 1.2 km northwest to the MAX-DOAS measurement site (48.155∘ N, 11.555∘ E) (blue dot in Fig. 1). Ambient NO2 mixing ratios are measured by an in situ chemiluminescence NO2 analyzer, while PM10 concentrations are measured with a beta attenuation and light-scattering-based in situ particle analyzer. Details of the air quality monitoring network as well as air quality monitoring data can be found on the website of the European Environment Agency (https://www.eea.europa.eu/, last access: 1 August 2020).
2.3 Sun photometer measurements
A sun photometer (CIMEL Electronique, CE-318) is installed next to the 2D MAX-DOAS instrument, providing multiwavelength measurements of aerosol optical properties (Holben et al., 2001). As part of the AErosol RObotic NETwork (AERONET, instrument no. 198) (Holben et al., 1998), data include measurements at seven different wavelengths, which are 340, 380, 440, 500, 675, 870 and 1020 nm, and aerosol optical properties are retrieved by an automated inversion algorithm developed by Dubovik and King (2000) and Dubovik et al. (2006). Cloud-screened and quality assured level 2.0 data are used in this study.
2.4 OMI satellite observations
The Ozone Monitoring Instrument (OMI) is a passive nadir-viewing satellite-borne push-broom imaging spectrometer (Levelt et al., 2006) on board of the Earth Observing System's (EOS) Aura satellite. The Aura satellite was launched on 15 July 2004, orbiting at an altitude of ∼710 km with a local Equator crossing time of 13:45 LT on ascending node. The OMI instrument consists of two CCD arrays, covering a wavelength range from 264 to 504 nm. Each scan provides measurements of earthshine radiance at 60 positions across the orbital track, covering a swath of approximately 2600 km. The spatial resolution of OMI varies from 13 km (across-track) ×24 km (along-track) at nadir to 150 km (across-track) ×40 km (along-track) at the edges of the swath. OMI scans along 14.5 sun-synchronous polar orbits per day, providing daily global coverage.
The OMI NO2 product derived within the framework of the quality assurance for the essential climate variables (QA4ECV) project is used in this study (Boersma et al., 2018). NO2 SCDs are derived from earthshine radiance spectra in the visible band from 405–465 nm using a DOAS retrieval. The SCDs are then converted to vertical column densities (VCDs) using the concept of air mass factors (AMFs) (Solomon et al., 1987). The AMFs used in the QA4ECV OMI NO2 product are calculated at 437.5 nm with NO2 vertical profiles taken from the global chemistry transport model TM5-MP (Williams et al., 2017). Albedo data are from the climatology albedo database derived from 5 years of OMI observations (Kleipool et al., 2008). Separation of stratospheric and tropospheric columns, which is necessary to provide proper information for the AMF calculation, is achieved by the model assimilation approach (Dirksen et al., 2011). The QA4ECV HCHO product is also available (De Smedt et al., 2018). However, due to the degradation of OMI instrument and the low optical density of HCHO, the data are very noisy. Therefore, we do not include OMI measurements of HCHO in the comparison study.
2.5 TROPOMI satellite observations
The TROPOspheric Monitoring Instrument (TROPOMI) is a passive nadir-viewing satellite-borne push-broom imaging spectrometer on board the Copernicus Sentinel-5 Precursor (S5P) satellite. The satellite was launched on 13 October 2017 on a sun-synchronous orbit at an altitude of ∼824 km with a local Equator overpass time of 13:30 LT on ascending node. The instrument has eight spectral bands covering the UV, VIS, near-infrared (NIR) and short-wavelength infrared (SWIR) ranges. The instrument takes measurements at 450 positions across the orbital track, which covers a swath of ∼2600 km, providing daily global coverage observations. The spatial resolution of the instrument is 3.6 km (across-track) ×7.2 km (along-track) for measurements taken before 6 August 2019. Thereafter the instrument was switched to a better spatial resolution of 3.6 km (across-track) ×5.6 km (along-track). A more detailed description of the TROPOMI instrument can be found in Veefkind et al. (2012).
The operational TROPOMI NO2 and HCHO products are used in this study (van Geffen et al., 2019, 2020; De Smedt et al., 2018). The operational TROPOMI NO2 retrieval algorithm is very similar to the OMI product as demonstrated in the QA4ECV project. The operational TROPOMI HCHO product retrieves HCHO SCDs with a large fitting window of 328.5–359 nm. The retrieved SCDs are then converted to VCDs using the AMF approach. The AMFs are calculated at 340 nm using HCHO vertical profiles from the global chemistry transport model TM5-MP. Cloud information is taken from the TROPOMI operational cloud product (Loyola et al., 2018) for AMF calculations. Similar to the operational NO2 product, albedo data are taken from the OMI climatology and will be updated to TROPOMI albedo climatology or to TROPOMI retrieved daily surface properties using the GE_LER algorithm (Loyola et al., 2020). A more detailed description of the TROPOMI HCHO retrieval algorithm can be found in De Smedt et al. (2018).
We have regridded and calculated the annual average of TROPOMI tropospheric NO2 and HCHO VCDs over Germany and its surrounding regions. The annual averaged TROPOMI tropospheric NO2 and HCHO maps over Germany are shown in Fig. 3a and b, respectively. The boxes in Fig. 3a and b indicate the location of Munich, and the zoomed-in maps are shown in Fig. 3c and d. Significant NO2 hot spots can be observed over major cities, indicating the significant contribution of anthropogenic emissions. The zoomed-in map of Munich also shows elevated NO2 columns over the city center and surrounding the airport of Munich. On the other hand, the spatial distribution of HCHO shows more areal sources due to the strong contribution from biogenic emissions.
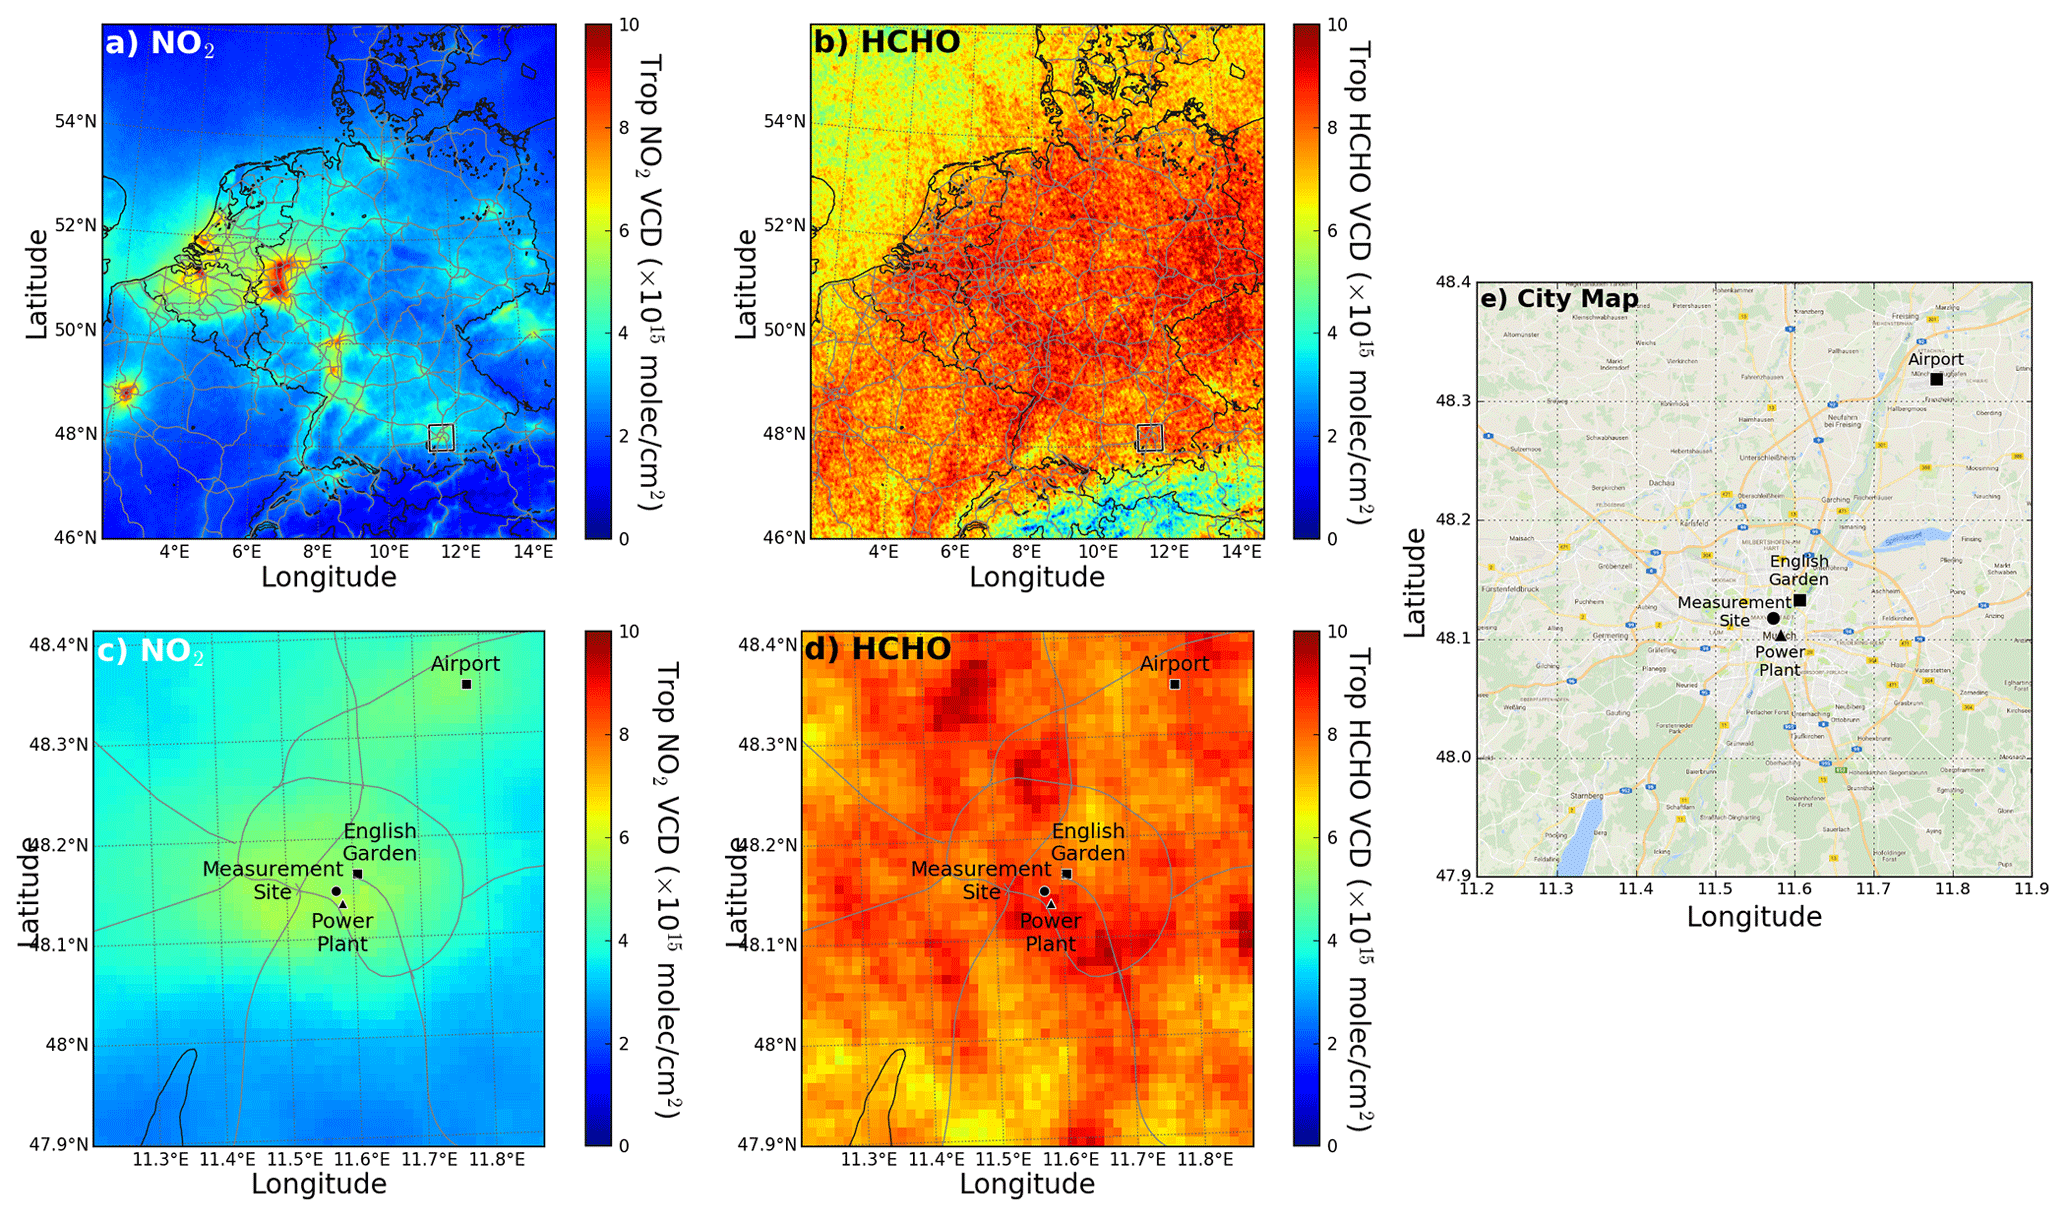
Figure 3Annual average TROPOMI tropospheric (a) NO2 and (b) HCHO VCDs over Germany and its surrounding regions. Zoomed-in maps of (c) NO2 and (d) HCHO over Munich are also shown in (c) and (d), respectively. Data from May 2018 to April 2019 are used in the calculation of average maps. Values above or below the range of the color scale are set to the maximum or minimum value of the color scale. Panel (e) shows the city map of Munich, and the base map is taken from © Google Maps (https://www.google.com/maps/).
3.1 Spatial variability
In order to investigate the spatial variability of NO2 and HCHO, we utilize the azimuthal scans of the MAX-DOAS. Tropospheric NO2 VCDs measured by the MAX-DOAS with different viewing azimuth angles are plotted in Fig. 4. Figure 4a shows normalized NO2 VCDs measured at each azimuth angle in both winter (December, January and February) and summer (June, July and August). Figure 4b shows normalized HCHO VCDs measured in winter and summer. NO2 and HCHO data are normalized by dividing the corresponding mean VCDs of all azimuth angles. Error bars indicate the 1σ standard deviation variation, which is mostly representing the natural variations of the measurements, e.g., diurnal variation. NO2 columns measured with different viewing azimuth angles during winter show a rather homogeneous spatial distribution, while during summer NO2 columns show slightly higher values (∼20 %) in the south and lower values in the north. A more homogeneous distribution of NO2 is due to better horizontal mixing of NO2 within the mixing layer during winter. The average wind speed in Munich during winter is ∼12 km h−1, while the summertime average wind speed is ∼8 km h−1 (https://www.en.meteo.physik.uni-muenchen.de/wetter/index.html, last access: 1 August 2020). Stronger wind speed together with the shallower mixing layer as known from ceilometer measurements results in better horizontal mixing of NO2 during winter. In addition, the atmospheric lifetime of NO2 is longer in winter due to a lower photolysis rate, which also leads to a more homogeneous NO2 distribution. In the south of the measurement site where the city center is located, higher NO2 levels are observed during summer. There are several local emission hot spots in the city, such as a number of busy crossroads and a minor natural-gas power plant (see Fig. 3). In addition, lower wind speed and shorter lifetime of NO2 reduced the dispersion in summer, thus resulting in a rather inhomogeneous NO2 distribution.

Figure 4Normalized MAX-DOAS measurements of (a) NO2 and (b) HCHO VCD for different viewing azimuth angles for winter (December, January and February, blue markers) and summer (June, July and August, red markers). The data are normalized by dividing the corresponding mean VCD. Error bars indicate the 1σ standard deviation variation range.
Figure 4c and d show the MAX-DOAS measurements of HCHO VCDs for different azimuth angles. Measurements taken during winter and summer are shown in Fig. 4c and d, respectively. In contrast to the NO2 distribution, the spatial distribution of HCHO is more homogeneous in summer, while higher values are observed in the south and southwest of the measurement site during winter. Homogeneous distribution of HCHO during summer is likely related to its source characteristic. A large fraction of HCHO and its precursors is related to biogenic emissions from vegetation in summer. These biogenic sources are areal sources and widely distributed over the city and its surrounding areas. One of the major biogenic emission sources is the Englischer Garten (denoted as English Garden in the figures), which is a public park with an area of 3.7 km2 and located in the center of Munich. Therefore, the spatial distribution of HCHO is expected to be more homogeneous in summer. Biogenic emissions are greatly reduced in winter and anthropogenic point sources, i.e., the natural-gas power plant and domestic wood-burning heating systems installed in old buildings, become the dominant source. Therefore, slightly elevated HCHO values are observed in the south and southwest direction during both summer and winter. A less pronounced HCHO peak in the south during summer is likely related to the reduced domestic heating.
3.2 Day of the week variability
Human activities usually fall into a 7 d weekly cycle. Reduction of industrial activities as well as traffic volume during the weekend leads to lower levels of pollutant emission: an effect known as the weekend effect (Cleveland et al., 1974). We have investigated the weekend effect of NO2 and HCHO using the MAX-DOAS measurements in Munich. Figure 5 shows the normalized mean weekly cycle of NO2 and HCHO. Measurements are separated for winter (December, January and February), summer (June, July and August) and all seasons. Data are normalized by dividing by the weekday mean value (Monday to Friday). Both vertical column and volume mixing ratio at the surface layer are shown. In the case of NO2, both vertical columns and surface mixing ratios show lower values during weekends. NO2 VCDs are in general reduced by 25 % and 35 % on Saturday and Sunday, respectively. The weekend reduction of surface mixing ratios is similar to that of the vertical column with reductions of 20 % for Saturday and 30 % for Sunday. The reduction of the NO2 level during the weekend implies a large anthropogenic contribution of NO2 emissions. The weekend reduction effect of NO2 is more significant during summer and less pronounced in winter. NO2 levels in summer are reduced by 40 % and 50 % on Saturday and Sunday, respectively, while the reduction in winter decreased to 15 % for Saturday and 25 % for Sunday. The stronger reduction effect during summer is related to the shorter atmospheric lifetime of NO2 and, as a result, less accumulation from weekdays. Compared to NO2, HCHO shows a much less significant weekly pattern. HCHO vertical columns and surface mixing ratios are in general reduced by ∼10 % during weekends. As natural emission, such as biogenic emission from plants, does not show a weekly pattern, the reduction during the weekend suggests that anthropogenic emissions of HCHO and its precursors have a substantial (>10 %) contribution to the ambient VOCs. The weekly patterns in winter are even less significant than the one in summer. In winter, HCHO levels observed on Sunday are even slightly higher than that of the weekday average. The anthropogenic sources of HCHO in the troposphere include the oxidation of various long-lifetime VOCs, such as methane. Their lifetimes are even longer in winter and result in a less significant weekly pattern.
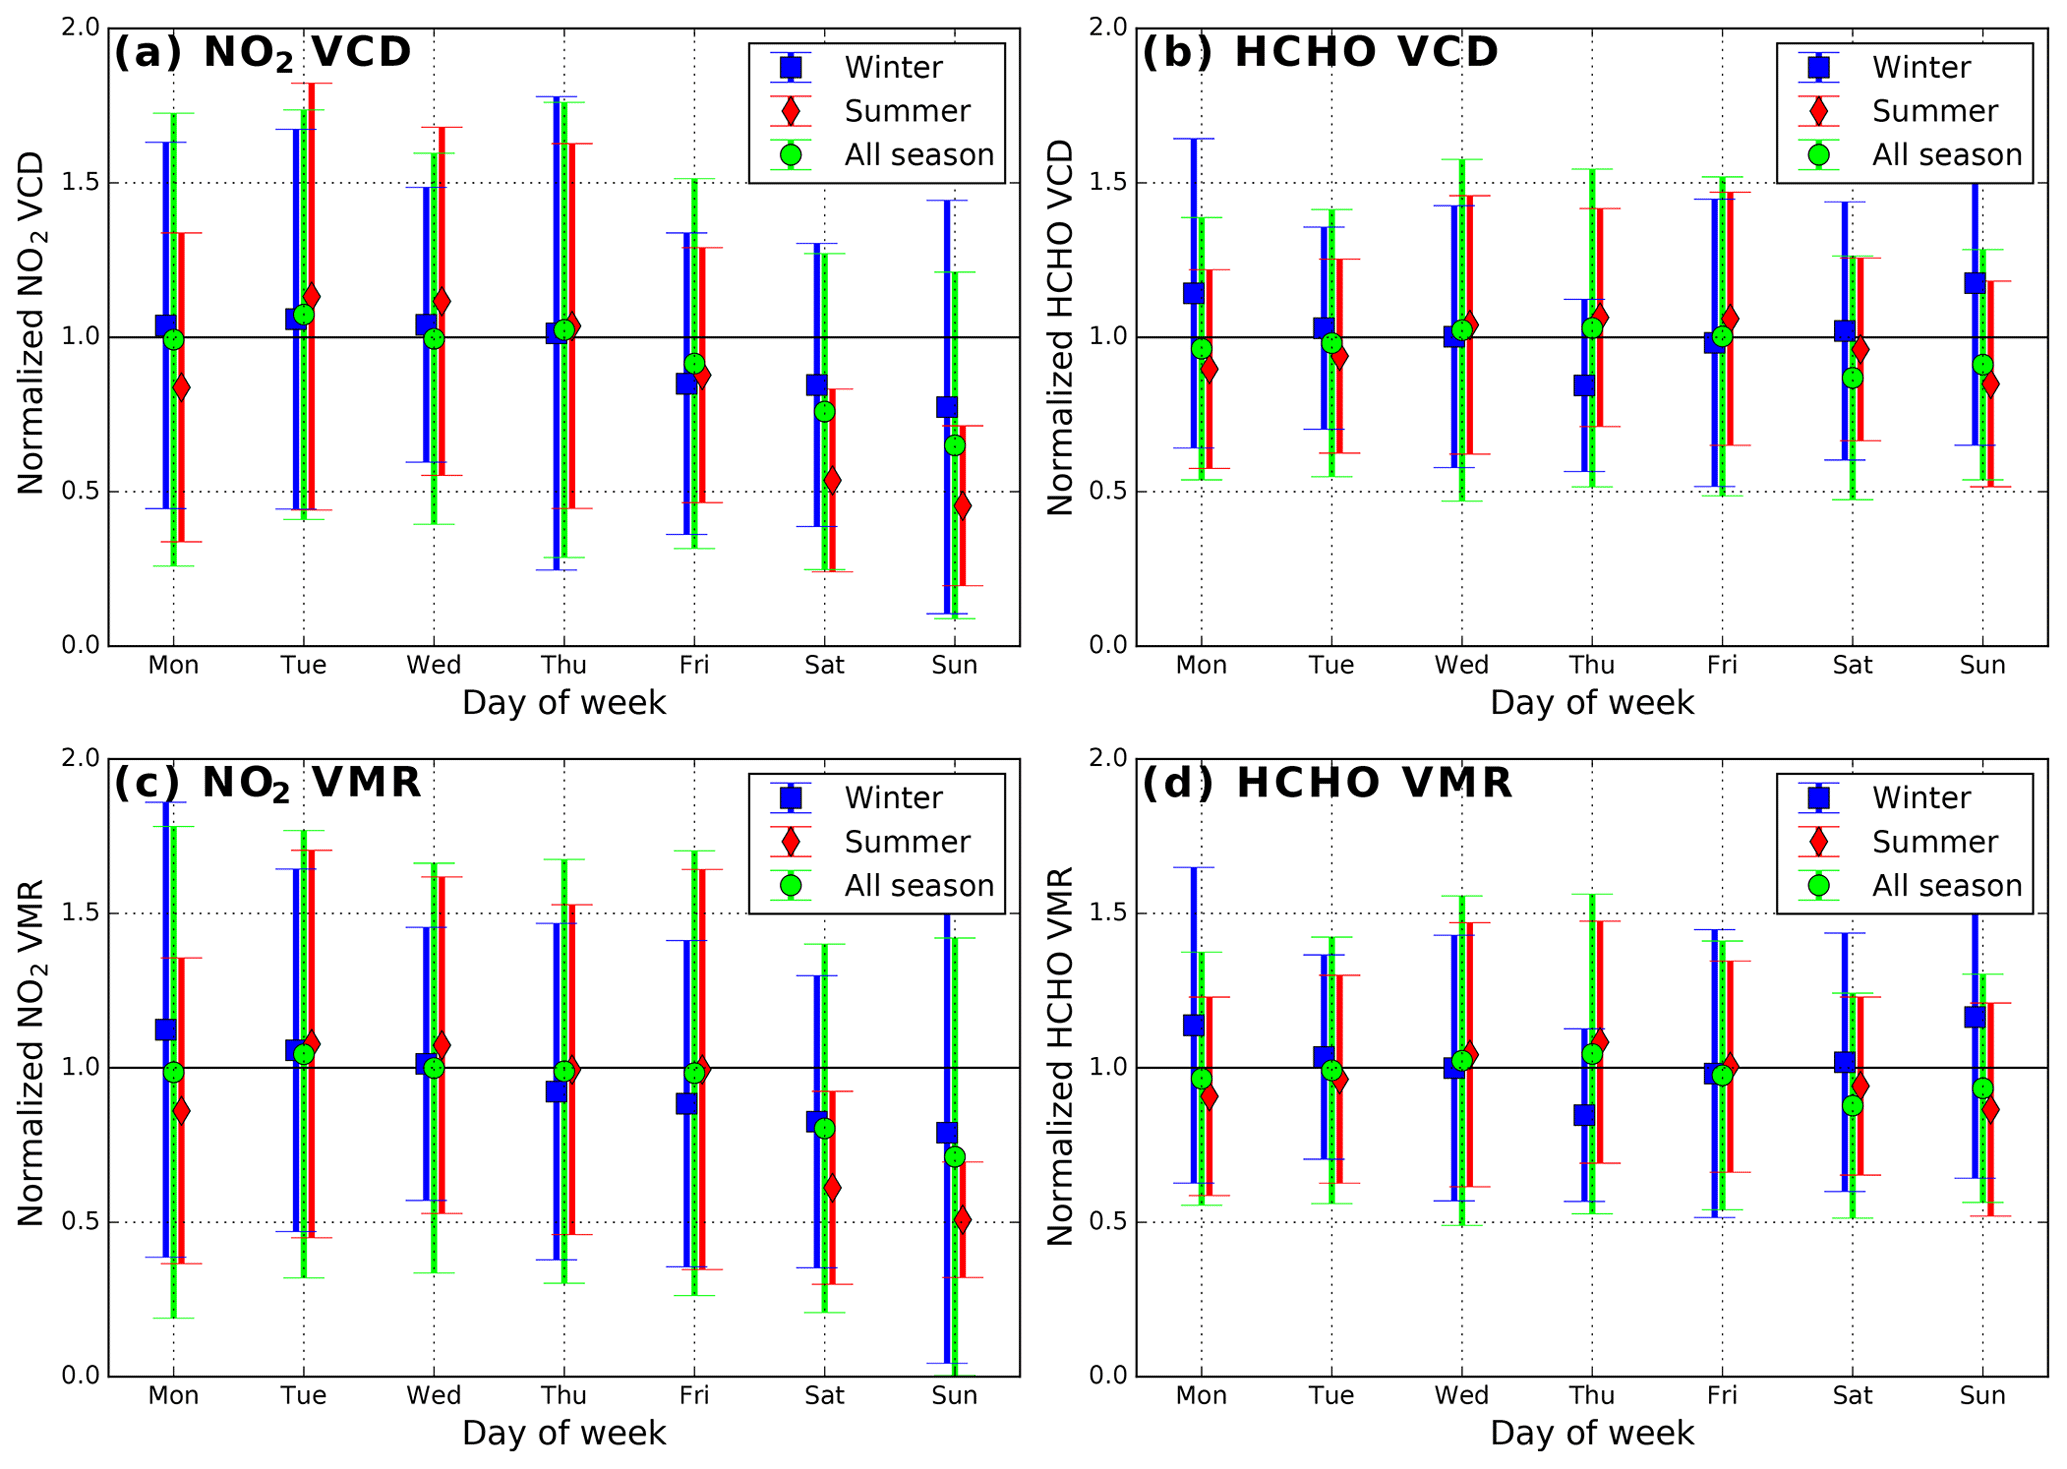
Figure 5Panels (a) and (c) show the averaged weekly cycle of NO2 (a) VCD and (c) volume mixing ratio at the surface layer. Panels (b) and (d) are the same as panels (a) and (c) but for HCHO. Measurements are separated for winter (December, January and February, blue markers), summer (June, July and August, red markers) and all seasons (green markers). The data are normalized by dividing by the mean weekday value (Monday to Friday). Error bars indicate the 1σ standard deviation variation range.
3.3 Relations among aerosol, NO2 and HCHO
The correlation between aerosol extinction coefficients, NO2 and HCHO mixing ratios can be used to investigate the composition and sources of aerosols (Veefkind et al., 2011). Fossil fuel combustion is the most significant primary source of NO2 and aerosols, while HCHO correlates strongly with secondary organic aerosol formation. Figure 6a shows the correlation between surface aerosol extinction coefficients (εsurf) and NO2 mixing ratios, while the correlation between εsurf and HCHO mixing ratios is shown in Fig. 6b. Aerosol extinction coefficients, NO2 and HCHO mixing ratios at the lowest layer of the MAX-DOAS profile are used in the analysis. Considering that meteorological influences are very different during different seasons, we have separated measurements during summer and winter. Both surface NO2 and HCHO mixing ratios show a significant correlation with εsurf with correlation coefficients ranging with better correlations observed during winter. The aerosol extinction to NO2 ratios for summer (0.033 km−1 ppbv−1) and winter (0.023 km−1 ppbv−1) are very similar. Assuming primary aerosols and NO2 originate from the same sources, a rather constant aerosol-to-NO2 ratio indicates that sources of primary emission are similar in summer and winter. On the other hand, a higher aerosol extinction to HCHO ratio is observed during winter (0.213 km−1 ppbv−1) compared to the summer ratio (0.065 km−1 ppbv−1). A higher aerosol extinction to HCHO ratio reflects a longer atmospheric lifetime of secondary aerosol and HCHO in winter, whereas higher photolysis rates in summer result in a lower aerosol-to-HCHO ratio.
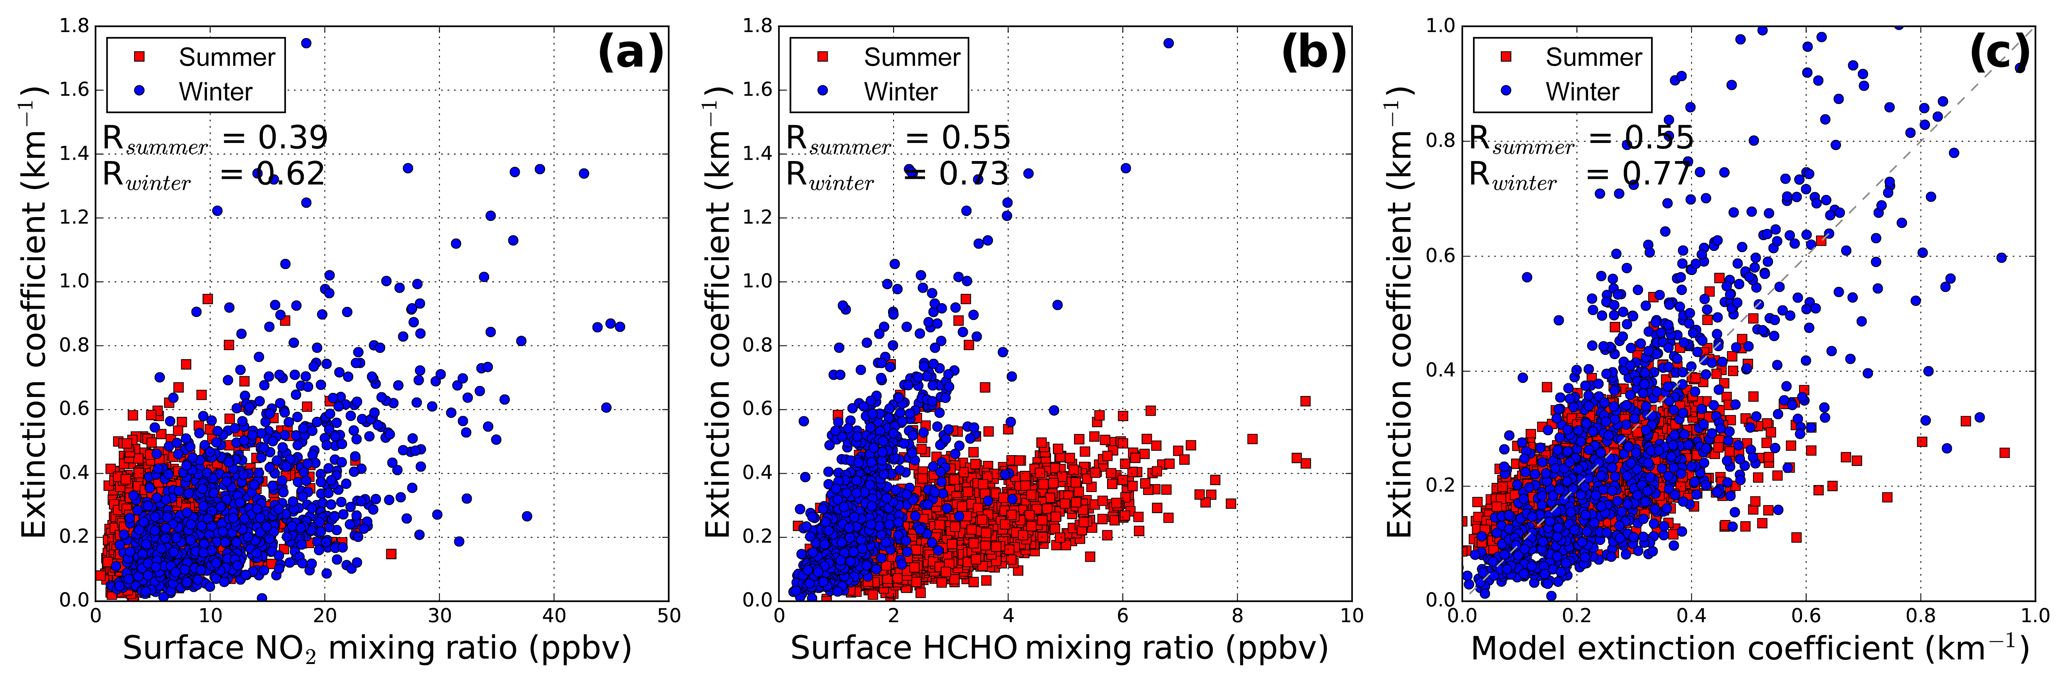
Figure 6Panel (a) shows the correlation between surface aerosol extinction coefficients (εsurf) and NO2 mixing ratios. Panel (b) shows the correlation between εsurf and HCHO mixing ratios. Panel (c) shows the scatterplot of measured and modeled surface aerosol extinction coefficients. Data measured in summer (June, July and August, red markers) and winter (December, January and February, blue markers) are shown.
Assuming that NO2 mixing ratios are related to primary emissions of aerosols and HCHO mixing ratios are related to secondary aerosol formation, we used a multiple linear regression model to estimate the contribution of primary and secondary aerosols. The comparison of modeled and MAX-DOAS measurements of aerosol extinction coefficients is shown in Fig. 6c. The Pearson correlation coefficients (R) between modeled and measured aerosol extinction coefficient for summer and winter are 0.55 and 0.77, respectively. The multiple linear regression model only considered primary and secondary sources of aerosol, while factors such as pollution transport and meteorological effects are not considered. Better correlation in winter indicates larger contributions of primary and secondary aerosols, whereas transportation and meteorological effects show a stronger influence on the ambient aerosol concentrations. Better correlation between aerosol and HCHO implies the large contribution of secondary aerosol, while primary aerosol sources show a less significant contribution as indicated by the correlation between aerosol and NO2.
4.1 Comparison of surface aerosol and NO2 concentrations
Aerosol extinction coefficients are related to the particle concentrations in the atmosphere, depending on the aerosol composition and size distribution. Thus, as a first approximation assuming constant composition, we compare the aerosol extinction coefficients at the lowest layer (εsurf) of the MAX-DOAS profile retrieval to PM10 concentrations reported from the nearby air quality monitoring station. Time series of εsurf at 360 nm and PM10 concentrations are shown in Fig. 7a. As the in situ air quality monitoring station only provides hourly data, MAX-DOAS measurements for all azimuth directions are averaged to hourly and monthly data for comparison. Both εsurf and PM10 show a similar variation pattern with slightly higher values in winter; however, εsurf varies over a wide range with hourly values ranging from 0.005 up to 1.859 km−1. The correlation between MAX-DOAS measurements of εsurf and PM10 concentrations from in situ measurement is shown in Fig. 7b. Monthly averaged MAX-DOAS data show a reasonable agreement with the in situ PM10 measurements with R of 0.66. This moderate correlation can be explained by the differences in physical quantities of the two measurements. The aerosol extinction coefficient is not only related to the aerosol mass concentration but also strongly related to the microphysical properties of aerosol, such as the size distribution and particle composition. Meteorological factors, such as humidity and temperature, could have big impacts on the aerosol size distribution and optical properties. Therefore, the relation between εsurf and PM10 concentrations can be very different in different seasons (Schäfer et al., 2008). In addition, the spatial coverage of the two measurements is quite different. MAX-DOAS observations typically cover a few kilometers around the measurement site, whereas the in situ measurements are only representative of the small area surrounding the station and governed by local conditions (see Geiß et al., 2017). As the in situ monitoring station is located northwest of the MAX-DOAS measurement site, we have also compared the εsurf measurement at an azimuth angle of 315∘ to the in situ data. The result shows a better agreement with each other with an R of 0.82. The result indicates the strong spatial variation of aerosol in Munich and suggests that a single in situ monitor is not representative of the general pollution condition in the city.
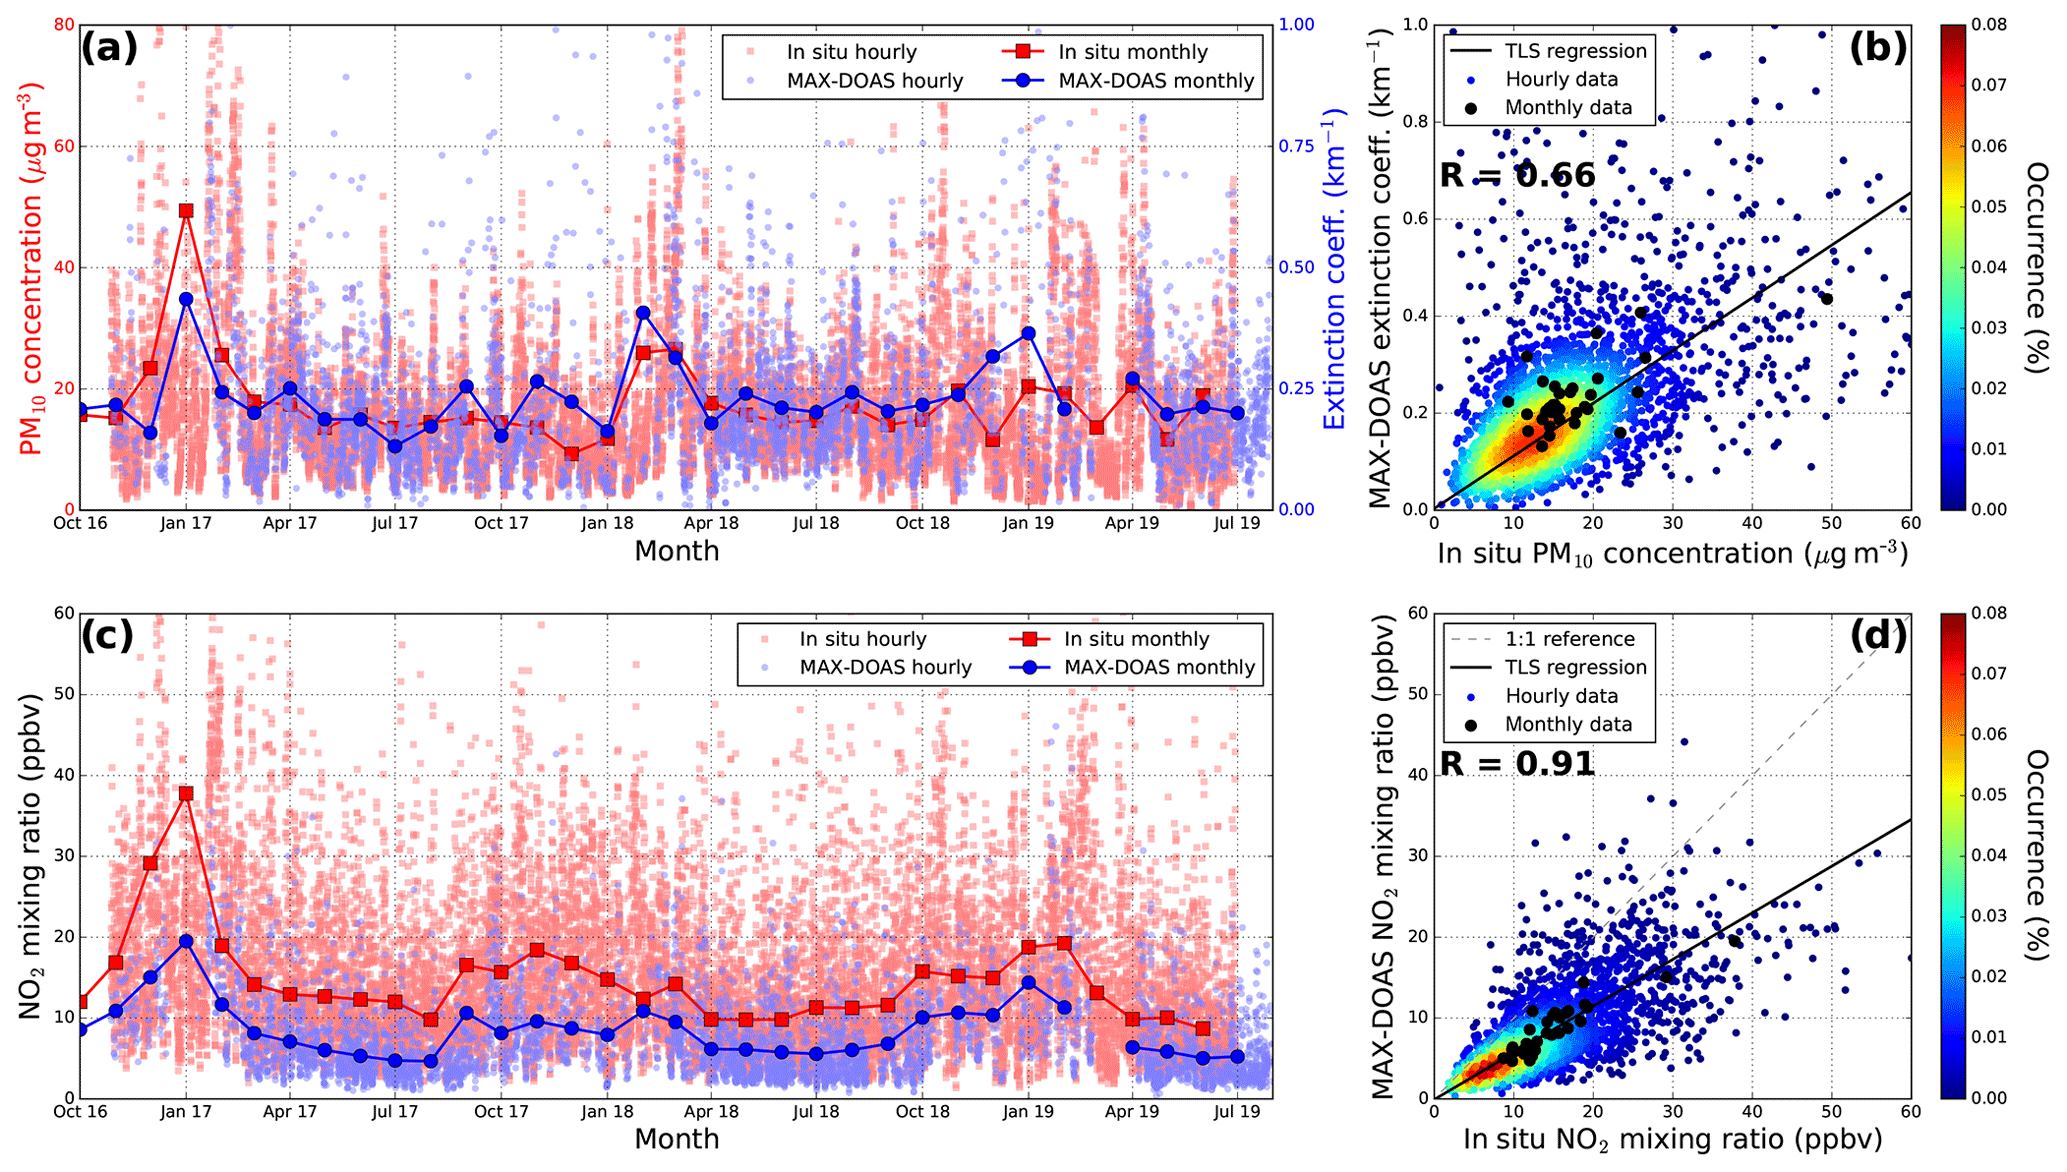
Figure 7(a) Time series of surface aerosol optical extinction coefficients εsurf at 360 nm retrieved from MAX-DOAS observations (blue curve) and PM10 concentrations measured by the air quality monitoring station (red curve). (b) Scatterplot of εsurf against PM10 concentrations. (c) Time series of surface NO2 mixing ratios measured by the MAX-DOAS (blue curve) and the air quality monitoring station (red curve). (d) Scatterplot of the NO2 mixing rations measured by the MAX-DOAS against the air quality monitoring station measurements. Correlation coefficient and total least squares regression lines are calculated based on monthly averaged data.
We have also compared the surface NO2 mixing ratios retrieved from the MAX-DOAS observations to the in situ monitor, the corresponding time series are shown in Fig. 7c. The MAX-DOAS surface NO2 mixing ratios are taken from the lowest layer of the NO2 vertical profile retrieval. Similar to the PM10 comparison, individual MAX-DOAS surface NO2 data are averaged to hourly and monthly values for comparison. The surface NO2 mixing ratios show a similar seasonal pattern as PM10 with higher values during winter and lower in summer. The surface NO2 mixing ratios vary in a wide range. Hourly averaged MAX-DOAS data are ranging from 0.4 up to 53.5 ppbv, while in situ monitor reports a variation of 1.3–100.2 ppbv. The MAX-DOAS observations are systematically lower than the in situ monitor by ∼50 %. Figure 7d shows the scatterplot between MAX-DOAS and in situ measurements of surface NO2 mixing ratios. Both hourly and monthly averaged data show good agreement with R = 0.91 for the monthly values. The slope of the total least squares regression line is 0.54 with an offset of 0.61 ppbv. Lower values measured by the MAX-DOAS are mainly due to the differences in vertical coverage. NO2 mixing ratios at the lowest layer of the MAX-DOAS retrieval represent the average values from 20 m (roof top level) to 120 m above ground, while the in situ monitor measures at ∼15 m above street level. We have also linearly extrapolated the MAX-DOAS measurements to 15 m using the two lowest layers of the NO2 vertical profile retrieval. The extrapolated NO2 concentrations are ∼10 % higher than the lowest layer of the MAX-DOAS measurements. The result indicates a stronger enhancement of NO2 levels at near street level compared to the upper part of the mixing layer. The major source of NO2 in urban areas is traffic emissions which are emitted at street level; therefore, the atmospheric concentration of NO2 is expected to be lower after being dispersed to upper altitudes. In addition, the MAX-DOAS reports NO2 mixing ratios averaged along a long optical path, which covers residential areas and city parks, where the NO2 mixing ratios are expected to be lower. As a consequence, the MAX-DOAS is in general measuring lower surface NO2 mixing ratios than the in situ monitoring station.
4.2 Comparison of aerosol optical depth
Time series of AOD at 360 nm over Munich derived from MAX-DOAS and sun photometer measurements are compared in Fig. 8a. For this purpose, sun photometer data measured at 340 and 380 nm have been interpolated to 360 nm following the Ångström exponent approach. As the temporal resolution of the MAX-DOAS and the sun photometer are different, individual data are averaged to hourly and monthly values for comparison. Missing data are due to cloud filtering or instrument maintenance. The annual averages of the AOD from the MAX-DOAS and sun photometer observations are 0.21 and 0.23, respectively, indicating consistency between both remote sensing techniques. In contrast to the surface aerosol extinction coefficients and PM10 concentrations, the annual cycle of the AOD shows larger values in summer and lower values in winter. This is true for measurements from MAX-DOAS and sun photometer. Stronger convection and insolation resulting in extended mixing layers and enhanced emission of, for example, biogenic VOCs are the main reasons of increased AOD in spring and summer. Moreover, long-range transport of Saharan dust occurs frequently with sometimes exceptionally large contributions (Ansmann et al., 2003; Wiegner et al., 2011). The difference between the annual variation of εsurf and AOD suggests a different vertical distribution of aerosols in different seasons. Due to reduced vertical exchange, aerosols are concentrated near the surface during winter, resulting in increased εsurf and low AOD.
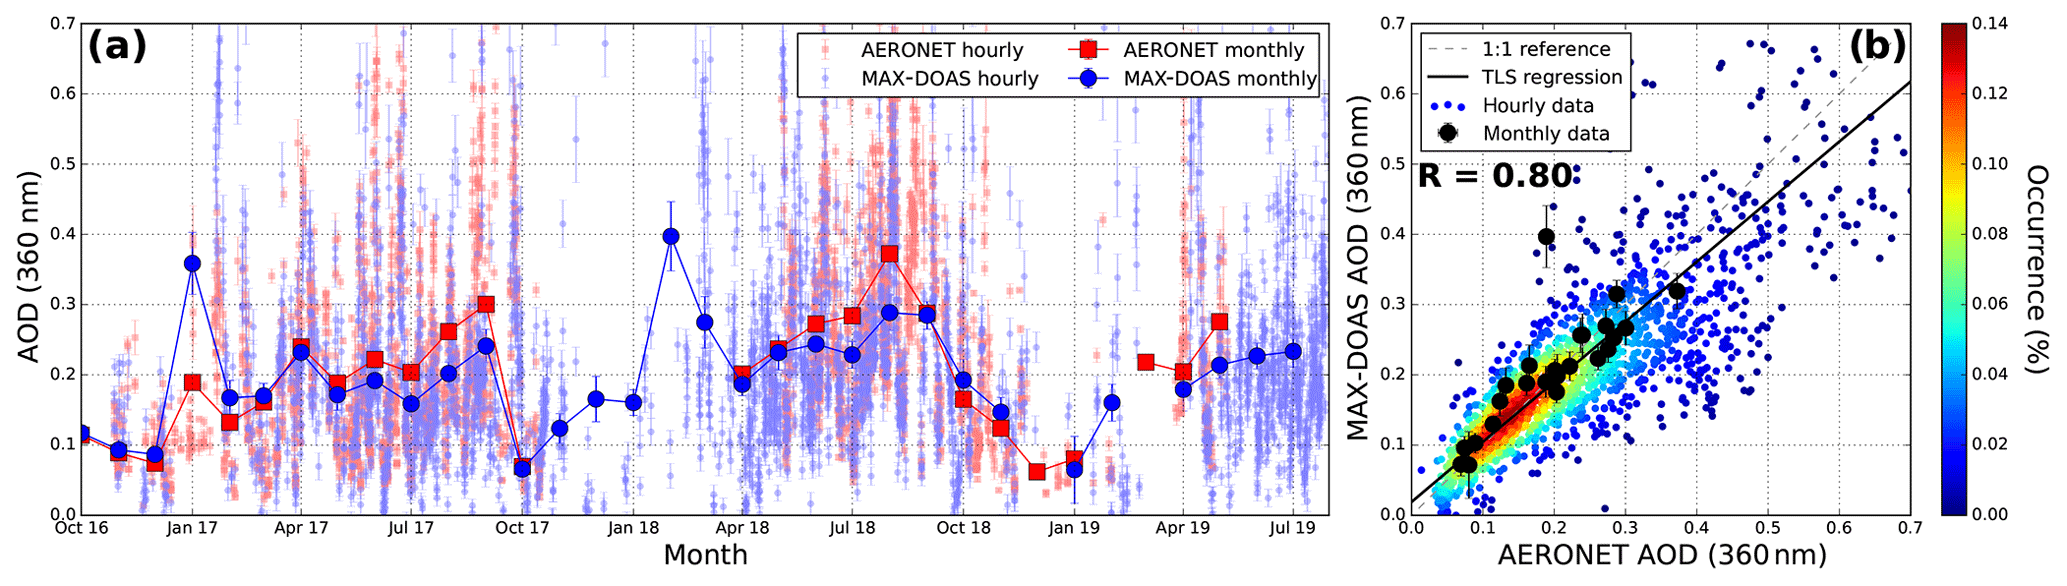
Figure 8(a) Time series of aerosol optical depth measured by MAX-DOAS (blue curve) and sun photometer (red curve). (b) Scatterplot of aerosol optical depth measured by MAX-DOAS and sun photometer. The correlation coefficient and total least squares regression line are calculated based on the hourly averaged data.
The scatterplot AOD derived from MAX-DOAS and sun photometer is shown in Fig. 8b. Hourly averaged data correlate well with R = 0.80. Despite the high correlation between the two datasets, AOD derived from MAX-DOAS is in general slightly lower than the AERONET retrievals, especially under high aerosol load. The slope of the total least squares regression line is 0.86 with an offset of 0.02. The discrepancy between the results can be explained by the differences in the measurement techniques: the MAX-DOAS retrieval derives the AOD from observations of O4 absorption, and is mostly sensitive to aerosols in the lowest few kilometers of the troposphere as it uses lower elevation angles. In contrast the sun photometer retrieval is based on the reduction of the transmission of solar radiation along the line of sight and thus covers the full vertical extent of the atmosphere. As the AODs reported from the MAX-DOAS only represent the AODs of the lowest 3 km, while the sun photometer AODs cover the entire atmosphere, lower AODs observed by the MAX-DOAS are expected. Furthermore, the assumptions on aerosol optical properties in the MAX-DOAS retrieval also contribute to the uncertainties in the MAX-DOAS AOD (∼5 %) (Chan et al., 2019).
5.1 Comparison of NO2 columns
Tropospheric NO2 vertical column densities retrieved from the MAX-DOAS measurements are compared to OMI and TROPOMI observations over Munich. MAX-DOAS VCDs are temporally averaged around the OMI and TROPOMI overpass time of 12:00–14:00 LT (local time), while OMI and TROPOMI data are spatially averaged for pixels within 10 km of the MAX-DOAS measurement site. Time series of tropospheric NO2 VCDs from MAX-DOAS, OMI and TROPOMI observations are shown in Fig. 9a. OMI and TROPOMI NO2 VCDs retrieved using MAX-DOAS profile as a priori information are also indicated. Daily and monthly averages are shown. Missing data are due to high cloudiness, pixel anomaly of OMI or maintenance of the MAX-DOAS instrument. OMI measurements are occasionally exceeding the MAX-DOAS values, which is mainly due to high cloudiness and the OMI pixel anomaly issue and result in rather sparse valid OMI measurements within these months. Both ground-based and satellite measurements show lower NO2 VCDs in summer and higher values during winter. Higher NO2 levels in winter are mainly due to higher emissions, e.g., domestic heating, and longer atmospheric lifetime of NO2.

Figure 9(a) Time series of tropospheric NO2 vertical column densities measured by MAX-DOAS, OMI and TROPOMI (labeled as S5P). MAX-DOAS data are temporally averaged around the satellite overpass time, while OMI and TROPOMI observations are spatially averaged within 10 km of the MAX-DOAS measurement site. OMI and TROPOMI VCDs retrieved using MAX-DOAS profile as a priori information are shown as well (labeled as OMI corr. and S5P corr.). (b) Scatterplot of tropospheric NO2 VCDs measured by MAX-DOAS and TROPOMI.
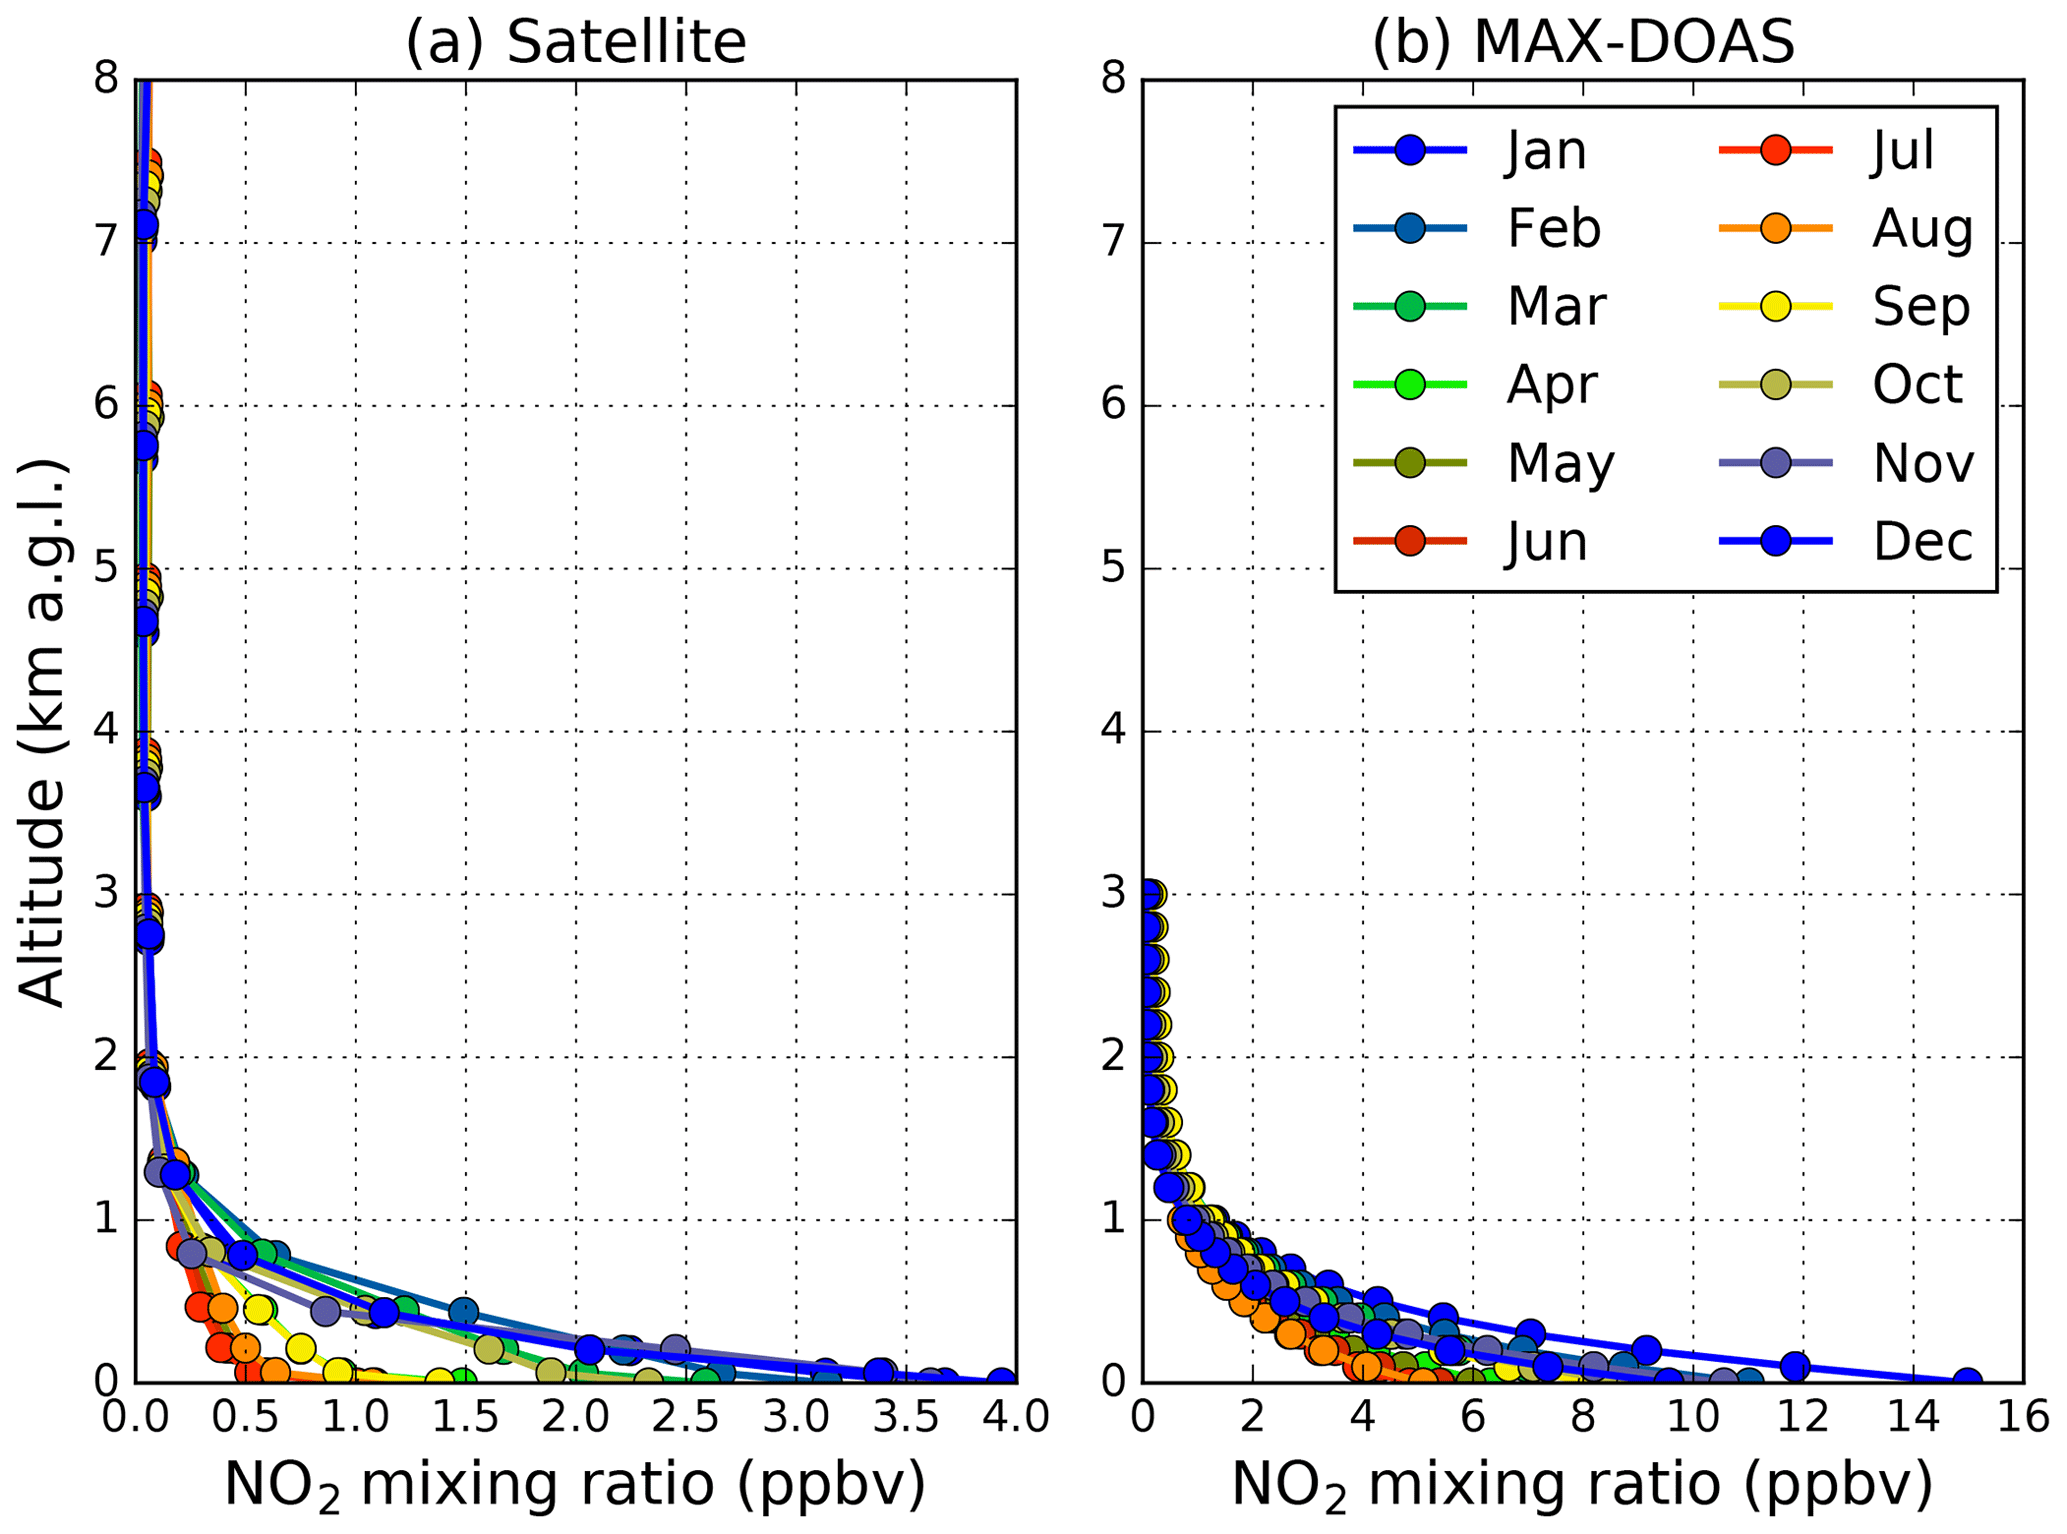
Figure 10(a) Monthly average of NO2 a priori profiles used in the satellite retrieval. (b) MAX-DOAS measurements of NO2 profiles.
The scatterplot of OMI and TROPOMI observations of tropospheric NO2 VCDs against MAX-DOAS measurements is shown in Fig. 9b. Both OMI and TROPOMI NO2 observations show good correlation with MAX-DOAS measurements with R = 0.85 and R = 0.93, respectively. However, both spaceborne observations report lower NO2 columns than the MAX-DOAS. Averaged differences between OMI and TROPOMI satellite observations and MAX-DOAS measurements of NO2 VCDs are and molec. cm−2, respectively. The underestimation of NO2 VCDs is partly related to the a priori vertical distribution profile of NO2 used in the air mass factor calculation of the satellite retrieval. These satellite a priori profiles are taken from the TM5 chemistry transport model simulation. The horizontal resolution of TM5 is rather coarse (), and it is not able to fully resolve emission hot spots over cites. In order to quantify the influence of the a priori NO2 profile in the satellite retrieval, we have recomputed the OMI and TROPOMI NO2 VCDs by using MAX-DOAS NO2 profiles as a priori information (labeled as OMI corr. and S5P corr. in Fig. 9). Monthly averages of the a priori NO2 profiles used in the satellite retrieval are shown in Fig. 10a, while the corresponding MAX-DOAS retrievals are shown in Fig. 10b. MAX-DOAS NO2 profiles show about 4 times higher NO2 levels at the surface compared to the original a priori profiles used in the satellite retrieval. Our finding agrees with the previous studies that higher-resolution and more accurate a priori profile information would significantly improve the TROPOMI observations of NO2 (Griffin et al., 2019; Zhao et al., 2020). Using the MAX-DOAS NO2 profiles as a priori information generally increased the OMI and TROPOMI NO2 VCDs by ∼45 % and ∼17 %, respectively. Due to a difference in temporal coverage, OMI provides longer-term measurements, while TROPOMI measurements are only available after November 2017; the percentage increase of OMI and TROPOMI NO2 VCDs are quite different. If we only consider the same period of November 2017 to July 2019, the percentage of increase is similar for OMI and TROPOMI. As can be seen in Fig. 9 the absolute values of OMI and TROPOMI NO2 VCDs retrieved with MAX-DOAS NO2 profiles as a priori agree better with the MAX-DOAS measurements with correlation nearly unchanged.
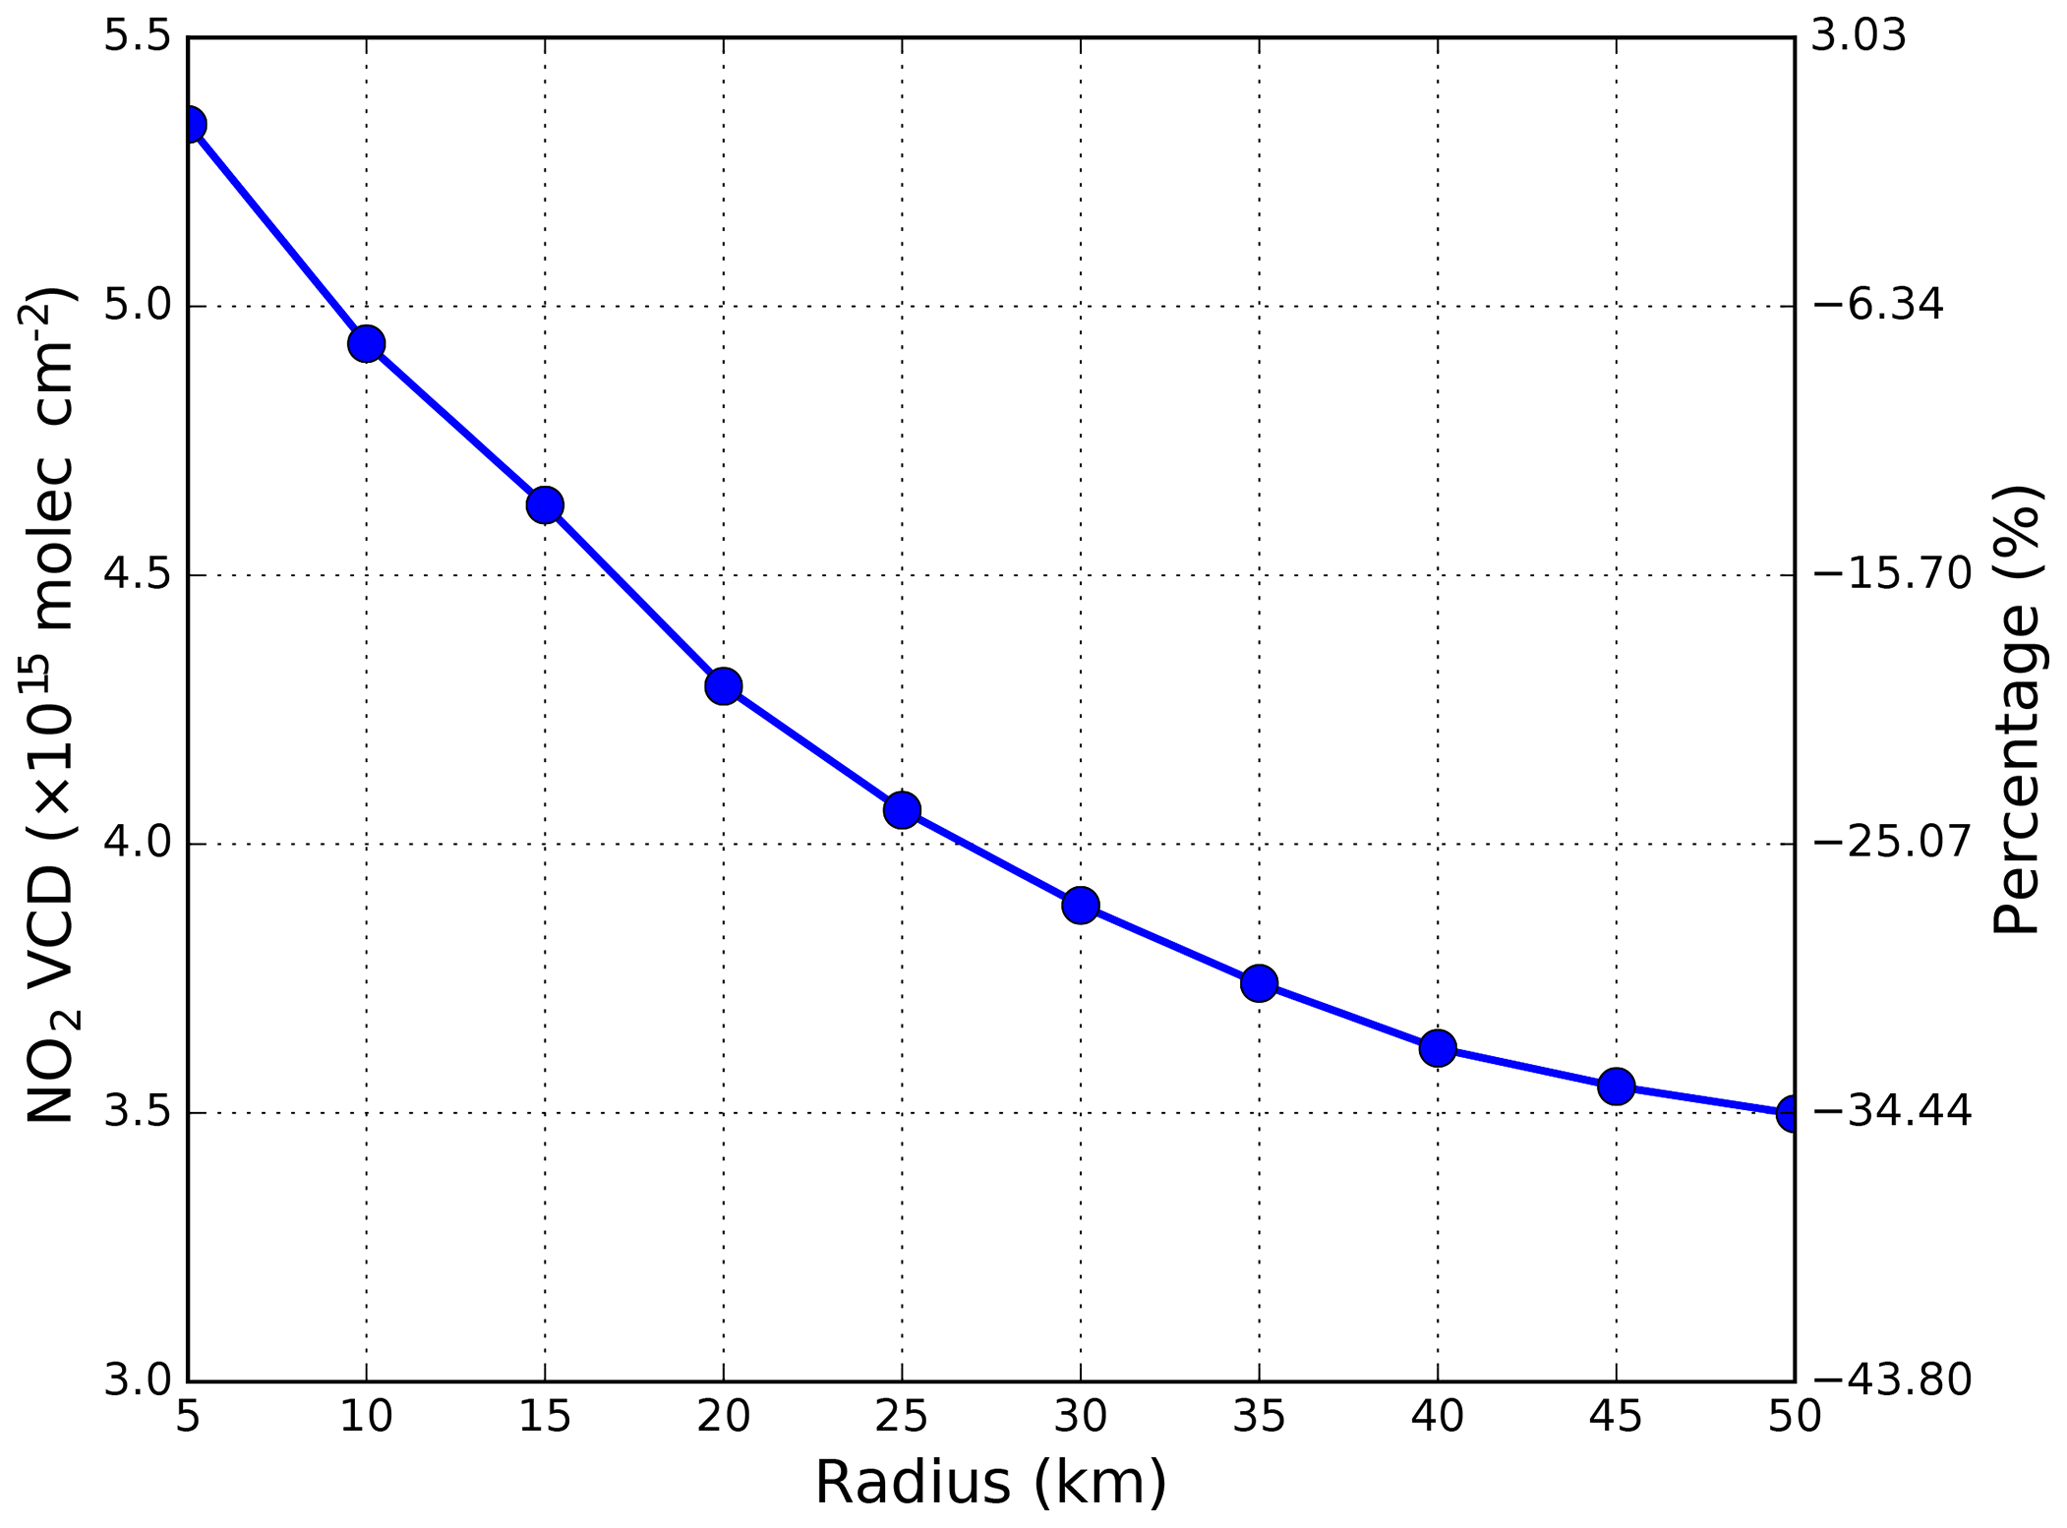
Figure 11Tropospheric NO2 VCDs measured by TROPOMI spatially averaged with different radii surrounding the MAX-DOAS measurement site.
Previous satellite observations often underestimated the tropospheric NO2 columns over cities or pollution hot spots. The underestimation is partially related to the large satellite footprint which is not able to capture the spatial gradient of NO2 due to the averaging over large satellite pixels (Wenig et al., 2008; Chan et al., 2012). This averaging effect over hot spots can be estimated by using high-resolution TROPOMI observations. Tropospheric NO2 VCDs measured by TROPOMI are spatially averaged with different radii as shown in Fig. 11. Satellite data with their pixels center coordinate within a certain radius of the MAX-DOAS measurement site are used in the spatial averaging. The MAX-DOAS measurement in the UV typically covers a range of 5–8 km depending on the visibility, while the measurement in the VIS has a better coverage of 8–12 km. Therefore, the percentage of underestimation relative to the 5 km average is shown in Fig. 11 as reference. The result shows that the averaged NO2 VCDs decrease with increasing averaging radius. NO2 columns are underestimated by ∼8 % with an averaging radius of 10 km, which is approximately the size of the OMI footprint at nadir (13 km × 24 km). The underestimations increase to ∼13 % and ∼34 % for averaging radii of 15 km (average OMI pixel size) and 50 km. These numbers are characteristic for pollution hot spots of the size of Munich (approximately 5 km in radius), but they could be different for hot spots of different size and spatial distribution. Although the spatial resolution of TROPOMI observations have been significantly improved compared to its predecessors, satellite observations are still critical to resolve spatial features of pollutants within a city. Therefore, ground-based measurements are essential for the investigation of small-scale pollution within a city.
5.2 Comparison of HCHO columns
MAX-DOAS observations of HCHO VCDs are also used to validate TROPOMI measurements. Time series of HCHO VCDs measured by the MAX-DOAS and TROPOMI are shown in Fig. 12a. MAX-DOAS VCDs are temporally averaged around the TROPOMI overpass time of 12:00–14:00 LT (local time), while TROPOMI data are spatially averaged for pixels within 10 km of the MAX-DOAS measurement site. Again, gaps are mainly due to high cloud amount and maintenance of the MAX-DOAS instrument. In contrast to the NO2 data, the HCHO VCDs show higher values in summer and lower VCDs during winter. Higher HCHO levels are expected in summer due to stronger biogenic emissions of precursor VOCs from vegetation and higher oxidation rate of VOCs. The scatterplot of TROPOMI HCHO VCDs against MAX-DOAS measurements is shown in Fig. 12b. Satellite and ground-based measurements show good correlation with R = 0.88 for monthly averaged HCHO VCDs. The absolute values measured by TROPOMI, however, are ∼30 % lower than the MAX-DOAS measurements. The average HCHO VCDs measured by TROPOMI and MAX-DOAS are 4.42 × 10¹⁵ and 6.56 × 10¹⁵ molec. cm−2, respectively. The slope of the total least squares regression line is 0.76 with an offset of molec. cm−2. Analogously to the previous section, we have recomputed the TROPOMI HCHO VCDs by using MAX-DOAS profiles (see Fig. 13b) instead of the TM5-profiles (see Fig. 13a) as a priori information to estimate the influence of the a priori profile. The MAX-DOAS profiles show larger amounts of HCHO in the lower troposphere. Using the MAX-DOAS profile as a priori in the satellite retrieval in general enhanced the HCHO columns by ∼50 %. The averaged TROPOMI HCHO VCD increased to 6.37 × 10¹⁵ molec. cm−2. The slope of the regression line of the new dataset also increased to 1.04 (see Fig. 12b).
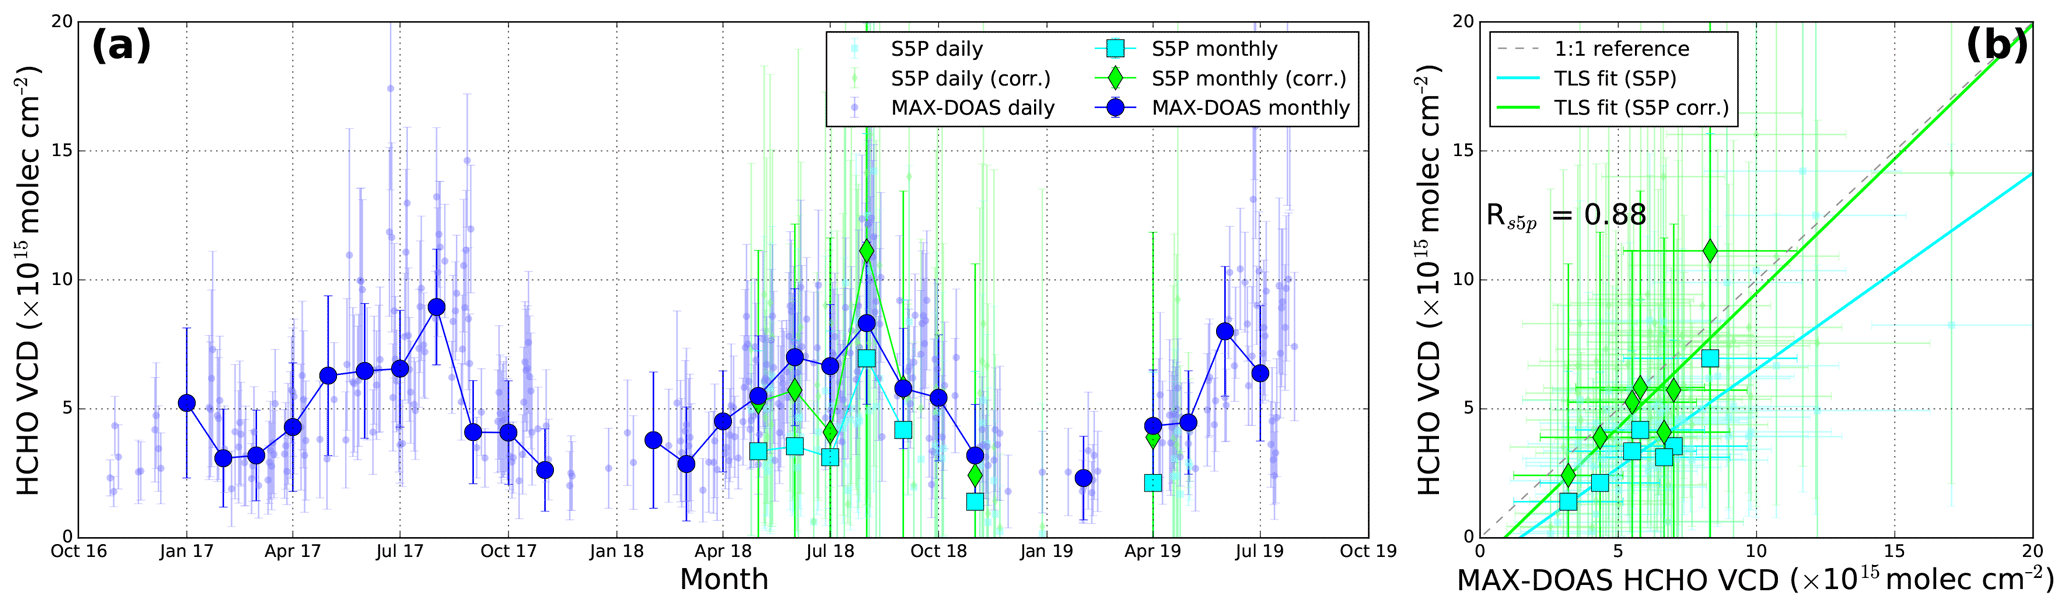
Figure 12(a) Time series of tropospheric HCHO vertical column densities measured by MAX-DOAS and TROPOMI. MAX-DOAS data are temporally averaged around the TROPOMI overpass time, while TROPOMI observations are spatially averaged within 10 km of the MAX-DOAS measurement site. TROPOMI VCDs retrieved using MAX-DOAS profile as a priori information are also indicated (labeled “corr”). (b) Scatterplot of tropospheric HCHO VCDs measured by MAX-DOAS and TROPOMI.
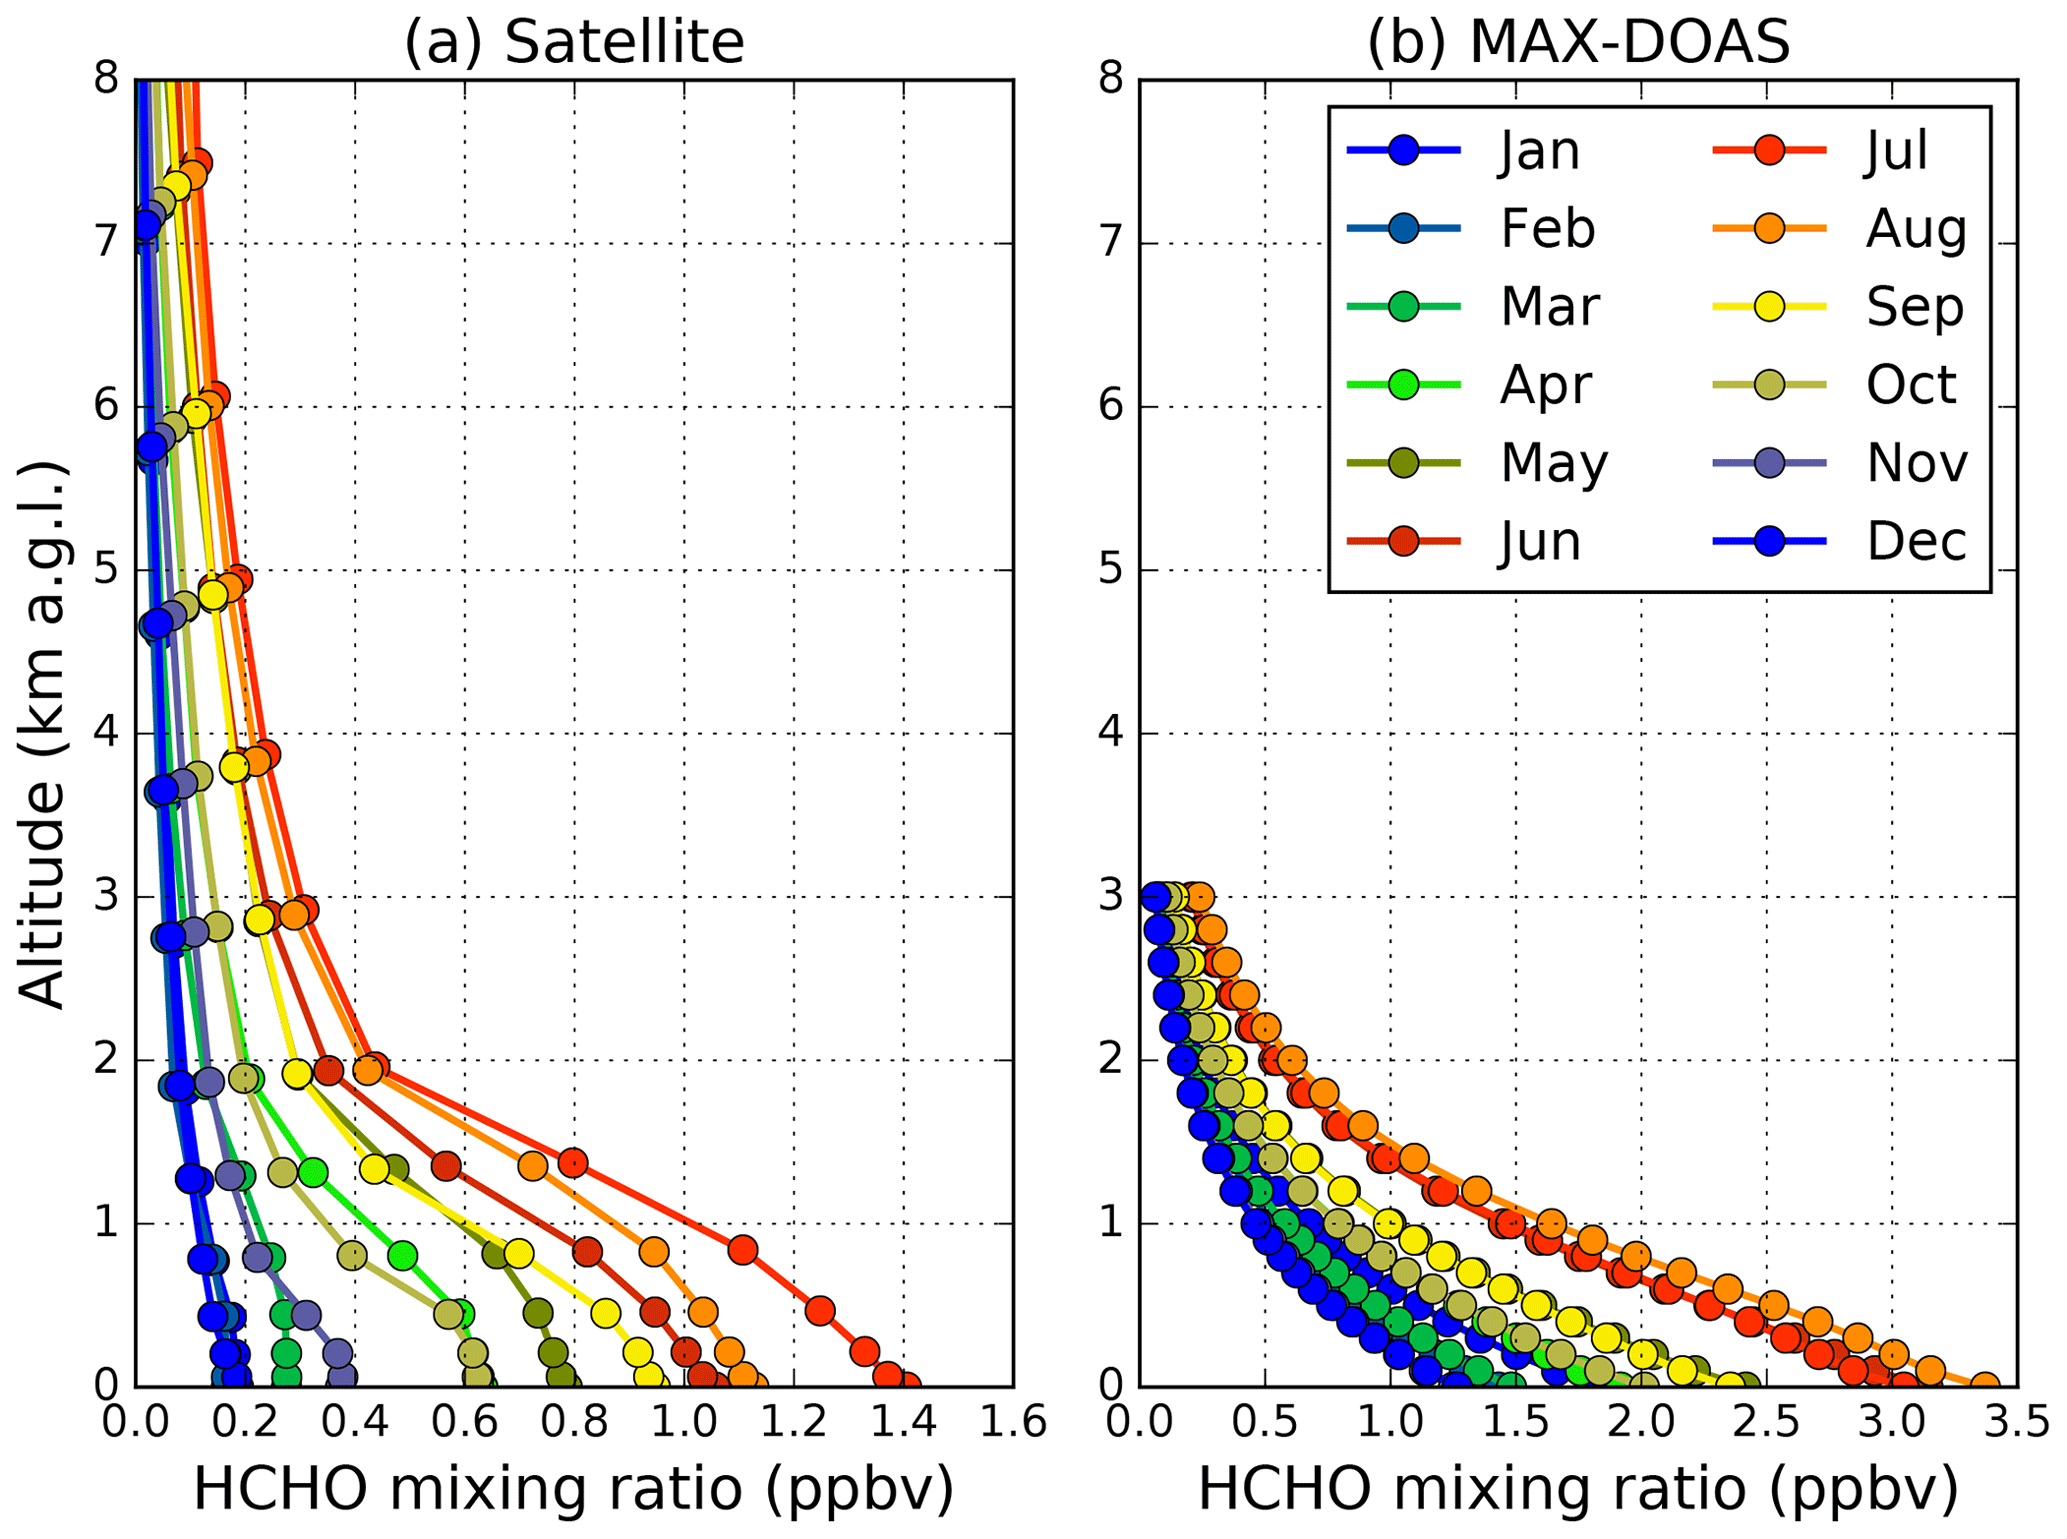
Figure 13(a) Monthly averages of HCHO mixing ratio based on TM5 simulations as used a priori profiles in the satellite retrieval. (b) MAX-DOAS measurements of HCHO profiles.
Similar to the discussion on NO2 retrievals we have analyzed the spatial averaging effect of satellite observations over a HCHO emission hot spot. TROPOMI HCHO VCDs are spatially averaged with different radii surrounding the MAX-DOAS measurement site, and the result is shown in Fig. 14. The underestimation relative to the 5 km average is also shown on the right axis. As expected the averaged HCHO VCDs decrease with increasing averaging radius. HCHO column for an averaging radius of 10 km is ∼7 % lower than the 5 km average. The underestimations increase to ∼8 % and ∼15 % with averaging radii of 15 and 50 km, respectively. The decreasing pattern indicated that there are significant anthropogenic HCHO or HCHO precursor emission in Munich. However, compared to the decreasing pattern of NO2, HCHO shows a more homogeneous distribution as it is mainly originated from regional sources.
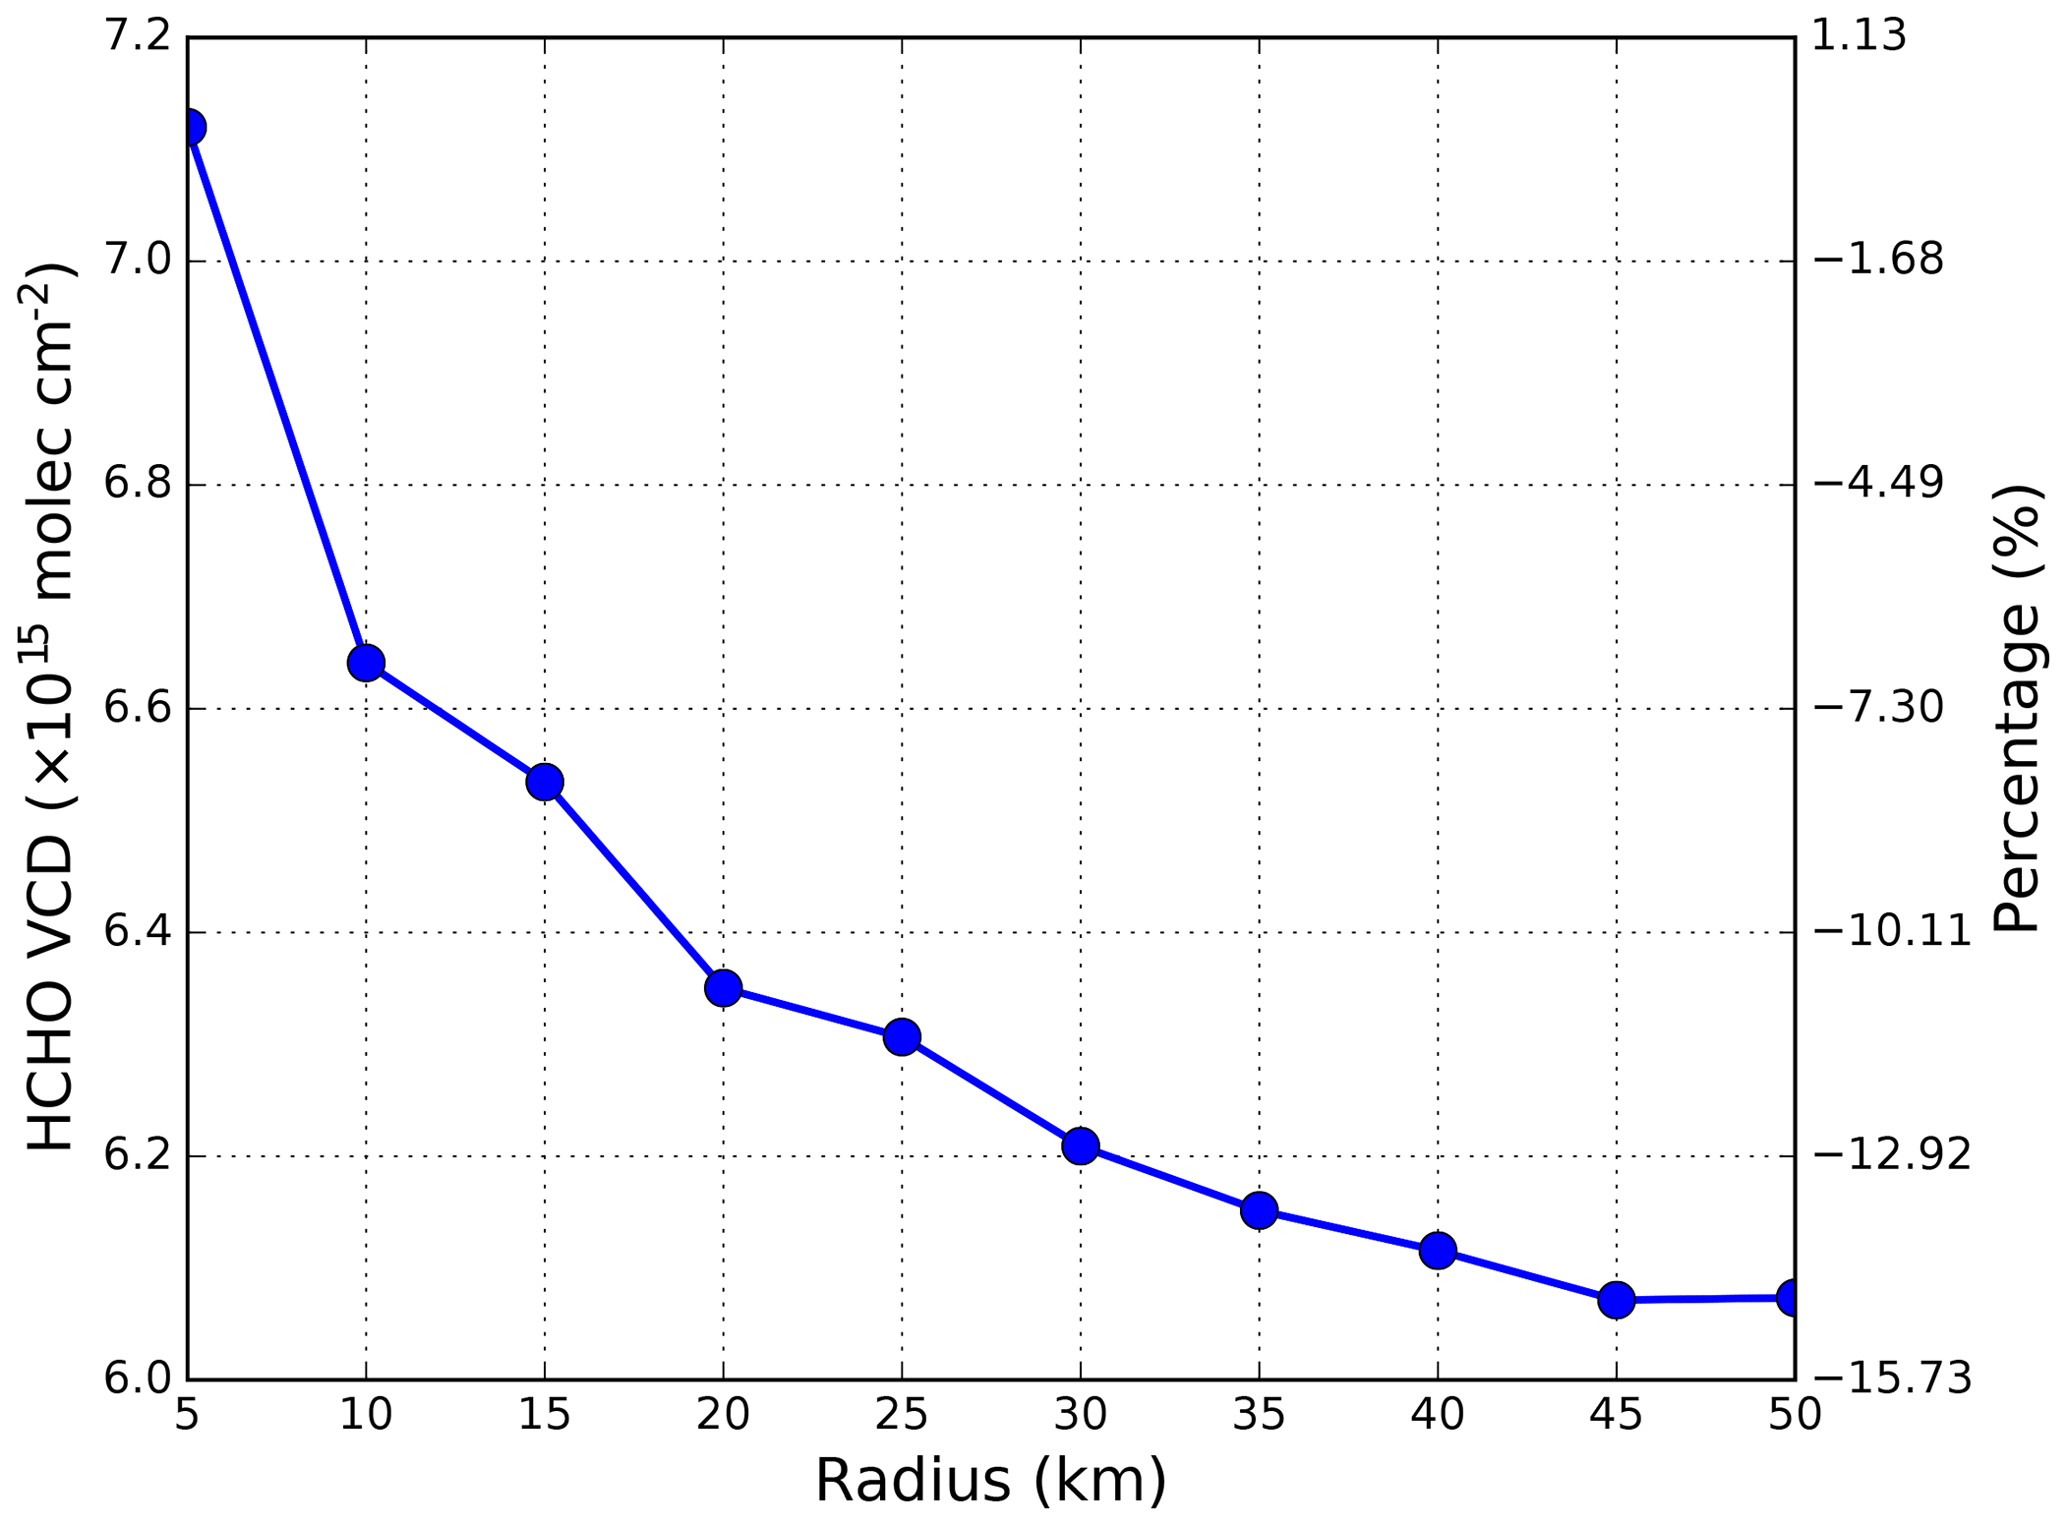
Figure 14Tropospheric HCHO VCDs measured by TROPOMI spatially averaged with different radii surrounding the MAX-DOAS measurement site.
In this paper, we present the first 2D Multi-AXis Differential Optical Absorption Spectroscopy (MAX-DOAS) observations of nitrogen dioxide (NO2) and formaldehyde (HCHO) vertical profiles in Munich, Germany. The measurement covers the time period from October 2016 to July 2019. We have determined vertical columns and vertical profiles of the aerosol extinction coefficient, NO2 and HCHO for Munich. The measured data are used to analyze the spatiotemporal variation of NO2 and HCHO. The spatial distribution of NO2 was in general quite homogeneous in winter, while higher values are observed at the city center during summer. The spatial pattern of HCHO shows higher values in the south in winter and a rather homogeneous distribution in summer. Analysis of the relations between aerosols, NO2 and HCHO shows higher aerosol-to-HCHO ratios in winter, which reflects a longer atmospheric lifetime of aerosol and HCHO during winter. The results also suggested that secondary aerosol formation is the major source of aerosol in Munich.
Our MAX-DOAS retrievals were also compared to independent datasets: we used in situ data from an ambient monitoring station for the intercomparison of surface aerosol extinction coefficients and MAX-DOAS-derived NO2 mixing ratios. A Pearson correlation coefficient of R = 0.91 was found between MAX-DOAS and in situ measurements of surface-level NO2; however, the MAX-DOAS reports ∼50 % lower NO2 mixing ratios. Lower NO2 values measured by the MAX-DOAS are due to the differences in spatial averaging. MAX-DOAS measurement of AOD was compared to AERONET data. The annual cycle was coherent with the MAX-DOAS measurements, and shows higher values in summer and lower values in winter.
Finally, we use tropospheric vertical column densities (VCDs) of NO2 and HCHO derived from MAX-DOAS measurements to validate OMI and TROPOMI satellite observations. Monthly averaged data show a good correlation with each other. However, satellite observations are on average 30 % lower than the MAX-DOAS measurements. Underestimation of NO2 and HCHO columns is largely related to the coarse spatial resolution of a priori profiles of the satellite retrieval. Using MAX-DOAS observations as a priori in satellite retrievals greatly reduces the underestimation.
In summary, our results demonstrate a wide range of applications of MAX-DOAS measurements in a global framework and also for investigations of the air quality in metropolitan areas. An obvious advantage is that different atmospheric components can be retrieved simultaneously. Thus, for the understanding of details of and reasons for the interactions between trace gases, aerosols and meteorological variables, MAX-DOAS measurements can provide a substantial contribution; however, only the combination of different observation techniques (e.g., Wiegner et al., 2006; Emeis et al., 2008; Geiß et al., 2017; von Schneidemesser et al., 2018) and city-scale resolving models (Vlemmix et al., 2015; Maronga et al., 2019, 2020) can ultimately resolve the open questions and lead to (political) regulations for the future design of urban environments to meet high air-quality standards.
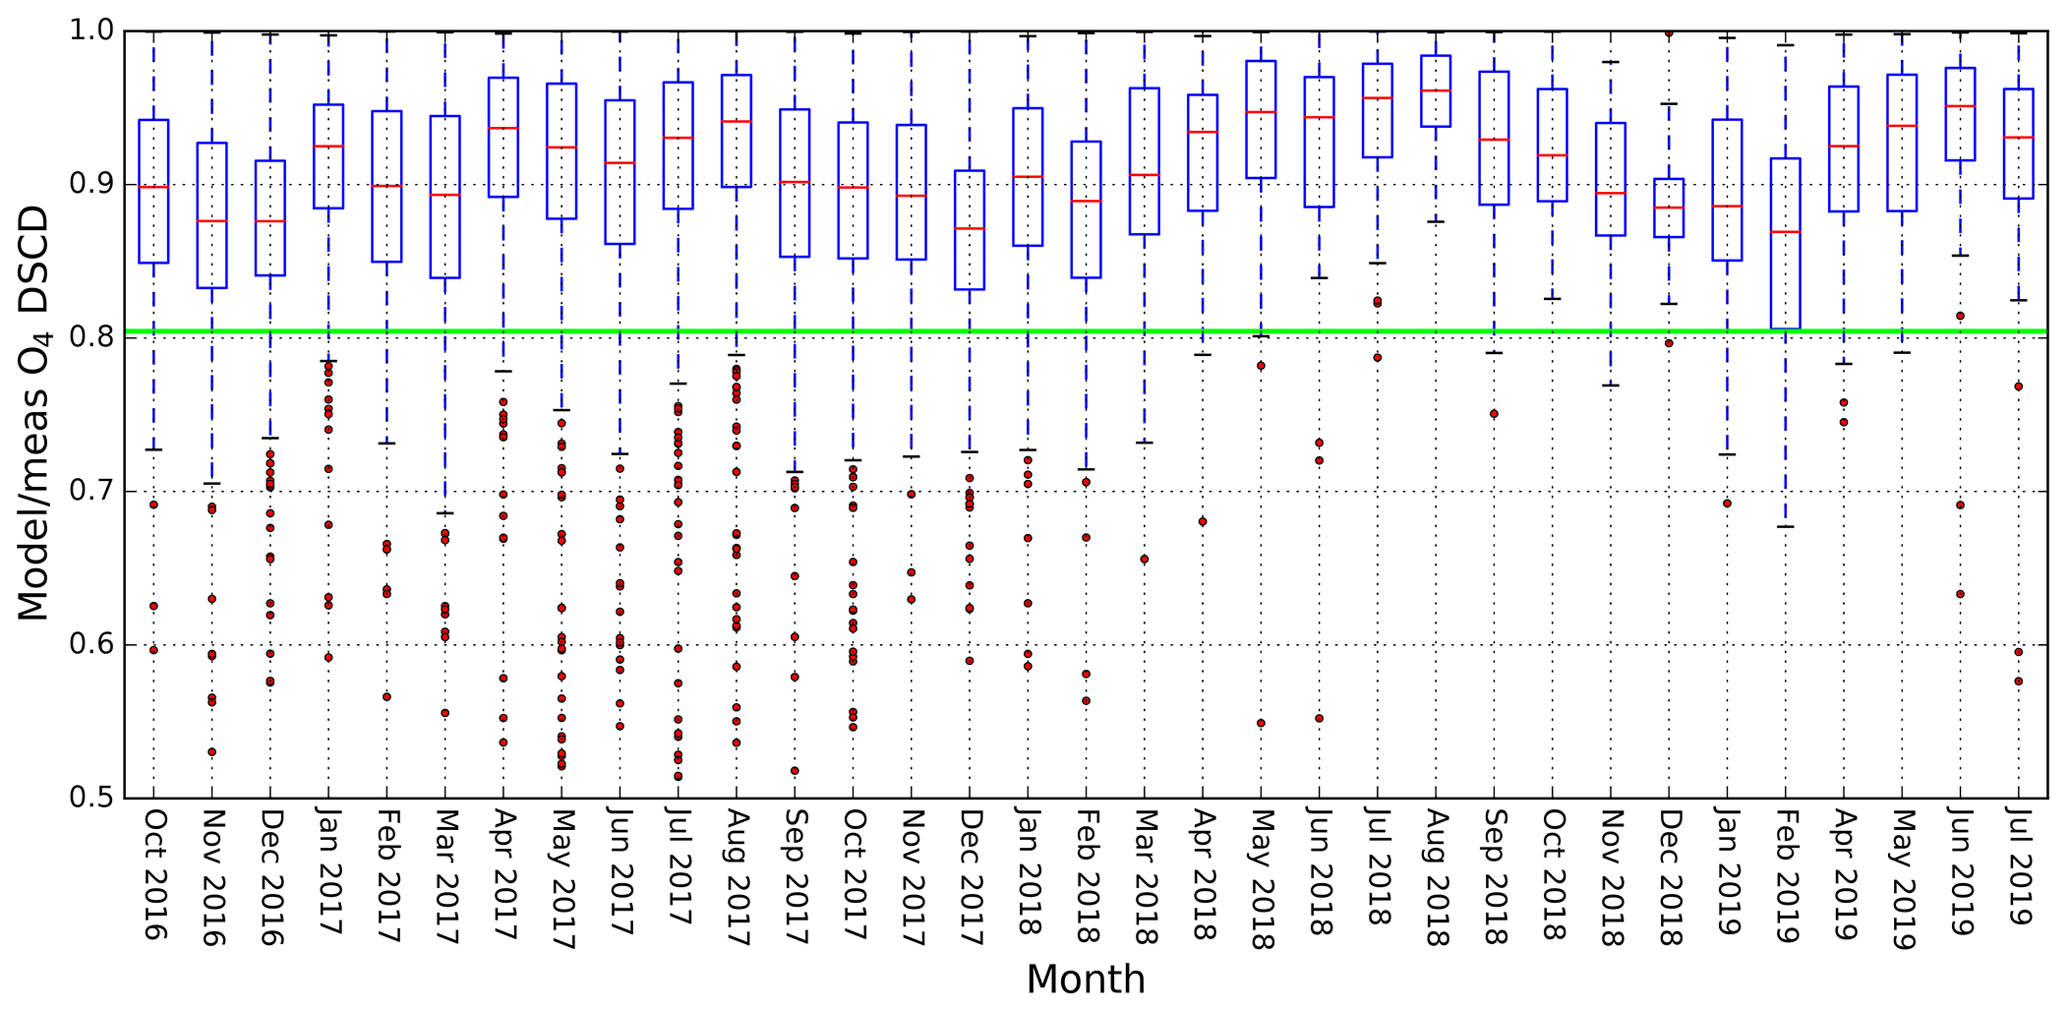
Figure A1Monthly statistics of measured O4 DSCDs exceeding the pure Rayleigh simulation. The ratios between modeled and measured O4 DSCDs for observations taken at an elevation angle of 15∘ are shown. The green line indicates the 10th percentile (0.804).
The M3 profile retrieval algorithm and MAX-DOAS data used in this study are available on request from the corresponding author (ka.chan@dlr.de).
KLC and MW designed the experiment. KLC, CA and SY carried out the experiment. JVG, IDS and ZC provided support on satellite data. MW provided support for the review and editing of the article. KLC analyzed the measurement data and prepared the article with contributions from all co-authors.
The authors declare that they have no conflict of interest.
This paper is dedicated to the memory of Matthias Wiegner who passed away suddenly on 29 July 2020.
This research has been supported by the DFG Major Research Instrumentation Programme (grant no. INST 86/1499-1 FUGG), the European Union's Horizon 2020 research and innovation program (grant no. 654109), and the Federal Minister of Transport and Digital Infrastructure (BMVI) (grant no. 19F2065).
The article processing charges for this open-access
publication were covered by a Research
Centre of the Helmholtz Association.
This paper was edited by William R. Simpson and reviewed by two anonymous referees.
Aliwell, S. R., Roozendael, M. V., Johnston, P. V., Richter, A., Wagner, T., Arlander, D. W., Burrows, J. P., Fish, D. J., Jones, R. L., Tørnkvist, K. K., Lambert, J.-C., Pfeilsticker, K., and Pundt, I.: Analysis for BrO in zenith-sky spectra: An intercomparison exercise for analysis improvement, J. Geophys. Res.-Atmos., 107, ACH10-1–ACH10-20, https://doi.org/10.1029/2001JD000329, 2002. a, b
Anderson, G. P., Clough, S. A., Kneizys, F., Chetwynd, J. H., and Shettle, E. P.: AFGL atmospheric constituent profiles (0.120 km), Tech. rep., AIR FORCE GEOPHYSICS LAB HANSCOM AFB MA, 1986. a, b
Ångström, A.: On the Atmospheric Transmission of Sun Radiation and on Dust in the Air, Geogr. Annal., 11, 156–166, https://doi.org/10.1080/20014422.1929.11880498, 1929. a
Ansmann, A., Bösenberg, J., Chaikovsky, A., Comerón, A., Eckhardt, S., Eixmann, R., Freudenthaler, V., Ginoux, P., Komguem, L., Linné, H., Márquez, M. Á. L., Matthias, V., Mattis, I., Mitev, V., Müller, D., Music, S., Nickovic, S., Pelon, J., Sauvage, L., Sobolewsky, P., Srivastava, M. K., Stohl, A., Torres, O., Vaughan, G., Wandinger, U., and Wiegner, M.: Long-range transport of Saharan dust to northern Europe: The 11–16 October 2001 outbreak observed with EARLINET, J. Geophys. Res.-Atmos., 108, https://doi.org/10.1029/2003JD003757, 2003. a
Beirle, S., Platt, U., Wenig, M., and Wagner, T.: Weekly cycle of NO2 by GOME measurements: a signature of anthropogenic sources, Atmos. Chem. Phys., 3, 2225–2232, https://doi.org/10.5194/acp-3-2225-2003, 2003. a
Beirle, S., Platt, U., Wenig, M., and Wagner, T.: NOx production by lightning estimated with GOME, Adv. Space Res., 34, 793–797, https://doi.org/10.1016/j.asr.2003.07.069, 2004. a
Boersma, K. F., Eskes, H. J., Richter, A., De Smedt, I., Lorente, A., Beirle, S., van Geffen, J. H. G. M., Zara, M., Peters, E., Van Roozendael, M., Wagner, T., Maasakkers, J. D., van der A, R. J., Nightingale, J., De Rudder, A., Irie, H., Pinardi, G., Lambert, J.-C., and Compernolle, S. C.: Improving algorithms and uncertainty estimates for satellite NO2 retrievals: results from the quality assurance for the essential climate variables (QA4ECV) project, Atmos. Meas. Tech., 11, 6651–6678, https://doi.org/10.5194/amt-11-6651-2018, 2018. a
Bond, D. W., Zhang, R., Tie, X., Brasseur, G., Huffines, G., Orville, R. E., and Boccippio, D. J.: NOx production by lightning over the continental United States, J. Geophys. Res.-Atmos., 106, 27701–27710, https://doi.org/10.1029/2000JD000191, 2001. a
Bovensmann, H., Burrows, J., Buchwitz, M., Frerick, J., Noël, S., Rozanov, V., Chance, K., and Goede, A.: SCIAMACHY: Mission objectives and measurement modes, J. Atmos. Sci., 56, 127–150, 1999. a
Burrows, J. P., Weber, M., Buchwitz, M., Rozanov, V., Ladstätter-Weißenmayer, A., Richter, A., DeBeek, R., Hoogen, R., Bramstedt, K., Eichmann, K.-U., Eisingera, M., and Pernerb, D.: The global ozone monitoring experiment (GOME): Mission concept and first scientific results, J. Atmos. Sci., 56, 151–175, 1999. a
Callies, J., Corpaccioli, E., Eisinger, M., Hahne, A., and Lefebvre, A.: GOME-2-Metop's second-generation sensor for operational ozone monitoring, ESA Bulletin, 102, 28–36, 2000. a
Chan, K. L., Pöhler, D., Kuhlmann, G., Hartl, A., Platt, U., and Wenig, M. O.: NO2 measurements in Hong Kong using LED based long path differential optical absorption spectroscopy, Atmos. Meas. Tech., 5, 901–912, https://doi.org/10.5194/amt-5-901-2012, 2012. a
Chan, K. L., Hartl, A., Lam, Y. F., Xie, P. H., Liu, W. Q., Cheung, H. M., Lampel, J., Pöhler, D., Li, A., Xu, J., Zhou, H. J., Ning, Z., and Wenig, M.: Observations of tropospheric NO2 using ground based MAX-DOAS and OMI measurements during the Shanghai World Expo 2010, Atmos. Environ., 119, 45–58, https://doi.org/10.1016/j.atmosenv.2015.08.041, 2015. a, b, c
Chan, K. L., Wiegner, M., Wenig, M., and Pöhler, D.: Observations of tropospheric aerosols and NO2 in Hong Kong over 5 years using ground based MAX-DOAS, Sci. Total Environ., 619–620, 1545–1556, https://doi.org/10.1016/j.scitotenv.2017.10.153, 2018. a, b, c
Chan, K. L., Wang, Z., Ding, A., Heue, K.-P., Shen, Y., Wang, J., Zhang, F., Shi, Y., Hao, N., and Wenig, M.: MAX-DOAS measurements of tropospheric NO2 and HCHO in Nanjing and a comparison to ozone monitoring instrument observations, Atmos. Chem. Phys., 19, 10051–10071, https://doi.org/10.5194/acp-19-10051-2019, 2019. a, b, c, d, e
Chance, K. and Kurucz, R.: An improved high-resolution solar reference spectrum for earth's atmosphere measurements in the ultraviolet, visible, and near infrared, J. Quant. Spectrosc. Ra., 111, 1289–1295, https://doi.org/10.1016/j.jqsrt.2010.01.036, 2010. a
Chen, D., Zhou, B., Beirle, S., Chen, L. M., and Wagner, T.: Tropospheric NO2 column densities deduced from zenith-sky DOAS measurements in Shanghai, China, and their application to satellite validation, Atmos. Chem. Phys., 9, 3641–3662, https://doi.org/10.5194/acp-9-3641-2009, 2009. a
Clémer, K., Van Roozendael, M., Fayt, C., Hendrick, F., Hermans, C., Pinardi, G., Spurr, R., Wang, P., and De Mazière, M.: Multiple wavelength retrieval of tropospheric aerosol optical properties from MAXDOAS measurements in Beijing, Atmos. Meas. Tech., 3, 863–878, https://doi.org/10.5194/amt-3-863-2010, 2010. a, b, c
Cleveland, W. S., Graedel, T. E., Kleiner, B., and Warner, J. L.: Sunday and Workday Variations in Photochemical Air Pollutants in New Jersey and New York, Science, 186, 1037–1038, https://doi.org/10.1126/science.186.4168.1037, 1974. a
Crutzen, P. J.: The influence of nitrogen oxides on the atmospheric ozone content, Q. J. Roy. Meteorol. Soc., 96, 320–325, https://doi.org/10.1002/qj.49709640815, 1970. a
De Smedt, I., Theys, N., Yu, H., Danckaert, T., Lerot, C., Compernolle, S., Van Roozendael, M., Richter, A., Hilboll, A., Peters, E., Pedergnana, M., Loyola, D., Beirle, S., Wagner, T., Eskes, H., van Geffen, J., Boersma, K. F., and Veefkind, P.: Algorithm theoretical baseline for formaldehyde retrievals from S5P TROPOMI and from the QA4ECV project, Atmos. Meas. Tech., 11, 2395–2426, https://doi.org/10.5194/amt-11-2395-2018, 2018. a, b, c
Dirksen, R. J., Boersma, K. F., Eskes, H. J., Ionov, D. V., Bucsela, E. J., Levelt, P. F., and Kelder, H. M.: Evaluation of stratospheric NO2 retrieved from the Ozone Monitoring Instrument: Intercomparison, diurnal cycle, and trending, J. Geophys. Res.-Atmos., 116, https://doi.org/10.1029/2010JD014943, 2011. a
Dubovik, O. and King, M. D.: A flexible inversion algorithm for retrieval of aerosol optical properties from Sun and sky radiance measurements, J. Geophys. Res.-Atmos., 105, 20673–20696, https://doi.org/10.1029/2000JD900282, 2000. a
Dubovik, O., Sinyuk, A., Lapyonok, T., Holben, B. N., Mishchenko, M., Yang, P., Eck, T. F., Volten, H., Muñoz, O., Veihelmann, B., van der Zande, W. J., Leon, J.-F., Sorokin, M., and Slutsker, I.: Application of spheroid models to account for aerosol particle nonsphericity in remote sensing of desert dust, J. Geophys. Res.-Atmos., 111, d11208, https://doi.org/10.1029/2005JD006619, 2006. a
Emde, C., Buras-Schnell, R., Kylling, A., Mayer, B., Gasteiger, J., Hamann, U., Kylling, J., Richter, B., Pause, C., Dowling, T., and Bugliaro, L.: The libRadtran software package for radiative transfer calculations (version 2.0.1), Geosci. Model Dev., 9, 1647–1672, https://doi.org/10.5194/gmd-9-1647-2016, 2016. a, b
Emeis, S., Schäfer, K., and Münkel, C.: Surface-based remote sensing of the mixing-layer height a review, Meteorol. Z., 17, 621–630, https://doi.org/10.1127/0941-2948/2008/0312, 2008. a
Fleischmann, O. C., Burrows, J. P., and Orphal, J.: Time-windowing Fourier transform absorption spectroscopy for flash photolysis investigations, J. Photochem. Photobiol. A, 157, 127–136, https://doi.org/10.1016/S1010-6030(03)00069-8, 2003. a
Fried, A., Cantrell, C., Olson, J., Crawford, J. H., Weibring, P., Walega, J., Richter, D., Junkermann, W., Volkamer, R., Sinreich, R., Heikes, B. G., O'Sullivan, D., Blake, D. R., Blake, N., Meinardi, S., Apel, E., Weinheimer, A., Knapp, D., Perring, A., Cohen, R. C., Fuelberg, H., Shetter, R. E., Hall, S. R., Ullmann, K., Brune, W. H., Mao, J., Ren, X., Huey, L. G., Singh, H. B., Hair, J. W., Riemer, D., Diskin, G., and Sachse, G.: Detailed comparisons of airborne formaldehyde measurements with box models during the 2006 INTEX-B and MILAGRO campaigns: potential evidence for significant impacts of unmeasured and multi-generation volatile organic carbon compounds, Atmos. Chem. Phys., 11, 11867–11894, https://doi.org/10.5194/acp-11-11867-2011, 2011. a
Frieß, U., Monks, P. S., Remedios, J. J., Rozanov, A., Sinreich, R., Wagner, T., and Platt, U.: MAX-DOAS O4 measurements: A new technique to derive information on atmospheric aerosols: 2. Modeling studies, J. Geophys. Res.-Atmos., 111, D14203, https://doi.org/10.1029/2005JD006618, 2006. a, b, c
Geiß, A., Wiegner, M., Bonn, B., Schäfer, K., Forkel, R., von Schneidemesser, E., Münkel, C., Chan, K. L., and Nothard, R.: Mixing layer height as an indicator for urban air quality?, Atmos. Meas. Tech., 10, 2969–2988, https://doi.org/10.5194/amt-10-2969-2017, 2017. a, b
Griffin, D., Zhao, X., McLinden, C. A., Boersma, F., Bourassa, A., Dammers, E., Degenstein, D., Eskes, H., Fehr, L., Fioletov, V., Hayden, K., Kharol, S. K., Li, S.-M., Makar, P., Martin, R. V., Mihele, C., Mittermeier, R. L., Krotkov, N., Sneep, M., Lamsal, L. N., Linden, M. T., Geffen, J. V., Veefkind, P., and Wolde, M.: High-Resolution Mapping of Nitrogen Dioxide With TROPOMI: First Results and Validation Over the Canadian Oil Sands, Geophys. Res. Lett., 46, 1049–1060, https://doi.org/10.1029/2018GL081095, 2019. a
Halla, J. D., Wagner, T., Beirle, S., Brook, J. R., Hayden, K. L., O'Brien, J. M., Ng, A., Majonis, D., Wenig, M. O., and McLaren, R.: Determination of tropospheric vertical columns of NO2 and aerosol optical properties in a rural setting using MAX-DOAS, Atmos. Chem. Phys., 11, 12475–12498, https://doi.org/10.5194/acp-11-12475-2011, 2011. a
Hartl, A. and Wenig, M. O.: Regularisation model study for the least-squares retrieval of aerosol extinction time series from UV/VIS MAX-DOAS observations for a ground layer profile parameterisation, Atmos. Meas. Tech., 6, 1959–1980, https://doi.org/10.5194/amt-6-1959-2013, 2013. a
Holben, B., Eck, T., Slutsker, I., Tanre, D., Buis, J., Setzer, A., Vermote, E., Reagan, J., Kaufman, Y., Nakajima, T., Lavenu, F., Jankowiak, I., and Smirnov, A.: AERONET – A Federated Instrument Network and Data Archive for Aerosol Characterization, Remote Sens. Environ., 66, 1–16, https://doi.org/10.1016/S0034-4257(98)00031-5, 1998. a
Holben, B. N., Tanre, D., Smirnov, A., Eck, T. F., Slutsker, I., Abuhassan, N., Newcomb, W. W., Schafer, J. S., Chatenet, B., Lavenu, F., Kaufman, Y. J., Castle, J. V., Setzer, A., Markham, B., Clark, D., Frouin, R., Halthore, R., Karneli, A., O'Neill, N. T., Pietras, C., Pinker, R. T., Voss, K., and Zibordi, G.: An emerging ground-based aerosol climatology: Aerosol optical depth from AERONET, J. Geophys. Res.-Atmos., 106, 12067–12097, https://doi.org/10.1029/2001JD900014, 2001. a
Hönninger, G. and Platt, U.: Observations of BrO and its vertical distribution during surface ozone depletion at Alert, Atmos. Environ., 36, 2481–2489, https://doi.org/10.1016/S1352-2310(02)00104-8, 2002. a
Hönninger, G., von Friedeburg, C., and Platt, U.: Multi axis differential optical absorption spectroscopy (MAX-DOAS), Atmos. Chem. Phys., 4, 231–254, https://doi.org/10.5194/acp-4-231-2004, 2004. a, b
Irie, H., Kanaya, Y., Akimoto, H., Iwabuchi, H., Shimizu, A., and Aoki, K.: First retrieval of tropospheric aerosol profiles using MAX-DOAS and comparison with lidar and sky radiometer measurements, Atmos. Chem. Phys., 8, 341–350, https://doi.org/10.5194/acp-8-341-2008, 2008. a
Jang, M. and Kamens, R. M.: Characterization of Secondary Aerosol from the Photooxidation of Toluene in the Presence of NOx and 1-Propene, Environ. Sci. Technol., 35, 3626–3639, https://doi.org/10.1021/es010676+, 2001. a
Jin, J., Ma, J., Lin, W., Zhao, H., Shaiganfar, R., Beirle, S., and Wagner, T.: MAX-DOAS measurements and satellite validation of tropospheric NO2 and SO2 vertical column densities at a rural site of North China, Atmos. Environ., 133, 12–25, https://doi.org/10.1016/j.atmosenv.2016.03.031, 2016. a, b
Kleipool, Q. L., Dobber, M. R., de Haan, J. F., and Levelt, P. F.: Earth surface reflectance climatology from 3 years of OMI data, J. Geophys. Res.-Atmos., 113, https://doi.org/10.1029/2008JD010290, 2008. a
Kreher, K., Van Roozendael, M., Hendrick, F., Apituley, A., Dimitropoulou, E., Frieß, U., Richter, A., Wagner, T., Lampel, J., Abuhassan, N., Ang, L., Anguas, M., Bais, A., Benavent, N., Bösch, T., Bognar, K., Borovski, A., Bruchkouski, I., Cede, A., Chan, K. L., Donner, S., Drosoglou, T., Fayt, C., Finkenzeller, H., Garcia-Nieto, D., Gielen, C., Gómez-Martín, L., Hao, N., Henzing, B., Herman, J. R., Hermans, C., Hoque, S., Irie, H., Jin, J., Johnston, P., Khayyam Butt, J., Khokhar, F., Koenig, T. K., Kuhn, J., Kumar, V., Liu, C., Ma, J., Merlaud, A., Mishra, A. K., Müller, M., Navarro-Comas, M., Ostendorf, M., Pazmino, A., Peters, E., Pinardi, G., Pinharanda, M., Piters, A., Platt, U., Postylyakov, O., Prados-Roman, C., Puentedura, O., Querel, R., Saiz-Lopez, A., Schönhardt, A., Schreier, S. F., Seyler, A., Sinha, V., Spinei, E., Strong, K., Tack, F., Tian, X., Tiefengraber, M., Tirpitz, J.-L., van Gent, J., Volkamer, R., Vrekoussis, M., Wang, S., Wang, Z., Wenig, M., Wittrock, F., Xie, P. H., Xu, J., Yela, M., Zhang, C., and Zhao, X.: Intercomparison of NO2, O4, O3 and HCHO slant column measurements by MAX-DOAS and zenith-sky UV–visible spectrometers during CINDI-2, Atmos. Meas. Tech., 13, 2169–2208, https://doi.org/10.5194/amt-13-2169-2020, 2020. a
Levelt, P., Van den Oord, G. H. J., Dobber, M., Malkki, A., Visser, H., de Vries, J., Stammes, P., Lundell, J., and Saari, H.: The ozone monitoring instrument, IEEE T. Geosci. Remote, 44, 1093–1101, https://doi.org/10.1109/TGRS.2006.872333, 2006. a, b
Li, X., Brauers, T., Shao, M., Garland, R. M., Wagner, T., Deutschmann, T., and Wahner, A.: MAX-DOAS measurements in southern China: retrieval of aerosol extinctions and validation using ground-based in-situ data, Atmos. Chem. Phys., 10, 2079–2089, https://doi.org/10.5194/acp-10-2079-2010, 2010. a
Li, X., Brauers, T., Hofzumahaus, A., Lu, K., Li, Y. P., Shao, M., Wagner, T., and Wahner, A.: MAX-DOAS measurements of NO2, HCHO and CHOCHO at a rural site in Southern China, Atmos. Chem. Phys., 13, 2133–2151, https://doi.org/10.5194/acp-13-2133-2013, 2013. a
Lin, J.-T., Martin, R. V., Boersma, K. F., Sneep, M., Stammes, P., Spurr, R., Wang, P., Van Roozendael, M., Clémer, K., and Irie, H.: Retrieving tropospheric nitrogen dioxide from the Ozone Monitoring Instrument: effects of aerosols, surface reflectance anisotropy, and vertical profile of nitrogen dioxide, Atmos. Chem. Phys., 14, 1441–1461, https://doi.org/10.5194/acp-14-1441-2014, 2014. a
Loyola, D. G., Gimeno García, S., Lutz, R., Argyrouli, A., Romahn, F., Spurr, R. J. D., Pedergnana, M., Doicu, A., Molina García, V., and Schüssler, O.: The operational cloud retrieval algorithms from TROPOMI on board Sentinel-5 Precursor, Atmos. Meas. Tech., 11, 409–427, https://doi.org/10.5194/amt-11-409-2018, 2018. a
Loyola, D. G., Xu, J., Heue, K.-P., and Zimmer, W.: Applying FP_ILM to the retrieval of geometry-dependent effective Lambertian equivalent reflectivity (GE_LER) daily maps from UVN satellite measurements, Atmos. Meas. Tech., 13, 985–999, https://doi.org/10.5194/amt-13-985-2020, 2020. a
Ma, J. Z., Beirle, S., Jin, J. L., Shaiganfar, R., Yan, P., and Wagner, T.: Tropospheric NO2 vertical column densities over Beijing: results of the first three years of ground-based MAX-DOAS measurements (2008–2011) and satellite validation, Atmos. Chem. Phys., 13, 1547–1567, https://doi.org/10.5194/acp-13-1547-2013, 2013. a
Maronga, B., Gross, G., Raasch, S., Banzhaf, S., Forkel, R., Heldens, W., Kanani-Sühring, F., Matzarakis, A., Mauder, M., Pavlik, D., Pfafferott, J., Schubert, S., Seckmeyer, G., Sieker, H., and Winderlich, K.: Development of a new urban climate model based on the model PALM – Project overview, planned work, and first achievements, Meteorol. Z., 28, 105–119, https://doi.org/10.1127/metz/2019/0909, 2019. a
Maronga, B., Banzhaf, S., Burmeister, C., Esch, T., Forkel, R., Fröhlich, D., Fuka, V., Gehrke, K. F., Geletič, J., Giersch, S., Gronemeier, T., Groß, G., Heldens, W., Hellsten, A., Hoffmann, F., Inagaki, A., Kadasch, E., Kanani-Sühring, F., Ketelsen, K., Khan, B. A., Knigge, C., Knoop, H., Krč, P., Kurppa, M., Maamari, H., Matzarakis, A., Mauder, M., Pallasch, M., Pavlik, D., Pfafferott, J., Resler, J., Rissmann, S., Russo, E., Salim, M., Schrempf, M., Schwenkel, J., Seckmeyer, G., Schubert, S., Sühring, M., von Tils, R., Vollmer, L., Ward, S., Witha, B., Wurps, H., Zeidler, J., and Raasch, S.: Overview of the PALM model system 6.0, Geosci. Model Dev., 13, 1335–1372, https://doi.org/10.5194/gmd-13-1335-2020, 2020. a
Mayer, B. and Kylling, A.: Technical note: The libRadtran software package for radiative transfer calculations – description and examples of use, Atmos. Chem. Phys., 5, 1855–1877, https://doi.org/10.5194/acp-5-1855-2005, 2005. a
Meller, R. and Moortgat, G. K.: Temperature dependence of the absorption cross sections of formaldehyde between 223 and 323 K in the wavelength range 225–375 nm, J. Geophys. Res.-Atmos., 105, 7089–7101, https://doi.org/10.1029/1999JD901074, 2000. a
Ortega, I., Berg, L. K., Ferrare, R. A., Hair, J. W., Hostetler, C. A., and Volkamer, R.: Elevated aerosol layers modify the O2-O2 absorption measured by ground-based MAX-DOAS, J. Quant. Spectrosc. Ra., 176, 34–49, https://doi.org/10.1016/j.jqsrt.2016.02.021, 2016. a, b
Peters, E., Pinardi, G., Seyler, A., Richter, A., Wittrock, F., Bösch, T., Van Roozendael, M., Hendrick, F., Drosoglou, T., Bais, A. F., Kanaya, Y., Zhao, X., Strong, K., Lampel, J., Volkamer, R., Koenig, T., Ortega, I., Puentedura, O., Navarro-Comas, M., Gómez, L., Yela González, M., Piters, A., Remmers, J., Wang, Y., Wagner, T., Wang, S., Saiz-Lopez, A., García-Nieto, D., Cuevas, C. A., Benavent, N., Querel, R., Johnston, P., Postylyakov, O., Borovski, A., Elokhov, A., Bruchkouski, I., Liu, H., Liu, C., Hong, Q., Rivera, C., Grutter, M., Stremme, W., Khokhar, M. F., Khayyam, J., and Burrows, J. P.: Investigating differences in DOAS retrieval codes using MAD-CAT campaign data, Atmos. Meas. Tech., 10, 955–978, https://doi.org/10.5194/amt-10-955-2017, 2017. a
Pinardi, G., Van Roozendael, M., Abuhassan, N., Adams, C., Cede, A., Clémer, K., Fayt, C., Frieß, U., Gil, M., Herman, J., Hermans, C., Hendrick, F., Irie, H., Merlaud, A., Navarro Comas, M., Peters, E., Piters, A. J. M., Puentedura, O., Richter, A., Schönhardt, A., Shaiganfar, R., Spinei, E., Strong, K., Takashima, H., Vrekoussis, M., Wagner, T., Wittrock, F., and Yilmaz, S.: MAX-DOAS formaldehyde slant column measurements during CINDI: intercomparison and analysis improvement, Atmos. Meas. Tech., 6, 167–185, https://doi.org/10.5194/amt-6-167-2013, 2013. a
Platt, U. and Stutz, J.: Differential optical absorption spectroscopy – principles and applications, Springer Nature, Switzerland, ISBN 978-3-642-05946-9, 568 pp., 2008. a, b
Richter, A., Burrows, J. P., Nüß, H., Granier, C., and Niemeier, U.: Increase in tropospheric nitrogen dioxide over China observed from space, Nature, 437, 129–132, 2005. a
Rodgers, C. D.: Inverse methods for atmospheric sounding: Theory and practice, vol. 2, World Scientific, Singapore, ISBN 978-981-02-2740-1, 256 pp., 2000. a
Schäfer, K., Harbusch, A., Emeis, S., Köpke, P., and Wiegner, M.: Correlation of aerosol mass near the ground with aerosol optical depth during two seasons in Munich, Atmos. Environ. 42, 4036–4046, https://doi.org/10.1016/j.atmosenv.2008.01.060, 2008. a
Serdyuchenko, A., Gorshelev, V., Weber, M., Chehade, W., and Burrows, J. P.: High spectral resolution ozone absorption cross-sections – Part 2: Temperature dependence, Atmos. Meas. Tech., 7, 625–636, https://doi.org/10.5194/amt-7-625-2014, 2014. a, b, c
Sinreich, R., Frieß, U., Wagner, T., and Platt, U.: Multi axis differential optical absorption spectroscopy (MAX-DOAS) of gas and aerosol distributions, Faraday Discuss., 130, 153–164, https://doi.org/10.1039/B419274P, 2005. a
Solomon, S., Schmeltekopf, A. L., and Sanders, R. W.: On the interpretation of zenith sky absorption measurements, J. Geophys. Res.-Atmos., 92, 8311–8319, https://doi.org/10.1029/JD092iD07p08311, 1987. a
Spinei, E., Cede, A., Herman, J., Mount, G. H., Eloranta, E., Morley, B., Baidar, S., Dix, B., Ortega, I., Koenig, T., and Volkamer, R.: Ground-based direct-sun DOAS and airborne MAX-DOAS measurements of the collision-induced oxygen complex, O2O2, absorption with significant pressure and temperature differences, Atmos. Meas. Tech., 8, 793–809, https://doi.org/10.5194/amt-8-793-2015, 2015. a
Thalman, R. and Volkamer, R.: Temperature dependent absorption cross-sections of O2-O2 collision pairs between 340 and 630 nm and at atmospherically relevant pressure, Phys. Chem. Chem. Phys., 15, 15371–15381, https://doi.org/10.1039/C3CP50968K, 2013. a
UBA: Nitrogen dioxide loads in Germany down slightly in 2018, available at: https://www.umweltbundesamt.de/en/press/pressinformation/nitrogen-dioxide-loads-in-germany-down-slightly-in (last access: 1 August 2020), 2019. a, b
van der A, R. J., Eskes, H. J., Boersma, K. F., van Noije, T. P. C., Van Roozendael, M., De Smedt, I., Peters, D. H. M. U., and Meijer, E. W.: Trends, seasonal variability and dominant NOx source derived from a ten year record of NO2 measured from space, J. Geophys. Res.-Atmos., 113, D04302, https://doi.org/10.1029/2007JD009021, 2008. a
van Geffen, J., Eskes, H., Boersma, K., Maasakkers, J., and Veefkind, J.: TROPOMI ATBD of the total and tropospheric NO2 data products, available at: http://www.tropomi.eu/sites/default/files/files/publicS5P-KNMI-L2-0005-RP-ATBD_NO2_data_products-20190206_v140.pdf (last access: 1 August 2020), 2019. a
van Geffen, J., Boersma, K. F., Eskes, H., Sneep, M., ter Linden, M., Zara, M., and Veefkind, J. P.: S5P TROPOMI NO2 slant column retrieval: method, stability, uncertainties and comparisons with OMI, Atmos. Meas. Tech., 13, 1315–1335, https://doi.org/10.5194/amt-13-1315-2020, 2020. a
Vandaele, A., Hermans, C., Simon, P., Carleer, M., Colin, R., Fally, S., Merienne, M., Jenouvrier, A., and Coquart, B.: Measurements of the NO2 absorption cross-section from 42000 cm−1 to 10000 cm−1 (238–1000 nm) at 220 K and 294 K, J. Quant. Spectrosc. Ra., 59, 171–184, https://doi.org/10.1016/S0022-4073(97)00168-4, 1998. a, b, c
Veefkind, J., Aben, I., McMullan, K., Förster, H., de Vries, J., Otter, G., Claas, J., Eskes, H., de Haan, J., Kleipool, Q., van Weele, M., Hasekamp, O., Hoogeveen, R., Landgraf, J., Snel, R., Tol, P., Ingmann, P., Voors, R., Kruizinga, B., Vink, R., Visser, H., and Levelt, P.: TROPOMI on the ESA Sentinel-5 Precursor: A GMES mission for global observations of the atmospheric composition for climate, air quality and ozone layer applications, Remote Sens. Environ., 120, 70–83, https://doi.org/10.1016/j.rse.2011.09.027, 2012. a, b
Veefkind, J. P., Boersma, K. F., Wang, J., Kurosu, T. P., Krotkov, N., Chance, K., and Levelt, P. F.: Global satellite analysis of the relation between aerosols and short-lived trace gases, Atmos. Chem. Phys., 11, 1255–1267, https://doi.org/10.5194/acp-11-1255-2011, 2011. a
Vlemmix, T., Eskes, H. J., Piters, A. J. M., Schaap, M., Sauter, F. J., Kelder, H., and Levelt, P. F.: MAX-DOAS tropospheric nitrogen dioxide column measurements compared with the Lotos-Euros air quality model, Atmos. Chem. Phys., 15, 1313–1330, https://doi.org/10.5194/acp-15-1313-2015, 2015. a
von Schneidemesser, E., Bonn, B., Butler, T. M., Ehlers, C., Gerwig, H., Hakola, H., Hellén, H., Kerschbaumer, A., Klemp, D., Kofahl, C., Kura, J., Lüdecke, A., Nothard, R., Pietsch, A., Quedenau, J., Schäfer, K., Schauer, J. J., Singh, A., Villalobos, A.-M., Wiegner, M., and Lawrence, M. G.: BAERLIN2014 – stationary measurements and source apportionment at an urban background station in Berlin, Germany, Atmos. Chem. Phys., 18, 8621–8645, https://doi.org/10.5194/acp-18-8621-2018, 2018. a
Wagner, T., Dix, B., Friedeburg, C. v., Fries, U., Sanghavi, S., Sinreich, R., and Platt, U.: MAX-DOAS O4 measurements: A new technique to derive information on atmospheric aerosols – Principles and information content, J. Geophys. Res.-Atmos., 109, D22205, https://doi.org/10.1029/2004JD004904, 2004. a
Wagner, T., Deutschmann, T., and Platt, U.: Determination of aerosol properties from MAX-DOAS observations of the Ring effect, Atmos. Meas. Tech., 2, 495–512, https://doi.org/10.5194/amt-2-495-2009, 2009. a, b
Wagner, T., Beirle, S., Brauers, T., Deutschmann, T., Frieß, U., Hak, C., Halla, J. D., Heue, K. P., Junkermann, W., Li, X., Platt, U., and Pundt-Gruber, I.: Inversion of tropospheric profiles of aerosol extinction and HCHO and NO2 mixing ratios from MAX-DOAS observations in Milano during the summer of 2003 and comparison with independent data sets, Atmos. Meas. Tech., 4, 2685–2715, https://doi.org/10.5194/amt-4-2685-2011, 2011. a
Wagner, T., Beirle, S., Benavent, N., Bösch, T., Chan, K. L., Donner, S., Dörner, S., Fayt, C., Frieß, U., García-Nieto, D., Gielen, C., González-Bartolome, D., Gomez, L., Hendrick, F., Henzing, B., Jin, J. L., Lampel, J., Ma, J., Mies, K., Navarro, M., Peters, E., Pinardi, G., Puentedura, O., Puķīte, J., Remmers, J., Richter, A., Saiz-Lopez, A., Shaiganfar, R., Sihler, H., Van Roozendael, M., Wang, Y., and Yela, M.: Is a scaling factor required to obtain closure between measured and modelled atmospheric O4 absorptions? An assessment of uncertainties of measurements and radiative transfer simulations for 2 selected days during the MAD-CAT campaign, Atmos. Meas. Tech., 12, 2745–2817, https://doi.org/10.5194/amt-12-2745-2019, 2019. a, b, c, d, e
Wang, S., Cuevas, C. A., Frieß, U., and Saiz-Lopez, A.: MAX-DOAS retrieval of aerosol extinction properties in Madrid, Spain, Atmos. Meas. Tech., 9, 5089–5101, https://doi.org/10.5194/amt-9-5089-2016, 2016. a, b
Wang, Y., Dörner, S., Donner, S., Böhnke, S., De Smedt, I., Dickerson, R. R., Dong, Z., He, H., Li, Z., Li, Z., Li, D., Liu, D., Ren, X., Theys, N., Wang, Y., Wang, Y., Wang, Z., Xu, H., Xu, J., and Wagner, T.: Vertical profiles of NO2, SO2, HONO, HCHO, CHOCHO and aerosols derived from MAX-DOAS measurements at a rural site in the central western North China Plain and their relation to emission sources and effects of regional transport, Atmos. Chem. Phys., 19, 5417–5449, https://doi.org/10.5194/acp-19-5417-2019, 2019. a
Wang, Z., Chan, K. L., Heue, K.-P., Doicu, A., Wagner, T., Holla, R., and Wiegner, M.: A multi-axis differential optical absorption spectroscopy aerosol profile retrieval algorithm for high-altitude measurements: application to measurements at Schneefernerhaus (UFS), Germany, Atmos. Meas. Tech., 13, 1835–1866, https://doi.org/10.5194/amt-13-1835-2020, 2020. a
Wenig, M., Spichtinger, N., Stohl, A., Held, G., Beirle, S., Wagner, T., Jähne, B., and Platt, U.: Intercontinental transport of nitrogen oxide pollution plumes, Atmos. Chem. Phys., 3, 387–393, https://doi.org/10.5194/acp-3-387-2003, 2003. a
Wenig, M. O., Cede, A. M., Bucsela, E. J., Celarier, E. A., Boersma, K. F., Veefkind, J. P., Brinksma, E. J., Gleason, J. F., and Herman, J. R.: Validation of OMI tropospheric NO2 column densities using direct-Sun mode Brewer measurements at NASA Goddard Space Flight Center, J. Geophys. Res.-Atmos., 113, D16S45, https://doi.org/10.1029/2007JD008988, 2008. a, b
Wiegner, M., Emeis, S., Freudenthaler, V., Heese, B., Junkermann, W., Münkel, C., Schäfer, K., Seefeldner, M., and Vogt, S.: Mixing layer height over Munich, Germany: Variability and comparisons of different methodologies, J. Geophys. Res.-Atmos., 111, https://doi.org/10.1029/2005JD006593, 2006. a
Wiegner, M., Groß, S., Freudenthaler, V., Schnell, F., and Gasteiger, J.: The May/June 2008 Saharan dust event over Munich: Intensive aerosol parameters from lidar measurements, J. Geophys. Res.-Atmos., 116, d23213, https://doi.org/10.1029/2011JD016619, 2011. a
Williams, J. E., Boersma, K. F., Le Sager, P., and Verstraeten, W. W.: The high-resolution version of TM5-MP for optimized satellite retrievals: description and validation, Geosci. Model Dev., 10, 721–750, https://doi.org/10.5194/gmd-10-721-2017, 2017. a
Wittrock, F., Oetjen, H., Richter, A., Fietkau, S., Medeke, T., Rozanov, A., and Burrows, J. P.: MAX-DOAS measurements of atmospheric trace gases in Ny-Ålesund – Radiative transfer studies and their application, Atmos. Chem. Phys., 4, 955–966, https://doi.org/10.5194/acp-4-955-2004, 2004. a
Zhang, J., Wang, S., Guo, Y., Zhang, R., Qin, X., Huang, K., Wang, D., Fu, Q., Wang, J., and Zhou, B.: Aerosol vertical profile retrieved from ground-based MAX-DOAS observation and characteristic distribution during wintertime in Shanghai, China, Atmos. Environ., 192, 193–205, https://doi.org/10.1016/j.atmosenv.2018.08.051, 2018. a
Zhang, Q., Streets, D. G., He, K., Wang, Y., Richter, A., Burrows, J. P., Uno, I., Jang, C. J., Chen, D., Yao, Z., and Lei, Y.: NOx emission trends for China, 1995–2004: The view from the ground and the view from space, J. Geophys. Res.-Atmos., 112, D22306, https://doi.org/10.1029/2007JD008684, 2007. a
Zhang, R., Tie, X., and Bond, D. W.: Impacts of anthropogenic and natural NOx sources over the U.S. on tropospheric chemistry, P. Natl. Acad. Sci., 100, 1505–1509, https://doi.org/10.1073/pnas.252763799, 2003. a
Zhao, X., Griffin, D., Fioletov, V., McLinden, C., Cede, A., Tiefengraber, M., Müller, M., Bognar, K., Strong, K., Boersma, F., Eskes, H., Davies, J., Ogyu, A., and Lee, S. C.: Assessment of the quality of TROPOMI high-spatial-resolution NO2 data products in the Greater Toronto Area, Atmos. Meas. Tech., 13, 2131–2159, https://doi.org/10.5194/amt-13-2131-2020, 2020. a
- Abstract
- Introduction
- Data and methods
- NO2 and HCHO retrievals for Munich
- Intercomparison of MAX-DOAS retrievals with other datasets
- MAX-DOAS retrievals for satellite validation
- Summary and conclusion
- Appendix A
- Code and data availability
- Author contributions
- Competing interests
- Acknowledgements
- Financial support
- Review statement
- References