the Creative Commons Attribution 4.0 License.
the Creative Commons Attribution 4.0 License.
 | 09 Sep 2020
Intercomparison of atmospheric CO2 and CH4 abundances on regional scales in boreal areas using Copernicus Atmosphere Monitoring Service (CAMS) analysis, COllaborative Carbon Column Observing Network (COCCON) spectrometers, and Sentinel-5 Precursor satellite observations
Frank Hase
Thomas Blumenstock
Rigel Kivi
Pauli Heikkinen
Mahesh Kumar Sha
Uwe Raffalski
Jochen Landgraf
Alba Lorente
Tobias Borsdorff
Huilin Chen
Florian Dietrich
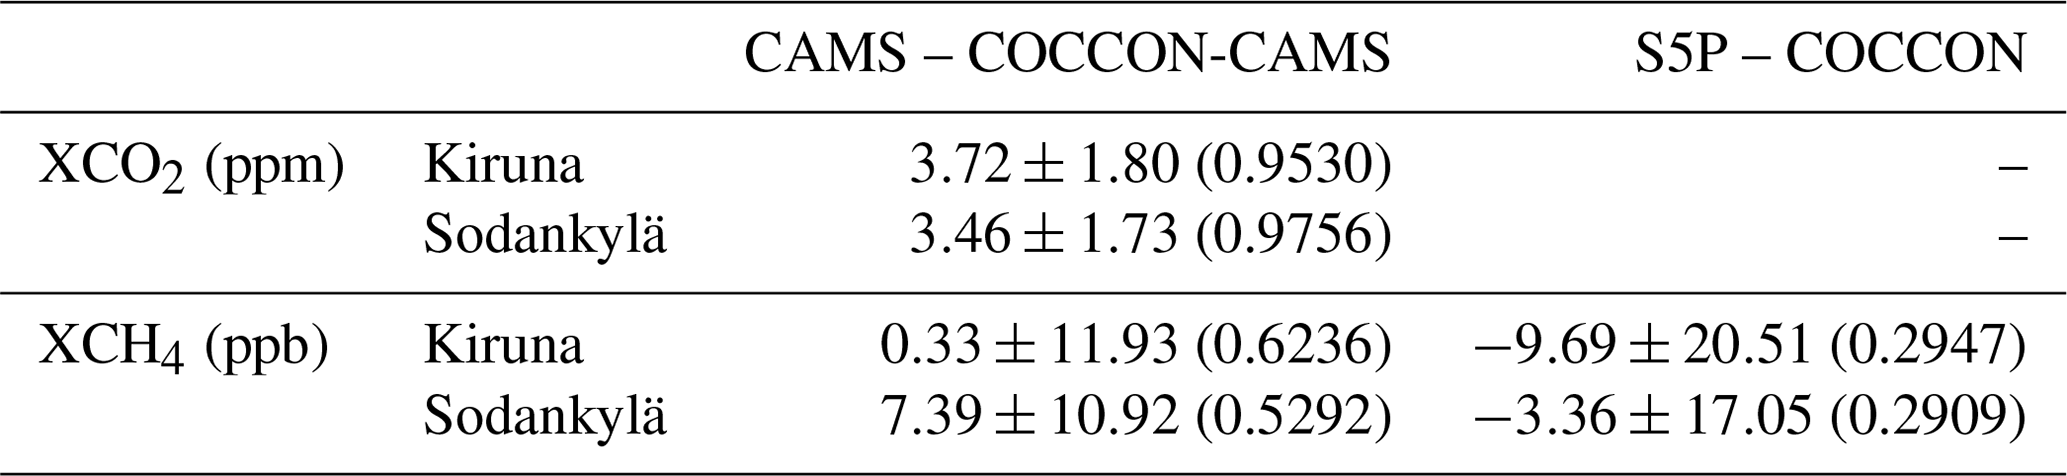
We compare the atmospheric column-averaged dry-air mole fractions of carbon dioxide (XCO2) and methane (XCH4) measured with a pair of COllaborative Carbon Column Observing Network (COCCON) spectrometers at Kiruna and Sodankylä (boreal areas). We compare model data provided by the Copernicus Atmosphere Monitoring Service (CAMS) between 2017 and 2019 with XCH4 data from the recently launched Sentinel-5 Precursor (S5P) satellite between 2018 and 2019. In addition, measured and modeled gradients of XCO2 and XCH4 (ΔXCO2 and ΔXCH4) on regional scales are investigated. Both sites show a similar and very good correlation between COCCON retrievals and the modeled CAMS XCO2 data, while CAMS data are biased high with respect to COCCON by 3.72 ppm (±1.80 ppm) in Kiruna and 3.46 ppm (±1.73 ppm) in Sodankylä on average. For XCH4, CAMS values are higher than the COCCON observations by 0.33 ppb (±11.93 ppb) in Kiruna and 7.39 ppb (±10.92 ppb) in Sodankylä. In contrast, the S5P satellite generally measures lower atmospheric XCH4 than the COCCON spectrometers, with a mean difference of 9.69 ppb (±20.51 ppb) in Kiruna and 3.36 ppb (±17.05 ppb) in Sodankylä. We compare the gradients of XCO2 and XCH4 (ΔXCO2 and ΔXCH4) between Kiruna and Sodankylä derived from CAMS analysis and COCCON and S5P measurements to study the capability of detecting sources and sinks on regional scales. The correlations in ΔXCO2 and ΔXCH4 between the different datasets are generally smaller than the correlations in XCO2 and XCH4 between the datasets at either site. The ΔXCO2 values predicted by CAMS are generally higher than those observed with COCCON with a slope of 0.51. The ΔXCH4 values predicted by CAMS are mostly higher than those observed with COCCON with a slope of 0.65, covering a larger dataset than the comparison between S5P and COCCON. When comparing CAMS ΔXCH4 with COCCON ΔXCH4 only in S5P overpass days (slope = 0.53), the correlation is close to that between S5P and COCCON (slope = 0.51). CAMS, COCCON, and S5P predict gradients in reasonable agreement. However, the small number of observations coinciding with S5P limits our ability to verify the performance of this spaceborne sensor. We detect no significant impact of ground albedo and viewing zenith angle on the S5P results. Both sites show similar situations with the average ratios of XCH4 (S5P/COCCON) of 0.9949±0.0118 in Kiruna and 0.9953±0.0089 in Sodankylä. Overall, the results indicate that the COCCON instruments have the capability of measuring greenhouse gas (GHG) gradients on regional scales, and observations performed with the portable spectrometers can contribute to inferring sources and sinks and to validating spaceborne greenhouse gas sensors. To our knowledge, this is the first published study using COCCON spectrometers for the validation of XCH4 measurements collected by S5P.
- Article
(15623 KB) - Full-text XML
- BibTeX
- EndNote


Carbon dioxide (CO2) concentrations in the atmosphere are steadily increasing since industrialization. This rise is mainly attributed to anthropogenic emissions as a consequence of the use of fossil fuels. The global mean concentration of CO2 in 2018 reached 147 % of the abundance in 1750 (World Meteorological Organization, 2019). Methane (CH4), the second most important anthropogenic greenhouse gas (GHG) after CO2, has increased by about 259 % since preindustrial times (World Meteorological Organization, 2019). Since GHGs have a major impact on global climate, scientific research aims at accurate accounting of GHG exchanges for a better understanding of the global carbon budget. Satellite measurements of column-averaged greenhouse gas abundances are an important source of information for this research. The satellite validation at high latitudes is limited by the relatively small number of ground-based stations (Wunch et al., 2017), and the high air mass may introduce a higher level of spectroscopic uncertainties (Jacobs et al., 2020). Because strong responses to climate change are expected at high latitudes, it is important to obtain accurate observations of GHGs also at high latitudes with high spatial and temporal coverage. Currently, both satellite and ground-based observations are used to monitor GHG column-averaged abundances.
Sentinel-5 Precursor (S5P) is the first mission of the Copernicus program, aiming to monitor air quality, climate, and ozone abundances with high spatiotemporal resolution and daily global coverage (Veefkind et al., 2012). The mission fills in the gap in the continuity between SCIAMACHY (SCanning Imaging Absorption spectroMeter for Atmospheric CHartographY) on board Envisat (Bovensmann et al., 1999) and Sentinel-5 (https://earth.esa.int/web/guest/missions/esa-future-missions/sentinel-5, last access: 1 September 2020). The S5P satellite was launched on 13 October 2017 and operates in a low Earth polar orbit, with an operational lifespan of 7 years. Its single payload, the TROPOspheric Monitoring Instrument (TROPOMI) is a nadir-viewing grating spectrometer that covers wavelength bands from the ultraviolet to shortwave infrared (SWIR). TROPOMI measures back-scattered solar radiation spectra using a push-broom configuration, combining a swath width of 2600 km. The instrument features a very high spatial resolution of approximately 7 km×7 km (5.5 km×7 km since August 2019) in the SWIR spectral band at nadir, providing global daily coverage. The SWIR module on TROPOMI covers the spectral range of 4190 to 4340 cm−1 (spectral resolution: 0.45 cm−1), and it is used to measure the concentration of methane and carbon monoxide in the Earth's atmosphere (Butz et al., 2012; Hu et al., 2018).
To validate the S5P column-averaged CH4 observations, the ground-based column-averaged CH4 measurements from solar-viewing near-infrared spectrometers are comprehensively used (Lambert et al., 2019). The Total Carbon Column Observing Network (TCCON) is a global network of ground-based Fourier transform infrared (FTIR) spectrometers, measuring solar absorption spectra in the near-infrared region to retrieve column-averaged dry-air mole fractions of CO2 (XCO2) and CH4 (XCH4) amongst other gases (Wunch et al., 2011). The TCCON measurements have high precision, because the effect of surface properties and aerosols on the measurements are minimal (Wunch et al., 2017). The measurements are scaled to the World Meteorological Organization (WMO) reference scale applying a post correction and thereby guaranteeing high accuracy (Wunch et al., 2015). The high-resolution TCCON sites are distributed globally; however, many of these are concentrated in Europe, North America, and eastern Asia. The costs, logistic requirements, and the need for qualified personnel on site have hindered the expansion of the network to, for example, the African continent, South America, or central Asia (Wunch et al., 2011). Remote sites and regions with high or low surface albedo are generally poorly covered by TCCON. Ground-based measurement stations in the abovementioned regions are needed for satellite and model validation and carbon cycle science.
Recently, cheaper and portable spectrometers have been developed and are now available for GHG measurements, with the potential to complement TCCON (Frey et al., 2019; Sha et al., 2019b). The EM27/SUN FTIR spectrometer was developed by Karlsruhe Institute of Technology (KIT) (Gisi et al., 2012) in cooperation with Bruker Optics GmbH, Ettlingen, Germany. It is available from Bruker as a commercial device since spring 2014. The EM27/SUN instrument is a portable ground-based FTIR spectrometer, consisting of a spectrometer body with dimensions of cm and a solar tracker which is directly mounted on the spectrometer. The total weight is approximately 25 kg, and the instrument can be carried by one person. This solar-viewing FTIR instrument has a resolution of 0.5 cm−1, similar to that of TROPOMI. This compact and mobile instrument is appropriate for field campaigns as well as for long-term deployment at a site with the potential to complement TCCON. In addition, its excellent robust and reliable characteristics have been demonstrated in several successful field campaigns (Frey et al., 2015; Klappenbach et al., 2015; Chen et al., 2016; Hedelius et al., 2016; Butz et al., 2017; Toja-Silva et al., 2017; Vogel et al., 2019; Kille et al., 2019; Sha et al., 2019b; Luther et al., 2019). KIT performs final optimizations, an expert review of instrument performance, and a final calibration of each unit with respect to the reference EM27/SUN spectrometer operated at KIT and the TCCON site in Karlsruhe. In the framework of recent European Space Agency (ESA) projects, codes required for the data processing and analysis of EM27/SUN measurement spectra have been developed by KIT, which are open source and freely available (https://www.imk-asf.kit.edu/english/3225.php, last access: 1 September 2020). If the operation of the EM27/SUN spectrometers adheres to the described standards (use of calibrated units, processing using the provided codes), then this practice is compatible with the requirements of the COllaborative Carbon Column Observing Network (COCCON; see Frey et al., 2019). The data presented in this paper have been generated using a pair of EM27/SUN spectrometers following these requirements. For this reason, we refer to these as COCCON spectrometers in the following.
This paper compares S5P observations to the ground-based observations performed with two COCCON spectrometers at boreal sites in Sodankylä, Finland, and Kiruna, Sweden. The measurements from these two sites are highly valuable for investigating the gradients of the greenhouse gas distribution on regional scales near the Arctic Circle. In addition to the COCCON and the S5P datasets, we investigate the CO2 and CH4 products from the Copernicus Atmosphere Monitoring Service (CAMS). CAMS is operated by the European Centre for Medium-Range Weather Forecasts (ECMWF), providing near-real-time analysis and forecast data with a spatial resolution of approximately 25 km (Agustí-Panareda et al., 2014; Massart et al., 2014, 2016). The CAMS analysis dataset is the latest global analysis dataset of atmospheric composition; though, a reanalysis for greenhouse gases (CO2, CH4) is being produced separately (Inness et al., 2019). This work uses CAMS 6-hourly analysis data of XCO2 and XCH4, integrated from CAMS volume mixing ratio (VMR) profiles of CO2 and CH4, respectively. CAMS profiles of CO2 and CH4 are also used to study the quality of a priori profiles used for the trace gas retrievals and compared with the TCCON official a priori profiles. We refer to the TCCON a priori profiles as “MAP” files, following the naming convention used for the TCCON processing. The profiles are derived from a stand-alone program to generate profiles as described in Toon and Wunch, 2017. These profiles are based on temperature, pressure, and humidity generated by the National Centers for Environmental Prediction/National Center for Atmospheric Research (NCEP/NCAR) and empirically derived from MkIV FTIR balloon flights (Toon, 1991) and in situ GLOBALVIEW data (GLOBALVIEW-CO2, 2006). The MAP profiles are up to 70 km and are sampled on an equidistant 1 km grid.
The following section gives a description of the sites and data sources. The results and discussions are given in Sect. 3, and the final conclusions are discussed in Sect. 4.
Multiyear measurements using two COCCON spectrometers were performed from March 2017 until the end of 2019 at the Finnish Meteorological Institute (FMI), Sodankylä, Finland (67.37∘ N, 26.63∘ E; 181 m a.s.l.) and at the Swedish Institute of Space Physics (IRF), Kiruna, Sweden (67.84∘ N, 20.41∘ E; 419 m a.s.l.) (Fig. 1). The area around these two sites represents a typical northern boreal forest or taiga environment, surrounded predominantly by coniferous forest with some mixed or deciduous forest. Regular TCCON measurements are performed at the Sodankylä site since 2009, providing XCO2 and XCH4 measurements (Kivi et al., 2016). The COCCON operation at the FMI observational station is performed in the framework of the Fiducial Reference Measurements for Ground-Based Infrared Greenhouse Gas Observations campaign (FRM4GHG; http://frm4ghg.aeronomie.be/, last access: 1 September 2020) funded by the ESA. The COCCON instrument in Sodankylä was at the beginning operated next to the campaign container by personnel on site; it was then moved to the roof of the campaign container (184 m a.s.l.) on 25 September 2018. Since then the measurements were performed remotely using an automated enclosure system, which was developed for the automatic remote control and protection of the COCCON instrument (Heinle and Chen, 2018; Dietrich and Chen, 2018). The cover of the enclosure rotates during the course of the day following the trajectory of the sun. In the case of bad weather, the cover closes automatically to protect the instrument inside.

Figure 1Map showing locations of the Kiruna and Sodankylä sites in this study.
The public S5P CH4 data are only available since May 2018 (https://s5phub.copernicus.eu/dhus/#/home, last access: 1 September 2020). The comparison between S5P and the COCCON measurements started since May 2018. Currently, the level-2 (L2) products of S5P are released, including the column-average dry-air mole fraction of methane, XCH4. This value presents the total column of methane in the atmosphere from the surface up to the top of the atmosphere divided by the corresponding dry-air column (Apituley et al., 2017). S5P L2 products provide bias-corrected XCH4 retrievals, which are used in this work. The quality control value (qa value) is given as part of the CH4 data product, and it is recommended to only use data with a qa value of above 0.5 to exclude data of questionable quality. To compare with the COCCON data, S5P data are collected from the average value within a radius of 100 km around each station. The radius criterion of 100 km was the best tested case as discussed in Sha et al. (2019a). When comparing the bias-corrected S5P XCH4 product with the NDACC (Network for the Detection of Atmospheric Composition Change) and TCCON FTIR products, results show slightly higher correlation when using the radius criterion of 100 km than those of using 50 km. A 10 min average value of COCCON data (retrieved from approximately 10 spectra) is obtained at the coincident S5P overpass time. The overpass time for Kiruna and Sodankylä stations is between 09:00 and 12:00 UTC. The standard error of mean is used as error bar, as it presents the estimation of the standard deviation of its sampling distribution and is calculated by using
Here, xi is a single measurement in the defined area or time range, is mean value of data sample, and n is the number of data points. This method is useful to distinguish the highly scattered dataset, especially for S5P and CAMS data which come from large areas.
The comparison between the CAMS analysis and the COCCON observations starts from the beginning of the field campaign (March 2017). The CAMS 6-hourly analysis data of XCO2 and XCH4 are derived from CAMS VMR profiles in defined areas around Kiruna and Sodankylä. These defined areas resemble rectangles of 100 km×100 km, covering 67–69∘ N and 18–23∘ E around Kiruna and 66.5–68.3∘ N and 24–29∘ E around Sodankylä. In these defined areas there are 476 data points in total in the area of Kiruna and 442 data points in the area of Sodankylä within their respective measuring periods. We use the average value from these points as 6-hourly CAMS analysis data. The coincident COCCON data are collected from 1 h average at 06:00 or 12:00 UTC, because the spectrometer measures only during daytime. Additionally, selection criteria are applied to the COCCON data as described in the work by Frey et al. (2015). Measurements at solar zenith angles (SZAs) >80∘ are filtered out to reduce uncertainties associated with spectra recorded at very high air masses. The data are also filtered based on Xair (column-averaged amount of dry air), and the Xair range between 0.995 and 1.005 is required.
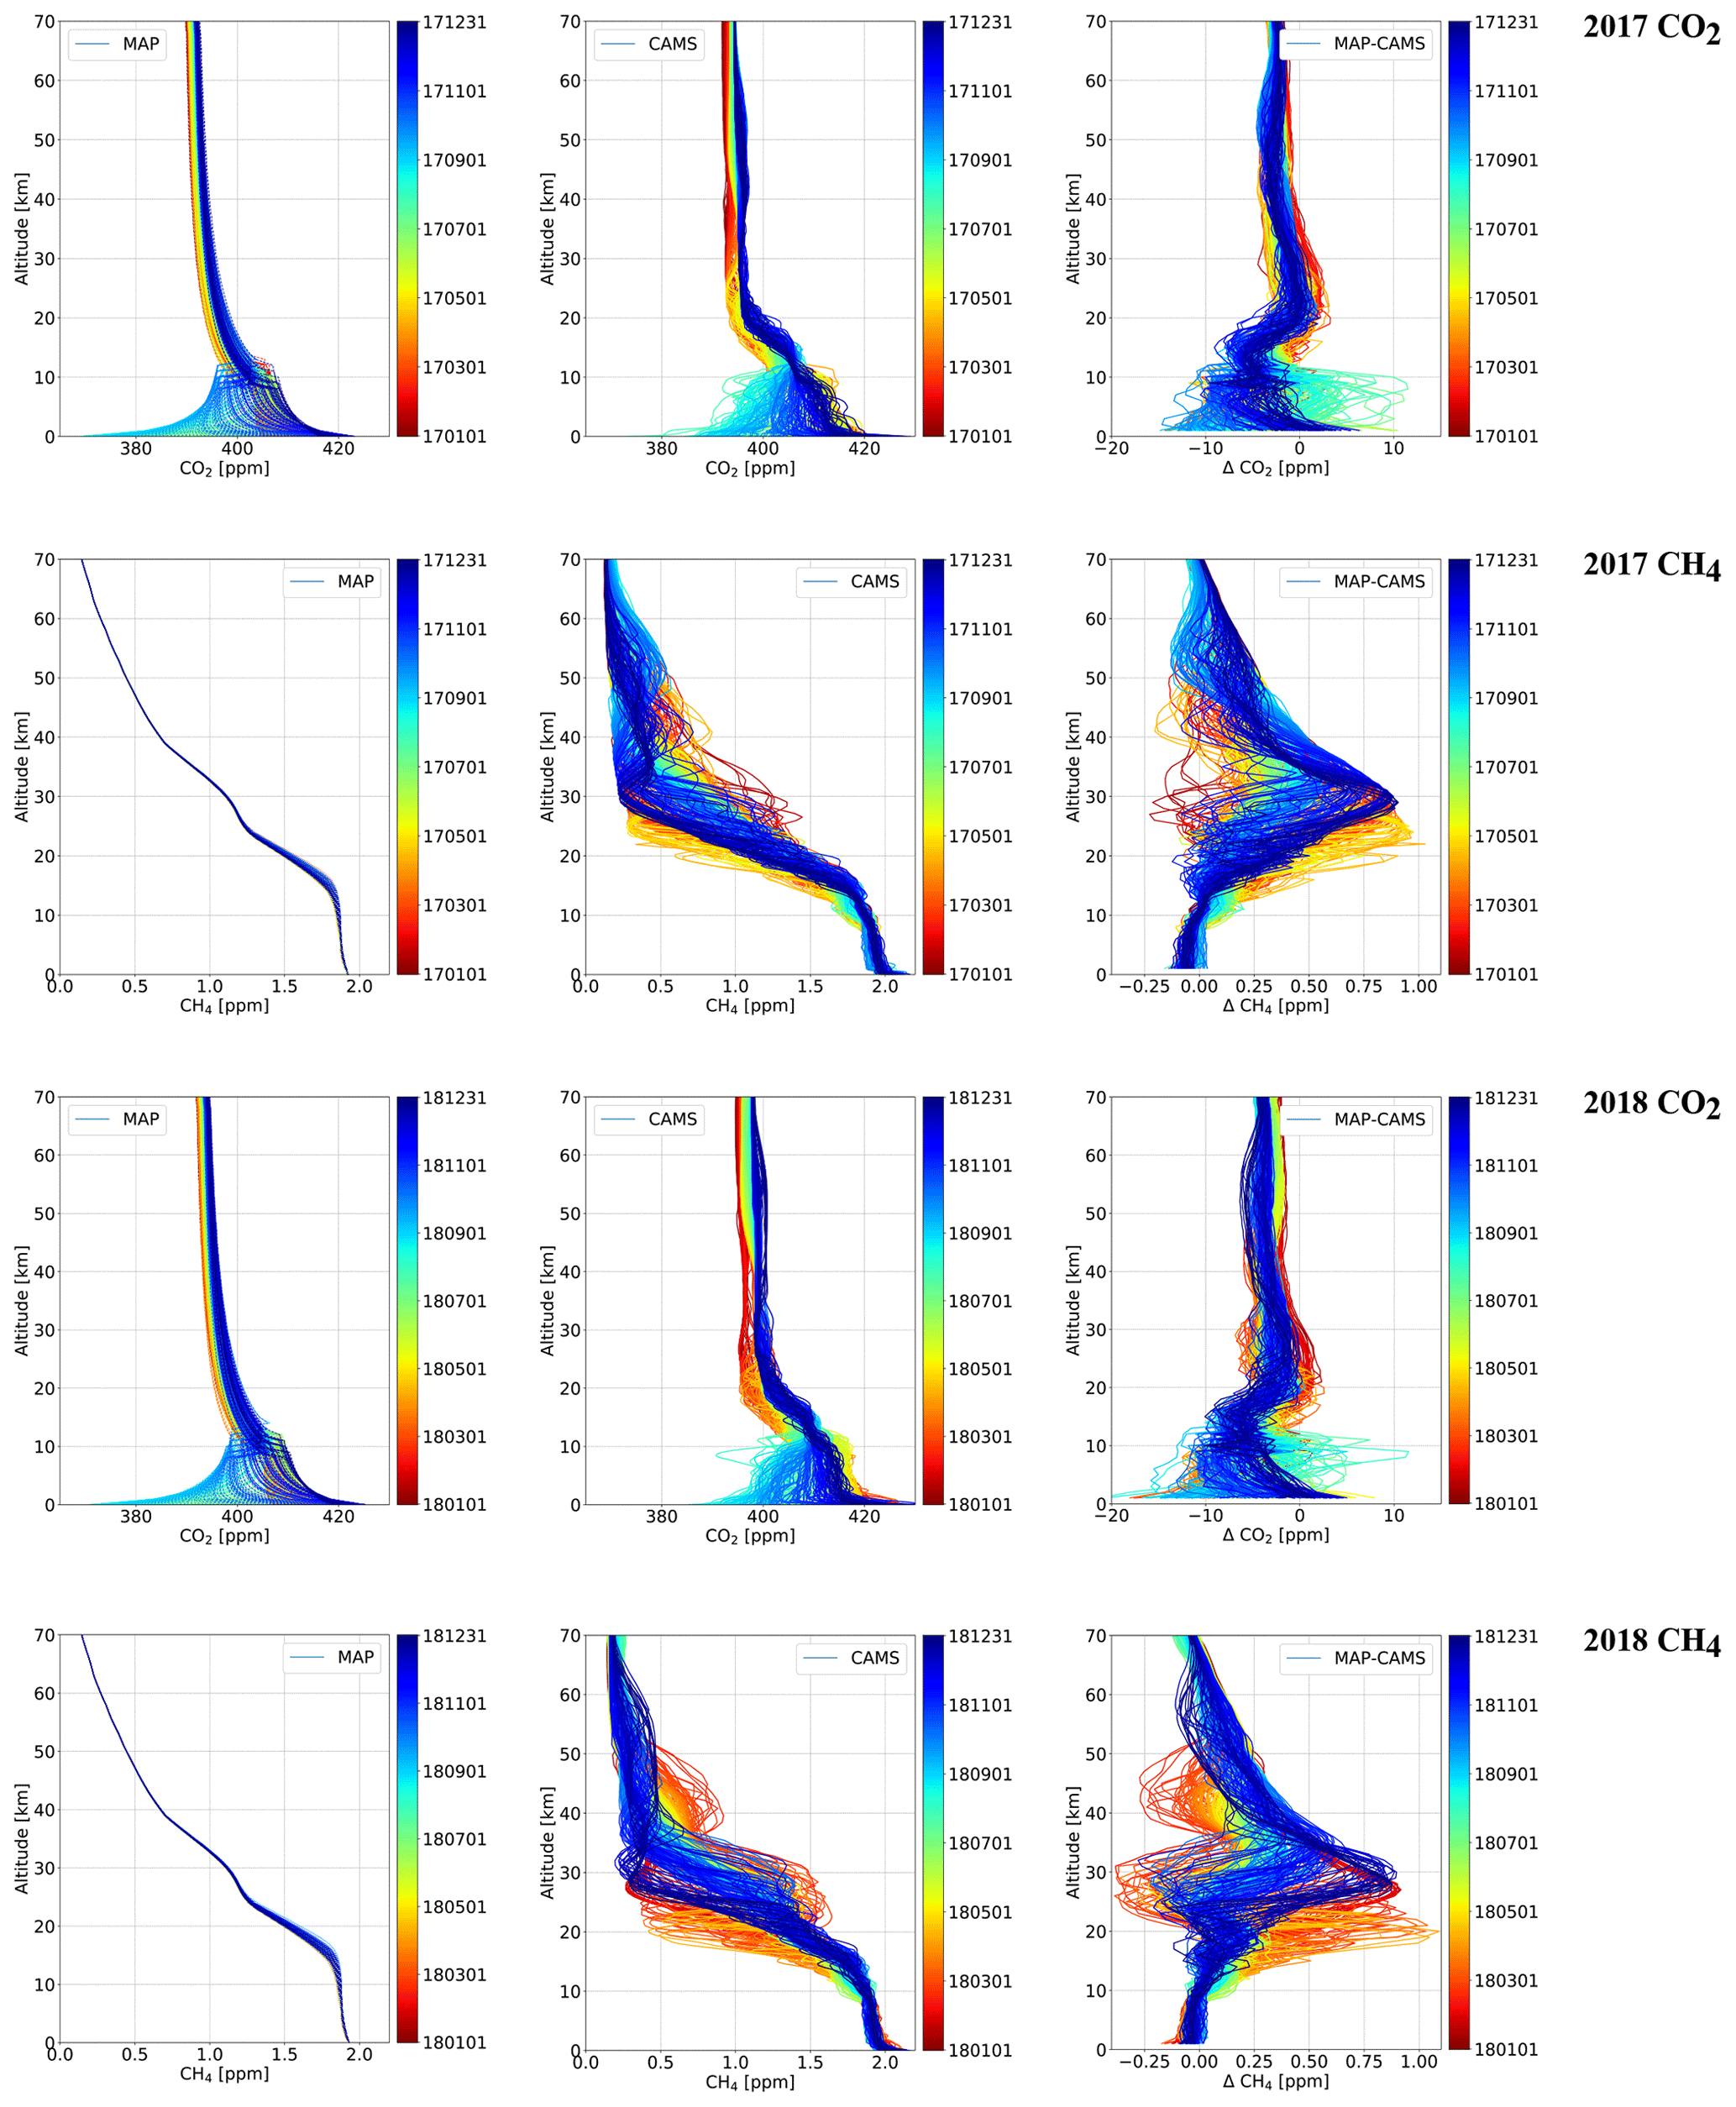
Figure 2Profiles of MAP (left column), CAMS (middle column), and the difference between MAP and CAMS (right column) for CO2 and CH4 in 2017 and 2018.
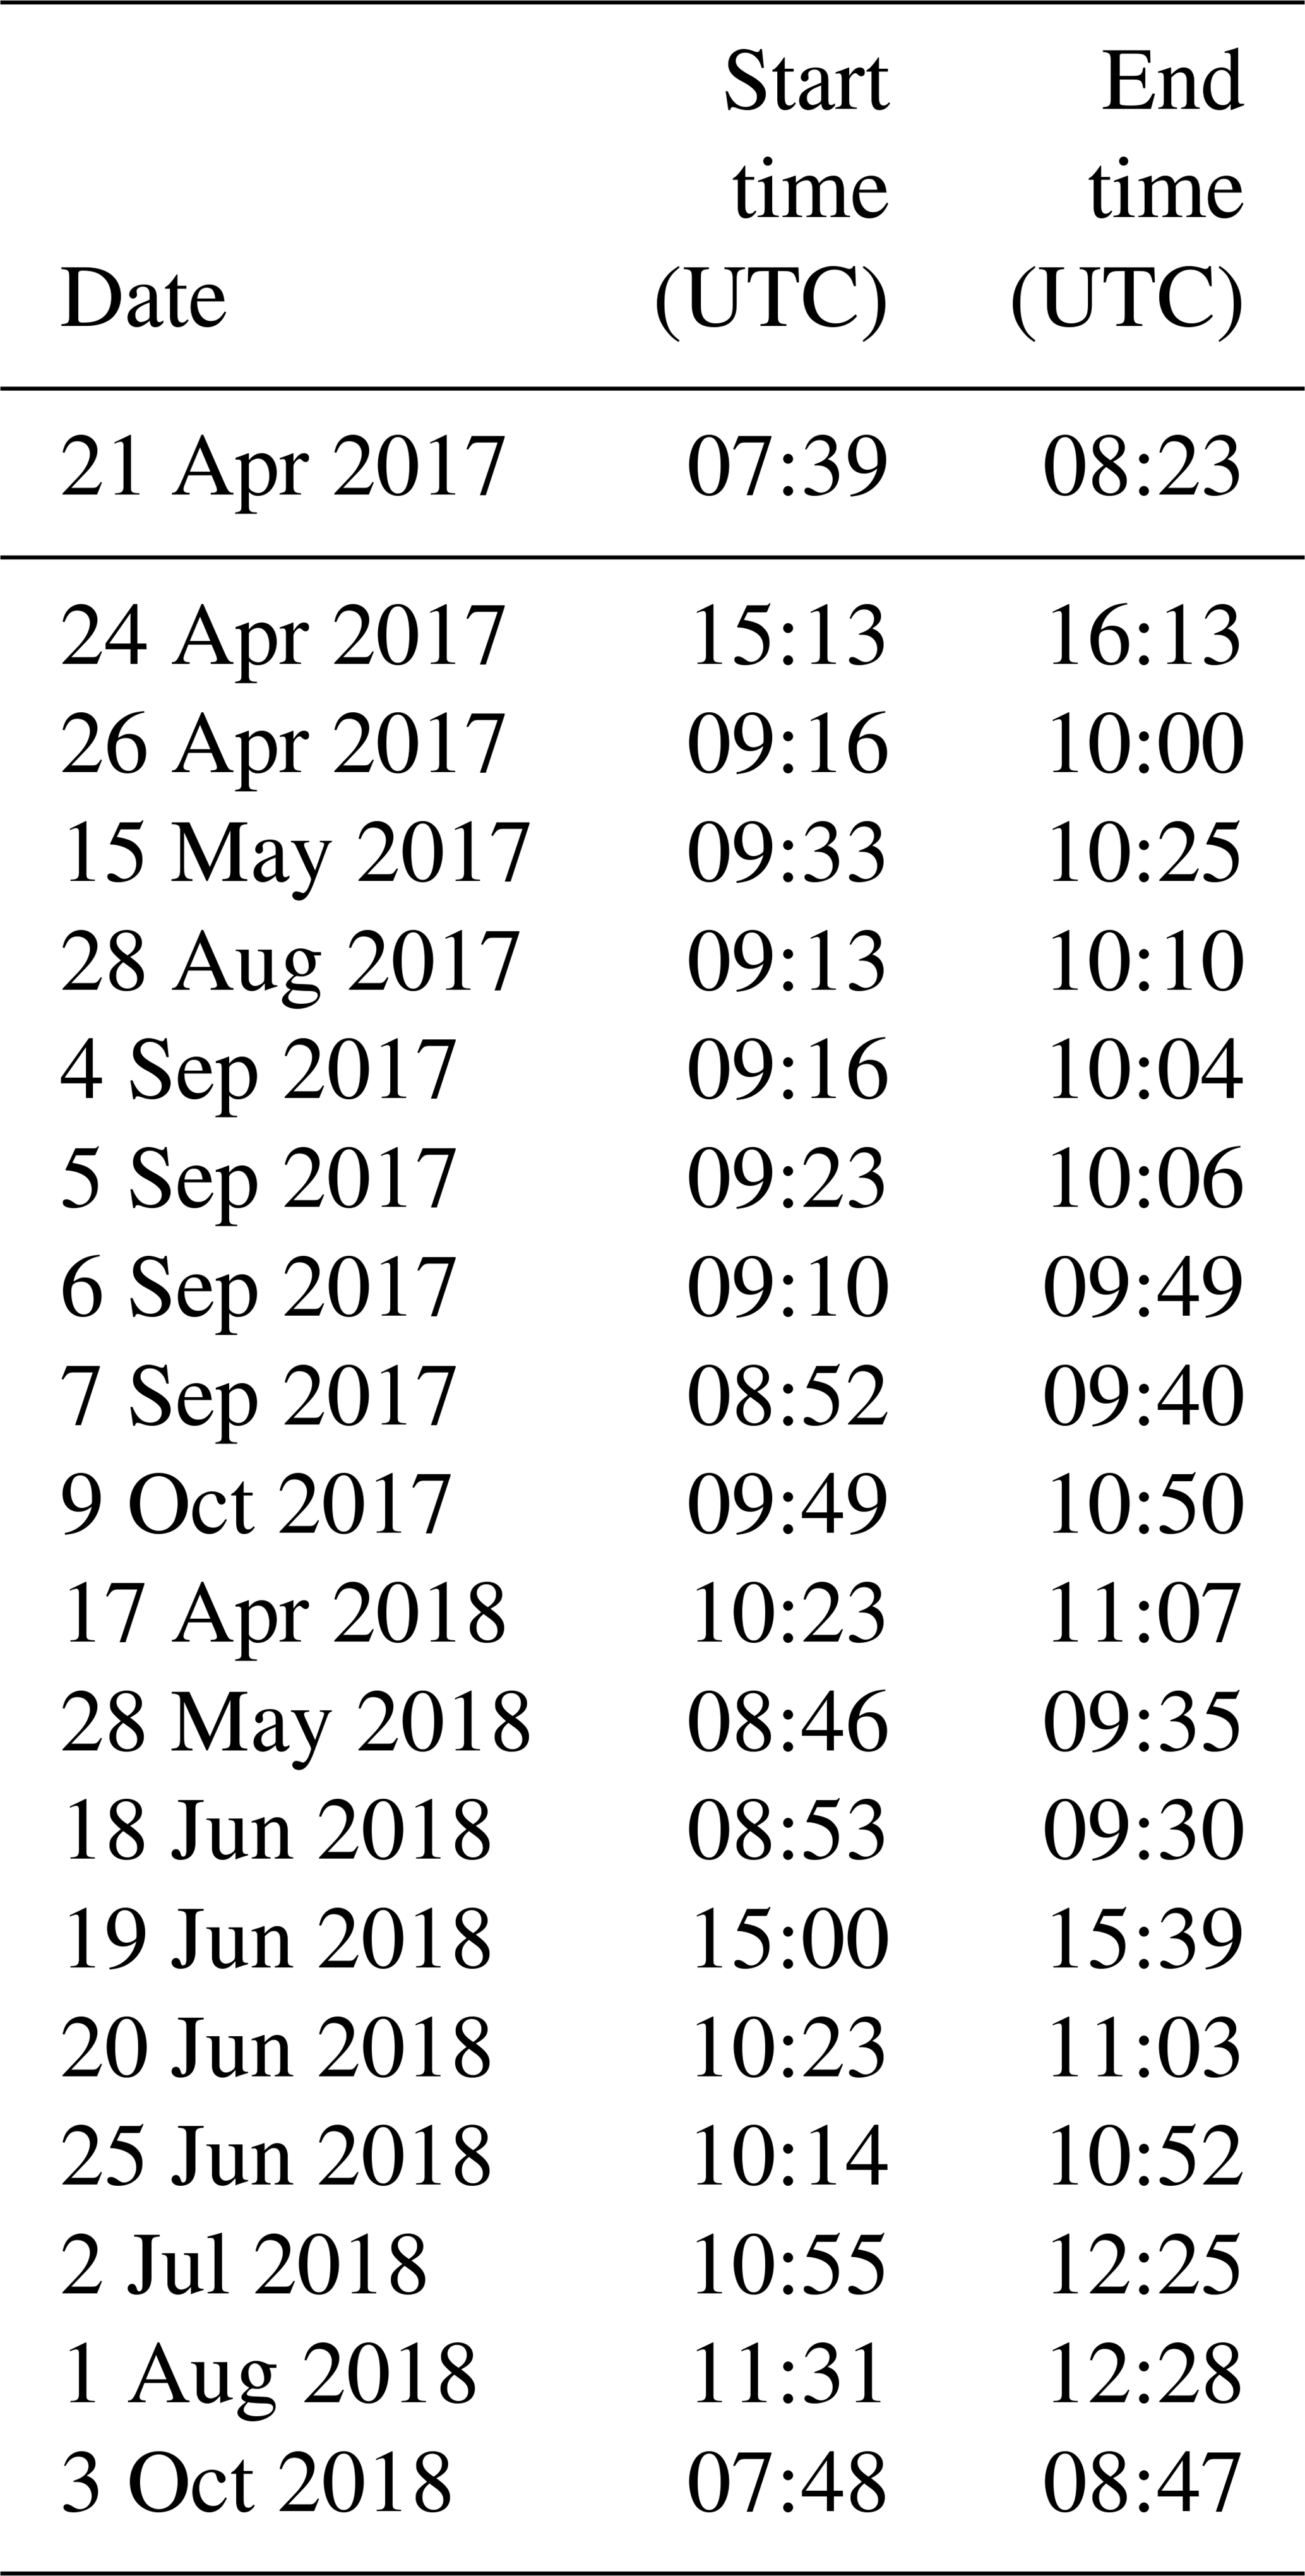
The chosen a priori VMR profiles are mainly based on model data. To assess the quality of the model data, knowledge of the actual profiles is required and might be obtainable from in situ instruments on board aircraft performing profile measurements or from in situ AirCore balloon launches. The AirCore instrument launches were performed on sunny days when the TCCON and COCCON instruments were taking measurements. There were 10 launches in 2017 and 9 launches in 2018, covering the spring to autumn period. We add a table providing the launch dates and sampling times in the appendix (Table A1). The AirCore, which was another main activity in the FRM4GHG campaign, is a simple and viable atmospheric sampling system to measure vertical profiles of greenhouse gases (Karion et al., 2010). The AirCore system that was used in Sodankylä was built at the University of Groningen (UG) and at the Finnish Meteorological Institute (FMI). It consists of a 100 m long coiled stainless-steel tube, combining ∼40 m of 0.25 in. (6.35 mm) tube and ∼60 m of 0.125 in. (3.175 mm) tube, along with an automatic shut-off valve and custom-built data logger to record temperature and pressure during the flight. A 3 kg meteorological balloon was used to launch the AirCore along with a radiosonde and the payload positioning system. The air is evacuated from the tube during ascent to an altitude of ∼30 km due to the pressure difference, while ambient air flushes into the tube as it descends. Upon landing, the automatic valve shuts off to prevent any further exchange of the sampled air inside the tube with ambient air. A cavity ring-down spectrometer (CRDS) manufactured by Picarro Inc. is used afterwards to quantify the mole fractions of the target gases (e.g., CO2 and CH4) in the AirCore sample.
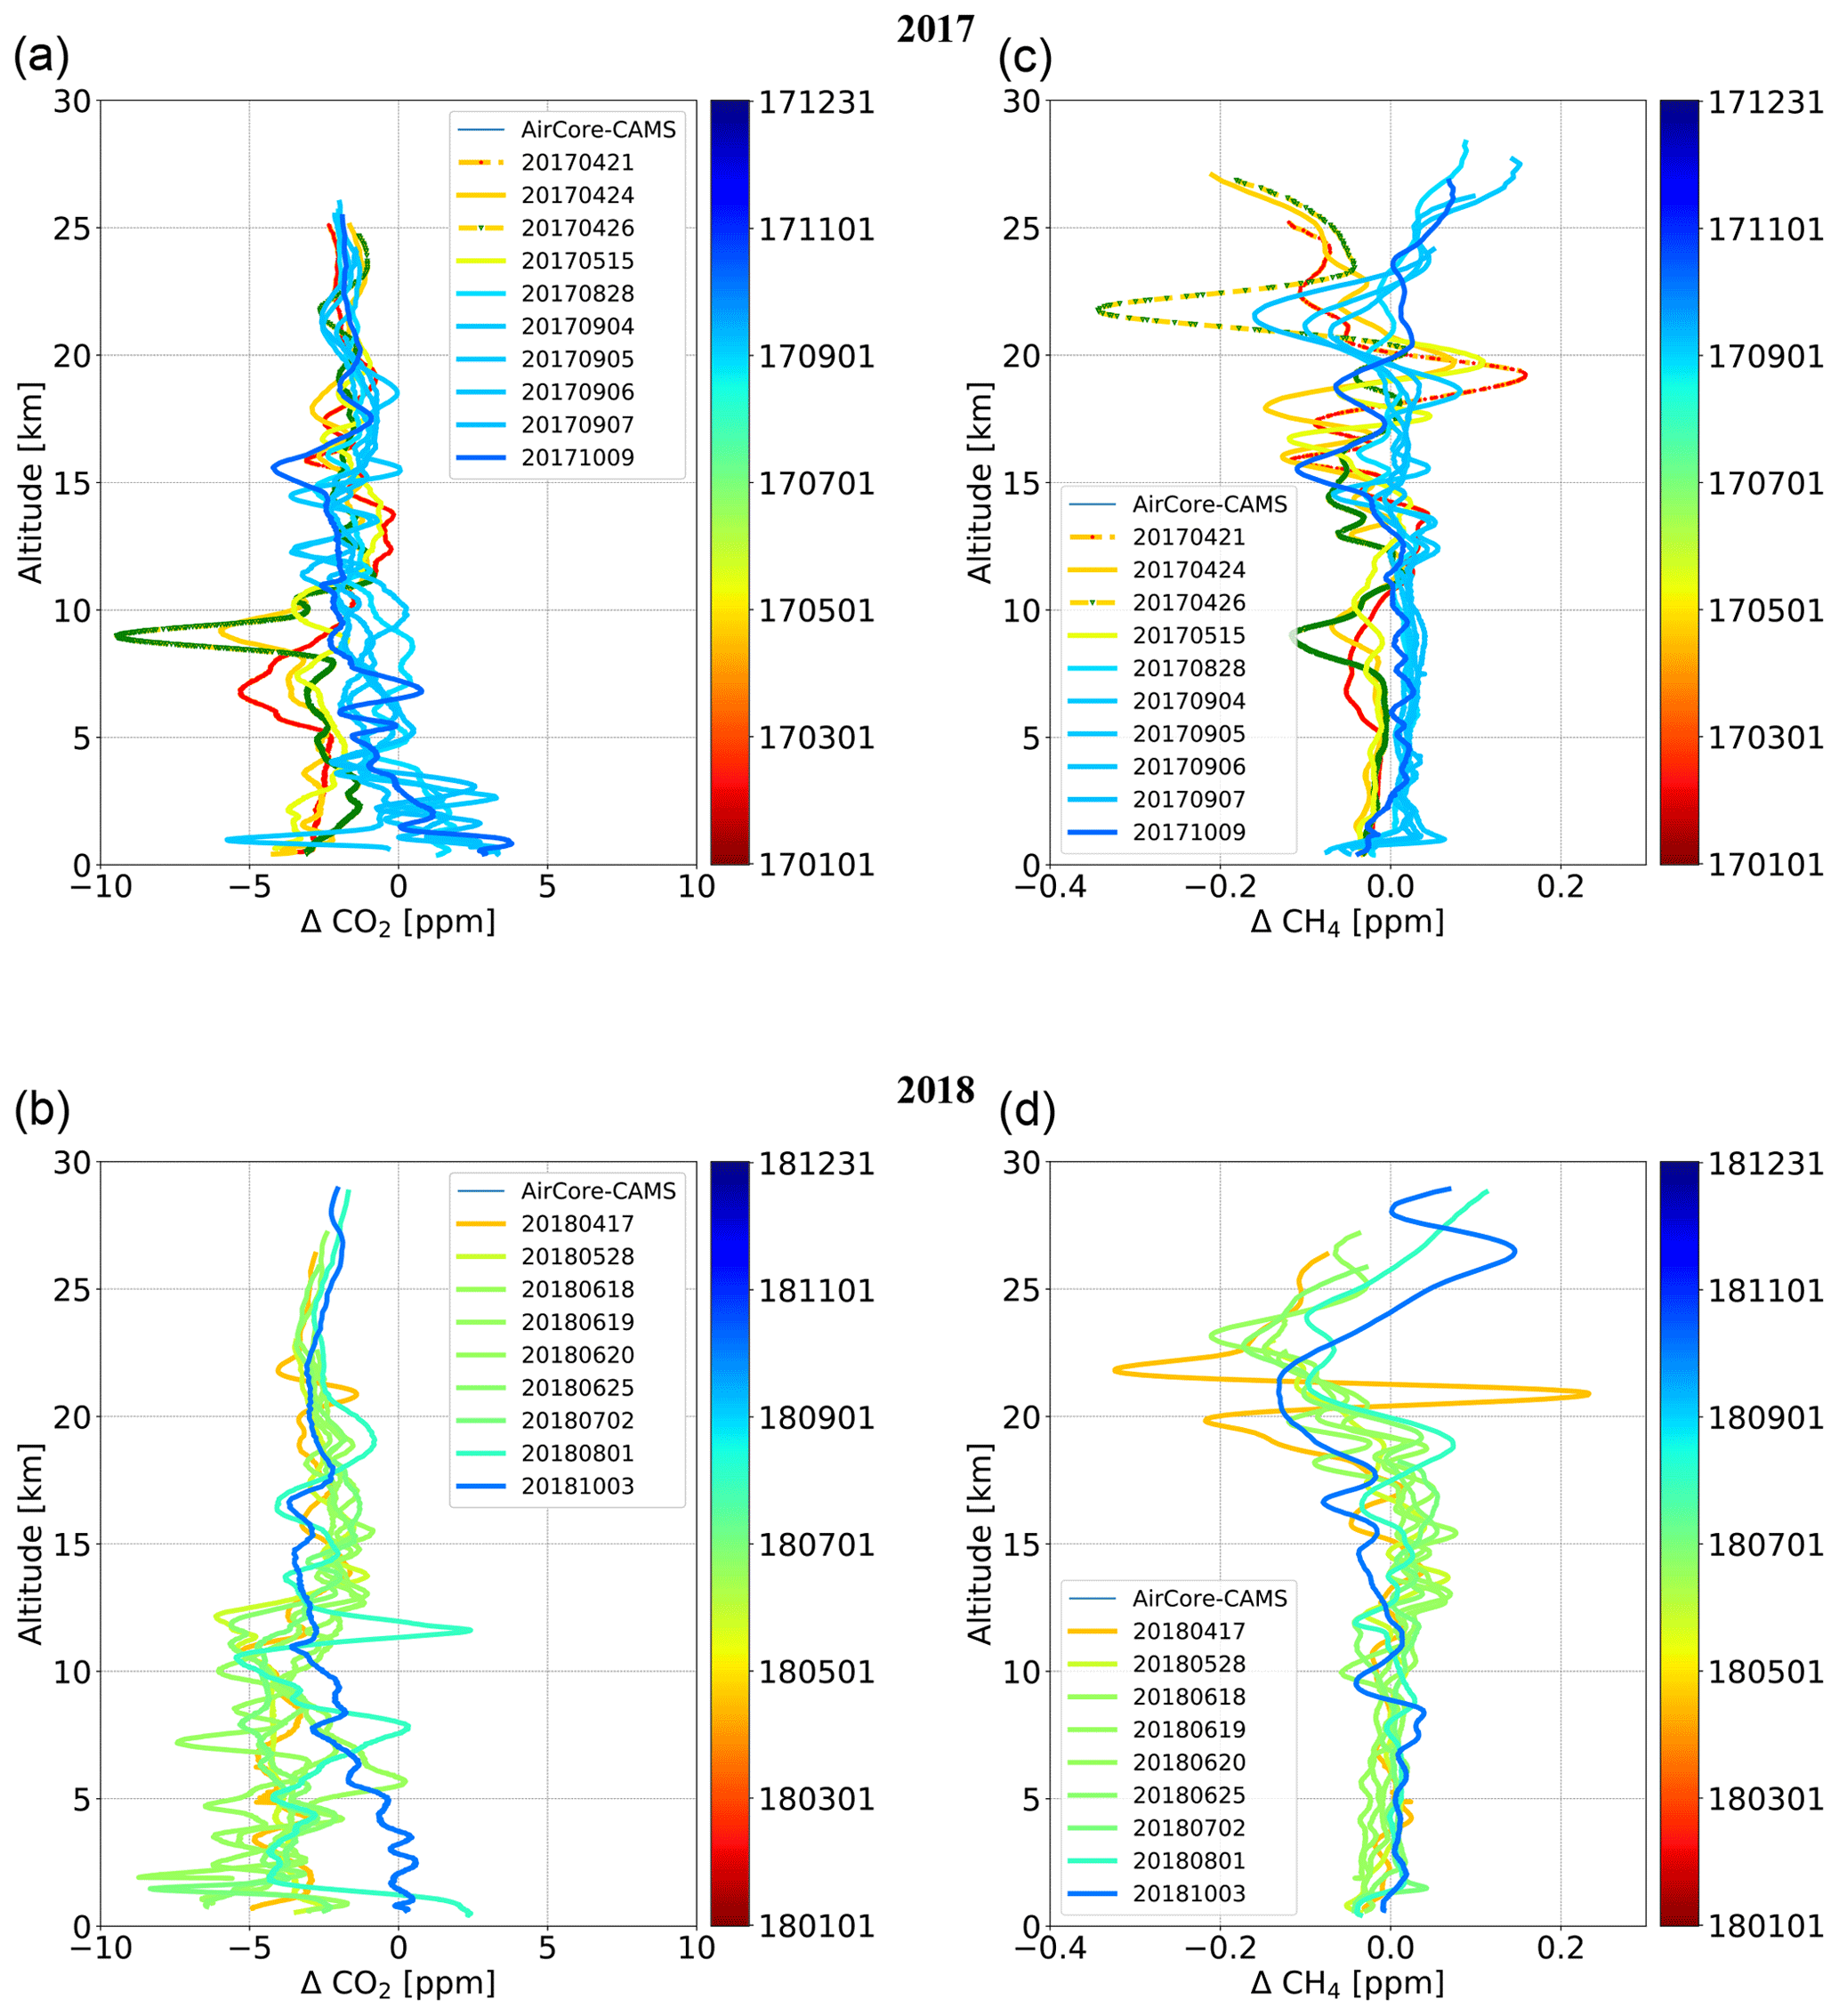
Figure 3Differences between AirCore and CAMS for CO2 (a, b) and CH4 (c, d) profiles in 2017 and 2018.
3.1 Quality of a priori profiles and their influence on the retrieval results
The choice of a priori VMR vertical profiles for the target gases is important for retrieving correct column abundances from ground-based FTIR spectra. A preprocessing tool developed by KIT in the framework of the COCCON-PROCEEDS project, funded by the ESA, generates spectra from raw interferograms and performs quality checks (Frey et al., 2019; Sha et al., 2019b). The column abundances of trace gases are subsequently retrieved from the spectra using the PROFFAST retrieval code. PROFFAST is a nonlinear least squares spectral fitting algorithm, scaling the a priori dry-air mole fraction gas profiles to generate the best spectral fit to the measured spectrum. In the following section two different sets of a priori profiles are used for investigating the sensitivity of the retrievals with respect to the choice of the profiles. One set of VMR profiles is the one used by TCCON (MAP). Another set of daily profiles (at 12:00 UTC) is provided by CAMS. These daily CAMS profiles refer to 137 model levels from 0.1 km up to 80 km. The choice of altitude levels is based on the 1976 version of the International Civil Aviation Organization (ICAO) Standard Atmosphere.
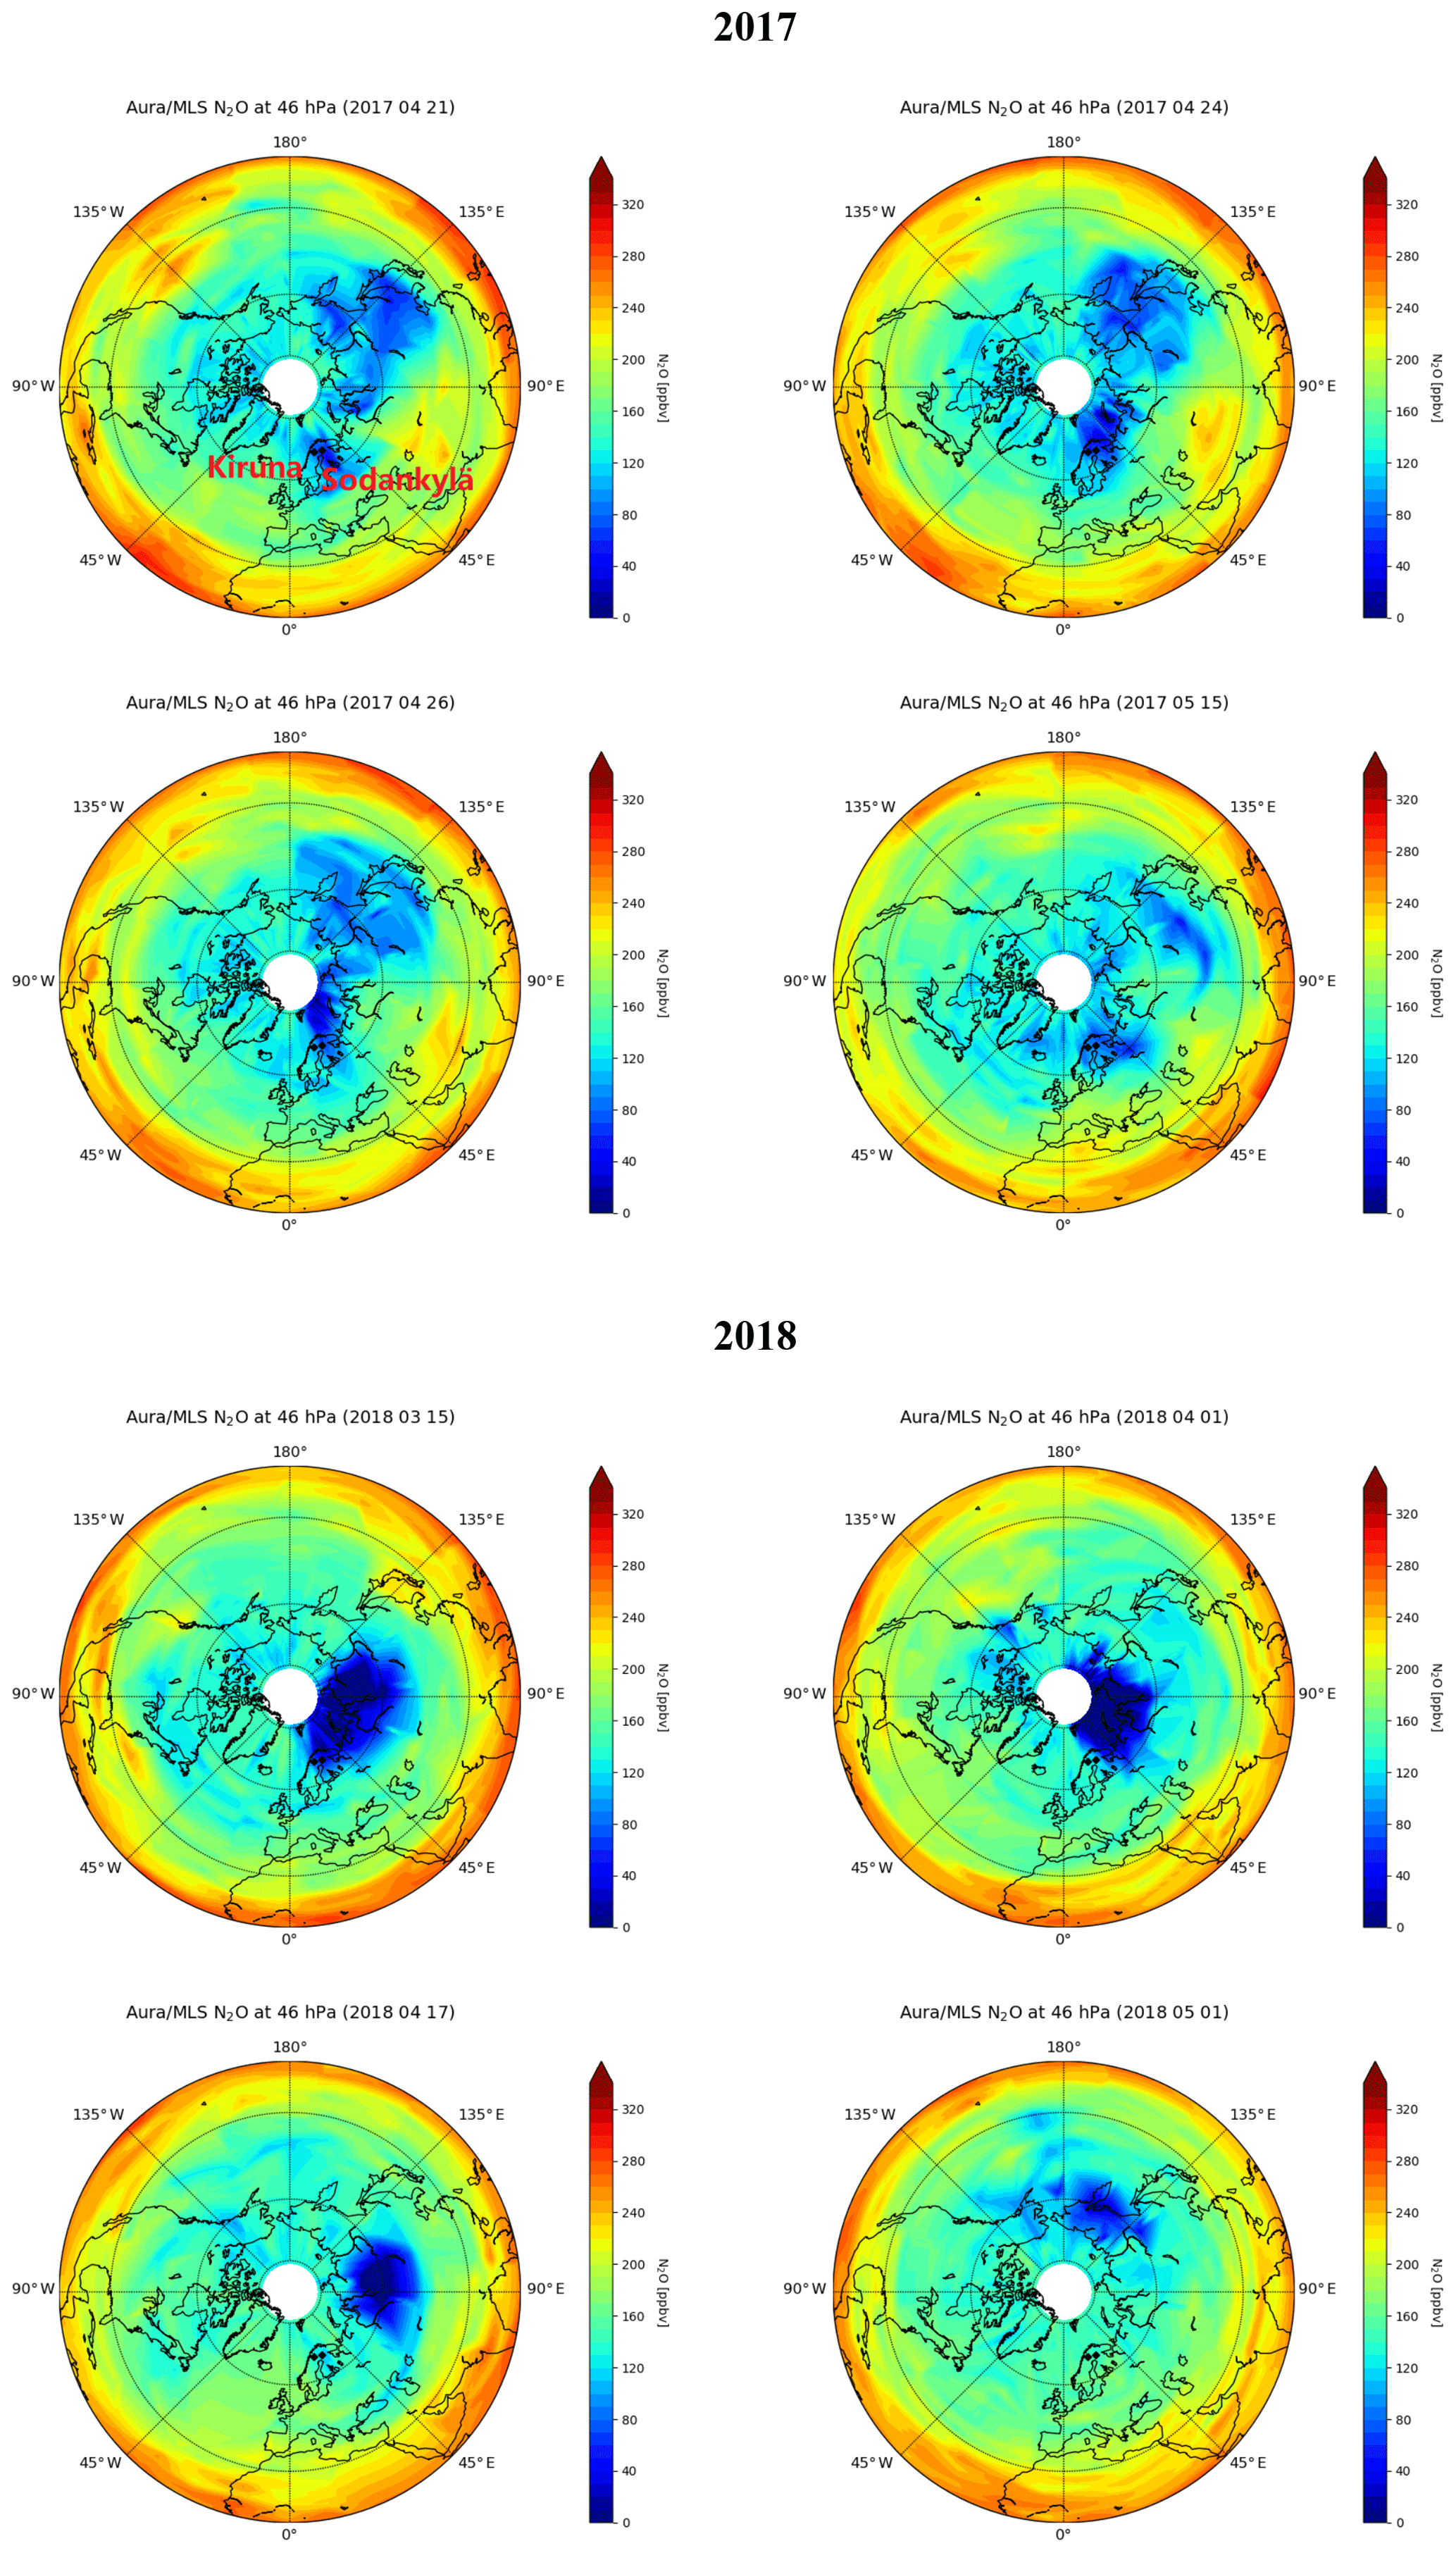
Figure 4Development of polar vortex in 4 d in April–May 2017 and 4 d in March–May 2018, using N2O retrieved from the Aura/MLS satellite dataset as a tracer. The two sites are denoted with diamond symbols (left one for Kiruna and right one for Sodankylä) in each subplot.
3.1.1 Comparison of the MAP and the CAMS profiles for the Sodankylä campaign site
The CO2 and CH4 profiles of MAP and CAMS in 2017 and 2018 for the Sodankylä campaign site are shown in Fig. 2. The left column shows the MAP profiles, the middle column shows the CAMS profiles, and the right column shows the differences between the MAP and the CAMS profiles as a function of the altitude. For CO2, both profiles present similar seasonal changes; the highest near-ground concentrations occur in winter and the lowest in summer. However, the CAMS profiles show higher vertical variability and more obvious seasonal changes over the whole year. Most of the time, the MAP profiles have lesser CO2 concentrations than CAMS as seen in the difference plots for both 2017 and 2018 profiles (Fig. 2 right columns). The main differences between MAP and CAMS CO2 profiles occur in the troposphere, and the difference near the ground ranges from −15 to 12 ppm for 2017 and from −21 to 12 ppm for 2018, showing peak-to-peak variabilities of about 27 ppm in 2017 and 33 ppm in 2018. The MAP profile estimates are lower than the CAMS estimates in the early part of the year and in autumn. The largest difference at ground level is −14.9 ppm, occurring on 5 September 2017, and it is −21 ppm on 9 August 2018. In the stratosphere the CAMS CO2 profiles show smaller vertical changes compared to the MAP profiles over the year; however, they are generally higher in concentration than the MAP profiles with over 40 km in 2017 and over 30 km in 2018. Altogether, the MAP a priori profiles agree quite well with the CAMS profiles.

Figure 5Comparisons of COCCON and TCCON data in 2017 and 2018 using MAP (four left panels) and CAMS (four right panels) profiles as a prior profiles. The slope of the relationship is represented by “s” in the figure, and the coefficient of determination is represented by “R2”. Each point represents a 10 min average of coincident measurements between COCCON and TCCON. The red solid line represents the best fit line, and the black dashed line is the one-to-one line.
A much larger difference exists in CH4 between the MAP and the CAMS profiles. CAMS shows a significant seasonal change, especially in the stratosphere, while MAP is more constant and overestimated relative to CAMS over the whole year. In contrast to CO2, the highest differences between MAP and CAMS appear in the lower stratosphere between 20 and 40 km as seen for both 2017 and 2018 plots (Fig. 2). In the beginning of the year, the difference between MAP and CAMS profiles is around 0.9 ppm at 28 km and reaches to nearly 1 ppm at a lower level of 20 km in spring. The largest difference reaches up to 1.0 ppm at 22 km on 12 April 2017 and at 20 km on 12 and 15 March 2018. The MAP profiles are close to CAMS, and the highest difference is around 0.35 ppm at 33 km in summer 2017 and 2018. In winter, the differences are also obvious and near to 0.9 ppm at around 30 km. The steeper vertical gradients together with the dynamical processes occurring in the polar atmosphere make a climatological guess of a priori profile shape much harder than for carbon dioxide; therefore, the MAP a priori profiles are less realistic for methane. We will investigate to what degree CAMS is capable of following the actual profile variability in the next section using AirCore soundings.
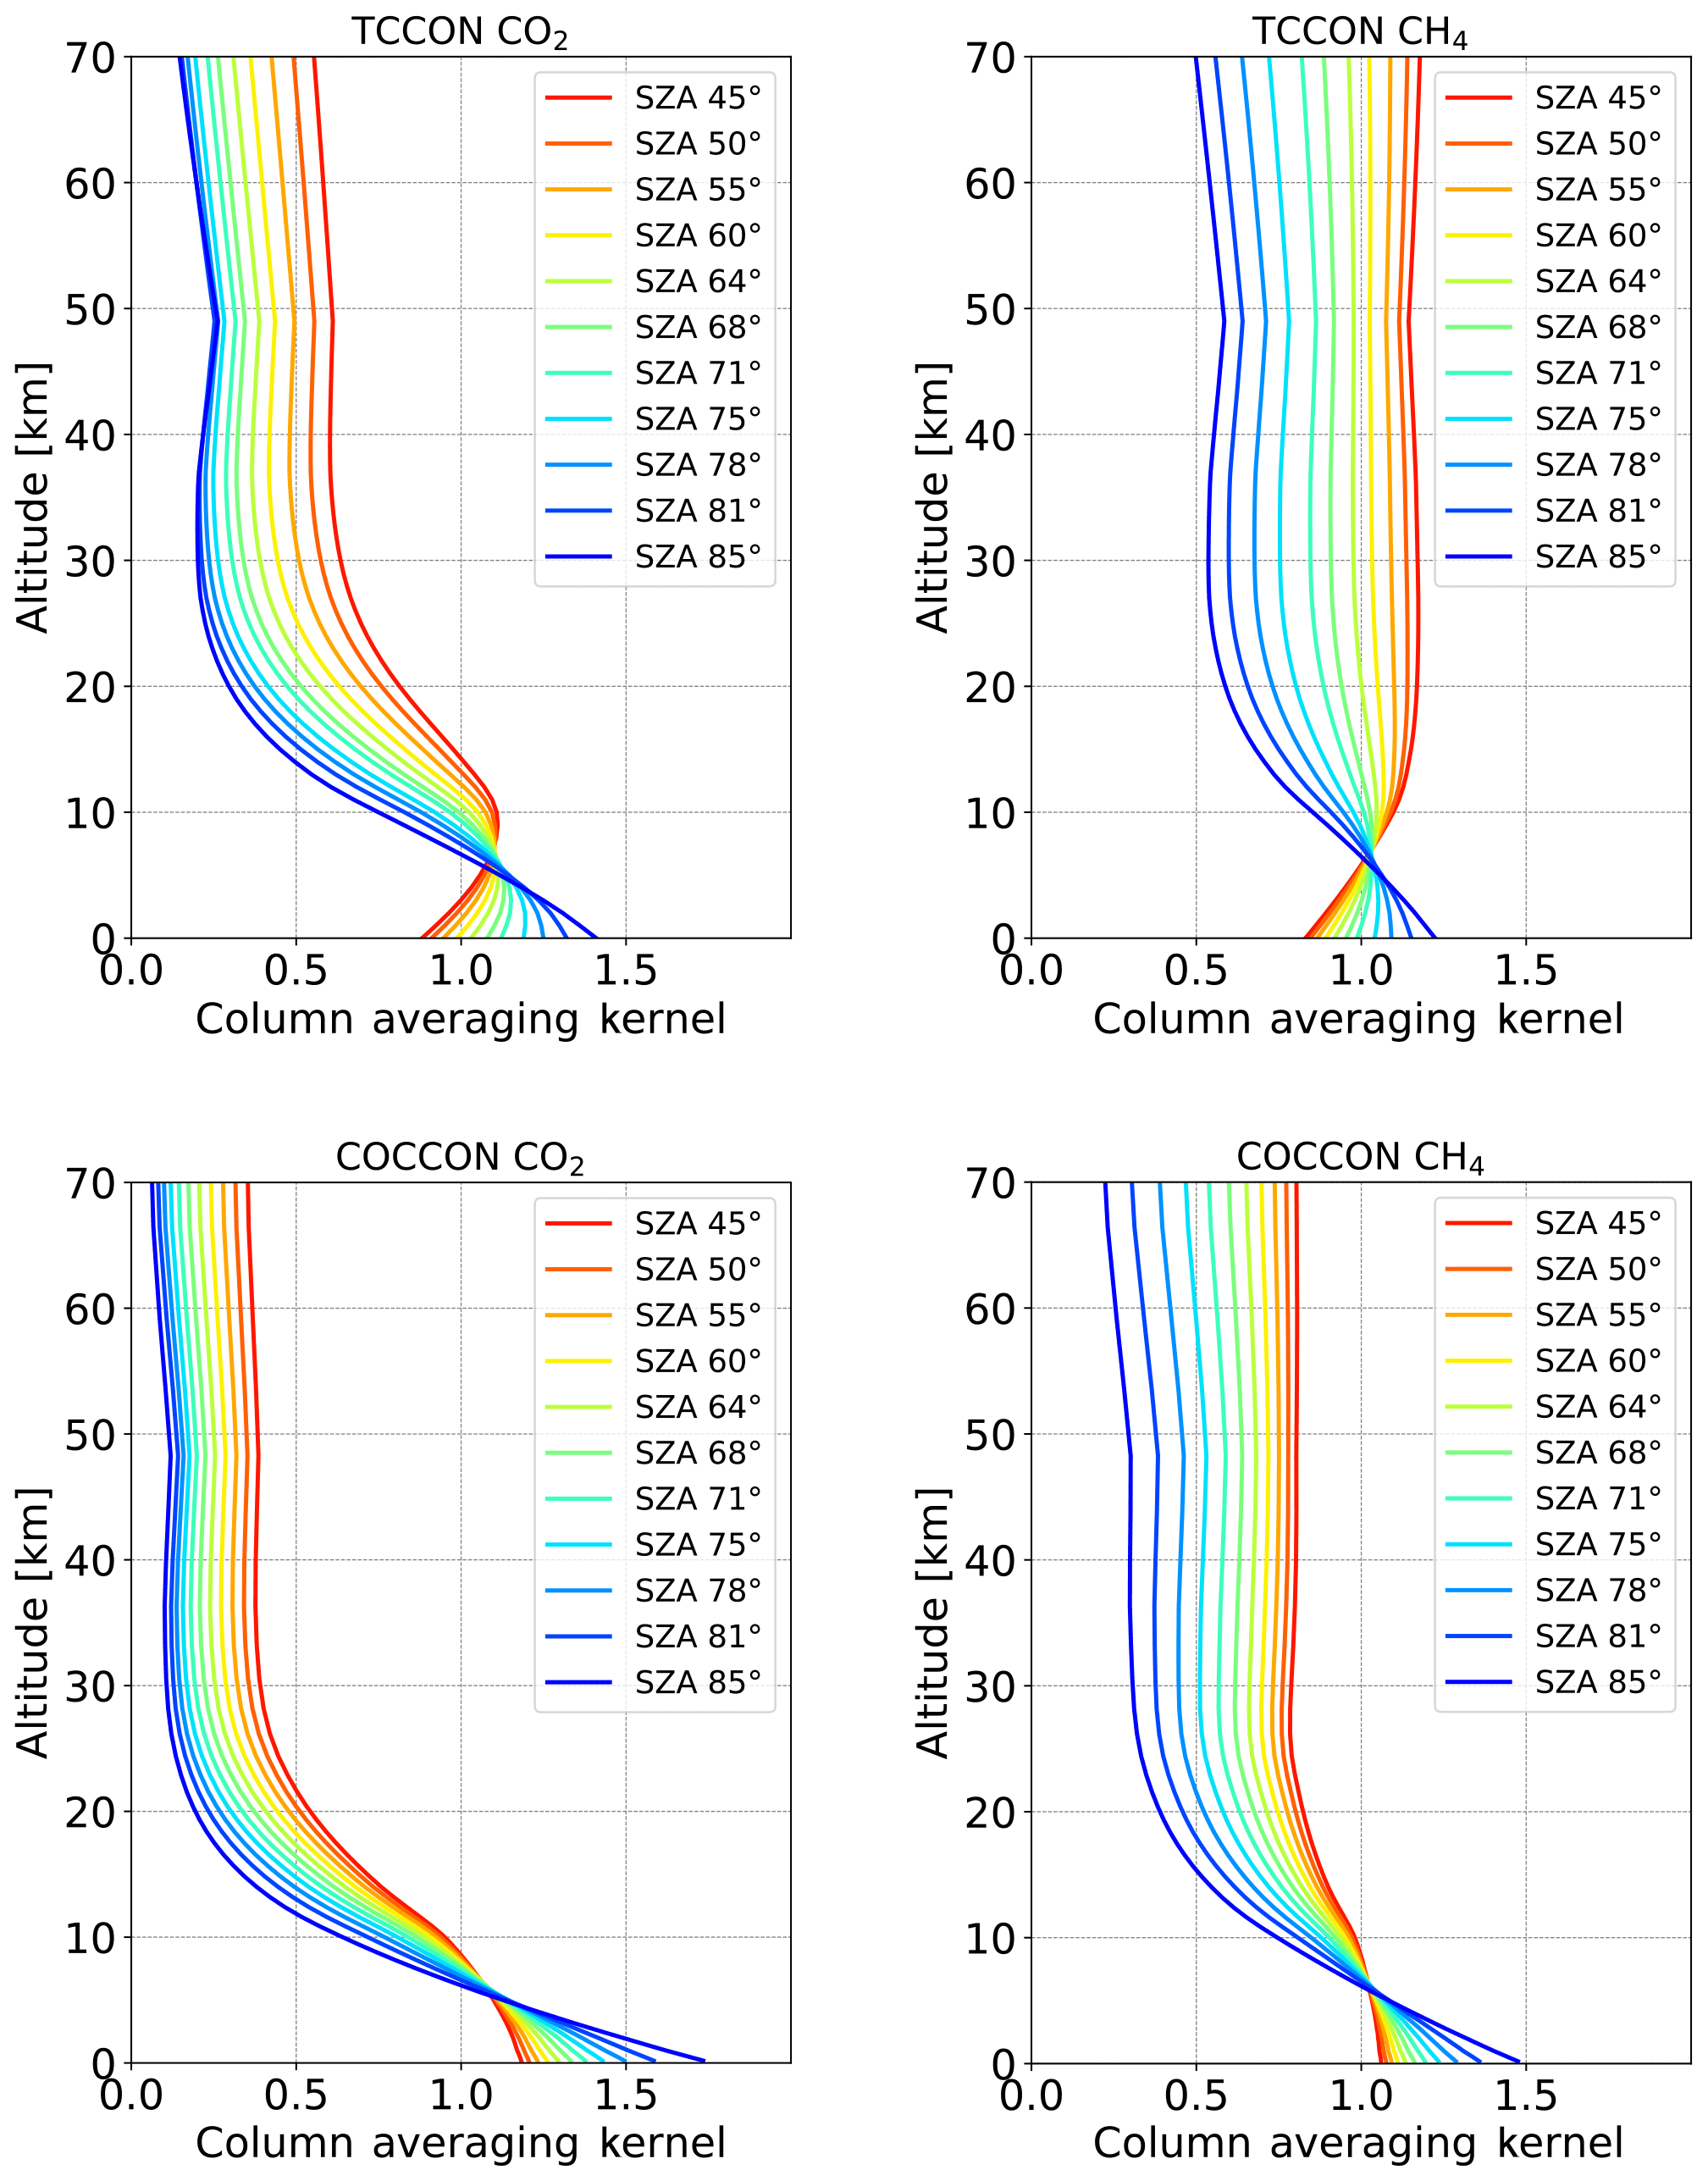
Figure 6An example of the averaging kernels comparison at different SZAs for the TCCON and COCCON instruments performed on 8 June 2017. The COCCON instrument is generally less sensitive to changes in SZA.
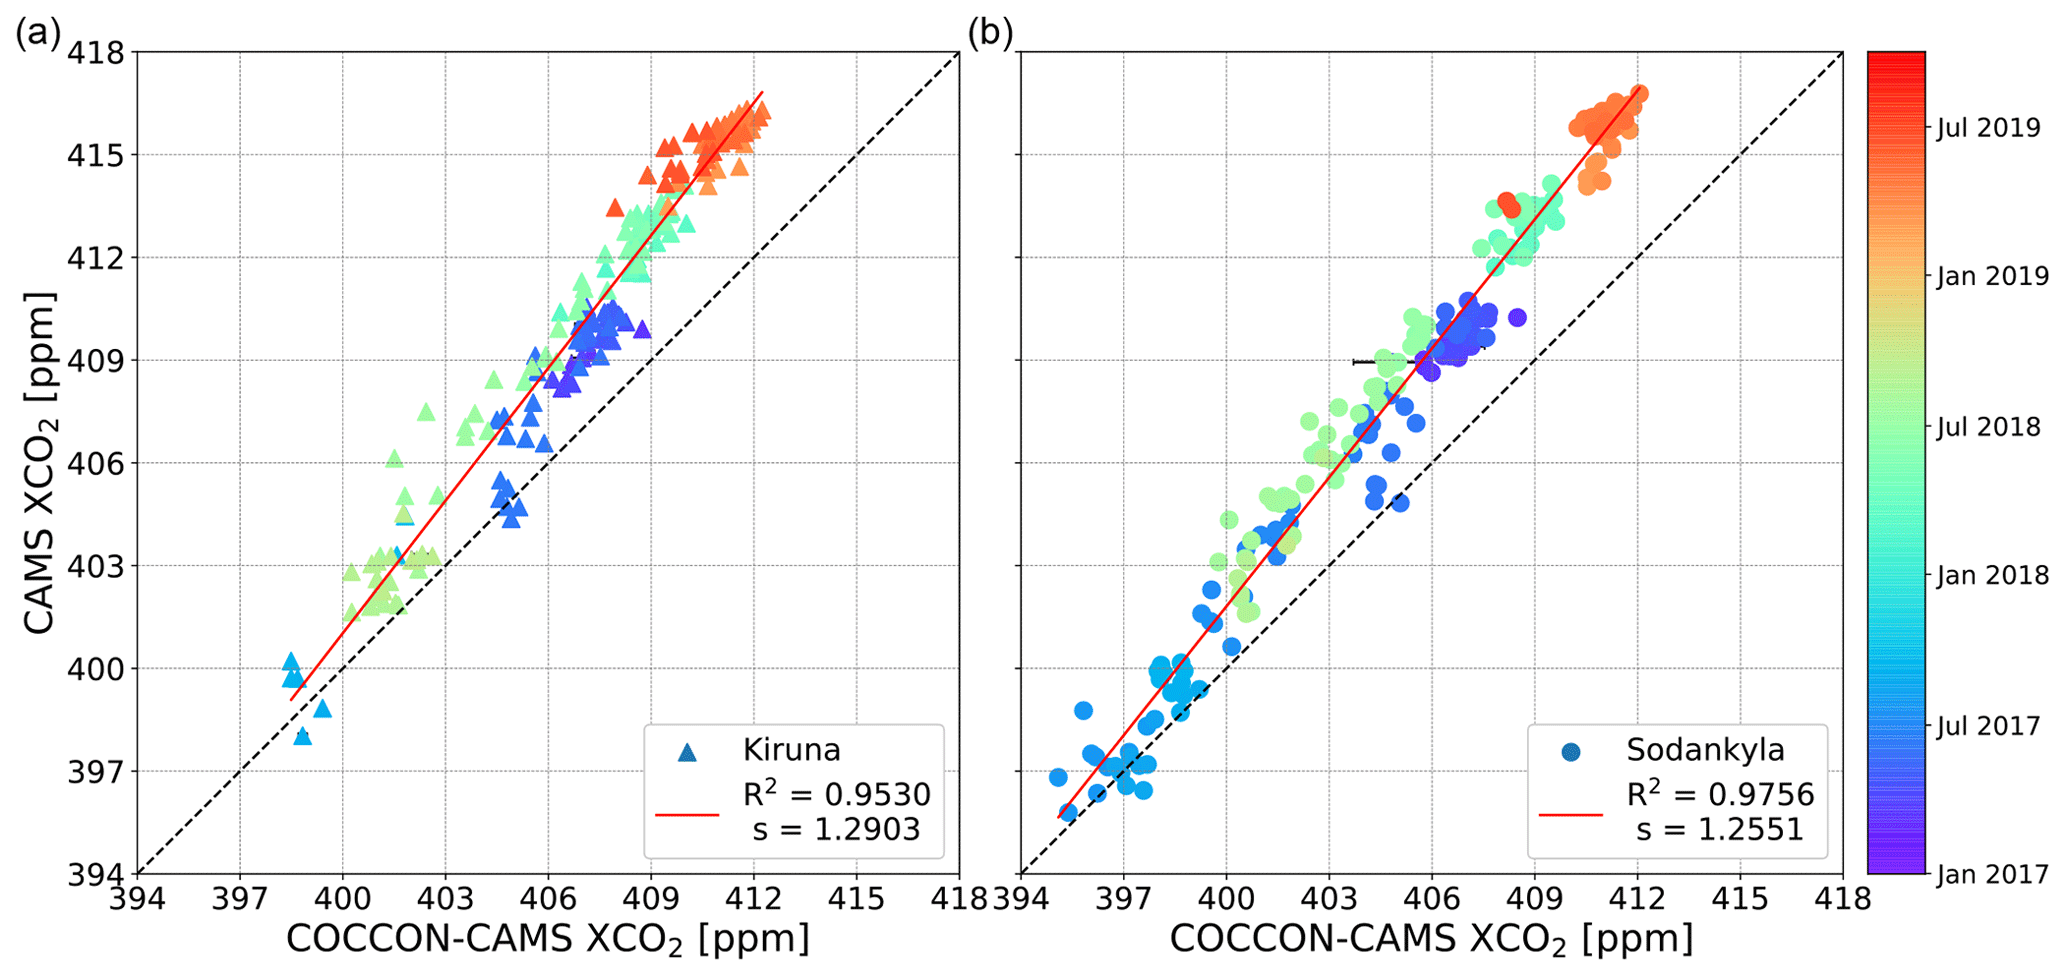
Figure 7XCO2 comparison between CAMS and COCCON-CAMS in Kiruna (a) and Sodankylä (b). Every point represents coincident CAMS and COCCON-CAMS measurements. The annotations follow those in Fig. 5.
Table 1A summary of statistics between two paired datasets is listed in terms of averaged bias and standard deviation (in brackets: R2 values).
3.1.2 Comparison of in situ AirCore profiles and CAMS profiles for the Sodankylä campaign site
The in situ profiles are derived from the AirCore balloon launches at the Sodankylä campaign site and up to an altitude of approximate 30 km. Figure 3 shows the differences between CO2 and CH4 between the AirCore and the CAMS profiles for 10 measurement days in 2017 and 9 measurement days in 2018. The AirCore launches cover the spring to autumn period.
The CAMS CO2 profiles are generally overestimated compared to the AirCore profiles, with a mean difference of 1.35 ppm in 2017 and 3.33 ppm in 2018. In the 10 AirCore launched days in 2017, CAMS profiles are slightly overestimated in the stratosphere, while the tropospheric CAMS profiles are closer to the AirCore profiles in summer than those in autumn 2017. Two peak differences are found at altitudes of around 9 km with −5.98 ppm (AirCore – CAMS) on 24 April and −9.46 ppm on 26 April and another peak at around 1 km with −5.76 ppm on 5 September 2017. The CAMS profiles show a slightly higher bias of CO2 in the troposphere during summer 2018 when a drought anomaly occurred. During drought, the air is moving upwards, resulting in an increasing CO2 concentration in the mid-troposphere (Jiang et al., 2017), and this impact is overestimated in CAMS data (Christophe et al., 2019). In general, CAMS profiles are overestimated over the whole vertical altitude range, and differences in the stratospheric part are quite constant throughout the year. The averaged difference over 10 km is about −1.7 ppm in 2017 and −2.9 ppm in 2018.
The significant differences for CH4 in the stratosphere can be seen in the early part of the year when comparing CAMS with in situ AirCore profiles. Two obvious differences occur on 21 and 26 April, whose plots are highlighted with additional red and green dots in Fig. 3. CAMS underestimates 0.16 ppm atmospheric CH4 abundances at around 19 km on 21 April 2017 and overestimates approximately 0.34 ppm CH4 at around 22 km on 26 April 2017. The significant stratospheric subsidence in April 2017 is probably caused by the polar vortex. Figure 4 (first two rows) shows N2O data from the Microwave Limb Sounder (MLS) on the Aura satellite for 3 d in April and 1 d in May 2017 when AirCore flights were performed. Because of its long lifetime, N2O is a good tracer for estimating the position of the polar vortex (Loewenstein et al., 1990; Sparling, 2000; Urban et al., 2004). Therefore, N2O concentrations at the 46 hPa level, approximately at the height of 20 km, are used here to study the XCH4 abnormal observations. Obvious stratospheric subsidence is clearly seen over Finland in April and disappeared in May 2017. For the CH4 profiles in the troposphere, CAMS profiles are slightly underestimated in spring and overestimated in summer 2017 as compared to AirCore profiles, while the CAMS CH4 profile is similar to that of AirCore profiles from approximately 3 km up to 12 km, coupled with an underestimated profile in the stratosphere on 9 October 2017. The tropospheric CAMS profiles for 2018 are very similar to the AirCore profiles for all measurement days. However, the CAMS profile on 17 April 2018 has three obvious peaks with underestimations of 0.21 ppm at 20 km and 0.32 ppm at 22 km and an overestimation of 0.23 ppm at 21 km. CAMS overestimates the CH4 concentration in the lower stratosphere on 3 October 2018. The difference between CAMS and AirCore profiles increases with height and reaches up to 0.13 ppm at 21 km; however, CAMS shows an underestimation at higher levels, with a peak value of 0.15 ppm at 27 km. Despite the remaining discrepancies, CAMS CH4 profiles approximate the true state of the polar atmosphere considerably better than the MAP profiles.
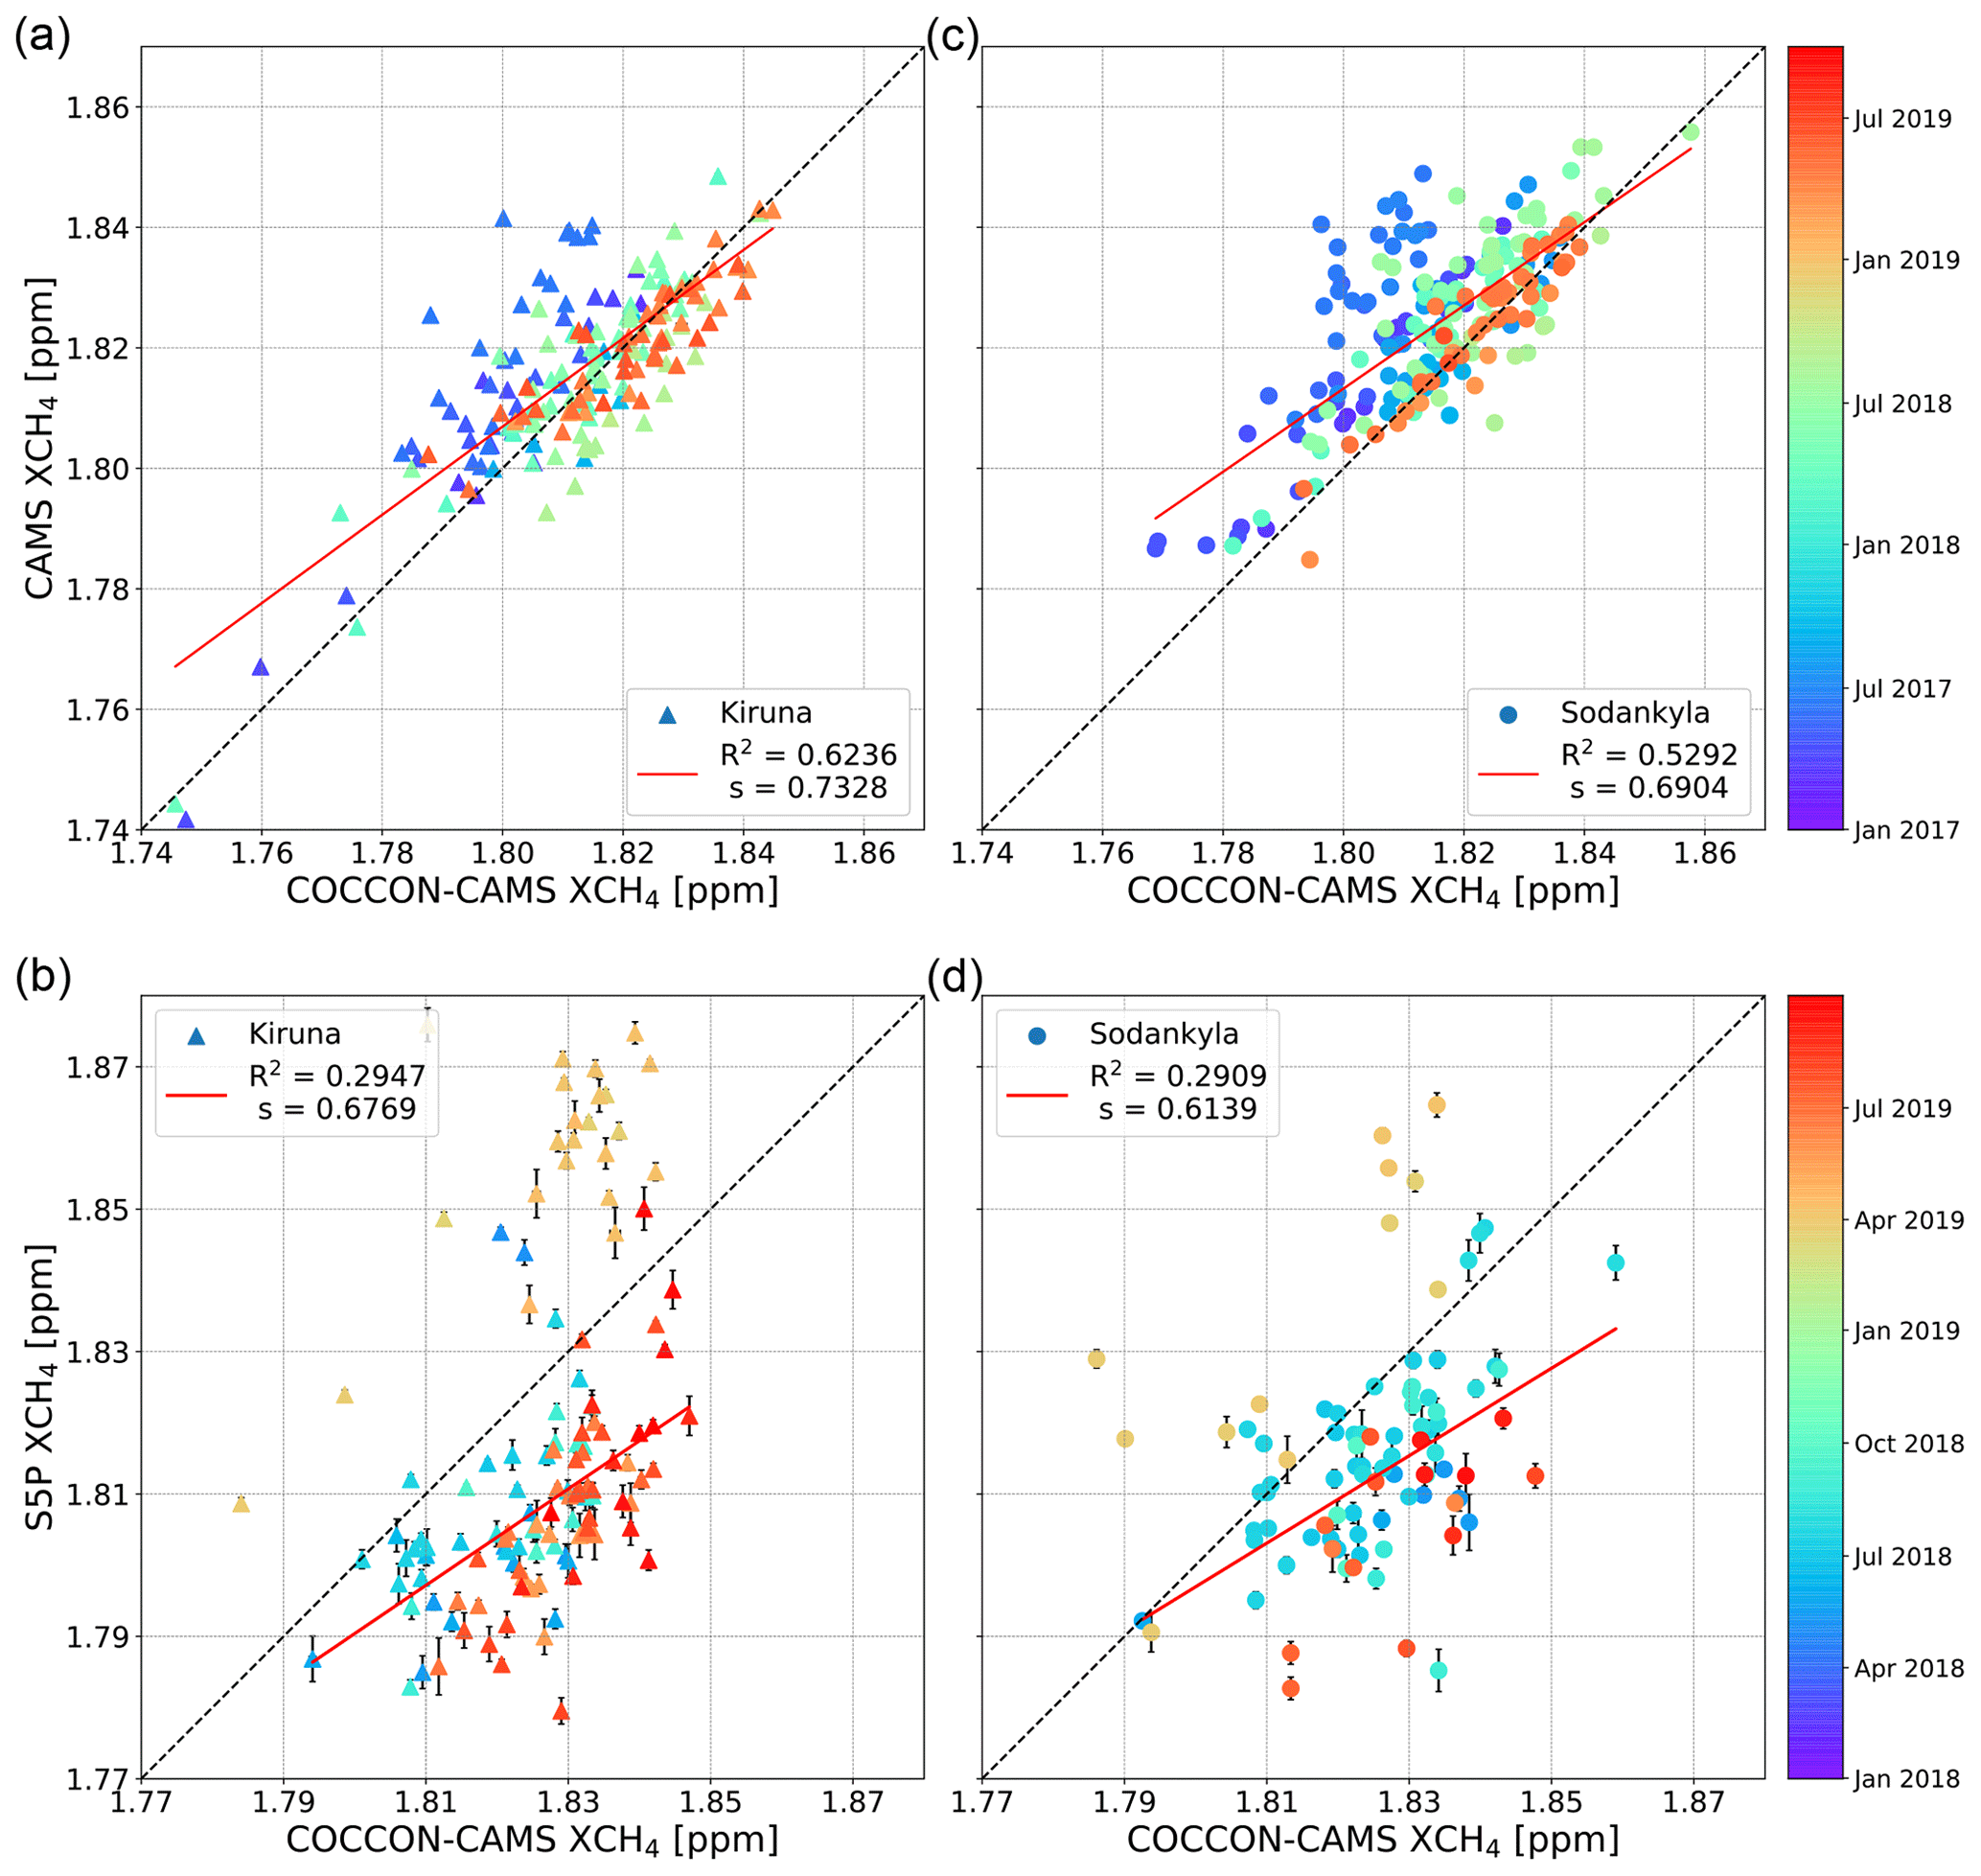
Figure 8XCH4 comparison between CAMS (a, c) or S5P (b, d) and COCCON-CAMS in Kiruna (a, b) and Sodankylä (c, d). Every point represents coincident measurements between two datasets. The annotations follow those in Fig. 5. It is noted that the fitting line derived from the data exclude March and April 2019, and the color bar starts from 2018 rather than 2017 to distinguish the data better.
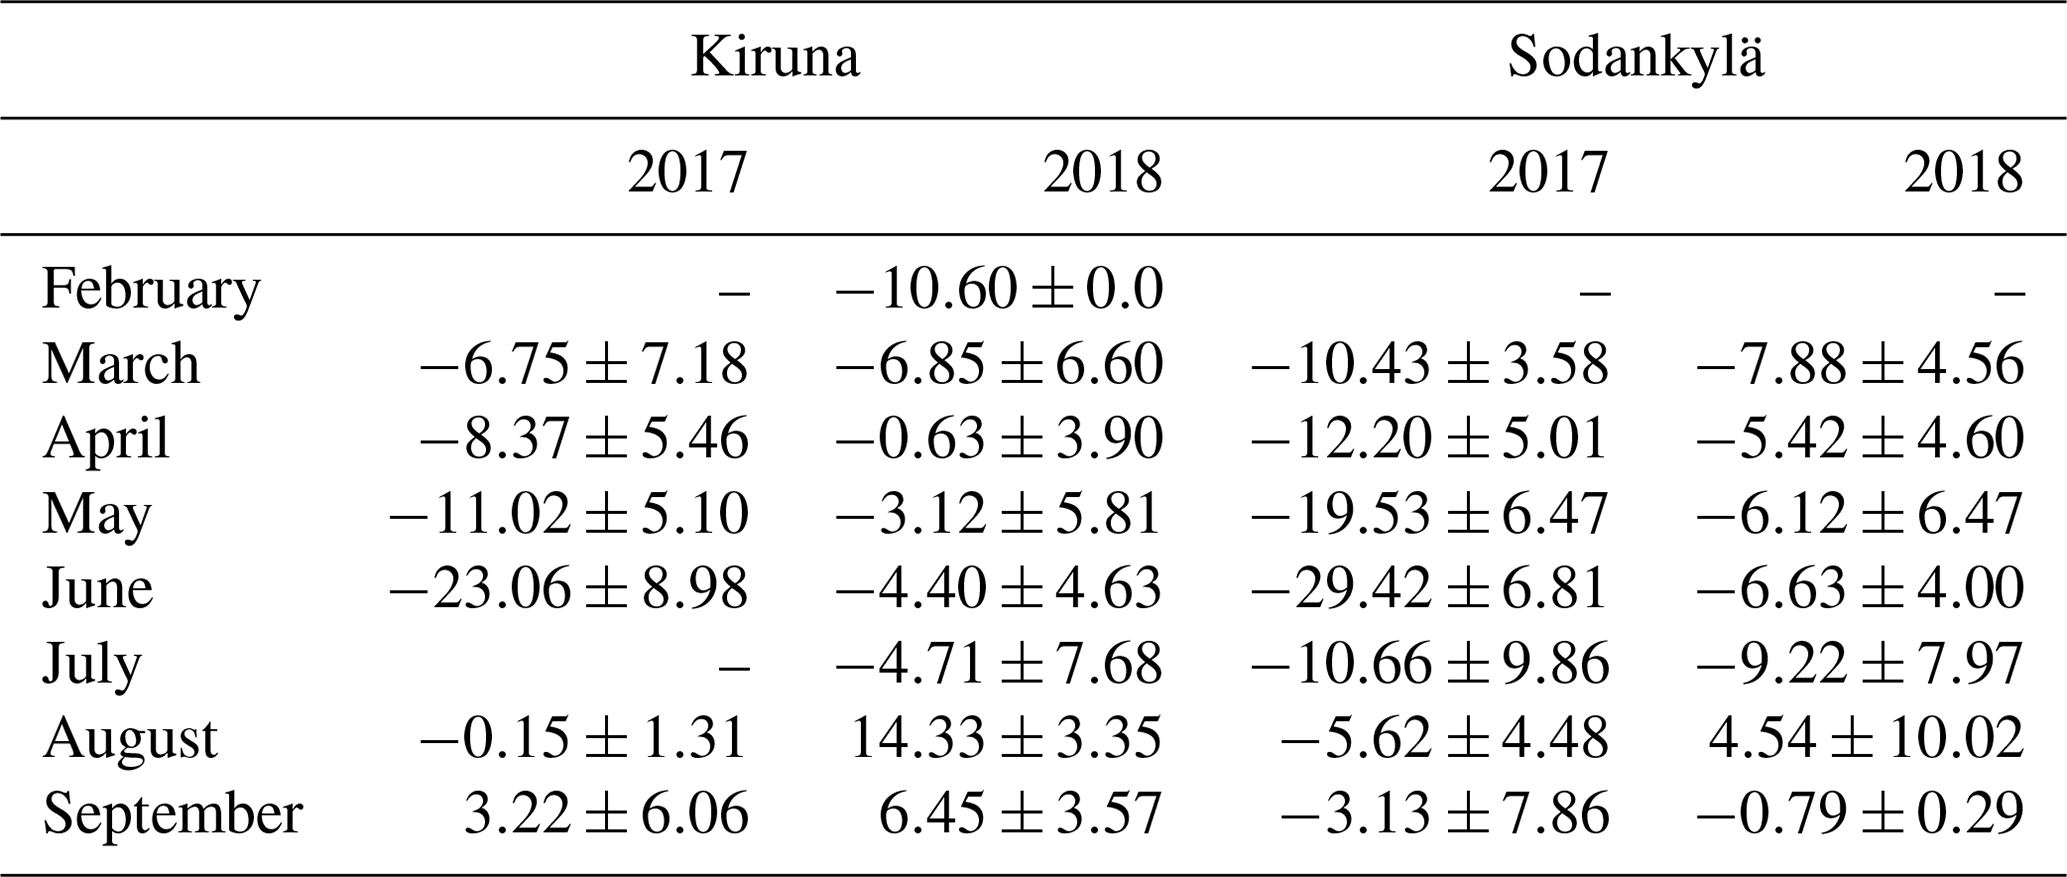
Table 2Monthly averaged difference and standard deviation of XCH4 (in ppb) between CAMS and COCCON-CAMS at two sites in 2017 and 2018.
3.1.3 Comparison of COCCON and TCCON datasets with different a priori profiles
When directly comparing the measurements of different remote sounders, it is necessary to account for differing observing system characteristics, particularly the a priori profiles used and the different sensitivity characteristics (Rodgers and Connor, 2003). In the following, we discuss the impact of the a priori profile choice.
Figure 5 shows the comparison of XCO2 and XCH4 between COCCON and co-located TCCON as a reference in Sodankylä in 2017 and 2018. Since the same a priori profiles are used, the differences between these two datasets are mainly from the different smoothing error characteristics. The partial column sensitivities of TCCON and COCCON are both imperfect and differ from each other. Exemplary averaging kernels are presented in Fig. 6. Therefore, we expect that a more realistic a priori profile will bring the results into better agreement. But it should be noted that the MAP profiles used in TCCON have their own advantages. It is much simpler to interpolate NCEP data than generating high-resolution model output from every TCCON location. Meanwhile, a high-resolution atmosphere model provides near-realistic profiles, reducing biases due to the smoothing error. The four left panels of Fig. 5 show results generated with the MAP a priori profiles, while the four right panels show the results achieved with the CAMS a priori profiles. To distinguish the COCCON and TCCON data processed with the MAP profiles, we use COCCON-CAMS and TCCON-CAMS to refer to the data processed with the a priori profiles derived from CAMS. The coincident data points are based on a 10 min average, and the error bars are presented with standard error of mean. Processed with the MAP profiles, COCCON and TCCON data show a generally good agreement in both XCO2 and XCH4. The COCCON instrument measures 0.74 ppm (±0.49 ppm) lower XCO2 and 0.17 ppb (±3.77 ppb) lower XCH4 on average than the TCCON retrievals in 2017. The XCO2 difference between COCCON and TCCON is slightly reduced in 2018, when COCCON retrievals are 0.57 ppm (±0.49 ppm) lower in XCO2. The difference in XCH4 between COCCON and TCCON triples in 2018 compared to that of the previous year, when COCCON measures a 0.57 ppb (±3.47 ppb) lower amount of XCH4. One reason for the change in XCH4 is because the obvious biases in April 2017, which increases the yearly averaged value of the COCCON XCH4.
When using CAMS profiles as the a priori information, COCCON-CAMS data show better correlations with TCCON-CAMS data compared to using MAP a priori profiles, especially in XCH4. This is mainly because CAMS profiles have better seasonal variations, especially for CH4. Significant biases in XCH4 in April 2017 and in March 2018 were found when using MAP a priori profiles, which is mainly caused by the polar vortex (see Fig. 4). The stratospheric subsidence was not included in the MAP profiles, resulting in high biases. However, these biases disappeared in the data comparison when using CAMS profiles, and the correlation improved due to the better modeled profile information from CAMS. Ostler et al. (2014) investigated the stratospheric subsidence caused by the influence of the polar vortex, and they found different impacts on mid-infrared and near-infrared retrievals because of the differing sensitivity, depending on the altitude, although the same a priori VMR profiles were used. Here, a similar mechanism is at work, the different sensitivities between TCCON and COCCON generate different smoothing errors. The more realistic CAMS a priori information reduces these discrepancies. The COCCON data discussed below are using the CAMS profiles as a priori profiles (COCCON-CAMS).
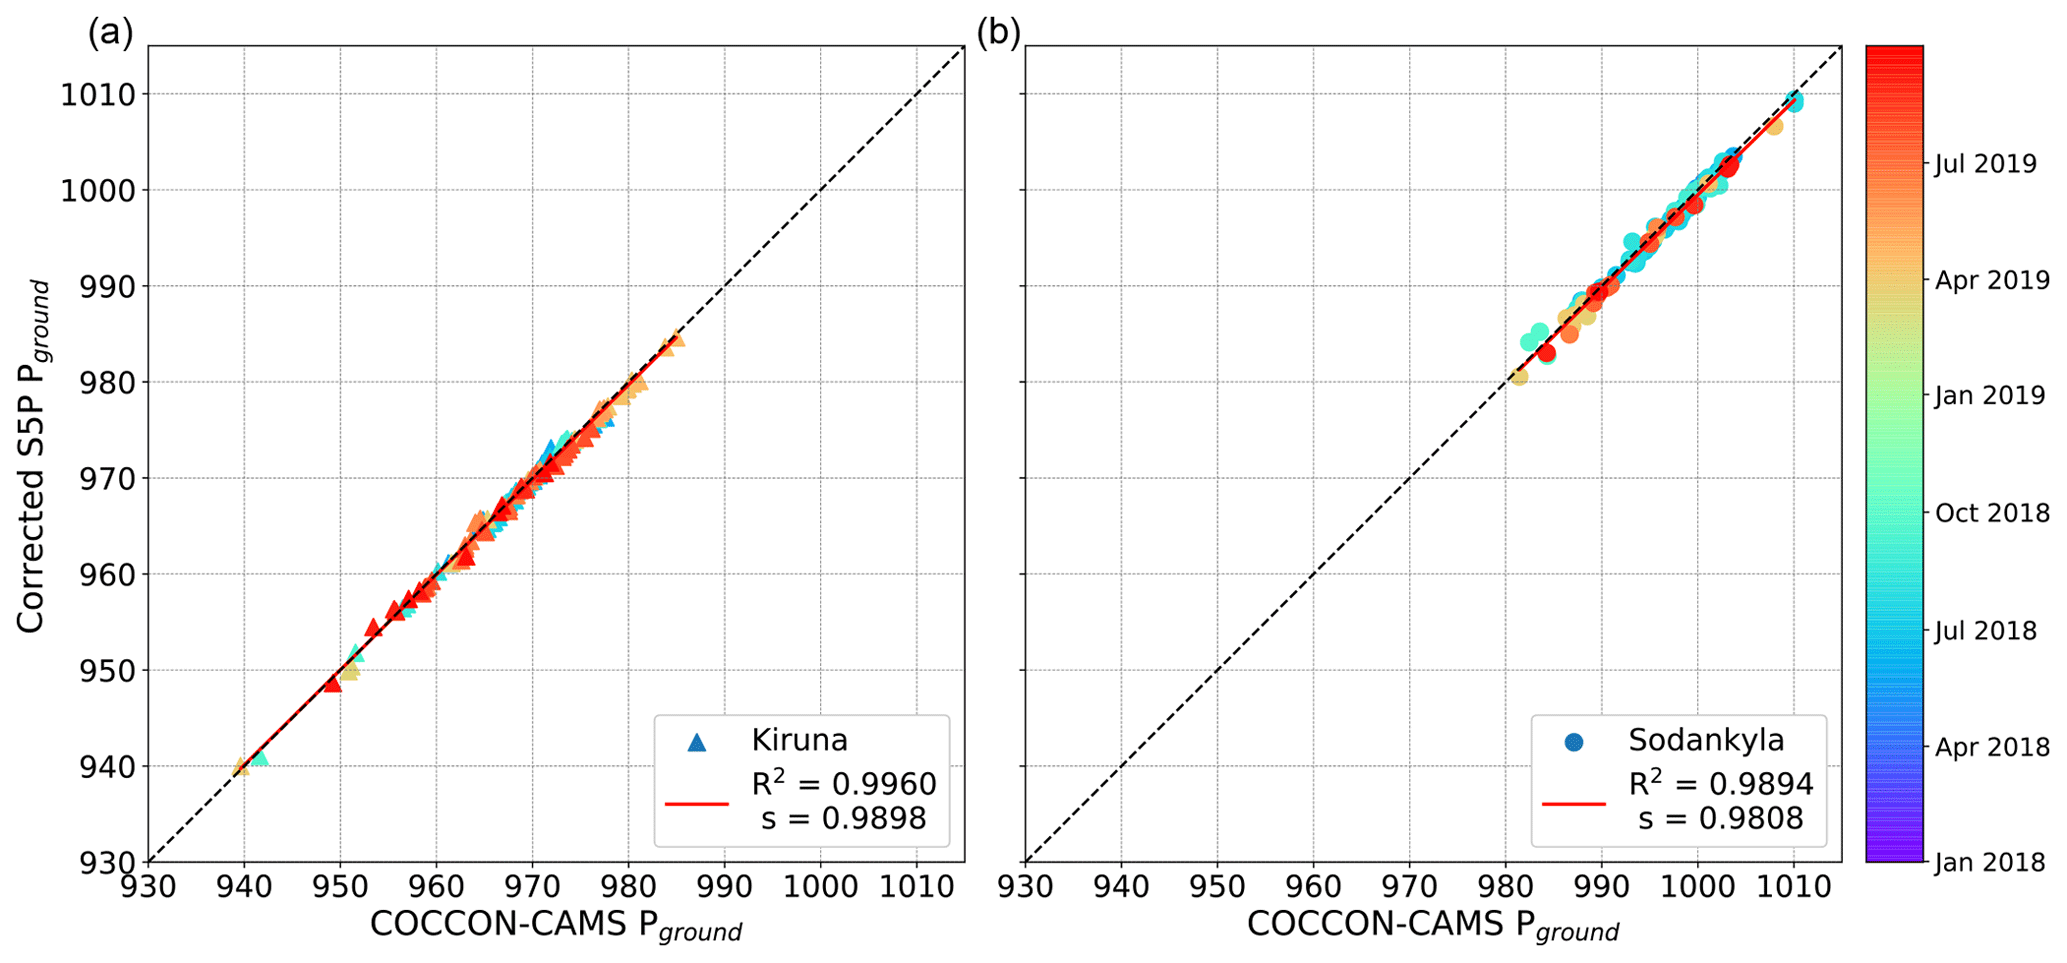
Figure 9Ground pressure comparison between S5P and COCCON at Kiruna (a) and Sodankylä (b). The S5P pressure is interpolated to the height of COCCON. Every point represents coincident S5P and COCCON measurements. The annotations follow those in Fig. 5. It is noted that the color bar starts from 2018 rather than 2017 to distinguish the data better.
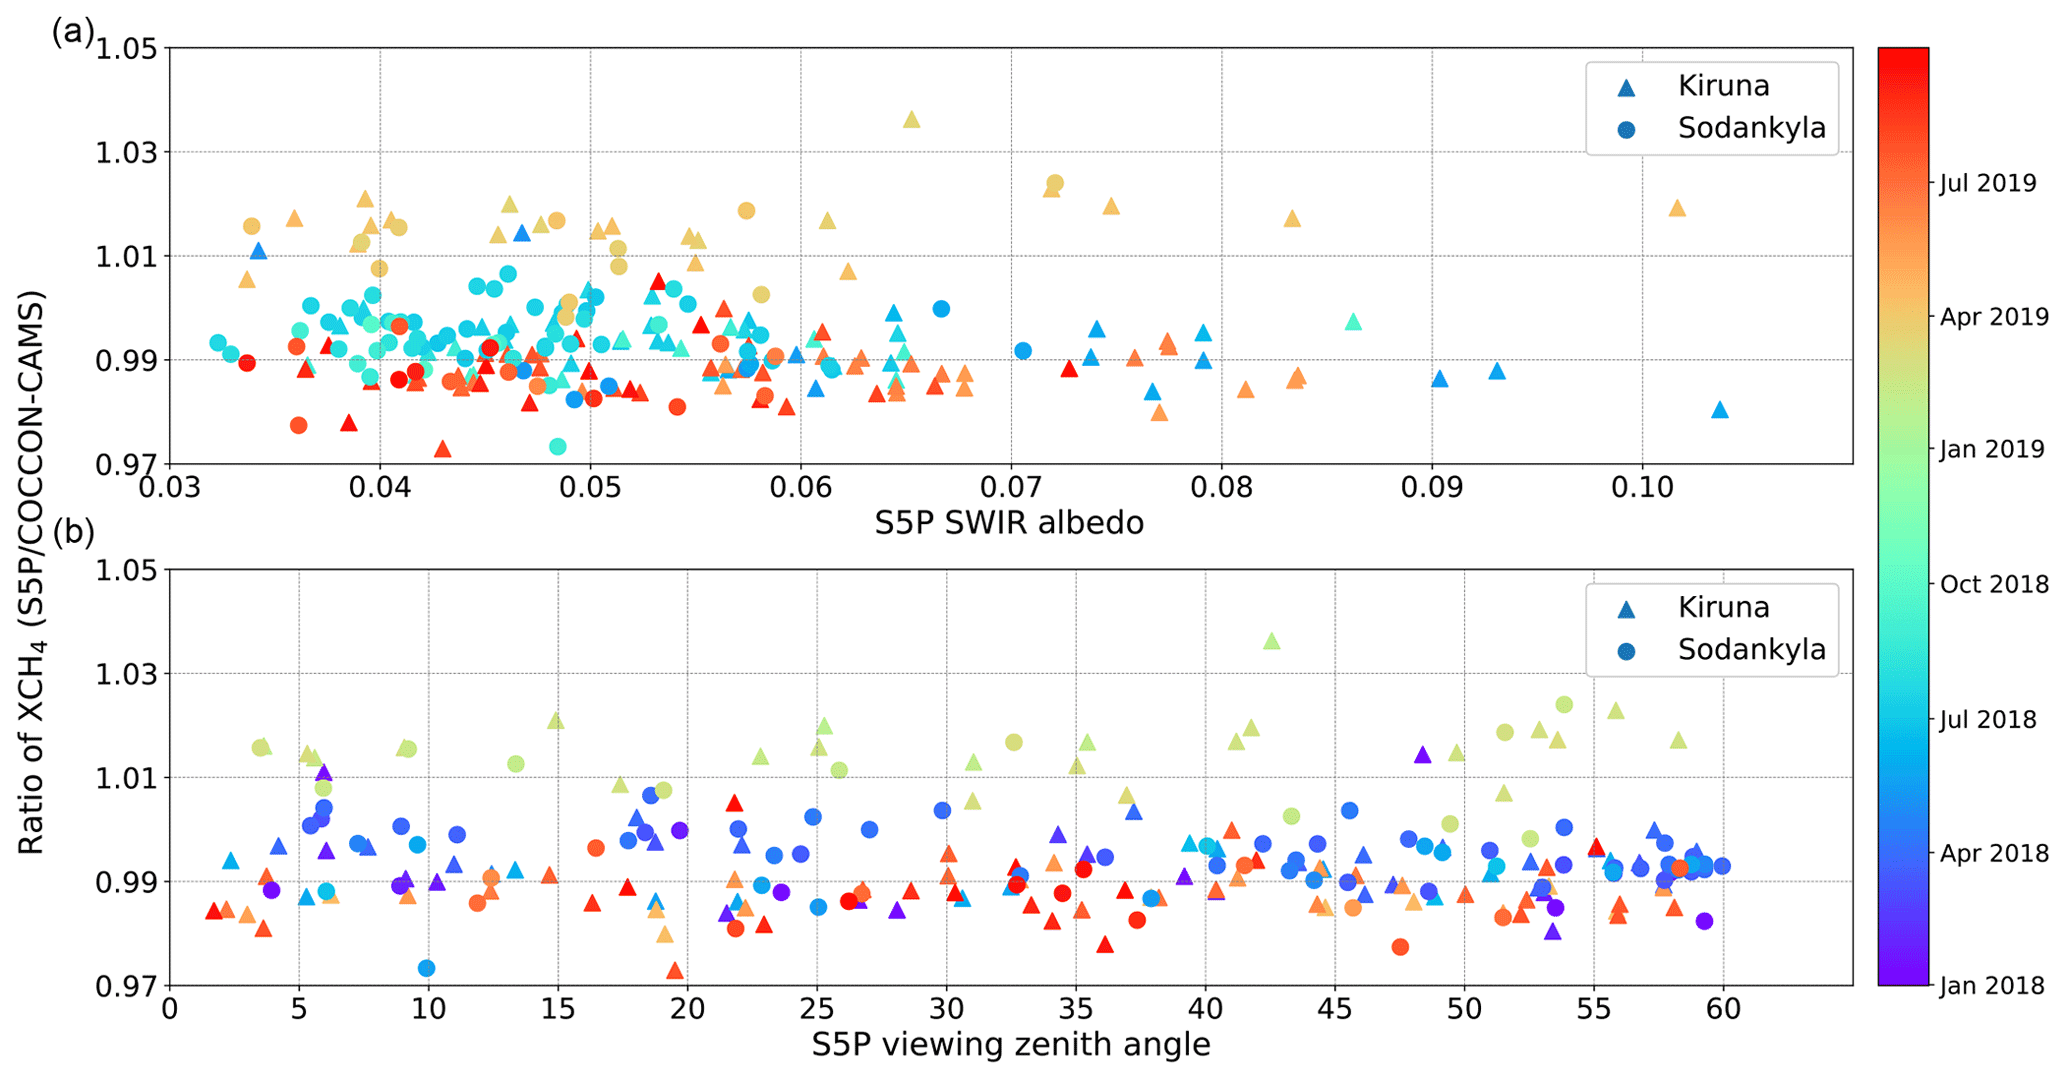
Figure 10The ratio of XCH4 (S5P divided by COCCON results) at two different sites as a function of albedo (a) and viewing zenith angle (b) from S5P. It is noted that the color bar starts from 2018 rather than 2017 to distinguish the data better.
3.2 Comparing COCCON observations with CAMS and S5P
3.2.1 XCO2
The XCO2 intercomparison between CAMS and COCCON retrievals at Kiruna (Fig. 7 left) and Sodankylä (Fig. 7 right) sites from 2017 to 2019 is shown in Fig. 7. COCCON retrievals (COCCON-CAMS) show a good and similar agreement with CAMS data at both sites with R2 values of 0.9530 in Kiruna and 0.9756 in Sodankylä. The CAMS data are biased high in comparison to COCCON-CAMS with a mean bias of 3.72 ppm and a standard deviation of 1.80 ppm in Kiruna and with a mean bias of 3.46 ppm and a standard deviation of 1.73 ppm in Sodankylä. (A summary of these statistics is listed in Table 1.) The increase in bias as a function of time can be clearly seen in Fig. 7. This is related to the CAMS model overestimation and is also reported by Christophe et al. (2019). The Orbiting Carbon Observatory 2 (OCO-2) satellite also provides global coverage of CO2 observations. The CO2 comparison between the OCO-2 satellite and the COCCON would be another subject of future work and is not shown here.
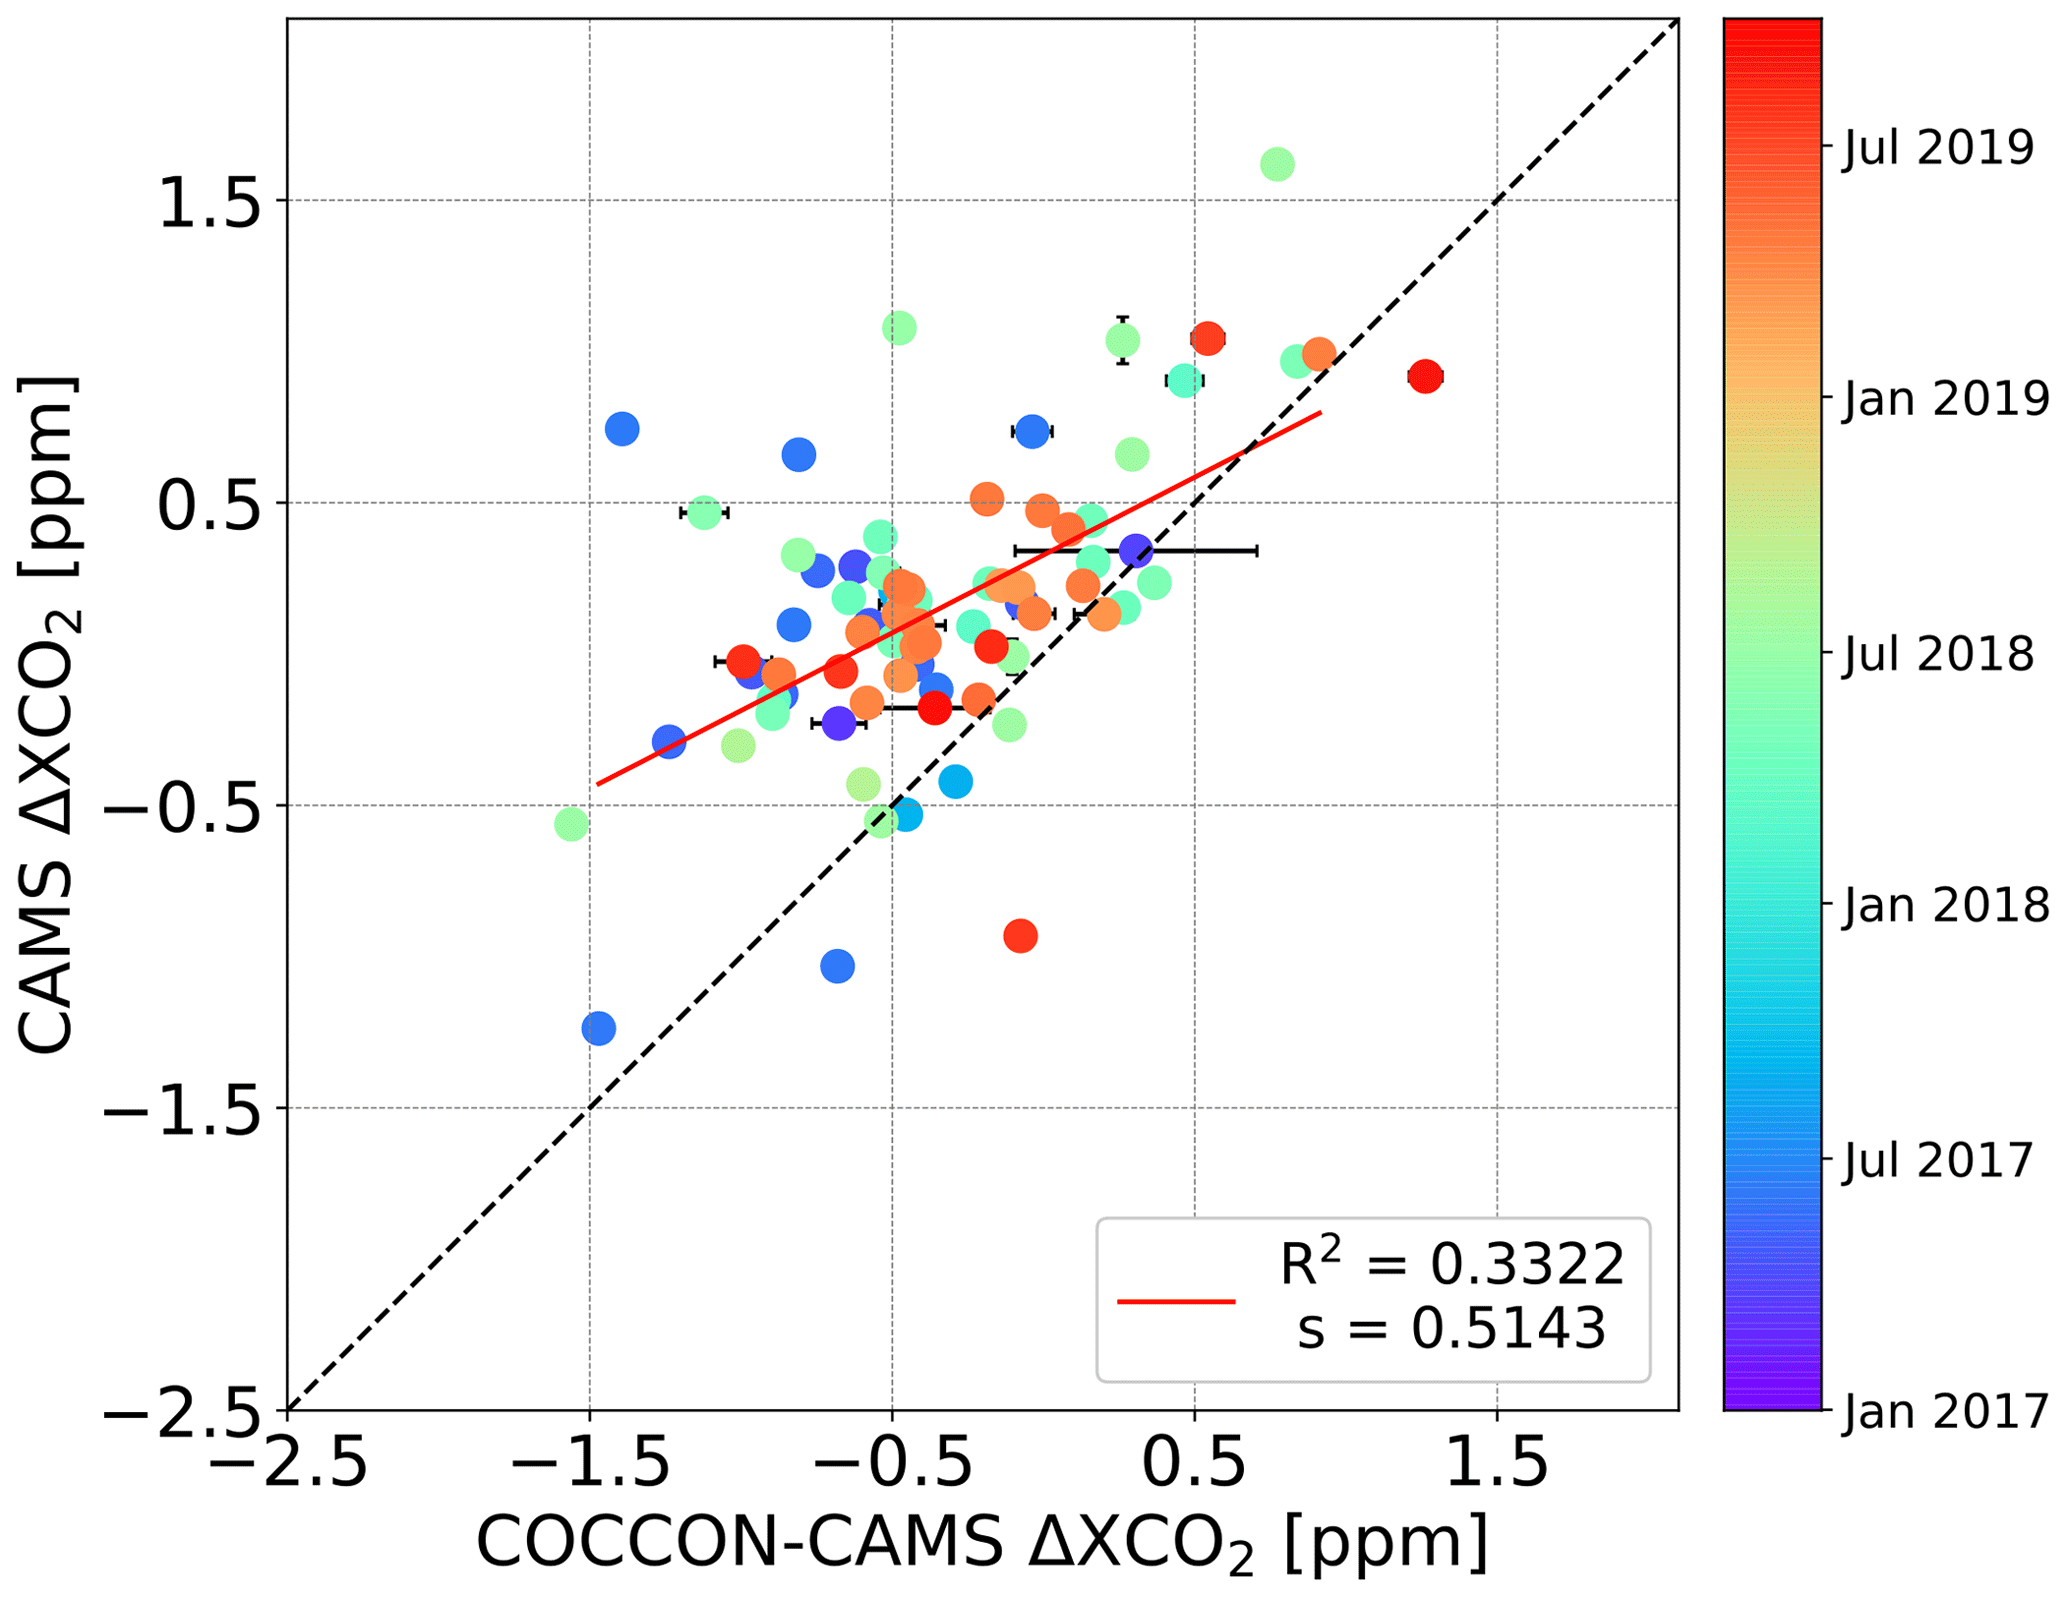
Figure 11Difference in XCO2 measured between Kiruna and Sodankylä. This plot is showing the comparison between CAMS and COCCON-CAMS. The annotations follow those in Fig. 5.
3.2.2 XCH4
The correlation of XCH4 between CAMS and COCCON-CAMS measurements is more scattered than that of XCO2 (see Fig. 8, upper panels). The R2 value decreased by nearly one-third to 0.6236 in Kiruna and by nearly half to 0.5292 in Sodankylä. CAMS data on average are biased high by about 0.33 ppb (±11.93 ppb) in Kiruna and 7.39 ppb (±10.92 ppb) in Sodankylä. The most significant high bias occurs at both sites from March to June 2017. Though CAMS profiles show better seasonal variability in CH4 compared to the MAP profiles, they are still not perfect compared to the realistic profiles, especially during a period of strong stratospheric subsidence (see Fig. 3, compared with AirCore profiles). These imperfect profile shapes of CAMS probably result in the high bias in March and April. The highest differences are found in June 2017 with 23.06 ppb in Kiruna and 29.42 ppb in Sodankylä. However, the much higher bias in June is more likely due to the bias from CAMS itself (as reported in Christophe et al., 2019), and it is not found when comparing COCCON and TCCON measurements for 2017. This is because the hydroxyl radical (OH) is the primary CH4 sink in the troposphere via oxidization (Lelieveld et al., 2016; Rigby et al., 2017), and its amount is generally higher in summer. Wang et al. (2020) evaluated the CAMS trace gases using aircraft observations and found an underestimation of OH concentrations in the Arctic. The underestimated concentrations of OH weaken the loss of CH4 concentration in the CAMS model, which contributes to a higher amount of CH4. The only exception is found in August 2018, when COCCON-CAMS measures 14.33 ppb higher XCH4 at Kiruna and 4.54 ppb higher at Sodankylä. Table 2 shows the monthly averaged difference in XCH4 between CAMS and COCCON-CAMS at both sites in 2017 and 2018.
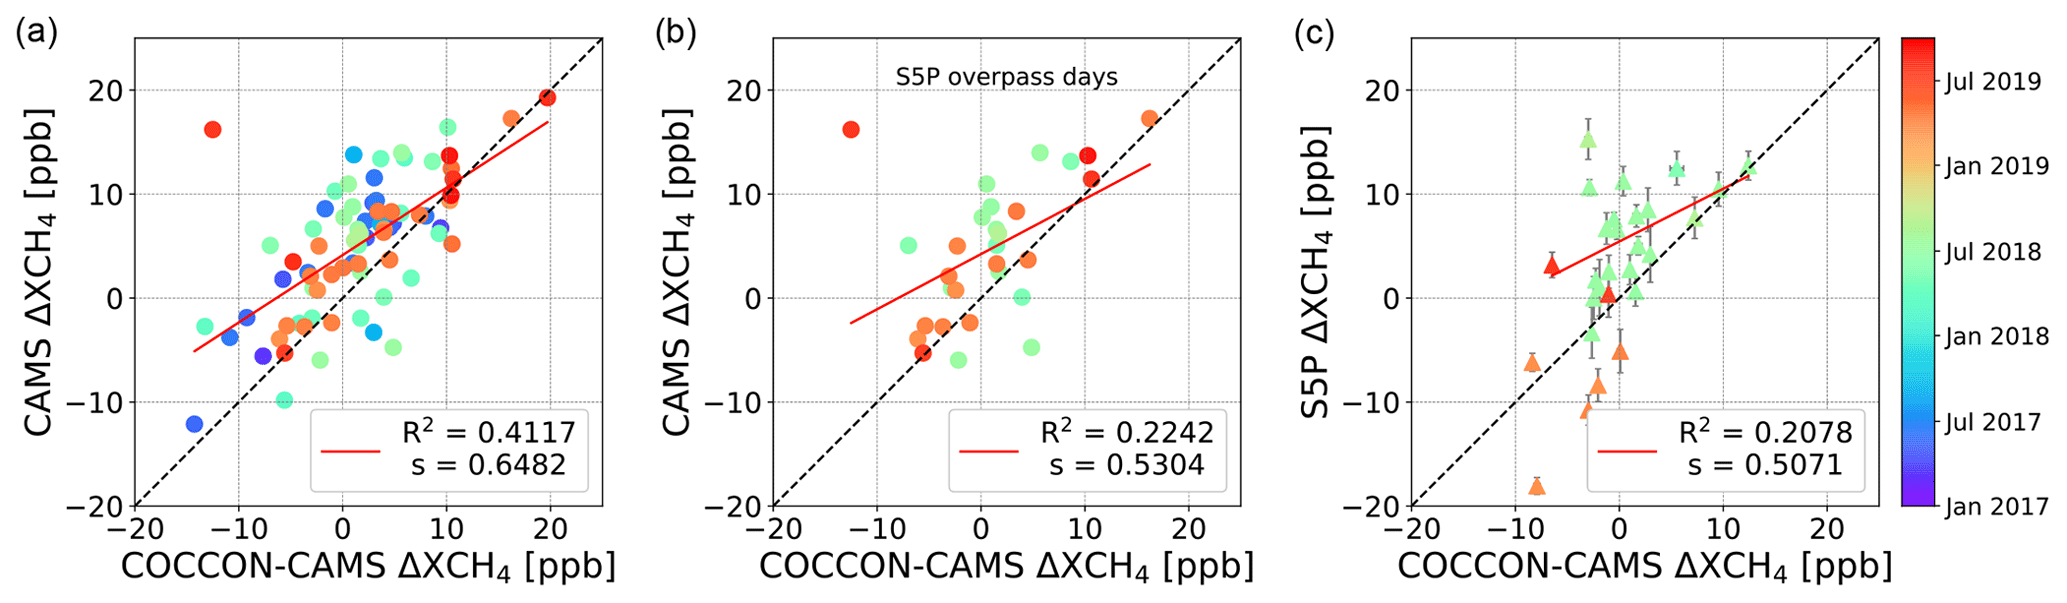
Figure 12Difference in XCH4 measured between Kiruna and Sodankylä. (a) Plot showing the comparison between CAMS and COCCON-CAMS. (b) Plot showing the comparison between CAMS and COCCON-CAMS during the S5P overpass days. (c) Plot showing the comparison between S5P and COCCON-CAMS. The annotations follow those in Fig. 5.
The comparison between S5P and COCCON-CAMS measurements shows a different situation, where the S5P satellite generally measures lower atmospheric XCH4 than COCCON-CAMS, with relative biases of −0.51 % in Kiruna and −0.47 % in Sodankylä. The S5P XCH4 observations have been validated with the measurements from TCCON by the S5P operational validation team, and S5P XCH4 exhibits a relative bias of −0.68 % with respect to the TCCON XCH4 values (Lambert et al., 2020). However, obvious biases are found in March and April 2019 (presented in yellow), when S5P measured higher XCH4. Excluding the measurements from these months, S5P measures 9.69 ppb (±20.51 ppb) lower XCH4 in Kiruna and 3.36 ppb (±17.05 ppb) lower in Sodankylä. Compared to the correlation between CAMS and COCCON-CAMS retrievals, the correlation between S5P and COCCON-CAMS measurements is poorer, and the values of R2 are nearly halved, with 0.2947 at the Kiruna site and 0.2909 at the Sodankylä site. The error bar represents the standard error of mean, caused by higher standard deviation and/or a smaller number of observations. Higher error bars are found at the Kiruna site, and this might be due to the more complex terrain where mountains are located to the west of Kiruna. For testing the resulting effects, we shifted the center of the coincidence area 50 km to the east to reduce the effects of mountains, but the higher scatters largely remain. This is further investigated by comparing the ground pressure derived from S5P to the values used by COCCON-CAMS. The altitude measured by S5P satellite ranges approximately from 220 to 960 m in the defined area around Kiruna, while it ranges only from 118 to 358 m in the Sodankylä area. When we interpolate the S5P pressure at the two sites to the altitude of two COCCON locations separately, the correlations at both sites show good agreement, and the R2 is 0.9960 at Kiruna and 0.9894 at Sodankylä (see Fig. 9).
3.2.3 Effects of albedo and viewing zenith angle on XCH4
The officially released S5P data also contain other parameters, such as albedo retrieved in the same SWIR region and viewing zenith angle (VZA). The sensitivities of the ratio of XCH4 (S5P measurements divided by COCCON) to albedo and VZA at each site are presented in Fig. 10. The albedo ranges from 0.03 to 0.10 in the period of May 2018–September 2019, showing no obvious effects on the ratio of XCH4. Both sites show similar situations with the average ratio of 0.9949±0.0118 at Kiruna and 0.9953±0.0089 at Sodankylä. The VZA of the S5P satellite changes approximately from 2 to 60∘ in the available time period. The sensitivity analysis shows that there are negligible changes in measuring XCH4 when VZA changes.
3.3 Comparison of gradient measurements at two sites between CAMS (or S5P) and COCCON-CAMS
To study the capability to measure the gradients of XCO2 (ΔXCO2) and XCH4 (ΔXCH4) on regional scales (between Kiruna and Sodankylä), the ΔXCO2 between CAMS and COCCON-CAMS is presented in Fig. 11, and the ΔXCH4 between CAMS and COCCON-CAMS and between S5P and COCCON-CAMS are presented in Fig. 12.
The ΔXCO2 comparison between CAMS and COCCON-CAMS shows a much poorer correlation (R2=0.3322) than the comparison of XCO2 between the two sites (R2=0.9643, mean value of both sites over the whole measurements), as to be expected: the ΔXCO2 signals are very small (on the order of 0.5 ppm). Still, a positive correlation in ΔXCO2 and similar amplitudes are found in CAMS and COCCON-CAMS data. If the comparison would be dominated either by horizontal smoothing effects due to the limited resolution of the model (which would reduce the spread along the y axis of Fig. 11) or by the uncertainties in the COCCON measurement (which would amplify the spread along the x axis of Fig. 11), the variability ranges would differ significantly.
For ΔXCH4, the comparison between CAMS and COCCON-CAMS measurements (Fig. 12a) shows a better correlation (R2=0.4117) than that between S5P and COCCON-CAMS (Fig. 12c). S5P results show higher scattering, resulting in a poorer correlation (R2=0.2078) with COCCON-CAMS. This nearly half difference is probably due to the smaller number of coincident measurements between S5P and COCCON. There are only 50 coincident measurements between S5P and COCCON in total, covering 17 d in 2018 and 16 d in 2019, while there are 86 coincident measurements between CAMS and COCCON in total, covering 17 d in 2017, 29 d in 2018, and 26 d in 2019. Figure 12b shows the agreement between CAMS and COCCON-CAMS for the subset of days with S5P observations. Appendix Table A2 lists the statistics of S5P data coincident with COCCON-CAMS data when S5P overpasses both sites in 1 d. The correlation in the restricted days is similar to the correlation between S5P and COCCON-CAMS. CAMS, COCCON, and S5P seem to be able to detect methane gradients on regional scales.
In this study, two COCCON instruments are used to perform multiyear measurements at Kiruna and Sodankylä. The instruments demonstrate useful performance and accuracy in measuring column-averaged greenhouse gas gradients on regional scales. We first compared the profiles derived from CAMS with the TCCON official profiles (MAP). For CO2 vertical profiles, both CAMS and MAP present similar seasonal variations, though CAMS profiles show higher vertical variability and more obvious seasonal changes over the whole time period of analysis. The main differences between them dominate in the troposphere, with a peak-to-peak variability of about 25 ppm. However, the CH4 profiles derived from CAMS show a significant seasonal change, especially in the stratosphere, while MAP estimates suggest less variability of CH4 profiles in the course of the year. The CH4 difference reaches up to 1 ppm at around 25 km height in April 2018. The AirCore balloon launches were performed as another main activity during the Finland campaign. CAMS profiles show a better agreement with the in situ measurements derived from AirCore launches than the official TCCON MAP a priori profiles. CAMS especially presents better profiles for CH4 in April, while the MAP profiles do not show the stratospheric subsidence caused by the polar vortex.
MAP and CAMS profiles are used as a priori information in processing COCCON and TCCON data at the Sodankylä and Kiruna sites. The correlation between COCCON data (COCCON-CAMS) and TCCON data (TCCON-CAMS) improved for both XCO2 and XCH4 when using CAMS a priori profiles. R2 increased to 0.9925 in 2017 and 0.9863 in 2018 for XCO2 and 0.9708 in 2017 and 0.9635 in 2018 for XCH4. The obvious biases in April 2017 when comparing COCCON to the TCCON data (using MAP profiles) are mainly caused by the polar vortex. However, these outliers disappeared from the data comparison when data are processed with CAMS profiles. Different instruments show different sensitivities to the a priori profiles, and the CAMS profiles might be a good choice to improve the data accuracy.
We also compared XCO2 and XCH4 between COCCON-CAMS and CAMS as well as XCH4 between COCCON-CAMS and the S5P satellite in Kiruna and Sodankylä. The XCO2 comparisons between COCCON-CAMS and CAMS at both sites show good agreements. For Kiruna, there was a mean bias of 3.72 ppm, standard deviation of 1.80 ppm, and R2 of 0.9530. For Sodankylä, there was a mean bias of 3.46 ppm, standard deviation of 1.73 ppm, and R2 of 0.9756. The correlations for XCH4 between COCCON-CAMS and CAMS are relatively poorer than the XCO2 correlations, with R2 values of 0.6236 in Kiruna and 0.4673 in Sodankylä. CAMS mostly overestimated XCH4 in comparison to COCCON-CAMS (approximately 0.33 ppb (±11.93 ppb) higher XCH4 in Kiruna and 7.39 ppb (±10.92 ppb) higher XCH4 in Sodankylä). In contrast, the S5P satellite generally measures lower atmospheric XCH4 than COCCON-CAMS. For Kiruna, there was a mean bias of 9.69 ppb, standard deviation of 20.51 ppb, and R2 of 0.2947. For Sodankylä, there was a mean bias of 3.36 ppb, standard deviation of 17.05 ppb, and R2 of 0.2909. In addition, no obvious variability is found when albedo and viewing zenith angle of S5P changes.
When studying the possibility of measuring gradients of XCO2 and XCH4 for the region between Kiruna and Sodankylä, we compared the COCCON-CAMS results with CAMS and S5P (only for XCH4). For ΔXCO2, CAMS shows higher values and has a R2 value of 0.3322. For ΔXCH4, COCCON-CAMS shows a better correlation with the CAMS (slope = 0.6482, R2=0.4117) than with the S5P (slope = 0.5791, R2=0.2078). When limiting the COCCON-CAMS and CAMS data to the S5P overpass days, the correlation of ΔXCH4 between them decreased (slope = 0.5304, R2=0.2242) and is close to the correlation between S5P and COCCON-CAMS. The lower correlation between COCCON-CAMS and S5P results is probably due to the smaller dataset. COCCON observations can be used for the quantification of sources and sinks of greenhouse gases and for the validation of spaceborne observations. To our knowledge, this is the first published study using COCCON spectrometers for the validation of XCH4 measurements collected by S5P.
Table A1The statistics of S5P data coincident with COCCON data when S5P overpassed both sites in 1 d. The error indicates the standard error of mean.
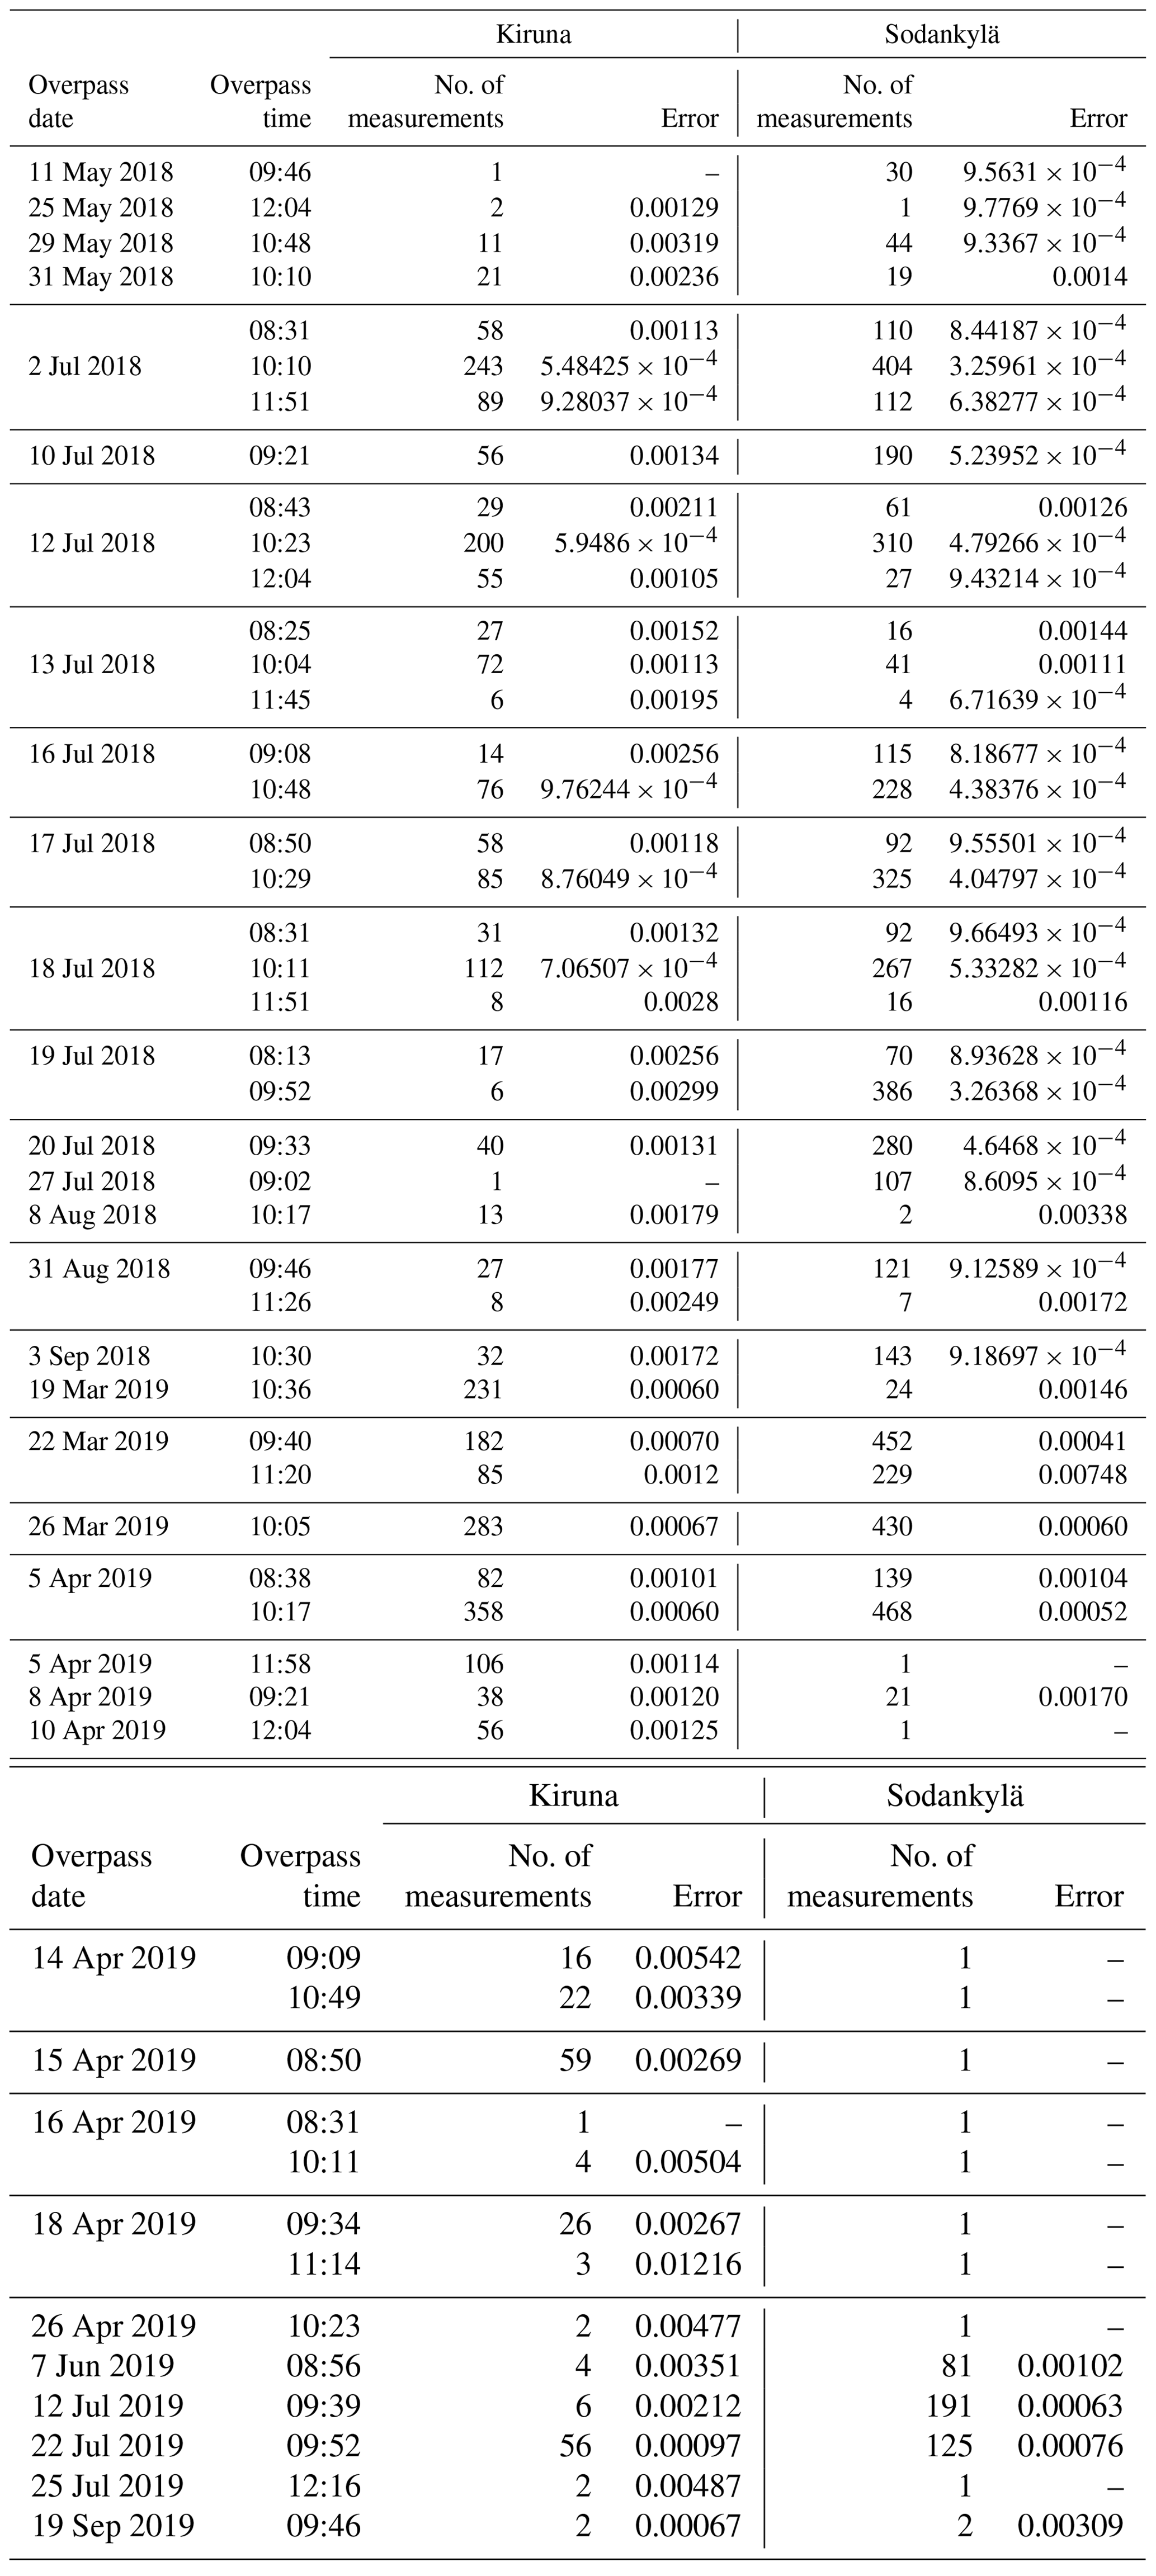
Table A2The dates and the start and end of sampling times of AirCore flights performed in 2017 and 2018 at the Sodankylä site.
The data are accessible by contacting the corresponding author (qiansi.tu@kit.edu). The S5P dataset is publicly available from https://scihub.copernicus.eu/ (last access: 1 September 2020; ESA, 2020). The access and use of any Copernicus Sentinel data available through the Copernicus Open Access Hub are governed by the legal notice on the use of Copernicus Sentinel Data and Service Information, which is given here: https://sentinels.copernicus.eu/documents/247904/690755/Sentinel_Data_Legal_Notice (last access: 1 September 2020; European Commission, 2020). The Aura/MLS dataset is publicly available from https://disc.gsfc.nasa.gov/datasets/ML2N2O_004/summary (last access: 1 September 2020; Lambert et al., 2015).
FH, TB, and QT developed the research question. QT wrote the article and performed the data analysis with support from FH, TB, and MKS. QT, TB, PH, RK, and UR took an active part in the field campaign by operating the COCCON spectrometers and collecting data. RK and PH also operated the TCCON station at the Sodankylä site and provided data. JL, AL, and TB offered technical support in analyzing S5P satellite data. HC and RK provided the AirCore data. JC's group developed the automated enclosure and the protection system for the EM27/SUN instruments. JC and FD offered technical support for the enclosure of the COCCON instrument during the campaign. All authors discussed the results and contributed to the final article.
The authors declare that they have no conflict of interest.
This article is part of the special issue “TROPOMI on Sentinel-5 Precursor: first year in operation (AMT/ACP inter-journal SI)”. It is not associated with a conference.
We thank Xiaobo Yang in the Copernicus User Support Team at ECMWF for providing the CAMS model data, which were generated using Copernicus Atmosphere Monitoring Service (2017–2019) information. We also thank Anna Agustí-Panareda, Michela Giusti, and Anabelle Guillory in the Copernicus User Support Team for providing comments about the CAMS model data. We would like to thank the MLS team for providing the N2O data and Farahnaz Khosrawi for producing the N2O figures. The work presented here overlaps with the Fiducial Reference Measurements for Ground-Based Infrared Greenhouse Gas Observations (FRM4GHG) project funded by European Space Agency under the grant agreement number ESA-IPL-POE-LG-cl-LE-2015-1129. We also acknowledge ESA support through the COCCON-PROCEEDS project. The AirCore launches are partly supported by the EU RINGO project. Jia Chen and Florian Dietrich acknowledge funding by Technische Universität München – Institute for Advanced Study, which is funded by the German Excellence Initiative; the European Union Seventh Framework Programme under grant agreement no. 291763; and the DFG (Deutsche Forschungsgemeinschaft) under grant no. 419317138. The article processing charges for this open-access publication were covered by a Research Centre of the Helmholtz Association.
The article processing charges for this open-access publication were covered by a Research Centre of the Helmholtz Association.
This paper was edited by Helen Worden and reviewed by two anonymous referees.
Agustí-Panareda, A., Massart, S., Chevallier, F., Boussetta, S., Balsamo, G., Beljaars, A., Ciais, P., Deutscher, N. M., Engelen, R., Jones, L., Kivi, R., Paris, J.-D., Peuch, V.-H., Sherlock, V., Vermeulen, A. T., Wennberg, P. O., and Wunch, D.: Forecasting global atmospheric CO2, Atmos. Chem. Phys., 14, 11959–11983, https://doi.org/10.5194/acp-14-11959-2014, 2014.
Apituley, A., Pedergnana, M., Sneep, M., Veefkind, J. P., Loyola, D., and Hasekamp, O.: Sentinel-5 precursor/TROPOMI Level 2 Product User Manual Methane, source: SRON/KNMI, ref: SRON-S5P-LEV2-MA-001, issue: 0.11.6, available at: https://sentinel.esa.int/documents/247904/2474726/Sentinel-5P-Level-2-Product-User-Manual-Methane (last access: 25 July 2020), 2017.
Bovensmann, H., Burrows, J. P., Buchwitz, M., Frerick, J., Noel, S., Rozanov, V. V., Chance, K. V., and Goede, A. P. H.: SCIAMACHY: mission objectives and measurement modes, J. Atmos. Sci., 56, 127–150, https://doi.org/10.1175/1520-0469(1999)056<0127:SMOAMM>2.0.CO;2, 1999.
Butz, A., Galli, A., Hasekamp, O., Landgraf, J., Tol, P., and Aben, I.: TROPOMI aboard Sentinel-5 Precursor: Prospective performance of CH4 retrievals for aerosol and cirrus loaded atmospheres, Remote Sens. Environ., 120, 267–276, https://doi.org/10.1016/j.rse.2011.05.030, 2012.
Butz, A., Dinger, A. S., Bobrowski, N., Kostinek, J., Fieber, L., Fischerkeller, C., Giuffrida, G. B., Hase, F., Klappenbach, F., Kuhn, J., Lübcke, P., Tirpitz, L., and Tu, Q.: Remote sensing of volcanic CO2, HF, HCl, SO2, and BrO in the downwind plume of Mt. Etna, Atmos. Meas. Tech., 10, 1–14, https://doi.org/10.5194/amt-10-1-2017, 2017.
Chen, J., Viatte, C., Hedelius, J. K., Jones, T., Franklin, J. E., Parker, H., Gottlieb, E. W., Wennberg, P. O., Dubey, M. K., and Wofsy, S. C.: Differential column measurements using compact solar-tracking spectrometers, Atmos. Chem. Phys., 16, 8479–8498, https://doi.org/10.5194/acp-16-8479-2016, 2016.
Christophe, Y., Ramonet, M., Wagner, A., Schulz, M., Eskes, H. J., Basart, S., Benedictow, A., Bennouna, Y., Blechschmidt, A.-M., Chabrillat, S., Cuevas, E., El-Yazidi, A., Flentje, H., Hansen, K. M., Im, U., Kapsomenakis, J., Langerock, B., Richter, A., Sudarchikova, N., Thouret, V., Warneke, T., and Zerefos, C.: Validation report of the CAMS near-real-time global atmospheric composition service: Period March–May 2019, Copernicus Atmosphere Monitoring Service (CAMS) report, September 2019, https://doi.org/10.24380/1t4q-1h53, 2019.
Dietrich, F. and Chen, J.: Portable Automated Enclosure for a Spectrometer Measuring Greenhouse Gases, Geophys. Res. Abst., Vol. 20, EGU2018-16281-1, https://doi.org/10.13140/RG.2.2.11591.14248, 2018.
ESA: Welcome to the Copernicus Open Access Hub, available at: https://scihub.copernicus.eu/, last access: 1 September 2020.
European Commission: Legal notice on the use of Copernicus Sentinel Data and Service Information, available at: https://sentinels.copernicus.eu/documents/247904/690755/Sentinel_Data_Legal_Notice, last access: 1 September 2020.
Frey, M., Hase, F., Blumenstock, T., Groß, J., Kiel, M., Mengistu Tsidu, G., Schäfer, K., Sha, M. K., and Orphal, J.: Calibration and instrumental line shape characterization of a set of portable FTIR spectrometers for detecting greenhouse gas emissions, Atmos. Meas. Tech., 8, 3047–3057, https://doi.org/10.5194/amt-8-3047-2015, 2015.
Frey, M., Sha, M. K., Hase, F., Kiel, M., Blumenstock, T., Harig, R., Surawicz, G., Deutscher, N. M., Shiomi, K., Franklin, J. E., Bösch, H., Chen, J., Grutter, M., Ohyama, H., Sun, Y., Butz, A., Mengistu Tsidu, G., Ene, D., Wunch, D., Cao, Z., Garcia, O., Ramonet, M., Vogel, F., and Orphal, J.: Building the COllaborative Carbon Column Observing Network (COCCON): long-term stability and ensemble performance of the EM27/SUN Fourier transform spectrometer, Atmos. Meas. Tech., 12, 1513–1530, https://doi.org/10.5194/amt-12-1513-2019, 2019.
Gisi, M., Hase, F., Dohe, S., Blumenstock, T., Simon, A., and Keens, A.: XCO2-measurements with a tabletop FTS using solar absorption spectroscopy, Atmos. Meas. Tech., 5, 2969–2980, https://doi.org/10.5194/amt-5-2969-2012, 2012.
GLOBALVIEW-CO2: Cooperative Atmospheric Data Integration Project – Carbon Dioxide, CD-ROM, NOAA GMD, Boulder, Colorado, 2006.
Hase, F., Blumenstock, T., and Paton-Walsh, C.: Analysis of the instrumental line shape of high-resolution fourier transform IR spectrometers with gas cell measurements and new retrieval software, Appl. Opt., 38, 3417–3422, https://doi.org/10.1364/AO.38.003417, 1999.
Hase, F., Hannigan, J. W., Coffey, M. T., Goldman, A., Höpfner, M., Jones, N. B., Rinsland, C. P., and Wood, S. W.: Intercomparison of retrieval codes used for the analysis of high-resolution, ground-based FTIR measurements, J. Quant. Spec. Rad. Trans., 87, 25–52, 2004.
Hedelius, J. K., Viatte, C., Wunch, D., Roehl, C. M., Toon, G. C., Chen, J., Jones, T., Wofsy, S. C., Franklin, J. E., Parker, H., Dubey, M. K., and Wennberg, P. O.: Assessment of errors and biases in retrievals of XCO2, XCH4, XCO, and XN2O from a 0.5 cm−1 resolution solar-viewing spectrometer, Atmos. Meas. Tech., 9, 3527–3546, https://doi.org/10.5194/amt-9-3527-2016, 2016.
Heinle, L. and Chen, J.: Automated enclosure and protection system for compact solar-tracking spectrometers, Atmos. Meas. Tech., 11, 2173–2185, https://doi.org/10.5194/amt-11-2173-2018, 2018.
Hu, H., Landgraf, J., Detmers, R., Borsdorff, T., Brugh, J. A. D., Aben, I., Butz, A., and Hasekamp, O.: Toward Global Mapping of Methane With TROPOMI: First Results and Intersatellite Comparison to GOSAT, Geophys. Res. Lett., 45, 3682–3689, https://doi.org/10.1002/2018GL077259, 2018.
Inness, A., Ades, M., Agustí-Panareda, A., Barré, J., Benedictow, A., Blechschmidt, A.-M., Dominguez, J. J., Engelen, R., Eskes, H., Flemming, J., Huijnen, V., Jones, L., Kipling, Z., Massart, S., Parrington, M., Peuch, V.-H., Razinger, M., Remy, S., Schulz, M., and Suttie, M.: The CAMS reanalysis of atmospheric composition, Atmos. Chem. Phys., 19, 3515–3556, https://doi.org/10.5194/acp-19-3515-2019, 2019.
Jacobs, N., Simpson, W. R., Wunch, D., O'Dell, C. W., Osterman, G. B., Hase, F., Blumenstock, T., Tu, Q., Frey, M., Dubey, M. K., Parker, H. A., Kivi, R., and Heikkinen, P.: Quality controls, bias, and seasonality of CO2 columns in the Boreal Forest with OCO-2, TCCON, and EM27/SUN measurements, Atmos. Meas. Tech. Discuss., https://doi.org/10.5194/amt-2019-505, in review, 2020.
Jiang, X., Kao, A., Corbett, A., Olsen, E., Pagano, T., Zhai, A., Newman, S., Li, L., and Yung, Y.: Influence of Droughts on Mid-Tropospheric CO2, Remote Sens., 9, 852, https://doi.org/10.3390/rs9080852, 2017.
Karion, A., Sweeney, C., Tans, P., and Newberger, T.: Air-Core: An Innovative Atmospheric Sampling System, J. Atmos. Ocean. Technol., 27, 1839–1853, https://doi.org/10.1175/2010JTECHA1448.1, 2010.
Kille, N., Chiu, R., Frey, M., Hase, F., Sha, M. K., Blumenstock, T., Hannigan, J. W., Orphal, J., Bon, D., and Voklamer, R.: Separation of methane emissions from agricultural and natural gas sources in the Colorado Front Range, Geophys. Res. Lett., 46, 3990–3998, https://doi.org/10.1029/2019GL082132, 2019.
Kivi, R. and Heikkinen, P.: Fourier transform spectrometer measurements of column CO2 at Sodankylä, Finland, Geosci. Instrum. Method. Data Syst., 5, 271–279, https://doi.org/10.5194/gi-5-271-2016, 2016.
Klappenbach, F., Bertleff, M., Kostinek, J., Hase, F., Blumenstock, T., Agusti-Panareda, A., Razinger, M., and Butz, A.: Accurate mobile remote sensing of XCO2 and XCH4 latitudinal transects from aboard a research vessel, Atmos. Meas. Tech., 8, 5023–5038, https://doi.org/10.5194/amt-8-5023-2015, 2015.
Lambert, A., Livesey, N., and Read, W.: MLS/Aura Level 2 Nitrous Oxide (N2O) Mixing Ratio V004, Greenbelt, MD, USA, Goddard Earth Sciences Data and Information Services Center (GES DISC), https://doi.org/10.5067/Aura/MLS/DATA2016), 2015.
Lambert, J.-C., Keppens, A., Hubert, D., Langerock, B., Eichmann, K.-U., Kleipool, Q., Sneep, M., Verhoelst, T., Wagner, T., Weber, M., Ahn, C., Argyrouli, A., Balis, D., Chan, K. L., Compernolle, S., De Smedt, I., Eskes, H., Fjæraa, A. M., Garane, K., Gleason, J. F., Goutail, F., Granville, J., Hedelt, P., Heue, K.-P., Jaross, G., Koukouli, M.-L., Landgraf, J., Lutz, R., Niemejer, S., Pazmiño, A., Pinardi, G., Pommereau, J.-P., Richter, A., Rozemeijer, N., Sha, M. K., Stein Zweers, D., Theys, N., Tilstra, G., Torres, O., Valks, P., Vigouroux, C., and Wang, P.: Quarterly Validation Report of the Copernicus Sentinel-5 Precursor Operational Data Products, #05: April 2018–November 2019, S5P MPC Routine Operations Consolidated Validation Report series, Issue #05, Version 05.0.1, 151 pp., December 2019, available at: http://www.tropomi.eu/sites/default/files/files/publicS5P-MPC-IASB-ROCVR-03.0.1-20190621_FINAL.pdf (last access: 29 June 2020), 2019.
Lambert, J.-C., Compernolle, S., Eichmann, K.-U., de Graaf, M., Hubert, D., Keppens, A., Kleipool, Q., Langerock, B., Sha, M.K., Verhoelst, T., Wagner, T., Ahn, C., Argyrouli, A., Balis, D., Chan, K. L., De Smedt, I., Eskes, H., Fjæraa, A. M., Garane, K., Gleason, J.F., Goutail, F., Granville, J., Hedelt, P., Heue, K.-P., Jaross, G., Koukouli, M. L., Landgraf, J., Lutz, R., Nanda, S., Niemejer, S., Pazmiño, A., Pinardi, G., Pommereau, J.-P., Richter, A., Rozemeijer, N., Sneep, M., Stein Zweers, D., Theys, N., Tilstra, G., Torres, O., Valks, P., Vigouroux, C., Wang, P., and Weber, M.: Quarterly Validation Report of the Copernicus Sentinel-5 Precursor Operational Data Products #06: April 2018–February 2020., S5P MPC Routine Operations Consolidated Validation Report series, Issue #06, Version 06.0.1, 154 pp., available at: http://www.tropomi.eu/sites/default/files/files/publicS5P-MPC-IASB-ROCVR-06.0.1-20200330_FINAL.pdf, last access: 29 June 2020.
Lelieveld, J., Gromov, S., Pozzer, A., and Taraborrelli, D.: Global tropospheric hydroxyl distribution, budget and reactivity, Atmos. Chem. Phys., 16, 12477–12493, https://doi.org/10.5194/acp-16-12477-2016, 2016.
Loewenstein, M., Podolske, J. R., Chan, K. R., and Strahan, S. E.: N2O as a dynamical tracer in the Arctic vortex, Geophys. Res. Lett., 17, 477–480, 1990.
Luther, A., Kleinschek, R., Scheidweiler, L., Defratyka, S., Stanisavljevic, M., Forstmaier, A., Dandocsi, A., Wolff, S., Dubravica, D., Wildmann, N., Kostinek, J., Jöckel, P., Nickl, A.-L., Klausner, T., Hase, F., Frey, M., Chen, J., Dietrich, F., Nȩcki, J., Swolkień, J., Fix, A., Roiger, A., and Butz, A.: Quantifying CH4 emissions from hard coal mines using mobile sun-viewing Fourier transform spectrometry, Atmos. Meas. Tech., 12, 5217–5230, https://doi.org/10.5194/amt-12-5217-2019, 2019.
Massart, S., Agusti-Panareda, A., Aben, I., Butz, A., Chevallier, F., Crevoisier, C., Engelen, R., Frankenberg, C., and Hasekamp, O.: Assimilation of atmospheric methane products into the MACC-II system: from SCIAMACHY to TANSO and IASI, Atmos. Chem. Phys., 14, 6139–6158, https://doi.org/10.5194/acp-14-6139-2014, 2014.
Massart, S., Agustí-Panareda, A., Heymann, J., Buchwitz, M., Chevallier, F., Reuter, M., Hilker, M., Burrows, J. P., Deutscher, N. M., Feist, D. G., Hase, F., Sussmann, R., Desmet, F., Dubey, M. K., Griffith, D. W. T., Kivi, R., Petri, C., Schneider, M., and Velazco, V. A.: Ability of the 4-D-Var analysis of the GOSAT BESD XCO2 retrievals to characterize atmospheric CO2 at large and synoptic scales, Atmos. Chem. Phys., 16, 1653–1671, https://doi.org/10.5194/acp-16-1653-2016, 2016.
Myhre, G., Shindell, D., Bréon, F.-M., Collins, W., Fuglestvedt, J., Huang, J., Koch, D., Lamarque, J.-F., Lee, D., Mendoza, B., and Nakajima, T.: Anthropogenic and natural radiative forcing, Clim. Change, 423, 658–640, 2013.
Ostler, A., Sussmann, R., Rettinger, M., Deutscher, N. M., Dohe, S., Hase, F., Jones, N., Palm, M., and Sinnhuber, B.-M.: Multistation intercomparison of column-averaged methane from NDACC and TCCON: impact of dynamical variability, Atmos. Meas. Tech., 7, 4081–4101, https://doi.org/10.5194/amt-7-4081-2014, 2014.
Rigby, M., Montzka, S. A., Prinn, R. G., White, J. W. C., Young, D., O'Doherty, S., Lunt, M. F., Ganesan, A. L., Manning, A. J., Simmonds, P. G., Salameh, P. K., Harth, C. M., Mühle, J., Weiss, R. F., Fraser, P. J., Steele, L. P., Krummel, P. B., McCulloch, A., and Park, S.: Role of OH in recent methane growth, P. Natl. Acad. Sci. USA, 114, 5373–5377, https://doi.org/10.1073/pnas.1616426114, 2017.
Rodgers, C. D. and Connor, B. J.: Intercomparison of remote sounding instruments, J. Geophys. Res.-Atmos., 108, 4116–4229, https://doi.org/10.1029/2002JD002299, 2003.
Sha, M. K. and Langerock, B.: S5P MPC VDAF and TCCON4S5P CH4 validation results, presentation at the Sentinel-5P Third products Release Workshop, available at: https://sentinel.esa.int/documents/247904/3753563/S5PCH4-VAL-MPC-TCCON4S5P (last access: 1 September 2020), 2019a.
Sha, M. K., De Mazière, M., Notholt, J., Blumenstock, T., Chen, H., Dehn, A., Griffith, D. W. T., Hase, F., Heikkinen, P., Hermans, C., Hoffmann, A., Huebner, M., Jones, N., Kivi, R., Langerock, B., Petri, C., Scolas, F., Tu, Q., and Weidmann, D.: Intercomparison of low and high resolution infrared spectrometers for ground-based solar remote sensing measurements of total column concentrations of CO2, CH4 and CO, Atmos. Meas. Tech. Discuss., https://doi.org/10.5194/amt-2019-371, in review, 2019b.
Sparling, L. C.: Statistical perspectives on stratospheric transport, Rev. Geophys., 38, 417–436, https://doi.org/10.1029/1999RG000070, 2000.
Toon, G. C.: The JPL MkIV interferometer, Opt. Photon. News, 2, 19–21, https://doi.org/10.1364/OPN.2.10.000019, 1991.
Toon, G. C. and Wunch, D.: A stand-alone a priori profile generation tool for GGG2014 release (Version GGG2014.R0), CaltechDATA, https://doi.org/10.14291/tccon.ggg2014.priors.r0/1221661, 2017.
Toja-Silva, F. Chen, J., Hachinger S., and Hase F.: CFD simulation of CO2 emission from urban thermal power plant: analysis of turbulent Schmidt number and comparison with Gaussian plume model and measurements, Journal of Wind Engineering and Industrial Aerodynamics, 169, 177–193, https://doi.org/10.1016/j.jweia.2017.07.015, 2017.
Urban, J., Lautié, N., Le Flochmoën, E., Murtagh, D., Ricaud, P., De La Noë, J., Dupuy, E., Drouin, A., El Amraoui, L., Eriksson, P., Frisk, U., Jiménez, C., Kyrölä, E., Llewellyn, E. J., Mégie, G., Nordh, L., and Olberg, M.: The northern hemisphere stratospheric vortex during the 2002–03 winter: Subsidence, chlorine activation and ozone loss observed by the Odin Sub-Millimetre Radiometer, Geophys. Res. Lett., 31, L07103, https://doi.org/10.1029/2003GL019089, 2004.
Veefkind, J., Aben, I., McMullan, K., Förster, H., de Vries, J., Otter, G., Claas, J., Eskes, H., de Haan, J., Kleipool, Q., van Weele, M., Hasekamp, O., Hoogeveen, R., Landgraf, J., Snel, R., Tol, P., Ingmann, P., Voors, R., Kruizinga, B., Vink, R., Visser, H., and Levelt, P.: TROPOMI on the ESA Sentinel-5 Precursor: A GMES mission for global observations of the atmospheric composition for climate, air quality and ozone layer applications, Remote Sens. Environ., 120, 70–83, https://doi.org/10.1016/j.rse.2011.09.027, 2012.
Vogel, F. R., Frey, M., Staufer, J., Hase, F., Broquet, G., Xueref-Remy, I., Chevallier, F., Ciais, P., Sha, M. K., Chelin, P., Jeseck, P., Janssen, C., Té, Y., Groß, J., Blumenstock, T., Tu, Q., and Orphal, J.: XCO2 in an emission hot-spot region: the COCCON Paris campaign 2015, Atmos. Chem. Phys., 19, 3271–3285, https://doi.org/10.5194/acp-19-3271-2019, 2019.
Wang, Y., Ma, Y.-F., Eskes, H., Inness, A., Flemming, J., and Brasseur, G. P.: Evaluation of the CAMS global atmospheric trace gas reanalysis 2003–2016 using aircraft campaign observations, Atmos. Chem. Phys., 20, 4493–4521, https://doi.org/10.5194/acp-20-4493-2020, 2020.
World Meteorological Organization, 2019: WMO Greenhouse Gases Bulletin: The State of Greenhouse Gases in the Atmosphere Based on Global Observations through 2018. No. 15, available at: https://library.wmo.int/doc_num.php?explnum_id=10100, last access: 1 September 2020, 2019.
Wunch, D., Toon, G. C., Blavier, J.-F. L., Washenfelder, R. A., Notholt, J., Connor, B. J., Griffith, D. W. T., Sherlock, V., and Wennberg, P. O.: The total carbon column observing network, Philos. T. R. Soc. A, 369, 2087–2112, https://doi.org/10.1098/rsta.2010.0240, 2011.
Wunch, D., Toon, G. C., Sherlock, V., Deutscher, N. M., Liu,C., Feist, D. G., and Wennberg, P. O.: The Total CarbonColumn Observing Network's GGG2014 Data Version, Tech.rep., California Institute of Technology, Carbon Dioxide In-formation Analysis Center, Oak Ridge National Laboratory, Oak Ridge, Tennessee, USA, https://doi.org/10.14291/tccon.ggg2014.documentation.R0/1221662, 2015.
Wunch, D., Wennberg, P. O., Osterman, G., Fisher, B., Naylor, B., Roehl, C. M., O'Dell, C., Mandrake, L., Viatte, C., Kiel, M., Griffith, D. W. T., Deutscher, N. M., Velazco, V. A., Notholt, J., Warneke, T., Petri, C., De Maziere, M., Sha, M. K., Sussmann, R., Rettinger, M., Pollard, D., Robinson, J., Morino, I., Uchino, O., Hase, F., Blumenstock, T., Feist, D. G., Arnold, S. G., Strong, K., Mendonca, J., Kivi, R., Heikkinen, P., Iraci, L., Podolske, J., Hillyard, P. W., Kawakami, S., Dubey, M. K., Parker, H. A., Sepulveda, E., García, O. E., Te, Y., Jeseck, P., Gunson, M. R., Crisp, D., and Eldering, A.: Comparisons of the Orbiting Carbon Observatory-2 (OCO-2) XCO2 measurements with TCCON, Atmos. Meas. Tech., 10, 2209–2238, https://doi.org/10.5194/amt-10-2209-2017, 2017.