the Creative Commons Attribution 4.0 License.
the Creative Commons Attribution 4.0 License.
 | 18 Sep 2020
A new Orbiting Carbon Observatory 2 cloud flagging method and rapid retrieval of marine boundary layer cloud properties
Matthew D. Lebsock
James McDuffie
Graeme L. Stephens
The Orbiting Carbon Observatory 2 (OCO-2) carries a hyperspectral A-band sensor that can obtain information about cloud geometric thickness (H). The OCO2CLD-LIDAR-AUX product retrieved H with the aid of collocated CALIPSO (Cloud-Aerosol Lidar and Infrared Pathfinder Satellite Observation) lidar data to identify suitable clouds and provide a priori cloud top pressure (Ptop). This collocation is no longer possible, since CALIPSO's coordination flying with OCO-2 has ended, so here we introduce a new cloud flagging and a priori assignment using only OCO-2 data, restricted to ocean footprints where solar zenith angle . Firstly, a multi-layer perceptron network was trained to identify liquid clouds over the ocean with sufficient optical depth (τ>1) for a valid retrieval, and agreement with MODIS–CALIPSO (Moderate Resolution Imaging Spectroradiometer) is 90.0 %. Secondly, we developed a lookup table to simultaneously retrieve cloud τ, effective radius (re) and Ptop from A-band and CO2 band radiances, with the intention that these will act as the a priori state estimate in a future retrieval. Median Ptop difference vs. CALIPSO is 12 hPa with an inter-decile range of , substantially better than the MODIS–CALIPSO range of . The MODIS–OCO-2 τ difference is , and re is . The τ difference is due to optically thick and horizontally heterogeneous cloud scenes. As well as an improved passive Ptop retrieval, this a priori information will allow for a purely OCO-2-based Bayesian retrieval of cloud droplet number concentration (Nd). Finally, our cloud flagging procedure may also be useful for future partial-column above-cloud CO2 abundance retrievals.
- Article
(2828 KB) - Full-text XML
-
Supplement
(773 KB) - BibTeX
- EndNote


Hyperspectral O2 A-band measurements near λ=0.78 µm, such as those taken by the Orbiting Carbon Observatory-2 (OCO-2), may provide unique new information about boundary layer clouds by retrieving their geometric thickness (H) or droplet number concentration (Nd), provided coincident information about effective radius (re) from other channels. They are able to do this because the spectrum responds to the photon path length between the Sun, Earth and the sensor. Increased H or decreased Nd with all other cloud properties held constant leads to increased distance between within-cloud scattering events and therefore a longer photon path length and decreased transmittance in wavelengths where O2 absorbs. This leads to spectrally varying changes in observed A-band spectra that can allow for joint retrievals of cloud optical depth (τ), cloud top pressure (Ptop) and H, provided there is sufficient spectral resolution and low enough noise (O'Brien and Mitchell, 1992; Richardson and Stephens, 2018).
The basic principle of A-band absorption for cloud height is well established (Fischer and Grassl, 1991; Rozanov and Kokhanovsky, 2004; Yamamoto and Wark, 1961), and numerous spaceborne A-band instruments retrieve cloud properties (Koelemeijer et al., 2001; Kokhanovsky et al., 2005; Lindstrot et al., 2006; Loyola et al., 2018; Preusker et al., 2007; Vanbauce et al., 1998), but most lack the spectral resolution or noise characteristics to obtain H (e.g. Schuessler et al., 2014). Others rely on multi-angle (Ferlay et al., 2010) or combined A- and B-band information (Yang et al., 2013), although these tend to contain little information on low-altitude and relatively thin clouds like marine stratocumulus (Davis et al., 2018; Merlin et al., 2016).
An OCO-2-based retrieval of τ, Ptop and H has been developed (OCO2CLD-LIDAR-AUX, available at http://www.cloudsat.cira.colostate.edu/data-products/level-aux/oco2cld-lidar-aux, last access: 1 September 2020), which uses lidar-based retrievals from the Cloud-Aerosol Lidar and Infrared Pathfinder Satellite Observation (CALIPSO) satellite to help identify cloudy scenes and constrain prior Ptop (Richardson et al., 2019). This retrieval is targeted at single-layer liquid clouds over the ocean whose response, both to warming and aerosols, is a major source of uncertainty in climate simulations (e.g. Bony et al., 2005; Bodas-Salcedo et al., 2019; Zelinka et al., 2020). Independent information about cloud structure may help to address timely questions, where other sensors which rely on different retrieval approaches and assumptions can lead to apparently contradictory conclusions (Rosenfeld et al., 2019; Toll et al., 2019).
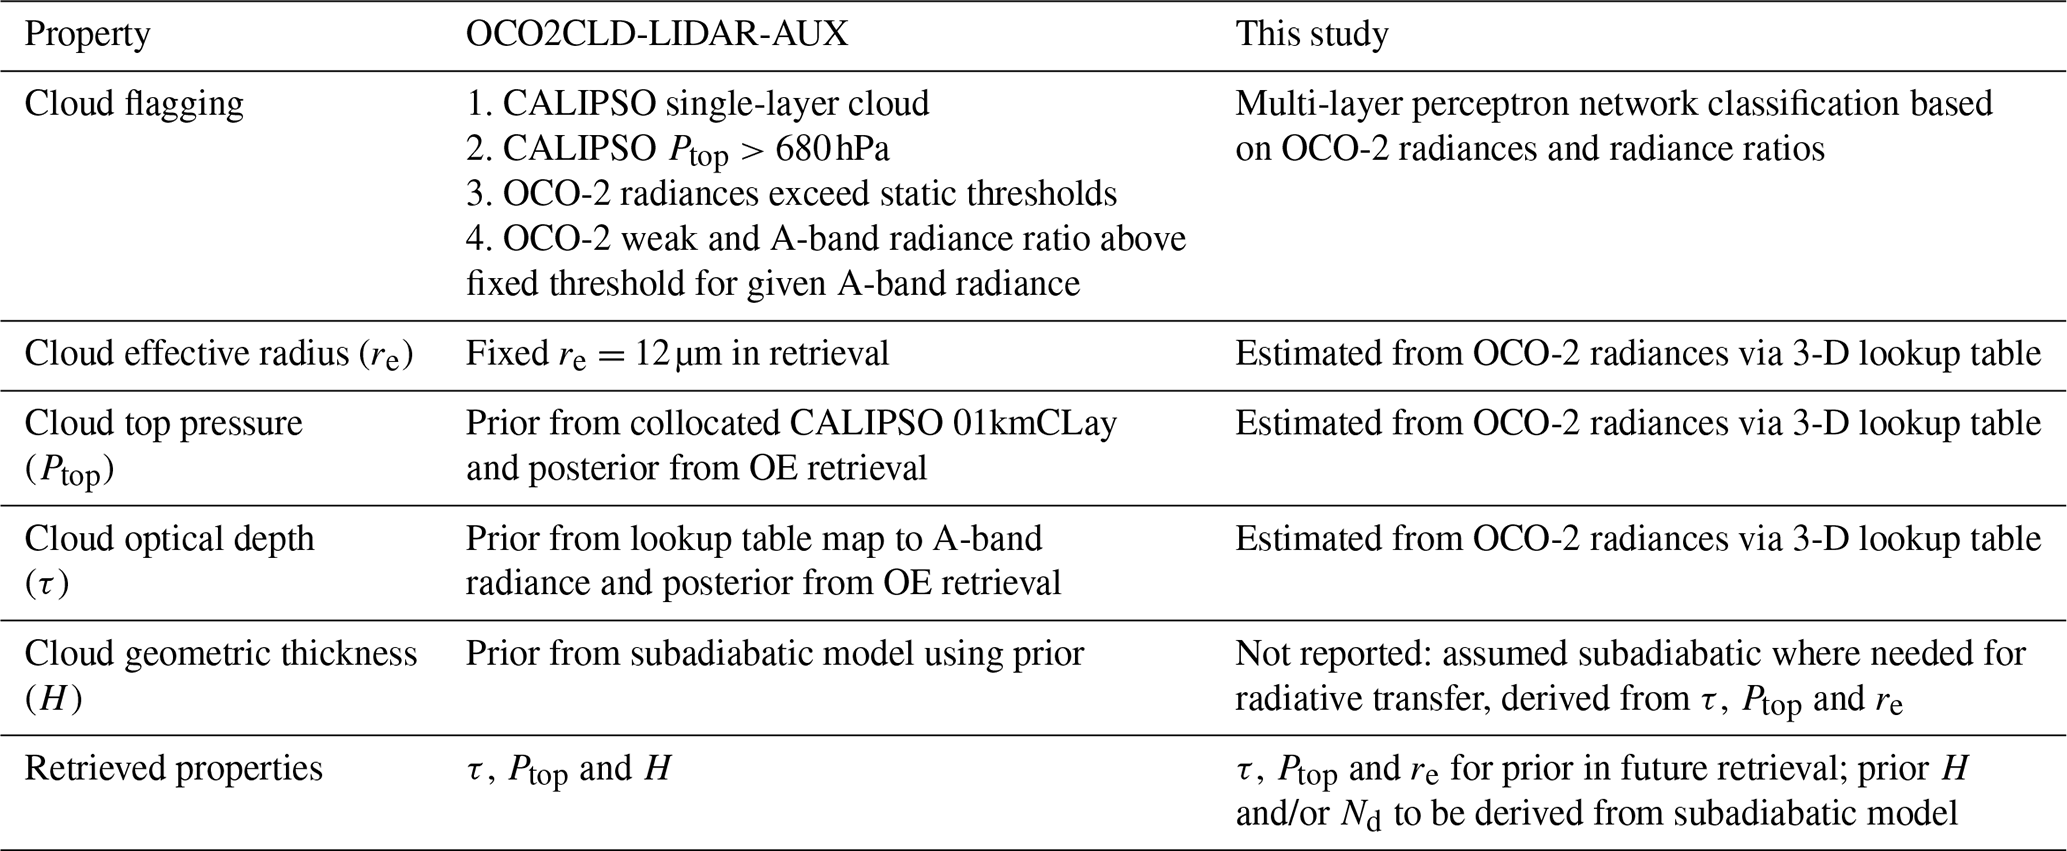
With CALIPSO leaving the A-Train constellation in 2018, collocation between OCO-2 and CALIPSO footprints is no longer possible. Our future retrievals require a new cloud flagging method plus a priori cloud top information for our iterative Bayesian optimal-estimation (OE) retrieval (Rodgers, 2000). This paper describes a new pre-processor for OCO-2-based liquid cloud property retrievals that provides the requisite cloud flagging and a priori information. Details of OCO2CLD-LIDAR-AUX are summarised in Table 1, which also lists the main changes introduced in this study.
Table 1Summary of methods for determining properties in OCO2CLD-LIDAR-AUX and changes introduced in this study. OCO2CLD-LIDAR-AUX is a full optimal-estimation (OE) retrieval that combined CALIPSO and OCO-2 information to obtain its prior state. This study is intended to provide OCO-2-only prior information for a future OE retrieval.
We do not use the published OCO-2 cloud flag, as it was not developed for ocean nadir scenes (Taylor et al., 2016), since they were considered too dark for OCO-2's main mission of column CO2 (XCO2) retrievals (Crisp, 2008; Crisp et al., 2004; Eldering et al., 2016). Therefore we train a multi-layer perceptron network to rapidly identify liquid cloud scenes using collocated CALIPSO and Moderate Resolution Imaging Spectroradiometer (MODIS) retrievals. For the prior cloud property retrieval we develop lookup tables (LUTs) that jointly retrieve τ, re and Ptop using OCO-2 O2 A-band and strong-CO2-band (λ∼2.06 µm) radiances. These are similar to the Nakajima–King tables used in MODIS cloud retrievals (Nakajima and King, 1990) but add an A-band absorption ratio that is sensitive to Ptop.
Our OCO-2 OE retrievals are computationally expensive due to the complex radiative transfer (RT), so we aim to avoid footprints which are unlikely to yield good retrievals. The cloud flagging and prior LUT retrieval developed here are a necessary step in excluding these footprints, and we further exclude those where solar zenith angle (SZA) based on OCO2CLD-LIDAR-AUX's retrieval statistics. It is possible that a future partial-column (i.e. above-cloud) XCO2 retrieval could be developed, which would likely be targeted at columns above optically thick clouds, so the pre-processor developed here could find wider use (Schepers et al., 2016; Vidot et al., 2009). A further development is that our past retrievals used a fixed re, and the addition of varying re is eased by a new Python RT interface using the ReFRACtor (Reusable Framework for Retrieval of Atmospheric Composition) software described in Sect. 2.3. Our new LUT retrieval of a prior re will allow for a more appropriate re to be assumed in the iterative OE.
The paper is organised as follows: Sect. 2 describes the relevant OCO-2 details, data selection and radiative-transfer calculations before detailing the methodology. Section 3 reports the performance statistics of the classifier, compares LUT retrieved cloud properties vs. MODIS and CALIPSO where the instrument footprints overlap, and compares the final pre-processor throughput against that of OCO2CLD-LIDAR-AUX. Section 4 discusses and contextualises the results and proposes actionable future work that could address identified biases, and Sect. 5 concludes.
2.1 Instruments and data selection
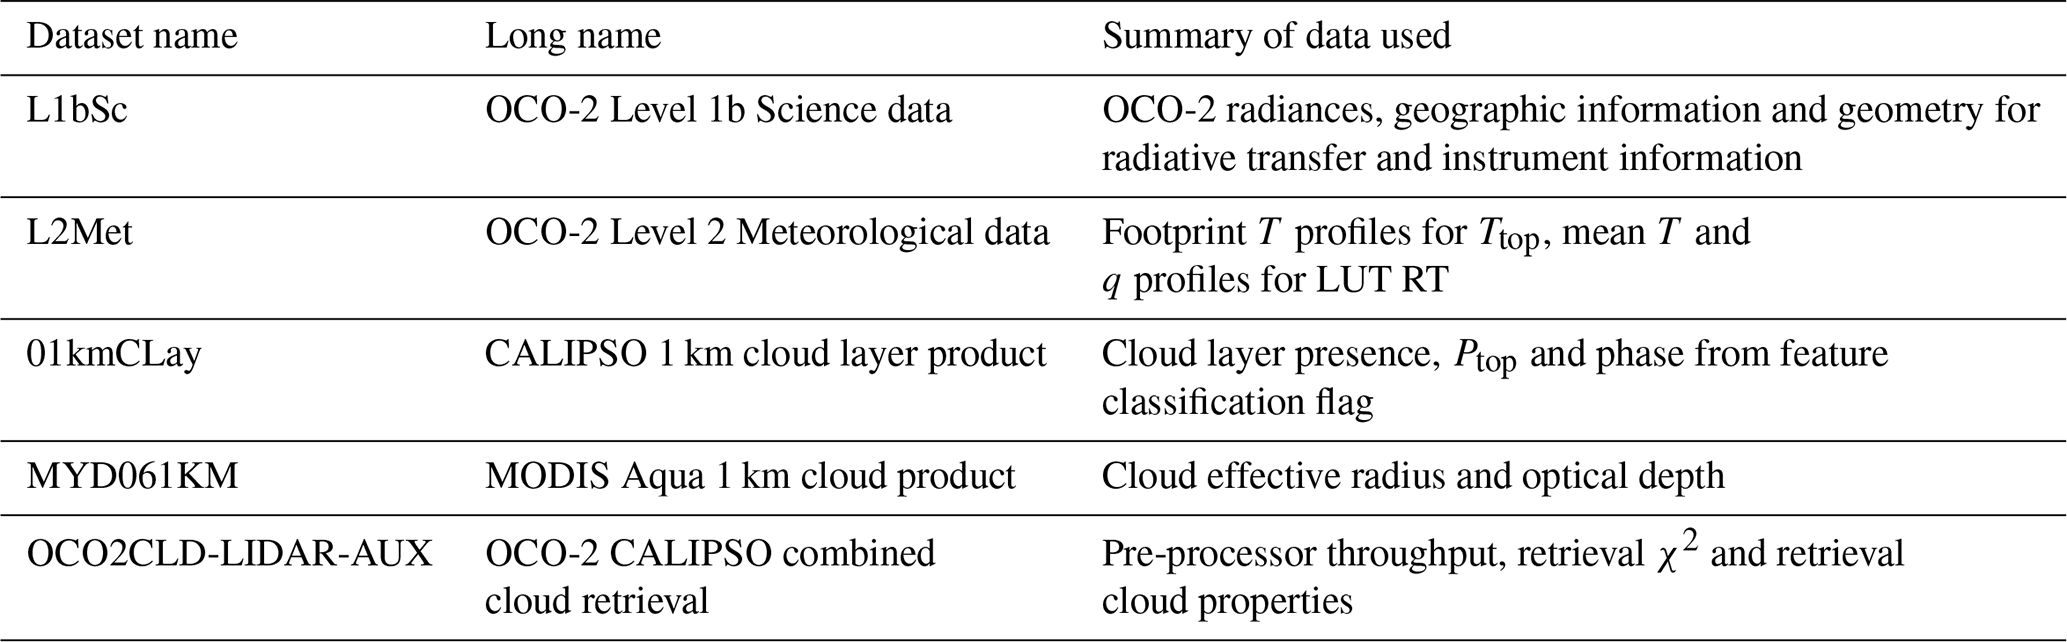
The OCO-2 measurement approach and instrumentation are detailed in Bösch et al. (2017); the Level 2 Full Physics (L2FP) RT's application to clouds is detailed in Richardson et al. (2017); and the MODIS–CALIPSO–OCO-2 matchup data are as used in Taylor et al. (2016). The datasets used here are listed in Table 2; in particular, from the OCO-2 Level 1b Science (L1bSc) data we obtain calibrated radiances and RT inputs such as solar zenith angle (SZA) and instrument characteristics.
Table 2Summary of datasets used. Note that we use the 01kmCLay and MYD061KM products collocated with OCO-2 as described in Taylor et al. (2016).
The OCO-2 satellite flies in the Sun-synchronous A-Train constellation (L'Ecuyer and Jiang, 2010) and measures during the daytime ascending node with an Equator crossing time near 13:30. Its orbits are committed primarily to either glint or nadir view, and we use nadir-only orbits to provide complementary vertical information on clouds that are too low or thin to be adequately profiled by CloudSat's nadir-view radar. Glint-view footprints would preclude our use of the nadir-only CALIPSO lidar data, and atmospheric photon path lengths would be longer, thereby reducing the retrieval sensitivity. Given our retrieval's computational expense we limit to nadir orbits to optimise the likelihood of good retrievals.
OCO-2 carries three co-boresighted grating spectrometers centred over the O2 A-band (λ∼0.78 µm), weak CO2 band (λ∼1.68 µm) and strong CO2 band (λ∼2.06 µm). The satellite operates in a push-broom fashion with a swath of eight footprints whose orientation relative to the track rotates through the orbit as the satellite angles to optimise solar power generation. The subsequent parallelogram-like footprints are nominally near 1.4 km×2.2 km at nadir. The channels' wavelengths vary across the track due to the manner in which the optics focus light onto the focal plane array (FPA), and wavelength also drifts throughout an orbit due to Doppler shift. This causes issues for a LUT developed from a fixed set of channels, since the wavelengths sampled by those channels will differ between each measurement. Furthermore, some sensor pixels are damaged, and we only include channel indexes where all eight swath soundings are classed as good, which reduces the A-band sample from 1016 to 853 channels. Section 2.2 describes how we use a channel-averaging approach to reduce the consequences of this wavelength shift in the cloud classifier, and Sect. 2.4 details our related channel selection for the LUT.
For classifier training and validation, we require spatial overlap between OCO-2, MODIS and CALIPSO data. The ascending OCO-2 ground track is approximately 200 km to the east of Aqua's and therefore within the MODIS swath, so we select the 1 km MODIS retrieval footprint whose centre is closest at the surface to the centre of the OCO-2 footprint. However, CALIPSO only measures once at nadir, so only one OCO-2 footprint in each swath can be collocated. Furthermore, even during formation flying the satellites drifted within their control boxes, and some CALIPSO measurements occurred outside the OCO-2 swath. We only include footprints with a CALIPSO–OCO-2 matchup distance of <1.5 km at the surface. Finally, the dataset was further restricted to footprints with the surface type of water, and valid radiances. Between 6 September 2014 and 30 April 2018 the MODIS–CALIPSO–OCO-2 matchup dataset has 5909 nadir orbits, of which 4743 contain valid matchups. This is reduced to N=3907 orbits through 31 December 2016 when we also require an OCO2CLD-LIDAR-AUX retrieval.
2.2 Cloud classifier data selection and training
For the first step of rapidly identifying footprints that contain liquid clouds over the ocean we select a machine learning classifier which is trained on a set of collocated MODIS–CALIPSO footprints before being validated against an independent set of MODIS–CALIPSO data. The footprints which pass this classifier will be forwarded to the LUT estimator to generate the a priori cloud property estimate.
We generated independent sets of training (N=100 000) and validation (N=250 000) footprints by randomly selecting orbits and taking all their valid footprints until we had those sample sizes. We assign a cloud flag value of 1 to a footprint when the following conditions are all met, else it is 0:
- i.
CALIPSO Feature_Classification_Flag = 2 (cloud present and liquid)
- ii.
CALIPSO (retrieves a single layer)
- iii.
MODIS Cloud_Optical_Thickness > 1 (cloud present and sufficiently optically thick).
As input we take the continuum radiances (Ic) from all three OCO-2 bands and correct for illumination geometry via , where μ0=cos (SZA) plus a number of A-band ratios described below. From Python's “sklearn” package (Pedregosa et al., 2011) we selected a multi-layer perceptron network (sklearn.neural_networks.MLPClassifier) with hidden layer sizes of . These selections are justified in Sect. S1 in the Supplement.
In these bands the ocean is dark and reflectance increases monotonically with τ, so the helps to identify optically thick clouds. Ice also absorbs more strongly than water in the higher wavelength bands, which aids phase discrimination.
We calculate A-band absorption ratios by dividing a non-continuum (i.e. absorbing) channel radiance by . Clouds tend to increase values, since photons scattered from the clouds encounter fewer O2 molecules than those that travel all the way to the surface. This principle has been exploited to improve detection of clouds over bright snow and ice surfaces with the A- and B-band channels of the Earth Polychromatic Imaging Camera (EPIC) on board the Deep Space Climate Observatory (DSCOVR) (Zhou et al., 2020). Consider
where is the O2 absorption coefficient, which is then integrated over the photon path ∫dz. Begin by considering a δ-function distribution of photon path lengths along the beam that is scattered from a single layer with constant , then at nadir the path can be decomposed into the path from the top of the atmosphere (TOA) to the layer top, , and from the layer top to TOA Δz
making kΔz the subject
We take the right-hand side of Eq. (3) as our observable. If we select channel combinations with near-constant , then the observable is proportional to Δz. Lower values should be associated with high (i.e. more likely ice) clouds, and high values are associated with clear scenes. This assumes similar scattering properties for the and , which is justified by the A band's small wavelength range.
The sampled by individual channels varies for three main reasons:
-
The central wavelength of each channel depends on the cross-track position due to the way in which the optics focus light on the FPA.
-
The wavelengths sampled change due to Doppler shift induced by relative Earth–satellite and Earth–Sun motion.
-
The strength of O2 absorption varies due to line broadening induced by atmospheric conditions.
We use a method from Richardson et al. (2017) to address these factors. The 853 undamaged channels are ranked from brightest to darkest, and a non-overlapping 10-channel mean is taken, resulting in 85 full “super channels”. These are combined with and μ0 using Eq. (3), and we selected every 10th super channel from the 35th onwards (Sect. S1 shows little improvement from additional super channels).
This is illustrated in Fig. 1, with Fig. 1a showing an example cloudy spectrum and the damaged channels, Fig. 1b showing the ranked super channels and those used in the classifier, and Fig. 1c comparing for the original spectrum (CALIPSO Ptop=827 hPa) and for a spectrum with similar μ0 and but with CALIPSO Ptop=403 hPa. The brightest super channels show little response to scattering layer altitude, so they contain little information, and they are excluded from the classifier. The higher-altitude cloud has a brighter due to the shorter mean path length. As stated previously, this aids in the phase classification and also in discriminating between cloudy and clear scenes, since very low is more likely associated with photons scattered from the surface.

Figure 1(a) OCO-2 A-band spectrum for a cloud with CALIPSO Ptop=943 hPa, with the used channels in orange and non-used (e.g. due to FPA pixel damage) in blue. (b) The smoothed super-channel spectrum, where the channels are ranked in brightness and then non-overlapping 10-channel means are taken. The super channels used in the classifier are shown in red. (c) Comparison of the ranked ratio I∕Ic between this cloud, and one at a higher altitude (Ptop=740 hPa). The SZA is within 0.01∘, and the continuum radiance is within 1 % between each spectrum; the differences are largely due to the shorter path length resulting in less absorption for the higher-altitude cloud.
2.3 Radiative-transfer simulations and ReFRACtor interface
The forward RT simulations used to generate the LUTs are performed with the ReFRACtor RT code, which implements the methodology described in Sect. 2.2.4 of O'Dell et al. (2012). Of particular relevance for cloudy scenes, multiple scattering is calculated using LIDORT (Linearized Discrete Ordinate Radiative Transfer) with a polarisation correction for low orders of scattering (Natraj and Spurr, 2007; Spurr, 2006). This assumes a plane-parallel atmosphere with a correction to the direct beam to account for Earth's sphericity. Angular output is calculated with eight streams for pre-defined bins in gas optical depth, while single-stream calculations are done for pre-selected wavenumbers at a mean separation of , with smaller separation within absorption bands. The high- and low-stream outputs are combined using O'Dell's (2010) low-stream interpolation to rapidly and accurately reproduce high-stream output at all wavenumbers. These are then interpolated onto a uniform grid and convolved with the instrument line shapes (ILSs) to obtain channel radiances. The selected numbers of streams were found to reproduce cloudy-scene radiances given MODIS and CALIPSO cloud properties (Richardson et al., 2017) and also match the selection in Vidot et al. (2009).
OCO2CLD-LIDAR-AUX used OCO-2 L2FP RT and required the input of L1bSc and meteorology files plus a file containing pressure level and cloud information. Each footprint's output was saved to a file for every OE iteration, adding to a read-write bottleneck. Further inefficiency arose if any footprint in an orbit included a type of scatterer (e.g. water clouds with re=10 µm, which we term wc_010), as its scattering properties had to be assigned for every profile in the orbit. For example, if one footprint contained a wc_010 cloud, every other footprint in the orbit that did not contain a wc_010 cloud would need an assigned wc_010 profile with extinction =0.
Here we use the new ReFRACtor, which handles footprints as individual objects. Inputs are assigned uniquely to that object, and it stores the RT output and updated properties internally, so no external reading or writing is required for intermediate OE iterations.
For LUT input we take an ocean footprint near 25∘ S from the L1bSc file for orbit 16094a on 11 July 2017 for instrument and satellite properties, although we manually vary SZA. We used the mean OCO-2 cloudy profiles for tropical (20∘ S–20∘ N) footprints from Richardson and Stephens (2018). The high-latitude case is excluded, as its surface temperature is near 0 ∘C, so it will mostly represent ice and mixed-phase clouds, and using the midlatitude (20–50∘ S or N) case had little effect on the retrieval statistics.
The RT code takes input on levels and then linearly interpolates to generate vertically homogeneous layers. We use 16 pressure levels: 3 assigned linearly in P from TOA to 500 hPa, 10 from 500 hPa to Ptop and 2 from Ptop to cloud bottom (Pbottom), and the final level is the surface. This was found to reliably reproduce OCO-2 L2FP RT standard outputs, which use 20 levels but with faster processing.
The cloud extinction is assigned to the level at the cloud centre, whose neighbouring levels are at Ptop and Pbottom, and the layer interpolation results in a vertically homogeneous cloud with constant τ(z) and re(z). Rozanov and Kokhanovsky (2004) showed that a vertically uniform assumption may introduce radiation biases, relative to our target marine boundary layer clouds, which tend to be vertically stratified with increasing extinction towards the cloud top (Bennartz, 2007; Grosvenor et al., 2018; Painemal and Zuidema, 2011), but quantifying such a bias requires extensive testing that we intend to perform separately. For now, the cloud H is calculated as in Szczodrak et al. (2001), where and is converted to ΔPby assuming . Where this would result in Pbottom>Psurf, the cloud is compressed while maintaining the same Ptop.
For surface reflection ReFRACtor does not currently allow for a Cox–Munk surface, so we assume it is Lambertian with albedo that varies by band and SZA. The band- and SZA-dependent values are derived from a set of OCO-2 radiances as described in Sect. S2 and range from 0.010 to 0.054.
Gaseous absorption is from the absorption coefficient (ABSCO) version 5.0 tables used in OCO-2's latest XCO2 retrieval, version 9. These tables account for line changes due to temperature, pressure and water vapour. Cloud properties are pre-calculated using Mie theory at integer micrometre values of re following an assumed gamma droplet size distribution with width parameter of . This follows the standard OCO-2 XCO2 retrieval aerosol input file but with an update to correct an error in water absorption in the CO2 bands (Aronne Merrelli, personal communication, 2019).
2.4 Lookup table development and retrieval
The LUT is designed to produce prior cloud property estimates for our future OE retrieval, which specifically targets marine boundary layer clouds and aims to provide additional information about their H or Nd. We therefore limit the range of the LUT properties to cover the majority of these clouds, with properties τ from 1 to 50, re from 4 to 32 µm and Ptop from 650 to 970 hPa and SZA spanning 20–45∘ inclusive (see Table 3 in the Supplement for selected values). The simulated outputs are in the O2 A band, Ic, st in the strong CO2 band and an A-band ratio of .
We take the mean of 5 channels for each of and Ic, st and 10 channels for , and fixed channel indices are required to consistently convert the RT-simulated spectra into LUT radiances. The selected channels minimise the root mean square error (RMSE) across a large sample of footprints against the L1bSc continua (for and Ic, st) and the 60th super channel for (as defined in Sect. 2.2). The 60th super channel is picked, as it showed the greatest sensitivity to CALIPSO Ptop in Richardson et al. (2017). The selection algorithm is described in Sect. S4; the error statistics are in Table 4 in the Supplement; and the channel indices are in Table S5. The error statistics show that our selection is valid for a range of meteorological conditions, illumination geometries, Doppler shifts and for all eight cross-track sounding positions.
The LUT channels are highlighted in Fig. 2, which shows mean spectra from a large sample of cloudy footprints. The channel means with 2σ ranges are shown as shaded bands and are compared with the truth as solid lines. The truth for Ic is the mean of the sample L1bSc radiance continua, which represent the brightest channels in each footprint and whose channel indices may change with the footprint, while the truth is the spectrum's 60th super channel. The estimators are consistent with the truth in each case, with the best agreement for and a negative bias in Ic, st. We found that scaling the L1bSc Ic, st value by 0.9804 resulted in similar error statistics to using our selected channels, so we use scaled L1bSc Ic, st in our LUT retrieval, since those radiances are already loaded for the classifier. The individual channels show a large spread, but the channel selection algorithm accounts for anti-correlation in their radiances such that the 10-channel mean is consistent with the 60th super channel across all test footprints.
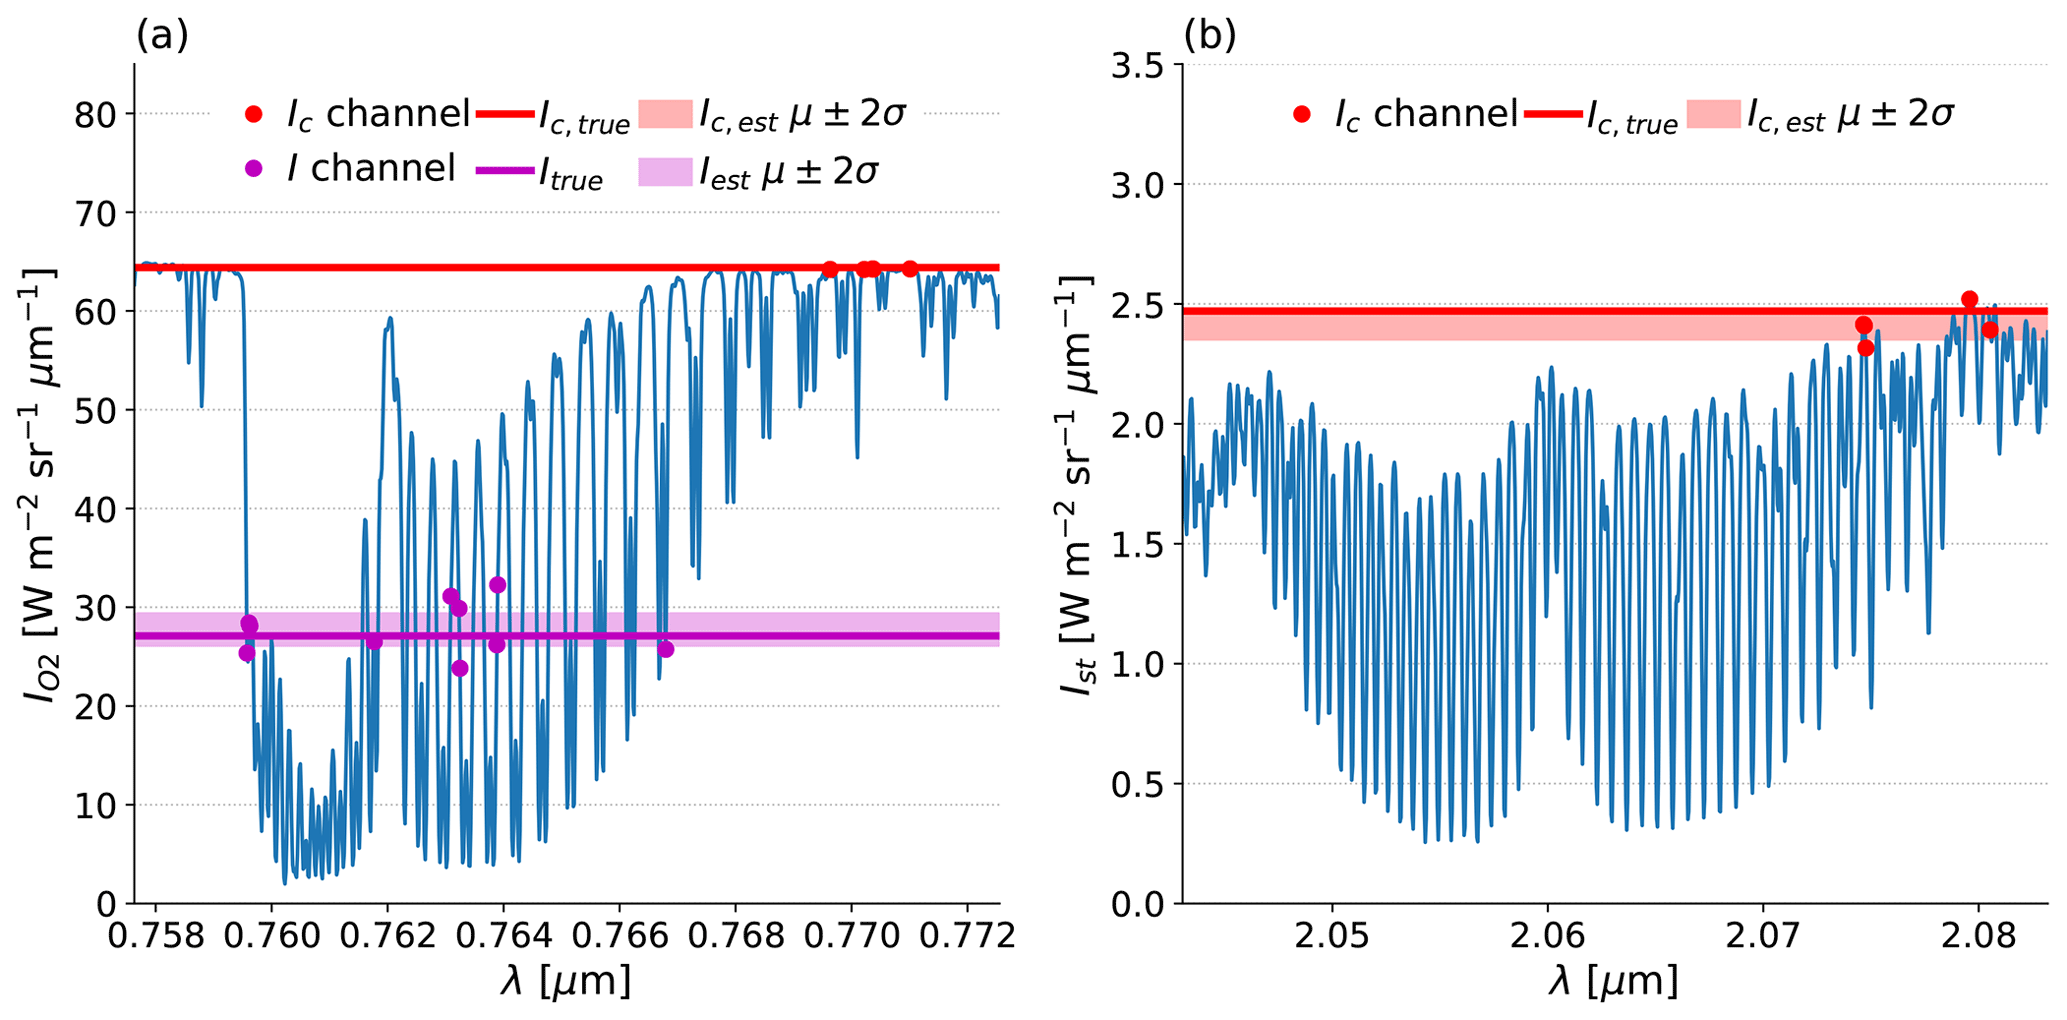
Figure 2Mean cloudy-scene spectra in (a) the O2 A-band and (b) the strong CO2 band. The channels used in the lookup tables are shown as points, with red for the continuum radiance Ic and magenta for the O2 absorption band radiance I. Thick horizontal lines represent the truth, either the L1bSc file's continuum radiance for Ic or the mean of the 600–609th brightest undamaged channels (i.e. the 60th super channel) for I. The shaded bands of the same colour are the mean ±2 standard errors based on the selected channel sample sizes (5 for Ic and 10 for I).
For each SZA, ReFRACtor is run for all combinations of input cloud properties to generate A-band and strong-CO2-band radiances for these selected LUT channels. A LUT is generated at each 5∘ in SZA from 20 to 45∘ inclusive, and the retrieval works as follows:
- i.
From an L1bSc file, load the SZA plus radiances to get , and Ic, st.
- ii.
Apply the classifier to identify appropriate cloudy footprints; pass only these to the next step.
- iii.
Convert these into the LUT observables , Ic, st and .
- iv.
Scale observables onto the nearest LUT SZA using the appropriate μ-related scaling.
- v.
Interpolate within the LUT to simultaneously estimate τ, re and Ptop.
If the observed radiances are outside the LUT values, then a NaN (not a number) is returned, and the footprint is flagged as not retrievable. The footprint is also flagged as likely to contain ice if L2Met . We refer to NaN or outputs as not being passed by the LUT, since these footprints will not be attempted in our future OE retrieval.
2.5 Pre-processor prior validation
The pre-processor is run on the 3907 orbits used in OCO2CLD-LIDAR-AUX from September 2014 to December 2016, where the new L1bSc and L2Met version 8 files are available along with the collocated MODIS and CALIPSO files and where there are any ocean footprints with . For validation of the LUT we consider only those footprints where the CALIPSO matchup distance <1.5 km as in Sect. 2.1; where the MODIS, CALIPSO and LUT retrievals are within the valid LUT property range; and where derived OCO-2 (N=1 264 449). The primary analysis is in the pairwise differences between the LUT retrieved properties and MODIS τ or re and CALIPSO Ptop. The MODIS Ptop is also evaluated against that of CALIPSO.
2.6 Comparison with the OCO2CLD-LIDAR-AUX pre-processor
The OCO2CLD-LIDAR-AUX matchups are separated into three sets: those that are not flagged by the classifier, those that are flatted but do not pass the LUT retrieval (due to out-of-range cloud properties or implied ), and those that fully pass the pre-processor. Throughput and agreement are compared with the OCO2CLD-LIDAR-AUX cloud flag, retrieval χ2, retrieved τ and Ptop discrepancy vs. CALIPSO. The pre-processor performs well if it successfully passes those footprints with small posterior χ2 and Ptop discrepancy while avoiding those with larger values.
The OCO2CLD-LIDAR-AUX cloud flag was based on simple thresholds in and combined with a phase discrimination based on their combination, and finally there is a requirement for valid CALIPSO single-layer clouds with Ptop>680 hPa occurring within 10 km. This flag did not have an SZA cutoff at 45∘, so we will also specifically consider comparisons between the outputs of the two pre-processors where .
3.1 Cloud classifier test statistics
As in Sect. 2.2 the classifier output is 1 when we expect a single-layer liquid cloud with τ>1 and 0 otherwise and the validation data, which we also term “truth”, is the MODIS–CALIPSO classification. We use the following terms:
- i.
true positive (TP), classifier = 1, truth = 1;
- ii.
false positive (FP), classifier = 1, truth = 0;
- iii.
false negative (FN), classifier = 0, truth = 1; and
- iv.
true negative (TN), classifier = 0, truth = 0.
These are normalised such that . These can be summarised in a confusion matrix, as is done in Fig. 3a for the N=250 000 non-training sample. Its trace is the accuracy score of 90.0 %, and the off-diagonal elements represent potential misclassifications. Figure 3b shows that the FNs are largely clouds of lower MODIS τ than those identified by the classifier, with 29.4 % of FNs having MODIS τ<3, compared with 7.3 % of TPs.
Some of these “missed” clouds may be due to collocation error; for example a cloud may average τ>1 over the 1 km MODIS footprint but not over the larger OCO-2 footprint. The classifier will also have errors: it maximises the accuracy score, and detecting lower τ clouds may require passing darker scenes, which could increase the prevalence of FPs.
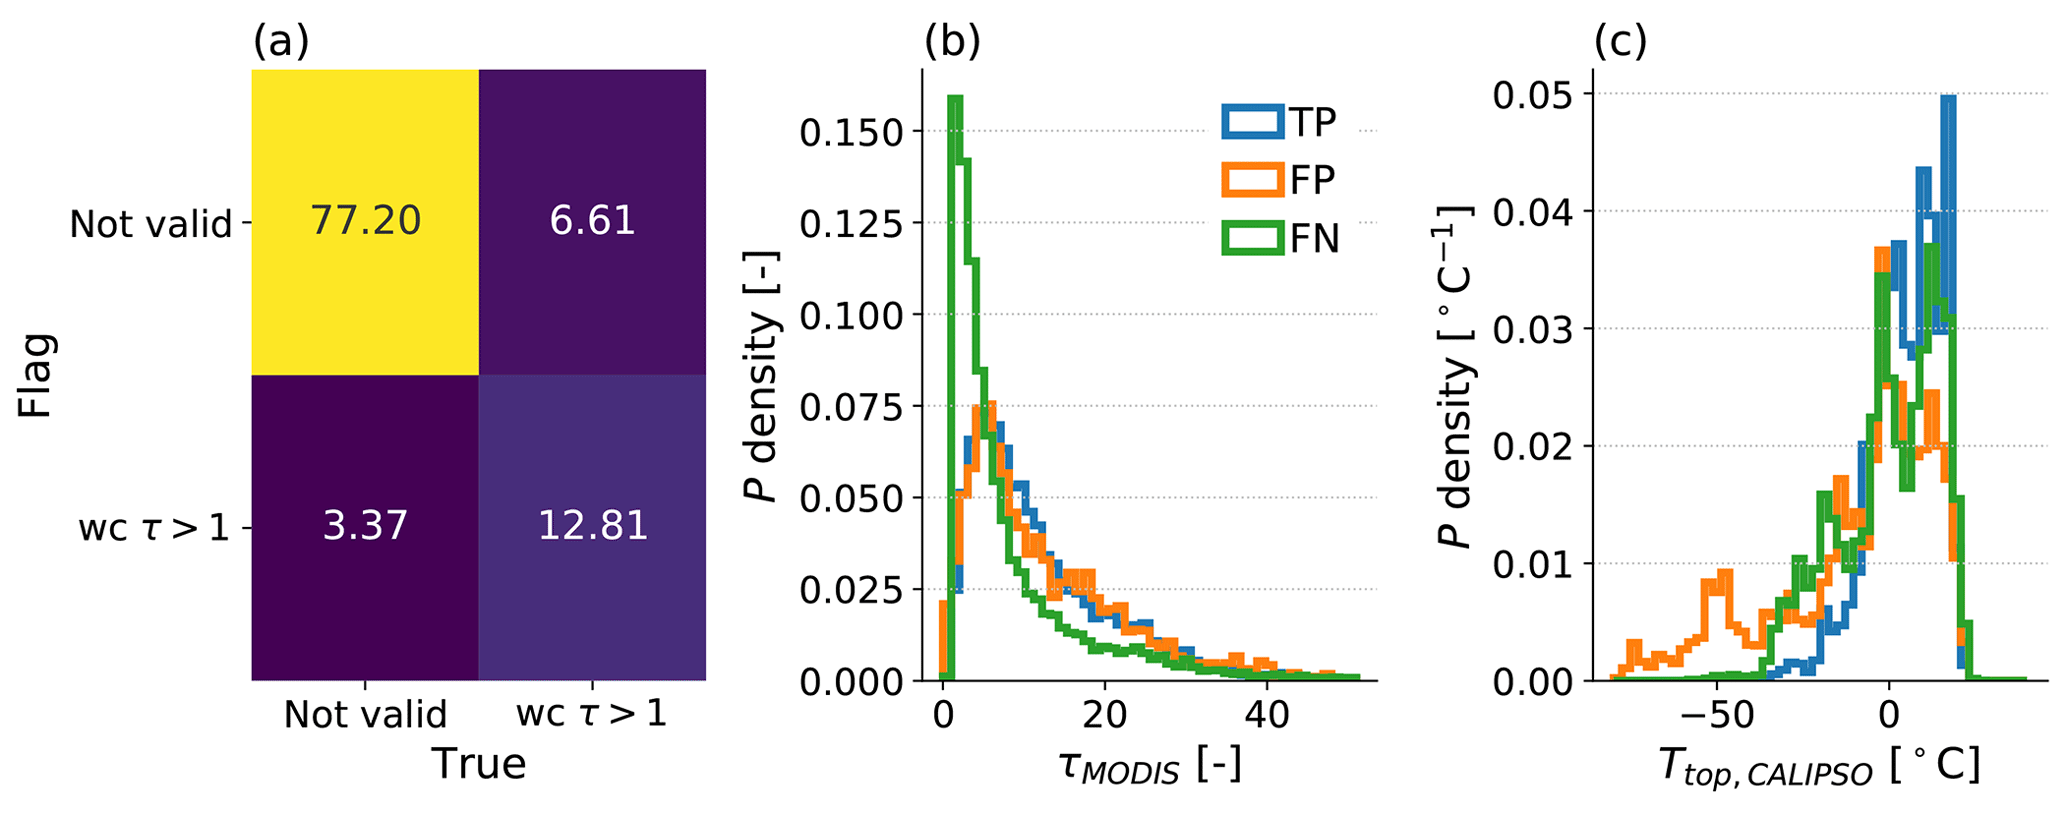
Figure 3(a) Confusion matrix with values as a percentage, comparing trained classifiers (“flag”) with collocated MODIS–CALIPSO definitions (“truth”) and entries being classified as a single-layer water cloud (wc) with τ>1 or “not valid”. (b) Normalised histograms of collocated MODIS τ, where retrieved, for true positives (TPs), false positives (FPs) and false negatives (FNs). (c) Normalised histograms of collocated CALIPSO Ttop, where retrieved, with colours as in (b).
Figure 3c shows the distribution of CALIPSO Ttop where retrieved and shows far more cold-topped clouds in the FP case compared with the TPs, although there is also a peak in the FN case. This suggests that the classifier misidentifies some ice clouds as liquid and also that some of the FNs may in reality be mixed-phase clouds that CALIPSO has nevertheless identified as liquid. For example, 24.6 % of FNs have , compared with 7.6 % of the TP sample.
Among the false positives, we expected that there would be a larger occurrence of broken or multi-layered clouds, where thick broken clouds were sufficiently bright to trigger detection or where overlying thin ice clouds have too little effect on the radiances to be flagged as ice. We describe a scene as broken when the MODIS partially cloudy retrieval exists (Cloud_Optical_Thickness_PCL >0) and a scene as multi-layered when CALIPSO retrieves more than one cloud layer, although strictly this can only detect multiple layers when the upper layer does not fully attenuate the lidar. While 11.3 % of the full sample is multi-layered, 40.1 % of the FP cases are, and while 12.2 % of scenes are partially cloudy, 30.4 % of FP footprints are. Overall, 69.4 % of FPs are associated with multi-layer or broken clouds or both.
3.2 Lookup table matchup performance
Figure 4a shows simulated and Ic, st at and Ptop=810 hPa for all τ and re, while Fig. 4b contains the median and spread of at each fixed Ptop. Most of the variance is explained by Ptop, with spread largely due to changes in within cloud scattering. For example, for Ptop=970 hPa, the optically thickest clouds were artificially compressed to prevent them from extending below the surface, thereby reducing the in-cloud path and increasing the maximum .
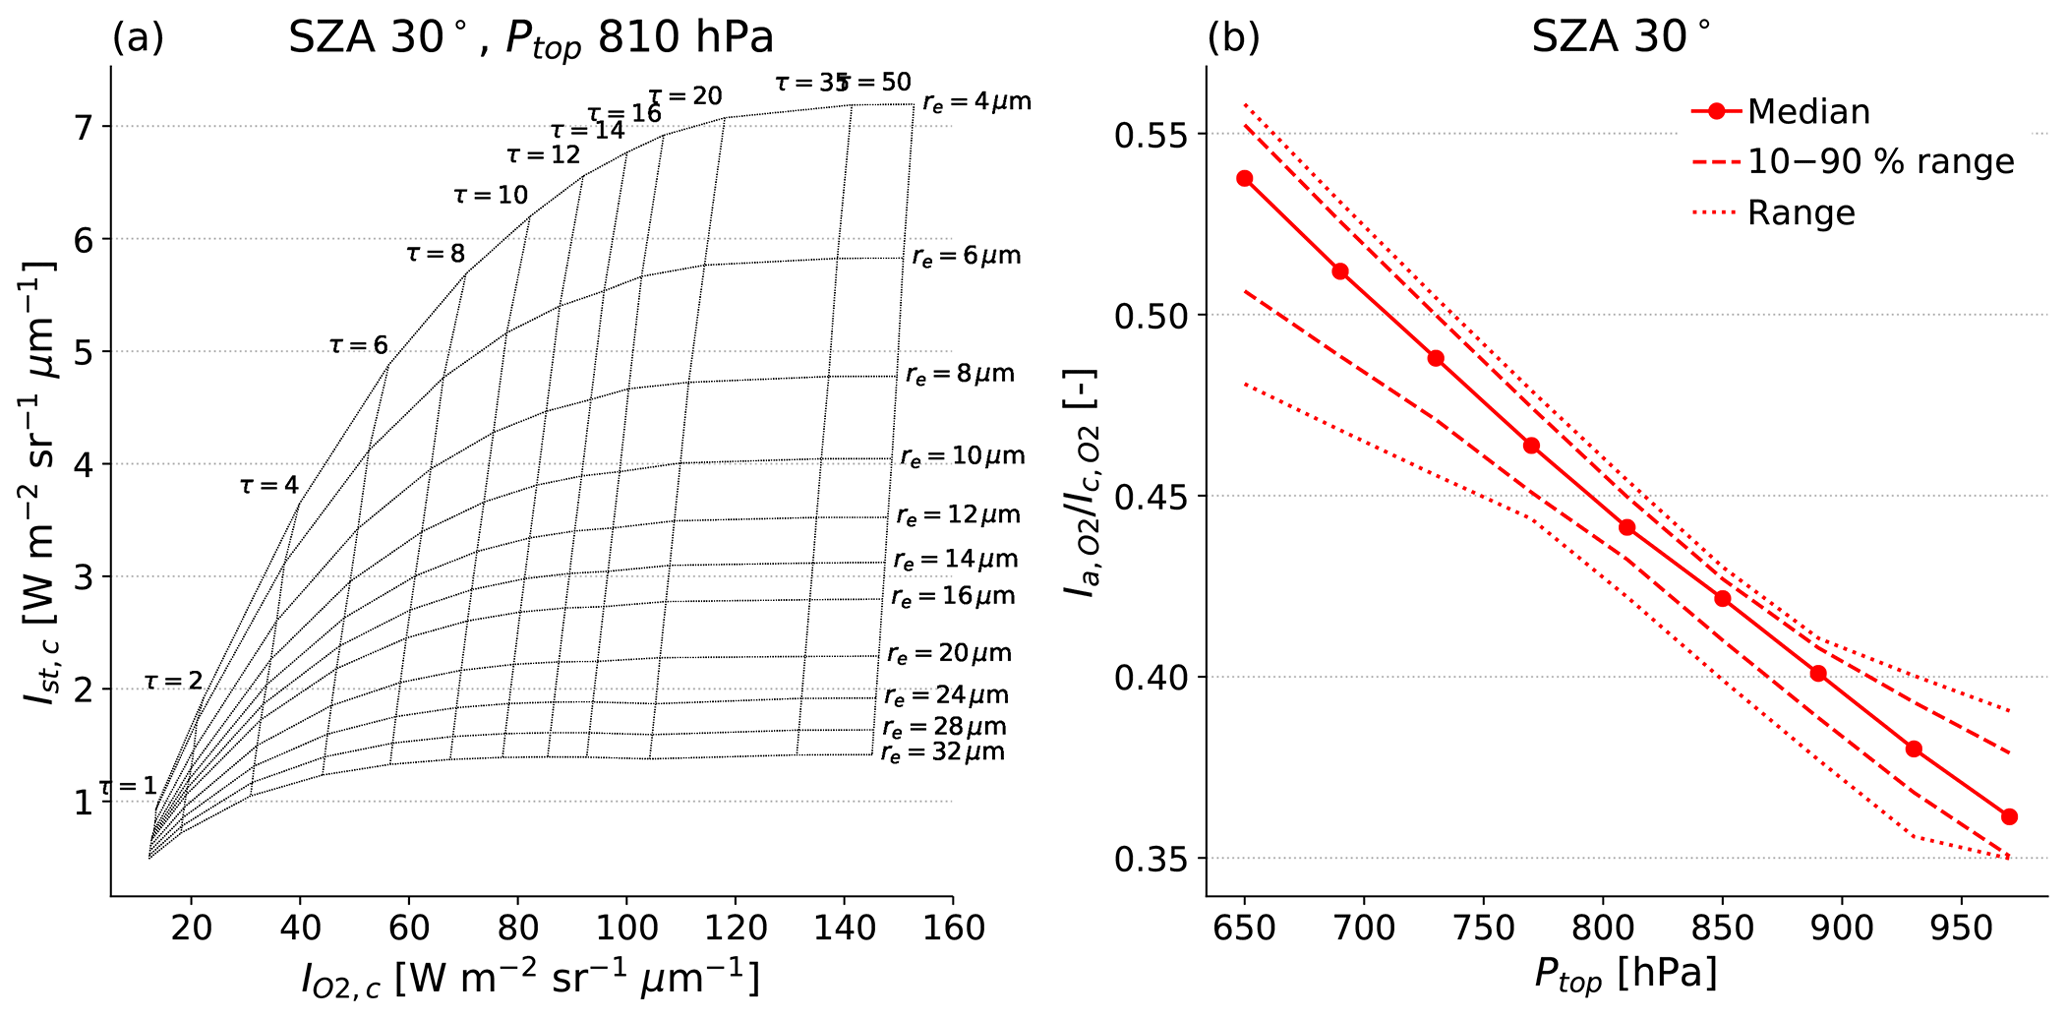
Figure 4Example lookup table (LUT) properties. (a) Radiance in the strong CO2 continuum as a function of A-band continuum radiance at for clouds with Ptop=810 hPa and τ and re as labelled. (b) A-band absorption ratio within the table as a function of Ptop. The solid line is the median value within each LUT at a fixed Ptop; the dashed lines span the 10 %–90 % range, and the dotted lines span the minimum to maximum values.
The OCO-2 LUT retrievals are compared with those of MODIS and CALIPSO in Fig. 5a–c, and the MODIS and OCO-2 Ptop differences relative to CALIPSO are in Fig. 5d. We consider the OCO-2 value minus the other product's value and report median [10th, 90th] percentiles instead of standard deviation, as these distributions are commonly non-Gaussian. There is good correlation between OCO-2 and other products, with a τ difference of , an re difference of and a Ptop difference of . As can be seen in Fig. 5d, the LUT Ptop retrieval outperforms that of MODIS, whose difference relative to CALIPSO is ; i.e. the OCO-2 inter-decile range is approximately 40 % smaller than that of MODIS.
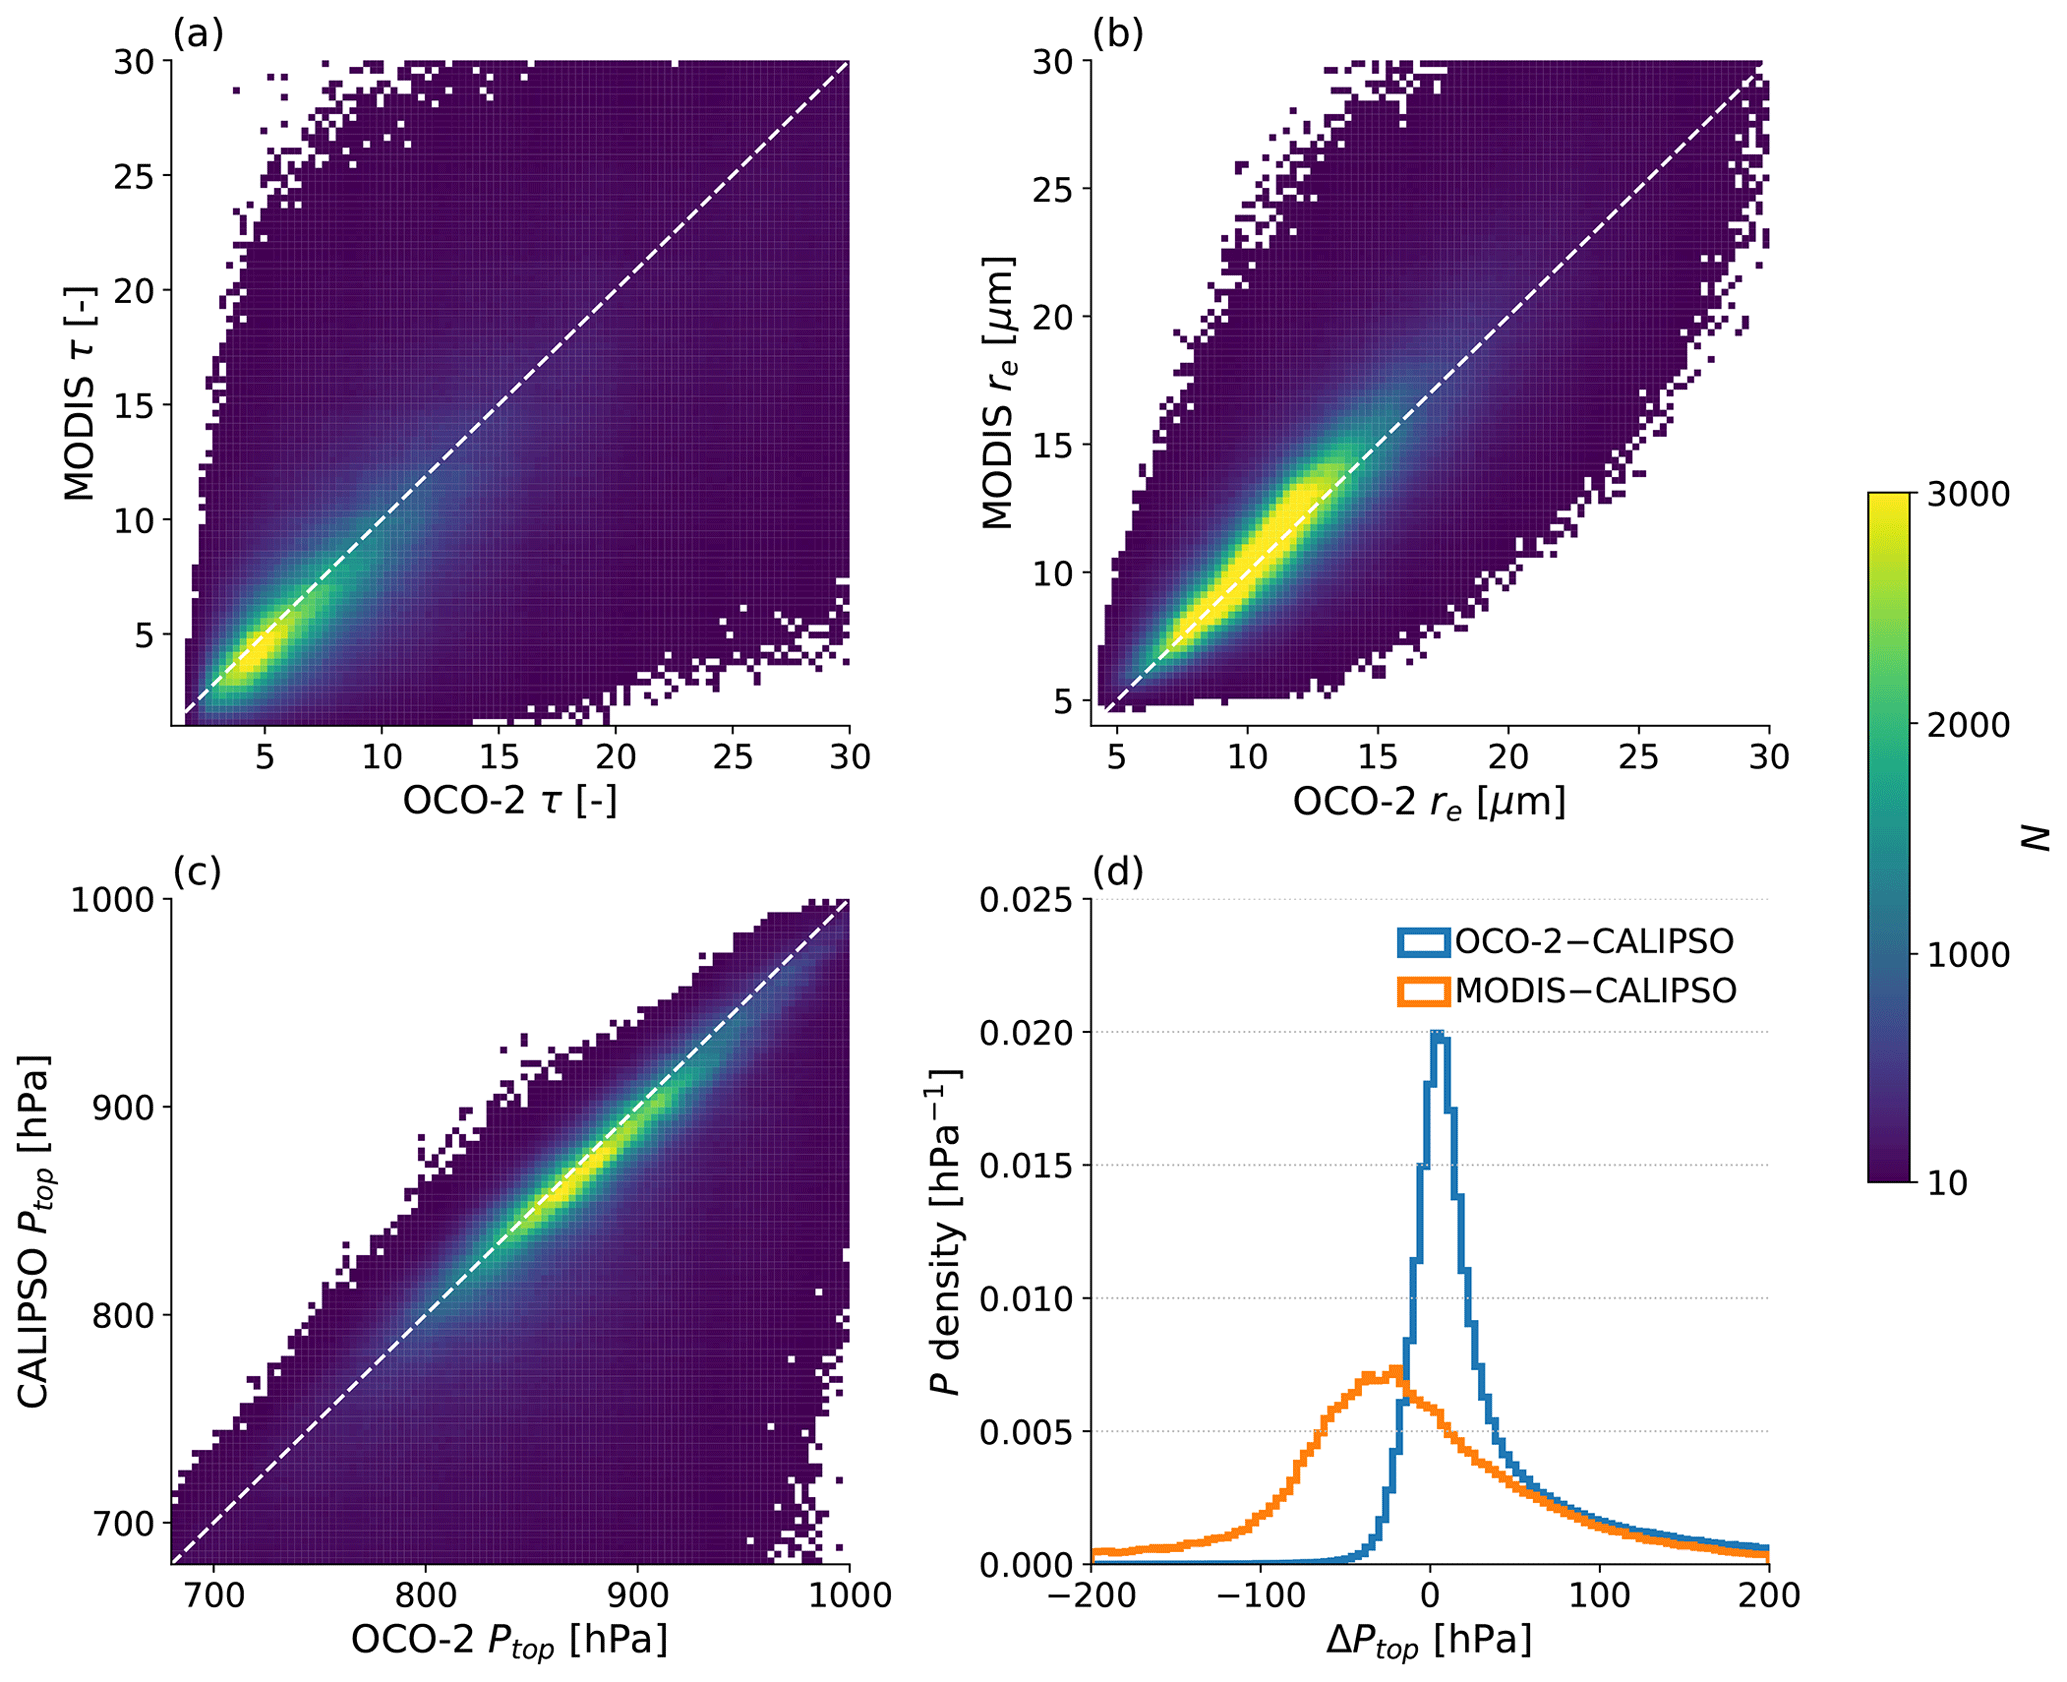
Figure 5Inter-satellite comparison of retrieved cloud properties of (a) MODIS vs. OCO-2 τ, (b) MODIS vs. OCO-2 re, (c) CALIPSO vs. OCO-2 Ptop, and (d) OCO-2 or MODIS Ptop minus CALIPSO Ptop. The colour bar on the right applies to (a, b, c).
We also divide the τ and re differences by the MODIS reported uncertainty (στ,MODIS, σre,MODIS). If the OCO-2 and MODIS retrievals were independent Gaussian with equal variance, then the standard deviation of OCO-2-MODIS differences would be . We find values of 1.26στ,MODIS and 0.37σre,MODIS, indicating that the re retrievals are not independent and that our differences are within the MODIS-reported uncertainties.
We acknowledge discrepancies in the median retrieved τ and re and refer to these as biases. The τ bias grows both with OCO-2 retrieved τ and with the horizontal variability of the scene as displayed in Fig. 6. For this figure, the samples were split into deciles according to the LUT retrieved τ or the MODIS sub-pixel index (SPI) at λ=0.66 µm, which is the standard deviation of the 250 m footprint radiances with a 1 km cloud retrieval divided by the mean of those radiances. Spatial variability and greater optical depths appear to drive much of the τ bias, but we could not identify a dominant factor consistently correlated with the small re bias. These issues are further discussed in Sect. 4.2.
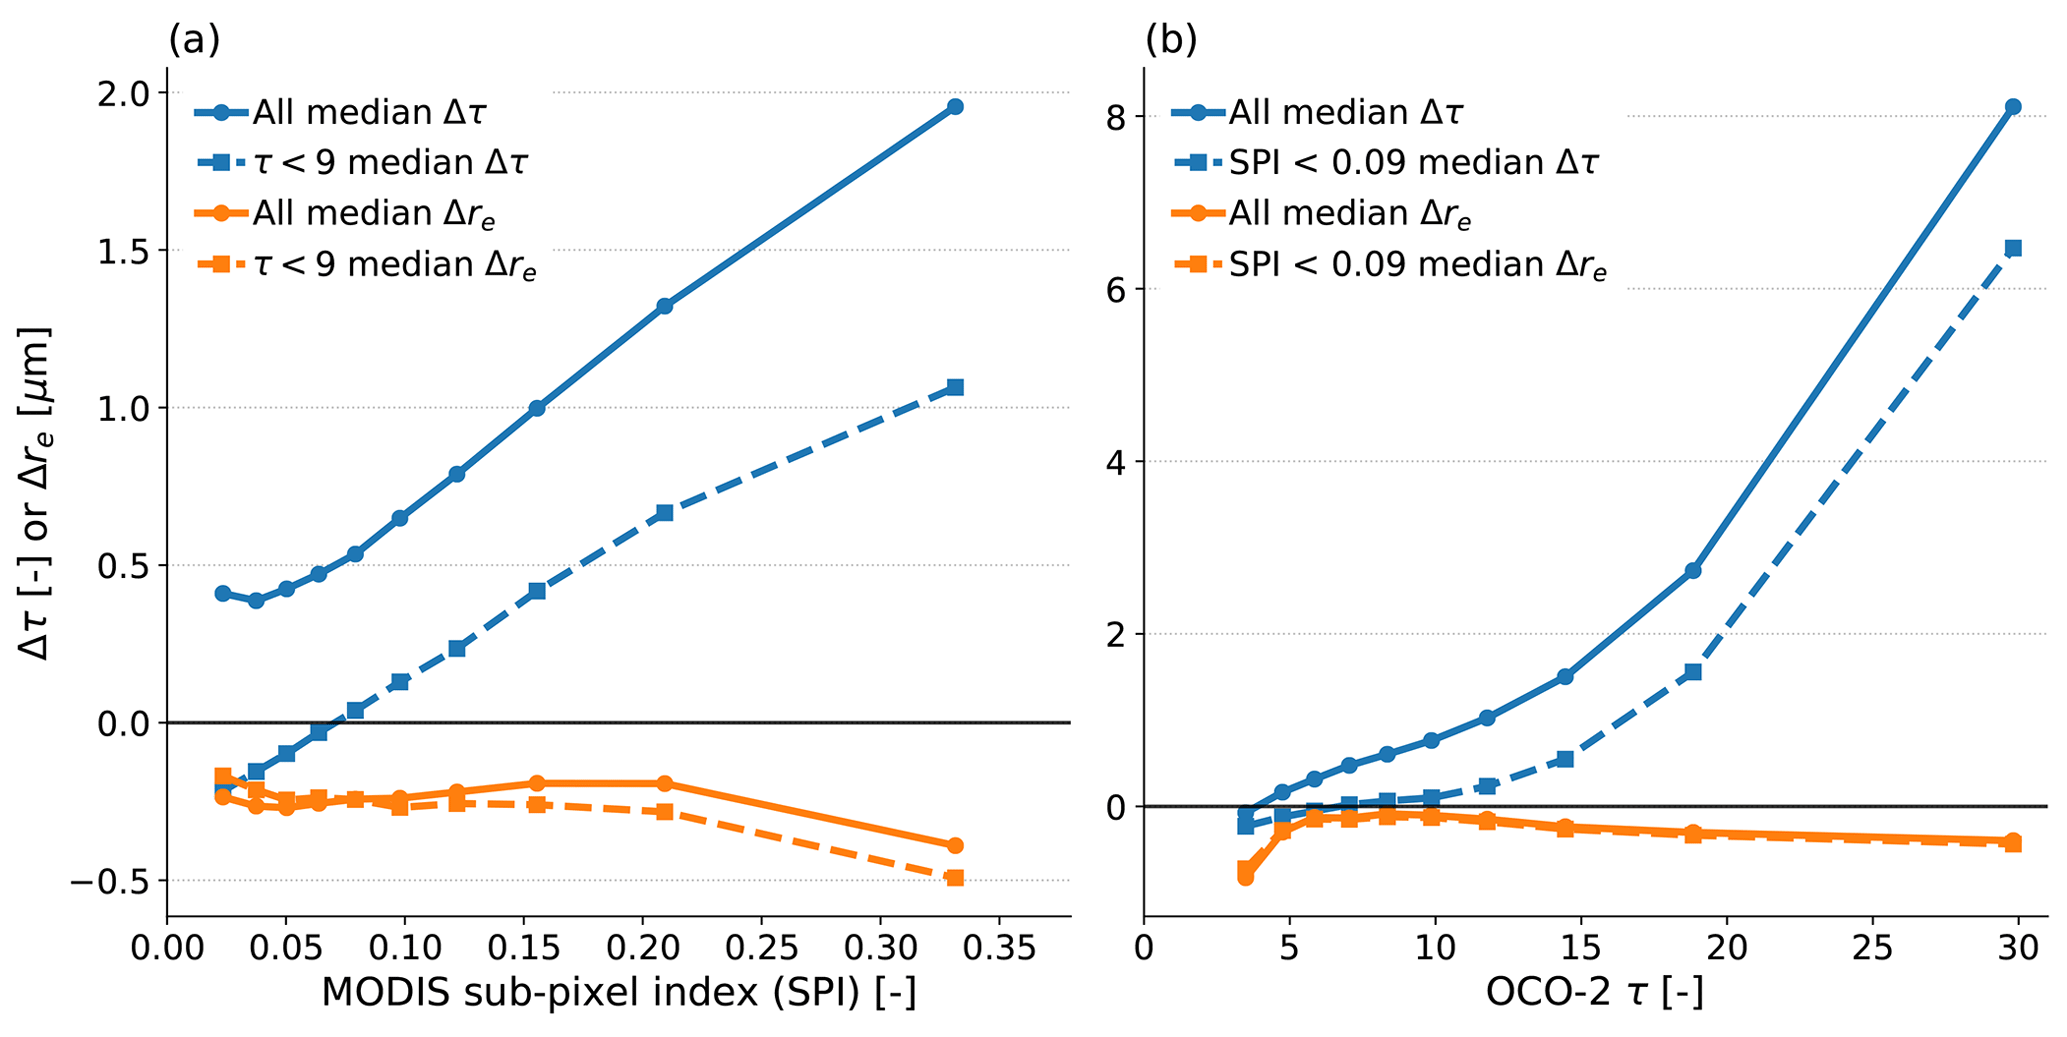
Figure 6Binned median bias in OCO-2 minus MODIS τ (blue) or re (orange) when (a) binned by the MODIS sub-pixel index (SPI) derived from the 250 m sampling at λ=0.66 µm or (b) binned by the OCO-2 LUT retrieved τ. Solid lines are for the full samples, and dashed lines are for the subset (a) below the median OCO-2 τ or (b) below the median MODIS SPI.
3.3 Pre-processor throughput
The multi-layer perceptron classifier passes 5.5 % of all OCO-2 footprints as τ>1 liquid clouds, of which 0.9 % return invalid cloud properties from the LUT, and a further 0.8 % have implied , resulting in a final throughput of 3.8 %. This is smaller than OCO2CLD-LIDAR-AUX, which attempted to retrieve 14.1 % of all soundings. However, most of the difference is due to SZA, and when we restrict the denominator to all footprints with , the throughputs are 13.1 % for OCO2CLD-LIDAR-AUX and 11.7 % for the new classifier or 8.1 % after the LUT thresholds.
Figure 7 displays histograms of selected OCO2CLD-LIDAR-AUX outputs for retrievals split into footprints where the new pre-processor passes the footprint (blue), where the LUT returns invalid properties or (orange), or where the classifier does not pass the footprint (green). The new classifier identifies “better” retrievals that ended with smaller fit errors: median vs. for those not passed (among those with ). The LUT filtering further improves the statistics, with median for those not passed by the LUT retrieval vs. for those successfully retrieved with . The perceptron network also tends to pass clouds that are more optically thick (median τ=8.6 vs. 2.4) and to show a smaller spread in the difference between OCO-2 and CALIPSO Ptop (standard deviation of differences of σ= 33 hPa vs. 55 hPa).

Figure 7Normalised histograms of OCO2CLD-LIDAR-AUX outputs where , separated into whether the soundings pass the new pre-processor flag and retrieval or not. The “passed both” set are those that returned valid cloud properties from the LUT along with ; the “passed-classifier” case gave invalid cloud values or had ; and the “failed-classifier” set are those that were attempted in OCO2CLD-LIDAR-AUX but are not passed by the new classifier. (a) Logarithm of χ2; (b) retrieved τ; (c) Ptop minus the closest CALIPSO retrieved Ptop.
The OCO2CLD-LIDAR-AUX footprints that are excluded by the new pre-processor are consistent with optically thinner clouds and with poorer quality retrievals. Among the footprints that are passed by the new pre-processor, 17.1 % were not attempted in OCO2CLD-LIDAR-AUX.
4.1 Cloud classifier and pre-processor throughput
The cloud classifier's agreement of 90.0 % with MODIS–CALIPSO is similar in performance to the original OCO-2 operational cloud flagging for ocean glint used in the L2FP XCO2 retrieval (Taylor et al., 2016). Furthermore, the multi-layer perceptron network is lightweight (size<250 kB) and fast. It throughputs 11 %–13 % of ocean soundings where , of which under a quarter are poor retrieval candidates according to MODIS–CALIPSO. These cases are consistently (∼69 %) broken or multi-layered cloud scenes, while the missed MODIS–CALIPSO cloud scenes are commonly optically thinner (∼4 times likelier to be τ<3) and colder (∼3 times likelier to have ) than the hit cloud scenes. These thinner and colder samples are also likely to be poor candidates for our target future retrieval of droplet number concentration in warm-topped clouds.
Applying the LUT retrieval further reduces the number of footprints that are taken to be liquid clouds with τ>1. The OCO2CLD-LIDAR-AUX retrieval attempted 13.1 % of footprints; the new classifier LUT pre-processor passes 8.1 %. Figure 7 shows that the excluded footprints tended to be more optically thin, have a larger discrepancy in retrieved Ptop relative to CALIPSO and have a higher χ2. This suggests that the new pre-processor will pass better retrieval candidates to the OE code, thereby improving efficiency. Of those that are now passed, 17 % were not passed by OCO2CLD-LIDAR-AUX. These likely include cases of misidentification that will result in poor-quality retrievals but may also include true cloud cases that were not identified in OCO2CLD-LIDAR-AUX. For example, retrievals were previously classified using the nearest CALIPSO footprint up to 10 km away, and if a cloud was in the OCO-2 field of view but not the CALIPSO field of view, it would not previously have been passed. Overall, the new pre-processor shows good performance in terms of identifying scenes which likely contain liquid clouds with sufficient τ.
4.2 Lookup table cloud property retrieval
The LUT retrieval shows good correlation with MODIS τ and re plus CALIPSO Ptop in Fig. 5. Compared to CALIPSO, the LUT-based Ptop retrievals have a smaller-magnitude bias and 40 % smaller inter-decile range than MODIS. The 12 hPa Ptop bias represents OCO-2 retrieved clouds that are lower in the atmosphere than retrieved by CALIPSO. These statistics may include cases of broken clouds, either above a lower cloud or above the surface; 3-D cloud effects or combined scattering from multiple cloud layers could lead to longer mean photon path lengths and thereby a larger OCO-2 Ptop, assuming that CALIPSO tends to identify the highest layer. We consider full 3-D radiative-transfer treatments to be beyond the scope of this study but point readers to a wide literature on this topic (Davis and Knyazikhin, 2005; Heidinger and Stephens, 2002; Kokhanovsky et al., 2007; Várnai and Marshak, 2002).
Aerosol is ignored in these simulations, as previous analysis using CALIPSO aerosol products showed no change in OCO2CLD-LIDAR-AUX Ptop bias in response to CALIPSO-identified aerosol (Richardson et al., 2019). Furthermore, above-cloud scattering aerosol would tend to reduce photon path length and therefore have an opposite effect on Ptop to our observed bias.
Retrieved Ptop could also change due to the assumed cloud vertical structure and meteorological profile used in the LUT development. If the cloud vertical structure used in the RT differs from reality, then this could lead to incorrectly simulated within-cloud photon paths. Firstly, if the simulated cloud is too geometrically thin (low H) for a given τ or re, then the within-cloud path length will be too small, and the above-cloud path must be lengthened to compensate, resulting in a positive Ptop bias and vice versa for too-high simulated H. This study improves on the OCO2CLD-LIDAR-AUX prior realistically varying H with re in addition to τ, but a bias may remain. In particular, shallow marine clouds tend to have extinction weighted towards the top, which affects the exiting radiance and may introduce Ptop biases which vary with geometry and cloud properties. We intend to perform a separate and more detailed analysis of how realistic vertical cloud profiles affect simulated OCO-2 radiances and determine how to account for such a vertical-structure bias.
With regards to meteorology, a warmer and moister profile broadens the O2 absorption lines, and we expect stronger resultant absorption in the selected channels. Our tropical meteorology may lead to too-strong absorption in non-tropical scenes such that the retrieved cloud is lifted (i.e. lower Ptop) to compensate, but the observed bias is opposite to this. We also retrieved using a LUT developed with the Richardson and Stephens (2018) midlatitude meteorology, where surface temperature is approximately 10 ∘C cooler. The retrieved Ptop distribution shifts as expected with median Ptop bias increasing from 12 to 15 hPa.
Overall the OCO-2 LUT gives better Ptop retrieval statistics than MODIS for these shallow marine clouds, where for these clouds MODIS retrievals rely on brightness temperature at λ∼11 µm and so may misassign Ptop when a temperature inversion is present (Baum et al., 2012). However, OCO-2 has a larger footprint and smaller swath and only retrieves during nadir-view orbits. The Ptop bias relative to CALIPSO is concerning for a future optimal-estimation retrieval, since biased prior properties may subsequently bias the posterior retrieved state in unpredictable ways. We confidently exclude aerosol and meteorology as the main factors in the observed bias and propose that the main candidate processes are a combination of horizontal variability, OCO-2-CALIPSO collocation error and potentially vertical cloud structure. In the future OE retrieval we would expect horizontally non-uniform clouds to produce spectra that are more difficult to match under our RT assumptions, so such cases may be identified by the posterior χ2 statistics. For vertical structure biases, we plan a detailed future investigation.
Retrieved τ and re show good correlation with those from MODIS, and the variance of the differences is smaller than implied by the MODIS-reported uncertainties if the LUT and MODIS uncertainties are independent Gaussian with MODIS' reported variance. However, OCO-2's instrumental noise is lower than MODIS' (single-channel signal-to-noise ratio – SNR – of 300–1200 vs. the MODIS-band-4-specified SNR of 228), so the instrumental uncertainty contribution to the error budget should be smaller for OCO-2. There are also common characteristics between the retrievals, such as the use of fixed droplet size distribution variances, so individual footprint error will covary between the two. Such covariance should further reduce the inter-satellite difference in retrieved τ and re. A quantitative analysis would require a thorough calculation controlling for individual terms in the error budget; we simply conclude that there is no evidence of substantial unexpected variance in our retrieved τ and re.
Of greater concern is the residual OCO-2 minus MODIS differences of 0.77 in τ and to a lesser extent −0.25 µm in re. For τ the bias increases both with horizontal inhomogeneity and with τ, and we expect to be able to identify these clouds scenes using retrieved τ and either OCO-2 developed metrics of spatial variability or future retrieval χ2.
For the re bias we briefly assessed several factors. Horizontal variability tends to increase retrieved re (Werner et al., 2018; Zhang et al., 2012), but we found no evidence of a strong dependence on spatial variability according to MODIS SPI. We also ran the LUT retrieval with a −1 % scaling of Ic, st, which changes median re by +0.2 µm. Such a radiance shift could be necessary due to errors in calibration or in our derived scaling factor of 0.9804, which we used to relate the L1bSc file Ic, st to our lookup table channels. We could therefore reduce our re bias by further scaling the Ic, st radiances, but the scaling was derived from directly comparing the channel radiances rather than as a post hoc correction to improve retrieval results. If the re bias is due to other factors, then this post hoc correction could result in compensating errors which hide other flaws in the retrieval. Instrumentally, the MODIS band 7 used in these re retrievals begins at λ=2.105 µm, outside the strong CO2 band. Changes in CO2 or, more likely, temperature- and vapour-driven broadening or vapour absorption could affect retrieved re. When retrieving with the midlatitude profile LUT described above, the median retrieved re increases by 0.17 µm. Given that the re discrepancy is small, we make no further efforts to explain or reduce it.
Here we developed a new pre-processor for a future optimal-estimation retrieval using the OCO-2 A-band to provide new estimates of droplet number concentration in marine water clouds. This future retrieval aims to address limitations in the previously published OCO2CLD-LIDAR-AUX product by (1) removing the requirement for collocated CALIPSO data now that the satellites are no longer formation-flying and (2) adding OCO-2 information about re to extend the analysis to droplet number concentration. The pre-processor must identify footprints that likely contain liquid clouds of sufficient τ and provide prior properties for the future cloud retrieval. It may also be useful for identifying appropriate footprints on which other researchers could conduct partial-column XCO2 retrievals.
The pre-processor first flags potentially cloudy scenes using a multi-layer perceptron network fed with continuum radiances across all three OCO-2 bands plus a set of absorption band radiances from the O2 A band. The next stage of the retrieval is to use a 3-D lookup table that that jointly retrieves τ, re and Ptop using radiances from two bands plus an A-band absorption ratio. Footprints whose radiances are inconsistent with the lookup table or whose implied Ptop occurs where T<0 ∘C can also be excluded from future retrievals. These footprints were associated with worse fit statistics in OCO2CLD-LIDAR-AUX, implying that the new pre-processor will minimise the waste of computational resources on poor-quality retrievals.
This pre-processor flag shows excellent agreement with MODIS and OCO-2, and the lookup table τ and re compare well with MODIS, while its Ptop shows better retrieval statistics than MODIS, when taking CALIPSO as the truth. Many of the inter-satellite differences are associated with known factors: false positives from the classifier occur when scenes contain broken or multi-layered clouds, and the τ retrieval bias grows with the horizontal heterogeneity of the scene.
A main concern is that the median OCO-2 retrieved Ptop is closer to the surface than CALIPSO's by approximately 12 hPa (∼120 m). The assumed mean cloud extinction or its profile will affect photon paths lengths and so could introduce a bias in retrieved Ptop, and we propose that a detailed analysis of cloud vertical structure is the next and final step before the development of a new OCO-2 cloud retrieval. If successful, this new retrieval would add independent information on cloud droplet number concentration, allowing for attempts to resolve apparent disagreements about low-cloud processes.
The sklearn software is available at https://doi.org/10.5281/zenodo.3971965 (Grisel et al., 2020). ReFRACtor is available at https://doi.org/10.5281/zenodo.4019567 (McDuffie et al., 2020). OCO2CLD-LIDAR-AUX can be downloaded from the CloudSat Data Processing Center (2020) at http://www.cloudsat.cira.colostate.edu/data-products/level-aux/oco2cld-lidar-aux (last access: 1 September 2020).
The supplement related to this article is available online at: https://doi.org/10.5194/amt-13-4947-2020-supplement.
MR contributed to study design, ran the analyses and wrote the paper. JM set up ReFRACtor for cloudy-scene simulations and provided technical support. MDL and GLS contributed to the study design, analysis and drafting of the paper .
The authors declare that they have no conflict of interest.
This work was carried out at the Jet Propulsion Laboratory, California Institute of Technology, under a contract with the National Aeronautics and Space Administration. Government sponsorship is acknowledged. Mark Richardson gratefully acknowledges Aronne Merrelli for his updated cloud scattering property tables that corrected an error in CO2 band absorption and removed resultant biases in retrieved re. Mark Richardson also thanks Annmarie Eldering and Michael Gunson for helpful input related to the OCO-2 mission.
This research has been supported by the National Aeronautics and Space Administration, Jet Propulsion Laboratory (grant no. 80NM0018D0004-80NM0018F0631).
This paper was edited by Alexander Kokhanovsky and reviewed by two anonymous referees.
Baum, B. A., Menzel, W. P., Frey, R. A., Tobin, D. C., Holz, R. E., Ackerman, S. A., Heidinger, A. K., and Yang, P.: MODIS Cloud-Top Property Refinements for Collection 6, J. Appl. Meteorol. Clim., 51, 1145–1163, https://doi.org/10.1175/JAMC-D-11-0203.1, 2012.
Bennartz, R.: Global assessment of marine boundary layer cloud droplet number concentration from satellite, J. Geophys. Res., 112, D02201, https://doi.org/10.1029/2006JD007547, 2007.
Bodas-Salcedo, A., Mulcahy, J. P., Andrews, T., Williams, K. D., Ringer, M. A., Field, P. R., and Elsaesser, G. S.: Strong Dependence of Atmospheric Feedbacks on Mixed-Phase Microphysics and Aerosol-Cloud Interactions in HadGEM3, J. Adv. Model. Earth Sy., 11, 1735–1758, https://doi.org/10.1029/2019MS001688, 2019.
Boesch, H., Brown, L., Castano, R., Christi, M., Connor, B., Crisp, D., Eldering, A., Fisher, B., Frankenberg, C., Gunson, M., Granat, R., McDuffie, J., Miller, C., Natraj, V., O'Brien, D., O'Dell, C., Osterman, G., Oyafuso, F., Payne, V., Polonsky, I., Smyth, M., Spurr, R., Thompson, D., and Toon, G.: Orbiting Carbon Observatory (OCO)-2 Level 2 Full Physics Algorithm Theoretical Basis Document, Pasadena, CA, available at: https://docserver.gesdisc.eosdis.nasa.gov/public/project/OCO/OCO2_L2_ATBD.V8.pdf (last access: 7 September 2020), 2017.
Bony, S. and Dufresne, J.-L.: Marine boundary layer clouds at the heart of tropical cloud feedback uncertainties in climate models, Geophys. Res. Lett., 32, L20806, https://doi.org/10.1029/2005GL023851, 2005.
CloudSat Data Processing Center: http://www.cloudsat.cira.colostate.edu/data-products/level-aux/oco2cld-lidar-aux, last access: 9 September 2020.
Crisp, D.: NASA Orbiting Carbon Observatory: measuring the column averaged carbon dioxide mole fraction from space, J. Appl. Remote Sens., 2, 023508, https://doi.org/10.1117/1.2898457, 2008.
Crisp, D., Atlas, R. M., Breon, F.-M., Brown, L. R., Burrows, J. P., Ciais, P., Connor, B. J., Doney, S. C., Fung, I. Y., Jacob, D. J., Miller, C. E., O'Brien, D., Pawson, S., Randerson, J. T., Rayner, P., Salawitch, R. J., Sander, S. P., Sen, B., Stephens, G. L., Tans, P. P., Toon, G. C., Wennberg, P. O., Wofsy, S. C., Yung, Y. L., Kuang, Z., Chudasama, B., Sprague, G., Weiss, B., Pollock, R., Kenyon, D., and Schroll, S.: The Orbiting Carbon Observatory (OCO) mission, Adv. Space Res., 34, 700–709, https://doi.org/10.1016/j.asr.2003.08.062, 2004.
Davis, A. B. and Knyazikhin, Y.: A Primer in 3D Radiative Transfer, in: 3D Radiative Transfer in Cloudy Atmospheres, Springer-Verlag, Berlin/Heidelberg, 153–242, 2005.
Davis, A. B., Merlin, G., Cornet, C., Labonnote, L. C., Riédi, J., Ferlay, N., Dubuisson, P., Min, Q., Yang, Y., and Marshak, A.: Cloud information content in EPIC/DSCOVR's oxygen A- and B-band channels: An optimal estimation approach, J. Quant. Spectrosc. Ra., 216, 6–16, https://doi.org/10.1016/j.jqsrt.2018.05.007, 2018.
Eldering, A., O'Dell, C. W., Wennberg, P. O., Crisp, D., Gunson, M. R., Viatte, C., Avis, C., Braverman, A., Castano, R., Chang, A., Chapsky, L., Cheng, C., Connor, B., Dang, L., Doran, G., Fisher, B., Frankenberg, C., Fu, D., Granat, R., Hobbs, J., Lee, R. A. M., Mandrake, L., McDuffie, J., Miller, C. E., Myers, V., Natraj, V., O'Brien, D., Osterman, G. B., Oyafuso, F., Payne, V. H., Pollock, H. R., Polonsky, I., Roehl, C. M., Rosenberg, R., Schwandner, F., Smyth, M., Tang, V., Taylor, T. E., To, C., Wunch, D., and Yoshimizu, J.: The Orbiting Carbon Observatory-2: first 18 months of science data products, Atmos. Meas. Tech., 10, 549–563, https://doi.org/10.5194/amt-10-549-2017, 2017.
Ferlay, N., Thieuleux, F., Cornet, C., Davis, A. B., Dubuisson, P., Ducos, F., Parol, F., Riédi, J., and Vanbauce, C.: Toward New Inferences about Cloud Structures from Multidirectional Measurements in the Oxygen A Band: Middle-of-Cloud Pressure and Cloud Geometrical Thickness from POLDER-3/ PARASOL, J. Appl. Meteorol. Climatol., 49, 2492–2507, https://doi.org/10.1175/2010JAMC2550.1, 2010.
Fischer, J. and Grassl, H.: Detection of Cloud-Top Height from Backscattered Radiances within the Oxygen A Band. Part 1: Theoretical Study, J. Appl. Meteorol., 30, 1245–1259, https://doi.org/10.1175/1520-0450(1991)030<1245:DOCTHF>2.0.CO;2, 1991.
Grisel, O., Mueller, A., Lars, Gramfort, A., Louppe, G., Prettenhofer, P., Blondel, M., Niculae, V., Nothman, J., Joly, A., Vanderplas, J., Kumar, M., Fan, T. J., Qin, H., Varoquaux, N., Estève, L., Layton, R., Hug, N., Metzen, J. H., Dawe, N., Lemaitre, G., Jalali, A., Rajagopalan, V. R., Schönberger, J., Yurchak, R., Li, W., Woolam, C., Eren, K., Dupré la Tour, T., and Eustache: scikit-learn/scikit-learn: scikit-learn 0.23.2, Zenodo, https://doi.org/10.5281/zenodo.3971965, 2020.
Grosvenor, D. P., Sourdeval, O., and Wood, R.: Parameterizing cloud top effective radii from satellite retrieved values, accounting for vertical photon transport: quantification and correction of the resulting bias in droplet concentration and liquid water path retrievals, Atmos. Meas. Tech., 11, 4273–4289, https://doi.org/10.5194/amt-11-4273-2018, 2018.
Heidinger, A. K. and Stephens, G. L.: Molecular Line Absorption in a Scattering Atmosphere. Part III: Pathlength Characteristics and Effects of Spatially Heterogeneous Clouds, J. Atmos. Sci., 59, 1641–1654, https://doi.org/10.1175/1520-0469(2002)059<1641:MLAIAS>2.0.CO;2, 2002.
Koelemeijer, R. B. A., Stammes, P., Hovenier, J. W., and de Haan, J. F.: A fast method for retrieval of cloud parameters using oxygen A band measurements from the Global Ozone Monitoring Experiment, J. Geophys. Res. Atmos., 106, 3475–3490, https://doi.org/10.1029/2000JD900657, 2001.
Kokhanovsky, A. A., Rozanov, V. V., Burrows, J. P., Eichmann, K.-U., Lotz, W., and Vountas, M.: The SCIAMACHY cloud products: Algorithms and examples from ENVISAT, Adv. Space Res., 36, 789–799, https://doi.org/10.1016/j.asr.2005.03.026, 2005.
Kokhanovsky, A. A., Mayer, B., Rozanov, V. V., Wapler, K., Burrows, J. P. and Schumann, U.: The influence of broken cloudiness on cloud top height retrievals using nadir observations of backscattered solar radiation in the oxygen A-band, J. Quant. Spectrosc. Ra., 103, 460–477, https://doi.org/10.1016/j.jqsrt.2006.06.003, 2007.
L'Ecuyer, T. S. and Jiang, J. H.: Touring the atmosphere aboard the A-Train, Phys. Today, 63, 36–41, https://doi.org/10.1063/1.3463626, 2010.
Lindstrot, R., Preusker, R., Ruhtz, T., Heese, B., Wiegner, M., Lindemann, C., and Fischer, J.: Validation of MERIS Cloud-Top Pressure Using Airborne Lidar Measurements, J. Appl. Meteorol. Clim., 45, 1612–1621, https://doi.org/10.1175/JAM2436.1, 2006.
Loyola, D. G., Gimeno García, S., Lutz, R., Argyrouli, A., Romahn, F., Spurr, R. J. D., Pedergnana, M., Doicu, A., Molina García, V., and Schüssler, O.: The operational cloud retrieval algorithms from TROPOMI on board Sentinel-5 Precursor, Atmos. Meas. Tech., 11, 409–427, https://doi.org/10.5194/amt-11-409-2018, 2018.
McDuffie, J., Bowman, K., Hobbs, J., Natraj, V., Sarkissian, E., Smyth, M., Thill, M., and Val, S.: Reusable Framework for Retrieval of Atmospheric Composition (ReFRACtor) (Version 1.09), Zenodo, https://doi.org/10.5281/zenodo.4019567, 2020.
Merlin, G., Riedi, J., Labonnote, L. C., Cornet, C., Davis, A. B., Dubuisson, P., Desmons, M., Ferlay, N., and Parol, F.: Cloud information content analysis of multi-angular measurements in the oxygen A-band: application to 3MI and MSPI, Atmos. Meas. Tech., 9, 4977–4995, https://doi.org/10.5194/amt-9-4977-2016, 2016.
Nakajima, T. and King, M. D.: Determination of the Optical Thickness and Effective Particle Radius of Clouds from Reflected Solar Radiation Measurements. Part I: Theory, J. Atmos. Sci., 47, 1878–1893, https://doi.org/10.1175/1520-0469(1990)047<1878:DOTOTA>2.0.CO;2, 1990.
Natraj, V. and Spurr, R. J. D.: A fast linearized pseudo-spherical two orders of scattering model to account for polarization in vertically inhomogeneous scattering–absorbing media, J. Quant. Spectrosc. Ra., 107, 263–293, https://doi.org/10.1016/j.jqsrt.2007.02.011, 2007.
O'Brien, D. M. and Mitchell, R. M.: Error Estimates for Retrieval of Cloud-Top Pressure Using Absorption in the A Band of Oxygen, J. Appl. Meteorol., 31, 1179–1192, https://doi.org/10.1175/1520-0450(1992)031<1179:EEFROC>2.0.CO;2, 1992.
O'Dell, C. W.: Acceleration of multiple-scattering, hyperspectral radiative transfer calculations via low-streams interpolation, J. Geophys. Res., 115, D10206, https://doi.org/10.1029/2009JD012803, 2010.
O'Dell, C. W., Connor, B., Bösch, H., O'Brien, D., Frankenberg, C., Castano, R., Christi, M., Eldering, D., Fisher, B., Gunson, M., McDuffie, J., Miller, C. E., Natraj, V., Oyafuso, F., Polonsky, I., Smyth, M., Taylor, T., Toon, G. C., Wennberg, P. O., and Wunch, D.: The ACOS CO2 retrieval algorithm – Part 1: Description and validation against synthetic observations, Atmos. Meas. Tech., 5, 99–121, https://doi.org/10.5194/amt-5-99-2012, 2012.
Painemal, D. and Zuidema, P.: Assessment of MODIS cloud effective radius and optical thickness retrievals over the Southeast Pacific with VOCALS-REx in situ measurements, J. Geophys. Res., 116, D24206, https://doi.org/10.1029/2011JD016155, 2011.
Pedregosa, F., Varoquaux, G., Gramfort, A., Michel, V., Thirion, B., Grisel, O., Blondel, M., Prettenhofer, P., Weiss, R., Dubourg, V., Vanderplas, J., Passos, A., Cournapeau, D., Brucher, M., Perrot, M., and Duchesnay, E.: Scikit-learn: Machine Learning in Python, J. Mach. Learn. Res., 12, 2825–2830, 2011.
Preusker, R., Fischer, J., Albert, P., Bennartz, R., and Schüller, L.: Cloud-top pressure retrieval using the oxygen A-band in the IRS-3 MOS instrument, Int. J. Remote Sens., 28, 1957–1967, https://doi.org/10.1080/01431160600641632, 2007.
Richardson, M. and Stephens, G. L.: Information content of OCO-2 oxygen A-band channels for retrieving marine liquid cloud properties, Atmos. Meas. Tech., 11, 1515–1528, https://doi.org/10.5194/amt-11-1515-2018, 2018.
Richardson, M., McDuffie, J., Stephens, G. L., Cronk, H. Q., and Taylor, T. E.: The OCO-2 oxygen A-band response to liquid marine cloud properties from CALIPSO and MODIS, J. Geophys. Res.-Atmos., 122, 8255–8275, https://doi.org/10.1002/2017JD026561, 2017.
Richardson, M., Leinonen, J., Cronk, H. Q., McDuffie, J., Lebsock, M. D., and Stephens, G. L.: Marine liquid cloud geometric thickness retrieved from OCO-2's oxygen A-band spectrometer, Atmos. Meas. Tech., 12, 1717–1737, https://doi.org/10.5194/amt-12-1717-2019, 2019.
Rodgers, C. D.: Inverse Methods for Atmospheric Sounding Theory and Practice, World Scientific, Singapore, 2000.
Rosenfeld, D., Zhu, Y., Wang, M., Zheng, Y., Goren, T., and Yu, S.: Aerosol-driven droplet concentrations dominate coverage and water of oceanic low-level clouds, Science, 363, eaav0566, https://doi.org/10.1126/science.aav0566, 2019.
Rozanov, V. V. and Kokhanovsky, A. A.: Semianalytical cloud retrieval algorithm as applied to the cloud top altitude and the cloud geometrical thickness determination from top-of-atmosphere reflectance measurements in the oxygen A band, J. Geophys. Res., 109, D05202, https://doi.org/10.1029/2003JD004104, 2004.
Schepers, D., Butz, A., Hu, H., Hasekamp, O. P., Arnold, S. G., Schneider, M., Feist, D. G., Morino, I., Pollard, D., Aben, I., and Landgraf, J.: Methane and carbon dioxide total column retrievals from cloudy GOSAT soundings over the oceans, J. Geophys. Res.-Atmos., 121, 5031–5050, https://doi.org/10.1002/2015JD023389, 2016.
Schuessler, O., Loyola Rodriguez, D. G., Doicu, A., and Spurr, R.: Information Content in the Oxygen A-Band for the Retrieval of Macrophysical Cloud Parameters, IEEE T. Geosci. Remote Sens., 52, 3246–3255, https://doi.org/10.1109/TGRS.2013.2271986, 2014.
Spurr, R. J. D.: VLIDORT: A linearized pseudo-spherical vector discrete ordinate radiative transfer code for forward model and retrieval studies in multilayer multiple scattering media, J. Quant. Spectrosc. Ra., 102, 316–342, https://doi.org/10.1016/j.jqsrt.2006.05.005, 2006.
Szczodrak, M., Austin, P. H., and Krummel, P. B.: Variability of Optical Depth and Effective Radius in Marine Stratocumulus Clouds, J. Atmos. Sci., 58, 2912–2926, https://doi.org/10.1175/1520-0469(2001)058<2912:VOODAE>2.0.CO;2, 2001.
Taylor, T. E., O'Dell, C. W., Frankenberg, C., Partain, P. T., Cronk, H. Q., Savtchenko, A., Nelson, R. R., Rosenthal, E. J., Chang, A. Y., Fisher, B., Osterman, G. B., Pollock, R. H., Crisp, D., Eldering, A., and Gunson, M. R.: Orbiting Carbon Observatory-2 (OCO-2) cloud screening algorithms: validation against collocated MODIS and CALIOP data, Atmos. Meas. Tech., 9, 973–989, https://doi.org/10.5194/amt-9-973-2016, 2016.
Toll, V., Christensen, M., Quaas, J., and Bellouin, N.: Weak average liquid-cloud-water response to anthropogenic aerosols, Nature, 572, 51–55, https://doi.org/10.1038/s41586-019-1423-9, 2019.
Vanbauce, C., Buriez, J. C., Parol, F., Bonnel, B., Sèze, G., and Couvert, P.: Apparent pressure derived from ADEOS-POLDER observations in the oxygen A-band over ocean, Geophys. Res. Lett., 25, 3159–3162, https://doi.org/10.1029/98GL02324, 1998.
Várnai, T. and Marshak, A.: Observations of Three-Dimensional Radiative Effects that Influence MODIS Cloud Optical Thickness Retrievals, J. Atmos. Sci., 59, 1607–1618, https://doi.org/10.1175/1520-0469(2002)059<1607:OOTDRE>2.0.CO;2, 2002.
Vidot, J., Bennartz, R., O'Dell, C. W., Preusker, R., Lindstrot, R., and Heidinger, A. K.: CO2 Retrieval over Clouds from the OCO Mission: Model Simulations and Error Analysis, J. Atmos. Ocean. Tech., 26, 1090–1104, https://doi.org/10.1175/2009JTECHA1200.1, 2009.
Werner, F., Zhang, Z., Wind, G., Miller, D. J., and Platnick, S.: Quantifying the Impacts of Subpixel Reflectance Variability on Cloud Optical Thickness and Effective Radius Retrievals Based On High-Resolution ASTER Observations, J. Geophys. Res.-Atmos., 123, 4239–4258, https://doi.org/10.1002/2017JD027916, 2018.
Yamamoto, G. and Wark, D. Q.: Discussion of the letter by R. A. Hanel, “Determination of cloud altitude from a satellite,” J. Geophys. Res., 66, 3596–3596, https://doi.org/10.1029/JZ066i010p03596, 1961.
Yang, Y., Marshak, A., Mao, J., Lyapustin, A., and Herman, J.: A method of retrieving cloud top height and cloud geometrical thickness with oxygen A and B bands for the Deep Space Climate Observatory (DSCOVR) mission: Radiative transfer simulations, J. Quant. Spectrosc. Ra., 122, 141–149, https://doi.org/10.1016/j.jqsrt.2012.09.017, 2013.
Zelinka, M. D., Myers, T. A., McCoy, D. T., Po-Chedley, S., Caldwell, P. M., Ceppi, P., Klein, S. A., and Taylor, K. E.: Causes of higher climate sensitivity in CMIP6 models, Geophys. Res. Lett., 47, e2019GL085782, https://doi.org/10.1029/2019GL085782, 2020.
Zhang, Z., Ackerman, A. S., Feingold, G., Platnick, S., Pincus, R., and Xue, H.: Effects of cloud horizontal inhomogeneity and drizzle on remote sensing of cloud droplet effective radius: Case studies based on large-eddy simulations, J. Geophys. Res. Atmos., 117, 19208, https://doi.org/10.1029/2012JD017655, 2012.
Zhou, Y., Yang, Y., Gao, M., and Zhai, P.-W.: Cloud detection over snow and ice with oxygen A- and B-band observations from the Earth Polychromatic Imaging Camera (EPIC), Atmos. Meas. Tech., 13, 1575–1591, https://doi.org/10.5194/amt-13-1575-2020, 2020.