the Creative Commons Attribution 4.0 License.
the Creative Commons Attribution 4.0 License.
 | 18 Sep 2020
Validating HY-2A CMR precipitable water vapor using ground-based and shipborne GNSS observations
Yanxiong Liu
Yang Liu
Xiufeng He
Wenxue Xu
Maorong Ge
Harald Schuh
The calibration microwave radiometer (CMR) on board the Haiyang-2A (HY-2A) satellite provides wet tropospheric delay correction for altimetry data, which can also contribute to the understanding of climate system and weather processes. The ground-based global navigation satellite system (GNSS) provides precise precipitable water vapor (PWV) with high temporal resolution and could be used for calibration and monitoring of the CMR data, and shipborne GNSS provides accurate PWV over open oceans, which can be directly compared with uncontaminated CMR data. In this study, the HY-2A CMR water vapor product is validated using ground-based GNSS observations of 100 International GNSS Service (IGS) stations along the global coastline and 56 d shipborne GNSS observations over the Indian Ocean. The processing strategy for GNSS data and CMR data is discussed in detail. Special efforts were made in the quality control and reconstruction of contaminated CMR data. The validation result shows that HY-2A CMR PWV agrees well with ground-based GNSS PWV with 2.67 mm as the root mean square (rms) within 100 km. Geographically, the rms is 1.12 mm in the polar region and 2.78 mm elsewhere. The PWV agreement between HY-2A and shipborne GNSS shows a significant correlation with the distance between the ship and the satellite footprint, with an rms of 1.57 mm for the distance threshold of 100 km. Ground-based GNSS and shipborne GNSS agree with HY-2A CMR well.
- Article
(3133 KB) - Full-text XML
- BibTeX
- EndNote


Sea surface height measurement is mainly implemented by satellite altimetry, where the precise tropospheric delay is required to correct the atmosphere propagation error in the measured distance between satellite and sea surface (Obligis et al., 2011). Since the wet delay, which can also be quantified by precipitable water vapor (PWV), in meteorology changes rather fast in space and time, the wet delay is measured with onboard water vapor radiometers. On the other hand, PWV is an essential factor in the weather and climate system (Randall et al., 2007); especially PWV over oceans it plays a paramount role, as more than 80 % of atmospheric water vapor comes from the ocean evaporation. Until now, PWV over ocean is mainly obtained by satellite-borne infrared sensors (e.g., Moderate Resolution Imaging Spectroradiometer, Fengyun-2C) and microwave radiometers (e.g., Special Sensor Microwave/Imager, Tropical Rainfall Measuring Mission's Microwave Imager) (Nelson et al., 2016), and its spatial and temporal resolution can be improved if PWV of altimeter satellites, such as Haiyang-2A (HY-2A) can be included.
HY-2A is a Chinese ocean observation satellite launched on 15 August 2011, operating in a sun-synchronous orbit. The objective of HY-2A is to monitor the dynamic ocean environment with microwave sensors to detect sea surface wind field, sea surface height, and sea surface temperature. It is equipped with a dual-frequency (13.58 and 5.2 GHz) altimeter, a calibration microwave radiometer (CMR), a microwave scatterometer, and a scanning microwave radiometer (Jiang et al., 2012). The HY-2A CMR is a nadir-looking passive radiometer with three frequencies (18.7, 23.8, and 37 GHz) and the footprint of the CMR is ∼40 km (Wang et al., 2014). The wet delay and PWV retrieved from CMR-measured brightness temperature (TB) were used for satellite altimetry observations correction and marine weather observation as well (Zhang et al., 2015).
Although the HY-2A CMR was calibrated in the laboratory before launching (Zhang et al., 2014), due to the quite different space environment, in-orbit validation was carried out subsequently. The onboard validation was mainly conducted by comparing the PWV of the HY-2A CMR with that of other altimetry satellites, e.g., Jason 1/2 (Zheng et al., 2014a), or using a numerical weather model (NWM) and radiosondes (Wang et al., 2014; Zhao et al., 2016). Furthermore, microwave components will inevitably have aging phenomena; for instance, the Jason-1 and ENVISAT wet tropospheric delay have a drift of 1 mm yr−1 (Brown, 2013; Obligis et al., 2006). The HY-2A altimetry values also show systematic biases in space and time (Peng et al., 2015; Yang et al., 2016), and the wet tropospheric delay drift is confirmed as one of the reasons (Peng, 2015). Moreover, a hardware problem of the 18.7 GHz band since June 2017 was reported (Wu et al., 2019). Therefore, the long-term validation and calibration of CMR data are vital for HY-2A applications.
Furthermore, in the observation of HY-2A CMR, only TB measurements over the ocean can be converted into PWV; the measurement in transition areas, where it happens very often that one footprint covers partly over the sea and partly over the land surface, will be contaminated. Special handling and specific quality control measures should be imposed (Brown, 2010; Fernandes et al., 2003, 2010).
GNSS observations have been used for atmosphere sounding since the 1990s (Bevis et al., 1992, 1994; Manandhar et al., 2018). PWV with an accuracy of 2 mm can be retrieved from ground-based GNSS observations (Gendt et al., 2004; Li et al., 2015; Wang and Liu, 2019) and has been successfully used for NWM assimilation (Gutman et al., 2004). Meanwhile, GNSS PWV retrieval using moving platforms over the ocean, such as ship and buoy, has been demonstrated with an accuracy of 1–3 mm (Kealy et al., 2012; Rocken et al., 2005; Wang et al., 2019). Therefore, GNSS PWV from coastal stations and especially that from moving platforms over the ocean could be a resource with higher accuracy and resolution for validating and potential calibrating of HY-2A CMR data. Liu et al. (2019) investigated the agreement of shipborne GNSS PWV over the Indian Ocean and HY-2A CMR PWV, where more attention was paid to the GNSS-PWV uncertainty, i.e., the influence of zenith total delay (ZTD) estimates from different software, the potential error induced by weighted mean temperature and atmospheric pressure, etc. And strict criteria were applied when choosing the crossovers to ensure the best agreement, which results in only four crossovers used. In this paper, we focus more on the HY-2A PWV evaluation on a global scale using 100 ground GNSS stations, and the potential agreement between shipborne GNSS PWV and HY-2A observation under different distance criteria is also discussed.
The paper is arranged as follows. Section 2 presents the data processing strategy, including the PWV retrieval from both ground-based and shipborne GNSS observations, and the reconstruction and quality control of HY-2A PWV of coastal footprints. Section 3 introduces the data used in the study including HY-2A CMR PWV and ground-based and shipborne GNSS observations. Section 4 summarizes the major achievements and conclusions.
In this section, we introduce the processing strategy of ground-based and shipborne GNSS observations. The height correction for PWV of ground-based GNSS is also discussed. Then we present the HY-2A CMR retrieval method and the reconstruction algorithm of coastal HY-2A CMR contaminated data based on European Centre for Medium-Range Weather Forecasts (ECMWF) ERA-Interim layer data.
2.1 GNSS data processing
The ground-based and shipborne GNSS – global navigation system (GPS) plus Globalnaya Navigatsionnaya Sputnikovaya (GLONASS) or GPS – data were processed using the Position And Navigation Data Analyst (PANDA) (Liu and Ge, 2003; Shi et al., 2008) in static and kinematic precise-point-positioning (PPP) mode, respectively.
GNSS data from 100 IGS stations during the day of the year (DOY 91–147) in 2014 were collected. In the processing, ionosphere-free pseudo-range and phase observations were used with a cutoff elevation angle of 7∘. The precise satellite orbit and clock products from the GeoForschungsZentrum (GFZ) were used. Satellite and station antenna phase-center offsets and variations were corrected using the IGS antenna file (igs08.atx), and the phase windup was fixed (Wu et al., 1993). The station displacements caused by solid earth tides, ocean tides, and pole tide were removed following the IERS 2010 Convention (Petit and Luzum, 2010).
The pressure and temperature from global pressure and temperature (GPT) (Böhm et al., 2007) were used to derive a priori hydrostatic and wet zenith delays with the Saastamoinen model (Saastamoinen, 1972). Global mapping function (GMF) (Böhm et al., 2006) was used to map zenith delay to the satellite signal transmitting path. ZTD was estimated as a random-walk process with a noise power density of (Kouba and Héroux, 2001) and the horizontal tropospheric gradients every 2 h as random-walk parameters with power density.
For the 30 s resampled shipborne GPS+GLONASS observations, the processing strategy is similar but in kinematic mode, where the receiver antenna coordinates were estimated as epoch-wise parameters. The pressure data were from the shipboard equipment.
Afterward, zenith wet delay (ZWD) was derived by subtracting zenith hydrostatic delay (ZHD) from the estimated ZTD where ZHD was calculated from the ERA-Interim layer pressure data provided by ECMWF (Dee et al., 2011). Then ZWD was converted to PWV with the following equation:
where ρw is the liquid water density, Rv=461.495 J (kg K)−1, which is the water-vapor-specific gas constant, K hPa−1, k3=375 463 K2 hPa−1 (Böhm and Schuh, 2013). Tm is the atmosphere-weighted mean temperature derived from the ERA-Interim product (Davis et al., 1985). The uncertainty in ground-based GNSS PWV is less than 1 mm (Ning et al., 2016), and the uncertainty in shipborne GNSS PWV is less than 3 mm (Liu et al., 2019).
For comparison, GNSS-derived PWV must be aligned to the same elevation as the HY-2A PWV observations. The orthometric height of stations was calculated as the ellipsoid height from GNSS positioning minus the geoid undulation from the Earth Gravitational Model 2008 (EGM2008). The height correction based on ERA-Interim layer data is as follows: (1) for each station, calculate the ERA-Interim PWV values at the station elevation and at sea level; (2) the PWV difference between these two elevations is used as the PWV height correction; (3) realign the GNSS PWV to sea level by adding the ERA-Interim-derived PWV height correction to the original GNSS PWV.
Figure 1 shows the biases between ECMWF PWV and GNSS PWV before and after the height correction on all the GNSS stations along with station height. The apparent height-related bias is reduced significantly, especially for the five stations over 1000 m. It should be mentioned that the PWV difference scatters at each station are also improved because of height correction. In general, the corresponding PWV rms is reduced to from 5.01 to 2.12 mm.

Figure 1PWV biases between GNSS and ECMWF at all the GNSS stations without (red dots) and with (black cycles) height correction.
2.2 HY-2A PWV observation processing
The processing of HY-2A CMR contains three steps: antenna temperature calibration, TB adjustment, and PWV retrieval. The first two steps have been done by the data provider during the conversion from level 0 to level 1 data, which are not discussed in detail here. In this study, we focus on the validation of level 2 data.
The PWV retrieval algorithm of the HY-2A CMR uses an empirical regression model based on the TB values from level 1 and PWV from the global database (Robinson, 2004). There are mainly two regression models to retrieve water vapor products: neural network algorithm and log–linear regression (Brown et al., 2004; Obligis et al., 2006; Thao et al., 2015). For HY-2A CMR data, the log–linear regression algorithm is widely used (Wang and Zhang, 2008; Zheng et al., 2014b). The model reads as
where TB18.7, TB23.8, and TB37 are the TB in kelvin of the three frequencies (18.7, 23.8, and 37 GHz), respectively. a0, a18.7, b18.7, a23.8, b23.8, a37, and b37 are the coefficients in the retrieval models. These coefficients must be estimated using external PWV datasets, e.g., NWM, radiosonde profiles, or previous satellite altimetry missions. This procedure is referred as the calibration of CMR data and should be carried out carefully and updated in time in order to obtain accurate PWV observations. In our study we used the product from the National Ocean Satellite Application Center (NSOAS), Ministry of Natural Resources (MNR) of China. The uncertainty in the CMR PWV dataset is less than 3 mm according to the 7 years of in-flight CMR observations (Wu et al., 2019).
For each transit of HY-2A to a ground GNSS station, there are a number of crossover points at different distances to the station. To avoid the potential large bias caused by a single point, the crossover points within 100 km from the GNSS station are used with the inverse distance weighting (IDW) interpolation:
where PWV(s) is the virtual measurement of HY-2A CMR at the GNSS station, ωi(s) is the weight value, and PWVi is the PWV of HY-2A crossover point. d(s, si) is the distance between the crossover point and the GNSS station, which is always larger than 0 since the GNSS stations located several kilometers away from the coastline.
From the weight in Eq. (3), we need the CMR observations of the crossover points geometrically close to the ground station. However, the quality of these observations could be rather poor, as they may contain the contribution of reflected signals from both land/ice and ocean, which have different emissivity characters. Therefore, HY-2A CMR data quality control is very crucial. First of all, the footprints flagged as “land” and “ice” must be excluded in advance. Then, the footprints flagged as “ocean” close to coastal regions should be checked carefully, due to the potential land contamination where the 40 km footprint may cover both ocean and land but be flagged as “ocean”.
The sampling interval of HY-2A CMR is 1 s, and the moving speed of the footprint is approximately 6 km s−1; thus the variation in HY-2A CMR PWV between consecutive epochs should be very smooth. Therefore, a linear fitting of HY-2A CMR PWV could be used for quality control in principle. However, for the regions with complex terrain, such as an archipelago, where there are more outliers than useful crossover points, the linear fit does not work. Therefore, a reliable external dataset is necessary for quality control. In this study, the vertical integral of water vapor (VIWV) from ERA-Interim surface product was used, and the PWV differences between HY-2A CMR and ECMWF at crossover points should be small and stable. Those with extremely large values (differences over 3 times the standard deviation value of the differences) were considered as contaminated points, and the remaining CMR data were taken as clean points.
The reconstruction of contaminated HY-2A PWV is usually implemented in the following two scenarios: (1) near the coastline where clean points are available only on the ocean side and (2) near the peninsula or small islands, where clean points before and after the contaminated point are available. The algorithm for the reconstruction of contaminated HY-2A CMR PWV can be summarized as follows (Fernandes et al., 2003):
where PWVhy_rec is the reconstructed HY-2A PWV at the crossover point, and PWVecmwf is the ECMWF PWV at this crossover point.
In Eq. (5), f(PWVhy_clean,PWVecmwf_clean) is a linear function to calculate the PWV differences between HY-2A CMR and ECMWF at the contaminated crossover points based on the differences between all the clean points. For the first case, the difference is extrapolated using the PWV differences between HY-2A and ECMWF of the clean points on one side, while for the second case, it is interpolated using the PWV differences between HY-2A and ECMWF of clean points on both sides.
The HY-2A CMR observations (DOY 123 and DOY 128, 2014) in Southeast Asia were used as an example to illustrate the coastal PWV reconstruction. The two trajectories of HY-2A traversed Malaysia and Indonesia in parallel, shown in the right panel of Fig. 2, including three representative terrain types, i.e., continental coast, peninsula, and islands. Meanwhile, as the PWV value in this low-latitude coastal area is rather large (>50 mm), a careful reconstruction should be implemented. The reconstruction of contaminated HY-2A CMR data was carried out with the ECMWF as the background field. As shown in the left panel of Fig. 2, the HY-2A PWV observations at coastal areas could be largely biased, by up to 100 mm, marked with red dots from the clean observations with green dots. By applying the aforementioned reconstruction algorithm, the reconstructed PWV observations show a much better agreement with the clean observations. The average value of the PWV biases between HY-2A CMR and ECMWF was reduced from 5.52 to 2.78 mm, while the standard deviation (SD) was reduced from 13.18 to 2.71 mm.

Figure 2HY-2A PWV observations on DOY 123 (left – upper) and DOY 128 (left – bottom) in 2014, where the clean, contaminated, and reconstructed observations are shown as green dots, red dots, and black dots, respectively. The right y axis is the label of clean points (value 1) and contaminated points (value 0). The right panel illustrates the satellite trajectory on DOY 123 and DOY 128, where the clean and contaminated footprints are shown in gray and red dots, respectively.
3.1 HY-2A CMR PWV observations
The CMR PWV products used were provided by the NSOAS, MNR of China. Two months of HY-2A CMR in-orbit data for the period of DOY 91–147, 2014, were used. The raw HY-2A PWV observations were processed with a complicated outlier detection method and coastal observation reconstruction was implemented on the HY-2A PWV observations, as mentioned in Sect. 2.2.
3.2 Ground-based GNSS observations
Figure 3 shows the distribution of 100 IGS stations used for the HY-2A CMR PWV comparison, including 46 stations located on islands and 54 stations located on mainland coastline. Each station has at least one crossover point within 100 km compared with the HY-2A subsatellite point during the experiment period. Most of the stations are below 200 m, and five stations are above 1000 m. The GPS observations were used for all these stations, and the GLONASS observations were used whenever available.
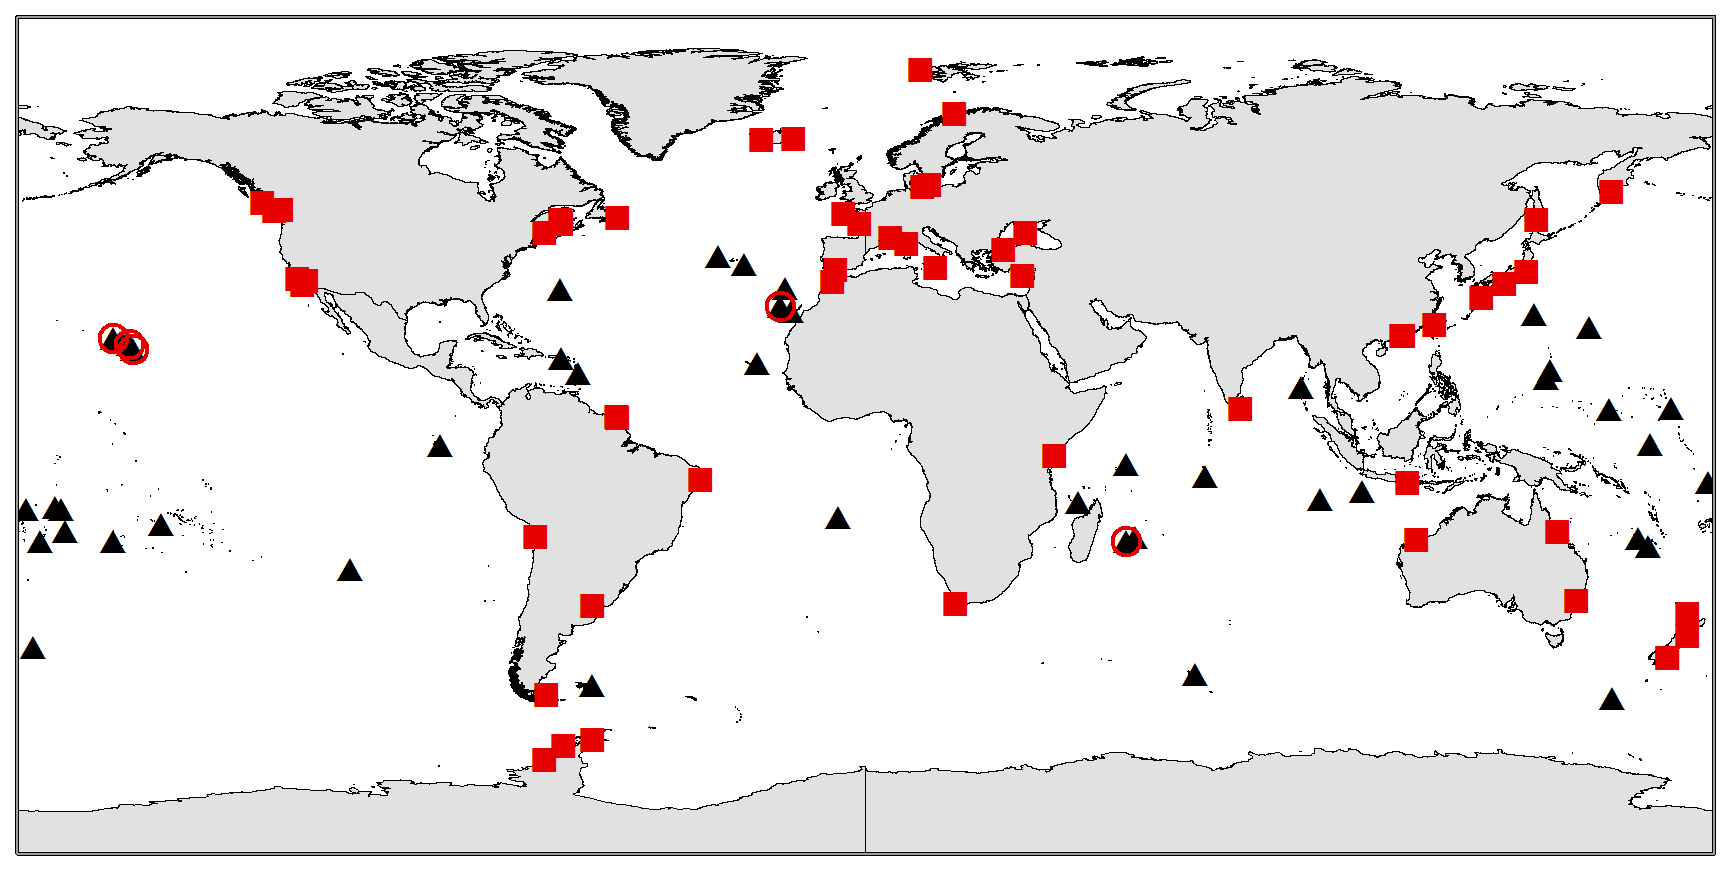
Figure 3The distribution of GNSS sites within 100 km compared to HY-2A subsatellite points, including 46 on islands (black triangle) and 56 on the mainland coastline (red square). Five of them (red circle) are higher than 1000 m.
3.3 Shipborne GNSS observations
The scientific survey of the Indian Ocean during DOY 91–146 in 2014 and the ship trajectory is shown in Fig. 4. The voyage started from Guangzhou, China, and went through the Sunda Strait into the Indian Ocean, sailing along the equatorial region, and arrived in Sri Lanka, finally returning to Guangzhou via the Malacca Strait. The ship was equipped with a TPS NET-G3A GNSS reference receiver to collect 1 Hz GPS+GLONASS data, where the choke ring antenna was used to reduce the multipath effect.

Figure 4The ship trajectory (black line) and HY-2A crossover points (red dots). There are 11 crossover events.
The HY-2A satellite moves very fast (∼6 km s−1), while the speed of the ship is low (maximum ∼35 km h−1), and the ship track lacks regularity; the crossover points between satellite footprint and ship track are scarce in both time and space. To have more crossover points for comparison, the thresholds in distance and time difference were set to 200 km and 2 h, respectively. Applying the thresholds, finally, 11 crossover events with 629 crossover points were found, which are shown with red dots in Fig. 4. With such a large number of crossover points, we can also further analyze the impact of different distance thresholds on the PWV comparison. It should be noted that the discontinuity of ship track was caused by the missing of GNSS observations.
In this section, the HY-2A CMR PWV is compared to GNSS PWV, and the results are presented, including the comparison to ground-based GNSS PWV and shipborne GNSS PWV. The PWV height correction is applied to all the IGS stations comparison, and the HY-2A PWV observations in coastal regions are reconstructed to avoid the land contamination.
4.1 HY-2A PWV validation using ground-based GNSS
The HY-2A PWV observations of 2 months of data were compared with the GNSS PWV on the 100 coastal stations. Analysis of the comparison results of the two sets is in Fig. 5a, while the detailed statistics of all crossover points in different latitude regions are shown in Fig. 5b, where the PWV differences in polar regions (), the tropical area (23.5∘ N–23.5∘ S), and midlatitude regions (23.5–66.5) were presented.
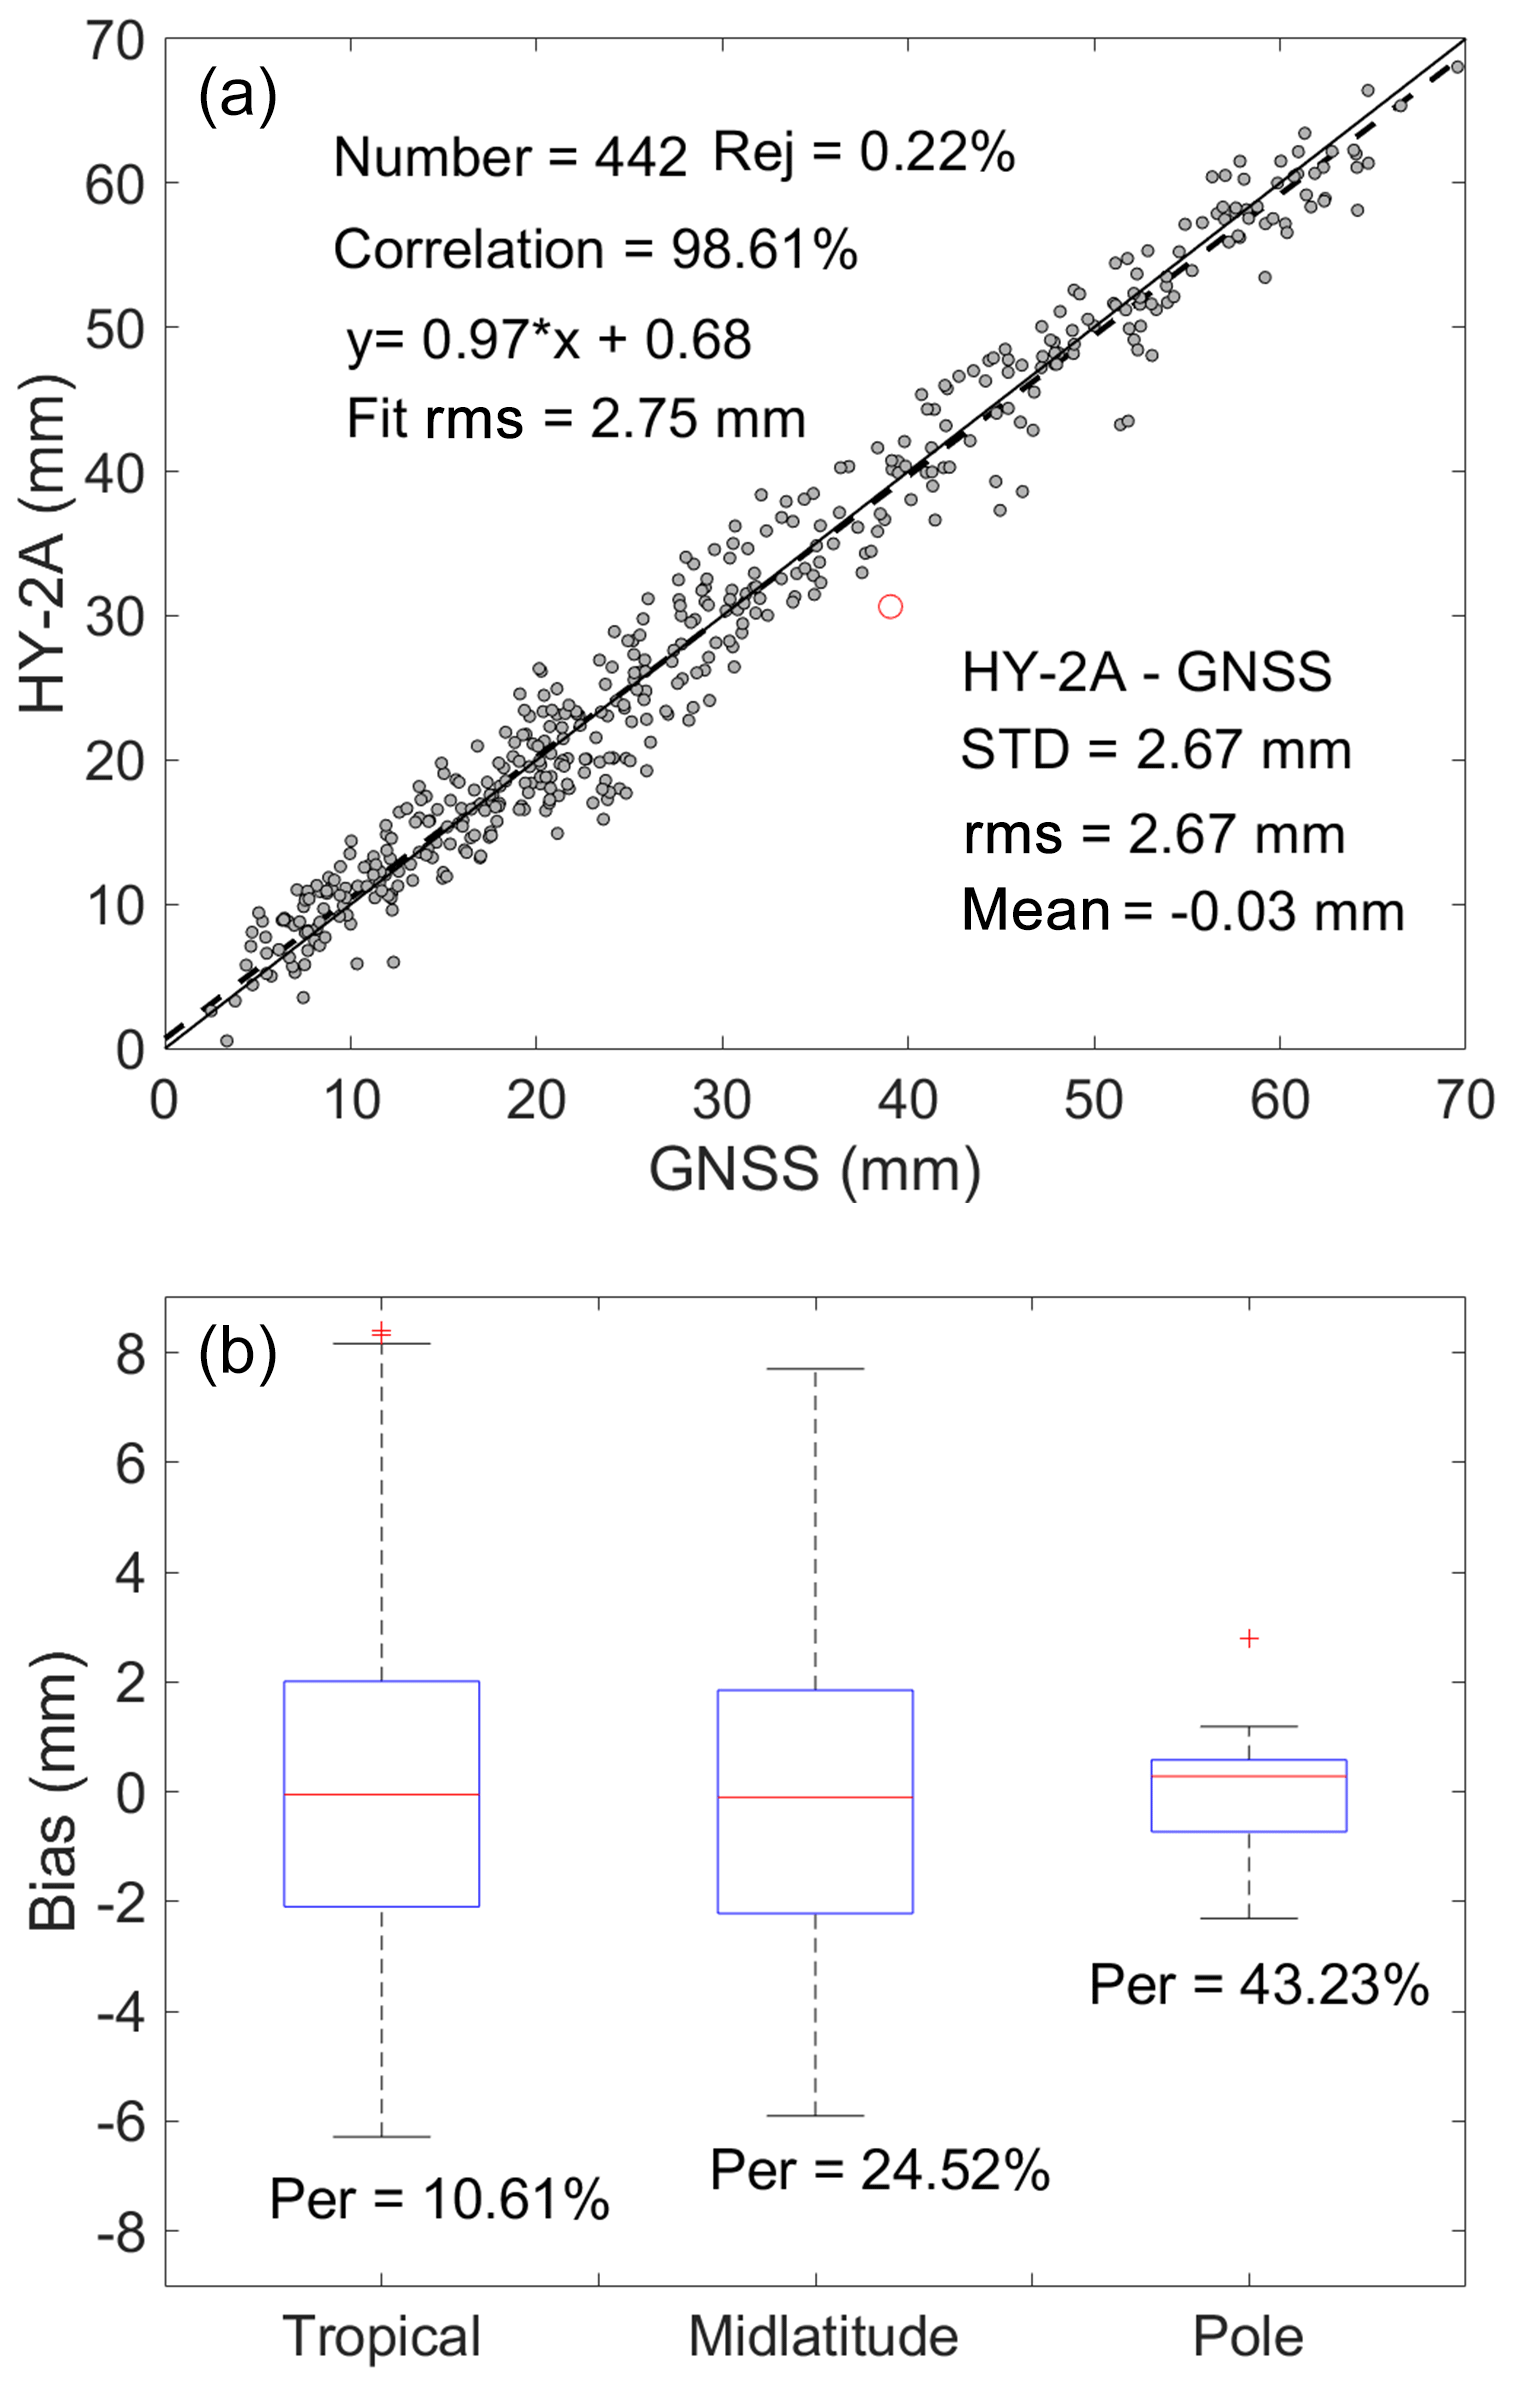
Figure 5PWV difference between HY-2A and ground GNSS. Panel (a) shows PWV scatter diagram of HY-2A observations and GNSS results; the linear fit result is the solid line, and the dashed line is the reference line; red circles are outliers. Panel (b) shows boxplots of the difference between HY-2A and GNSS at tropical regions, midlatitude regions, and pole regions. The blue box describes the upper and lower quartile; the red line inside the box is median value; the whiskers are 1.5 times the interquartile range (IQR), and the red open crosshatches describe data outliers; ”Per” represents the average ratio of the rms to derived PWV of the region.
Figure 5a shows the scatterplot of HY-2A CMR PWV and ground-based GNSS PWV and linear fit result, in which about 0.22 % of the total points with a difference larger than 3 times the SD were excluded. The HY-2A PWV shows good agreement with the GNSS PWV with an average bias of −0.03 mm, and the rms is 2.67 mm. No systematic bias is revealed, and a high correlation coefficient of 98.61 % is achieved. As shown in Fig. 5b, the difference in polar regions is smaller than that in other regions; the upper and lower quartile are −2.31 and 1.18 mm, respectively, with an average value of 0.27 mm and an rms value of 1.12 mm. The relative PWV error (PWV bias/PWV value) in the polar region (43.23 %) is much larger than that in other regions. On the other hand, the PWV rms in lower- and midlatitude regions is 2.78 mm, partially because of the large PWV content in these regions. It should also be noted that all the stations used in this comparison are located in coastal regions, which usually have a larger PWV. The PWV agreement between HY-2A and ground-based GNSS does not show an obvious correlation with latitude.
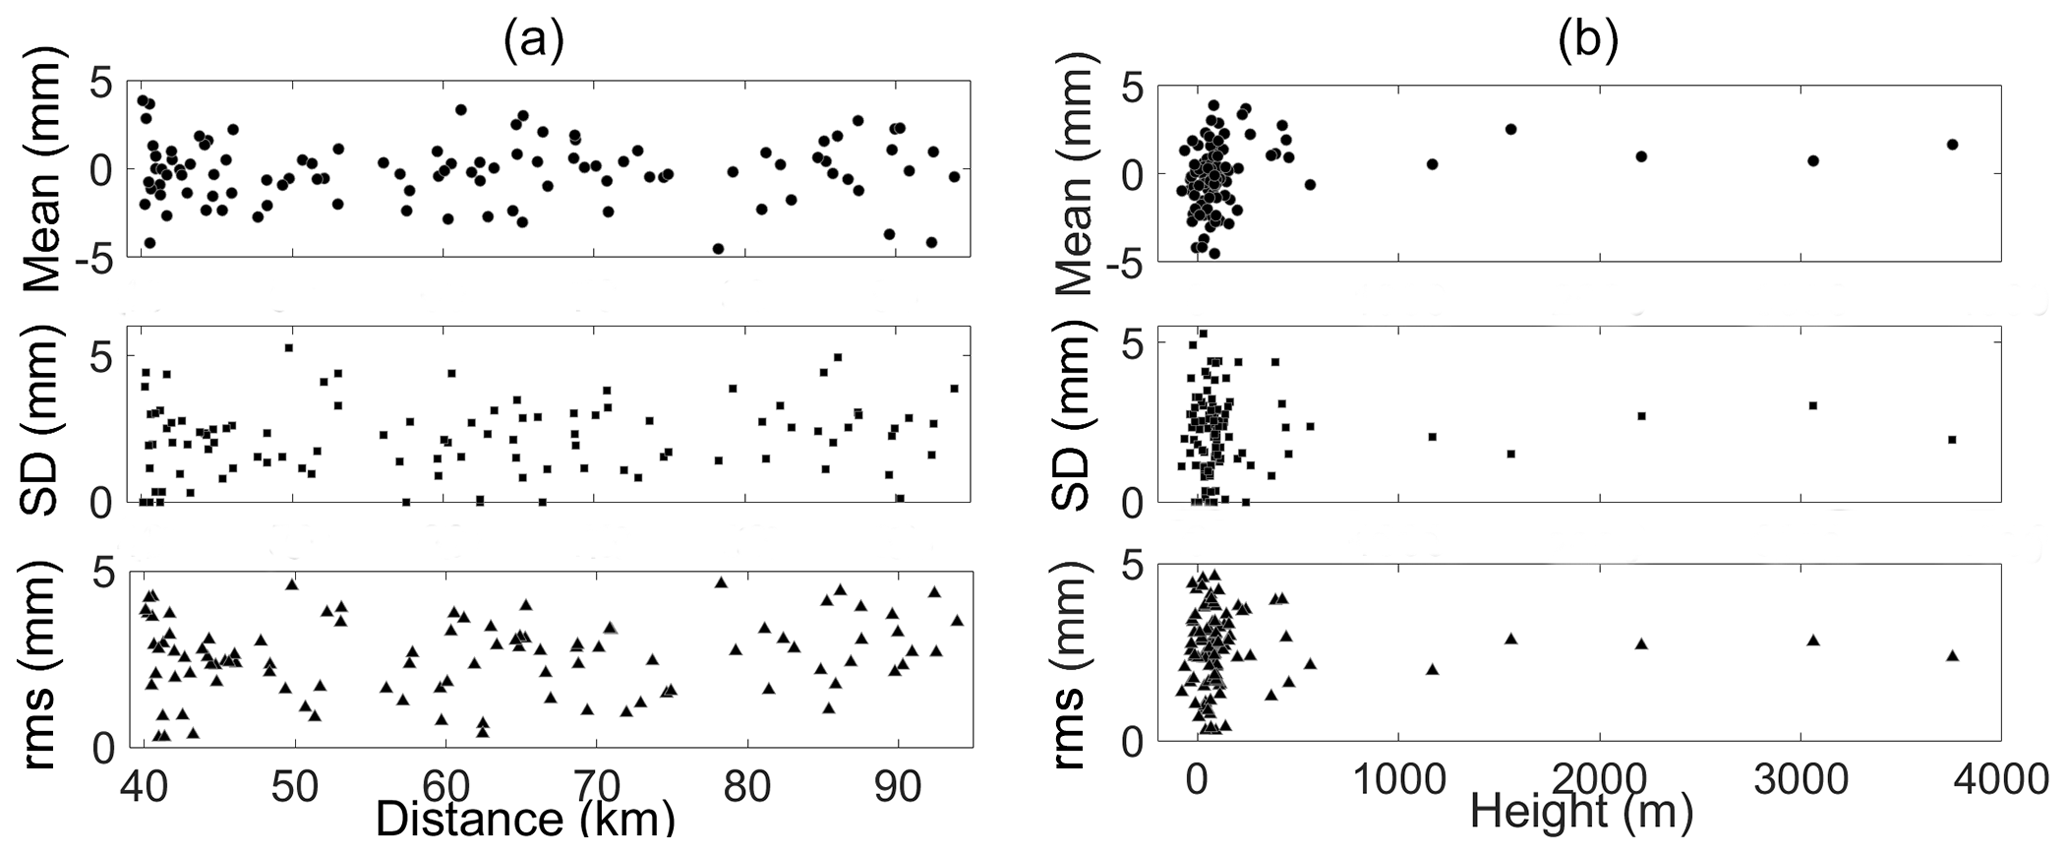
Figure 6The statistics of PWV differences between HY-2A and ground-based GNSS with respect to (a) the distance between HY-2A footprint and GNSS stations and (b) the station height.
Moreover, for each GNSS station, the statistics of PWV differences in all the crossover points at different times were calculated – together with the average distance to the crossover points. The relationship between the PWV differences and the averaged distance and GNSS station height is shown in Fig. 6. As shown in Fig. 6a, both the average value and SD of the PWV differences between HY-2A and GNSS show no correlation with the averaged distance ranging from 40 to 95 km, indicating that the HY-2A reconstructed PWV observations are free of land contamination. However, it should be noted that in Fig. 6a the distance varies from 40 to 90 km, and thus this conclusion does not indicates the case of distance less than 40 km. Figure 6b confirms that the PWV differences have no correlation with station height, which means that the PWV height correction at ground-based GNSS stations is effective.
4.2 HY-2A PWV validation using shipborne GNSS
Although ground-based GNSS can provide long-term PWV with certain accuracy for the validation of HY-2A CMR, the validation could still suffer from contaminated CMR data by the signal on the land, long distance between GNSS station and footprint, and GNSS height, especially for higher accuracy of validation based on GNSS. The comparison result could be affected by the residual error after correction. The coastal GNSS can be combined with shipborne kinematic GNSS, which can also obtain high-accuracy ZWD (Wang et al., 2019), and shipborne GNSS observations in open-sea regions provide an accurate and direct method for the satellite altimetry comparison and validation, which is free of any land contamination or height correction error. The shipborne GNSS observations could be a very good supplement for the validation using GNSS observation and extend the method to open sea. More than 160 000 vessels are sailing across the ocean daily (https://www.marinetraffic.com, last access: 10 September 2020), and these data can also be used for calibration if the vessels are equipped with a geodetic GNSS receiver and antenna.
As mentioned before, with the threshold of 200 km and 2 h, the number of the crossover events between HY-2A and GNSS are 11 with 629 crossover points in total, which is shown in Fig. 4. For each crossover event, the PWV observations larger than 3 times the SD value of the differences were removed as outliers, i.e., the 3σ criterion. Among the 629 crossover points, ∼4.8 % were removed as outliers and the useful number is 599.
To investigate the impact of the space threshold on the PWV validation, the PWV differences between the crossover points defined with space threshold of 200, 150, 100, and 50 km are presented in Fig. 7. As shown in Fig. 7, the PWV agreement between HY-2A CMR and shipborne GNSS decreases with the increase in the corresponding distance threshold. The rms values within 200, 150, 100, and 50 km are 2.89, 1.78, 1.53, and 0.89 mm, respectively, and the correlation increases from 77 % to 98.2 %. The outliers (red dots) decrease from 4.77 % to 0 % when the distance threshold gets smaller. The linear fit also shows a better agreement when the distance is shorter.
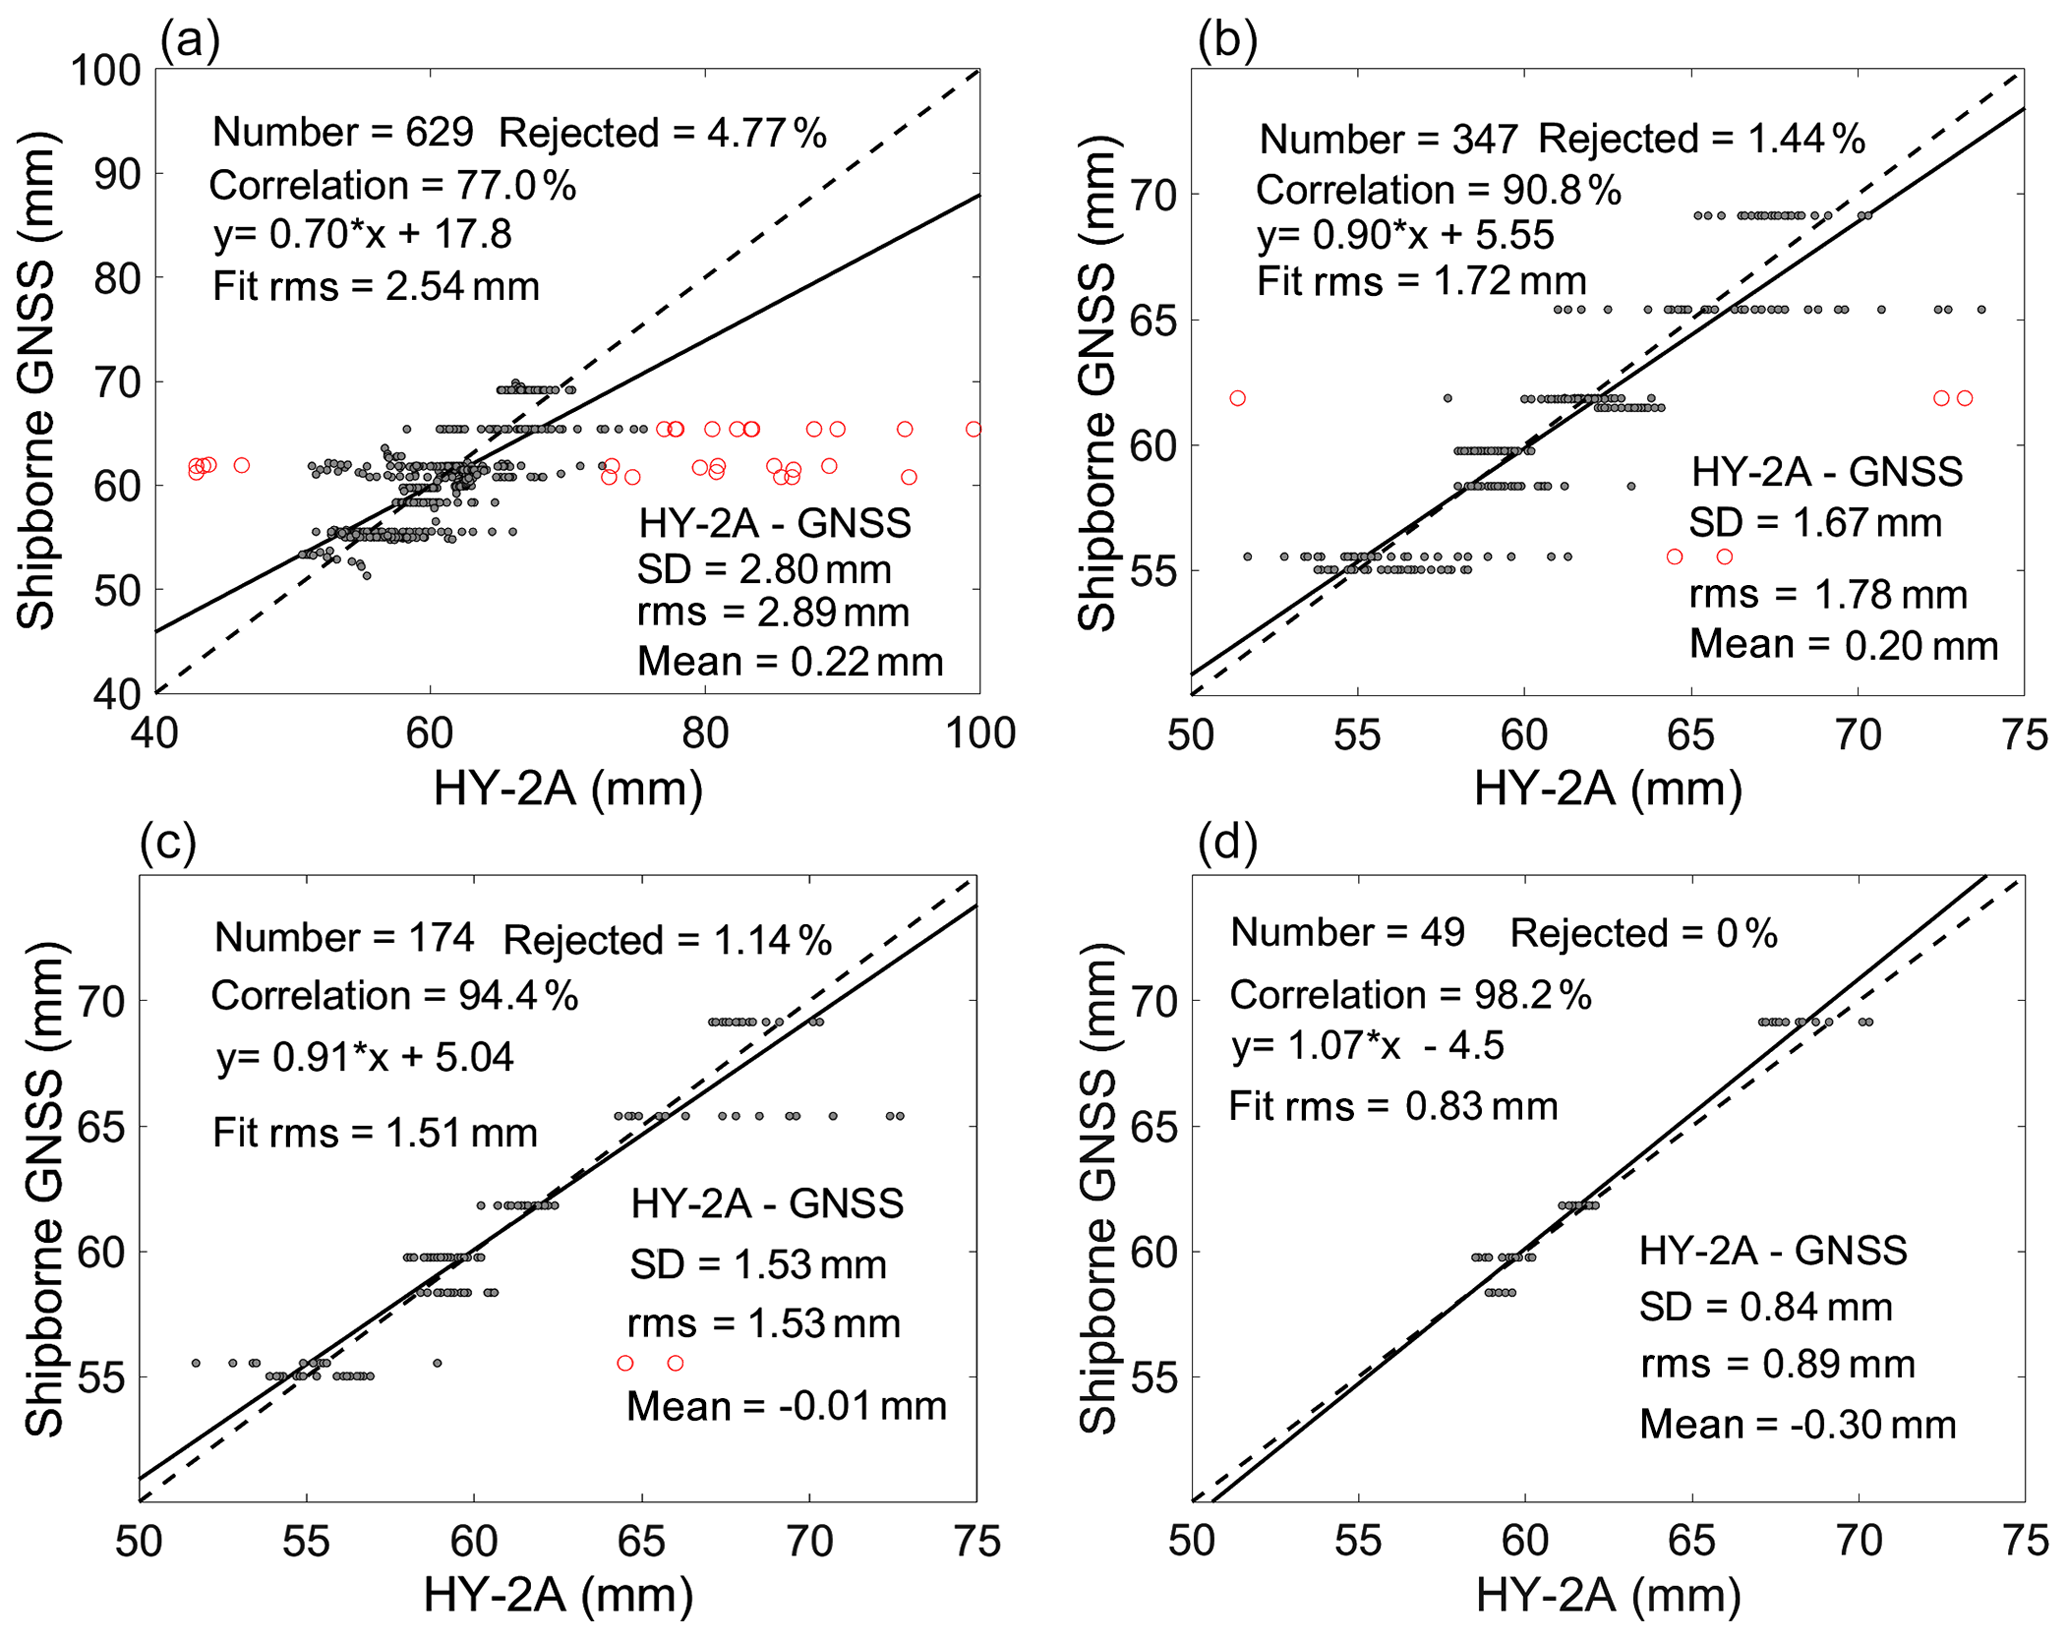
Figure 7PWV comparison between HY-2A CMR and shipborne GNSS for crossover points with a distance threshold of (a) 200 km, (b) 150 km, (c) 100 km, and (d) 50 km. The red circles are for outliers, and the linear fit result is presented as a solid line with its reference in dash line. For each panel, the linear fit is shown in the upper left, and the comparison statistics are shown in the bottom right.
The average bias is 0.22 mm for the distance of 200 km, with a much larger SD value (2.80 mm). When the distance gets closer (from 200 to 100 km), the mean bias between shipborne GNSS and HY-2A gets closer to zero (varies from 0.22 to −0.01 mm). The average bias is −0.22 mm within 50 km, which might be caused by the limited sample number (49 crossovers). Since the variation in PWV is relatively slow over the ocean, the average bias remains small even though the distance reaches 200 km. The agreement between shipborne GNSS and HY-2A data is better than that of the ground GNSS result, which could be caused by the potential residual error of the ground-based GNSS stations due to the PWV height correction and that of the HY-2A observations due to the data reconstruction; the complex topography in coastal regions could be another reason. It should be pointed out that there is no “ideal” method to reconstruct the valid PWV data in coastal regions, but it is still necessary to spare no efforts to investigate any useful method to derive “clean” data for inter-technique comparison and validation. Overall, the PWV difference between HY-2A CMR data and ground-based GNSS is 2.67 mm in terms of rms value within a distance of 100 km, and that between HY-2A and shipborne GNSS is 1.53 mm under the same comparison criteria.
Water vapor over oceans is essential for both the altimeter correction and the understanding of climate system and weather processes. Therefore, retrieving and validating HY-2A CMR PWV become critical. HY-2A PWV is mainly validated with NWM and other satellites (Wang et al., 2014; Zhao et al., 2016). Liu et al. (2019) investigated the agreement of shipborne GNSS and HY-2A CMR PWV, where more attention was paid to the GNSS-PWV uncertainty.
In this study, we focus on the HY-2A CMR PWV evaluation on a global-scale validation with GNSS observations. The HY-2A PWV observations in coastal regions were carefully checked, and those that suffer from land contamination were reconstructed using PWV products from NWM. The PWV height correction was applied to the ground-based GNSS stations to remove the height-related variations. The result shows that HY-2A PWV agrees well with the ground-based GNSS PWV with an average bias of −0.03 mm and an rms value of 2.67 mm. Besides, we compared shipborne GNSS-derived PWV and HY-2A PWV, which shows the difference of 1.53 mm in rms within 100 km. The shipborne GNSS reveals a better agreement than the ground-based result, which may caused by the residual errors from the HY-2A reconstruction and ground-based GNSS PWV height correction, and the complex topography in coastal regions could be another reason.
HY-2A, after its operation for more than 7 years, is facing the problem of inaccurate CMR data, e.g., biased PWV and ZWD caused by aging of the observation device. Although the agreement between HY-2A and ground-based GNSS is relatively worse, the ground-based GNSS could provide long-term observation globally with relatively high accuracy. With the supplement of shipborne GNSS observations, the new validation method using GNSS observation can play a critical role in the calibration of HY-2A CMR data and improve the accuracy of HY-2A data for both altimeter correction and meteorological study.
The source codes for the validation and the data of HY-2A and shipborne GNSS used in this study can be provided by the corresponding authors upon reasonable request.
ZW and JW co-designed this research; ZW, JW, XH, YL, and XW conducted the data analyses; ZW wrote the manuscript. All authors discussed the experimental results and helped revise the paper.
The authors declare that they have no conflict of interest.
We would like to thank NSOAS for providing HY-2A data, South China Sea Institute of Oceanology for the research vessel cruise, ECMWF for NWM data, IGS for GNSS observations, and GFZ for precise orbit products.
This research has been supported by the National Natural Science Foundation of China (grant no. 41876106), the Basic Scientific Fund for National Public Research Institutes of China (grant no. 2018Q04), the National Key R&D Program of China (grant no. 2017YFC1405100), and the China Scholarship Council (CSC; file no. 201606260035).
The article processing charges for this open-access
publication were covered by a Research
Centre of the Helmholtz Association.
This paper was edited by Alexander Kokhanovsky and reviewed by three anonymous referees.
Bevis, M., Businger, S., Herring, T. A., Rocken, C., Anthes, R. A., and Ware, R. H.: GPS meteorology: Remote sensing of atmospheric water vapor using the Global Positioning System, J. Geophys. Res., 97, 15787–15801, https://doi.org/10.1029/92JD01517, 1992.
Bevis, M., Businger, S., Chiswell, S., Herring, T. A., Anthes, R. A., Rocken, C., and Ware, R. H.: GPS meteorology: Mapping zenith wet delays onto precipitable water, J. Appl. Meteorol., 33, 379–386, 1994.
Böhm, J., Niell, A., Tregoning, P., and Schuh, H.: Global Mapping Function (GMF): A new empirical mapping function based on numerical weather model data, Geophys. Res. Lett., 33, L07304, https://doi.org/10.1029/2005GL025546, 2006.
Böhm, J., Heinkelmann, R., and Schuh, H.: Short note: a global model of pressure and temperature for geodetic applications, J. Geodesy, 81, 679–683, 2007.
Böhm, J. and Schuh, H.: Atmospheric effects in space geodesy, Springer, Berlin, 2013.
Brown, S.: A novel near-land radiometer wet path-delay retrieval algorithm: Application to the Jason-2/OSTM advanced microwave radiometer, IEEE T. Geosci. Remote, 48, 1986–1992, 2010.
Brown, S.: Maintaining the long-term calibration of the Jason-2/OSTM advanced microwave radiometer through intersatellite calibration, IEEE T. Geosci. Remote, 51, 1531–1543, https://doi.org/10.1109/TGRS.2012.2213262, 2013.
Brown, S., Ruf, C., Keihm, S., and Kitiyakara, A.: Jason microwave radiometer performance and on-orbit calibration, Mar. Geod., 27, 199–220, https://doi.org/10.1080/01490410490465643, 2004.
Davis, J., Herring, T., Shapiro, I., Rogers, A., and Elgered, G.: Geodesy by radio interferometry: Effects of atmospheric modeling errors on estimates of baseline length, Radio Science, 20, 1593–1607, 1985.
Dee, D. P., Uppala, S. M., Simmons, A., Berrisford, P., Poli, P., Kobayashi, S., Andrae, U., Balmaseda, M., Balsamo, G., and Bauer, P.: The ERA‐Interim reanalysis: configuration and performance of the data assimilation system, Q. J. Roy. Meteor. Soc., 137, 553–597, https://doi.org/10.1002/qj.828, 2011.
Fernandes, M. J., Bastos, L., and Antunes, M.: Coastal satellite altimetry – methods for data recovery and validation, in: Proceedings of the 3rd Meeting of the International Gravity and Geoid Commission, Gravity and Geoid 2002 – GG2002, Thessaloniki, Greece, 26–30 August 2002, edited by: Tziavos, I. N., ZITI EDITIONS, Thessaloniki, Greece, 302–307, 2003.
Fernandes, M. J., Lazaro, C., Nunes, A. L., Pires, N., Bastos, L., and Mendes, V. B.: GNSS-derived path delay: An approach to compute the wet tropospheric correction for coastal altimetry, IEEE Geosci. Remote S., 7, 596–600, 2010.
Gendt, G., Dick, G., Reigber, C., Tomassini, M., Liu, Y., and Ramatschi, M.: Near real time GPS water vapor monitoring for numerical weather prediction in Germany, J. Meteorol. Soc. Jpn., Ser. II, 82, 361–370, https://doi.org/10.2151/jmsj.2004.361, 2004.
Gutman, S. I., Sahm, S. R., Benjamin, S. G., Schwartz, B. E., Holub, K. L., Stewart, J. Q., and Smith, T. L.: Rapid retrieval and assimilation of ground based GPS precipitable water observations at the NOAA Forecast Systems Laboratory: Impact on weather forecasts, J. Meteorol. Soc. Jpn., Ser. II, 82, 351–360, 2004.
Jiang, X., Lin, M., Liu, J., Zhang, Y., Xie, X., Peng, H., and Zhou, W.: The HY-2 satellite and its preliminary assessment, Int. J. Digit. Earth, 5, 266–281, https://doi.org/10.1080/17538947.2012.658685, 2012.
Jing-nan, L. and Mao-rong, G.: PANDA software and its preliminary result of positioning and orbit determination, Wuhan University Journal of Natural Sciences, 8, 603, https://doi.org/10.1007/BF02899825, 2003.
Kealy, J., Foster, J., and Businger, S.: GPS meteorology: An investigation of ocean-based precipitable water estimates, J. Geophys. Res., 117, D17303, https://doi.org/10.1029/2011JD017422, 2012.
Kouba, J. and Héroux, P.: Precise point positioning using IGS orbit and clock products, GPS Solut., 5, 12–28, 2001.
Li, X., Zus, F., Lu, C., Dick, G., Ning, T., Ge, M., Wickert, J., and Schuh, H.: Retrieving of atmospheric parameters from multi-GNSS in real time: Validation with water vapor radiometer and numerical weather model, Geophys. Res.-Atmos., 120, 7189–7204, 2015.
Liu, J. and Ge, M.: PANDA software and its preliminary result of positioning and orbit determination, Wuhan University Journal of Natural Sciences, 8, 603, https://doi.org/10.1007/BF02899825, 2003.
Liu, Y., Liu, Y., Chen, G., and Wu, Z.: Evaluation of HY-2A satellite-borne water vapor radiometer with shipborne GPS and GLONASS observations over the Indian Ocean, GPS Solut., 23, 87, https://doi.org/10.1007/s10291-019-0876-5, 2019.
Manandhar, S., Lee, Y. H., Meng, Y. S., Yuan, F., and Ong, J. T.: GPS-Derived PWV for Rainfall Nowcasting in Tropical Region, IEEE T. Geosci. Remote, 56, 4835–4844, 2018.
Nelson, R. R., Crisp, D., Ott, L. E., and O'Dell, C. W.: High-accuracy measurements of total column water vapor from the Orbiting Carbon Observatory-2, Geophys. Res. Lett., 43, 12261–12269, https://doi.org/10.1002/2016GL071200, 2016.
Ning, T., Wang, J., Elgered, G., Dick, G., Wickert, J., Bradke, M., Sommer, M., Querel, R., and Smale, D.: The uncertainty of the atmospheric integrated water vapour estimated from GNSS observations, Atmos. Meas. Tech., 9, 79–92, https://doi.org/10.5194/amt-9-79-2016, 2016.
Obligis, E., Eymard, L., Tran, N., Labroue, S., and Femenias, P.: First three years of the microwave radiometer aboard Envisat: In-flight calibration, processing, and validation of the geophysical products, J. Atmos. Ocean. Tech., 23, 802–814, 2006.
Obligis, E., Desportes, C., Eymard, L., Fernandes, M., Lázaro, C., and Nunes, A.: Tropospheric corrections for coastal altimetry, in: Coastal altimetry, Springer, 147–176, 2011.
Peng, H., Lin, M., Mu, B., and Zhou, W.: Global statistical evaluation and performance analysis of HY-2A satellite radar altimeter data, Haiyang Xuebao, 37, 54–66, https://doi.org/10.3969/j.issn.0253-4193.2015.07.006, 2015.
Petit, G., and Luzum, B.: IERS Conventions (2010) IERS Tech Note 36, Verlag des Bundesamtes für Geodäsie und Kartographie, Frankfurt am Main, 2010.
Randall, D. A., Wood, R. A., Bony, S., Colman, R., Fichefet, T., Fyfe, J., Kattsov, V., Pitman, A., Shukla, J., and Srinivasan, J.: Climate models and their evaluation, in: Climate change 2007: The physical science basis. Contribution of Working Group I to the Fourth Assessment Report of the IPCC (FAR), Cambridge University Press, Cambridge, 589–662, 2007.
Robinson, I. S.: Measuring the Oceans from Space: The principles and methods of satellite oceanography, Springer Science & Business Media, Berlin, 2004.
Rocken, C., Johnson, J., Van Hove, T., and Iwabuchi, T.: Atmospheric water vapor and geoid measurements in the open ocean with GPS, Geophys. Res. Lett., 32, L12813, https://doi.org/10.1029/2005GL022573, 2005.
Saastamoinen, J.: Atmospheric correction for the troposphere and stratosphere in radio ranging satellites, in: The use of artificial satellites for geodesy, edited by: Henriksen, S. W., Mancini, A., and Chovitz, B. H., American Geophysical Union (AGU), 15, 247–251, https://doi.org/10.1029/GM015p0247, 1972.
Shi, J., Zhao, Q., Geng, J., Lou, Y., Ge, M., and Liu, J.: Recent development of PANDA software in GNSS data processing, in: Proc. SPIE 7285, International Conference on Earth Observation Data Processing and Analysis (ICEODPA), Wuhan, China, 28–30 December 2008, SPIE, 558–566, https://doi.org/10.1117/12.816261, 2008.
Thao, S., Eymard, L., Obligis, E., and Picard, B.: Comparison of regression algorithms for the retrieval of the wet tropospheric path, IEEE J. Sel. Top. Appl., 8, 4302–4314, 2015.
Wang, J. and Liu, Z.: Improving GNSS PPP accuracy through WVR PWV augmentation, J. Geodesy, 93, 1685–1705, 2019.
Wang, J., Zhang, J., Fan, C., and Wang, J.: Validation of the “HY-2” altimeter wet tropospheric path delay correction based on radiosonde data, Acta Oceanol. Sin., 33, 48–53, 2014.
Wang, J., Wu, Z., Semmling, M., Zus, F., Gerland, S., Ramatschi, M., Ge, M., Wickert, J., and Schuh, H.: Retrieving Precipitable Water Vapor From Shipborne Multi-GNSS Observations, Geophys. Res. Lett., 46, 5000–5008, https://doi.org/10.1029/2019GL082136, 2019.
Wang, Z. and Zhang, D.: Simulation on retrieving of atmospheric wet path delay by microwave radiometer on HY-2 satellite, in: 2008 China-Japan Joint Microwave Conference, Shanghai, China, 10–12 September 2008, IEEE, 665–668, 2008.
Wu, J.-T., Wu, S. C., Hajj, G. A., Bertiger, W. I., and Lichten, S. M.: Effects of antenna orientation on GPS carrier phase, Manuscr. Geodaet., 18, 91–98, 1993.
Wu, Z., Wang, J., Liu, Y., He, X., Liu, Y., and Xu, W.: Validation of 7 Years in-Flight HY-2A Calibration Microwave Radiometer Products Using Numerical Weather Model and Radiosondes, Remote Sens., 11, 1616, https://doi.org/10.3390/rs11131616, 2019.
Yang, L., Zhou, X., Lin, M., Lei, N., Mu, B., Zhu, L.: Global statistical assessment of HY-2A altimeter IGDR data, Progress in Geophysics, 31, 629–636, 2016.
Zhang, D., Wang, Z., Wang, H., Zhao, J., and Li, Y.: ACMR system description and performance, Geoscience and Remote Sensing Symposium (IGARSS), in: 2014 IEEE Geoscience and Remote Sensing Symposium, Quebec City, QC, Canada, 13–18 July 2014, IEEE, 5179–5182, 2014.
Zhang, D., Wang, Z., Li, Y., Zhao, J., and Liu, Y.: Preliminary analysis of HY-2 ACMR data, Geoscience and Remote Sensing Symposium (IGARSS), in: 2015 IEEE International Geoscience and Remote Sensing Symposium (IGARSS), Milan, Italy, 26–31 July 2015, IEEE, 177–180, 2015.
Zhao, J., Zhang, D., Wang, Z., and Li, Y.: The validation of HY-2A ACMR retrieval algorithms and product, in: 2016 IEEE International Geoscience and Remote Sensing Symposium (IGARSS), Beijing, China, 10–15 July 2016, IEEE, 411–413, 2016.
Zheng, G., Yang, J., and Ren, L.: Retrieval models of water vapor and wet tropospheric path delay for the HY-2A calibration microwave radiometer, J. Atmos. Ocean. Tech., 31, 1516–1528, 2014a.
Zheng, G., Yang, J., Ren, L., Zhou, W., and Huang, L.: The preliminary cross-calibration of the HY-2A calibration microwave radiometer with the Jason-1/2 microwave radiometers, Int. J. Remote Sens., 35, 4515–4531, 2014b.