the Creative Commons Attribution 4.0 License.
the Creative Commons Attribution 4.0 License.
 | 23 Sep 2020
Multi-year ACSM measurements at the central European research station Melpitz (Germany) – Part 1: Instrument robustness, quality assurance, and impact of upper size cutoff diameter
Gerald Spindler
Achim Grüner
Thomas Tuch
Bastian Stieger
Dominik van Pinxteren
Jean-Eudes Petit
Olivier Favez
Hartmut Herrmann
Alfred Wiedensohler
The aerosol chemical speciation monitor (ACSM) is nowadays widely used to identify and quantify the main components of fine particles in ambient air. As such, its deployment at observatory platforms is fully incorporated within the European Aerosol, Clouds and Trace Gases Research Infrastructure (ACTRIS). Regular intercomparisons are organized at the Aerosol Chemical Monitoring Calibration Center (ACMCC; part of the European Center for Aerosol Calibration, Paris, France) to ensure the consistency of the dataset, as well as instrumental performance and variability. However, in situ quality assurance remains a fundamental aspect of the instrument's stability. Here, we present and discuss the main outputs of long-term quality assurance efforts achieved for ACSM measurements at the research station Melpitz (Germany) since 2012 onwards. In order to validate the ACSM measurements over the years and to characterize seasonal variations, nitrate, sulfate, ammonium, organic, and particle mass concentrations were systematically compared against the collocated measurements of daily offline high-volume PM1 and PM2.5 filter samples and particle number size distribution (PNSD) measurements. Mass closure analysis was made by comparing the total particle mass (PM) concentration obtained by adding the mass concentration of equivalent black carbon (eBC) from the multi-angle absorption photometer (MAAP) to the ACSM chemical composition, to that of PM1 and PM2.5 during filter weighing, as well as to the derived mass concentration of PNSD. A combination of PM1 and PM2.5 filter samples helped identifying the critical importance of the upper size cutoff of the ACSM during such exercises. The ACSM–MAAP-derived mass concentrations systematically deviated from the PM1 mass when the mass concentration of the latter represented less than 60 % of PM2.5, which was linked to the transmission efficiency of the aerodynamic lenses of the ACSM. The best correlations are obtained for sulfate (slope =0.96; R2=0.77) and total PM (slope =1.02; R2=0.90). Although, sulfate did not exhibit a seasonal dependency, total PM mass concentration revealed a small seasonal variability linked to the increase in non-water-soluble fractions. The nitrate suffers from a loss of ammonium nitrate during filter collection, and the contribution of organo-nitrate compounds to the ACSM nitrate signal make it difficult to directly compare the two methods. The contribution of m∕z 44 (f44) to the total organic mass concentration was used to convert the ACSM organic mass (OM) to organic carbon (OC) by using a similar approach as for the aerosol mass spectrometer (AMS). The resulting estimated OCACSM was compared with the measured OC (slope =0.74; R2=0.77), indicating that the f44 signal was relatively free of interferences during this period. The PM2.5 filter samples use for the ACSM data quality might suffer from a systematic bias due to a size truncation effect as well as to the presence of chemical species that cannot be detected by the ACSM in coarse mode (e.g., sodium nitrate and sodium sulfate). This may lead to a systematic underestimation of the ACSM particle mass concentration and/or a positive artifact that artificially decreases the discrepancies between the two methods. Consequently, ACSM data validation using PM2.5 filters has to be interpreted with extreme care. The particle mass closure with the PNSD was satisfying (slope =0.77; R2=0.90 over the entire period), with a slight overestimation of the mobility particle size spectrometer (MPSS)-derived mass concentration in winter. This seasonal variability was related to a change on the PNSD and a larger contribution of the supermicrometer particles in winter.
This long-term analysis between the ACSM and other collocated instruments confirms the robustness of the ACSM and its suitability for long-term measurements. Particle mass closure with the PNSD is strongly recommended to ensure the stability of the ACSM. A near-real-time mass closure procedure within the entire ACTRIS–ACSM network certainly represents an optimal quality control and assurance of both warranting the quality assurance of the ACSM measurements as well as identifying cross-instrumental biases.
- Article
(4141 KB) - Full-text XML
-
Supplement
(1915 KB) - BibTeX
- EndNote


Aerosol particles strongly influence our environment, having especially an impact on the ecosystem and human health. In particular, fine particulate pollution directly affects mortality and morbidity (e.g., Gurjar et al., 2010; Ostro et al., 2007). Lelieveld et al. (2015) estimated that air pollution, mostly <2.5 µm aerosol particles, may lead to 3.5 million premature deaths per year worldwide. Consequently, improving air quality represents a clear challenge, especially in urban areas. Quantifying the impact of the regulations to the air quality and changes on aerosol chemical composition needs to perform continuous and long-term measurements of aerosol particle properties such as, e.g., the particle number size distribution (PNSD) and the chemical composition. For this purpose, a European distributed facility of the ground-based aerosol chemical species monitor (ACSM; Ng et al., 2011) is operated within ACTRIS (European Research Infrastructure for the observation of Aerosol, Clouds and Trace Gases; http://www.actris.eu, last access: 20 September 2019). Complementary, the COST Action CA16109 Chemical On-Line cOmpoSition and Source Apportionment of fine aerosoL (COLOSSAL; https://www.costcolossal.eu, last access: 20 September 2019) is gathering a wide community of European research groups (with even further international inputs, as well as participation of some regional air quality monitoring networks) interested in the fine-aerosol fraction. One of the main objectives of these coordinated programs is to investigate and understand the spatial variability in aerosol chemical composition on a continental scale, including temporal variability over days, seasons, and years. With such an instrumental network, it is essential to keep a strong focus on the data quality as well as to assure that the results provided by each instrument are comparable to each other. Therefore, ACSM intercomparison workshops are regularly conducted within the framework of the European Center for Aerosol Calibration (ECAC; http://www.actris-ecac.eu, last access: 15 September 2019) at the Aerosol Chemical Monitor Calibration Center (ACMCC) in France. Data quality is ensured by determining instrumental variability between ACSMs (total mass 9 %, organics 19 %, nitrate 15 %, sulfate 28 %, ammonium 36 %; Crenn et al., 2015; Fröhlich et al., 2015a; Freney et al., 2019).
Although intercomparison exercises provide instrumental variability, a comparison between ACSM and collocated measurements remains a fundamental aspect of in situ quality control. These intercomparisons are considered in a number of publications (e.g., Fröhlich et al., 2015b; Petit et al., 2015; Parworth et al., 2015; Ovadnevaite et al., 2014; Ripoll et al., 2015; Minguillon et al., 2015; Poulain et al., 2011b, a; Huang et al., 2018; Takegawa et al., 2009; Wang et al., 2015; Crenn et al., 2015; Guo et al., 2015; Schlag et al., 2016; Sun et al., 2015). Usually, the comparisons between ACSM and collocated measurements were only performed for a few months up to 1 year. This might be perfectly adequate to ensure ACSM quality in that period. Only a few systematic comparisons with datasets longer than 1 year have been reported in the literature (e.g., Fröhlich et al., 2015b; Petit et al., 2015; Parworth et al., 2015; Sun et al., 2015). Ovadnevaite et al. (2014) wrote a rare published work that reports long-term aerosol mass spectrometer (AMS) comparisons (3 years). Even though the authors successfully compared it with offline PM2.5 filter samples, they did not discuss the variability in the correlation and potential source of uncertainties. However, it might not appear sufficiently long to properly evaluate the performance and stability of an instrument designed for long-term monitoring, e.g., covering periods of several years. Therefore, there is really a need for such year-long investigations in order to evaluate the robustness of the instrument independently of calibrations and tuning as well as maintenance activities after technical failures (e.g., such as changing filament, pumps, etc.), seasonal variability, and properly define the limits of such exercises.
A key aspect of such a comparison is the individual upper size cutoff of each instrument. That of an ACSM (as well as the AMS since both are using the same aerodynamic lenses) is considered to be near PM1 (vacuum aerodynamic diameter), regarding the approximate 30 %–40 % transmission efficiency of its aerodynamic lenses at 1 µm (Liu et al., 2007; Takegawa et al., 2009). Recently, a near-PM2.5 aerodynamic lens has been developed (Xu et al., 2017). However, this new generation of instruments having a near-PM2.5 cutoff are not within the focus of the present work. Overall, only a limited number of investigations referred to a direct comparison of the ACSM (as well as the AMS) with instruments that have a PM1 cutoff. From those, multiple external references have been considered in order to compare individual species derived from offline filter analysis (e.g., Ripoll et al., 2015; Minguillon et al., 2015; Poulain et al., 2011b, a; Huang et al., 2018), impactors (e.g., Takegawa et al., 2009; Wang et al., 2015), PILS (e.g., Crenn et al., 2015; Guo et al., 2015), and a MARGA (e.g., Schlag et al., 2016). Particle mass closure analysis has also been reported in the literature. It is achieved by adding equivalent black carbon mass concentrations (eBC) measured by an absorption photometer to the ACSM/AMS ones to obtain PM1 mass concentrations and compare them with the ones derived from particle number size distributions (PNSD) measured by a MPSS (mobility particle size spectrometer). One of the main difficulties of a comparison with the MPSS is volume-to-mass conversion, which requires the density of each detected species (e.g., Bougiatioti et al., 2016; Ortega et al., 2016; Ripoll et al., 2015). To avoid this, some studies have reported a direct comparison of mass concentration vs. volume concentration (e.g., Setyan et al., 2012; DeCarlo et al., 2008; Parworth et al., 2015; Huang et al., 2010). Although this second approach might represent an advantage in providing a direct estimation of the aerosol particle density, the absolute value of the resulting density might become difficult to interpret in some cases because of possible discrepancies between the two instruments types (e.g., Parworth et al., 2015). Although the MPSS is certainly the most popular instrument for particle mass closure analysis, the tapered element oscillating microbalance equipped with a filter dynamics measurement system (TEOM-FDMS) can be used, since it provides the PM mass concentration directly (Petit et al., 2015; Guerrero et al., 2017).
The aim of the present work is to investigate the long-term stability and comparability between ACSM and collocated and well-established techniques over year-long measurements. Specific attention was paid to the influence of the upper size cutoff diameter to better understand how it might affect the validation step and the robustness of the data. Finally, recommendations are provided for better on-site quality assurance and quality control of the ACSM results, which would be useful for either long-term monitoring or intensive campaigns.
2.1 Research observatory Melpitz
The atmospheric aerosol measurements were performed at the TROPOS research station Melpitz (51.54∘ N, 12.93∘ E, 86 m a.s.l.), 50 km to the northeast of Leipzig, Germany. The station has been in operation since 1992 to examine the impact of atmospheric long-range transport on central European background air quality (Spindler et al., 2012, 2013). The site itself is situated on a meadow and is mainly surrounded by agricultural pastures and forests. The Melpitz observatory is part of EMEP (European Monitoring and Evaluation Programme; Level 3 station; Aas et al., 2012), ACTRIS, ACTRIS-2, GAW (Global Atmosphere Watch of the World Meteorological Organization), and GUAN (German Ultrafine Aerosol Network; Birmili et al., 2015, 2009, 2016).
All online instruments are set up in the same laboratory container and connected to the same air inlet. This inlet line consists of a PM10 Anderson impactor located approximately 6 m above ground level and directly followed by an automatic aerosol diffusion dryer to actively keep the relative humidity on the sampling line below 40 % (Tuch et al., 2009). The aerosol flow is divided among a set of instruments by an isokinetic splitter (WMO/GAW, 2016) ensuring a representative sampling between the instruments. These instruments include (1) a multi-angle absorption photometer (MAAP; model 5012, Thermo Scientific; Petzold and Schönlinner, 2004) to measure the particle light absorption coefficients and the equivalent black carbon (eBC) mass concentration, (2) a dual mobility particle size spectrometer (TROPOS-type T-MPSS; Birmili et al., 1999; Wiedensohler et al., 2012) to determine the PNSD from 3 to 800 nm (mobility diameter, d mob) alternating at ambient temperatures and behind a thermodenuder operating at 300 ∘C (Wehner et al., 2002), (3) an aerodynamic particle size spectrometer (APSS; model TSI-3321) to measure the PNSD from 0.8–10 µm (aerodynamic diameter), and (4) a three-wavelength integrating nephelometer (model TSI-3563) for particle light scattering and backscattering coefficients.
For a basic overview of the physical and chemical aerosol characterization methods, see, e.g., Birmili et al. (2008), Spindler et al. (2012, 2013), and Poulain et al. (2014, 2011b). Physical and optical aerosol instruments are frequently calibrated within the framework of the ECAC. The MPSS is calibrated at the WCCAP (World Calibration Center for Aerosol Physics), following the recommendations given in Wiedensohler et al. (2018). The PNSD uncertainty determined with the MPSS is approximately 10 %. The uncertainty in an APSS is between 10 % and 30 %, depending on the size range (Pfeifer et al., 2016). The uncertainty in the MAAP is also within 10 % as determined by Müller et al. (2011).
2.2 ACSM
The ACSM (Ng et al., 2011) is connected to the same inlet as the previously described laboratory container. It is based on the same working principle as the widespread Aerodyne aerosol mass spectrometer, AMS (Canagaratna et al., 2007; DeCarlo et al., 2006; Jayne et al., 2000). Compared to the AMS, the ACSM cannot provide size-resolved chemical information. It is equipped with a low-cost residual gas analyzer (RGA)-type quadrupole (Pfeiffer Vacuum PrismaPlus system) with a unit mass resolution instead of a time-of-flight mass spectrometer. The same aerodynamic lenses as in the AMS are also equipped in the ACSM, with a maximum transmission ranging from 75 to 650 nm, with ca. 30 % to 40 % transmission efficiency at 1 µm (Liu et al., 2007). Consequently, the ACSM, like the AMS, provides the chemical composition of nonrefractory near-PM1 aerosol particles (organics, nitrate, sulfate, ammonium, and chloride) with a typical time resolution of 30 min. The ACSM has been permanently operated at the Melpitz since June 2012. The present work will be, however, limited to the period from June 2012 to November 2017. The instrument was sent to the ACMCC (Aerosol Chemical Monitor Calibration Center) near Paris (France) twice to take part in the ECAC intercomparison workshops (November–December 2013; Crenn et al., 2015; Fröhlich et al., 2015a; and March–May 2016; Freney et al., 2019). Overall, the ACSM data capture 80 % of the time the instrument was deployed at Melpitz. Missing days correspond to either instrument failures or maintenance operations.
The ACSM was regularly calibrated according to the manufacturer's recommendations at that time with 350 nm monodispersed ammonium nitrate and ammonium sulfate particles selected by a differential mobility analyzer (DMA) and using the jump scan approach. It is important to note that recently the recommended calibration method has changed to a full-scan approach (Freney et al., 2019). The total particle number concentration was systematically set below 800 particles cm−3 to limit the artifact due to multiple-charged particles. An overview of the ionization efficiency (IE) and relative ionization efficiency (RIE) for ammonium and sulfate can be found in Fig. S1 in the Supplement. On average, all performed calibration provides a mean IE value of 4.93 (mean ± SD) and mean RIEs for ammonium and sulfate were 6.48±1.26 and 0.68±0.13, respectively. These values are very close to the ones used for the data evaluation as indicated in Fig. S1. Overall, no clear trend for IE and RIE of sulfate can be observed over the period, while a small decrease in the RIE of ammonium can be reported. The lowest RIE of ammonium was reported just after the replacement of the filament, indicating a possible need for degassing and stabilization period. However, it is difficult to conclude if these tendencies could be associated with a possible aging effect of the instrument, since it corresponds to a single instrument. Similar observations on various other individual ACSMs would be needed to allow for stating such a conclusion, and a more systematic investigation of potential trends should then be performed with a large number of ACSMs. The ACSM measurements and data analysis were made with the latest version of the data acquisition (DAQ) and data analysis (DAS) software available at that time (Aerodyne, https://sites.google.com/site/ariacsm, last access: 10 April 2019). The ACSM data were analyzed following the recommendation of the manufacturer and applying a composition-dependent collection efficiency (CDCE) correction based on the algorithms proposed by Middlebrook et al. (2012) to correct particle loss due to bouncing off the vaporizer before flash vaporization. It is important to note that the CDCE algorithm includes inorganic species only and did not consider a possible effect of the organics on the collection efficiency estimation.
2.3 Offline chemical characterization
Parallel to the ACSM, the high-volume samplers, DIGITEL DHA-80 (Digitel Elektronik AG, Hegnau, Switzerland), collect particles with size-selective PM2.5 and PM10 on preheated quartz fiber filters (105 ∘C) (Munktell, type MK360, Sweden) for 24 h from midnight to midnight. Samples were collected on a daily-based regime, whereas PM1 was collected every 6 d. During some specific periods, related to different research projects that took place at the station, PM1 sampling was also performed on a daily basis, as with PM2.5 and PM10.
After sampling, the filters were conditioned for 48 h at 20±2 ∘C and 50±5 % RH before being weighed by a microbalance Mettler-Toledo (AT 261). The filters were then extracted with ultrapure water (>18 MΩ cm) and analyzed through ion chromatography (ICS-3000, Dionex, USA) for water-soluble anions (column AS18, eluent KOH) and cations (column CS16, eluent methane sulfonic acid). For further descriptions of sampling and analyzing procedures, see Spindler et al. (2013).
For the chemical quantification of organic carbon (OC) and elemental carbon (EC), the sum of which is total carbon (TC), a thermo-optical method was used. Rectangular punches (1.5 cm2) of every quartz filter were analyzed for OC and EC using the Lab OC–EC aerosol analyzer (Sunset Laboratory Inc., USA). The standard temperature protocol EUSAAR2 (Cavalli et al., 2010) was applied to distinguish OC and EC, and the transmittance mode was used for the charring correction. In European networks, like EMEP and ACTRIS, this thermos-optical method is the preferred technique for quartz fiber filters (final temperature 850 ∘C). Because filter samples were collected over 24 h, an artifact due to the evaporation of the most volatile compounds during warm periods, like ammonium nitrate or some organics, cannot be fully excluded (Schaap et al., 2004; Keck and Wittmaack, 2005).
2.4 Air mass trajectory analysis
A trajectory analysis was made based on 96 h backward trajectories for the altitude of 500 m above model ground with the NOAA HYbrid Single-Particle Lagrangian Integrated Trajectory (HYSPLIT-4) model (Draxler and Hess, 2004, http://www.ready.noaa.gov/ready/hysplit4.html, last access: 12 September 2019). The trajectories were then analyzed using Zefir 3.7 (Petit et al., 2017) for the identification of potential aerosol sources using the potential source contribution function (PSCF). Because the filters were collected over 24 h, a total of 12 trajectories were considered for the analysis per day (i.e., every 2 h), using the enlarge function of Zefir. Finally, the meteorological conditions as available from the HYSPLIT output for each trajectory calculation were also examined. Although backward trajectories were started at a height of 500 m, the planetary boundary layer (PBL) at the trajectory starting time could be at a lower altitude, making the association between the ground-based measurements and the inflowing air mass difficult. Therefore, only air mass trajectories with a HYSPLIT-estimated PBL height above 500 m were further considered for analysis. Moreover, trajectories were cut off if they had a precipitation rate of over 1 mm h−1 and an altitude of above 2000 m.
To assure the data quality of the ACSM measurements, the results were systematically compared to (i) daily offline filter samples (PM1 and PM2.5) of individual species (sulfate, nitrate, ammonium, and organics) and (ii) combined with eBC (MAAP) for mass closure analysis of both offline filter samplers and online MPSS. The accuracy of the comparison and the seasonal variabilities will be discussed in the following. All correlation fits were performed using the least-orthogonal-distance fitting approach without forcing it to zero.
3.1 Comparison with offline chemical composition
A comparison between total PM mass concentrations, sulfate, nitrate, and ammonium over the 5.5 years is plotted in Fig. 1 for PM1 and in Fig. S2 for PM2.5. The seasonal effect on the fitting's correlation to each species and PM cutting is presented in Figs. 2 and S3 for PM1 and PM2.5, respectively. In the following, chloride will not be considered due to its very low concentrations and limited detection, as described by Crenn et al. (2015). It is also important to note here that the comparison between ACSM and offline samplers generally consists of comparing dry aerosol online measurements to offline analyses of samples collected at ambient RH. A direct consequence is that the offline results might suffer from a cutoff shift due to aerosol hygroscopic growth when ambient RH is high (Chen et al., 2018). Based on this study, the cutoff shift due to aerosol hygroscopic growth should play a minor role at Melpitz, as this effect was estimated to influence the comparison by 2 % for marine air mass and 1 % for continental air mass. For European background stations, such a cutoff shift has been estimated to represent less than 10 % for PM1 and 20 % for PM2.5 particle mass loading, while it is stronger for marine or coastal stations (up to 43 % for PM1 and 62 % for PM2.5). Therefore, such an artifact has to be considered when comparison ACSM with offline measurements.
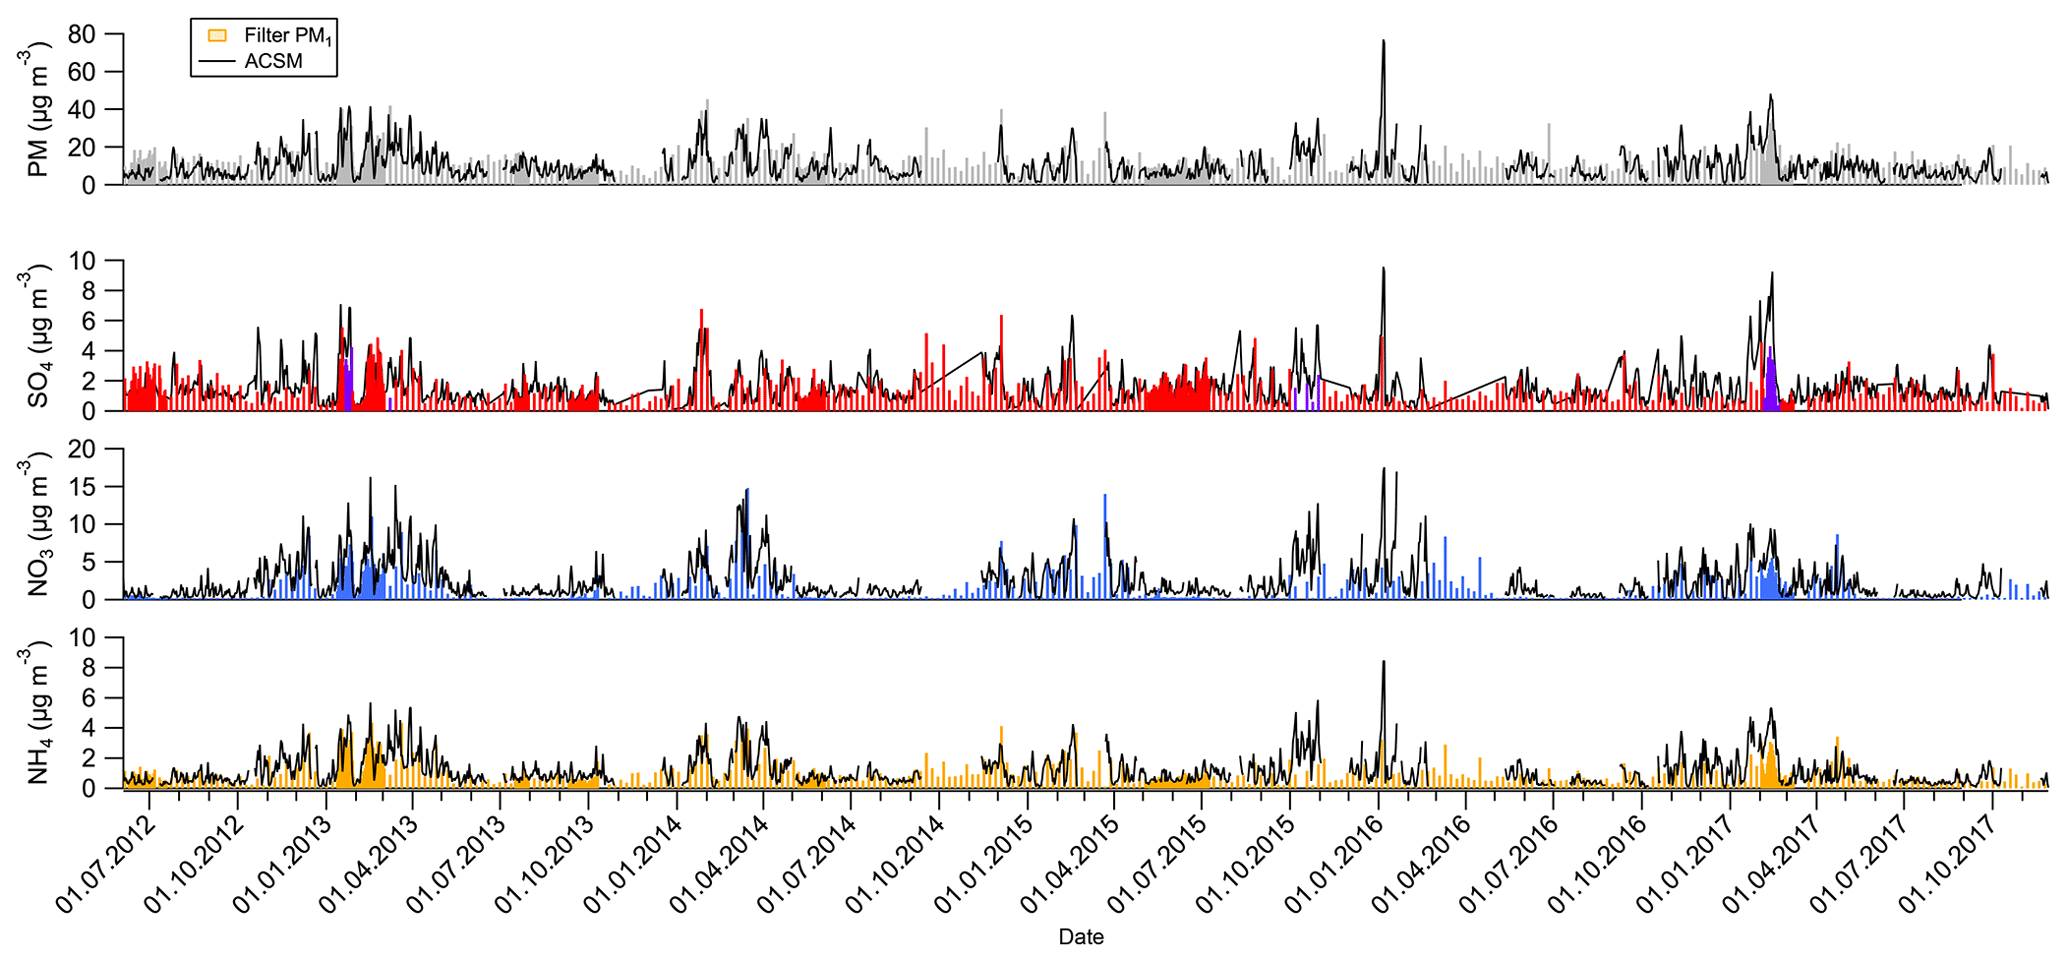
Figure 1Time series ACSM (daily averaged, black line) and 24 h PM1 filter samples (colored bars) for the total particle mass concentration and the mass concentration of sulfate, nitrate, and ammonium. The particulate matter (PM) corresponds with the sum of ACSM species and eBC for the online instrument and the PM1 filter mass for the offline samples.
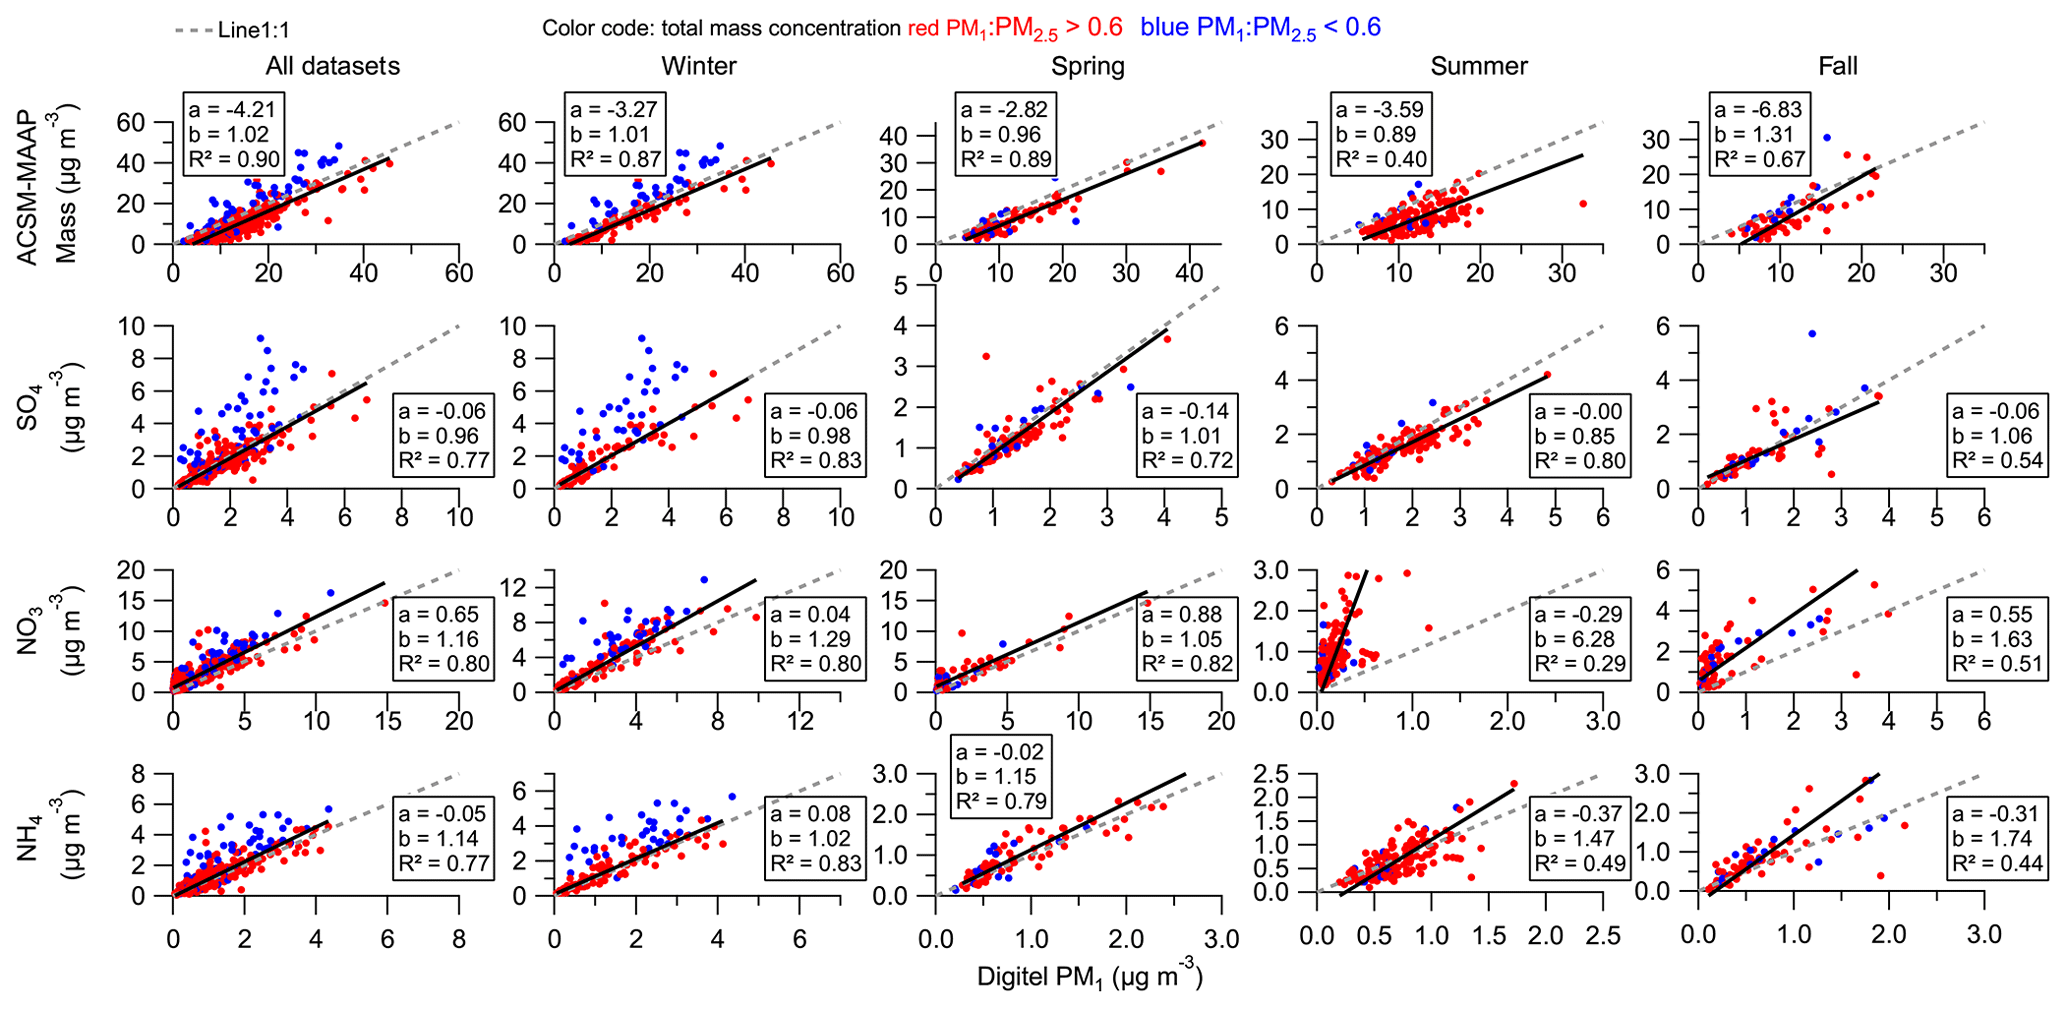
Figure 2Seasonal variability in the comparison between online and offline PM1 aerosol measurements. The color coding indicates whether the ratio PM1 : PM2.5 total mass concentration is above (red) or below (blue) the selected threshold value of 0.6 (see discussion in Sect. 3.1.1.). Dotted grey lines show the line 1 : 1 and solid black lines represent regression fit by least-orthogonal-distance fit (). Please note the different axis ranges for the same species.
3.1.1 Sulfate
Over the entire period, the regression slope of the sulfate mass concentration comparison is suggesting overestimation of the ACSM compared to PM1 filters (slope =1.45; R2=0.59, Fig. 2 and Table S1). Better regression slopes were obtained in spring (slope =0.98; R2=0.74) and summer (slope =0.87; R2=0.77) than in fall (slope =1.25; R2=0.58) and winter (slope =1.57; R2=0.61). However, the overestimation observed throughout the entire period, seems to be strongly influenced by three periods taking place in January 2013, October 2015, and February 2017 (these periods are highlighted in Fig. 1). During these periods, the ACSM sulfate mass concentration strongly overestimates the PM1 one. The correlations with the PM2.5 sulfate mass concentration (Figs. S2 and S3) underline the systematic underestimation of the ACSM sulfate concentration throughout the entire period (slope =0.68; R2=0.85), similar to the value reported by Petit et al. (2015) over 2 years of measurements in the region of Paris (France). This overestimation could be associated with the size-cutting difference between the two methods and the presence of not detected sulfate species on the coarse mode, such as sodium sulfate. The seasonal impact on the regression coefficients is less pronounced than in the comparison with PM1, with regression slopes ranging from 0.64 (R2=0.85) in spring to 0.94 (R2=0.85) in summer. Contrary to the correlation with PM1, no outliers were identified here.
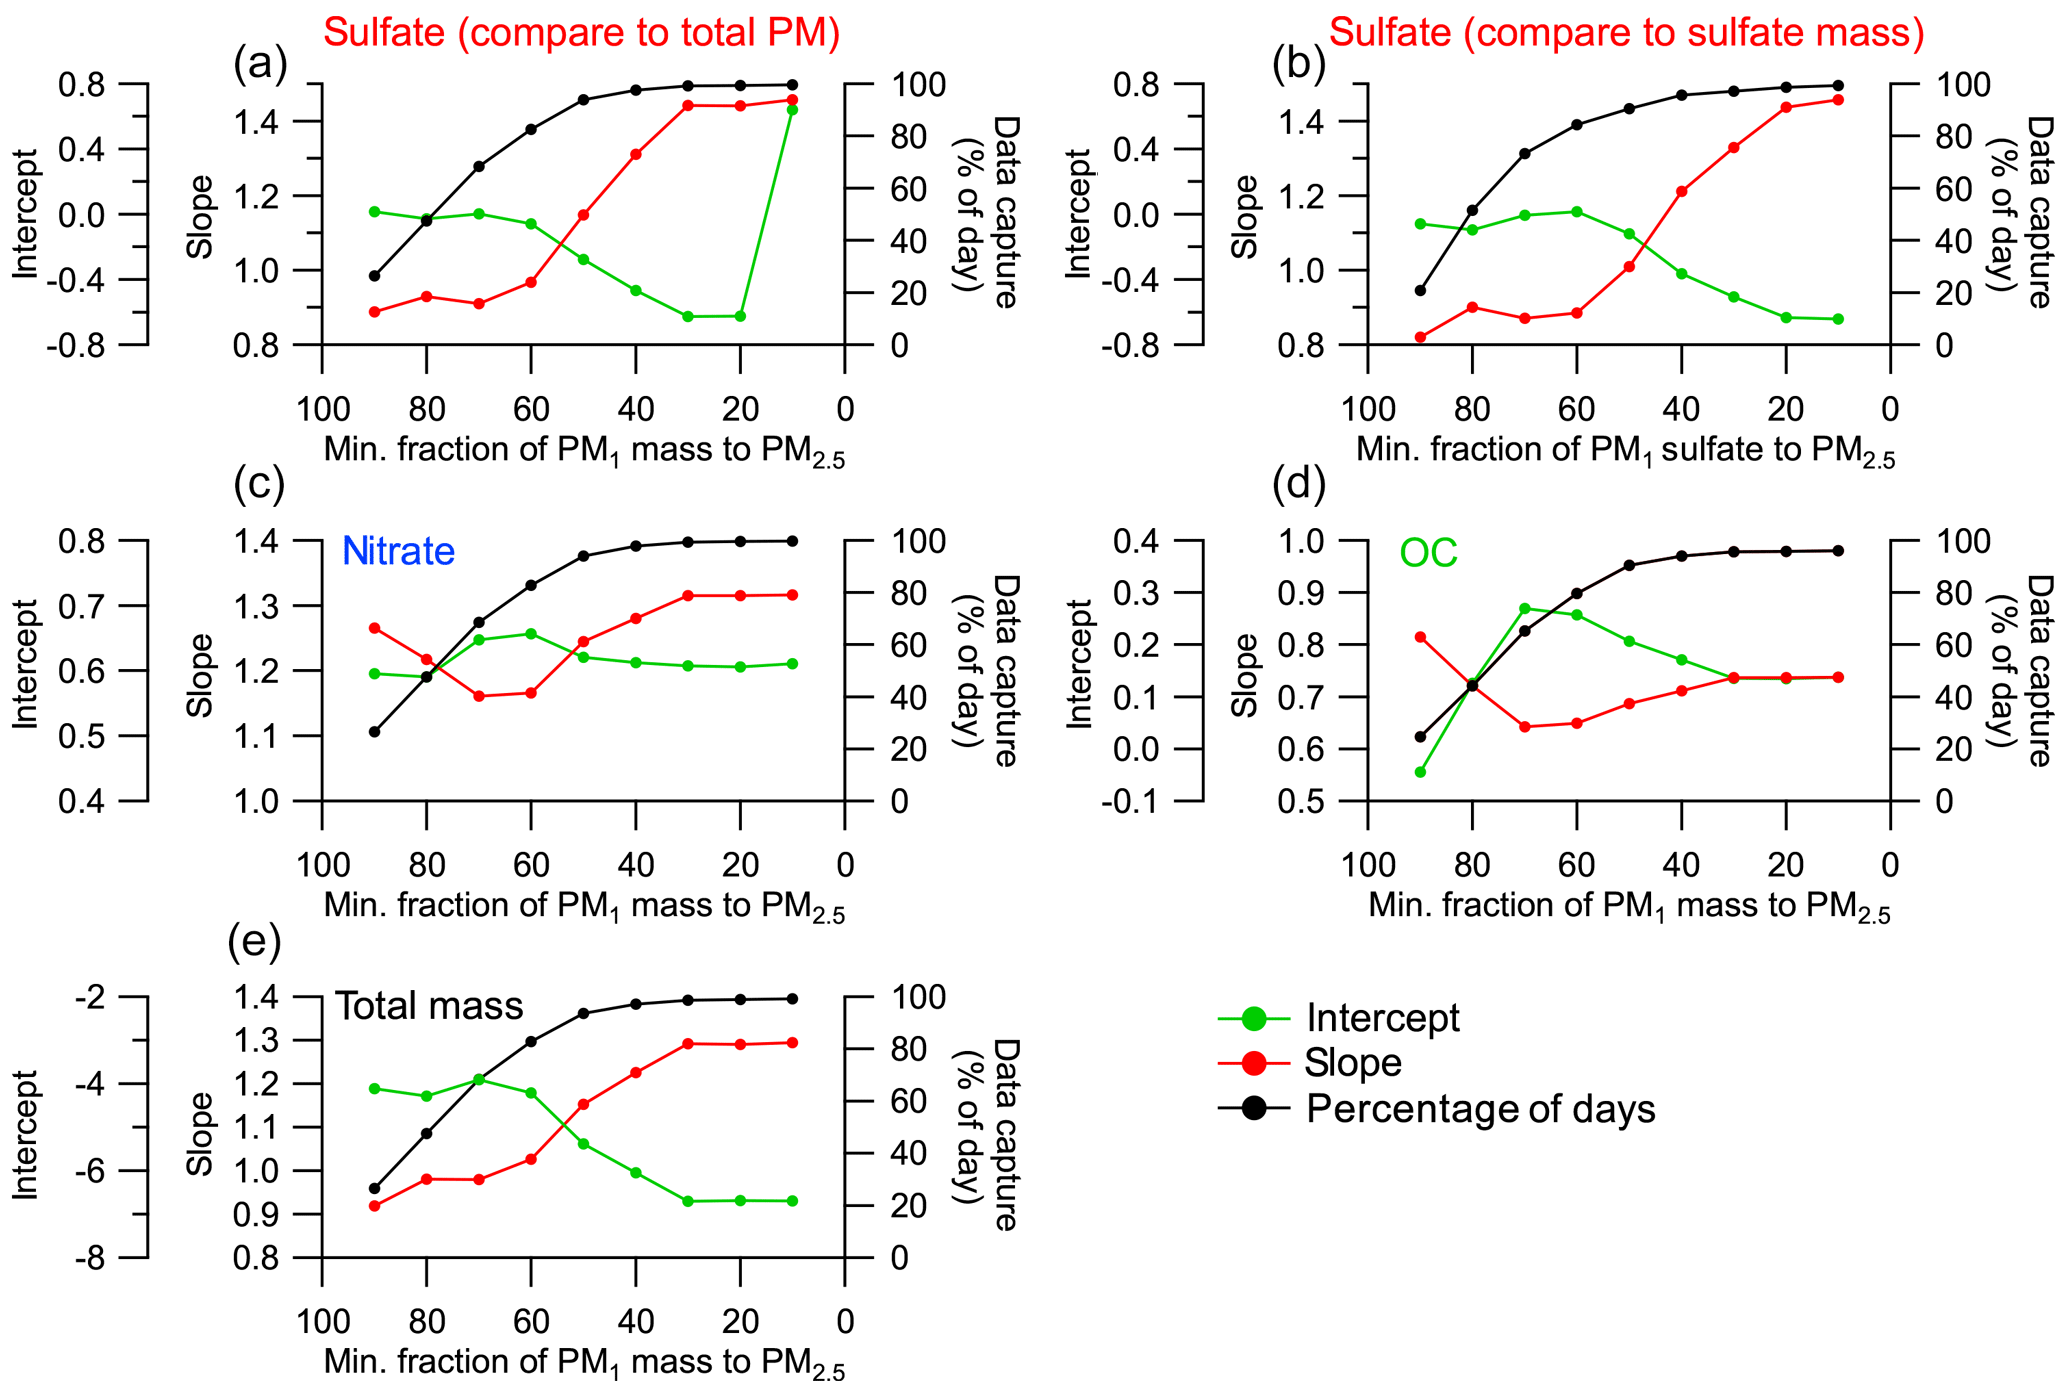
Figure 3Sensitivity analysis of the correlation between ACSM and PM1 sulfate, nitrate, OC, and total mass concentration depending on the PM1 : PM2.5 ratio of the total mass concentration in the range 90 %–10 %. The influence of sulfate distribution on PM1 and PM2.5 was also investigated.
The following will focus on the ACSM sulfate's overestimation days. There are several reasons that might explain the sulfate overestimation by the ACSM. The first is a technical aspect: since the ACSM has a mass spectrometer with a unit mass resolution, it cannot distinguish between sulfate and organic fragments with the same m∕z (for example, and/or C5H4O+ at m∕z 80 for ; or and C5H5O+ at m∕z 81 for ), as already discussed in Budisulistiorini et al. (2014). Therefore, an increase in the organic signal at this m∕z might lead to an overestimation of the ACSM sulfate mass concentration. Although our previous measurements using high-resolution time-of-flight aerosol mass spectrometer (HR-ToF-AMS) at Melpitz (Poulain et al., 2011b) support the presence of organic fragments on the unit mass resolution (UMR) sulfate signal. The difference between the sulfate mass concentration based on UMR (as for ACSM) and the one obtained for the high resolution (i.e., excluding the contribution of organic fragments on the sulfate signal) is below 10 %, indicating a minor impact of the organics to the sulfate signal. The second possible instrumental artifact is associated with the presence of a higher amount of organo-sulfate during these specific events. Indeed, organo-sulfate compounds lead to similar fragments as inorganic sulfate on AMS mass spectra (e.g., Farmer et al., 2010), which can contribute to the overestimation of the inorganic sulfate mass concentration. However, no particular change of and ratios was observed when directly comparing their values before and after events, which can support neither the presence of organo-sulfate nor an increase in organic fragments at m∕z 80 and 81. The second aspect is linked to sulfate size distribution. As can be seen in Fig. S4, the PM1 : PM2.5 ratio of the sulfate mass concentration has a pronounced season variability with a mean value of above 0.8 in spring and summer and of 0.6 in winter. The influence of supermicrometer particles is also supported by the PNSD and particle volume size distribution (PVSD) as illustrated in Fig. S5 for February 2017, which coincides with the period with the highest discrepancy between the two methods (Fig. 2). In order to investigate a possible dependency on particle mass size distribution, a sensitivity test analysis was performed by investigating the changes in the fitting parameters parallel to the changes in the PM1 : PM2.5 ratio for both sulfate and total PM mass concentrations (Fig. 3). In both cases, a clear change in regression slopes as well as intercept values could be observed whenever the PM1 : PM2.5 ratio became smaller than 60 %. For days with a PM1 : PM2.5>60 %, the regression slope ranges from 0.82 and 0.97, with a small intercept value ranging from −0.06 to 0.015 µg m−3. As soon as the PM1 sulfate or the PM mass concentration represents less than 60 % of the PM2.5, the ACSM overestimates the PM1 sulfate. Therefore, the discrepancy between the ACSM and the PM1 can be attributed to the individual upper size cutting of the two instruments, and it highlights the limits of such a comparison. As already mentioned, a minor effect of the RH on the cutoff shift of the offline samplers can be expected at Melpitz (Chen et al., 2018). Consequently – and for the following discussions on sulfate correlation – only the days with a PM1 : PM2.5 ratio of above 60 % will be considered, which still covers more than 80 % of sampling days. The Table S1 shows the fitting parameters obtained with and without considering the discussed size effect. The resulting correlation parameters show a regression slope of 0.96 (intercept and R2=0.77; Fig. 2), which supports the results reported by Minguillon et al. (2015) (slope =1.15) and Ripoll et al. (2015) (slope =1.12). Seasons do not exercise a significant influence on the correlation between the two instruments, with regression slopes ranging from 0.85 in summer to 1.06 in fall, which supports the results reported by Budisulistiorini et al. (2014) and are better than the ACSM reproducibility uncertainties of 28 % reported by Crenn et al. (2015). The very low intercepts (−14 to 0 ng m−3) might indicate a minor contribution of organo-sulfate on the ACSM sulfate (Fig. 2 and Table S1). As was already mentioned, the transmission efficiency of the aerodynamic lenses of the ACSM is decreasing from ≈600 nm (dva) to 30 %–40 % at 1 µm. Consequently, the remaining transmission efficiency of the aerodynamic lenses above 1 µm influences the sulfate correlation with the PM1 samples, leading to the reported overestimation of the ACSM sulfate mass concentration on days with a low PM1 : PM2.5 ratio.
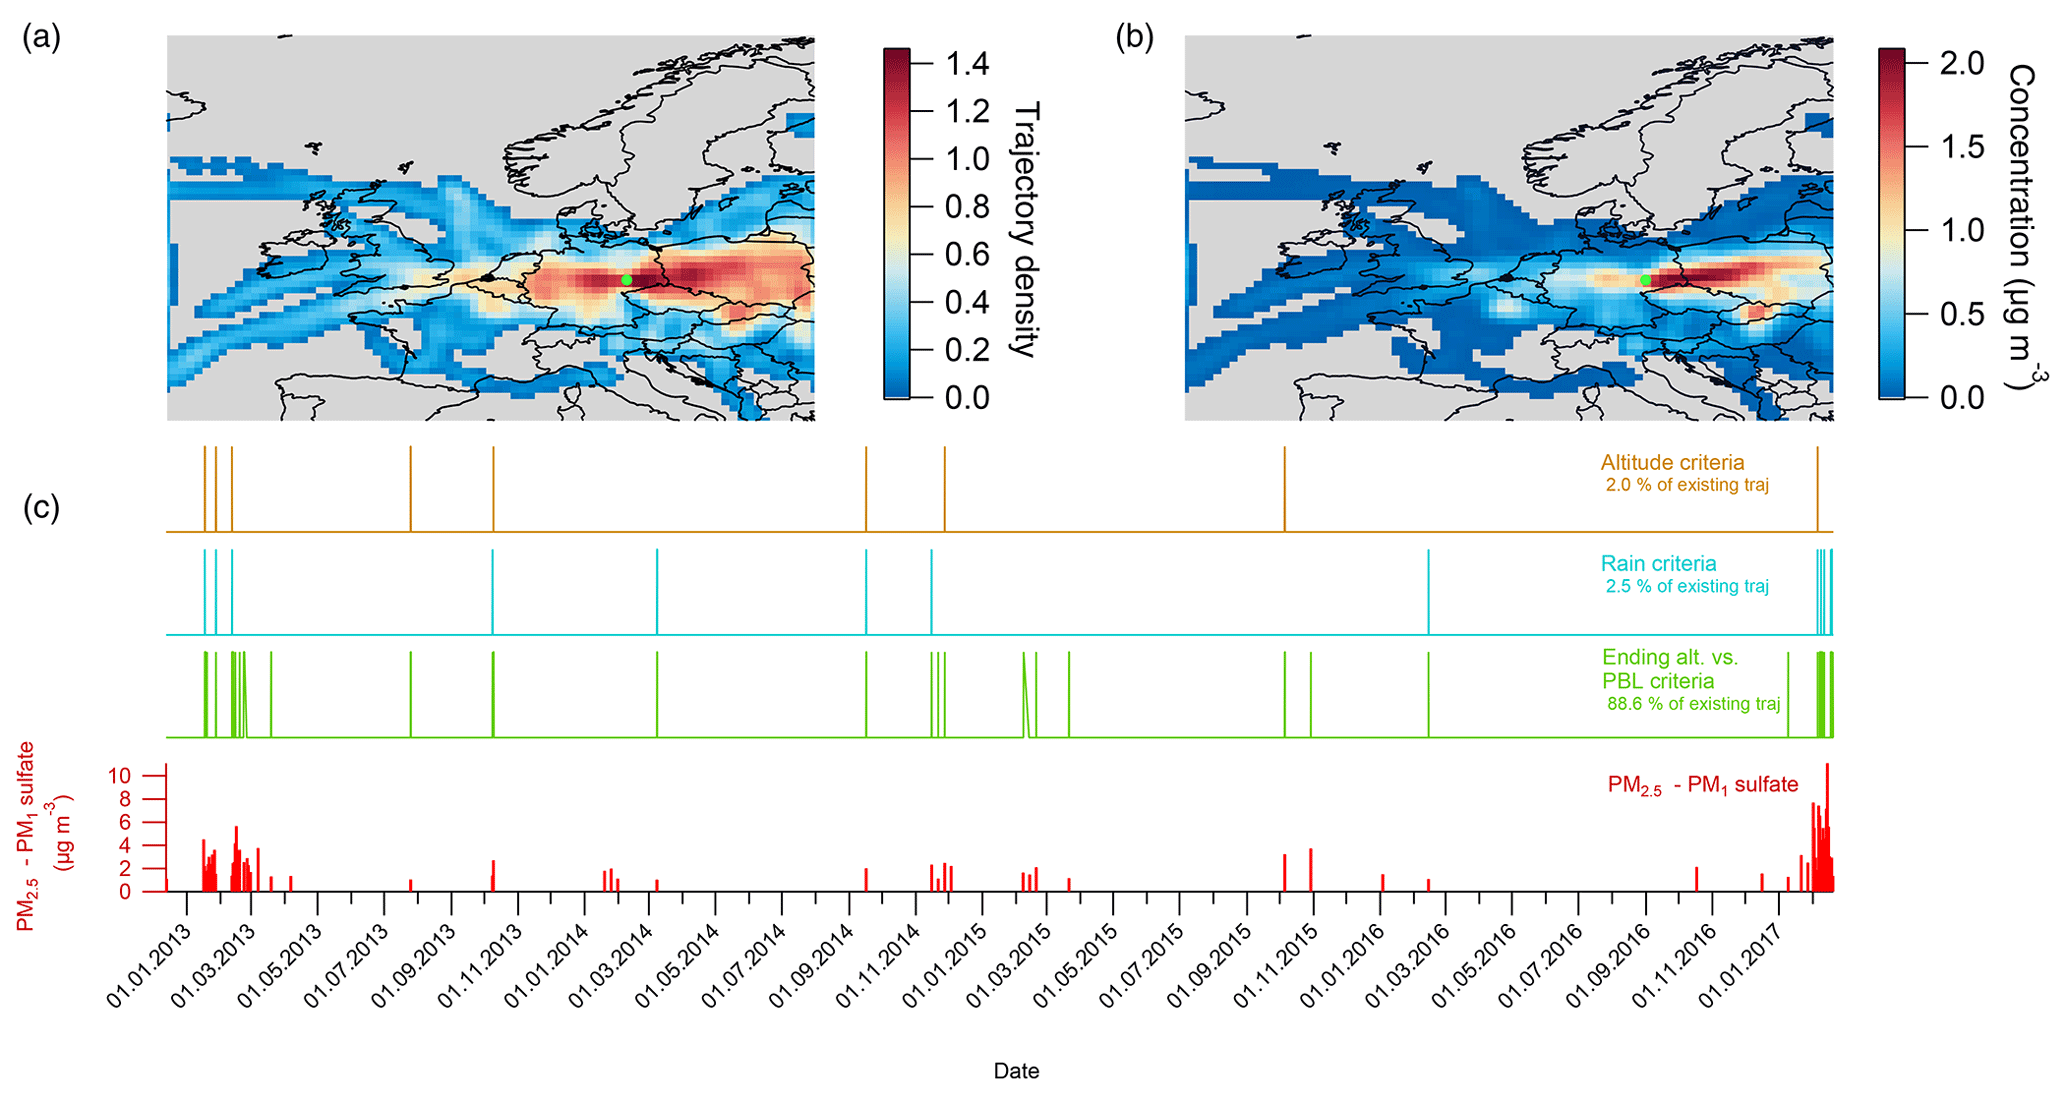
Figure 4Trajectory analysis for days where sulfate concentration difference between PM2.5 and PM1 exceeded 1 µg m−3: (a) overpassing trajectory density; (b) results of the potential source contribution function (PSCF) analysis; (c) time series of sulfate mass concentration difference, trajectory altitude above 2000 m, precipitation events exceeding 1 mm h−1, and PBL above the station <500 m.
To investigate a possible origin of supermicrometer sulfate, trajectory analysis was performed for days that have a difference in sulfate mass concentrations in PM1 and PM2.5 that is larger than 1 µg m−3 (i.e., PM2.5−PM1 sulfate >1 µg m−3) (Fig. 4). The trajectory density indicates that during these days, the air masses were dominated by two sectors (east and west), with the highest probability in a near, eastern area of Melpitz. This confirms the predominantly shallow planetary boundary layer (PBL) height as calculated by HYSPLIT, which was below 500 m for approx. 90 % of the time (Fig. 4c), rather indicating local/regional sources than resulting from long-range transport processes. For days that have a connection between calculated trajectories and measurements (e.g., PBL >500 m), PSCF analysis identified supermicrometer sulfate located inside a narrow corridor starting from Melpitz and going east, then passing over the south of Poland (Fig. 4b). Since this area is known to host several coal power plants, supermicrometer sulfate might be associated with coal emissions originating from this area.
3.1.2 Nitrate
The ACSM nitrate mass concentration tends to slightly overestimate the offline PM1 nitrate throughout the entire period (slope =1.16; R2=0.80; Figs. 1 and 2). This overestimation is very small and within the error margin compared to massive overestimation in Ripoll et al. (2015) with a slope of 1.35 (R2=0.77) and Minguillon et al. (2015) with a slope of 2.8 (R2=0.80). A similar conclusion was also drawn by Schlag et al. (2016), during a comparison to MARGA PM1 measurements. The overall results must be carefully interpreted since a strong seasonal effect has been observed (Fig. 2) with very poor correlation in summer (slope =6.28; R2=0.29) and a strong overestimation during the colder seasons (slope =1.29; R2=0.80). On the one hand, ambient temperature strongly influences the nitrate mass concentrations on filter samples. Ammonium nitrate is a semivolatile compound that evaporates, leading to a loss of ammonium nitrate on the filter sample. In an intercomparison study of different sampling supports, Schaap et al. (2004) demonstrated that a quartz filter (PM2.5 and PM10) is a suitable material for sampling nitrate as long as temperature does not exceed 20 ∘C. The high-volume samplers are sitting outside and are not temperature controlled. Therefore, the inside temperature of the sampler is influenced by the outside temperature. This temperature artifact is clearly illustrated in Fig. 5, when the variation in the ACSM : PM1 nitrate ratio and the maximum temperature measured during the sampling day are compared. For ambient maximum temperatures above 10 ∘C, an increase in the ACSM : PM1 ratio can be observed. Here it is imperative to note that the ambient maximum temperature did not reflect the temperature inside the sampler; solar radiation may also contribute to warming up the sampler. The highest discrepancy between the two methods corresponds to the warmest days, supporting the temperature artifact. Moreover, this also corresponds to the period with the lowest nitrate mass concentration measured by the ACSM (Fig. 5b), which might also interfere with the absolute value of the ratio. On the other hand, the nitrate quantification by the ACSM is not free of artifacts. The ACSM's nitrate quantification is mainly based on the signals at m∕z 30 (NO+) and m∕z 46 (), as well as on a minor contribution of N+ and ions in a similar way as for the AMS (Allan et al., 2003). As with sulfate, interferences due to organic contributions at m∕z 30 (CH2O+ and/or ) and m/z 46 (, C2H6O+) also cannot be completely excluded. Because the ACSM is working at a unit mass resolution (UMR), it is not possible to distinguish nitrate from organic signals at these two m∕z ratios. The direct consequence is a possible overestimation of the nitrate mass concentration in the UMR during high organic aerosol OA : NO3 periods as shown by Fry et al. (2018). Another source of uncertainties concerning the ACSM nitrate mass concentration is the contribution of organo-nitrates to the nitrate signal, since the nitrate function of the organo-nitrate compounds fragments in a similar way to inorganic nitrate (Farmer et al., 2010). Therefore, the presence of organo-nitrate compounds artificially increases the ACSM-nitrate concentration. Kiendler-Scharr et al. (2016) have already shown that organo-nitrate compounds contribute to a significant fraction of the default AMS-NO3 signal, especially in summer. It represents 57 % and 29 % of the default nitrate measured by an AMS at Melpitz in summer and winter, respectively (Kiendler-Scharr et al., 2016). Since the ACSM and the AMS are based on a similar principle, a simple assumption was made to tentatively correct the ACSM nitrate assuming the following: firstly, the winter nitrate filter PM1 mass concentration is free of temperature artifacts, and secondly, the contribution of the organo-nitrate to the ACSM nitrate signal is constant (29 %) over winter and years as previously reported for winter AMS measurements at the site. The resulting winter nitrate mass concentration has a better correlation to the filter PM1 (slope =0.88; R2=0.77; Fig. S6). This indirectly confirming the importance of organo-nitrate contributions to the default ACSM nitrate mass concentration during wintertime. Therefore, one should be careful when comparing the ACSM nitrate with an offline system because of both temperature and organo-nitrate artifacts. Comparing the ACSM with a PM1 MARGA for a year, Schlag et al. (2016) have obtained a R2 of 0.96 throughout the year, without discussing seasonal variability. Consequently, all these results tend to indicate that the ACSM inorganic nitrate should properly correlate with the temperature artifact-free PM1 nitrate measurements, as can be achieved by a PILS or a MARGA for example. Moreover, calculating the difference in nitrate mass concentrations between the ACSM and an online PM1 system (e.g., PILS or MARGA) might represent a possible way to estimate the organo-nitrate concentration as reported by Xu et al. (2015) using HR-ToF-AMS vs. PILS or by Schlag et al. (2016) using ACSM and MARGA. Due to the unit mass resolution of the ACSM, direct quantification of particulate organo-nitrate remains a challenging task, and more investigations are needed to better understand how organo-nitrate can be detected by the ACSM.
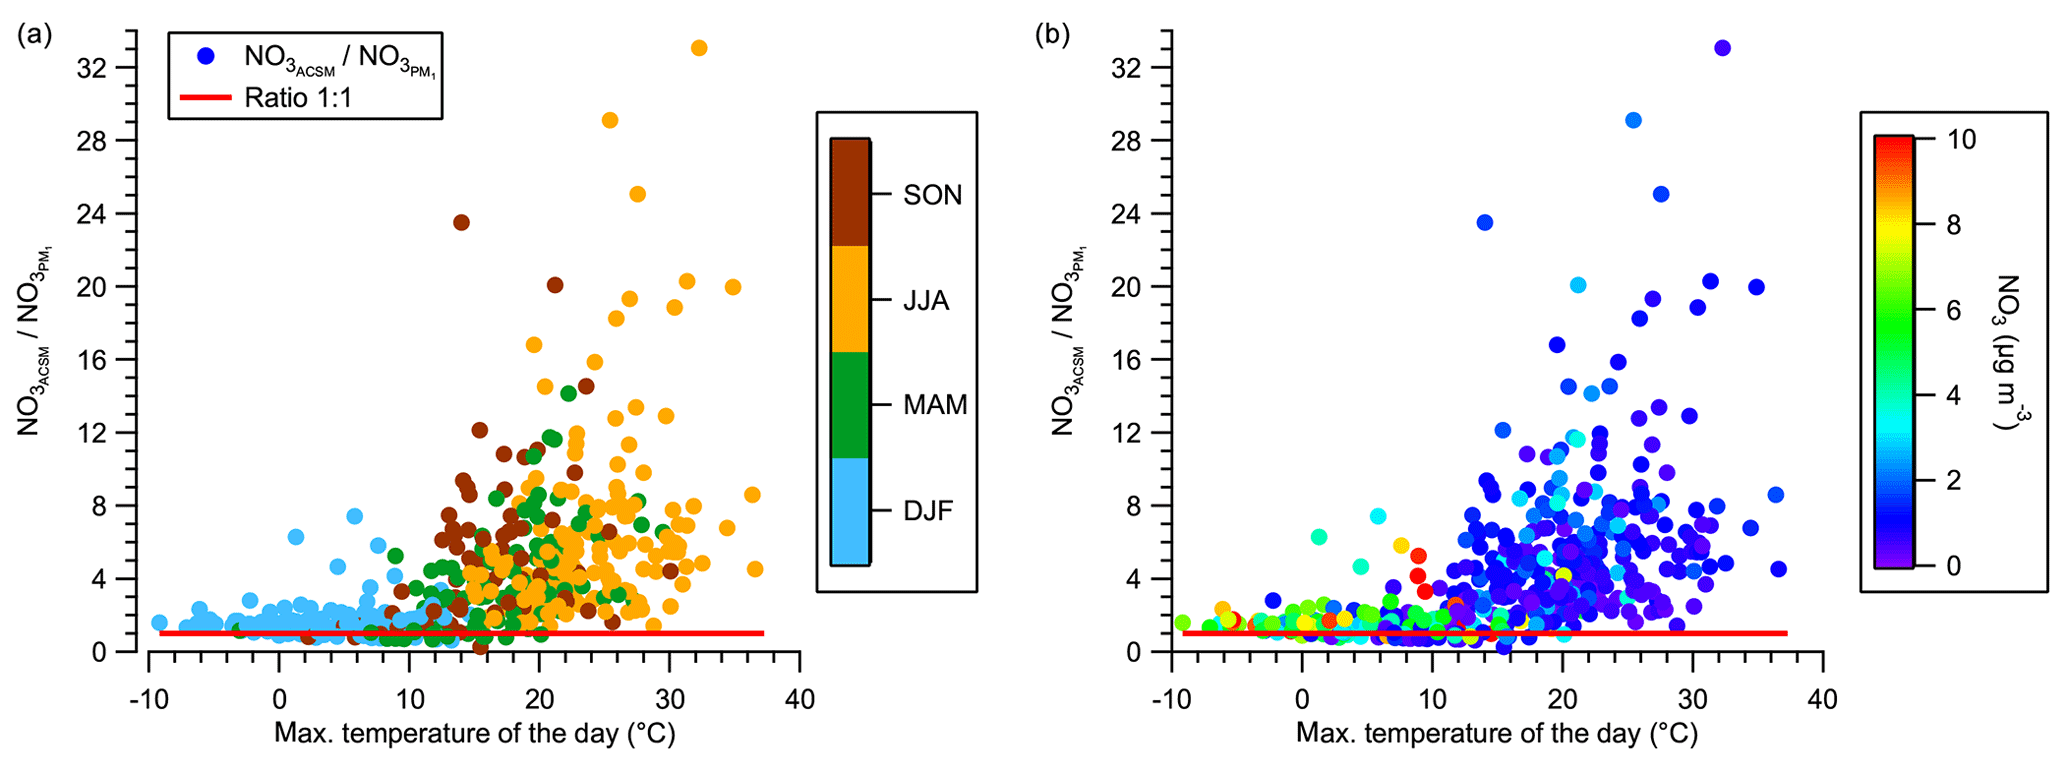
Figure 5ACSM : PM1 ratio nitrate mass concentration compared to the maximum temperature of the corresponding sampling day. The color code corresponds to the (a) different seasons and the (b) total nitrate mass concentration of the ACSM.
In a first approach, comparisons with the PM2.5 nitrate mass concentration provided better correlation coefficients over the entire period (slope =0.76; R2=0.77), as well as in winter (slope =0.74; R2=0.69), spring (slope =0.77; R2=0.83), and fall (slope =0.96; R2=0.74), compared to PM1 (Figs. S2 and S3). Similar to PM1, no correlation was found in summer. Here, the temperature effect on the filters as well as on organo-nitrate artifacts seems to have a less pronounced influence. Consequently, the presence of nonvolatile nitrate compounds such as sodium nitrate (NaNO3), resulting from the reaction of marine sodium chloride with HNO3 when marine air masses cross polluted areas (Finlayson-Pitts and Pitts, 1986; Pio and Lopes, 1998), might explain the difference in the correlations between PM1 and PM2.5. This is supported by the absence of significant effects of the PM1 : PM2.5 nitrate ratio to the fitting parameters when comparing the ACSM nitrate with the PM1 (Fig. 3). The influence of sodium nitrate at Melpitz has already been discussed in Stieger et al. (2017), comparing PM10 MARGA results with ACSM ones throughout the same period. Consequently, comparisons between the ACSM and PM2.5 nitrate measurements could be strongly biased by coarse-mode sodium nitrate that cannot be detected by the ACSM. This might be an important source of artifacts, especially for sites under the influence of processed marine air masses, and might lead to a wrong validation of the ACSM nitrate measurements.
3.1.3 Ammonium
The ammonium mass concentration measured by the ACSM mostly corresponds to ammonium nitrate and ammonium sulfate salts. Before comparing ACSM and offline PM1 ammonium mass concentration, the neutralization state of the particles was estimated for both datasets assuming a full neutralization by nitrate, sulfate, and chloride, as described in, e.g., Sun et al. (2010). In both approaches, particles can be considered as fully neutralized during the entire period with no seasonality (Fig. S7), in agreement with previous AMS measurements made at the same place (Poulain et al., 2011b). Correlations with offline systems fall somewhere between the two previously discussed ions. During the cold season, the ACSM ammonium mass concentration matches the PM1 (slope =1.02; R2=0.83), which supports the larger fraction of ammonium nitrate in the total PM as well as the size effect of sulfate during wintertime (Figs. 1 and 2). During the warm season, the evaporation of ammonium nitrate as discussed before will also induce a loss of ammonium on the filter samples compared to the online measurements leading to an underestimation of the ammonium concentration on the offline sampler as well as a poor correlation (R2=0.49). Similar conclusions can also be drawn when comparing it to the PM2.5 ammonium mass concentration (Figs. S2 and S3).
3.1.4 OM and OC
The ACSM provides organic aerosol (OA) mass concentrations, but contrary to the inorganic species, no direct comparison with collocated organic mass (OM) measurements provided organic mass concentration is possible. Actually, only ACSM or AMS systems are nowadays able to provide such measurements, and other methods – primarily based on the thermal and/or optical properties of carbonaceous aerosols – are estimating organic carbon (OC) mass concentration instead of OA. Here, offline OC measurements are available from the thermal–optical analyses of filter punches, allowing for comparing both parameters over the entire period of the study. In the following, the limitations of both methods are discussed. First of all, the organic aerosol mass concentration is defined as the sum of the non-attributed inorganic species fragments from the aerosol mass spectra as defined by Allan et al. (2004). A wrong assignment or correction of the fragmentation table during the data analysis process could be a source of mis-quantification of the organic mass concentration. For example, the fragment (m∕z 44) is the major signal on the organic mass spectra. It can suffer from substantial measurement biases, i.e., the so-called Pieber effect (Pieber et al., 2016; Freney et al., 2019) associated with interference due to nitrate signal. This artifact can lead to an overestimation of the m∕z 44 and consequently directly affects the total organic mass concentration. Unfortunately, a thorough quantification of this effect on the present dataset is not possible, as the relevant method to do so includes regular full-scan calibrations, which has been proposed only recently, and further works are still needed to define associated correction procedures (Freney et al., 2019). Another main source of uncertainty for OA concentration estimates is linked to the assumption of a constant RIE. Here, it has been set at its 1.4 default value during the whole period of the study, while it is known that organic RIE and/or its CE can be influenced by the chemical composition of the organics (Xu et al., 2018). As already mentioned, organics are not included in the CDCE estimation method from Middlebrook et al. (2012), which might also have a potential impact on the resulting mass concentration. Overall, an uncertainty of 19 % in the ACSM organic mass concentration can be considered based on the ACSM reproducibility analysis made by Crenn et al. (2015).
OC mass concentrations derived from the offline analyses of filter samples are also subject to measurement uncertainties They are obtained according to a specific method (here the EUSAAR2 thermal–optical protocol). Applying another method will directly influence the OC concentration (Cavalli et al., 2010; Zanatta et al., 2016; Chiappini et al., 2014). Moreover, the samplers used for this study were sitting outside and were not temperature controlled. A direct consequence is that the evaporation of the more semivolatile organics during warm days must be expected, which similarly impacted the measured OC concentration as for ammonium nitrate discussed above.
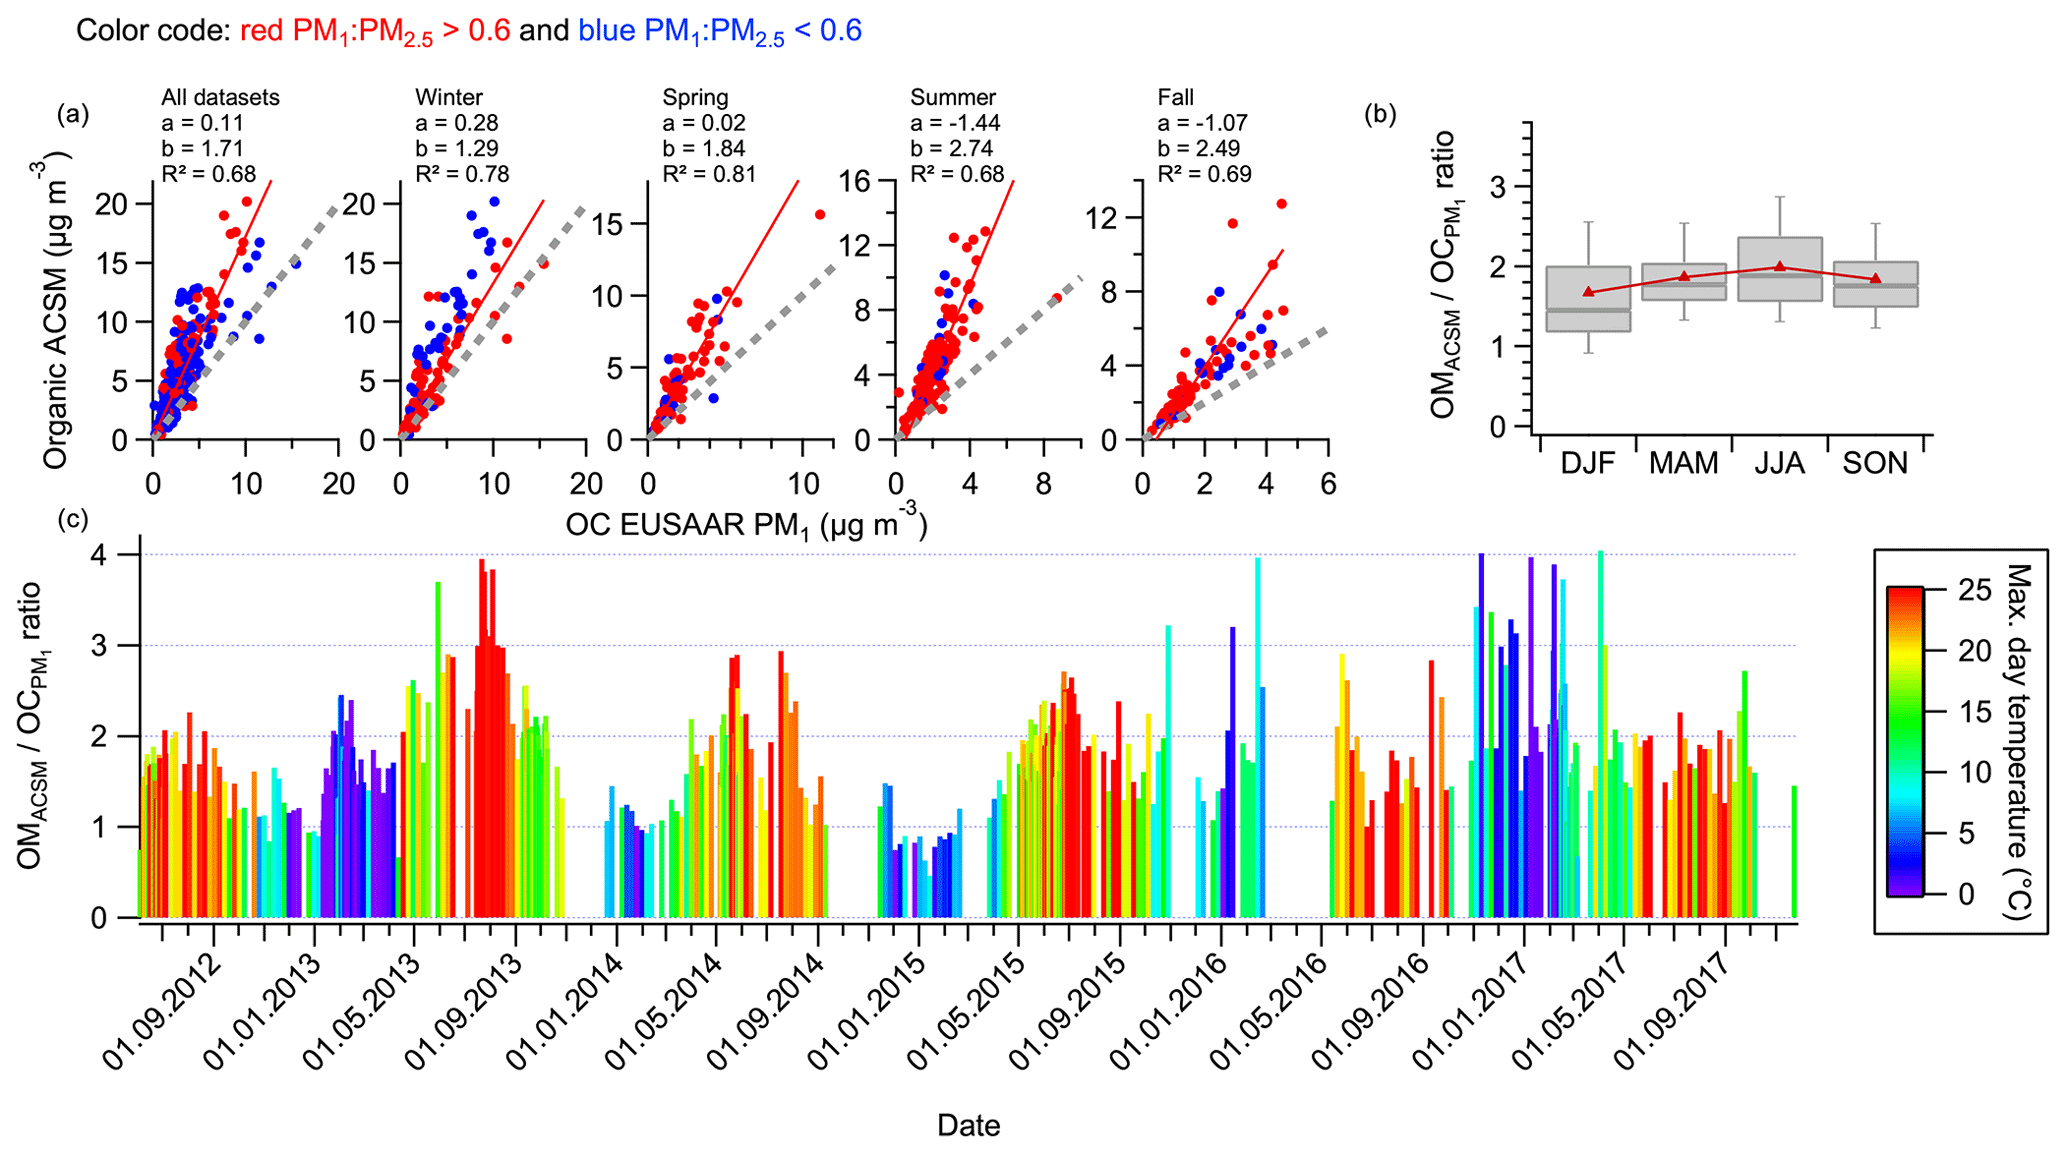
Figure 6(a) Correlation between ACSM organic mass concentrations and offline OC PM1; (b) seasonal variability in the estimated OMACSM : OC ratio; (c) the entire time series colored by maximum daily temperature.
Keeping in mind all the mentioned uncertainties on each method, the OA mass concentration was compared to the offline OC mass concentration, which can therefore be considered as a fair estimation of the OM : OC ratio (Fig. 6a). Correlation between OA and OC is not significantly impacted by the PM1 : PM2.5 threshold ratio of 0.6 as for inorganics (Table S1). This supports the fact that organics are mainly distributed on the submicrometer size range throughout the year (Fig. S4). As expected, a lower OM : OC ratio was obtained in winter (slope =1.29; R2=0.78), which corresponds with the period with the largest anthropogenic influence. The highest OM : OC ratio was obtained in summer (slope =2.74; R2=0.68), corresponding with the secondary organic aerosol (SOA) formation maximum. Although such a seasonal variation is coherent with a priori expectations (notably considering higher SOA contribution at summertime), biases related to instrumental uncertainties should still be considered. In a similar way as for nitrate, ambient temperature affects the OC leading to a systematic extreme OM : OC ratio during summer (Fig. 6c). Consequently, the summer's slope of 2.74 is certainly overestimated. However, some extreme values are found also for some winter days, which can therefore not be associated with a temperature artifact on the offline samplers. Such wintertime discrepancies might rather be attributed to the abovementioned ACSM uncertainties related to RIE for organics, CE estimation, and/or substantial influence of the so-called Pieber effect.

Figure 7Correlations between the estimated OCACSM and the offline OC mass concentration over the entire period and seasonality for (a) PM1 and (b) PM2.5. Black lines show the least-orthogonal-distance linear fit and the red dotted lines the 1 : 1 line.
Another way to compare ACSM measurements to OC concentrations could be envisaged based on some previous works using AMS systems. Indeed, the estimation of the OM : OC ratio from AMS measurements is normally not done on a direct comparison of organic particle mass concentrations with collocated OC measurements but rather estimated based on the elemental analysis of the high-resolution organic mass spectra – Aiken et al. (2007) and Aiken et al. (2008) – or the variability in the f44, the contribution of mass m∕z 44 (mostly ) to the total organic signal when only unit mass resolution mass spectra are available (Aitken et al., 2008; Ng et al., 2010). Both methods were reinvestigated and improved by Canagaratna et al. (2015) providing the following equations to convert the f44 signal of an AMS into O : C and OM : OC ratios:
By a systematic comparison of the two approaches, the elemental analysis and the f44, Canagaratna et al. (2015) concluded an accuracy of 13 % of the f44 proxy for SOA traces decreasing for primary OA standards having an f44<4 % on average. Considering that m∕z 44 is systematically the dominate fragment of the organic mass spectra for ambient measurements and that the ACSM is based on similar principle as the AMS, it is relevant to apply the f44 approach to the ACSM organic results as a proxy for ambient OC and compare the results with the well-established offline OC method. Therefore, Eqs. (1) and (2) were applied in the present dataset to estimate OC mass concentrations from the measured ACSM organic mass concentration (OCACSM) and to compare them to the OC (for the entire dataset: slope =0.65; R2=0.73; Fig. 7a). As previously shown, a seasonal trend can also be observed here, with a unity regression slope obtained during summer periods (slope =0.99; R2=0.64), whereas a lower slope (0.56; R2=0.82) was obtained in winter (Fig. 7a). Here, the different instrumental and technical uncertainties have to be considered. Contrary to nitrate, temperature seems to have a less significant impact on the ratio between the OCACSM and the OC, as can be seen in Fig. S8. However, the extreme OCACSM : OC ratio values mostly happened during warm days, supporting our previous conclusion about the temperature artifact on the OMACSM : OC ratio. As was mentioned above, the extreme ratio values during winter might result from a possible variability in the organic RIE as well as a possible so-called Pieber effect on the m∕z 44 that directly affects the estimation of the OCACSM. Despite this agreement between ACSMs, Crenn et al. (2015) showed a large variability concerning the f44 signal itself during the ACSM intercomparison exercise. This variability was attributed to an instrument-dependent difference in the vaporization conditions. For this reason, the authors did not recommend to systematically use the f44 approach to estimate the O : C ratio, as it can be achieved with the AMS and done here, or to interpret the resulting O : C ratios with caution. Since the OCACSM results are well supported by the offline analysis, we can conclude that our ACSM provides a relatively realistic value of the f44 over the considered timeframe and consequently, a reasonable proxy for the OM : OC ratio. However, we cannot rule out that a similar approach would provide the same results when using another ACSM at Melpitz and/or when applying the present method in another location. Further systematic comparisons between the ACSM and collocated OC measurements should be performed in order to better investigate and characterize the suspected instrument vaporization dependency and/or a possible matrix effect depending on the dominant type of aerosol chemical composition at the considered sampling site, which might influence both the signal and the organic RIE.
Comparison of the OCACSM with the OC PM2.5 (Fig. 7b) presents a systematic underprediction of the ACSM organics, which can be directly related to the size distribution of organic carbon between PM1 and PM2.5 (Fig. S4). Similar seasonality effects can be observed, which matches the quite constant distribution of the OC between PM1 and PM2.5 over the course of a year.
3.2 Mass closure analysis
Before performing a mass closure analysis, the total ACSM particle mass concentration (i.e., the sum of organic, nitrate, sulfate, ammonium, and chloride mass concentrations) was completed by adding the eBC PM1 mass concentration. The eBC (PM10) measured by the MAAP was converted to PM1 by using a factor 0.9, which was obtained by running two MAAPs at Melpitz side by side with different inlets; see Poulain et al. (2011b). The resulting total PM1 mass, later referred to as the ACSM–MAAP-derived mass concentration, was then compared to the particle mass concentration obtained by weighing filters (PM1 and PM2.5) as well as to the calculated particle volume and mass concentration from the PNSD of the MPSS.
3.2.1 Mass closure with offline filters
In a similar way to sulfate, the mass closure between the online ACSM–MAAP-derived mass concentration and the offline PM1 mass concentrations strongly depends on the PM1 : PM2.5 ratio (Fig. 3). Because nitrate and organics did not present such a dependency to the PM1 : PM2.5 ratio (Fig. 3), the sulfate size distribution should be the main driver of the total mass correlation. Consequently, the same PM1 : PM2.5 threshold of 0.6 is applied in the following for the mass closure analysis and its discussion. It leads to a strong consistency between the online and the offline methods (slope =1.02; R2=0.90; Fig. 2 and Table S1). Our results support those of Petit et al. (2015), which used a PM1 TEOM-FDMS for mass closure over a 2-year timeframe (slope =1.06). However, Guerrero et al. (2017) stated that a regression slope of 0.81 could also be found in the PM1 TEOM-FDMS. Therefore, it is not possible to conclude whether this difference in correlation results between the two studies depends on the location or the presence of more coarse mode particles. Moreover, a possible loss of the more volatile compounds during the heated transmission line of the TEOM-FDMS could also occur.
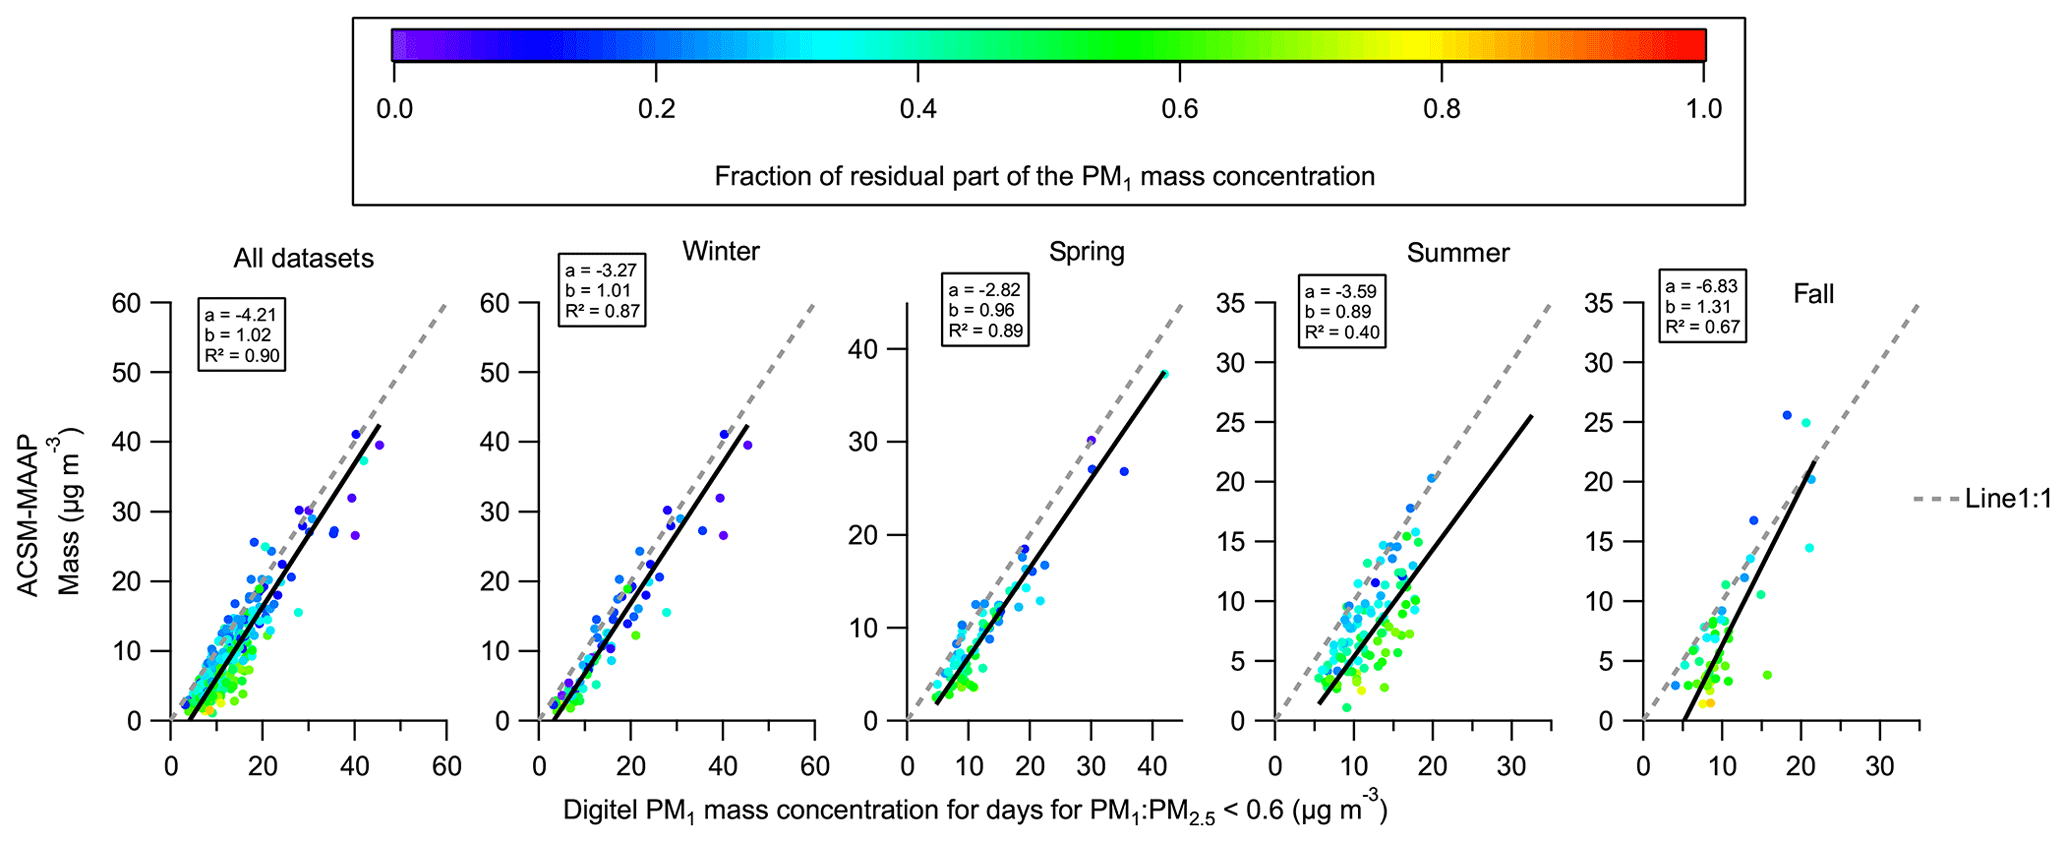
Figure 8Influence of the residual mass fraction on the PM1 filter to the mass closure with online ACSM–MAAP-derived mass concentration.
Looking at the different seasons, the regression slopes were always around unity except in fall (slope =1.31), the overestimation of which will be discussed in the following. Despite a near-unity regression slope of 0.96 in summer, the low R2 and the high intercept value (−3.59 µg m−3) both suggest a possible bias between the two methods. Chemical analysis performed on the filter samples cannot typically account for the entire mass, leading to the so-called residual mass fraction. This residual mass fraction is made out of all the non-water-soluble compounds such as mineral dust and carbonated or metal ones that are not detected. Here, the residual mass fraction was calculated as the difference between the weighed filter mass and the sum of the detected compounds (Fig. S9). It is important to note here that to properly convert the OC into OM and to consider all the different limitations inherent to both online and offline approaches, the seasonal means' OM : OC ratio values (Fig. 6b) were applied. Figure 8 illustrates how this residual mass fraction interferes with the comparison of the ACSM–MAAP-derived mass concentrations. In summer, the residual mass fraction represents a significant part of the PM1 mass concentration (above 60 %), explaining the low correlation coefficient and the large intercept value in this season. Similar conclusions can be drawn for fall. The increase in residual mass fraction in summer and fall could be associated with a larger resuspension of crustal material on dry and warm days and/or with agricultural activities (e.g., plowing) at these times of the year. Since mineral dust is not detectable by the ACSM, the presence of such compounds in the PM1 could significantly influence mass closure results and must, therefore, be considered in such an approach.
A comparison with the PM2.5 mass concentration provides a regression slope of 0.69 (R2=0.77; Fig. S3), which matches the comparisons from the literature using PM2.5 TEOM-FDMS mass concentration (e.g., Sun et al., 2015, 2012). A seasonal effect on the correlation can be observed (Fig. S3). In winter, the discrepancy between online and offline techniques becomes more pronounced (slope =0.65; R2=0.88). This supports the seasonal variation in the PM1 : PM2.5 ratio (Fig. S5) as well as the impact of coarse-mode sulfate that was previously mentioned. Similar results were also shown by Sun et al. (2015) when performing mass closure with a PM2.5 TEOM.
3.2.2 Mass closure with PNSD
The PNSD has been continuously measured in parallel with the aerosol mass spectrometer and can, therefore, be used to perform mass closure analysis between ACSM–MAAP and PNSD (ranging from 10 to 800 nm, mobility diameter). To ensure a robust comparison between the two systems, two approaches are reported in the literature: the first one consists of converting the ACSM–MAAP mass concentration into volume and the PNSD in volume concentration. The second one consists of converting the PNSD into mass concentration. Both approaches are based on the same assumptions of (i) spherical and (ii) fully internally mixed particles and (iii) an identical chemical composition over the entire size distribution to estimate a chemical time-dependent gravimetric particle density based on the following equation from Salcedo et al. (2006):
Here, the density was assumed to be 1.75 g cm−3 for ammonium nitrate and ammonium sulfate (Lide, 1991), 1.52 g cm−3 for ammonium chloride (Lide, 1991), and 1.2 g cm−3 for organic matter (Turpin and Lim, 2001). Finally, a density of 1.77 g cm−3 (Park et al., 2004) was applied for eBC. A discussion of eBC density can be found in Poulain et al. (2014).
It is important to note that for the volume concentration approach, both measurements (ACSM–MAAP and MPSS) remain independent between each other, which is not the case when using mass concentration. However, only a few papers reported a comparison between AMS or ACSM and MPSS in volume concentration (e.g., DeCarlo et al., 2008; Elsasser et al., 2012). Even though the two variables are non-independent in the mass concentration approach, it remains the most commonly used. A possible reason is that the mass concentration unit remains easier to use and interpret than the volume concentration since atmospheric measurements are usually made in mass concentration.
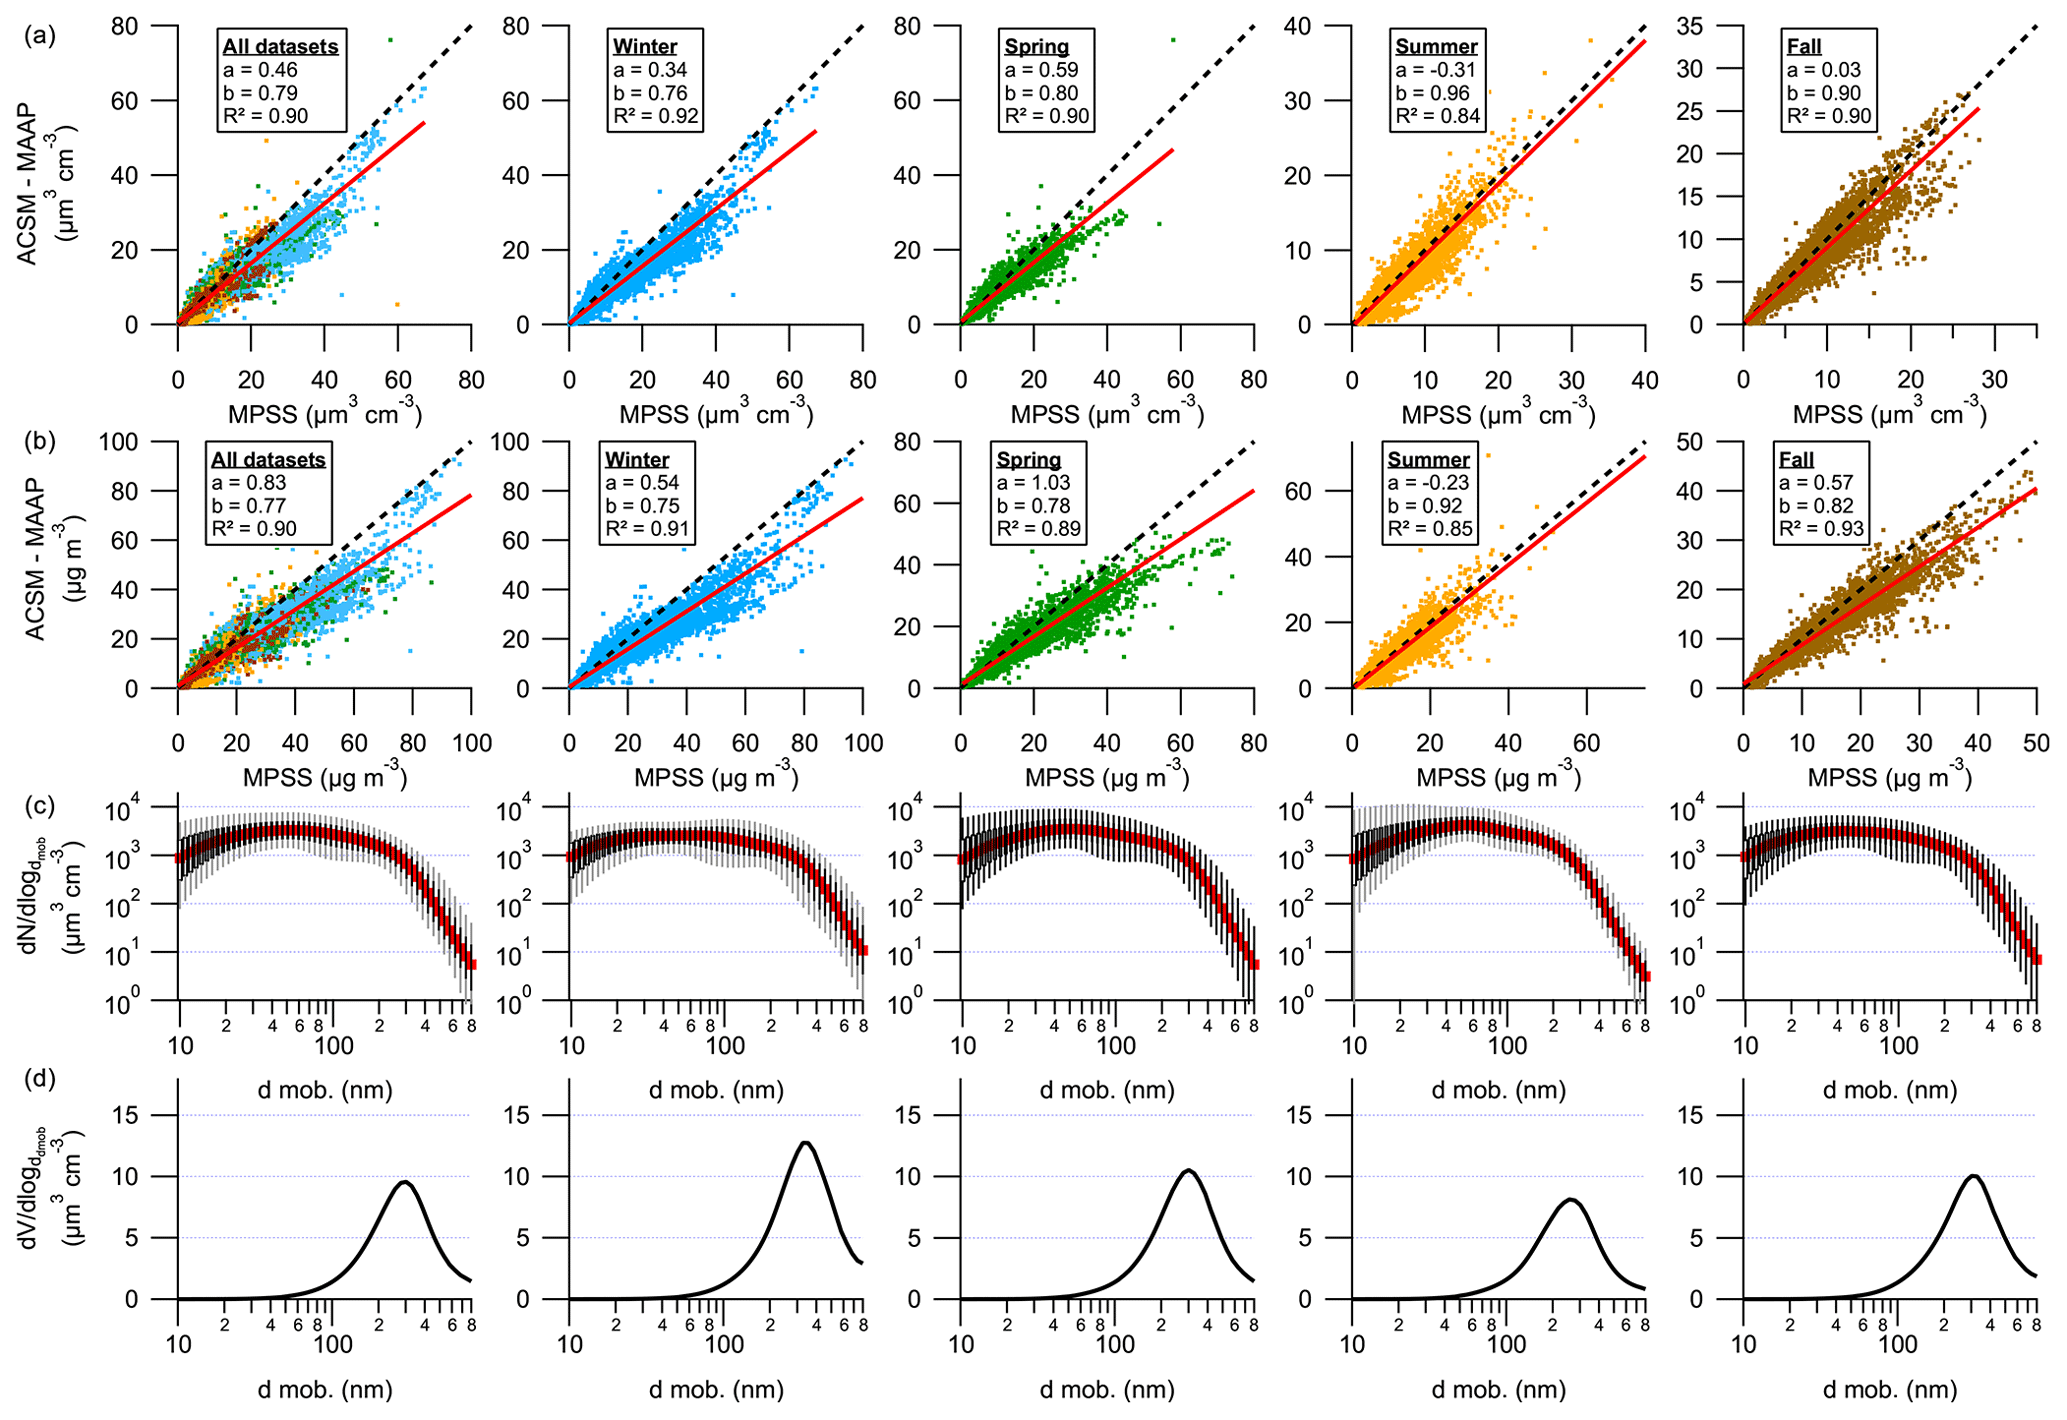
Figure 9Comparison between measured ACSM–MAAP and MPSS for the entire period and seasonal variability: (a) volume closure, (b) mass closure, (c) median number size distribution (red) with 10–90 (grey line) and 25–75 (black boxes) percentiles, and (d) median volume size distribution. The linear regressions (red lines) were calculated using the least- orthogonal-distance fit method.
Here, we investigated comparison results obtained using each of these approaches. Results are summarized in Fig. 9a for the volume concentration approach and Fig. 9b for the mass concentration one. Over 5.5 years of measurements, the ACSM–MAAP-derived volume or mass concentration correlates well with the estimated volume or mass concentration of the MPSS with similar slopes of 0.79 and 0.77, respectively (R2=0.90; Fig. 9a and b). This matches similar previous comparisons at the same place with an AMS (Poulain et al., 2014). Therefore, the selected method (volume or mass) did not substantially influence the comparison results. In the conditions of the present study both approaches could be applied for the station of Melpitz. Since comparison in mass concentration is the more commonly used, we will focus on it in the following discussions.
However, our results also highlight a non-negligible seasonality effect on mass closure, with a better slope in warmer seasons (summer: slope =0.92; R2=0.85) than in cold ones (winter: slope =0.75; R2=0.91). A similar seasonality was already reported by Fröhlich et al. (2015b) using a ToF-ACSM at the Jungfraujoch (Switzerland) during 14-month measurements. The median particle number (Fig. 9b) and volume (Fig. 9c) size distributions throughout the winter and summer months emphasize two different behaviors. In winter, the fine-mode volume distribution peak occurs around 340 nm, while in summer it is around 250 nm. Moreover, the particle volume size distribution in winter also shows a higher concentration of the largest size bins. This difference corresponds to the higher concentration of supermicrometer particles in winter as confirmed by the seasonality of the PM1 : PM2.5 mass ratio (winter: 0.73; summer: 0.84; Fig. S4). The PNSD provided by the MPSS is corrected from multiple-charged particles artifact in the submicrometer size range, and in case of low contributions of supermicrometer particles, the multiple-charged particles coming from supermicrometer particles on the PNSD are negligible. However, in case of a large coarse-mode concentration, multiple-charged particles from the supermicrometer size range might also affect the submicrometer size distribution, leading to an overestimation of the PNSD. This interference represents a possible source of artifact for the MPSS in such a case (Birmili et al., 2008). This artifact may plausibly explain the seasonality of the mass closure. An extended particle number size distribution by merging the MPSS and the APSS is presented in Fig. S5 for February 2017 to illustrate the impact of supermicrometer particle on size distribution. This period was strongly influenced by coarse-mode particles that interfered with the comparison between the ACSM and offline sulfate and PM as discussed earlier. On the other hand, as previously mentioned, the transmission efficiency of the aerodynamic lenses of the ACSM decreases to about 30 %–40 % from ≈650 nm (dva) to 1 µm. Consequently, the ACSM certainly underestimates the particle mass concentration for the larger size bins compared to the MPSS, which might also have a significant effect on particle mass closure with the MPSS in wintertime.
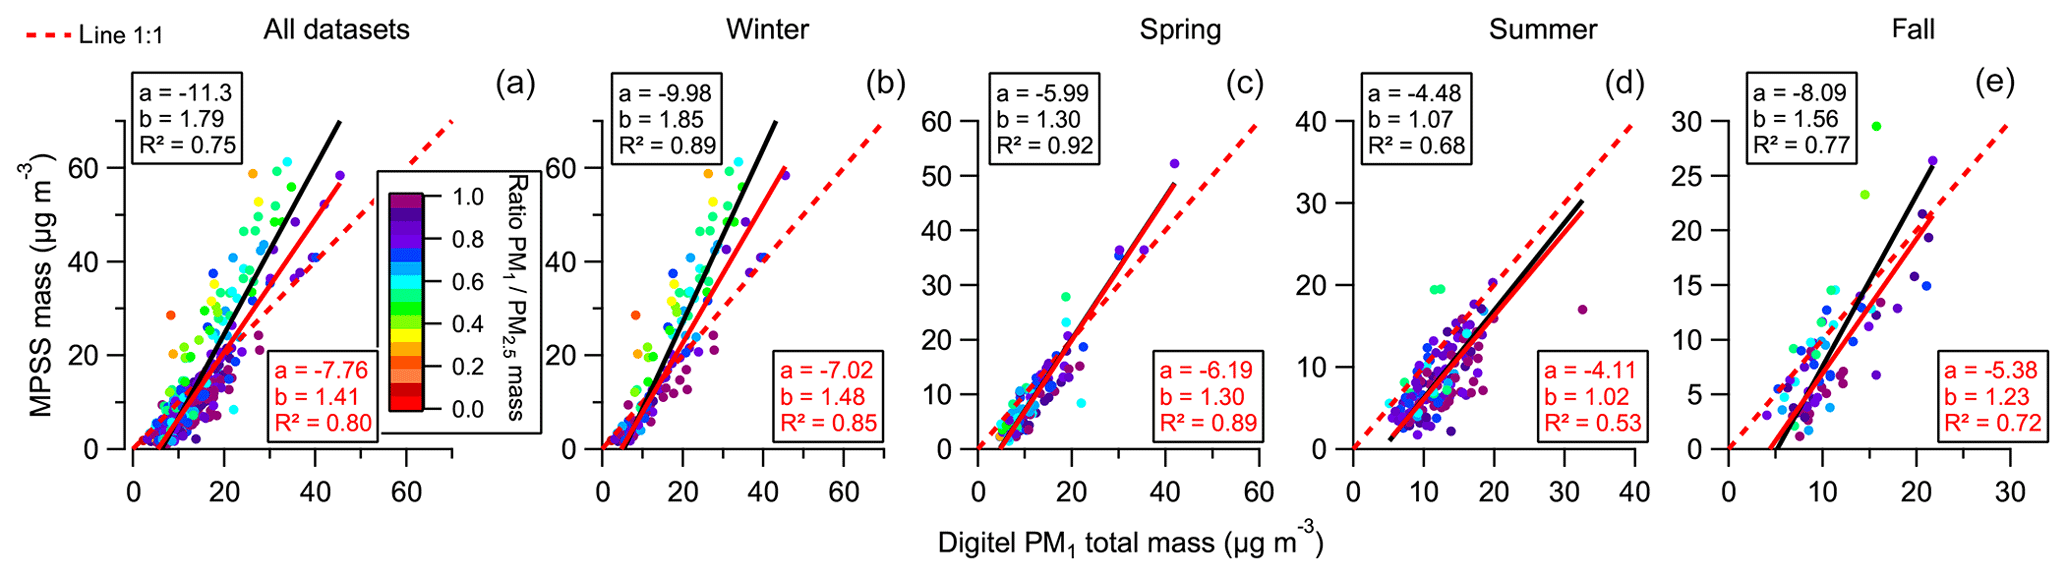
Figure 10(a) Comparison between filter PM1 total mass concentrations and the MPSS-derived mass concentrations for the entire period and (b–e) the different seasons. The black lines and boxes correspond to the regression fitting without threshold correction and the red lines to the regression fitting according to a PM1 : PM2.5>0.6.
Assuming spherical particles and a constant density of 1.6, the size cutting of the Digitel PM1 corresponds to a volume equivalent diameter of approx. 790 nm, which is quite similar to the MPSS (800 nm). The comparison between the MPSS-derived mass concentration and the PM1 filter one also supports our conclusions (Fig. 10). Whereas the correlation slope of 1.79 (R2=0.75) over the entire dataset seems to indicate an overestimation of the offline PM1 compared to the MPSS, the correlation slope is strongly influenced by some winter days. Here, again, the discrepancy between the two methods can be linked directly to the upper size cut of each system. As shown in Fig. 10, the discrepancy between the PM1 and the MPSS-derived mass concentration is always associated with days with a low PM1 : PM2.5 ratio corresponding to a larger contribution of the coarse-mode particle compared to the other days. This result confirms the individual size-cutting effect as well as supports our conclusions about a non-negligible artifact of supermicrometer multiple-charged particles on the estimated MPSS mass concentration on specific winter days. During summertime, the PM1 filter mass concentrations underestimate those derived from the MPSS, which have to be associated with the already discussed loss of semivolatile compounds on the filters.
A systematic comparison between the ACSM and collocated measurements (including daily PM1, PM2.5, and MPSS) over a period of more than 5 years was performed to investigate the robustness of the ACSM as well as to identify the limits of such an exercise and the possible sources of uncertainties and artifacts. For such an exercise, it is fundamental to ensure isokinetic flow splitting between the different instruments connected to the main sampling line to ensure a homogeneous distribution of the air sample.
The comparison with the offline daily PM1 samples over the entire period highlights a strong artifact due to the presence of supermicrometer sulfate. This artifact becomes non-negligible as soon as the PM1 : PM2.5 ratio of the sulfate (and subsequently the total PM mass concentration) is below 60 %. The differences were directly associated with the specific size cutting of each instrument and the effect of the remaining transmission efficiency of the aerodynamic lenses of the ACSM above 1 µm. Moreover, similar conclusions were also drawn for the mass closure between the MPSS and PM1 mass concentrations, confirming individual instrumental upper size cutoff effect. Because this artifact strongly depends on the size distribution of sulfate salts, it certainly depends on the sampling location and the origin of the different aerosol sources. Moreover, this effect should also depend on the aerodynamic lenses themselves, which should not all have exactly the same transmission efficiency about 1 µm, leading to a certain instrument dependency. Considering these instrumental limits, the ACSM sulfate mass concentration strongly correlates with the one measured on the filters without any pronounced seasonal effect (slope =0.96; R2=0.77). This also indicates a minor contribution of organo-sulfates to the ACSM sulfate mass concentration at the measurement site. Consequently, the appears to be a crucial parameter to ensure the SO4-ACSM validation as well as to support the ACSM's sulfate calibration. In contrast, nitrate mass closure suffers from strong sampling artifacts for both instruments. On the one hand, offline measurements are strongly affected by a temperature effect, leading to the evaporation and loss of ammonium nitrate, as was observed for maximum day temperatures of above 10 ∘C. On the other hand, organo-nitrate compounds lead to a systematic overprediction of nitrate by the ACSM, which was clearly demonstrated in winter. Therefore, more investigations on the quantification of organo-nitrate by the ACSM are required in order to reduce this uncertainty.
The ACSM organic mass concentration correlates with the OC (R2=0.68 to 0.81), supporting the ACSM organic measurements. The regression slopes have a clear seasonal variability that matches the expected change of the oxidation state of organics throughout the year. Despite the large inter-instrumental variability in the f44 reported by Crenn et al. (2015), the f44 was used to convert the organic mass measured by the ACSM into OC by applying the method proposed by Canagaratna et al. (2015), which was developed for the AMS. The good match between the OCACSM and OC (slope ranging from 0.99 in summer to 0.56 in winter with an overall value of 0.65) confirmed that the approach for this instrument and at this sampling place is also suitable for the ACSM. Nevertheless, the method might be difficult to apply for short time measurements (e.g., only a few weeks), where low and/or high extreme ratios may be misinterpreted, and results interpreted with cautions, such OA–OC comparison and OCACSM : OCoffline methods shall then preferably be used on long-term continuous measurements. Finally, it should also be noted that OC is the only regulated organic aerosol-related variable commonly monitored within current air quality networks (Directive 2008/50/CE, 2008; WMO/GAW, 2016), whereas equivalent methods for a better OA quantification at high time resolution are still to be standardized, reinforcing the need for many more systematic comparison exercises at various locations.
Not surprisingly, the comparison to the offline PM2.5 first highlights the importance of the size cutoff of the filter samples. This is true for all considered species (PM, nitrate, sulfate, ammonium, and organics). Although such conclusions might appear quite trivial, the ACSM as well as the AMS are often compared to PM2.5 filters. This is certainly the case, because PM2.5 is the monitoring standard of air quality in several countries like the USA, Canada, and China, instead of PM1. Therefore, for such a comparison, the limitations due to the different size cuttings must be considered. Moreover, possible cutoff shift due to ambient relative humidity effect on the offline measurements could represent a non-negligible impact and has to be considered during such an exercise, especially for marine stations.
The total PM1 mass balance between online (ACSM and MAAP) and offline PM1 matches throughout the entire time period (slope =1.02; R2= 0.90) as well as the different seasons when considering the size effect mentioned before. However, non-water-soluble species like dust, metals, and carbonate that were not analyzed in the filter samples in this study – and which are also not detected by the ACSM – influence the correlation especially in summer, leading to a lower correlation coefficient during this period (R2=0.40). Mass closure with the PNSD certainly represents the best way for in situ quality control as well as for tracking a possible drift in the ACSM performance. It can be performed by converting the ACSM–MAAP mass concentration into volume concentration or by converting the MPSS volume concentration into mass concentration both using time-dependent density and assuming spherical and fully internally mixed particles. The volume approach is the most robust since it enables a strictly independent method. Being more interpretable, the mass approach may be used instead for error quantification as long as it agrees with the volume approach. For the present dataset, the selected method did not substantially influence the comparison results. Compared to offline samples, not only do comparisons with the MPSS have a quite stable correlation over the years and the seasons, but also the mass closure between the ACSM and MPSS presents the main advantage of being done with a near-real-time approach, since no further laboratory analyses are needed. Consequently, near-real-time mass closure between the ACSM and MPSS should be considered in the near future as a standard way for in situ quality control of measurements. Moreover, this approach does not remain free of artifacts related to the instrumental upper size cutoff diameter. This should be considered for sampling places with an important coarse-mode fraction, in order to considered artifacts induced by both the remaining aerodynamic lens transmission efficiency of the ACSM and the contribution of multiple-charged particles from coarse mode on the PNSD spectra.
Finally, our results clearly emphasize the different limits of a comparison to collocated instruments and the effects of each individual instrumental upper size cutoff diameter. Consequently, there is a need for a better and systematic characterization of the transmission efficiency of the aerodynamic lenses of the ACSM on the upper size range. This knowledge will also certainly be useful to better understand the instrumental variability. Nevertheless, such near-real-time comparisons certainly represent the best way to ensure long-term quality assurances of the ACSM measurements, especially at a station where the ACSM is used for long-term monitoring of particle chemical composition. More systematic comparisons performed in a similar way as in the present work over a long time period in different environments as well as using different reference methods (e.g., TEOM-FDMS, beta gauge, or a PILS with PM1 inlet for example) are still needed to better characterize the robustness of the ACSM over a long sampling time.
All data are available upon request to the corresponding author or by visiting the EBAS user interface directly (http://ebas.nilu.no, last access: 10 September 2019).
The supplement related to this article is available online at: https://doi.org/10.5194/amt-13-4973-2020-supplement.
LP, TT, AG, and BS collected the data at Melpitz. LP performed measurements and data analysis on the ACSM. TT did the measurements and data validation of the MPSS data. GS contributed to the evaluation of the offline dataset. All authors were involved in the discussion of the results. LP wrote the paper with contributions from all coauthors. All coauthors commented on the paper.
The authors declare that they have no conflict of interest.
This project has received funding from the European Union's Horizon 2020 research and innovation programme within the infrastructure projects ACTRIS (Aerosols, Clouds, and Trace gases Research InfraStructure Network; EU FP7 grant agreement no. 262254) and ACTRIS-2 (Aerosols, Clouds, and Trace gases Research InfraStructure; grant agreement no. 654109). This work was also supported by the COST Action COLOSSAL CA16109. The physical measurements were also funded by the German Ultrafine Aerosol Network GUAN, which was jointly established with help of the German Federal Environment Ministry (BMU) grants F&E 370343200 (German title: “Erfassung der Zahl feiner und ultrafeiner Partikel in der Außenluft”), 2008–2010, and F&E 371143232 (German title: “Trendanalysen gesundheitsgefährdender Fein- und Ultrafeinstaubfraktionen unter Nutzung der im German Ultrafine Aerosol Network (GUAN) ermittelten Immissionsdaten durch Fortführung und Interpretation der Messreihen”), 2012–2014. We also acknowledge the WCCAP (World Calibration Center for Aerosol Physics) as part of the WMO–GAW program. The WCCAP is base-funded by the German Federal Environmental Agency (Umweltbundesamt), Germany. Support by the European Regional Development Funds (EFRE – Europe funds Saxony) is gratefully acknowledged. The authors also thanks René Rabe especially for technical support in the field and Anke Rödger, Anett Dietze, and Susanne Fuchs for numerous laboratory analyses.
This research has been supported by the H2020 research infrastructures (grant nos. ACTRIS (262254) and ACTRIS-2 (654109)), the European Cooperation in Science and Technology (grant no. COLOSSAL CA16109), the German Federal Environment Ministry (BMU) grants F&E 370343200 (German title: “Erfassung der Zahl feiner und ultrafeiner Partikel in der Außenluft”), 2008–2010, and F&E 371143232 (German title: “Trendanalysen gesundheitsgefährdender Fein- und Ultrafeinstaubfraktionen unter Nutzung der im German Ultrafine Aerosol Network (GUAN) ermittelten Immissionsdaten durch Fortführung und Interpretation der Messreihen”), 2012–2014.
This paper was edited by Mingjin Tang and reviewed by two anonymous referees.
Aas, W., Tsyro, S., Bieber, E., Bergström, R., Ceburnis, D., Ellermann, T., Fagerli, H., Frölich, M., Gehrig, R., Makkonen, U., Nemitz, E., Otjes, R., Perez, N., Perrino, C., Prévôt, A. S. H., Putaud, J.-P., Simpson, D., Spindler, G., Vana, M., and Yttri, K. E.: Lessons learnt from the first EMEP intensive measurement periods, Atmos. Chem. Phys., 12, 8073–8094, https://doi.org/10.5194/acp-12-8073-2012, 2012.
Aiken, A. C., DeCarlo, P. F., and Jimenez, J. L.: Elemental analysis of organic species with electron ionization high-resolution mass spectrometry, Anal. Chem., 79, 8350–8358, https://doi.org/10.1021/ac071150w, 2007.
Aiken, A. C., Decarlo, P. F., Kroll, J. H., Worsnop, D. R., Huffman, J. A., Docherty, K. S., Ulbrich, I. M., Mohr, C., Kimmel, J. R., Sueper, D., Sun, Y., Zhang, Q., Trimborn, A., Northway, M., Ziemann, P. J., Canagaratna, M. R., Onasch, T. B., Alfarra, M. R., Prevot, A. S. H., Dommen, J., Duplissy, J., Metzger, A., Baltensperger, U., and Jimenez, J. L.: O/C and OM/OC ratios of primary, secondary, and ambient organic aerosols with high-resolution time-of-flight aerosol mass spectrometry, Environ. Sci. Technol., 42, 4478–4485, https://doi.org/10.1021/es703009q, 2008.
Allan, J. D., Delia, A. E., Coe, H., Bower, K. N., Alfarra, R. M., Jimenez, J. L., Middlebrook, A. M., Drewnick, F., Onasch, T. B., Canagaratna, M. R., Jayne, J. T., and Worsnop, D. R.: A generalised method for the extraction of chemically resolved mass spectra from Aerodyne aerosol mass spectrometer data, J. Aerosol Sci., 35, 909–922, https://doi.org/10.1016/j.jaerosci.2004.02.007, 2004.
Allan, J. D., Alfarra, R. M., Bower, K. N., Williams, P. I., Gallagher, M. W., Jimenez, J. L., McDonald, A. G., Nemitz, E., Canagaratna, M. R., Jayne, J. T., Coe, H., and Worsnop, D. R.: Quantitative sampling using an Aerodyne aerosol mass spectrometer 2. Measurements of fine particulate chemical composition in two U.K. cities, J. Geophys. Res., 108, 4091, https://doi.org/10.1029/2002JD002358, 2003.
Birmili, W., Stratmann, F., and Wiedensohler, A.: Design of a DMA-based size spectrometer for a large particle size range and stable operation, J. Aerosol Sci., 30, 549–553, https://doi.org/10.1016/S0021-8502(98)00047-0, 1999.
Birmili, W., Schepanski, K., Ansmann, A., Spindler, G., Tegen, I., Wehner, B., Nowak, A., Reimer, E., Mattis, I., Müller, K., Brüggemann, E., Gnauk, T., Herrmann, H., Wiedensohler, A., Althausen, D., Schladitz, A., Tuch, T., and Löschau, G.: A case of extreme particulate matter concentrations over Central Europe caused by dust emitted over the southern Ukraine, Atmos. Chem. Phys., 8, 997–1016, https://doi.org/10.5194/acp-8-997-2008, 2008.
Birmili, W., Weinhold, K., Nordmann, S., Wiedensohler, A., Spindler, G., Müller, K., Herrmann, H., Gnauk, T., Pitz, M., Cyrys, J., Flentje, H., Nickel, C., Kuhlbusch, T. A. J., and Löschau, G.: Atmospheric aerosol measurements in the German Ultrafine Aerosol Network (GUAN): Part 1 – soot and particle number size distribution, Gefahrst. Reinh. Luft., 69, 137–145, 2009.
Birmili, W., Sun, J., Weinhold, K., Merkel, M., Rasch, F., Spindler, G., Wiedensohler, A., Bastian, S., Loschau, G., Schladitz, A., Quass, U., Kuhlbusch, T. A. J., Kaminski, H., Cyrys, J., Pitz, M., Gu, J., Peters, A., Flentje, H., Meinhardt, F., Schwerin, A., Bath, O., Ries, L., Gerwig, H., Wirtz, K., and Weber, S.: Atmospheric aerosol measurements in the German Ultrafine Aerosol Network (GUAN) Part 3: Black Carbon mass and particle number concentrations 2009 to 2014, Gefahrst. Reinh. Luft., 75, 479–488, 2015.
Birmili, W., Weinhold, K., Rasch, F., Sonntag, A., Sun, J., Merkel, M., Wiedensohler, A., Bastian, S., Schladitz, A., Löschau, G., Cyrys, J., Pitz, M., Gu, J., Kusch, T., Flentje, H., Quass, U., Kaminski, H., Kuhlbusch, T. A. J., Meinhardt, F., Schwerin, A., Bath, O., Ries, L., Gerwig, H., Wirtz, K., and Fiebig, M.: Long-term observations of tropospheric particle number size distributions and equivalent black carbon mass concentrations in the German Ultrafine Aerosol Network (GUAN), Earth Syst. Sci. Data, 8, 355–382, https://doi.org/10.5194/essd-8-355-2016, 2016.
Bougiatioti, A., Nikolaou, P., Stavroulas, I., Kouvarakis, G., Weber, R., Nenes, A., Kanakidou, M., and Mihalopoulos, N.: Particle water and pH in the eastern Mediterranean: source variability and implications for nutrient availability, Atmos. Chem. Phys., 16, 4579–4591, https://doi.org/10.5194/acp-16-4579-2016, 2016.
Budisulistiorini, S. H., Canagaratna, M. R., Croteau, P. L., Baumann, K., Edgerton, E. S., Kollman, M. S., Ng, N. L., Verma, V., Shaw, S. L., Knipping, E. M., Worsnop, D. R., Jayne, J. T., Weber, R. J., and Surratt, J. D.: Intercomparison of an Aerosol Chemical Speciation Monitor (ACSM) with ambient fine aerosol measurements in downtown Atlanta, Georgia, Atmos. Meas. Tech., 7, 1929–1941, https://doi.org/10.5194/amt-7-1929-2014, 2014.
Canagaratna, M. R., Jayne, J. T., Jimenez, J. L., Allan, J. D., Alfarra, M. R., Zhang, Q., Onasch, T. B., Drewnick, F., Coe, H., Middlebrook, A., Delia, A., Williams, L. R., Trimborn, A. M., Northway, M. J., Decarlo, P. F., Kolb, C. E., Davidovits, P., and Worsnop, D. R.: Chemical and microphysical characterization of ambient aerosols with the Aerodyne aerosol mass spectrometer, Mass Spectrom. Rev., 26, 185–222, https://doi.org/10.1002/mas.20115, 2007.
Canagaratna, M. R., Jimenez, J. L., Kroll, J. H., Chen, Q., Kessler, S. H., Massoli, P., Hildebrandt Ruiz, L., Fortner, E., Williams, L. R., Wilson, K. R., Surratt, J. D., Donahue, N. M., Jayne, J. T., and Worsnop, D. R.: Elemental ratio measurements of organic compounds using aerosol mass spectrometry: characterization, improved calibration, and implications, Atmos. Chem. Phys., 15, 253–272, https://doi.org/10.5194/acp-15-253-2015, 2015.
Cavalli, F., Viana, M., Yttri, K. E., Genberg, J., and Putaud, J.-P.: Toward a standardised thermal-optical protocol for measuring atmospheric organic and elemental carbon: the EUSAAR protocol, Atmos. Meas. Tech., 3, 79–89, https://doi.org/10.5194/amt-3-79-2010, 2010.
Chen, Y., Wild, O., Wang, Y., Ran, L., Teich, M., Gross, J., Wang, L. N., Spindler, G., Herrmann, H., van Pinxteren, D., McFiggans, G., and Wiedensohler, A.: The influence of impactor size cut-off shift caused by hygroscopic growth on particulate matter loading and composition measurements, Atmos. Environ., 195, 141–148, 2018.
Chiappini, L., Verlhac, S., Aujay, R., Maenhaut, W., Putaud, J. P., Sciare, J., Jaffrezo, J. L., Liousse, C., Galy-Lacaux, C., Alleman, L. Y., Panteliadis, P., Leoz, E., and Favez, O.: Clues for a standardised thermal-optical protocol for the assessment of organic and elemental carbon within ambient air particulate matter, Atmos. Meas. Tech., 7, 1649–1661, https://doi.org/10.5194/amt-7-1649-2014, 2014.
Crenn, V., Sciare, J., Croteau, P. L., Verlhac, S., Fröhlich, R., Belis, C. A., Aas, W., Äijälä, M., Alastuey, A., Artiñano, B., Baisnée, D., Bonnaire, N., Bressi, M., Canagaratna, M., Canonaco, F., Carbone, C., Cavalli, F., Coz, E., Cubison, M. J., Esser-Gietl, J. K., Green, D. C., Gros, V., Heikkinen, L., Herrmann, H., Lunder, C., Minguillón, M. C., Močnik, G., O'Dowd, C. D., Ovadnevaite, J., Petit, J.-E., Petralia, E., Poulain, L., Priestman, M., Riffault, V., Ripoll, A., Sarda-Estève, R., Slowik, J. G., Setyan, A., Wiedensohler, A., Baltensperger, U., Prévôt, A. S. H., Jayne, J. T., and Favez, O.: ACTRIS ACSM intercomparison – Part 1: Reproducibility of concentration and fragment results from 13 individual Quadrupole Aerosol Chemical Speciation Monitors (Q-ACSM) and consistency with co-located instruments, Atmos. Meas. Tech., 8, 5063–5087, https://doi.org/10.5194/amt-8-5063-2015, 2015.
DeCarlo, P. F., Kimmel, J. R., Trimborn, A., Northway, M. J., Jayne, J. T., Aiken, A. C., Gonin, M., Fuhrer, K., Horvath, T., Docherty, K. S., Worsnop, D. R., and Jimenez, J. L.: Field-deployable, high-resolution, time-of-flight aerosol mass spectrometer, Anal. Chem., 78, 8281–8289, https://doi.org/10.1021/ac061249n, 2006.
DeCarlo, P. F., Dunlea, E. J., Kimmel, J. R., Aiken, A. C., Sueper, D., Crounse, J., Wennberg, P. O., Emmons, L., Shinozuka, Y., Clarke, A., Zhou, J., Tomlinson, J., Collins, D. R., Knapp, D., Weinheimer, A. J., Montzka, D. D., Campos, T., and Jimenez, J. L.: Fast airborne aerosol size and chemistry measurements above Mexico City and Central Mexico during the MILAGRO campaign, Atmos. Chem. Phys., 8, 4027–4048, https://doi.org/10.5194/acp-8-4027-2008, 2008.
Directive 2008/50/CE: Ambient air quality and cleaner air for Europe, OJL 152, available at: http://data.europa.eu/eli/dir/2008/50/oj (last access: 1 September 2019), 11 June 2008.
Draxler, R. and Hess, G.: Description of the HYSPLIT4 modeling system, NOAA Technical Memorandum, ERL, ARL-224, available at: https://www.arl.noaa.gov/documents/reports/arl-224.pdf (last access: 10 September 2019), 2004.
Elsasser, M., Crippa, M., Orasche, J., DeCarlo, P. F., Oster, M., Pitz, M., Cyrys, J., Gustafson, T. L., Pettersson, J. B. C., Schnelle-Kreis, J., Prévôt, A. S. H., and Zimmermann, R.: Organic molecular markers and signature from wood combustion particles in winter ambient aerosols: aerosol mass spectrometer (AMS) and high time-resolved GC-MS measurements in Augsburg, Germany, Atmos. Chem. Phys., 12, 6113–6128, https://doi.org/10.5194/acp-12-6113-2012, 2012.
Farmer, D. K., Matsunaga, A., Docherty, K. S., Surratt, J. D., Seinfeld, J. H., Ziemann, P. J., and Jimenez, J. L.: Response of an aerosol mass spectrometer to organonitrates and organosulfates and implications for atmospheric chemistry, P. Natl. Acad. Sci. USA, 107, 6670–6675, https://doi.org/10.1073/pnas.0912340107, 2010.
Finlayson-Pitts, B. J. and Pitts, J. N. J.: Atmospheric chemistry : fundamentals and experimenta techniques, John Wiley & Sons, New York, USA, 1986.
Freney, E., Zhang, Y., Croteau, P., Amodeo, T., Williams, L., Truong, F., Petit, J.-E., Sciare, J., Sarda-Esteve, R., Bonnaire, N., Arumae, T., Aurela, M., Bougiatioti, A., Mihalopoulos, N., Coz, E., Artinano, B., Crenn, V., Elste, T., Heikkinen, L., Poulain, L., Wiedensohler, A., Herrmann, H., Priestman, M., Alastuey, A., Stavroulas, I., Tobler, A., Vasilescu, J., Zanca, N., Canagaratna, M., Carbone, C., Flentje, H., Green, D., Maasikmets, M., Marmureanu, L., Minguillon, M. C., Prevot, A. S. H., Gros, V., Jayne, J., and Favez, O.: The second ACTRIS inter-comparison (2016) for Aerosol Chemical Speciation Monitors (ACSM): Calibration protocols and instrument performance evaluations, Aerosol Sci. Tech., 53, 830–842, https://doi.org/10.1080/02786826.2019.1608901, 2019.
Fröhlich, R., Crenn, V., Setyan, A., Belis, C. A., Canonaco, F., Favez, O., Riffault, V., Slowik, J. G., Aas, W., Aijälä, M., Alastuey, A., Artiñano, B., Bonnaire, N., Bozzetti, C., Bressi, M., Carbone, C., Coz, E., Croteau, P. L., Cubison, M. J., Esser-Gietl, J. K., Green, D. C., Gros, V., Heikkinen, L., Herrmann, H., Jayne, J. T., Lunder, C. R., Minguillón, M. C., Močnik, G., O'Dowd, C. D., Ovadnevaite, J., Petralia, E., Poulain, L., Priestman, M., Ripoll, A., Sarda-Estève, R., Wiedensohler, A., Baltensperger, U., Sciare, J., and Prévôt, A. S. H.: ACTRIS ACSM intercomparison – Part 2: Intercomparison of ME-2 organic source apportionment results from 15 individual, co-located aerosol mass spectrometers, Atmos. Meas. Tech., 8, 2555–2576, https://doi.org/10.5194/amt-8-2555-2015, 2015a.
Fröhlich, R., Cubison, M. J., Slowik, J. G., Bukowiecki, N., Canonaco, F., Croteau, P. L., Gysel, M., Henne, S., Herrmann, E., Jayne, J. T., Steinbacher, M., Worsnop, D. R., Baltensperger, U., and Prévôt, A. S. H.: Fourteen months of on-line measurements of the non-refractory submicron aerosol at the Jungfraujoch (3580 m a.s.l.) – chemical composition, origins and organic aerosol sources, Atmos. Chem. Phys., 15, 11373–11398, https://doi.org/10.5194/acp-15-11373-2015, 2015b.
Fry, J. L., Brown, S. S., Middlebrook, A. M., Edwards, P. M., Campuzano-Jost, P., Day, D. A., Jimenez, J. L., Allen, H. M., Ryerson, T. B., Pollack, I., Graus, M., Warneke, C., de Gouw, J. A., Brock, C. A., Gilman, J., Lerner, B. M., Dubé, W. P., Liao, J., and Welti, A.: Secondary organic aerosol (SOA) yields from NO3 radical + isoprene based on nighttime aircraft power plant plume transects, Atmos. Chem. Phys., 18, 11663–11682, https://doi.org/10.5194/acp-18-11663-2018, 2018.
Guerrero, F., Alvarez-Ospina, H., Retama, A., Lopez-Medina, A., Castro, T., and Salcedo, D.: Seasonal changes in the PM1 chemical composition north of Mexico City, Atmosfera, 30, 243–258, https://doi.org/10.20937/Atm.2017.30.03.05, 2017.
Guo, H., Xu, L., Bougiatioti, A., Cerully, K. M., Capps, S. L., Hite Jr., J. R., Carlton, A. G., Lee, S.-H., Bergin, M. H., Ng, N. L., Nenes, A., and Weber, R. J.: Fine-particle water and pH in the southeastern United States, Atmos. Chem. Phys., 15, 5211–5228, https://doi.org/10.5194/acp-15-5211-2015, 2015.
Gurjar, B. R., Jain, A., Sharma, A., Agarwal, A., Gupta, A., Nagpure, A. S., and Lelieveld, J.: Human health risks in megacities due to air pollution, Atmos. Environ., 44, 4606–4613, https://doi.org/10.1016/j.atmosenv.2010.08.011, 2010.
Huang, S., Wu, Z., Poulain, L., van Pinxteren, M., Merkel, M., Assmann, D., Herrmann, H., and Wiedensohler, A.: Source apportionment of the organic aerosol over the Atlantic Ocean from 53° N to 53° S: significant contributions from marine emissions and long-range transport, Atmos. Chem. Phys., 18, 18043–18062, https://doi.org/10.5194/acp-18-18043-2018, 2018.
Huang, X.-F., He, L.-Y., Hu, M., Canagaratna, M. R., Sun, Y., Zhang, Q., Zhu, T., Xue, L., Zeng, L.-W., Liu, X.-G., Zhang, Y.-H., Jayne, J. T., Ng, N. L., and Worsnop, D. R.: Highly time-resolved chemical characterization of atmospheric submicron particles during 2008 Beijing Olympic Games using an Aerodyne High-Resolution Aerosol Mass Spectrometer, Atmos. Chem. Phys., 10, 8933–8945, https://doi.org/10.5194/acp-10-8933-2010, 2010.
Jayne, J. T., Leard, D. C., Zhang, X., Davidovits, P., Smith, K. A., Kolb, C. E., and Worsnop, D. R.: Development of an Aerosol Mass Spectrometer for size and composition analysis of submicron particles, Aerosol Sci. Tech., 33, 49–70, 2000.
Keck, L. and Wittmaack, K.: Effect of filter type and temperature on volatilisation losses from ammonium salts in aerosol matter, Atmos. Environ., 39, 4093–4100, https://doi.org/10.1016/j.atmosenv.2005.03.029, 2005.
Kiendler-Scharr, A., Mensah, A. A., Friese, E., Topping, D., Nemitz, E., Prevot, A. S. H., Aijala, M., Allan, J., Canonaco, F., Canagaratna, M., Carbone, S., Crippa, M., Dall Osto, M., Day, D. A., De Carlo, P., Di Marco, C. F., Elbern, H., Eriksson, A., Freney, E., Hao, L., Herrmann, H., Hildebrandt, L., Hillamo, R., Jimenez, J. L., Laaksonen, A., McFiggans, G., Mohr, C., O'Dowd, C., Otjes, R., Ovadnevaite, J., Pandis, S. N., Poulain, L., Schlag, P., Sellegri, K., Swietlicki, E., Tiitta, P., Vermeulen, A., Wahner, A., Worsnop, D., and Wu, H. C.: Ubiquity of organic nitrates from nighttime chemistry in the European submicron aerosol, Geophys. Res. Lett., 43, 7735–7744, 2016.
Lelieveld, J., Evans, J. S., Fnais, M., Giannadaki, D., and Pozzer, A.: The contribution of outdoor air pollution sources to premature mortality on a global scale, Nature, 525, 367–371, 2015.
Lide, D. R.: CRC Handbook of Chemistry and Physics, CRC Press Inc., Boca Raton, FL, USA, 1991.
Liu, P. S. K., Deng, R., Smith, K. A., Williams, L. R., Jayne, J. T., Canagaratna, M. R., Moore, K., Onasch, T. B., Worsnop, D. R., and Deshler, T.: Transmission efficiency of an aerodynamic focussing lens system: Comparison of model calculations and laboratory measurements for the aerodyne aerosol mass spectrometer, Aerosol Sci. Tech., 41, 721–733, https://doi.org/10.1080/02786820701422278, 2007.
Middlebrook, A. M., Bahreini, R., Jimenez, J. L., and Canagaratna, M. R.: Evaluation of Composition-Dependent Collection Efficiencies for the Aerodyne Aerosol Mass Spectrometer using Field Data, Aerosol Sci. Tech., 46, 258–271, https://doi.org/10.1080/02786826.2011.620041, 2012.
Minguillón, M. C., Ripoll, A., Pérez, N., Prévôt, A. S. H., Canonaco, F., Querol, X., and Alastuey, A.: Chemical characterization of submicron regional background aerosols in the western Mediterranean using an Aerosol Chemical Speciation Monitor, Atmos. Chem. Phys., 15, 6379–6391, https://doi.org/10.5194/acp-15-6379-2015, 2015.
Müller, T., Henzing, J. S., de Leeuw, G., Wiedensohler, A., Alastuey, A., Angelov, H., Bizjak, M., Collaud Coen, M., Engström, J. E., Gruening, C., Hillamo, R., Hoffer, A., Imre, K., Ivanow, P., Jennings, G., Sun, J. Y., Kalivitis, N., Karlsson, H., Komppula, M., Laj, P., Li, S.-M., Lunder, C., Marinoni, A., Martins dos Santos, S., Moerman, M., Nowak, A., Ogren, J. A., Petzold, A., Pichon, J. M., Rodriquez, S., Sharma, S., Sheridan, P. J., Teinilä, K., Tuch, T., Viana, M., Virkkula, A., Weingartner, E., Wilhelm, R., and Wang, Y. Q.: Characterization and intercomparison of aerosol absorption photometers: result of two intercomparison workshops, Atmos. Meas. Tech., 4, 245–268, https://doi.org/10.5194/amt-4-245-2011, 2011.
Ng, N. L., Herndon, S. C., Trimborn, A., Canagaratna, M. R., Croteau, P. L., Onasch, T. B., Sueper, D., Worsnop, D. R., Zhang, Q., Sun, Y. L., and Jayne, J. T.: An Aerosol Chemical Speciation Monitor (ACSM) for Routine Monitoring of the Composition and Mass Concentrations of Ambient Aerosol, Aerosol Sci. Tech., 45, 780–794, https://doi.org/10.1080/02786826.2011.560211, 2011.
Ortega, A. M., Hayes, P. L., Peng, Z., Palm, B. B., Hu, W., Day, D. A., Li, R., Cubison, M. J., Brune, W. H., Graus, M., Warneke, C., Gilman, J. B., Kuster, W. C., de Gouw, J., Gutiérrez-Montes, C., and Jimenez, J. L.: Real-time measurements of secondary organic aerosol formation and aging from ambient air in an oxidation flow reactor in the Los Angeles area, Atmos. Chem. Phys., 16, 7411–7433, https://doi.org/10.5194/acp-16-7411-2016, 2016.
Ostro, B., Feng, W. Y., Broadwin, R., Green, S., and Lipsett, M.: The effects of components of fine particulate air pollution on mortality in California: Results from CALFINE, Environ. Health Perspect., 115, 13–19, https://doi.org/10.1289/Ehp.9281, 2007.
Ovadnevaite, J., Ceburnis, D., Leinert, S., Dall'Osto, M., Canagaratna, M., O'Doherty, S., Berresheim, H., and O'Dowd, C.: Submicron NE Atlantic marine aerosol chemical composition and abundance: Seasonal trends and air mass categorization, J. Geophys. Res.-Atmos., 119, 11850–11863, https://doi.org/10.1002/2013jd021330, 2014.
Park, K., Kittelson, D. B., Zachariah, M. R., and McMurry, P. H.: Measurement of inherent material density of nanoparticle agglomerates, J. Nanopart. Res., 6, 267–272, https://doi.org/10.1023/B:NANO.0000034657.71309.e6, 2004.
Parworth, C., Fast, J., Mei, F., Shippert, T., Sivaraman, C., Tilp, A., Watson, T., and Zhang, Q.: Long-term measurements of submicrometer aerosol chemistry at the Southern Great Plains (SGP) using an Aerosol Chemical Speciation Monitor (ACSM), Atmos. Environ., 106, 43–55, https://doi.org/10.1016/j.atmosenv.2015.01.060, 2015.
Petit, J.-E., Favez, O., Sciare, J., Crenn, V., Sarda-Estève, R., Bonnaire, N., Močnik, G., Dupont, J.-C., Haeffelin, M., and Leoz-Garziandia, E.: Two years of near real-time chemical composition of submicron aerosols in the region of Paris using an Aerosol Chemical Speciation Monitor (ACSM) and a multi-wavelength Aethalometer, Atmos. Chem. Phys., 15, 2985–3005, https://doi.org/10.5194/acp-15-2985-2015, 2015.
Petit, J. E., Favez, O., Albinet, A., and Canonaco, F.: A user-friendly tool for comprehensive evaluation of the geographical origins of atmospheric pollution: Wind and trajectory analyses, Environ. Modell. Softw., 88, 183–187, https://doi.org/10.1016/j.envsoft.2016.11.022, 2017.
Petzold, A. and Schönlinner, M.: Multi-angle absorption photometry - a new method for the measurement of aerosol light absorption and atmospheric black carbon, J. Aerosol Sci., 35, 421–441, https://doi.org/10.1016/j.jaerosci.2003.09.005, 2004.
Pfeifer, S., Müller, T., Weinhold, K., Zikova, N., Martins dos Santos, S., Marinoni, A., Bischof, O. F., Kykal, C., Ries, L., Meinhardt, F., Aalto, P., Mihalopoulos, N., and Wiedensohler, A.: Intercomparison of 15 aerodynamic particle size spectrometers (APS 3321): uncertainties in particle sizing and number size distribution, Atmos. Meas. Tech., 9, 1545–1551, https://doi.org/10.5194/amt-9-1545-2016, 2016.
Pieber, S. M., El Haddad, I., Slowik, J. G., Canagaratna, M. R., Jayne, J. T., Platt, S. M., Bozzetti, C., Daellenbach, K. R., Frohlich, R., Vlachou, A., Klein, F., Dommen, J., Miljevic, B., Jimenez, J. L., Worsnop, D. R., Baltensperger, U., and Prevot, A. S. H.: Inorganic Salt Interference on in Aerodyne AMS and ACSM Organic Aerosol Composition Studies, Environ. Sci. Technol., 50, 10494–10503, https://doi.org/10.1021/acs.est.6b01035, 2016.
Pio, C. A. and Lopes, D. A.: Chlorine loss from marine aerosol in a coastal atmosphere, J. Geophys. Res.-Atmos., 103, 25263–25272, https://doi.org/10.1029/98jd02088, 1998.
Poulain, L., Iinuma, Y., Müller, K., Birmili, W., Weinhold, K., Brüggemann, E., Gnauk, T., Hausmann, A., Löschau, G., Wiedensohler, A., and Herrmann, H.: Diurnal variations of ambient particulate wood burning emissions and their contribution to the concentration of Polycyclic Aromatic Hydrocarbons (PAHs) in Seiffen, Germany, Atmos. Chem. Phys., 11, 12697–12713, https://doi.org/10.5194/acp-11-12697-2011, 2011a.
Poulain, L., Spindler, G., Birmili, W., Plass-Dülmer, C., Wiedensohler, A., and Herrmann, H.: Seasonal and diurnal variations of particulate nitrate and organic matter at the IfT research station Melpitz, Atmos. Chem. Phys., 11, 12579–12599, https://doi.org/10.5194/acp-11-12579-2011, 2011b.
Poulain, L., Birmili, W., Canonaco, F., Crippa, M., Wu, Z. J., Nordmann, S., Spindler, G., Prévôt, A. S. H., Wiedensohler, A., and Herrmann, H.: Chemical mass balance of 300 °C non-volatile particles at the tropospheric research site Melpitz, Germany, Atmos. Chem. Phys., 14, 10145–10162, https://doi.org/10.5194/acp-14-10145-2014, 2014.
Ripoll, A., Minguillón, M. C., Pey, J., Jimenez, J. L., Day, D. A., Sosedova, Y., Canonaco, F., Prévôt, A. S. H., Querol, X., and Alastuey, A.: Long-term real-time chemical characterization of submicron aerosols at Montsec (southern Pyrenees, 1570 m a.s.l.), Atmos. Chem. Phys., 15, 2935–2951, https://doi.org/10.5194/acp-15-2935-2015, 2015.
Salcedo, D., Onasch, T. B., Dzepina, K., Canagaratna, M. R., Zhang, Q., Huffman, J. A., DeCarlo, P. F., Jayne, J. T., Mortimer, P., Worsnop, D. R., Kolb, C. E., Johnson, K. S., Zuberi, B., Marr, L. C., Volkamer, R., Molina, L. T., Molina, M. J., Cardenas, B., Bernabé, R. M., Márquez, C., Gaffney, J. S., Marley, N. A., Laskin, A., Shutthanandan, V., Xie, Y., Brune, W., Lesher, R., Shirley, T., and Jimenez, J. L.: Characterization of ambient aerosols in Mexico City during the MCMA-2003 campaign with Aerosol Mass Spectrometry: results from the CENICA Supersite, Atmos. Chem. Phys., 6, 925–946, https://doi.org/10.5194/acp-6-925-2006, 2006.
Schaap, M., Spindler, G., Schulz, M., Acker, K., Maenhaut, W., Berner, A., Wieprecht, W., Streit, N., Muller, K., Bruggemann, E., Chi, X., Putaud, J. P., Hitzenberger, R., Puxbaum, H., Baltensperger, U., and ten Brink, H.: Artefacts in the sampling of nitrate studied in the “INTERCOMP” campaigns of EUROTRAC-AEROSOL, Atmos. Environ., 38, 6487–6496, https://doi.org/10.1016/j.atmosenv.2004.08.026, 2004.
Schlag, P., Kiendler-Scharr, A., Blom, M. J., Canonaco, F., Henzing, J. S., Moerman, M., Prévôt, A. S. H., and Holzinger, R.: Aerosol source apportionment from 1-year measurements at the CESAR tower in Cabauw, the Netherlands, Atmos. Chem. Phys., 16, 8831–8847, https://doi.org/10.5194/acp-16-8831-2016, 2016.
Setyan, A., Zhang, Q., Merkel, M., Knighton, W. B., Sun, Y., Song, C., Shilling, J. E., Onasch, T. B., Herndon, S. C., Worsnop, D. R., Fast, J. D., Zaveri, R. A., Berg, L. K., Wiedensohler, A., Flowers, B. A., Dubey, M. K., and Subramanian, R.: Characterization of submicron particles influenced by mixed biogenic and anthropogenic emissions using high-resolution aerosol mass spectrometry: results from CARES, Atmos. Chem. Phys., 12, 8131–8156, https://doi.org/10.5194/acp-12-8131-2012, 2012.
Spindler, G., Gnauk, T., Grüner, A., Iinuma, Y., Müller, K., Scheinhardt, S., and Herrmann, H.: Size-segregated characterization of PM10 at the EMEP site Melpitz (Germany) using a five-stage impactor: a six year study, J. Atmos. Chem., 69, 127–157, https://doi.org/10.1007/s10874-012-9233-6, 2012.
Spindler, G., Grüner, A., Müller, K., Schlimper, S., and Herrmann, H.: Long-term size-segregated particle (PM10, PM2.5, PM1) characterization study at Melpitz - influence of air mass inflow, weather conditions and season, J. Atmos. Chem., 70, 165–195, https://doi.org/10.1007/s10874-013-9263-8, 2013.
Stieger, B., Spindler, G., Fahlbusch, B., Müller, K., Grüner, A., Poulain, L., Thöni, L., Seitler, E., Wallasch, M., and Herrmann, H.: Measurements of PM10 ions and trace gases with the online system MARGA at the research station Melpitz in Germany – A five-year study, J. Atmos. Chem., 75, 33–70, https://doi.org/10.1007/s10874-017-9361-0, 2017.
Sun, J. Y., Zhang, Q., Canagaratna, M. R., Zhang, Y. M., Ng, N. L., Sun, Y. L., Jayne, J. T., Zhang, X. C., Zhang, X. Y., and Worsnop, D. R.: Highly time- and size-resolved characterization of submicron aerosol particles in Beijing using an Aerodyne Aerosol Mass Spectrometer, Atmos. Environ., 44, 131–140, https://doi.org/10.1016/j.atmosenv.2009.03.020, 2010.
Sun, Y. L., Zhang, Q., Schwab, J. J., Yang, T., Ng, N. L., and Demerjian, K. L.: Factor analysis of combined organic and inorganic aerosol mass spectra from high resolution aerosol mass spectrometer measurements, Atmos. Chem. Phys., 12, 8537–8551, https://doi.org/10.5194/acp-12-8537-2012, 2012.
Sun, Y. L., Wang, Z. F., Du, W., Zhang, Q., Wang, Q. Q., Fu, P. Q., Pan, X. L., Li, J., Jayne, J., and Worsnop, D. R.: Long-term real-time measurements of aerosol particle composition in Beijing, China: seasonal variations, meteorological effects, and source analysis, Atmos. Chem. Phys., 15, 10149–10165, https://doi.org/10.5194/acp-15-10149-2015, 2015.
Takegawa, N., Miyakawa, T., Watanabe, M., Kondo, Y., Miyazaki, Y., Han, S., Zhao, Y., van Pinxteren, D., Bruggemann, E., Gnauk, T., Herrmann, H., Xiao, R., Deng, Z., Hu, M., Zhu, T., and Zhang, Y.: Performance of an Aerodyne Aerosol Mass Spectrometer (AMS) during Intensive Campaigns in China in the Summer of 2006, Aerosol Sci. Tech., 43, 189–204, https://doi.org/10.1080/02786820802582251, 2009.
Tuch, T. M., Haudek, A., Müller, T., Nowak, A., Wex, H., and Wiedensohler, A.: Design and performance of an automatic regenerating adsorption aerosol dryer for continuous operation at monitoring sites, Atmos. Meas. Tech., 2, 417–422, https://doi.org/10.5194/amt-2-417-2009, 2009.
Turpin, B. J. and Lim, H.-J.: Species contributions to PM2.5 mass concentrations: revisiting common assumptions for estimating organic mass, Aerosol Sci. Tech., 35, 302–610, https://doi.org/10.1080/02786820119445, 2001.
Wang, Q. Q., Sun, Y. L., Jiang, Q., Du, W., Sun, C. Z., Fu, P. Q., and Wang, Z. F.: Chemical composition of aerosol particles and light extinction apportionment before and during the heating season in Beijing, China, J. Geophys. Res.-Atmos., 120, 12708–12722, https://doi.org/10.1002/2015jd023871, 2015.
Wehner, B., Philippin, S., and Wiedensohler, A.: Design and calibration of a thermodenuder with an improved heating unit to measure the size-dependent volatile fraction of aerosol particles, J. Aerosol Sci., 33, 1087–1093, 2002.
Wiedensohler, A., Birmili, W., Nowak, A., Sonntag, A., Weinhold, K., Merkel, M., Wehner, B., Tuch, T., Pfeifer, S., Fiebig, M., Fjäraa, A. M., Asmi, E., Sellegri, K., Depuy, R., Venzac, H., Villani, P., Laj, P., Aalto, P., Ogren, J. A., Swietlicki, E., Williams, P., Roldin, P., Quincey, P., Hüglin, C., Fierz-Schmidhauser, R., Gysel, M., Weingartner, E., Riccobono, F., Santos, S., Grüning, C., Faloon, K., Beddows, D., Harrison, R., Monahan, C., Jennings, S. G., O'Dowd, C. D., Marinoni, A., Horn, H.-G., Keck, L., Jiang, J., Scheckman, J., McMurry, P. H., Deng, Z., Zhao, C. S., Moerman, M., Henzing, B., de Leeuw, G., Löschau, G., and Bastian, S.: Mobility particle size spectrometers: harmonization of technical standards and data structure to facilitate high quality long-term observations of atmospheric particle number size distributions, Atmos. Meas. Tech., 5, 657–685, https://doi.org/10.5194/amt-5-657-2012, 2012.
Wiedensohler, A., Wiesner, A., Weinhold, K., Birmili, W., Hermann, M., Merkel, M., Muller, T., Pfeifer, S., Schmidt, A., Tuch, T., Velarde, F., Quincey, P., Seeger, S., and Nowak, A.: Mobility particle size spectrometers: Calibration procedures and measurement uncertainties, Aerosol Sci. Tech., 52, 146–164, https://doi.org/10.1080/02786826.2017.1387229, 2018.
WMO/GAW: Aerosol Measurement Procedures, Guidelines and Recommendation, 2nd edn., Geneva, Switzerland, 2016.
Xu, L., Guo, H. Y., Boyd, C. M., Klein, M., Bougiatioti, A., Cerully, K. M., Hite, J. R., Isaacman-VanWertz, G., Kreisberg, N. M., Knote, C., Olson, K., Koss, A., Goldstein, A. H., Hering, S. V., de Gouw, J., Baumann, K., Lee, S. H., Nenes, A., Weber, R. J., and Ng, N. L.: Effects of anthropogenic emissions on aerosol formation from isoprene and monoterpenes in the southeastern United States, P. Natl. Acad. Sci. USA, 112, 37–42, https://doi.org/10.1073/pnas.1417609112, 2015.
Xu, W., Croteau, P., Williams, L., Canagaratna, M., Onasch, T., Cross, E., Zhang, X., Robinson, W., Worsnop, D., and Jayne, J.: Laboratory characterization of an aerosol chemical speciation monitor with PM2.5 measurement capability, Aerosol Sci. Tech., 51, 69–83, https://doi.org/10.1080/02786826.2016.1241859, 2017.
Xu, W., Lambe, A., Silva, P., Hu, W. W., Onasch, T., Williams, L., Croteau, P., Zhang, X., Renbaum-Wolff, L., Fortner, E., Jimenez, J. L., Jayne, J., Worsnop, D., and Canagaratna, M.: Laboratory evaluation of species-dependent relative ionization efficiencies in the Aerodyne Aerosol Mass Spectrometer, Aerosol Sci. Tech., 52, 626–641, https://doi.org/10.1080/02786826.2018.1439570, 2018.
Zanatta, M., Gysel, M., Bukowiecki, N., Muller, T., Weingartner, E., Areskoug, H., Fiebig, M., Yttri, K. E., Mihalopoulos, N., Kouvarakis, G., Beddows, D., Harrison, R. M., Cavalli, F., Putaud, J. P., Spindler, G., Wiedensohler, A., Alastuey, A., Pandolfi, M., Sellegri, K., Swietlicki, E., Jaffrezo, J. L., Baltensperger, U., and Laj, P.: A European aerosol phenomenology-5: Climatology of black carbon optical properties at 9 regional background sites across Europe, Atmos. Environ., 145, 346–364, 2016.