the Creative Commons Attribution 4.0 License.
the Creative Commons Attribution 4.0 License.
 | 29 Sep 2020
In situ cloud ground-based measurements in the Finnish sub-Arctic: intercomparison of three cloud spectrometer setups
Konstantinos-Matthaios Doulgeris
Mika Komppula
Sami Romakkaniemi
Antti-Pekka Hyvärinen
Veli-Matti Kerminen
David Brus
Continuous, semi-long-term, ground-based in situ cloud measurements were conducted during the Pallas Cloud Experiment (PaCE) in 2013. The measurements were carried out in Finnish sub-Arctic region at Sammaltunturi station (67∘58′ N, 24∘07′ E; 560 m a.s.l.), part of Pallas Atmosphere – Ecosystem Supersite and Global Atmosphere Watch (GAW) program. The main motivation of the campaign was to conduct in situ cloud measurements with three different cloud spectrometer probes and perform an evaluation of their ground-based setups. Therefore, we mutually compared the performance of the cloud and aerosol spectrometer (CAS), the cloud droplet probe (CDP) and the forward-scattering spectrometer probe (FSSP-100) (DMT; Boulder, CO, USA). We investigated how different meteorological parameters affect each instrument's ground-based setup operation and quantified possible biases and discrepancies of different microphysical cloud properties. Based on the obtained results we suggested limitations for further use of the instrument setups in campaigns where the focus is on investigating aerosol–cloud interactions. Measurements in this study were made by instruments owned by the Finnish Meteorological Institute and results concern their operation in sub-Arctic conditions with frequently occurring supercooled clouds.
The measured parameter from each instrument was the size distribution, and additionally we derived the number concentration, the effective diameter, the median volume diameter and the liquid water content. A complete intercomparison between the CAS probe and the FSSP-100 ground setups and additionally between the FSSP-100 and the CDP probe ground setups was made and presented. Unfortunately, there was not a sufficient amount of common data to compare all three probes together due to operational problems of the CDP ground setup in sub-zero conditions. The CAS probe that was fixed to one direction lost a significant number of cloud droplets when the wind direction was out of wind iso-axial conditions in comparison with the FSSP-100 and the CDP, which were both placed on a rotating platform. We revealed that CAS and FSSP-100 had good agreement in deriving sizing parameters (effective diameter and median volume diameter from 5 to 35 µm) even though CAS was losing a significant amount of cloud droplets. The most sensitive derived parameter was liquid water content, which was strongly connected to the wind direction and temperature.
- Article
(6022 KB) - Full-text XML
-
Supplement
(2150 KB) - BibTeX
- EndNote


Clouds and their interaction with aerosol particles provide some of the greatest uncertainties in predictions of climate change (Boucher et al., 2013). Therefore, in situ measurements of clouds play a key factor for further investigation of the aerosol–cloud interaction area. Many of the climatically important cloud properties (e.g., albedo, precipitation rate and lifetime) depend, among other factors, on the number concentration of aerosol particles and on their chemical composition (Komppula et al., 2005; Lihavainen et al., 2008). Measuring the cloud size distribution is an important parameter for the identification and description of clouds, their microphysical properties (Pruppacher and Klett, 1977; Rosenfeld and Ulbrich, 2003) and their lifetime (Albrecht 1989; Small et al., 2009).
One major category of instruments that it is commonly used for in situ cloud measurements is known as cloud spectrometers (e.g., Knollenberg, 1976; Dye and Baumgardner, 1984; Wendish et al., 1996; Baumgardner et al., 2001, 2014; Lance et al., 2010). Cloud spectrometers are single particle counters that use forward scattering, usually with the angles between 4 and 12∘ of a laser beam, to detect and classify individual particles in different size bins. The main theory used for the particle sizing based on the scattering of light from single particles is the Lorenz–Mie theory (Mie, 1908). Several experiments were conducted with these instruments; they mainly cover laboratory (e.g., Wagner et al., 2006; Smith et al., 2015; Nichmann et al., 2017), ground-based (e.g., Mertes et al., 2001; Henning et al., 2002; Eugster et al., 2006; Lihavainen et al., 2008; Guyot et al., 2015; Lloyd et al., 2015; Lowenthal et al. 2019) and airborne measurements (e.g., Knollenberg et al., 1981; Heymsfeld et al., 2004; McFarquhar et al., 2007; Bromwich et al., 2012; Johnson et al., 2012; Jones et al., 2012; Brenguier et al., 2013; Beswick et al., 2014; Luebke et al., 2016; Korolev et al., 2014; Petäjä et al., 2016; Wendish et al., 2016; Voigt et al., 2017; Faber et al., 2018).
In addition to the abovementioned experiments, many studies were done to quantify biases, uncertainties and limitations of cloud spectrometers while they were used in measurement campaigns. Uncertainties were usually a result of different meteorological conditions. Baumgardner (1983) presented a comparison of five water droplet instruments, included the axially scattering spectrometer (ASSP) and the forward-scattering spectrometer probe (FSSP). He concluded that scattering probes had an accuracy of 17 % in number concentration and size measurements. A full description and evaluation of the FSSP was made by Baumgardner et al. (1985) investigating coincidence and dead-time losses and by Baumgardner et al. (1990) investigating time response and laser inhomogeneity limitations. Baumgardner et al. (1989) made a calibration of the FSSP during the airborne Antarctic zone experiment and set further limitations to be applied during the data analysis of this project. A similar study from Baumgardner et al. (1992) was conducted for the FSSP during the airborne Arctic stratospheric expedition where an improved forward-scattering spectrometer probe, the FSSP-300, was developed and introduced. Wendisch (1998) presented a quantitative comparison of ground-based FSSP with a particle volume monitor. He stated that FSSP can be regarded as an excellent microphysical sensor in continental, stratiform or cumuliform clouds with mostly small drops; however he noticed some discrepancies in the liquid water content, especially when cloud droplets larger than 25 µm were considered. Gerber et al. (1999) performed and evaluated ground-based measurements of liquid water content using also an FSSP and a particle volume monitor (PVM). They observed large discrepancies too and stated that the FSSP overestimated liquid water content for large cloud droplets due to the inertial concentration effect. Burnet and Brenguier (1999) validated the droplet spectra and the liquid water content using five instruments including the FSSP, the fast FSSP and the cloud droplet probe (CDP). Burnet and Brenguier (2002) only investigated the FSSP further in detail to address the instrumental uncertainties and their limitations. Coelho et al. (2005a, b) made a detailed discussion for FSSP-100 in low and high droplet concentration measurements with a proposed correction for coincidence effects. Lance et al. (2010) calibrated the CDP and presented a full description of the instrument performance in laboratory and in-flight conditions. Baumgardner et al. (2011) summarized airborne systems for in situ measurements of aerosol particles, clouds and radiation that were currently in use on research aircraft around the world including cloud spectrometer probes. Febvre et al. (2012) highlighted the possible effects of ice crystals in FSSP measurements. Spiegel et al. (2012) made a thoroughly analysis of wind velocity and wind angle impacts at the Junfraujoch comparing the fog droplet spectrometer (FM-100) to others instruments. FM-100 showed several artifacts at temperatures below zero. One more evaluation regarding cloud ground-based measurements which took the wind direction into consideration was made by Guyot et al. (2015) at the Puy-de-Dôme observatory between seven optical sensors including an FSSP, a fast FSSP, a fog monitor and two CDP probes. They placed one FSSP and the fog monitor on the roof of the observatory and the two CDP probes and one FSSP inside a wind tunnel. The authors showed that there was good agreement in the sizing abilities of the instruments but observed possible discrepancies in number concentration values, a fact that also affected the liquid water content values. Lloyd et al. (2015) observed cloud microphysical structures by conducting cloud, aerosol and precipitation spectrometer (CAPS), FSSP, CDP-100, and PVM measurements. They mounted all the instruments on a rotator and wing on the terrace rooftop outside the Sphinx Laboratory, (Jungfraujoch, Switzerland). Several developments of the in situ measurement systems were reviewed and summarized by Baumgardner et al. (2017) with respect to their strengths, weaknesses, limitations and uncertainties. The progress in performing in situ cloud measurements was clearly observed along with other developments. Lowenthal et al. (2019) conducted wintertime mixed-phase orographic cloud measurements at the Storm Peak Laboratory (Colorado, USA). They deployed an FSSP-100 on a rotating wind vane (to orient it into the wind).
In this work, we focused on the intercomparison of three cloud spectrometer probe ground setups as they were used during the Pallas Cloud Experiment (PaCE) 2013. Due to the increased demand for long-term continuous ground-based in situ cloud measurements, we tested and evaluated the operation of three ground setups owned by the Finnish Meteorological Institute (FMI) to perform continuous ground-based measurements in harsh environments. The FMI research station (Sammaltunturi) located in northern Finland is regarded as an ideal place to perform in situ low-level cloud measurements, especially during autumn, when the station is usually inside a cloud about 50 % of the time. There, along with the FSSP-100 and the CDP, which are classic instruments for in situ cloud measurements, we also used the CAPS probe (part of this instrument is the cloud and aerosol spectrometer (CAS) probe) with a purchased inhalation system. CAPS' worldwide unique setup allows us to make semi-long-term (in orders of months) observations when compared to short-term (orders of hours) airborne measurement. The exact set of measurement limitations for each cloud probe that are presented in this work will help us to conduct a detailed further analysis of microphysical cloud properties and their interactions with aerosol during all PaCE campaigns. The previous PaCE campaigns already resulted in a series of publications on experimental observations and modeling studies (e.g., Komppula et al., 2005, 2006; Lihavainen et al., 2008, 2010; Kivekas et al., 2009; Anttila et al., 2009, 2012).
A description of the measurement site and the instrumentation as it was installed can be found in Sect. 2.1 and 2.2. Subsequently, in Sect. 2.3, the procedure we followed during data analysis is presented. In Sect. 3, the intercomparison of the instruments and how they were influenced by the meteorological parameters are presented. Finally, in Sect. 4, we summarized our main results and conclusions in order to set limitations and made recommendations for the data analysis of the three instrument ground-based setups during future studies in a sub-Arctic environment.
2.1 Measurement site description
Measurements were conducted during autumn 2013, in the Finnish sub-Arctic region at Sammaltunturi station (67∘58′ N, 24∘07′ E; 560 m a.s.l.), which is a part of the Pallas Atmosphere – Ecosystem Supersite hosted by the Finnish Meteorological Institute. The station is also part of Global Atmosphere Watch (GAW) program. Sammaltunturi station is located on the top of a treeless hill. A full detailed description of the site can be found in Hatakka et al. (2003). Autumn was chosen as the best period to run the campaign due to the high chances that the station will be inside a cloud. This allows us to conduct in situ cloud measurements. All the meteorological parameters were continuously measured by the Vaisala FD12P weather sensor. During our previous PaCE, cloud microphysical properties and aerosol physicochemical properties and their interactions were measured and investigated (e.g., Lihavainen et al., 2008, 2015; Hyvärinen et al., 2011; Anttila et al., 2012; Collaud Cohen et al., 2013; Jaatinen et al., 2014; Raatikainen et al., 2015; Gérard et al., 2019). During PaCE 2013, our main motivation was to focus on an intercomparison of in situ cloud properties measured with three different cloud probes, their evaluation and mutual benchmarking regarding PaCE campaigns.
2.2 Cloud instrumentation
The atmospheric in situ measurement community has identified cloud droplet probes with surface installation as a potential method for continuous cloud in situ measurements (Wandinger et al., 2018). During PaCE 2013, to perform in situ measurements of cloud droplets, we used three instruments originally developed for airborne measurements, but tailored to ground-based measurements by the manufacturer (DMT, USA): the CAPS, the CDP and the forward-scattering spectrometer probe (FSSP-100; hereafter called FSSP for simplicity). All three of them were installed on the rooftop of the measurement site as described below in detail and share a similar measurement technique. A wind tunnel could be regarded as the optimal choice to utilize these instruments for ground-based setups (e.g., Elk Mountain, Baumgardner, 1983, and Puy de Dôme, Guyot et al., 2015). There are measurement sites like ours in the sub-Arctic which do not have this possibility for both practical and budgetary reasons. However, it was shown that the same quality data could be obtained from rooftop measurements (Guyot et al., 2015). Ground-based measurements with cloud probes that were originally designed to be used for aircraft have already been conducted in several measuring sites without using a wind tunnel (e.g., Jungfraujoch, Lloyd et al., 2015, and Storm Peak, Lowenthal et al., 2019). The basic concept is that they use the forward scattering of a laser beam for the detection and sizing of individual particles. Then, using Mie theory (Mie, 1908), they calculate the size of the particle from the intensity of the scattered light.
Only data of the CAS probe were used for the CAPS. CAS is one part of the CAPS (DMT) (0.51–930 µm), which is an instrument that is widely used in airborne measurements for investigating the microphysical properties of clouds (e.g., Baumgardner, 2001; Baumgardner et al., 2011). The CAPS probe includes two more instruments; however they are not comparable with the FSSP and the CDP probe: the cloud imaging probe (CIP) and the hot-wire liquid water content (hot-wire LWC) sensor. CAS measures smaller particles (0.51 to 50 µm) and relies on light scattering. Particles scatter light from an incident laser at a wavelength of 680 nm and a sample area of 0.24 mm2, and collecting optics guide the light scattered in the 4 to 12∘ range into a forward-sizing photodetector. The intensity of light is measured and used to infer the particle size. Backscatter optics also measure light intensity in the 168 to 176∘ range, which allows the determination of the real component of a particle's refractive index for spherical particles. The droplets are then classified into 30 size bins. CAS was operational from 15 October until 28 November. It was installed and fixed on Sammaltunturi station roof. It was pointing in the main wind direction of the station (southwest, ∼225∘). For the instrument's installation we used the manufacturer pylon (height 0.3 m) (the same as is used for CAPS airborne measurements). The whole system was fixed on a horizontal metallic circle (D=0.28 m). The metallic circle was attached to a vertical metallic bar (height 0.3 m), part of a square metallic stand (0.7 m×0.7 m) (see Fig. 1a). As a result CAPS had a total height of 0.6 m on the roof where it was installed and a height of 4.5 m from the ground. In our setup, CAPS had its own tailored inhalation system: a high-flow pump (Baldor, Reliance, USA), which worked continuously. The pump was connected with the CAS probe with a 1.14 m long hose with an inner diameter of 0.07 m. The hose was connected to a triple branch (three parts with i.d. = 0.12) through a 0.12 to 0.05 m reducer. The triple branch connected the CAS probe through the hose with the high-flow pump. The other parts of the branch connected the pump with the CIP through two different hoses (L=1.52 m; i.d. = 0.12 m). In addition, a stepped CAS inlet (funnel shape reducer i.d. = 0.12 to i.d. = 0.05 m) was attached over the CAS inlet tube (for detailed description, please see Figs. S1 and S2 in the Supplement).The probe air speed (PAS) inside CAS was checked daily with a digital thermo-anemometer (model 471, Dwyer Inc.) to ensure that the flows inside the instrument remained similar. This was done through a small hole near the end of the CAS probe outlet and the beginning of the 0.05 m hose and in a position such that the anemometer inserted into the hole was just in the middle of the CAS probe outlet (hose diameter). In cases when PAS changed, data were corrected accordingly. During this campaign PAS values ranged from 17 to 23 m s−1. The calibration of the instrument was done at DMT and also at the Finnish Meteorological Institute before and after the campaign using glass beads and polystyrene latex sphere (PSL) standards.
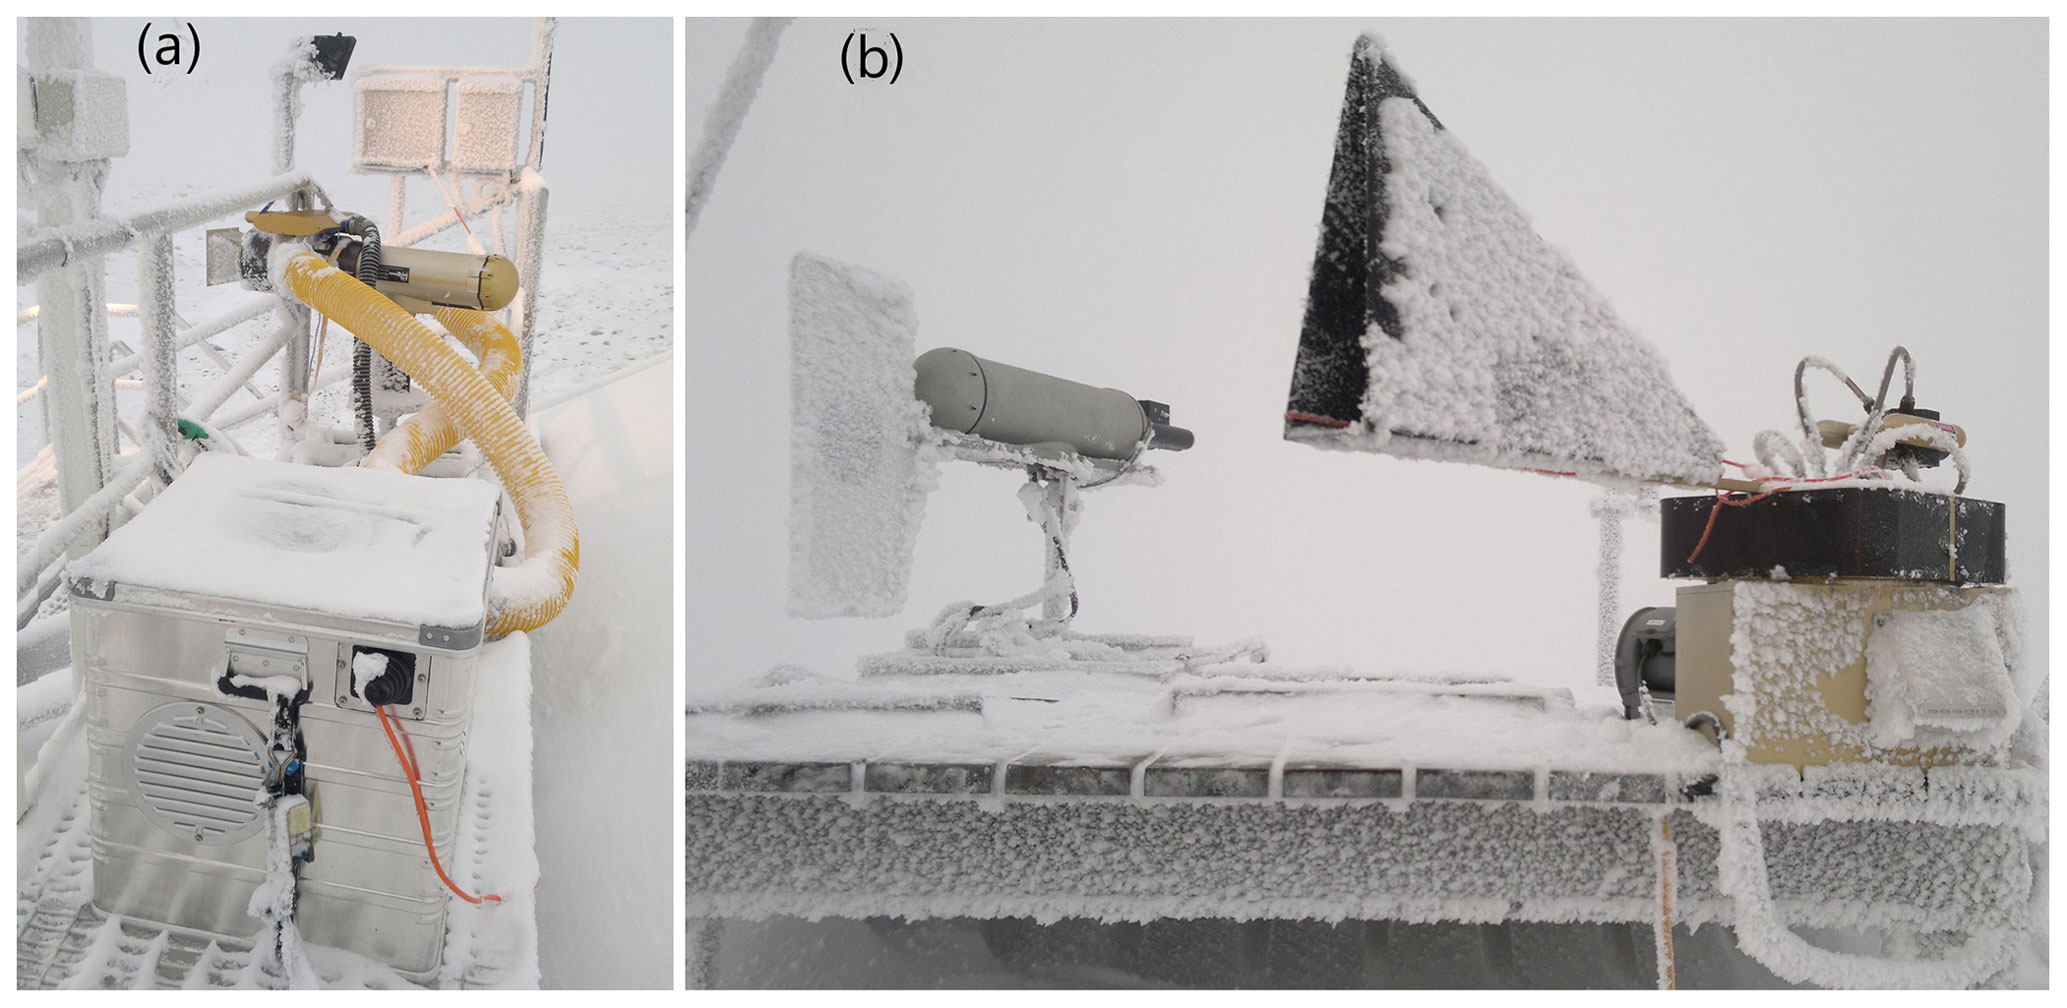
Figure 1(a) The CAPS probe setup and (b) the FSSP-100 and the CDP setups as they were installed on Sammaltunturi station during PACE 2013.
Table 1Instruments, wavelengths (nm), sampling area (mm), number of bins, probe air speed (ms−1), size range (µm), time resolution (s), and operation starting and ending date are presented.
The FSSP (1.2–47 µm, model SPP-100, DMT), initially manufactured by Particle Measuring Systems (PMS Inc., Boulder CO, USA), is a widely used cloud probe for measuring droplet size distribution (Brenquier, 1989). It shares the measurement principle with the CAS probe and measures the light scattered in the 4 to 12∘ range with a laser of wavelength 633 nm and a sample area of 0.414 mm2. Droplets were classified into 40 size bins. During PaCE, the FSSP was installed and placed on a rotating platform, so that the inlet was always directed against the wind direction. The rotating platform was a horizontal metallic base () with a metallic fin fixed at the back of it. This setup ensured that the instrument would follow the wind direction continuously. The rotating platform was placed on a similar squared metallic stand we also used in the CAPS setup, but with a higher metallic vertical bar (L=0.6 m, i.d. = 4 cm). Thus, the instrument had a total height of 0.6 m on the roof where it was installed and a height of 5.5 m from the ground. During FSSP installation on the rotating platform, we wanted to prevent the full rotation of the probe, which could be dangerous for the cable wiring and safety of the instrument. For this reason, a vertical metallic bar (0.3 m, D. = 0.6 cm) and two horizontal bars (L=0.25 m, D = 0.6 cm) were installed (northeast ∼60∘), and they served as a brake (Fig. 1b). A custom inhalation system with a high-flow ventilator was employed through the instruments' inlet to ensure that the air speed would remain constant (for detailed description, please see Fig. S3 in the Supplement). In addition, the PAS inside the FSSP tube was checked daily with the digital thermo-anemometer (model 471, Dwyer Inc.). The PAS during the campaign was ∼10 m s−1, which led to an air speed of ∼36 m s−1 inside the inlet due to the necking inside the inlet's mouth from i.d. = 3.8 cm to i.d. = 2.0 cm. This value was used for further data processing. FSSP was installed and operational from 14 September until 28 November 2013. The instrument was calibrated at DMT, USA, before the campaign and on site after the end of the campaign.
The third instrument that we used was the CDP (3–50 µm, Droplet Measurement Technologies) (Lance et al., 2010). Similar to the previous instruments it uses the same principle and measures the light scattered in the 4 to 12∘ range. The laser beam had a wavelength of 658 nm and a sample area of 0.3 mm2. The CDP classified droplets into 30 size bins. It was placed next to the FSSP also on a rotating platform to be continuously directed against the wind direction (Fig. 1b). The metallic platform covering the instrumental electronics consists of a fixed part () at the bottom and on top of that the rotating part () with the probe itself on top. The rotating part is equipped with a large fin to keep the inlet towards the wind (for detailed description, please see Fig. S4). The instrument had a custom inlet with an external pump to ensure a constant PAS (14 ms−1). The CDP was installed and was operational from 25 September 2013 until 28 November 2013. It was calibrated at the Finnish Meteorological Institute, Kuopio unit, before the campaign and after the campaign on site using glass beads and PSL standards.
All three instruments used anti-ice heaters as they were deployed by the manufacturer. The external parts of the setup (rotating platforms and inhalation systems) did not use an additional heating system. The instruments were installed in a horizontal position and placed close to each other on Sammaltunturi roof. The CDP and FSSP were installed next to each other (approx. 0.5 m) and they had a horizontal distance of ∼10 m and a vertical distance of ∼1 m to the CAS probe. All the probes' parameters are presented in Table 1. During the campaign a routine was consistently followed. The cloud probes functionality was checked visually daily. Ice and snow accumulation could fully or partially block the probes' inlets and affect the flows. In addition, ice and snow could also accumulate in parts of the roof and affect the probe measurements. For this reason, all three cloud probes needed periodical cleaning. When the station was inside a cloud and sub-zero temperatures were observed, the cleaning procedure of the probes during the day was repeated twice or more times per day (if needed).
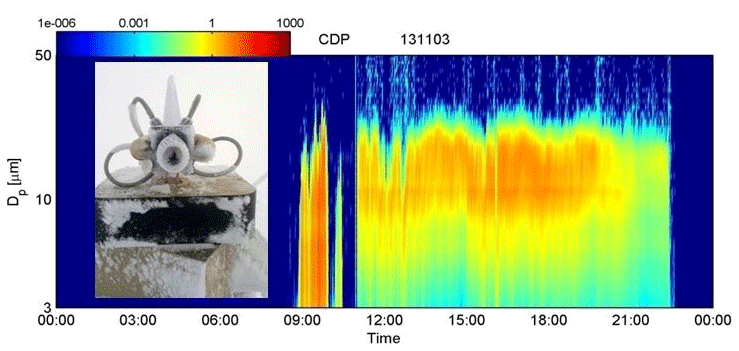
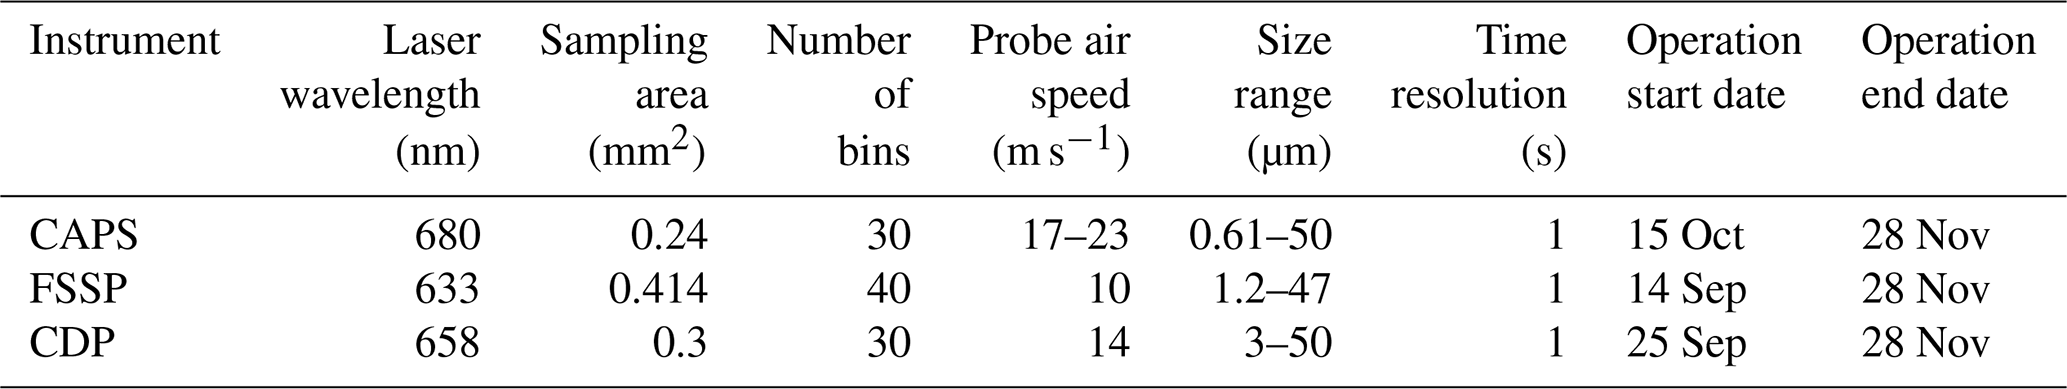
Figure 2An example case of the CDP probe where its rotational platform and inlet are frozen. The size distribution of the CDP probe on 3 Nov 2013 is depicted. The instrument was out of order from 00:00 to about 11:30 LT (all times in this paper are given as local time), and a CDP cleaning procedure was needed to start operation again.
Figure 3Time series of 1 min averages on 3 Nov 2013; (a) Nc of each cloud probe along with (b) temperature, wind speed and wind direction are presented. This is a typical example of the cloud probes accumulating ice. From 12:00 we can see a drop in Nc of the CAS. The sudden increase just before was a clear sign of probe inlet freezing. The same behavior could be also seen for the CDP after 16:00. When ice was accumulated, the opening of the probe inlet became smaller, which resulted in a raised PAS. While deriving Nc to evaluate our data set, we considered the PAS to be constant. The underestimation of the PAS explains the abnormality in Nc.
2.3 Data handling and processing
The presence of a cloud was estimated by the cloud droplet counts measured with all the cloud probes and by the visibility and relative humidity measurements at the site. As a cloud event we defined the situation when there were droplet counts (considering a cleaned data set) measured by the cloud probes for more than 30 continuous minutes, the horizontal visibility was less than 1000 m and the relative humidity was ∼100 %.
From each cloud probe we obtained the cloud droplet size distribution. For the intercomparison of the probes we had to eliminate some size bins of the CAS and the FSSP probe in order to use a similar size range in each case. The CAS probe, using the PADS software (Droplet Measurement Technologies Manual, 2011), derives the number concentration (Nc), the LWC, the median volume diameter (MVD) and the effective diameter (ED). The same parameters were derived using the following equations, since we have used old software PACS 2.2 (Droplet Measurement Technologies) for data acquisition of the FSSP-100 and the CDP probe.
Nc (cm−3) was calculated from the division of the total number of sized particles N by the sample volume Vs (cm−3):
where VS was defined as
where PAS is the probe air speed (m s−1), t is the time of the sampling interval and A is sample area (mm2) defined as the height of the laser beam (mm) multiplied by the length of the laser beam within the depth of field (DOF, mm). On an instrument that records probe time, such as CAS and FSSP, the sampling interval is calculated by subtracting the previous instance's probe time from that of the current instance. On the CDP the sampling interval is assumed to be the designated sample rate. All three probes were set up to sample at 1 s (1 Hz).
LWC (g m−3) is the mass of liquid water per unit volume of air, and it was calculated using the following equation:
where
mi is the midpoint of its bin and calculated as
and ci is the droplet concentrations per bin (m−3).
The factor in the equation indicated that we assume that the particle is a sphere. Another assumption that was made is that water has a density of 1 g cm−3.
MVD (µm) indicates the droplet diameter, which divides the total water volume in the droplet spectrum such that half the water volume is in smaller drops and half is in larger drops; and it is derived by a linear interpolation with respect to the (i+1) bin as
where is the proportion of the spectrum LWC that falls in the ith bin and is the cumulative proportion of the spectrum LWC that falls in the first i bins and i∗ is the smallest value of i such that .
This interpolation gives an accurate estimation in comparison with the half point of and bi+1. The second component of the equation scales the amount summed to according to how close and bi+1 each were to 0.5.
ED (µm) is the ratio of LWC to the optical cross-sectional area of droplets of a sample droplet spectrum calculated by the following equation:
where n is the number of sizing bins, pi the particle counts for bin i and ri the mean radius in micrometers of bin i.
All our instruments were calibrated in the laboratory and/or on site. The calibration of all three instruments was done for size measurements but not for Nc measurements. Also, we should take into account the fact that the instruments faced extreme conditions during the whole campaign, in terms of frequent changes in wind direction and speed and sub-zero temperatures. These meteorological conditions could possibly lead to unexpected performance.
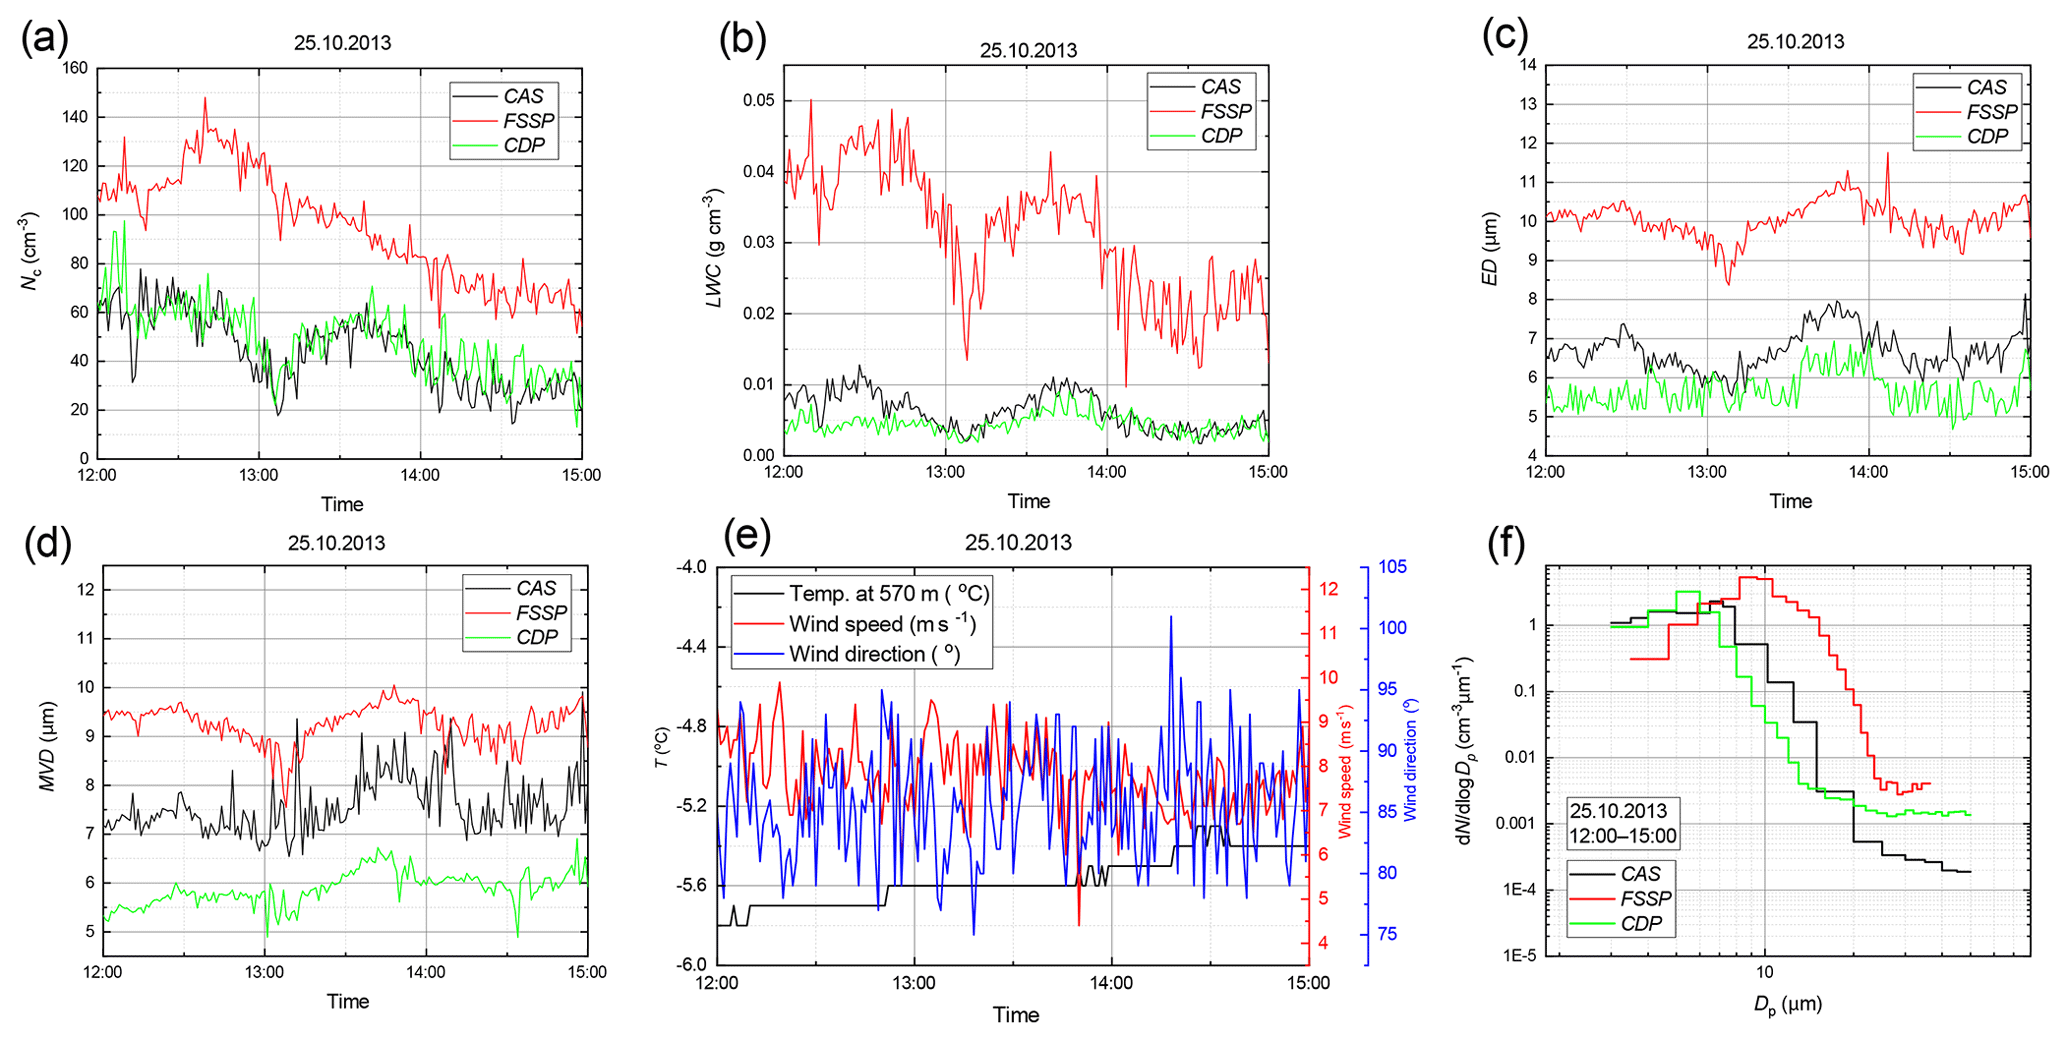
Figure 4Time series for the 12 November case from 15:00 to 18:00. The main parameters as they were derived/measured from all three cloud probes: (a) Nc; (b) LWC; (c) ED; (d) MVD; (e) temperature, wind speed, wind direction; and (f) size distribution. All three instruments were pointing in the same direction. This resulted in high agreement in Nc for all three probes. In addition, we also noticed good agreement in LWC. The main reason for slight differences in ED and MVD was the different sizing ability of the probes.
The sizing accuracy for cloud spectrometers has been estimated as 20 % and the concentration accuracy as 16 % (Baumgardner, 1983; Dye and Baumgardner, 1984; Baumgardner et al., 2017). The major factors that are usually considered for possible biases in data analysis are coincidence, dead-time losses and changing velocity acceptance ratio (VAR). Coincidence events occur when more than one droplet is registered by an instrument at the same time, resulting in multiple droplets artificially measured as one droplet. A changing VAR is a result of the fact that only part of a laser beam is used to calculate the sampling volume because drops passing the laser beam near the edges are undersized. Lance (2012) showed that at ambient droplet concentrations of 500 cm−3, at least 27 % undercounting and a 20 %–30 % oversizing bias were observed for CAS. However, during PaCE 2013 droplet number concentrations we observed to reach a maximum of 200 cm−3, and in the majority of cases they were less than 100 cm−3. Due to these low number concentration values we do not take coincidence, dead-time losses and VAR uncertainties into consideration in this analysis. LWC as it was derived from the CAS probe has a significant uncertainty of 40 % according to the Droplet Measurement Technologies Manual (2011). FSSP uncertainties, limitations and corrections have been reported in the literature several times (Dye and Baumgardner, 1984; Baumgardner et al., 1985; Baumgardner and Spowart, 1990). Febvre et al. (2012) found out that the uncertainty of the FSSP in derived ED and derived LWC is 3 µm and 30 % regarding mixed-phase clouds. For the CDP probe, Lance et al. (2012) reported the importance of the coincidence errors even if the number concentrations are as low as 200 cm−3, resulting in a 25 % undercounting error and a 30 % oversizing error due to coincidence.
During the campaign, measurements were performed with a 1 Hz acquisition frequency for all three probes. During the data analysis, averages per minute from each cloud probe were calculated when the station was inside a cloud. As we previously highlighted, there were cases when the flows of the cloud probes were blocked. This situation was also visible in raw data. Such cases were cleaned out from all data sets for the final analysis. A typical example case of probe freezing was observed on 3 November 2013. The CDP was completely clogged with ice; see Fig. 2, where its size distribution is presented. However, in order to find probe freezing cases a closer look in Nc was carefully undertaken for the whole data set. As an example, Fig. 3 depicts the Nc of each cloud probe on the same day along with the meteorological parameters. There, the sudden decrease in droplet number concentration of the CAS probe from 12:00 onwards and a sudden increase in Nc just before was a clear sign of probe inlet freezing. This behavior in Nc was observed because the opening of the probe inlet becoming smaller (from the accumulation of ice), which resulted in a raised PAS. During data evaluation we considered the PAS to be constant. This led to an underestimation of the PAS, which explains this abnormality in the Nc. The same behavior could be also seen for the CDP after 16:00.
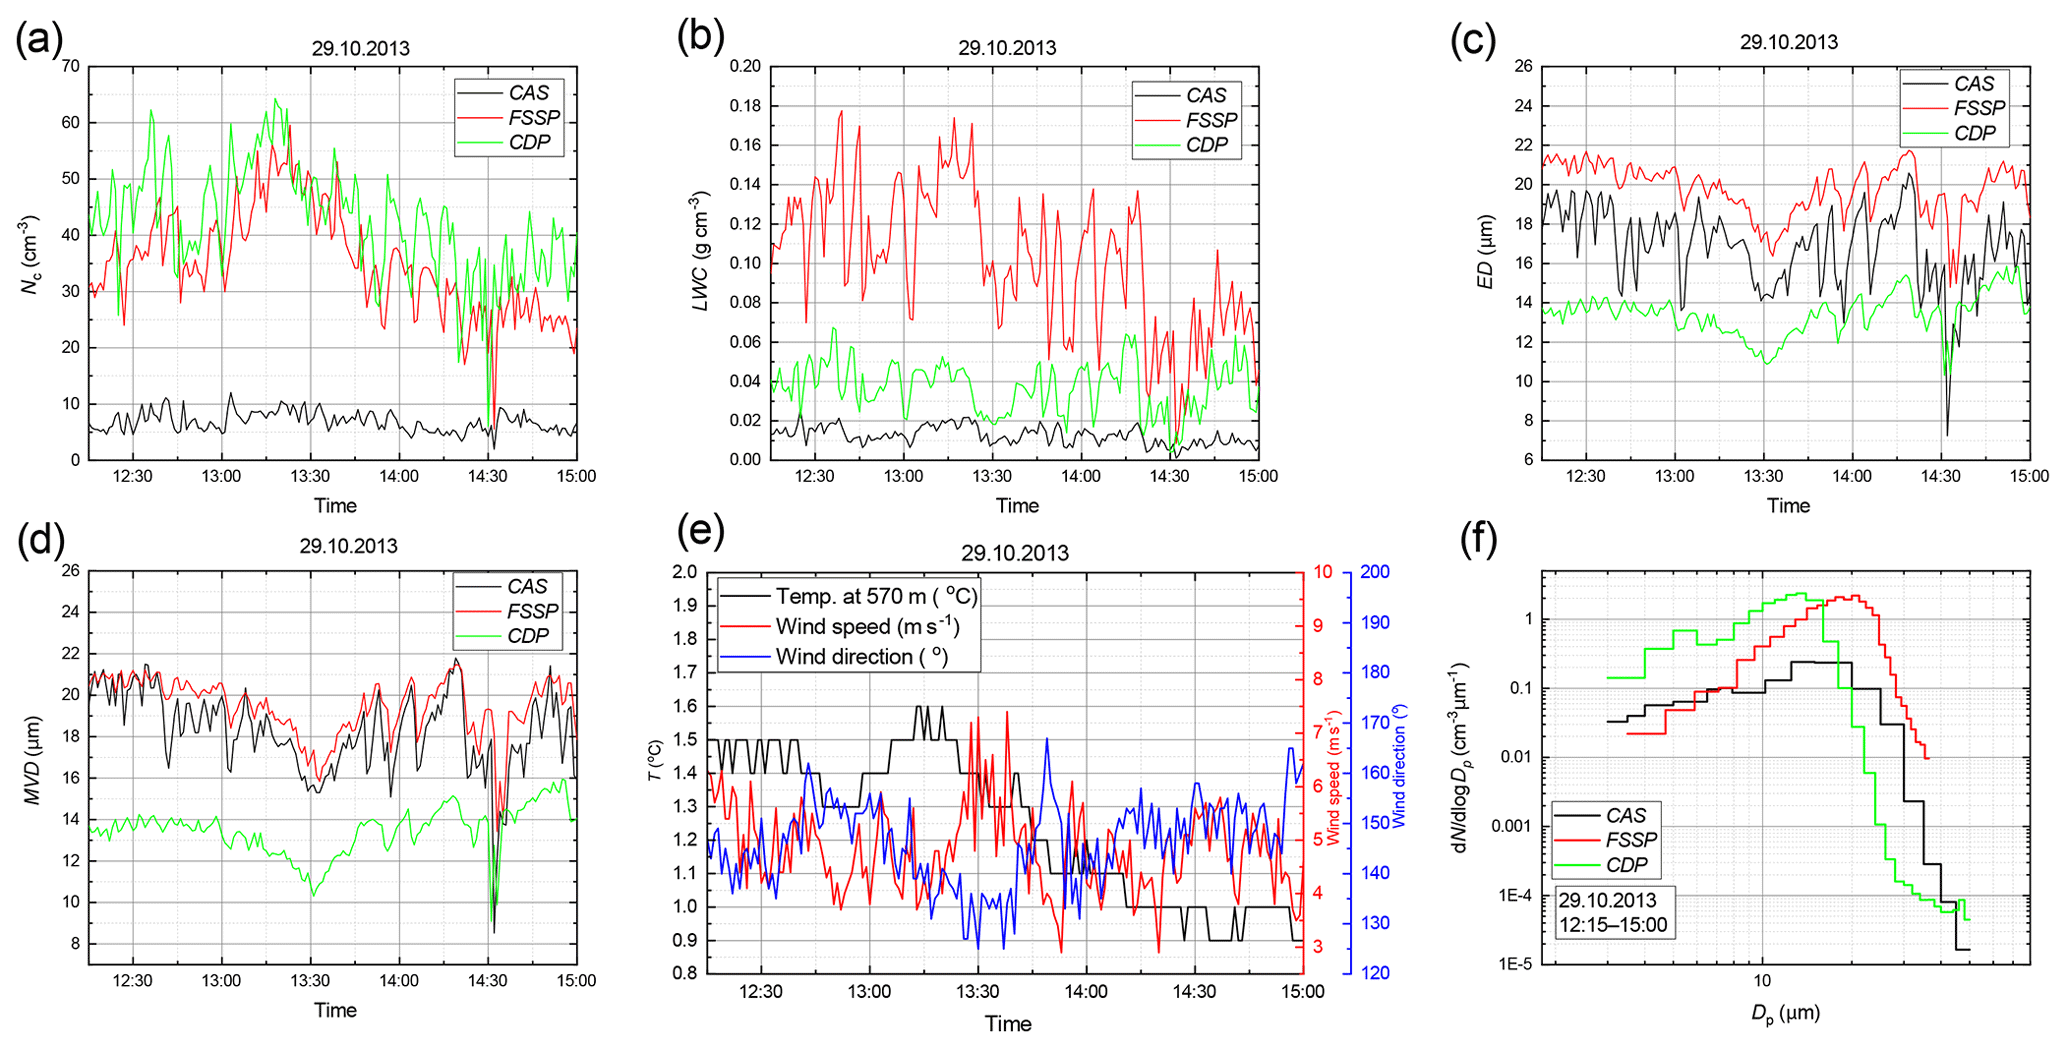
Figure 5Time series on 29 October from 12:15 to 15:00. The main parameters as they were derived/measured from all three cloud probes: (a) Nc; (b) LWC; (c) ED; (d) MVD; (e) temperature, wind speed, wind direction; and (f) size distribution. The wind direction was perpendicular to the CAS probe. This resulted in CAS significantly underestimating Nc and LWC. The main reason for slight differences in ED and MVD was the different sizing ability of the probes.
3.1 Overview of results for PACE 2013
During PaCE 2013, FSSP, CAS and CDP were installed for a total of 1824, 1080 and 1560 h, respectively; see Table 1 for installation dates. During the campaign, the station was inside a cloud for about 664 h (36.5 %). During this period, the temperature ranged from −12.0 to 10.2 ∘C with an averaged temperature −1.9 ∘C (SD 5.1 ∘C), and the wind speed average was 6.8 (SD 2.9) m s−1. The dominant wind direction was ∼ 220∘, but there were winds and clouds from all directions. Regarding data coverage, the FSSP and the CAS probe showed good performance, with ∼500 h (75 %) and ∼220 h (67 %) cleaned data coverage, respectively. The CDP probe performed significantly worse, with ∼108 h (17 %) cleaned data coverage. The worse CDP performance was due to its frozen inlet and/or its rotation system during the night; it encountered frequent operation problems especially at sub-zero temperatures.
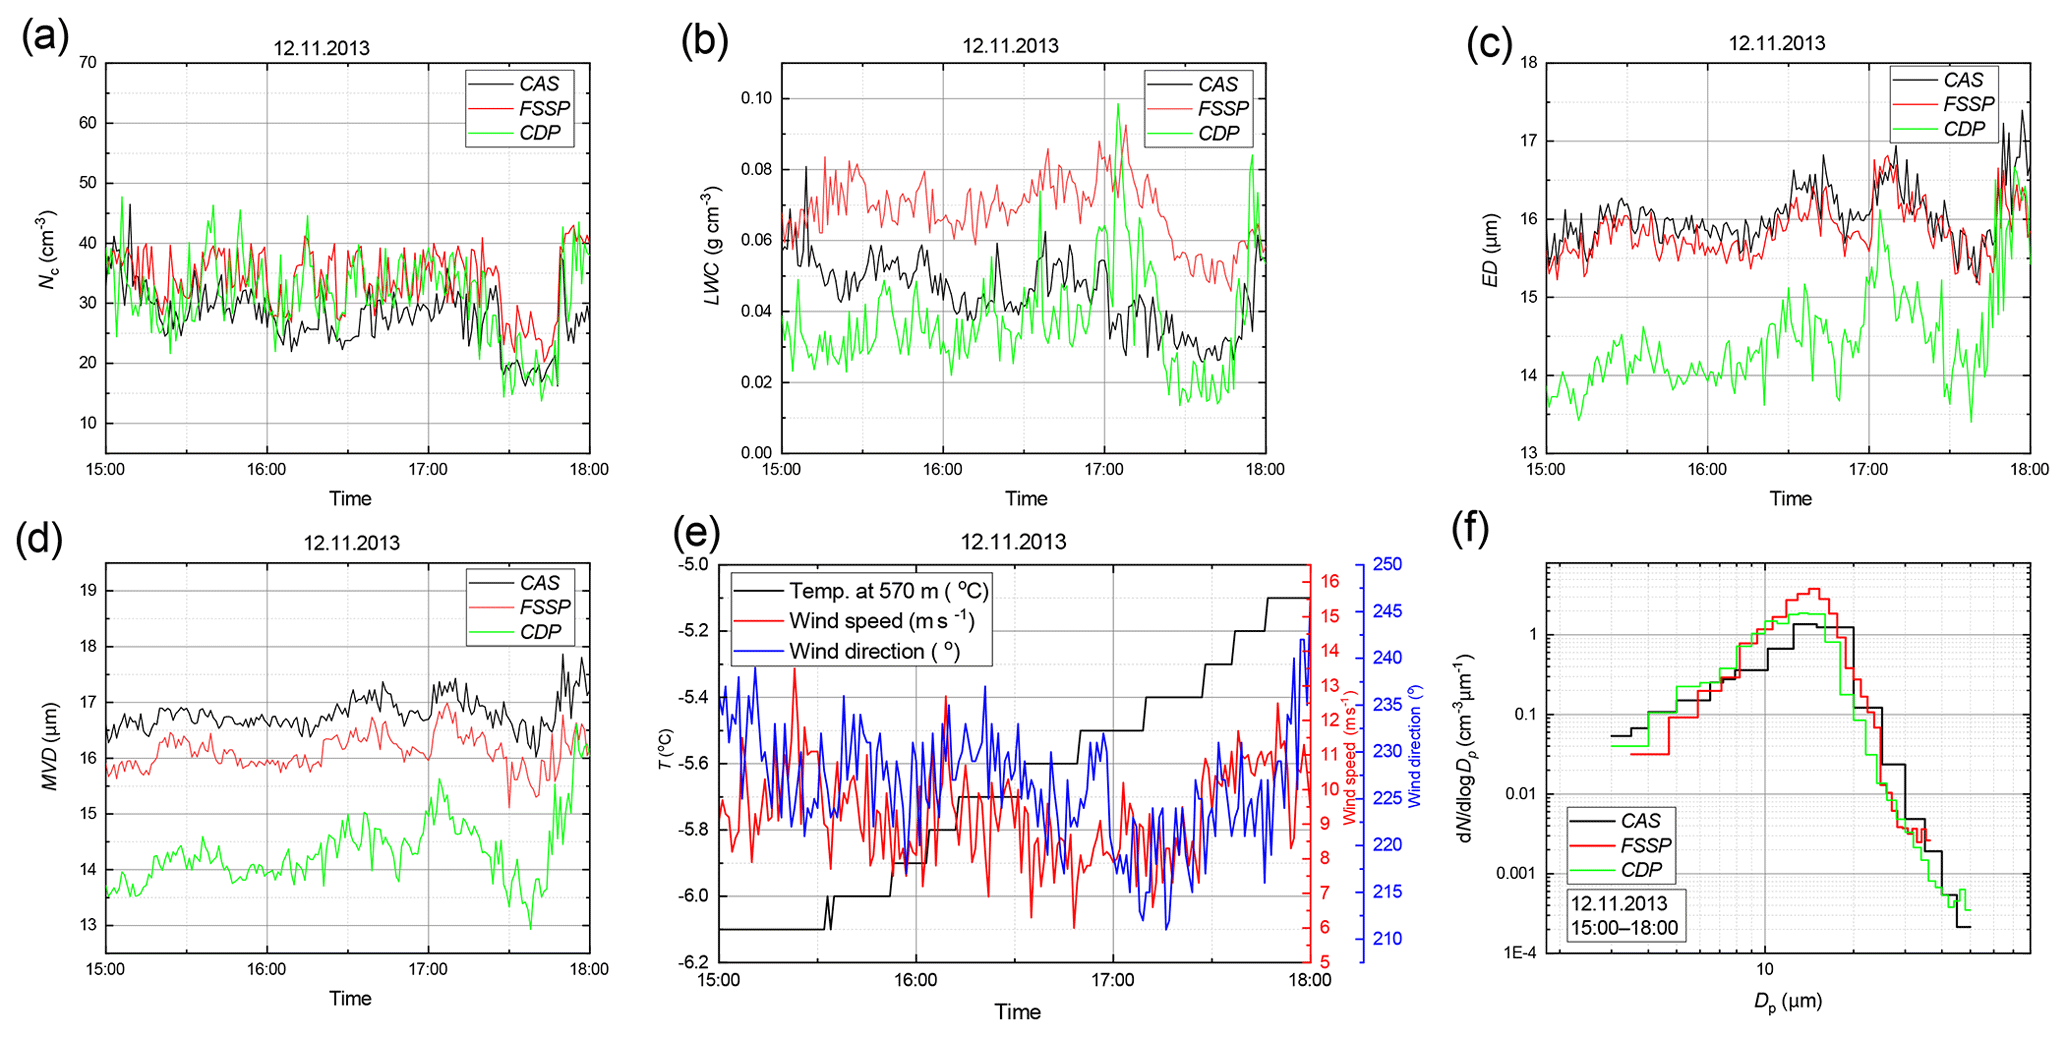
Figure 6Time series on 25 October from 12:00 to 15:00. The main parameters as they were derived/measured from all three cloud probes: (a) Nc; (b) LWC; (c) ED; (d) MVD; (e) temperature, wind speed, wind direction; and (f) size distribution. During this case the probes were not facing in the same direction. Agreement in Nc between CAS and CDP indicates that the CDP rotation system was frozen and CAS was not facing the wind. Large discrepancies were observed in LWC and slight discrepancies in ED and MVD. The main reason for these discrepancies was the different sizing ability of the probes.
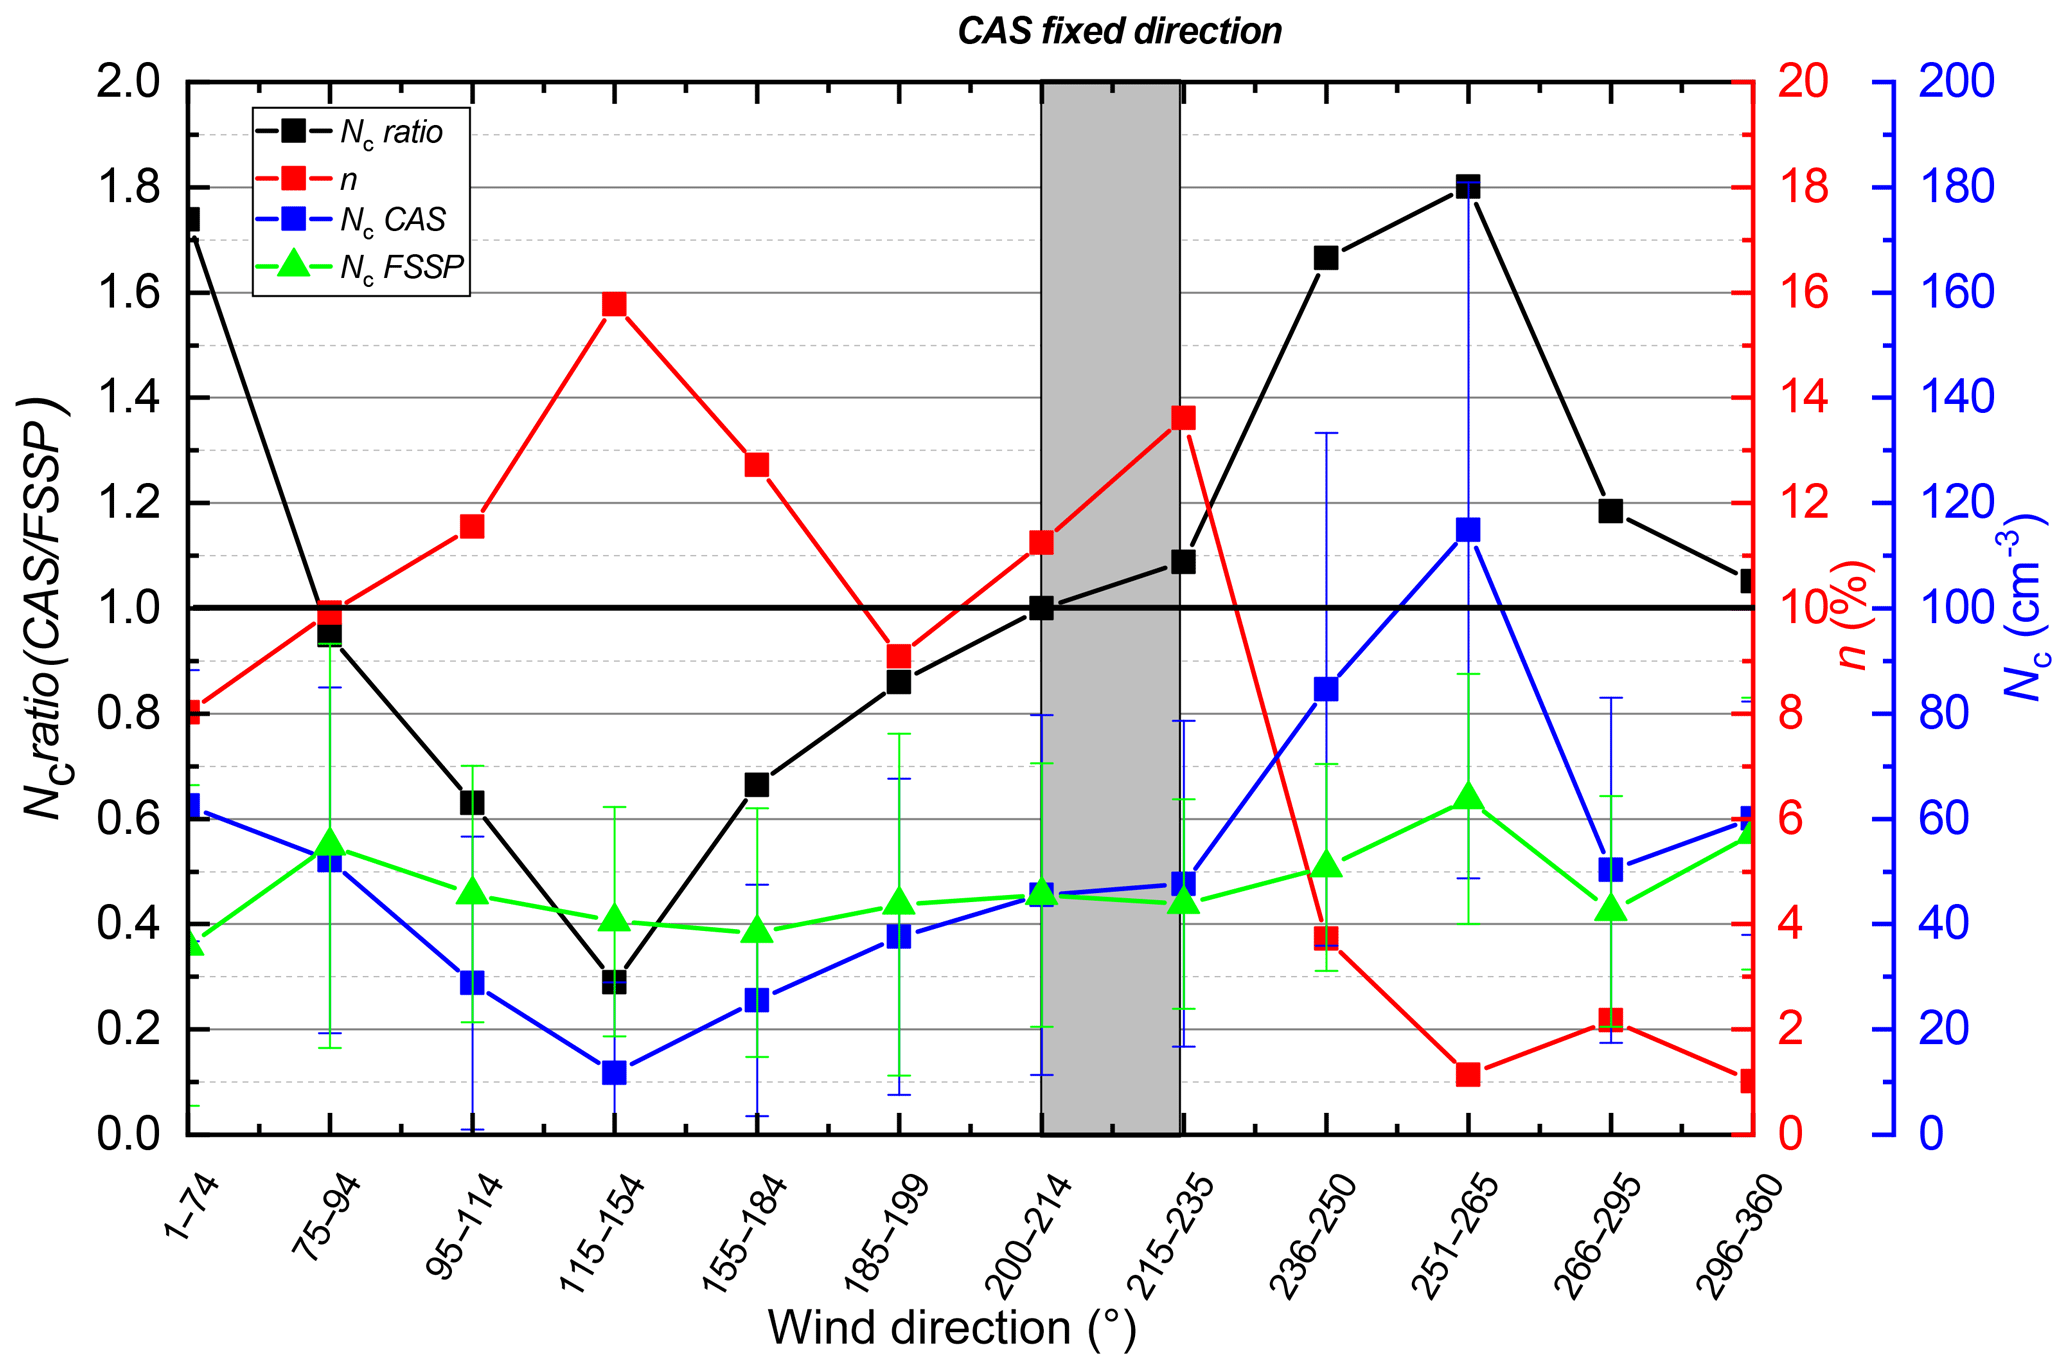
Figure 7Number concentration ratio (Nc ratio), number of observations (n), and Nc of the CAS probe and the FSSP for each part of the 360∘ wind rose as it was divided for detailed investigation. The gray rectangle corresponds to wind iso-axial measurements.
3.2 Example cases with all three probes in operation
Firstly, we present example cases when all three probes were operating. These cases correspond to different wind directions. This choice was made since we used two different approaches; two probes were installed on a rotating platform (FSSP, CDP) and one probe was installed in a fixed direction (CAS). We provide the time series of the derived Nc, LWC, ED, MVD and the size distributions as they were measured by all three probes along with selected meteorological parameters (temperature, wind speed and wind direction). For each case, the same size range for each probe was adopted. For this reason, we eliminated 12 bins (ranging from 0.51 to 3 µm) of the CAS probe and two bins (from 1.2 to 3.5 µm) of the FSSP-100. The final size ranges for probe comparison were then as follows: CAS – 3 to 50 µm; FSSP – 3.5 to 47 µm; CDP – 3 to 50 µm.
The abovementioned parameters are presented on 12 November from 15:00 to 18:00; see Fig. 4. The wind speed during this period varied from 6 to 13.5 m s−1, and temperature varied from −6.1 to −5.1 ∘C. The average wind direction was 226.5 (SD 6.1)∘, which means that all three instruments were pointing in the same direction (Fig. 6e). As we noticed in Fig. 4a, this resulted in good agreement among all three probes in deriving Nc. The CDP operated without flaws in both its rotation and inhalation system due to the cleaning procedure of the instrument done just before this measuring period. In this case, the LWC values were in best possible agreement; see Fig. 4b. Derived sizing parameters ED and MVD are presented in Fig. 4c and d, and both of them had good agreement.
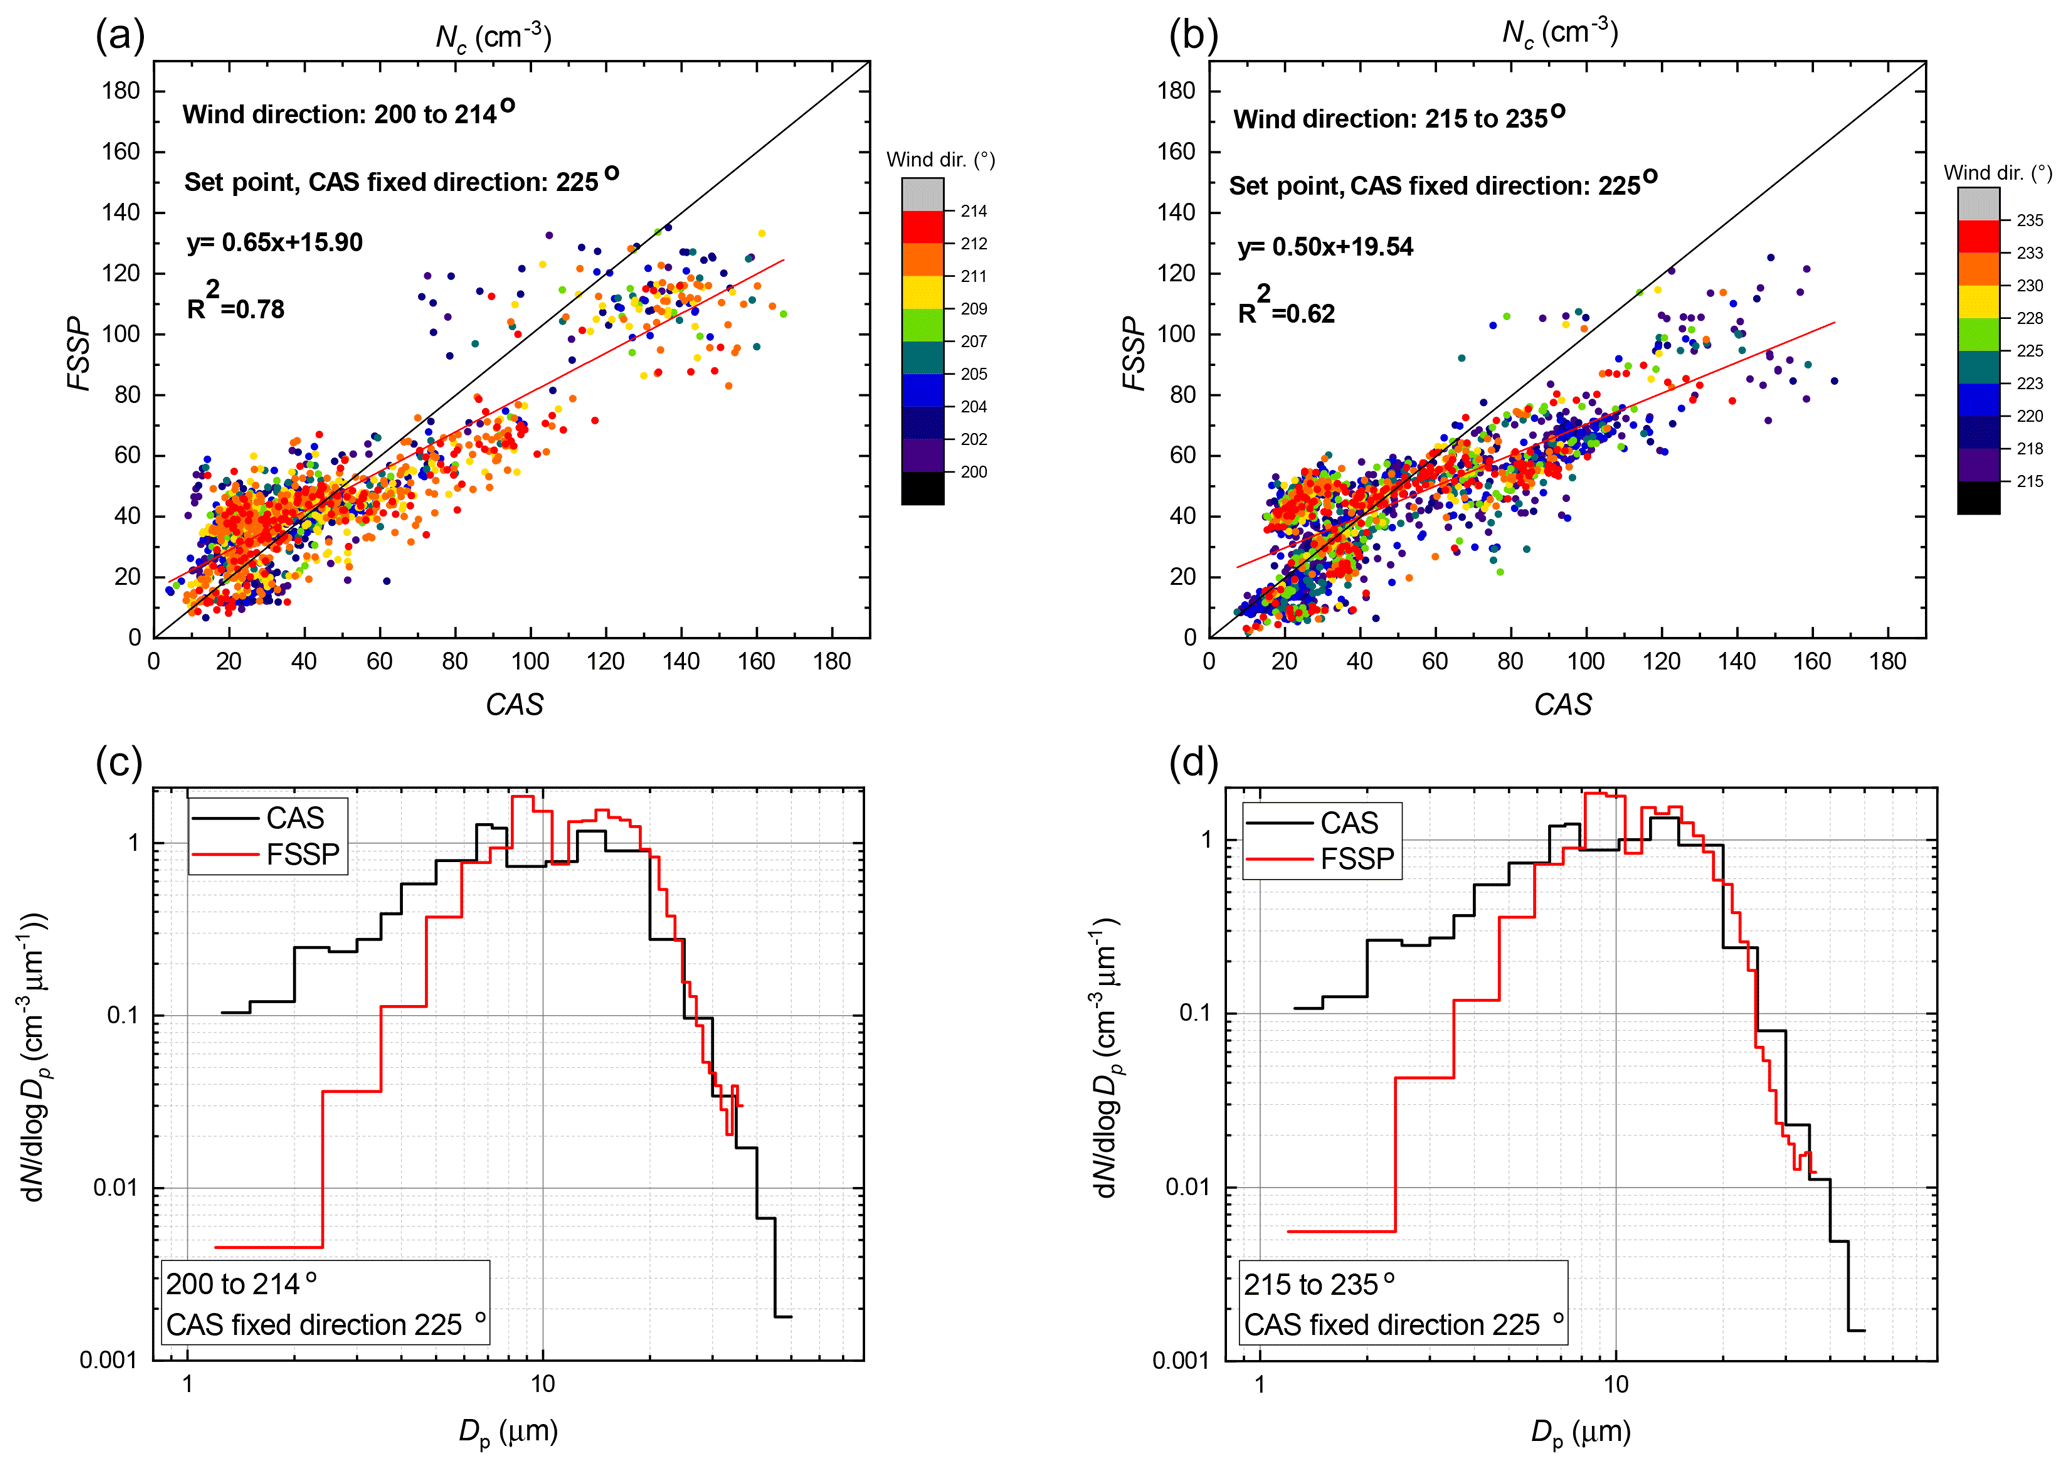
Figure 8Comparison of number concentration (Nc) as it was derived from the CAS and the FSSP is presented for two sectors of the wind rose while the station was inside a cloud: (a) 200 to 214∘; (b) 215 to 235∘. Color code represents the wind direction. In (c) and (d) the size distribution as it was measured from the CAS probe and the FSSP for the same two wind sectors is presented.
The next example case took place on 29 October, from 12:15 to 15:00; see Fig. 5. The wind speed during this period varied from 2.9 to 8.9 m s−1, and temperature varied from −5.4 to 2.9 ∘ C. Average wind direction was 141.2 (SD 18.4)∘, which indicates that the wind direction was perpendicular to the CAS probe (Fig. 5e). Here, the CAS probe significantly undercounted Nc (∼ factor 5) compared to FSSP and CDP (Fig. 5a). The CDP was also operating with no malfunctions in its rotation and inhalation system. LWC as it was derived by the CAS probe was highly affected by a factor of about 7 due to its losses in Nc (Fig. 5b). Furthermore, as we can see in Fig. 5c and d, CAS ability to derive ED and MVD was not affected by Nc. Especially, when we are comparing ED and MVD between CAS and FSSP, their difference is less than 20 %. However, it was also interesting that even though CDP and the FSSP had a good agreement in droplet counts, they present some differences in the other derived parameters. Investigating in detail their size distribution, we found that this was a result of different estimation in sizing. This can be clearly seen in Fig. 5f. In this case there was a shift in CDP sizing when compared with FSSP towards smaller sizes about 5 µm in size range from 15 to 20 µm.
The last example day we present took place on 25 October, from 12:00 to 15:00; see Fig. 6. The wind speed varied during this period from 4.4 to 9.9 m s−1 and temperature from −5.8 to −5.3 ∘ C. The average wind direction was 85.6 (SD 4.8)∘, which means that the probes were not facing in the same direction (Fig. 6e). This explains why the Nc of CAS was lower than the Nc of FSSP by a factor of 2. The CDP measured the same Nc of cloud droplets as CAS, something that was not really expected (Fig. 6a). This is a typical example case we faced, which indicates why the CDP counts were not trusted during sub-zero temperatures. Even if the CDP was not obviously clogged, when observed from the raw data, its rotation system was frozen, so it could not follow the wind direction and we were not able to determine where exactly the CDP was pointing. Also, here, we can see that during the period the instruments were not facing in the same wind direction, we observed large discrepancies in derived LWC (Fig. 6b). In Fig. 6c and d we can also see slight discrepancies in the derived sizing parameters ED and MVD. We noticed a slight shift in FSSP sizing towards bigger sizes compared to CAS, about 2.5 µm in size range from 7 to 10 µm, and a slight shift in CDP sizing towards smaller sizes, about 2 µm in size range from 5 to 7 µm, as depicted in Fig. 6f; this clearly explains these differences.
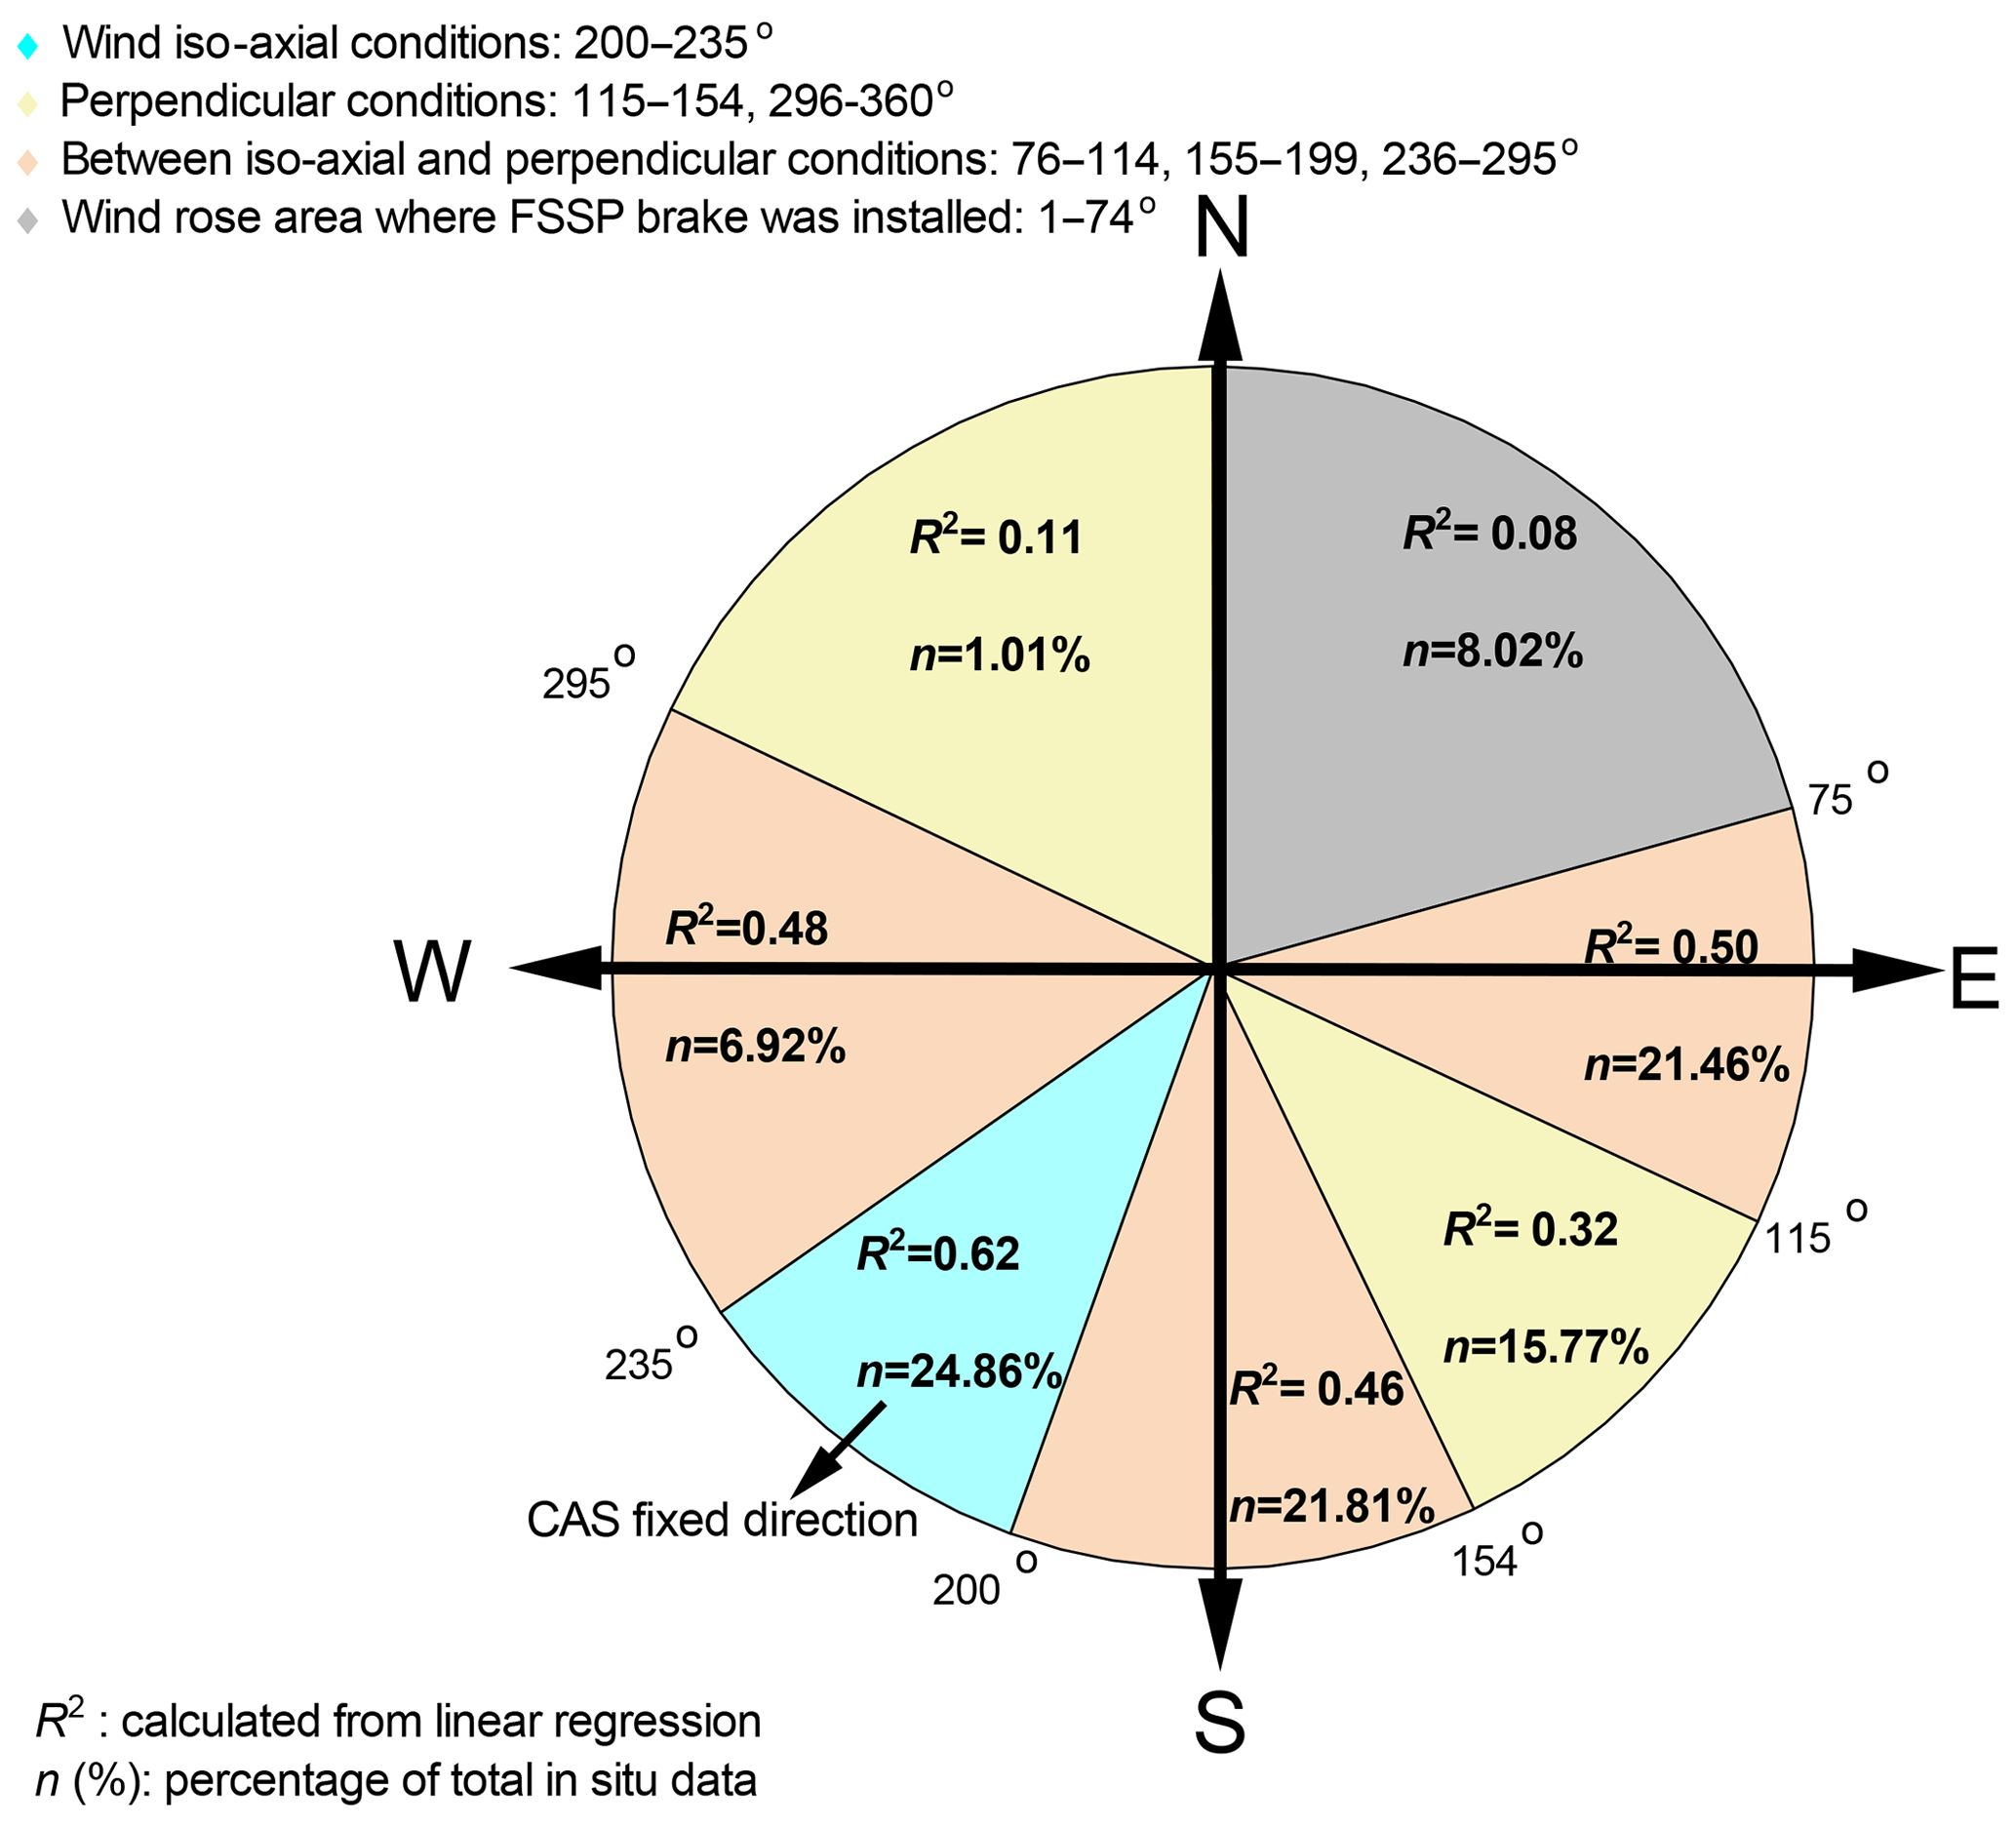
Figure 9Intercomparison of number concentration (Nc) between the CAS and the FSSP based on the wind direction. The CAS was set and installed in a fixed direction (southwest, ∼225∘); the FSSP was installed on a rotating platform and followed the wind direction. The wind rose was separated into four representative wind direction conditions; wind iso-axial conditions (from 200 to 235∘), perpendicular conditions (from 115 to 154 and 296 to 360∘), conditions between iso-axial and perpendicular (from 76 to 114, from 155 to 199 and from 236 to 295∘) and the special case where the brake influenced the performance of FSSP (from 1 to 74∘).
3.3 CAS and FSSP counting performance based on the wind direction
After investigating different example cases, we focused on how the change in the wind direction influenced the droplet counting ability of the instruments in different sectors of the wind rose. In this section, we concentrated only on the intercomparison of the CAS probe (installed in a fixed direction) with the FSSP (was following the wind direction). The decision to first compare only CAS and FSSP setups was made because their parallel data coverage was the best (∼243 h of common cleaned data set). CDP was not used in this section due to only few common data with the CAS. The reason for this was that from the date that the CAS was installed the CDP had operation problems. A detailed analysis regarding the CDP and its behavior is presented later in Sect. 3.5. To obtain as close as possible a size range for both instruments we removed the first 10 bins of the CAS and the first bin of the FSSP. As a result, we used the following size ranges: CAS – from 1.25 to 50 µm; FSSP – from 1.2 to 47 µm.
To estimate the possible losses of the cloud droplet counts from each cloud probe we used Nc as a benchmark parameter. Possible CAS sampling losses were investigated by calculating the aspiration efficiency as described in Spiegel et al. (2012). Our expected losses were ∼5 % for 20 µm, ∼20 % for 40 µm and 40 % for 50 µm cloud droplets. Averaged total Nc values of the cleaned data set as they were derived from the CAS probe and the FSSP were 39.8 (SD 35.3) cm−3 and 44.1(SD 26.9) cm−3, respectively. We divided the wind rose into 12 parts. This choice was made according to specific factors. First of all, we took into consideration the crucial point orientation of the CAS inlet when compared to actual wind direction since the CAS probe was fixed and installed (southwest of the station, ∼225∘). This point helped us to define the areas where the two instruments were performing in wind iso-axial conditions. Secondly, we tried to ensure that we would have enough amount of data in each part to increase the reliability of our results. Accordingly, the 360∘ wind rose was divided into the following sectors: 0 to 74, 75 to 94, 95 to 114, 115 to 154, 155 to 184, 185 to 199, 200 to 214, 215 to 235, 236 to 250, 251 to 265, 266 to 295 and 296 to 360∘. Figure 7 shows the ratio of Nc of the CAS to the FSSP probes along with the percentage of observations in each of these sectors of the wind rose and the averaged Nc values from both instruments. There, we can see that each of the instruments had a different counting performance in each sector. The best counting performance (the ratio is close to 1) was found in two sectors (from 200 to 214∘ and 215 to 235∘), where both probes were facing in a similar direction. On the other hand, when the wind direction was perpendicular (115 to 154∘) to the CAS fixed direction, the ratio was found to be lower than 0.4. There the CAS probe undercounted a significant amount of cloud droplets (∼60 %). However, there were also cases where FSSP measured smaller Nc compared to the CAS probe (sectors from 236 to 250∘ and from 251 to 265∘). During these cases, FSSP was not actually freely moving because of the brake setup. Depending on the wind turns, FSSP could be left in the wrong orientation for an unknown amount of time. Inside these two sectors the CAS probe measured relatively high Nc (∼120 cm−3) in comparison with the other parts of the wind rose (∼50 cm−3).
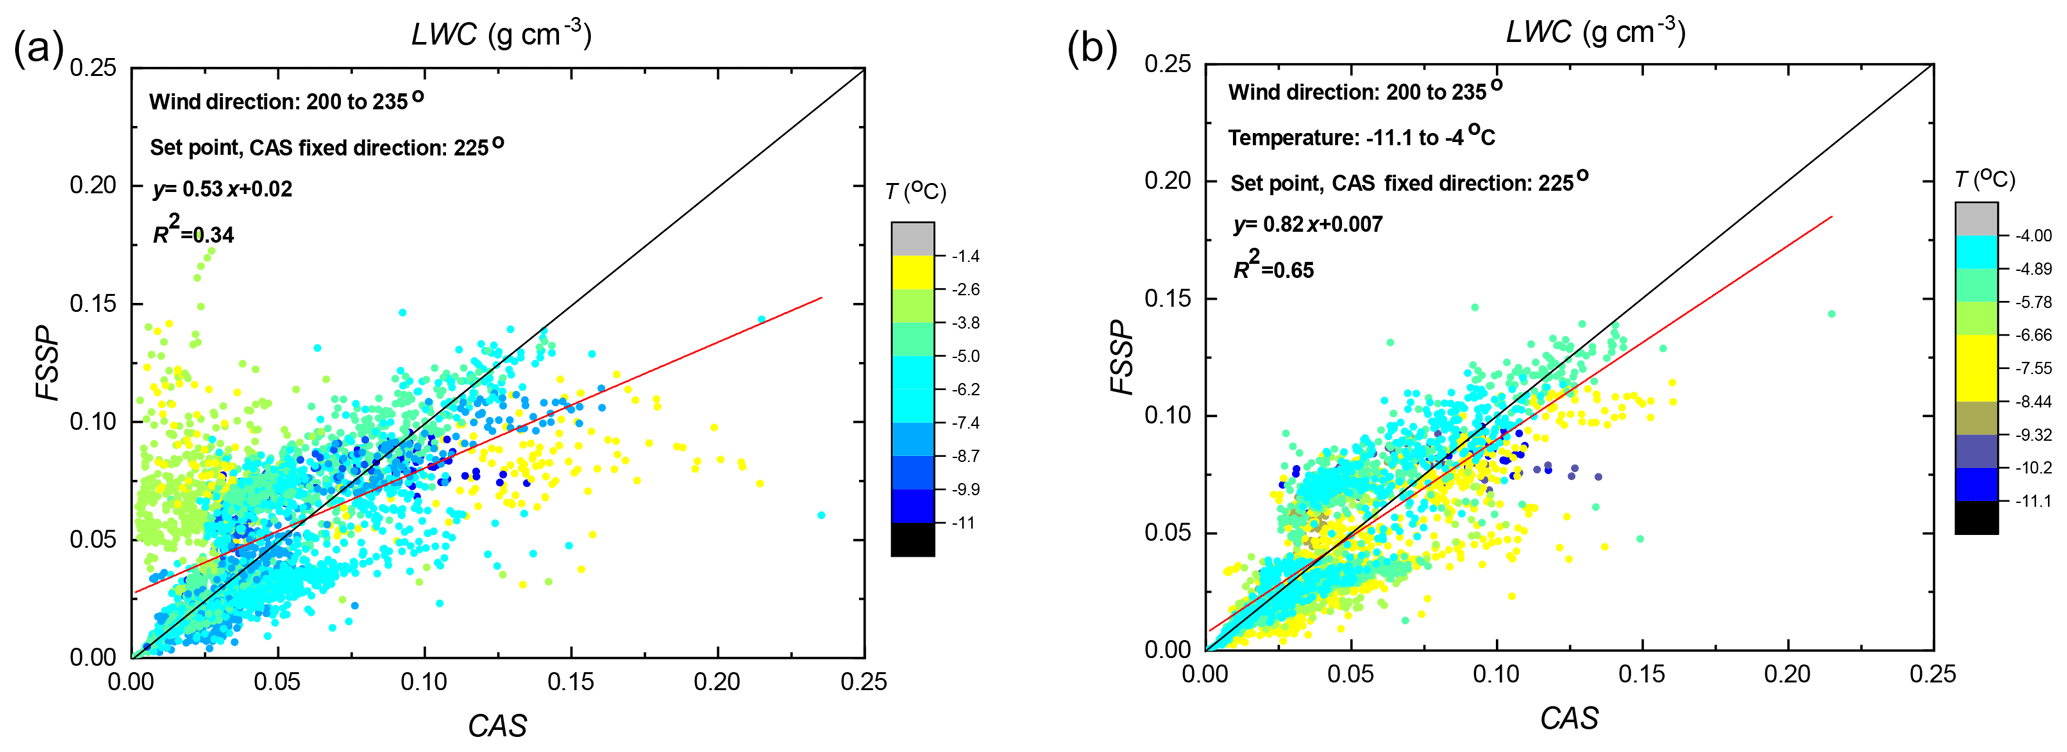
Figure 10(a) Comparison of LWC as it was derived from the CAS and FSSP for wind iso-axial conditions, color code represents full temperature range from −11.1 to −1.4 ∘C. (b) Comparison of LWC as it was derived from the CAS and FSSP is presented for the same conditions but only for the temperature range from −11.1 to −4 ∘C.
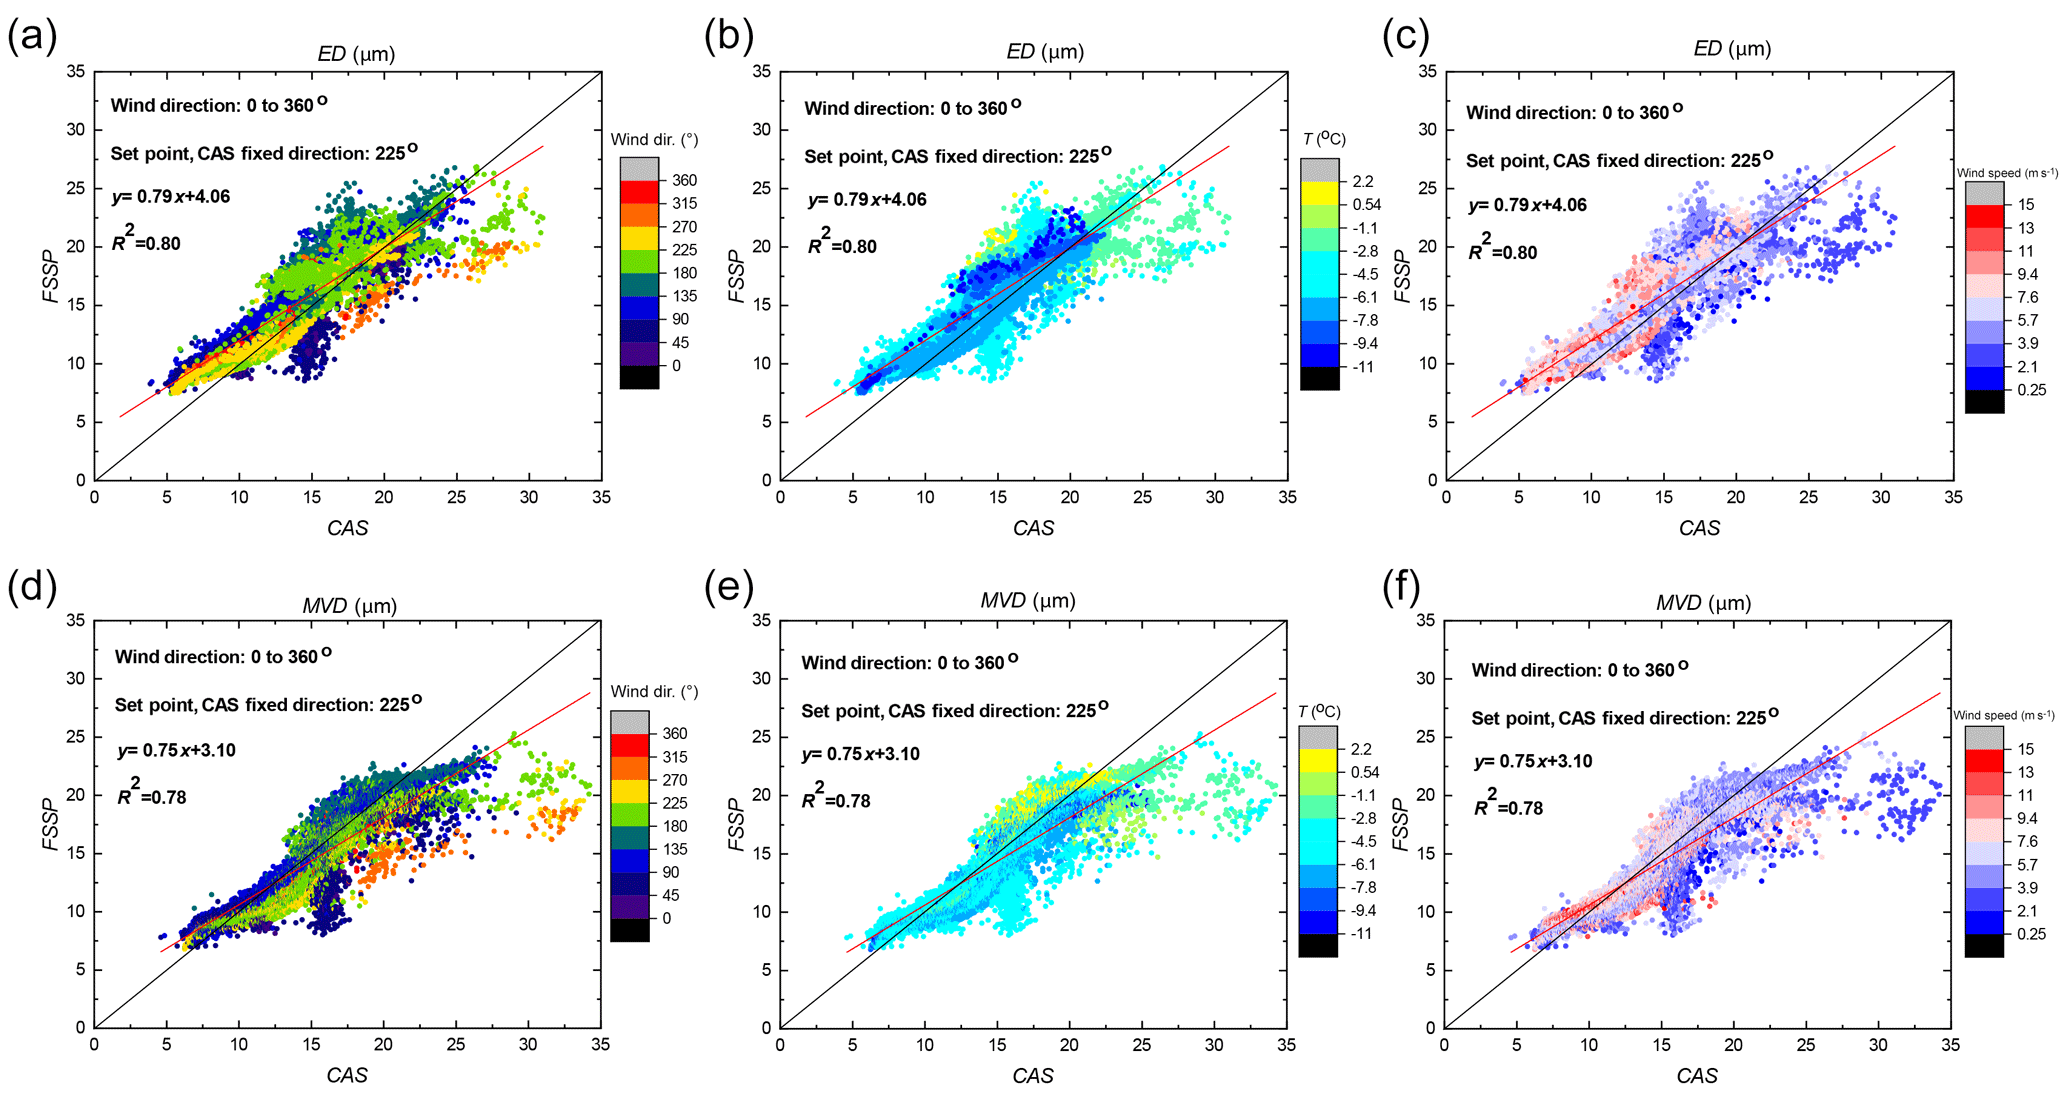
Figure 11Comparison of ED (a , b, c) and MVD (d, e, f) as it was derived from the CAS and FSSP is presented for all wind directions. Color code represents wind direction (a and d), temperature (b and e), and wind speed (c and f).
All wind sectors were further investigated to explain the biases in the performance of the two instruments. Firstly, a closer look (see Fig. 8) is presented for two sectors (200–214, 215–235∘) where the agreement was found to be the best according to the Nc ratio. For this reason, the wind rose sector from 200 to 235∘ was adopted as wind iso-axial conditions for the rest of this work. Results indicate that the agreement in both cases was good (R2=0.78 and 0.62 with slope 0.65 and 0.50, respectively; Fig. 8a and b), and the maximum difference observed was ∼30 %. When Nc as derived from CAS was more than 80 cm−3, FSSP Nc was about 25 % lower. Temperature and wind speed in the range of −11 to −1.4 ∘ C and 1.6 to 13.8 m s−1 were also tested for possible biases in wind iso-axial conditions, and we found that they did not affected the ability of the probes to derive Nc. A more detailed look at how the two cloud probes measured in wind iso-axial conditions when the station was inside a cloud is presented in Fig. 8c and d, where the averaged number size distribution of the cloud droplets is shown. The CAS probe measured more counts in sizes smaller than 7 µm (∼3 counts cm−3 more than the FSSP at 1.4 µm and ∼15 drops cm−3 more at 5 µm; in both cases, the difference in counts was less than 30 %). Also, we can see that the FSSP measured no droplets for sizes larger than 35 µm. Within the size range, meaning from 7 to 20 µm (an area which usually represented the peak of the size distribution), the FSSP usually measured higher Nc. This difference could be up to 25 % (∼150 more counts cm−3). We have also noticed a slight shift in FSSP sizing towards bigger sizes: about 1.5 µm in the size range from 7 to 10 µm. These differences in the counting efficiency of the two instruments explain the slight discrepancies we observed in Nc even when they were measuring in wind iso-axial conditions. In a similar way, all the remaining sectors of the wind rose were investigated in detail to reveal more biases (for detailed description, please see discussion and Figs. S5, S6).
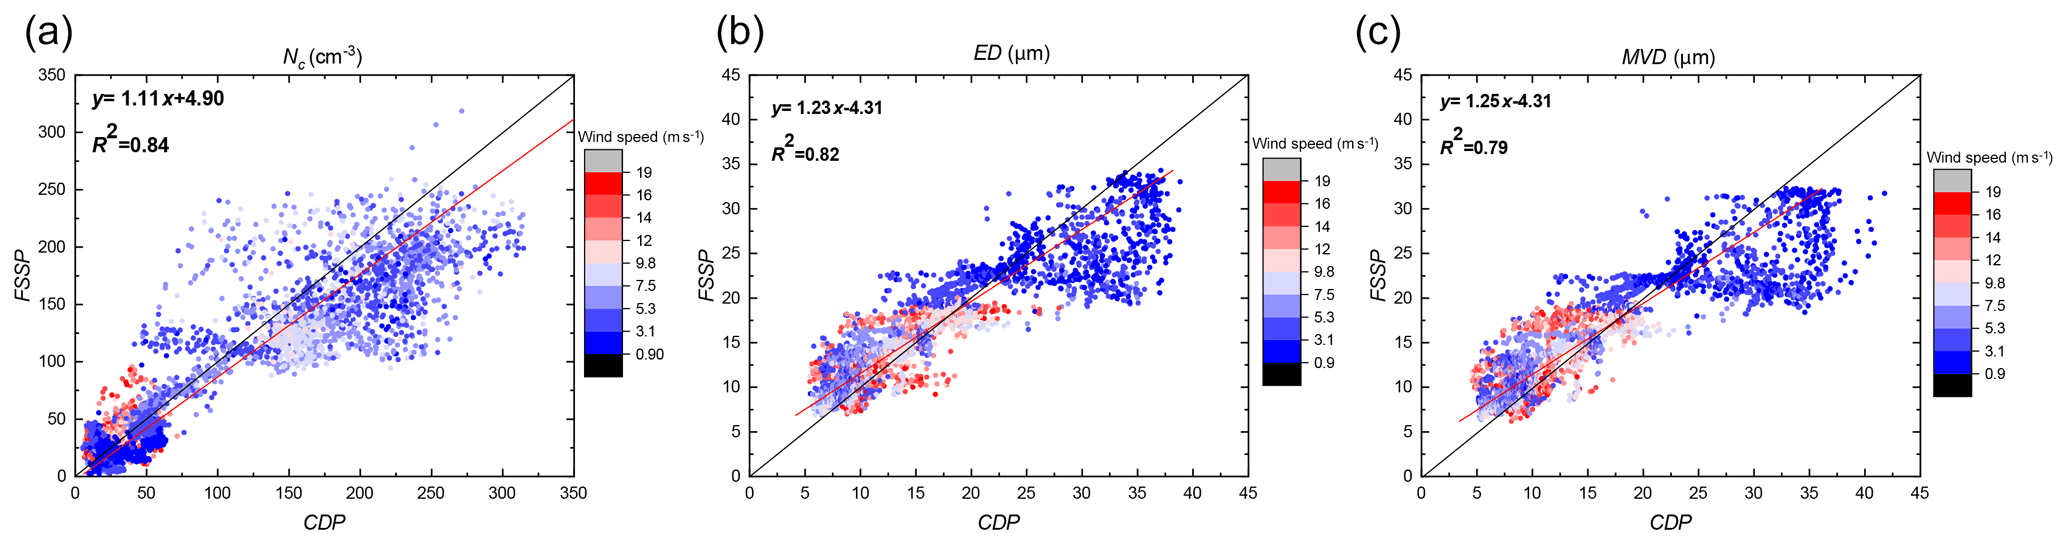
Figure 12Intercomparison of (a) Nc, (b) ED and (c) MVD as it was derived from the CDP and the FSSP is presented for all wind directions. Color code represents the wind speed.
From the intercomparison of the two instruments in each sector of the wind rose, a general benchmarking was created, and it is presented in Fig. 9. According to our results we merged some of the wind sectors that we had initially created. As a result, we now have four sectors representing the wind rose; wind iso-axial conditions (from 200 to 235∘), perpendicular conditions (from 115 to 154 and 296 to 360∘), conditions between iso-axial and perpendicular (from 76 to 114, from 155 to 199 and from 236 to 295∘) and the special case where the brake influenced the performance of FSSP (from 1 to 74∘). To summarize our results, we should highlight that the best agreement between the two cloud spectrometers was obtained in wind iso-axial conditions (from 200 to 235∘, R2=0.60), and it covered a cleaned data set of ∼66 observation hours. The effect of wind direction on the CAS probe's ability to measure Nc was immediately noticed when the wind direction was out of the range of the wind iso-axial conditions. The agreement became slightly worst when the spectrometers were facing conditions in which the wind direction was between iso-axial and perpendicular ( for 76 to 114, 155 to 199 and 236 to 295∘, respectively; ∼50 % of total cleaned data set). The CAS probe performed the worst when the wind direction was perpendicular to the CAS installed direction (R2=0.32 and 0.11 for 115 to 154 and 296 to 360∘, respectively) and represents ∼40 observation hours. Guyot et al. (2015) performed a similar experiment to investigate the sensitivity of the FSSP to meteorological parameters. Even though we conducted the measurements at different temperatures (in Puy-de-Dôme they sampled clouds only above zero), we found that our results were related. The main reason that caused the discrepancies (mainly in deriving Nc and LWC) to the fixed-direction cloud spectrometer ground setups (Pallas – CAPS; Puy-de-Dôme – FSSP) was the wind direction. The strong sensitivity to the wind direction suggested that the cloud spectrometers were sampling anisokinetically in both cases.
3.4 Intercomparison of CAS and FSSP – derived parameters LWC, ED and MVD
In this section, we focus on investigating the derived parameters LWC, ED and MVD. First, a comparison of the LWC for the two probes CAS and FSSP is presented. We only present measurements that were performed in wind iso-axial conditions, since the LWC was very sensitive to both changes in droplet Nc and changes in the shape of the number size distribution. The discrepancies we observed in droplet Nc in sectors outside the wind iso-axial conditions caused a significant difference in total LWC at least by a factor of 5 or even more. We also noticed differences by a factor of 15 especially when the wind direction was perpendicular to the CAS fixed direction. Figure 10a shows that the agreement in LWC (R2=0.34 and slope 0.53) between CAS and FSSP in iso-axial conditions was found to be worse than agreement between both probes in Nc. After investigating how different meteorological parameters contribute to apparent biases in more detail, we found that temperature was the main and only factor that affected the instruments' ability to derive LWC. Accordingly, we divided our measurements into two temperature data sets: measurements with a temperature range from −11.1 to −4 and from −3.9 to −1.4 ∘C. Figure 10b presents the agreement for the first set of measurements: temperatures below −4 ∘C. Excluding the warmer temperature range, we obtained better agreement between the probes (R2=0.78 and slope 0.82). On other hand, the second set of temperatures (from −3.9 to −1.4 ∘C) indicated that the two probes significantly disagreed (R2=0.02 and slope 0.07). As we already explained in Sect. 3.3, there was a slight shift in FSSP sizing towards bigger sizes, about 1.5 µm in size range from 7 to 10 µm. However, when the correction to FSSP sizing was applied, the resulting change in LWC was found to be marginal (about 0.7 %).
Our main conclusion regarding the derived LWC was that the main factor affecting LWC, values was the actual difference in the counts in each bin, especially when referring to larger droplets. Taking into account these limitations and biases in deriving LWC, our final proposal is to use only LWC values from wind iso-axial conditions. In addition, the critical parameter should be the temperature of the cloud. This suggests that only derived LWC values for temperatures below −4 ∘ C will be regarded as acceptable and will be used for further analysis of this data set. However, even when we consider the best agreement, the maximum difference in obtained LWC between CAS and FSSP could still be about 40 %. In addition, we suggest the deployment of another LWC sensor, e.g., the particle volume monitor (PVM-100; Gerber, 1999), during future campaigns in order to obtain another reference LWC value for intercomparison in a wide temperature range. In addition, we are continuously pursuing the development of a new generation of counters designed for ground-based in situ cloud measurements. Thus, it is a matter of future deployment during upcoming PaCE campaigns.
The final step to complete the intercomparison between the CAS probe and the FSSP was to investigate their ability to derive two sizing parameters: the ED and the MVD. Both of them are significant to identify and evaluate the sizing performance of the cloud spectrometers (e.g., Stephens, 1978; Slingo and Schencker, 1982; Korolev, 1999; Mitchell et al., 2011). The cleaned data set obtained from the whole wind spectrum plotted in a different color scale for wind directions, temperature and wind speed is presented in Fig. 11a, b and c for ED and in Fig. 11 d, e and f for MVD. The observations when the FSSP did not operate properly due to the installation of the brake were excluded from the intercomparison. The agreement for both sizing parameters was found to be good (R2=0.80, slope 0.79 and R2=0.78, slope 0.75, respectively). The best agreement was observed when the wind direction (see Fig. 13a, d) was inside the range of iso-axial conditions where all the points were focused along the 1:1 line. When the direction was perpendicular the points were spread wider (maximum observed difference between the two probes was about 20 %). Surprisingly, despite the fact that CAS was measuring lower Nc even by a factor of 10 when the wind direction was perpendicular to the CAS fixed direction, the derived ED and MVD were not significantly influenced. Both sizing parameters were derived from the measured size distribution as described in Sect. 2.3. We found that even if a significant number of cloud droplets was lost due to inertia, the shape and the position of the peak of the size distribution measured by CAS remained similar. This behavior was found to be the same through the whole available cleaned data set (∼183 h) with the maximum ED and MVD of 35 and 30 µm. It has to be pointed out that this behavior might be exclusive for sub-Arctic conditions with generally small cloud droplets. This fact allows us to use the majority of the data set when investigating these two derived sizing parameters. As a result, it creates a significant and usable data set without the need to disqualify data according to a particular wind direction. Thus we obtain statistically significant size properties of the cloud droplets in a wide range of meteorological conditions. We also investigated the probability that wind speed will affect the sizing parameters (see Fig. 11c, f). When the probes were facing high wind speed, ED and MVD were slightly influenced (FSSP derived bigger values of ED and MVD when compared to CAS). On the other hand, while they were facing low wind speeds, sizing was again influenced in the opposite way (FSSP derived smaller values when compared to CAS). This could happen due to the isokinetic motion of the particles. The larger particles could not enter the FSSP because the inner diameter necking on the inlet was changing from 3.8 to 2.0 cm. Finally, Fig. 11b and d indicate that at lower temperatures we observed smaller ED and MVD values.
Table 2The table presents the final recommendations for data analysis regarding the cloud spectrometers ground-based setups for future campaigns in sub-Arctic conditions with frequently occurring supercooled clouds.

According to previous analysis, our main conclusion was that even if there were slight biases and uncertainties, the agreement in intercomparison was considered good as both R2 and slope were higher than 0.75. As a result, we propose that when deriving the sizing parameters, ED and MVD, all measurements can be used for further research after carefully excluding the FSSP data set that was obtained from the wind rose sector where the brake influenced its performance.
3.5 Evaluation of the CDP during PaCE 2013
After comparing and analyzing discrepancies and biases between the CAS and the FSSP cloud probes, we discuss the performance of the CDP cloud probe separately. To evaluate CDP performance we used only FSSP data. We should remember that during the period that both the CDP and the CAS probe were on site (from 15 October to 27 November), the CDP encountered several malfunctions and operational problems during icy conditions. As a result, there was a lack of common data between the CDP and the CAS probe.
We used CDP and FSSP data from 25 September to 14 October (∼70 h of cleaned data set) since it was the only period that the CDP faced fewer operational problems since average ambient temperatures were mostly above 0 ∘C. During this intercomparison, a set of data from the FSSP was removed (0 to 74∘, where the FSSP had significant malfunctions due to the installation of the brake). For this time period, average temperature at the station was 1.7 (SD 1.6) ∘C and the averaged wind speed was 6.9 (SD 3.6) m s−1. In order to compare similar size ranges for both cloud probes, the first two bins from the FSSP were removed. This means that the following results depict the size range from 3.5 to 47 µm for the FSSP and from 3 to 50 µm for the CDP probe.
As was already mentioned at the beginning of Sect. 3.2 these two instruments belong to the sub-category of the probes that were installed on a rotating platform during PaCE 2013. Figure 12a shows, as was expected, that the ability of the two instruments to derive Nc was good (R2=0.84, slope 1.11). However, there were cases where the difference between them was about 30 %. Additionally, we investigated the derived sizing parameters ED and MVD; see Fig. 12b and c. In a range of temperatures (from −3.9 to 3.8 ∘C) and wind speeds (0.9 to 19 ms−1) agreement corresponding to the sizing parameters was good (R2=0.82 and 0.79 with slopes 1.23 and 1.25 for ED and MVD, respectively). However, when FSSP derived ED and MVD for sizes larger than 22.5 µm, we could see a difference that could even be 15 µm smaller in comparison with CDP. This difference was noticed especially when the wind speeds were low. FSSP had similar behavior (Sect. 3.4) when we were comparing CAS and FSSP due to the isokinetic motion of the particles.
A significant limitation in derived LWC regarding temperature has already been discussed above during the comparison of CAS and FSSP. In this case, the temperature ranged from −3.9 to 3.8 ∘C. This range that was above −4 ∘C (the temperature point that was set in Sect. 3.4). As a result, the comparison of CDP- with FSSP-derived LWC did not lead to reasonable correlation, and no LWC data are presented here.
In summary, the CDP was operating well in warm liquid clouds and had good agreement in cloud droplet counts and the sizing derived parameters with FSSP. On the other hand, while we faced sub-zero conditions, the CDP operation was regarded as problematic. Its probe inlet often became clogged because of supercooled cloud drop accumulation. This happened to both the rotation and inhalation system because the probe's big surfaces were collecting ice, and it had a small opening for the inhalation system. In conclusion, even though this CDP setup performed well in warm cloud conditions, it is not a suitable instrument for semi-long-term ground-based measurement of clouds in sub-Arctic conditions when we are facing sub-zero conditions.
We conducted ground-based in situ cloud measurements during PaCE 2013 from 14 September until 28 November. We deployed three cloud spectrometer setups (CAS, FSSP and CDP) on the roof of Sammaltunturi station, located in the Finnish sub-Arctic. The obtained data set was analyzed in detail to evaluate the instruments' ground-based setups' performance and to establish limitations for future studies. All cloud spectrometers and their setups are owned by FMI and results could be used in campaigns with similar meteorological conditions: sub-Arctic conditions with frequently occurring supercooled clouds. Although there is a possibility that we sampled ice particles in some cases, it is expected that the number of supercooled liquid droplets greatly exceeds the number of small ice cloud droplets. The CAS was installed and fixed against the main wind direction of the station (∼225∘), and the other two probes (FSSP and CDP) were installed on rotating platforms. Each probe had its own inhalation system. Their ability to measure the size distribution of cloud droplets along with the derived Nc, the sizing parameters (ED and MVD) and the LWC was tested and the above parameters were mutually compared. In this work, CAS and FSSP ground setups were investigated first because their parallel data coverage was the best (∼243 h of common cleaned data set). On the other hand, CDP had a low common data set with the CAS. The reason for this was that from the date that the CAS was installed we were mainly facing sub-zero temperatures, conditions that proved not to be favorable for this CDP ground setup.
To estimate the droplet counting performance and possible droplets losses, we used Nc. Results indicated that when we were deriving Nc, the mutual direction of probe heading and the wind direction played the most significant role. From the intercomparison of the CAS (fixed orientation) with FSSP (rotating platform), it was found that the CAS probe had the best agreement (R2=0.70) with the FSSP during wind iso-axial conditions (200 to 235∘). The CAS probe counting efficiency was strongly dependent on the wind direction; this can be clearly explained by its installation with a fixed orientation. When the station was inside warm clouds, both the CDP and the FSSP had good agreement (R2=0.82) as they were both operating on rotating platforms.
The LWC was found to be the most sensitive derived parameter. This is because LWC strongly depends both on size and the number of droplets in each size bin. Thus, the wind direction played the most significant role again. For that reason, we strongly recommend that only CAS- and FSSP-derived LWC values from wind iso-axial conditions should be used. Additionally, LWC values were also found to be temperature dependent. For temperatures lower than −4 ∘C the agreement between the CAS and the FSSP in wind iso-axial conditions was high (R2=0.62), and that is why temperature −4 ∘C was adopted as the critical temperature point regarding LWC estimation. We excluded all LWC values derived from the CDP due to its problematic operation at sub-zero conditions; i.e., close to a temperature of −4 ∘C, CDP was usually frozen. The CDP probe often accumulated ice in sub-zero condition, both in its rotational platform and inhalation system. This was happening due to the presence of supercooled clouds at the station. The big surfaces of the CDP's rotation platform and the inlet with a small opening collected ice very fast.
The analysis of the derived sizing parameters, ED and MVD, showed good agreement among the three probes during the time they were operating properly. However, our conclusions here concentrate only on CAS and FSSP because only these two instruments operated properly in sub-zero temperatures, temperatures that we usually face during PaCE. The obtained intercomparison results were surprisingly good even though CAS lost a significant amount of cloud droplets due to its orientation. The wind direction did not significantly affect the ED values or the MVD, even though large discrepancies (uncertainty ∼85 %) in Nc outside of the wind iso-axial conditions could be found (e.g., when the wind direction was perpendicular to the CAS probe fixed direction, uncertainty for sizing parameters was ∼20 %). The ED and MVD were not affected because the shape and the peak position of the CAS size droplet distribution did not change significantly. Such behavior held through ∼183 h of data set. This result is important as it allows us to use a larger data set without limitations due to wind direction and other meteorological parameters regarding derived ED and MVD. The small differences (about 2 µm) were explained by a closer look at the size distribution of each spectrometer and the differences in sizing during operation in real conditions as they were mentioned above.
At the time of PaCE 2013, the market did not offer any instrumentation fulfilling our requirements on continuous long-term unattended operation at sub-zero conditions. As final suggestions regarding performing continuous ground-based in situ cloud measurements in harsh environments, we would like to highlight two major issues. First, the cloud probes should always continuously face the wind direction to minimize the sampling losses. If this is not ensured, only the measurements that are conducted in wind iso-axial conditions can be used for further analysis. However, deriving the sizing parameters ED and MVD for the whole wind direction spectrum is still possible, but it must be done with insight and prudence. Secondly, deicing features of the ground setups should be upgraded to make possible their long-term unattended operation in sub-zero conditions. Otherwise, the cloud probes need necessary daily or more frequent checkups and cleaning of their inlets. Our final recommendations and our view on the main limitations of each spectrometer ground setup for using and analyzing the obtained data sets during sub-Arctic meteorological conditions with frequently occurring supercooled clouds (including future PaCE campaigns) are summarized and presented in Table 2.
The cloud probes and meteorological data used here are available upon request to the corresponding author (konstantinos.doulgeris@fmi.fi).
The supplement related to this article is available online at: https://doi.org/10.5194/amt-13-5129-2020-supplement.
K-MD and DB wrote the paper with contributions from all co-authors. K-MD prepared the paper and analyzed data from all cloud probes and meteorological data with contributions from DB. DB installed and operated all the instruments during PACE 2013. MK and SR provided the CDP ground setup and performed its calibration.
The authors declare that they have no conflict of interest.
This work was supported by the Koneen Säätiö, NordForsk; the CRAICC Amendment on CRAICC-PEEX Collaboration, the Academy of Finland; the Academy of Finland Center of Excellence program; the Natural Environment Research Council (NERC). This project has received funding from the European Union, Seventh Framework Programme (BACCHUS) and H2020 research and innovation program (ACTRIS-2, the European Research Infrastructure for the observation of Aerosol, Clouds, and Trace gases).
This research has been supported by the Koneen Säätiö (grant no. 46-6817), the NordForsk (grant no. 26060), the Academy of Finland (grant no. 269095), the Academy of Finland Center of Excellence program (grant no. 307331) the Natural Environment Research Council (grant no. NE-L011514-1), and the European Union's H2020 research and innovation programme (ACTRIS-2 (grant agreement no. 654109)) and Seventh Framework Programme (FP7/2007–2013) (BACCHUS (grant no. 603445)).
This paper was edited by Alexander Kokhanovsky and reviewed by Darrel Baumgardner and two anonymous referees.
Albrecht, B. A.: Aerosols, cloud microphysics, and fractional cloudiness, Science, 245, 1227–1230, 1989.
Anttila, T., Vaattovaara, P., Komppula, M., Hyvärinen, A.-P., Lihavainen, H., Kerminen, V.-M., and Laaksonen, A.: Size-dependent activation of aerosols into cloud droplets at a subarctic background site during the second Pallas Cloud Experiment (2nd PaCE): method development and data evaluation, Atmos. Chem. Phys., 9, 4841–4854, https://doi.org/10.5194/acp-9-4841-2009, 2009.
Anttila, T., Brus, D., Jaatinen, A., Hyvärinen, A.-P., Kivekäs, N., Romakkaniemi, S., Komppula, M., and Lihavainen, H.: Relationships between particles, cloud condensation nuclei and cloud droplet activation during the third Pallas Cloud Experiment, Atmos. Chem. Phys., 12, 11435–11450, https://doi.org/10.5194/acp-12-11435-2012, 2012.
Baumgardner, D.: An analysis and comparison of five water droplet measuring instruments, J. Appl. Meteorol., 22, 891–910, https://doi.org/10.1175/1520-0450(1983)022<0891:AAACOF>2.0.CO;2, 1983.
Baumgardner, D. and Spowart, M.: Evaluation of the Forward Scattering Spectrometer Probe. Part III: Time Response and Laser Imhomogeneity Limitations, J. Atmos. Ocean. Technol., 7, 666–672, https://doi.org/10.1175/1520-0426(1990)007<0666:EOTFSS>2.0.CO;2 1990.
Baumgardner, D., Strapp, W., and Dye, J. E.: Evaluation of the Forward Scattering Spectrometer Probe – Part II: Corrections for coincidence and dead-time losses, J. Atmos. Ocean. Technol.,2, 626–632, https://doi.org/10.1175/1520-0426(1985)002<0626:EOTFSS>2.0.CO;2, 1985.
Baumgardner, D., Dye, J. E., and Gandrud, B. W.: Calibration of the forward scattering spectrometer probe used on the ER-2 during the Airborne Antarctic Ozone Experiment, Geophys. Res., 94, 16475–16480, https://doi.org/10.1029/JD094iD14p16475, 1989.
Baumgardner, D., Dye, J. E., Gandrud, B. W., and Knollenberg, R. G.: Interpretation of Measurements Made by the Forward Scattering Spectrometer Probe (FSSP-300) During the Airborne Arctic Stratospheric Expedition, J. Geophys. Res., 97, 8035–8046, https://doi.org/10.1029/91JD02728, 1992.
Baumgardner, D., Jonsson, H., Dawson, W., O'Connor D., and Newton R.: The cloud, aerosol and precipitation spectrometer (CAPS): A new instrument for cloud investigations, Atmos. Res., 59–60, 251-2-64, https://doi.org/10.1016/S0169-8095(01)00119-3, 2001.
Baumgardner, D., Brenguier, J., Bucholtz, A., Coe, H., DeMott, P., Garrett, T., Gayet, J., Hermann, M., Heymsfield, A., Korolev, A., Kramer, M., Petzold, A., Strapp, W., Pilewskie, P., Taylor, J., Twohy, C., Wendisch, M., Bachalo, W., and Chuang, P.: Airborne instruments to measure atmospheric aerosol particles, clouds and radiation: A cook's tour of mature and emerging technology, Atmos. Res., 102, 10–29, https://doi.org/10.1016/j.atmosres.2011.06.021, 2011.
Baumgardner, D., Newton, R., Krämer, M., Meyer, J., Beyer, A., Wendisch, M., and Vochezer, P.: The Cloud Particle Spectrometer with Polarization Detection (CPSPD): A next generation open-path cloud probe for distinguishing liquid cloud droplets from ice crystals, Atmos. Res., 142, 2–14, https://doi.org/10.1016/j.atmosres.2013.12.010, 2014.
Baumgardner, D., Abel, S. J., Axisa, D., Cotton, R., Crosier, J., Field, P., Gurganus, C., Heymsfield, A., Korolev, A., Krämer, M., Lawson, P., McFarquhar, G., Ulanowski, Z., and Um, J.: Cloud Ice Properties: In Situ Measurement Challenges, Meteor. Mon., 58, 9.1–9.23, https://doi.org/10.1175/AMSMONOGRAPHS-D-16-0011.1, 2017.
Beswick, K., Baumgardner, D., Gallagher, M., Volz-Thomas, A., Nedelec, P., Wang, K.-Y., and Lance, S.: The backscatter cloud probe – a compact low-profile autonomous optical spectrometer, Atmos. Meas. Tech., 7, 1443–1457, https://doi.org/10.5194/amt-7-1443-2014, 2014.
Boucher, O., Randall, D., Artaxo, P., Bretherton, C., Feingold, G., Forster, P., Kerminen, V.-M., Kondo, Y., Liao, H., Lohmann, U., Rasch, P., Satheesh, S. K., Sherwood, S., Stevens, B., and Zhang, X. Y.: Clouds and aerosols, in: Climate Change 2013: The Physical Science Basis. Contribution of Working Group I to the Fifth Assessment Report of the Intergovernmental Panel on Climate Change, edited by: Stocker, T. F., Qin, D., Plattner, G.-K., Tignor, M., Allen, S. K., Doschung, J., Nauels, A., Xia, Y., Bex, V., and Midgley, P. M., Cambridge University Press, 571–657, https://doi.org/10.1017/CBO9781107415324.016, 2013.
Brenguier, J. L.: Coincidence and Dead-Time Corrections for Particles Counters. Part II: High Concentration Measurements with an FSSP, J. Atmos. Ocean. Tech., 6, 585–598, https://doi.org/10.1175/1520-0426(1989)006<0585:CADTCF>2.0.CO;2, 1989.
Brenguier, J.-L., Bachalo, W. D., Chuang, P. Y., Esposito, B. M., Fugal, J., Garrett, T., Gayet, J.-F., Gerber, H., Heymsfield, A., Kokhanovsky, A., Korolev, A., Lawson, R. P., Rogers, D. C., Shaw, R. A., Strapp, W., and Wendisch, M.: In Situ Measurements of Cloud and Precipitation Particles, in Airborne Measurements for Environmental Research, in: Methods and Instruments, edited by: Wendisch, M. and Brenguier, J.-L., Wiley VCH Verlag GmbH & Co. KGaA, Weinheim, Germany, 225–301, https://doi.org/10.1002/9783527653218.ch5, 2013.
Bromwich, D. H., Nicolas, J. P., Hines, K. M., Kay, J. E., Key, E. L., Lazzara, M. A., Lubin, D., McFarqulah, G. M., Gorodetskaya, I. V., Grosvenor, D. P., Lachnan-Cope, T., and Van Lipzig, N. P. M.: Tropospheric clouds in Antarctica, Rev. Geophys., 50, RG1004, https://doi.org/10.1029/2011RG000363, 2012.
Burnet F. and Brenguier, J. L.: Validation of droplet spectra and liquid water content measurements, Phys. Chem. Earth, 24, 249–254, https://doi.org/10.1016/S1464-1909(98)00046-X, 1999.
Burnet F. and Brenguier, J. L.: Comparison between standard and modified Forward Scattering Spectrometer Probes during the Small Cumulus Microphysics Study, J. Atmos. Ocean. Technol., 19, 1516–1531, https://doi.org/10.1175/1520-0426(2002)019<1516:CBSAMF>2.0.CO;2 ,2002.
Coelho, A., Brenguier, J. L., and Perrin, T.: Droplet spectra measurements with the FSSP-100. Part I: Low droplet concentration measurements, J. Atmos. Ocean. Technol., 22, 1749–1756, https://doi.org/10.1175/JTECH1817.1, 2005a.
Coelho, A., Brenguier, J. L., and Perrin, T.: Droplet spectra measurements with the FSSP-100. Part II: Coincidence Effects, J. Atmos. Ocean. Technol., 22, 1749–1756, https://doi.org/10.1175/JTECH1818.1, 2005b.
Collaud Coen, M., Andrews, E., Asmi, A., Baltensperger, U., Bukowiecki, N., Day, D., Fiebig, M., Fjaeraa, A. M., Flentje, H., Hyvärinen, A., Jefferson, A., Jennings, S. G., Kouvarakis, G., Lihavainen, H., Lund Myhre, C., Malm, W. C., Mihapopoulos, N., Molenar, J. V., O'Dowd, C., Ogren, J. A., Schichtel, B. A., Sheridan, P., Virkkula, A., Weingartner, E., Weller, R., and Laj, P.: Aerosol decadal trends – Part 1: In-situ optical measurements at GAW and IMPROVE stations, Atmos. Chem. Phys., 13, 869–894, https://doi.org/10.5194/acp-13-869-2013, 2013.
Droplet Measurement Technologies Manual: CAPS operator manual, DOC-0066 Revision F, DMT, Boulder, Colorado, USA, 2011
Dye, J. E. and Baumgardner, D.: Evaluation of the forward scattering spectrometer probe, I – Electronic and optical studies, J. Atmos. Ocean. Technol., 1, 329–344, https://doi.org/10.1175/1520-0426(1984)001<0329:EOTFSS>2.0.CO;2, 1984.
Eugster, W., Burkard, R., Holwerda, F., Scatena, F., and Bruijnzeel, L.: Characteristics of fog and fogwater fluxes in a Puerto Rican elfin cloud forest, Agr. Forest. Meteorol., 139, 288–306, https://doi.org/10.1016/j.agrformet.2006.07.008, 2006.
Faber, S., French, J. R., and Jackson, R.: Laboratory and in-flight evaluation of measurement uncertainties from a commercial Cloud Droplet Probe (CDP), Atmos. Meas. Tech., 11, 3645–3659, https://doi.org/10.5194/amt-11-3645-2018, 2018.
Febvre, G., Gayet, J.-F., Shcherbakov, V., Gourbeyre, C., and Jourdan, O.: Some effects of ice crystals on the FSSP measurements in mixed phase clouds, Atmos. Chem. Phys., 12, 8963–8977, https://doi.org/10.5194/acp-12-8963-2012, 2012.
Gérard, V., Noziere, B., Fine, L., Ferronato, C., Singh, D., K., Frossard, A., Cohen, R. C. Asmi, E., Lihavainen, H., Kivekäs, N., Aurela, M., Brus, D., Frka, S., and Cvitešić Kušan, A.: Concentrations and Adsorption Isotherms for Amphiphilic Surfactants in PM1 Aerosols from Different Regions of Europe, Environ. Sci. Technol., 53, 12379–12388, https://doi.org/10.1021/acs.est.9b03386, 2019.
Gerber, H., Frick, G., and Rodi, A.: Ground-based FSSP and PVM measurements of liquid water content, J. Atmos. Ocean. Tech., 16, 1143–1149, https://doi.org/10.1175/1520-0426(1999)016<1143:GBFAPM>2.0.CO;2, 1999.
Guyot, G., Gourbeyre, C., Febvre, G., Shcherbakov, V., Burnet, F., Dupont, J.-C., Sellegri, K., and Jourdan, O.: Quantitative evaluation of seven optical sensors for cloud microphysical measurements at the Puy-de-Dôme Observatory, France, Atmos. Meas. Tech., 8, 4347–4367, https://doi.org/10.5194/amt-8-4347-2015, 2015.
Hatakka, J., Aalto, T., Aaltonen, V., Aurela, M., Hakola, H., Komppula, M., Laurila, T., Lihavainen, H., Paatero, J., Salminen, K., and Viisanen Y., Overview of the atmospheric research activities and results at Pallas GAW station, Boreal Environ. Res., 8, 365–384, 2003.
Henning, S., Weingartner, E., Schwikowski, M., Gäggeler, H. W., Gehrig, R., Hinz, K.‐P., Trimborn, A., Spengler, B., and Baltensperger, U: Seasonal variation of water‐soluble ions of the aerosol at the high‐alpine site Jungfraujoch (3580 m asl), J. Geophys. Res., 108, 4030, https://doi.org/10.1029/2002JD002439, 2003.
Heymsfield, A. J., Bansemer, A., Schmitt, C., Twohy, C., and Poellot, M. R.: Effective Ice Particle Densities Derived from Aircraft Data, J. Atmos. Sci., 61, 982–1003, https://doi.org/10.1175/1520-0469(2004)061<0982:EIPDDF>2.0.CO;2, 2004.
Hyvärinen, A.-P., Kolmonen, P., Kerminen, V.-M., Virkkula, A., Leskinen, A., Komppula, M., Hatakka, J., Burkhart, J., Stohl, A., Aalto, P., Kulmala, M., Lehtinen, K. E. J., Viisanen, Y., and Lihavainen, H.: Aerosol black carbon at five background measurement sites over Finland, a gateway to the Arctic, Atmos. Environ., 45, 4042–4050, https://doi.org/10.1016/j.atmosenv.2011.04.026, 2011.
Jaatinen, A., Romakkaniemi, J., Anttila, T., Hyvärinen, A.-P., Hao, L. Q., Kortelainen, A., Miettinen, P., Mikkonen, S., Smith, J. N., Virtanen, A., and Laaksonen, A.: The third Pallas Cloud Experiment: Consistency between the aerosol hygroscopic growth and CCN activity, Boreal Environ. Res., 19, 368–382, 2014.
Johnson, B., Turnbull, K., Brown, P., Burgess, R., Dorsey, J., Baran, A. J., Webster, H., Haywood, J., Cotton, R., Ulanowski, Z., Hesse, E., Woolley, A., and Rosenberg, P.: In situ observations of volcanic ash clouds from the FAAM aircraft during the eruption of Eyjafjallajökull in 2010, J. Geophys. Res.-Atmos., 117, D00U24, https://doi.org/10.1029/2011JD016760, 2012.
Jones, H. M., Haywood, J., Marenco, F., O'Sullivan, D., Meyer, J., Thorpe, R., Gallagher, M. W., Krämer, M., Bower, K. N., Rädel, G., Rap, A., Woolley, A., Forster, P., and Coe, H.: A methodology for in-situ and remote sensing of microphysical and radiative properties of contrails as they evolve into cirrus, Atmos. Chem. Phys., 12, 8157–8175, https://doi.org/10.5194/acp-12-8157-2012, 2012.
Kivekas, N., Kerminen, V.-M., Raatikainen, T., Vaattovaara, P., and Lihavainen, H.: Physical and chemical characteristics of the activating particles during the Second Pallas Cloud Experiment (Second PaCE), Boreal. Environ. Res., 14, 515–526, 2009.
Knollenberg, R. G.: Three new instruments for cloud physics measurements: the 2-D spectrometer probe, the forward scattering spectrometer probe and the active scattering aerosol spectrometer, American Meteorological Society, Int'l Conf. on Cloud Physics, 554–561, 1976.
Knollenberg, R. G.: Techniques for Probing Cloud Microstructure, in: Clouds, Their Formation, Optical Properties and Effects, edited by: Hobbs, P. V. and Deepak, A., Academic Press, New York, NY, USA, 15–92, 1981.
Komppula, M., Lihavainen, H., Kerminen, V.-M., Kulmala, M., and Viisanen, Y.: Measurements of cloud droplet activation of aerosol particles at a clean subarctic background site, J. Geophys. Res., 110, D06204, https://doi.org/10.1029/2004JD005200, 2005.
Komppula, M., Sihto, S.-L., Korhonen, H., Lihavainen, H., Kerminen, V.-M., Kulmala, M., and Viisanen, Y.: New particle formation in air mass transported between two measurement sites in Northern Finland, Atmos. Chem. Phys., 6, 2811–2824, https://doi.org/10.5194/acp-6-2811-2006, 2006.
Korolev, A. V., Strapp, W. J., and Nevzorov, N. A.: In situ measurements of effective diameter and effective droplet number concentration, J. Geophys. Res., 104, 3993–4003, https://doi.org/10.1029/1998JD200071, 1999.
Korolev, A. V., Shashkov, A., and Barker, H.: Calibrations and Performance of the Airborne Cloud Extinction Probe, J. Atmos. Ocean. Technol., 31, 326–345, https://doi.org/10.1175/JTECH-D-13-00020.1, 2014.
Lance, S.: Coincidence Errors in a Cloud Droplet Probe (CDP) and a Cloud and Aerosol Spectrometer (CAS), and the Improved Performance of a Modified CDP, https://doi.org/10.1175/JTECH-D-11-00208.1, 2012.
Lance, S., Brock, C. A., Rogers, D., and Gordon, J. A.: Water droplet calibration of the Cloud Droplet Probe (CDP) and in-flight performance in liquid, ice and mixed-phase clouds during ARCPAC, Atmos. Meas. Tech., 3, 1683–1706, https://doi.org/10.5194/amt-3-1683-2010, 2010.
Lihavainen, H., Kerminen, V.-M., Komppula, M., Hyvärinen, A.-P., Laakia, J., Saarikoski, S., Makkonen, U., Kivekäs, N., Hillamo, R., Kulmala, M., and Viisanen, Y.: Measurements of the relation between aerosol properties and microphysics and chemistry of low-level liquid water clouds in Northern Finland, Atmos. Chem. Phys., 8, 6925–6938, https://doi.org/10.5194/acp-8-6925-2008, 2008.
Lihavainen, H., Kerminen, V.-M., and Remer, L. A.: Aerosol-cloud interaction determined by both in situ and satellite data over a northern high-latitude site, Atmos. Chem. Phys., 10, 10987–10995, https://doi.org/10.5194/acp-10-10987-2010, 2010.
Lihavainen, H., Hyvärinen, A.-P., Asmi, E., Hatakka, J., and Viisanen, Y.: Long term variability of aerosol optical properties in northern Finland, Boreal Environ. Res., 20, 526–541, 2015.
Lloyd, G., Choularton, T. W., Bower, K. N., Gallagher, M. W., Connolly, P. J., Flynn, M., Farrington, R., Crosier, J., Schlenczek, O., Fugal, J., and Henneberger, J.: The origins of ice crystals measured in mixed-phase clouds at the high-alpine site Jungfraujoch, Atmos. Chem. Phys., 15, 12953–12969, https://doi.org/10.5194/acp-15-12953-2015, 2015.
Lowenthal, D. H., Hallar, A. G., David, R. O., McCubbin, I. B., Borys, R. D., and Mace, G. G.: Mixed-phase orographic cloud microphysics during StormVEx and IFRACS, Atmos. Chem. Phys., 19, 5387–5401, https://doi.org/10.5194/acp-19-5387-2019, 2019.
Luebke, A. E., Afchine, A., Costa, A., Grooß, J.-U., Meyer, J., Rolf, C., Spelten, N., Avallone, L. M., Baumgardner, D., and Krämer, M.: The origin of midlatitude ice clouds and the resulting influence on their microphysical properties, Atmos. Chem. Phys., 16, 5793–5809, https://doi.org/10.5194/acp-16-5793-2016, 2016.
McFarquhar, G. M., Um, J., Freer, M., Baumgardner, D., Kok, G. L., and Mace, G.: Importance of small ice crystals to cirrus properties: Observations from the Tropical Warm Pool International Cloud Experiment (TWP-ICE), Geophys. Res. Lett., 34, L13803, https://doi.org/10.1029/2007GL029865, 2007.
Mertes, S., Schwarzenböck, A., Laj, P., Wobrock, W., Pichon, J. M., Orsi, G., and Heintzenberg, J.: Changes of cloud microphysical properties during the transition from supercooled to mixed-phase conditions during CIME, Atmos. Res., 58, 267–294, https://doi.org/10.1016/S0169-8095(01)00095-3, 2001
Mie, G.: Beiträge zur Optik trüber Medien, speziell kolloidaler Metallösungen, Ann. Phys.-Berlin, 330, 377–445, 1908.
Mitchell, D. L., Lawson, R. P., and Baker, B.: Understanding effective diameter and its application to terrestrial radiation in ice clouds, Atmos. Chem. Phys., 11, 3417–3429, https://doi.org/10.5194/acp-11-3417-2011, 2011.
Nichman, L., Järvinen, E., Dorsey, J., Connolly, P., Duplissy, J., Fuchs, C., Ignatius, K., Sengupta, K., Stratmann, F., Möhler, O., Schnaiter, M., and Gallagher, M.: Intercomparison study and optical asphericity measurements of small ice particles in the CERN CLOUD experiment, Atmos. Meas. Tech., 10, 3231–3248, https://doi.org/10.5194/amt-10-3231-2017, 2017.
Petäjä, T., O’Connor, E.J, Moisseev, D., Sinclair, V.A., Manninen, A.J., Väänänen, R., Von Lerber, A., Thornton, J.A., Nicoll, K., Petersen, W., Chandrasekar, V., Smith, J.N., Winkler, P.M., Krüger, O., Hakola, H., Timonen, H., Brus, D., Laurila, T., Asmi, E., Riekkola, M.-L., Mona, L., Massoli, P., Engelmann, R., Komppula, M., Wang, J., Kuang, C., Bäck, J., Virtanen, A., Levula, J., Ritsche, M., and Hickmon, N.: BAECC: A Field Campaign to Elucidate the Impact of Biogenic Aerosols on Clouds and Climate. B. Am. Meteorol. Soc., 97, 1909–1928, https://doi.org/10.1175/BAMS-D-14-00199.1, 2016.
Pruppacher, H. R. and Klett, J. D.: Microphysics of Clouds and Precipitation, Kluwer Academic Publishers, Dordrecht, 1997.
Raatikainen, T., Brus, D., Hyvärinen, A.-P., Svensson, J., Asmi, E., and Lihavainen, H.: Black carbon concentrations and mixing state in the Finnish Arctic, Atmos. Chem. Phys., 15, 10057–10070, https://doi.org/10.5194/acp-15-10057-2015, 2015.
Rosenfeld, D. and Ulbrich, C. W.: Cloud Microphysical Properties, Processes, and Rainfall Estimation Opportunities, Meteor. Mon., 30, 237–237, https://doi.org/10.1175/0065-9401(2003)030<0237:CMPPAR>2.0.CO;2, 2003.
Small, J. D., Chuang, P. Y., Feingold, G., and Jiang, H.: Can aerosol decrease cloud lifetime?, Geophys. Res. Lett., 36, L16806, https://doi.org/10.1029/2009GL038888, 2009.
Smith, H., Connolly, P., Baran, A., Hesse, E., Smedley, A., and Webb, A.: Cloud chamber laboratory investigations into scattering properties of hollow ice particles, J. Quant. Spectrosc. Ra. Trans., 157, 106–118, https://doi.org/10.1016/j.jqsrt.2015.02.015, 2015.
Slingo, A. and Schencker, H. M.: On the shortwave radiative properties of stratiform water clouds, Q. J. Roy. Meteorol. Soc., 108, 407–426, https://doi.org/10.1002/qj.49710845607, 1982.
Spiegel, J. K., Zieger, P., Bukowiecki, N., Hammer, E., Weingartner, E., and Eugster, W.: Evaluating the capabilities and uncertainties of droplet measurements for the fog droplet spectrometer (FM-100), Atmos. Meas. Tech., 5, 2237–2260, https://doi.org/10.5194/amt-5-2237-2012, 2012.
Stephens, G. L.: Radiation profiles in extended water clouds, II, Parameterization scheme, J. Atmos. Sci., 35, 2123–2132, https://doi.org/10.1175/1520-0469(1978)035<2123:RPIEWC>2.0.CO;2, 1978.
Voigt, C., Schumann, U., Minikin, A., Abdelmonem, A., Afchine, A., Borrmann, S., Boettcher, M., Buchholz, B., Bugliaro, L., Costa, A., Curtius, J., Dollner, M., Dörnbrack, A., Dreiling, V., Ebert, V., Ehrlich, A., Fix, A., Forster, L., Frank, F., Fütterer, D., Giez, A., Graf, K., Grooß, J.-U., Groß, S., Heimerl, K., Heinold, B., Hüneke, T., Järvinen, E., Jurkat, T., Kaufmann, S., Kenntner, M., Klingebiel, M., Klimach, T., Kohl, R., Krämer, M., Krisna, T. C., Luebke, A., Mayer, B., Mertes, S., Molleker, S., Petzold, A., Pfeilsticker, K., Port, M., Rapp, M., Reutter, P., Rolf, C., Rose, D., Sauer, D., Schäfler, A., Schlage, R., Schnaiter, M., Schneider, J., Spelten, N., Spichtinger, P., Stock, P., Walser, A., Weigel, R., Weinzierl, B., Wendisch, M., Werner, F., Wernli, H., Wirth, M., Zahn, A., Ziereis, H., and Zöger, M.: ML-CIRRUS: The Airborne Experiment on Natural Cirrus and Contrail Cirrus with the High-Altitude Long-Range Research Aircraft HALO, B. Am. Meteorol. Soc., 98, 271–288, https://doi.org/10.1175/bams-d-15-00213.1, 2017.
Wagner, R., Bunz, H., Linke, C., Möhler, O., Naumann, K. H., Saathoff, H., Schnaiter, M., and Schurath, U.: Chamber simulations of cloud chemistry: the AIDA Chamber, in: NATO Adv. Res. Work. Environ. Simul. Chambers Appl. to Atmos. Chem. Process. (2004 Zakopane, Poland), edited by: Barnes, I. and Rudzinski, K. J., Springer, Dordrecht, the Netherlands, 2006.
Wandinger, U., Apituley, A., Blumenstock, T., Bukowiecki, N., Cammas, J.-P., Connolly, P., De Mazière, M., Dils, B., Fiebig, M., Freney, E., Gallagher, M., Godin-Beekmann, S., Goloub, P., Gysel, M., Haeffelin, M., Hase, F., Hermann, M., Herrmann, H., Jokinen, T., Komppula, M., Kubistin, D., Langerock, B., Lihavainen, H., Mihalopoulos, N., Laj, P., Lund Myhre, C., Mahieu, E., Mertes, S., Möhler, O., Mona, L., Nicolae, D., O'Connor, E., Palm, M., Pappalardo, G., Pazmino, A., Petäjä, T., Philippin, S., Plass-Duelmer, C., Pospichal, B., Putaud, J.-P., Reimann, S., Rohrer, F., Russchenberg, H., Sauvage, S., Sellegri, K., Steinbrecher, R., Stratmann, F., Sussmann, R., Van Pinxteren, D., Van Roozendael M., Vigouroux C., Walden C., Wegene R., and Wiedensohler, A.: ACTRIS-PPP Deliverable D5.1: Documentation on technical concepts and requirements for ACTRIS Observational Platforms, available at: https://www.actris.eu/Portals/46/Documentation/ACTRIS PPP/Deliverables/Public/WP5_D5.1_M18.pdf?ver= 2018-06-28-125343-273 (last access: 21 September 2020), 2018.
Wendisch, M.: A quantitative comparison of ground-based FSSP and PVM measurements, J. Atmos. Ocean. Tech., 15, 887–900, https://doi.org/10.1175/1520-0426(1998)015<0887:AQCOGB>2.0.CO;2, 1998.
Wendisch, M., Keil, A., and Korolev, A. V.: FSSP Characterization with Monodisperse Water Droplets, J. Atmos. Ocean. Tech., 13, 1152–1165, https://doi.org/10.1175/1520-0426(1996)013<1152:FCWMWD>2.0.CO;2, 1996.
Wendisch, M., Pöschl, U., Andreae, M. O., Machado, L. A. T., Albrecht, R., Schlager, H., Rosenfeld, D., Martin, S. T., Abdelmonem, A., Afchine, A., Araùjo, A., Artaxo, P., Aufmhoff, H., Barbosa, H. M. J., Borrmann, S., Braga, R., Buchholz, B., Cecchini, M. A., Costa, A., Curtius, J., Dollner, M., Dorf, M., Dreiling, V., Ebert, V., Ehrlich, A., Ewald, F., Fisch, G., Fix, A., Frank, F., Fütterer, D., Heckl, C., Heidelberg, F., Hüneke, T., Jäkel, E., Järvinen, E., Jurkat, T., Kanter, S., Kästner, U., Kenntner, M., Kesselmeier, J., Klimach, T., Knecht, M., Kohl, R., Kölling, T., Krämer, M., Krüger, M., Krisna, T. C., Lavric, J. V., Longo, K., Mahnke, C., Manzi, A. O., Mayer, B., Mertes, S., Minikin, A., Molleker, S., Münch, S., Nillius, B., Pfeilsticker, K., Pöhlker, C., Roiger, A., Rose, D., Rosenow, D., Sauer, D., Schnaiter, M., Schneider, J., Schulz, C., de Souza, R. A. F., Spanu, A., Stock, P., Vila, D., Voigt, C., Walser, A., Walter, D., Weigel, R., Weinzierl, B., Werner, F., Yamasoe, M. A., Ziereis, H., Zinner, T., and Zöger, M.: The ACRIDICON-CHUVA campaign: studying tropical deep convective clouds and precipitation over Amazonia using the new german research aircraft HALO, B. Am. Meteorol. Soc., 97, 1885–1908, https://doi.org/10.1175/BAMS-D-14-00255.1, 2016.