the Creative Commons Attribution 4.0 License.
the Creative Commons Attribution 4.0 License.
 | 02 Oct 2020
Validation of TROPOMI tropospheric NO2 columns using dual-scan multi-axis differential optical absorption spectroscopy (MAX-DOAS) measurements in Uccle, Brussels
Ermioni Dimitropoulou
François Hendrick
Gaia Pinardi
Martina M. Friedrich
Alexis Merlaud
Frederik Tack
Helene De Longueville
Caroline Fayt
Christian Hermans
Quentin Laffineur
Frans Fierens
Michel Van Roozendael
Ground-based multi-axis differential optical absorption spectroscopy (MAX-DOAS) measurements of aerosols and tropospheric nitrogen dioxide (NO2) were carried out in Uccle (50.8∘ N, 4.35∘ E), Brussels, during 1 year from March 2018 until March 2019. The instrument was operated in both the UV and visible wavelength ranges in a dual-scan configuration consisting of two sub-modes: (1) an elevation scan in a fixed viewing azimuthal direction (the so-called main azimuthal direction) pointing to the northeast and (2) an azimuthal scan in a fixed low elevation angle (2∘). By applying a vertical profile inversion algorithm in the main azimuthal direction and a parameterization technique in the other azimuthal directions, near-surface NO2 volume mixing ratios (VMRs) and vertical column densities (VCDs) were retrieved in 10 different azimuthal directions. The dual-scan MAX-DOAS dataset allows for partly resolving the horizontal distribution of NO2 around the measurement site and studying its seasonal variations. Furthermore, we show that measuring the tropospheric NO2 VCDs in different azimuthal directions improves the spatial colocation with measurements from the Sentinel-5 Precursor (S5P), leading to a reduction of the spread in validation results. By using NO2 vertical profile information derived from the MAX-DOAS measurements, we also resolve a systematic underestimation in S5P NO2 data due to the use of inadequate a priori NO2 profile shape data in the satellite retrieval.
- Article
(14667 KB) - Full-text XML
- Companion paper
- BibTeX
- EndNote


Nitrogen oxides (NOx = NO2 + NO) play a critical role in tropospheric chemistry through many gas-phase and multiphase chemical reactions. Tropospheric nitrogen dioxide (NO2) is an important anthropogenic pollutant emitted by combustion processes associated with traffic, industrial activity and domestic heating (Seinfeld and Pandis, 1998). In the boundary layer, its lifetime is short (typically a few hours close to the surface), and therefore concentrations vary rapidly in time and space (Ehhalt et al., 1992). NO2 has a direct health impact and is considered a proxy for air pollution, as its high concentrations are often associated with high concentrations of other pollutants such as tropospheric ozone (O3) and aerosols (Crutzen, 1979). Depending on the NOx, O3 and volatile organic compound (VOC) concentration levels in the troposphere, two regimes can be distinguished: (1) the NOx-limited and (2) the VOC-limited regime. In the NOx-limited regime, an increase in NOx concentrations leads to an O3 increase, while in the VOC-limited (NOx-saturated) regime, the tropospheric O3 increases when the VOC concentration levels increase (Seinfeld and Pandis, 1998). For these reasons, it is essential to monitor the global distribution of NO2 to assess chemistry transport models and to estimate air quality trends over different regions of the world.
For more than 2 decades, satellite nadir measurements of atmospheric backscattered sunlight in the UV–vis range have provided daily global tropospheric column measurements of atmospheric NO2 and a number of other species such as sulfur dioxide (SO2), formaldehyde (HCHO) and glyoxal (CHOCHO). Those observations started in 1995 with the ERS-2 GOME (Global Ozone Monitoring Experiment) instrument (Burrows et al., 1999), followed in chronological order by ENVISAT-SCIAMACHY (SCanning Imaging Absorption spectroMeter for Atmospheric CHartographY) in 2002 (Bovensmann et al., 1999), AURA OMI (Ozone Monitoring Experiment) in 2004 (Levelt et al., 2006), MetOp-A/GOME-2A in 2006, MetOp-B/GOME-2B in 2012 and MetOp-C in 2018 (Munro et al., 2016). It is worth mentioning that the pixel size of those instruments showed a significant reduction from 40×320 km2 for GOME to 13×24 km2 for OMI. More recently, the TROPOspheric Monitoring Instrument (TROPOMI) sensor launched onboard the Sentinel-5p Precursor (S5P) platform in October 2017 reached an even finer resolution of 7×3.5 km2 and further improved to 3.5×5.5 km2 from 6 August 2019 onward. S5P is the first mission of the EU Copernicus Program dedicated to atmospheric measurements with a high spatiotemporal resolution. The improved spatial resolution of TROPOMI offers new opportunities for air quality monitoring compared to previous satellite instruments, but it also introduces additional challenges concerning large data storage, processing capability and the difficulty in validating satellite measurements at high spatial resolution.
For about 2 decades, the multi-axis differential optical absorption spectroscopy (MAX-DOAS) technique (Hönninger et al., 2004) has been widely used for retrieving the vertical and horizontal distribution of trace gases and aerosols in the troposphere (e.g., Sinreich et al., 2005; Ortega et al., 2015). MAX-DOAS instruments perform observations of scattered sunlight in the visible and ultraviolet (UV) spectral ranges at multiple elevation angles towards the horizon, leading to increased sensitivity to absorbers situated close to the surface (Hönninger et al., 2004). NO2, HCHO, CHOCHO, SO2, bromine monoxide (BrO), water vapor (H2O), nitrous acid (HONO) and tropospheric O3 are some of the tropospheric species that can be measured by MAX-DOAS instruments (e.g., Wittrock4 et al., 2004; Pinardi et al., 2008, 2013; Clémer et al., 2010; Hendrick et al., 2014; Irie et al., 2011, 2012; Sinreich et al., 2007; Wagner et al., 2011; Wang et al., 2018). Because of their ability to retrieve vertical column and profile information, MAX-DOAS measurements provide an adequate source of reference data for the validation of satellite nadir trace gas measurements (Irie et al., 2008; Peters et al., 2012; Wang et al., 2017). In the case of NO2, studies published so far (e.g., Celarier et al., 2008; Irie et al., 2012; Kramer et al., 2008; Ma et al., 2013; Pinardi et al., 2020) indicate that satellite sensors tend to underestimate tropospheric NO2 columns, especially over large cities.
The motivation of the present work is to investigate the use of multi-azimuthal MAX-DOAS measurements in Uccle (Belgium) to validate the TROPOMI tropospheric NO2 column observations in urban conditions. This measurement site is located south of Brussels at a distance of around 6 km from the city center and is therefore representative of moderate to high pollution levels at which the NO2 spatial distribution can be highly heterogeneous. One complete year (March 2018–March 2019) of MAX-DOAS measurements is used to quantify the agreement between the two datasets and its seasonal dependence, as well as to investigate to what extent the multi-azimuthal capability of the Uccle instrument can contribute to improving this agreement.
The paper is organized as follows: in Sect. 2, the measurement site and the MAX-DOAS experimental setup are described, followed by the DOAS analysis and the retrieval methodologies applied to the MAX-DOAS observations and their validation. Section 3 focuses on the tropospheric NO2 measurements performed by TROPOMI. Thereafter, in Sect. 4, results are separated into two main parts: the demonstration of the dual-scan MAX-DOAS retrievals and afterwards their use for the TROPOMI/S5P validation. Finally, in Sect. 5, concluding remarks and perspectives are given.
2.1 Measurement site and experimental setup
The MAX-DOAS instrument operated at BIRA-IASB (Koninklijk Belgisch Instituut voor Ruimte-Aeronomie – Institut royal d'Aeronomie Spatiale de Belgique) is an improved version of the system described in Clémer et al. (2010). Developed to contribute to the CINDI-2 intercomparison campaign in Cabauw in September 2016 (Kreher et al., 2020), it was subsequently installed on the rooftop of the Royal Meteorological Institute (RMI) in Uccle (50.8∘ N, 4.34∘ E; 125 m a.s.l.) and, since January 2017, has continuously operated at this location. Uccle is situated to the south of the Brussels-Capital Region, one of the most densely populated areas of Belgium. Frequently, the NO2 concentration monitored by the network of telemetric air quality stations from Bruxelles Environment/Leefmilieu Brussel (https://environnement.brussels/, last access: 15 February 2020) often exceeds the European standard upper limit fixed to 40 and 200 µg m−3 for the NO2 annual and hourly mean concentrations, respectively. For instance, in 2015, the NO2 annual mean concentrations were found to exceed the European standards in narrow busy streets in Brussels, with an annual mean concentration between 42.5 and 52.5 µg m−3 (see https://environnement.brussels/, last access: last access: 15 February 2020). Additionally, as detected by satellite sensors like OMI (Huijnen et al., 2010), NO2 columns over Brussels are among the highest in Europe.
The MAX-DOAS dual-scan instrument is composed of three main parts: (1) an optical head mounted on a sun tracker, (2) a thermoregulated box with two spectrometers (UV and visible) and (3) the acquisition unit. Optical fibers connect the optical head with the two spectrometers.
The optical head is equipped with a filter wheel that allows for switching between skylight and direct sun measurements. The UV optical fiber consists of a 6 m×1000 µm long monofiber attached to a 2 m bundle made of 51 fibers. Likewise, the visible fiber consists of a 6 m×800 µm long monofiber attached to a 2 m bundle of 37 fibers. Both monofibers are placed at the focal point of a telescope lens of 50 mm focal length, resulting in a field of view of 1 and 0.5∘ for the UV and visible channels, respectively. The optical head is also equipped with a digital inclinometer to correct for potential misalignment of the elevation scanner.
Installed indoors, the thermoregulated box is equipped with visible and UV grating spectrometers covering the wavelength ranges of 405 to 540 nm and 300 to 390 nm, respectively. The UV spectrometer is from Newport (model 74086) with a spectral resolution of 0.4 nm. To block the visible light and to reduce the stray light in the UV wavelength region, a band-pass filter (U-340 Hoya) is used. The output of the UV spectrometer is connected to a back-illuminated UV-enhanced charge-coupled device (CCD) detector system (Princeton Instrument Pixis 2K). The visible spectrometer from Horiba (model Micro HR) has a spectral resolution of 0.7 nm and is also mounted on a back-illuminated CCD system (Princeton Instrument Pixis 100). Both CCD detectors are cooled at 223 K (using multistage Peltier system). The overall spectrometric unit is thermally stabilized to better than 1 ∘C.
To control the data acquisition, two computers are used. One records spectra coming from the visible spectrometer and controls the sun tracker, while the second, synchronized with the first one, records the spectra from the UV spectrometer.
In order to measure in dual-scan (elevation + azimuthal) viewing mode, the initial operation mode (elevation scanning in one azimuthal direction) was modified. From March 2018, the instrument was operated in two modes: (1) a vertical scan mode covering nine different elevation angles in one fixed (standard) azimuthal direction (35.5∘ with respect to north in the eastward direction) and (2) a horizontal scan mode covering nine different azimuthal directions at a fixed elevation angle of 2∘ above the horizon (Fig. 1). As can be seen in Table 1 and Fig. 9, several configurations were tested in order to select the best combination of horizontal and vertical viewing directions, which is a trade-off between the acquisition time and the horizontal representativeness. Since the NO2 emission sources are located towards the north, more azimuthal directions are selected in this direction. With an integration time of 60 s for each measured spectrum, the total scan duration (azimuthal + elevation viewing modes) ranges between 20 and 30 min, depending on the configuration. Each azimuthal direction was quality-checked by performing horizon scans as during the CINDI-2 campaign (Donner et al., 2020) in order to ensure that obstacles, like trees and buildings, are not present in the different lines of sight.
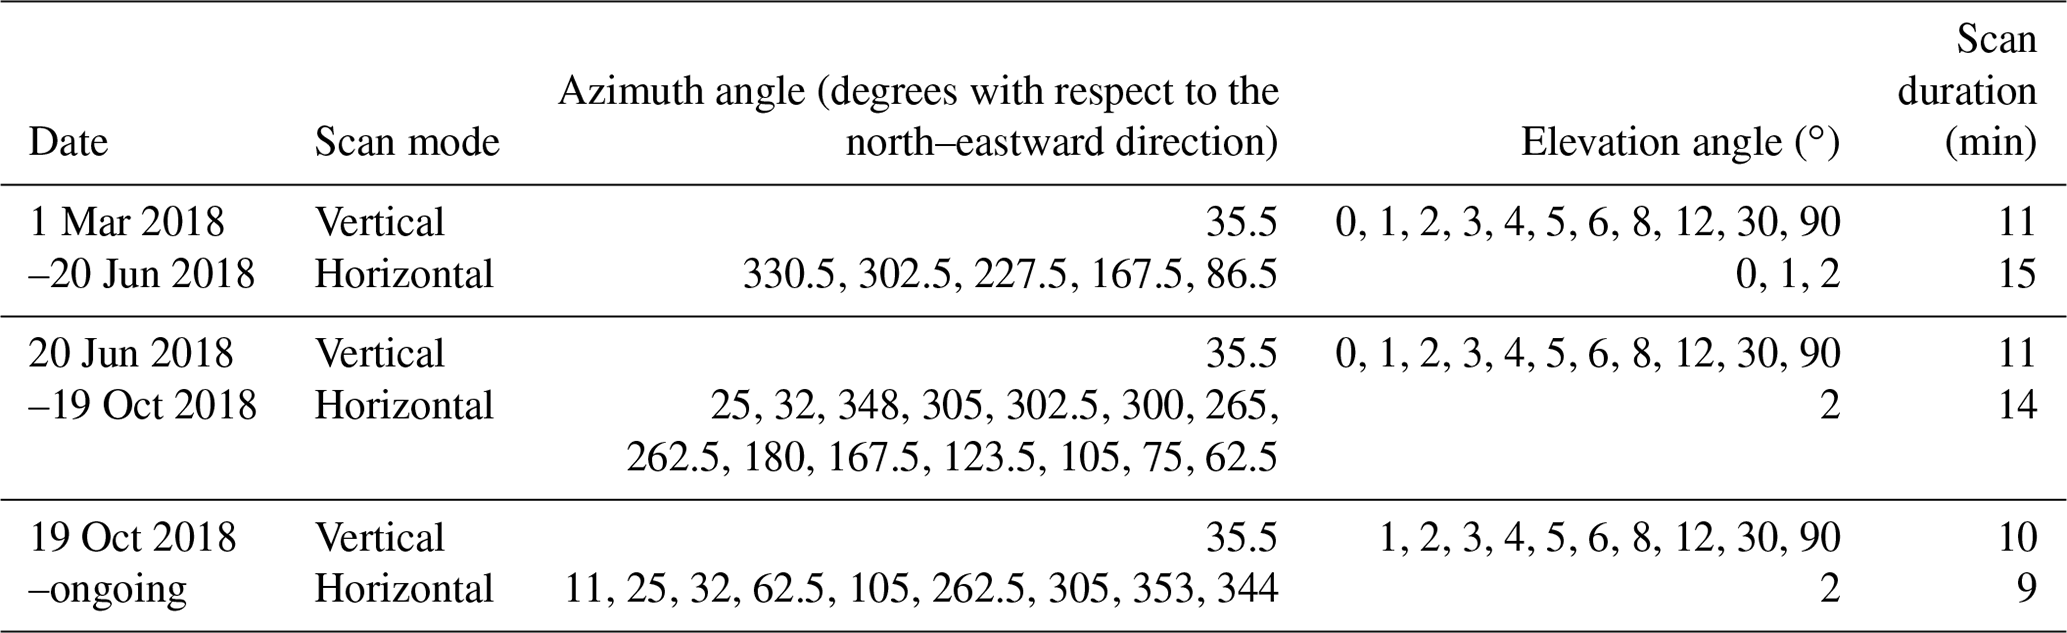
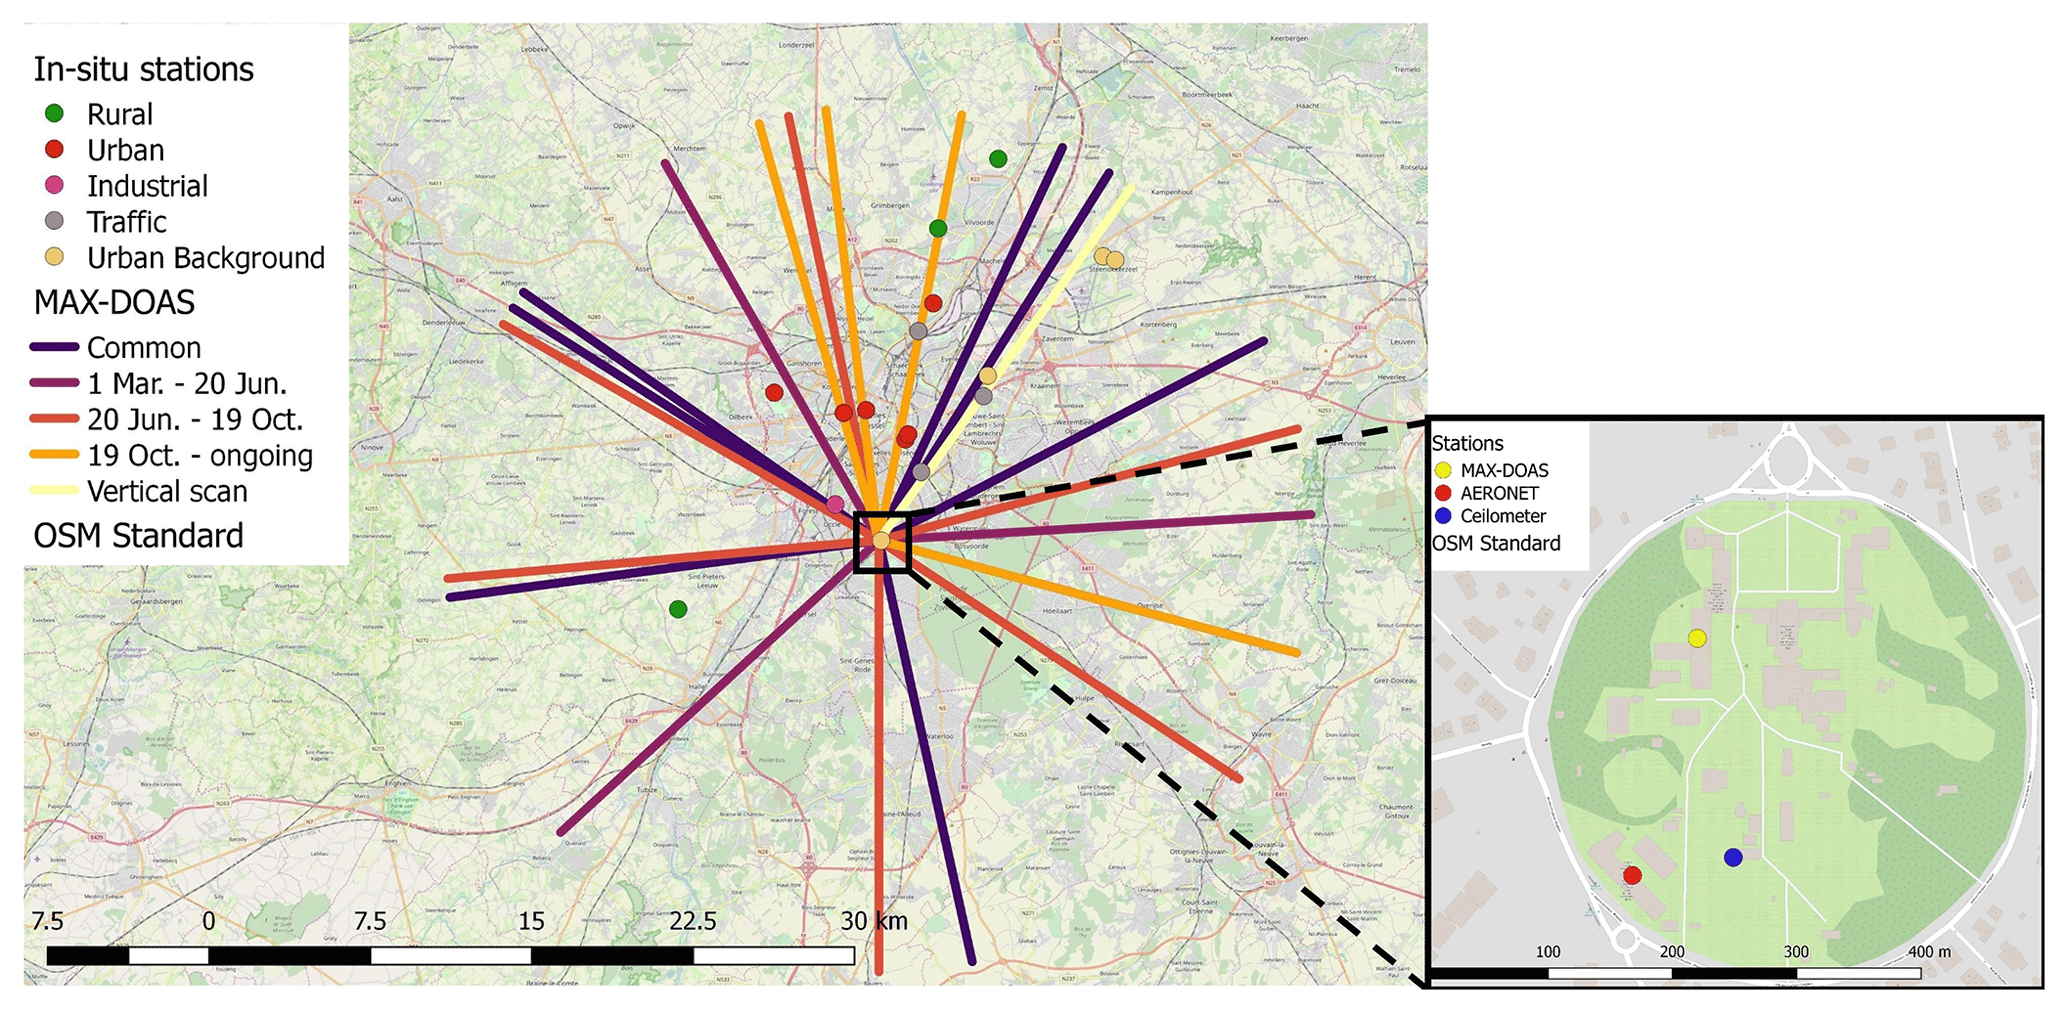
Figure 1The dual-scan experimental setup of the BIRA-IASB MAX-DOAS instrument (overlaid onto the OpenStreetMap (OSM) standard layer) (left panel). The lines are color-coded according to the three different experimental setups (Table 1), with a line length of 20 km each. The colored dots show the different types of in situ stations around the MAX-DOAS instrument (see Sect. 4.2). The right panel shows the location of the MAX-DOAS, AERONET and ceilometer instruments at the measurement site. ©OpenStreetMap contributors 2019. Distributed under a Creative Commons BY-SA License.
2.2 DOAS analysis
The spectra measured in both sub-modes are analyzed using the QDOAS spectral fitting software developed at BIRA-IASB (Fayt et al., 2011) for the retrieval of atmospheric trace gas abundances in the UV, visible and near-infrared spectral ranges. The DOAS technique consists of a separation between narrow absorption features characteristic of molecular species and a spectral background resulting mainly from Mie and Rayleigh scattering as well as instrumental effects (Platt and Stutz, 2008). Its primary product is the differential slant column density (dSCD), which represents the light-path-integrated trace gas concentration in a measured spectrum relative to the amount of the same absorber in a reference spectrum. In the present case, daily noon zenith spectra are used as a reference.
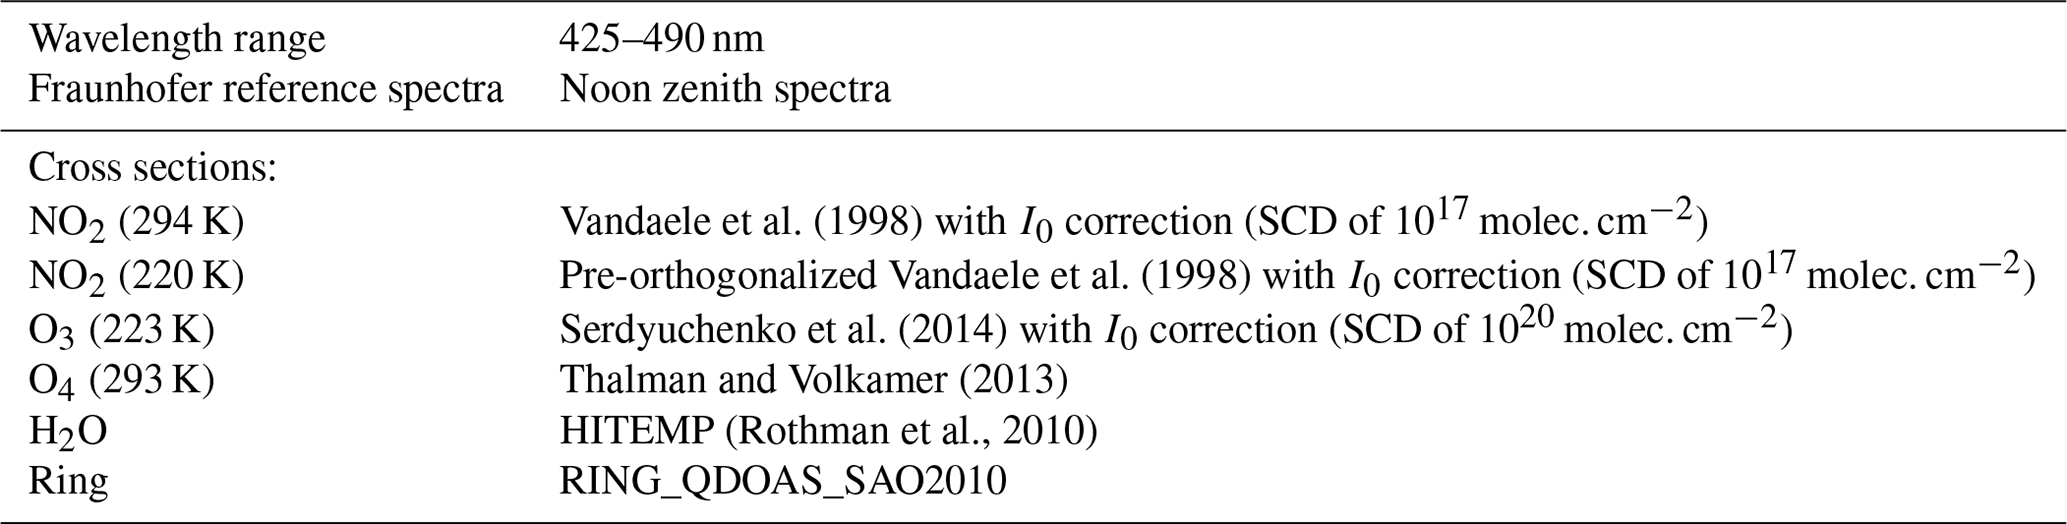
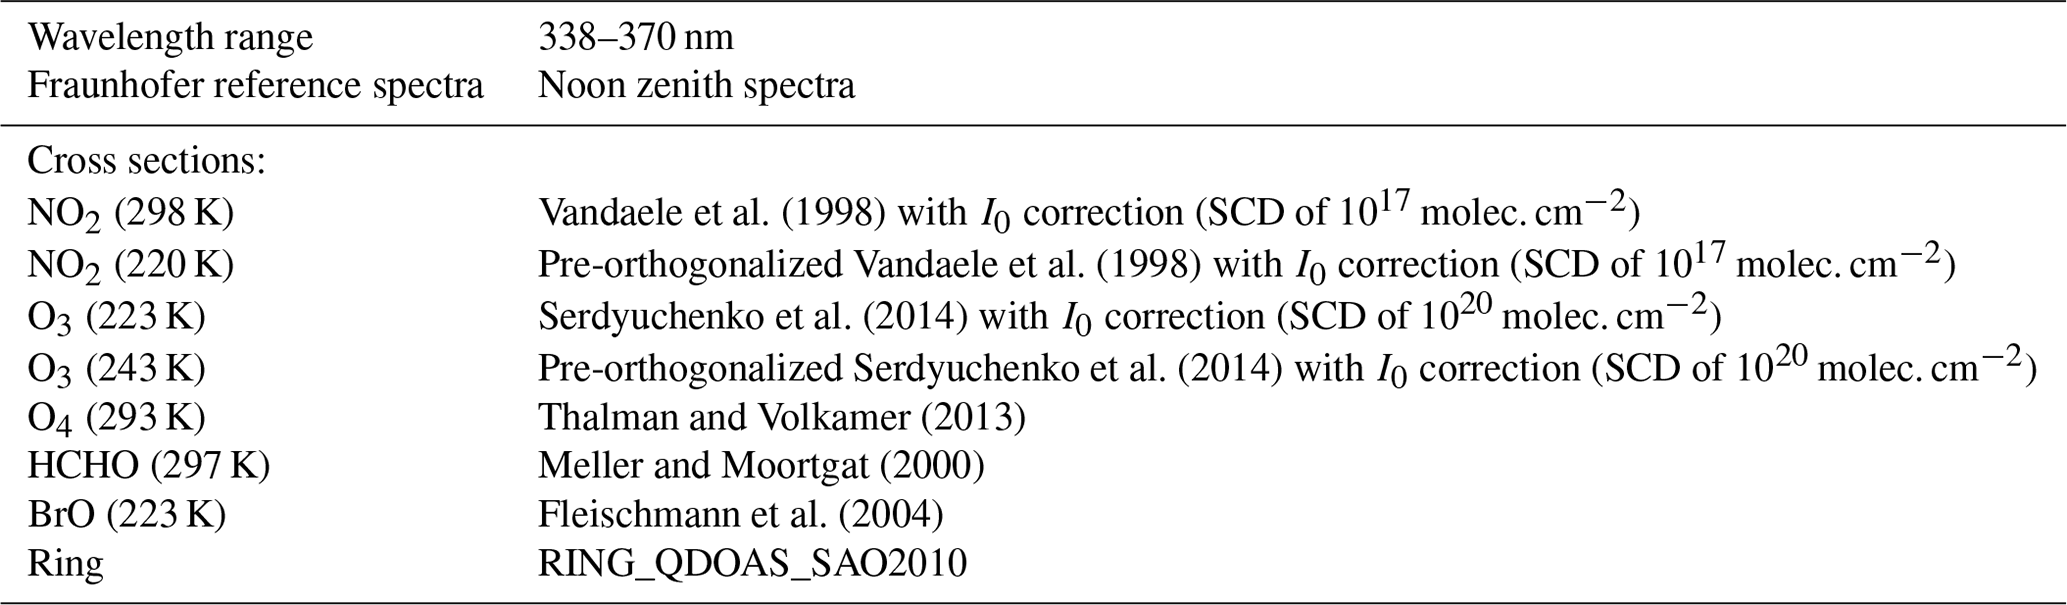
NO2 dSCDs are retrieved in both the visible and UV ranges according to settings defined during the CINDI-2 campaign (see Tables 2 and 3; Kreher et al., 2020). For retrievals in the visible spectral range, we use the 425–490 nm fitting interval, while UV retrievals are performed in the 338–370 nm spectral range.
Table 2DOAS settings for NO2 and O4 in the visible spectral range.
2.3 Aerosol and OEM-based profile retrievals
The aerosol extinction coefficient and NO2 vertical profiles are retrieved for each MAX-DOAS elevation scan in the main azimuthal direction by applying the Mexican MAX-DOAS fit (MMF; Friedrich et al., 2019) inversion algorithm to the corresponding measured O4 and NO2 dSCDs. The inversion is performed in two successive steps. First, an aerosol extinction profile is retrieved using O4 measurements according to the principles described in Frieß et al. (2006). This aerosol profile is then used as an input for the radiative transfer calculations needed to invert the NO2 vertical profile.
The MMF algorithm uses the optimal estimation method (OEM; Rodgers, 2000) formalism, the VLIDORT (Spurr, 2006) version 2.7 radiative transfer model (RTM) as a forward model and a Levenberg–Marquardt (LM) iteration scheme.
MMF works in linear measurement space and logarithmic retrieval space. Further details about this algorithm can be found in Friedrich et al. (2019). MMF was one of the retrieval codes used during the CINDI-2 campaign (Tirpitz et al., 2020), and it also participated in the round-robin comparison of profiling algorithms as part of the fiducial reference measurements for the Ground-Based DOAS Air-Quality Observations (FRM4DOAS) project (Frieß et al., 2019). The main advantages of MMF are (1) the online calculation of Jacobians with operation in a logarithmic state vector space, which prevents unphysical negative partial columns from being retrieved, (2) the use of a stable Levenberg–Marquardt nonlinear iteration scheme (in replacement for a Gauss–Newton scheme) and (3) the fast computing time (5 s per scan for both aerosols and trace gases). A drawback of OEM-based profiling algorithms such as MMF is that a priori profiles should be carefully chosen in order to avoid biases in the retrieved profiles and columns at altitudes characterized by a low information content.
An important parameter in the OEM approach is the a priori profile. In the present study, exponentially decreasing a priori profiles are used for both aerosols and NO2, with a scaling height of 1 km and aerosol optical depth (AOD) and NO2 vertical columns fixed to 0.18 and 9.15×10¹⁵ molec. cm−2, respectively. For the diagonal elements of the a priori covariance matrix, we use 50 % of the a priori profile, with a correlation length of 200 m for the non-diagonal elements (Clémer et al., 2010).
The pressure and temperature profiles are prescribed using 20-year monthly averaged data extracted from the European Centre for Medium-Range Weather Forecasts (ECMWF) ERA-Interim reanalysis (see Beirle et al., 2019) for the location of Uccle. The retrieval altitude grid consists of 20 layers of 200 m thickness between the surface and 4 km of altitude. The surface albedo is set to 0.06 and the aerosol optical properties, such as the single-scattering albedo and the asymmetry parameter, are taken from colocated AERONET measurements. Regarding the retrieval wavelengths, aerosol extinction vertical profiles are retrieved at 360 and 477 nm and the NO2 vertical profiles at 360 and 460 nm.
Each retrieval is quality-checked based on three different criteria. First, the degrees of freedom (DOFs) should be larger than 2. This ensures that the profile information comes mostly from the measurements and not from the a priori profile. Second, the relative root mean square error (RMSE) of the difference between measured and calculated differential slant column densities with respect to the zenith spectrum of each scan should be smaller than 15 %. This excludes local minima. Third, the AODs should be smaller than 5 because of the high profile uncertainties on the trace gas retrieval in such conditions (Hendrick et al., 2014). The abovementioned criteria are applied to the NO2 and aerosol profile retrievals in the visible and UV ranges.
The presence of aerosols and clouds in the atmosphere can strongly affect the MAX-DOAS trace gas retrieval (Frieß et al., 2006; Gielen et al., 2014; Wagner et al., 2004, 2014). In order to exclude MAX-DOAS measurements strongly influenced by the presence of clouds, a cloud-filtering approach is applied using a colocated thermal infrared pyrometer. The pyrometer determines the total cloud-cover fraction based on the temperature data over a field of view of 6∘ (Gillotay et al., 2001). Generally, the method is able to determine most cloudy conditions, with the exception of cirrus clouds. The total cloud-cover fraction is defined as the ratio between the observed cloudy solid angle elements and clear-sky elements. In the present study, only MAX-DOAS scans with a total cloud-cover fraction less than 0.8 (80 %) are selected for further analysis. The application of the abovementioned upper limit allows for the rejection of scans under fully cloudy conditions and does not significantly reduce the total number of accepted MAX-DOAS scans.
The uncertainties of the vertical profiles retrieved by MMF include three types of errors (Rodgers, 2000): (1) the smoothing error, which represents the difference between the retrieved and the true profile due to the vertical smoothing, (2) the noise error, which represents the uncertainty arising from the dSCD measurement, and (3) the error coming from the forward model. In Table 4, an overview of the main error sources for the NO2 near-surface VMR and VCD retrievals is presented. For the visible range, the smoothing error amounts to around 3 % of the NO2 near-surface VMR and 8 % of the VCD, and the noise error is about 2 % of the near-surface VMR and 2 % of the VCD. In the UV range, the smoothing error amounts to around 2 % of the NO2 near-surface VMR and 9 % of the VCD, and the noise error is about 2 % of the near-surface VMR and 3 % of the VCD. Despite the fact that the smoothing error seems to be small, it is the main error source in the profile retrieval (Rodgers, 2000). The use of a constructed covariance matrix results in the underestimation of the smoothing error because daily variations of the a priori profile are not taken into account. The uncertainty associated with the forward model parameters has been estimated by modifying the input parameters, such as the single-scattering albedo and the asymmetry parameter, in the RTM calculations and quantifying the impact on the NO2 near-surface VMR and VCD. For the visible range, it is up to 3 % of the near-surface VMR and 4 % of the VCD, and in the UV range, the corresponding values are 2 % and 1 %, respectively.
Table 4Error budget overview of the MMF-retrieved NO2 VMR and VCD in the visible and UV spectral ranges. The total uncertainty is calculated as the square root of the sum of the squares of the different error sources.
We also consider the systematic uncertainty on the NO2 cross sections at the assumed fixed temperature of 294 K, which is about 3 % (Vandaele et al., 1998). Taking into account the temperature dependence (0.4 % K−1 for the visible fitting window; Takashima et al., 2012) and assuming a mean temperature difference between winter and summer of 23 K, the total systematic error due to NO2 cross sections reaches a maximum of 9 %. Combining all the abovementioned sources of error, the following uncertainties for NO2 retrievals are estimated: 11 % and 13 % on NO2 VMR and VCD in the visible range, respectively, and 10 % and 14 % on NO2 VMR and VCD in the UV, respectively. Another source of uncertainty is estimated by comparing the NO2 near-surface VMR and VCD in the UV and visible wavelength ranges. The uncertainty is up to 15.5 % of the near-surface VMR and 15.4 % of the VCD. This percentage difference is slightly larger than the abovementioned retrieval uncertainties. The main origin of this uncertainty is the different horizontal sensitivity in the UV and visible wavelength ranges and therefore a different air mass sampling.
2.4 Dual-scan MAX-DOAS retrieval strategy
The dual-scan MAX-DOAS retrieval strategy refers to the near-surface NO2 box-averaged VMR in the lowest layer(s) of the mixing layer height (MLH) and VCD retrieval over one complete MAX-DOAS elevation and azimuthal scan by using (1) an OEM-based profile retrieval and (2) a parameterization approach. Both methods are described in Sect. 2.4.1 and 2.4.2 below.
2.4.1 The parameterization method
The parameterization approach used in this study is an adaptation of the one introduced in Sinreich et al. (2013). It consists of a conversion of NO2 dSCDs measured at one low elevation angle (2∘) to near-surface box-averaged mixing ratios.
If sufficient aerosols are present in the lower troposphere (boundary layer), the measured dSCD at two low elevation angles (in the present study, 1 and 2∘) are equal. In this case, the concentration of an absorber close to the surface (e.g., NO2) can be considered the box-averaged near-surface concentration and is related to the dSCD as follows (Sinreich et al., 2013):
where dSCD is the differential slant column density of the absorber (molec. cm−2) and its mean concentration (molec. cm−3) along the differential effective path lengths (dLeff) in centimeters.
The unknown variable in Eq. (1) is the differential effective path length of the measurement. The absorption of the oxygen collisional dimer (O4) can be used as a tracer for the light path distribution (Wagner et al., 2004). The concentration of O4 is proportional to the square of the concentration of molecular oxygen (O2), which can be accurately determined. Variations in the O4 dSCD are therefore directly related to changes in the state of the atmosphere and changes in the measurement geometry.
For each measurement, the differential effective path lengths can be calculated as a ratio of the measured O4 dSCDs to the typical O4 concentration at the altitude of the instrument (instr):
As mentioned above, the profile shape of O4 is an exponentially decreasing profile with altitude. In contrast, the NO2 profile has a different shape, as this trace gas is emitted close to the surface. Therefore, the dLeff (O4) cannot be used directly in Eq. (1) in order to estimate the near-surface NO2 VMR. As indicated by Sinreich et al. (2013), Wang et al. (2014) and Ortega et al. (2015), the direct use of the dLeff derived from O4 measurements introduces systematic errors in the near-surface VMR. In general, if no correction factors are applied, dLeff will be overestimated, leading to an underestimation of the VMR by up to a factor of 3 (Sinreich et al., 2013). In the present study, in which off-axis measurements were performed at 2∘ elevation in an urban polluted environment, the dLeff of NO2 was found to be smaller than the corresponding dLeff_O4 by an average factor of 2 and 1.6 in the visible and UV wavelength ranges, respectively (Fig. 8).
The introduction of a unitless correction factor (fc) accounting for differences between the O4 and NO2 profile shapes is therefore necessary. fc connects the two different dLeff as follows:
Taking this relation into account and combining with Eqs. (1), (2) and (3), the near-surface concentration of NO2 can be expressed as
Previous studies (Ortega et al., 2015; Sinreich et al., 2013; Wang et al., 2014; Seyler et al., 2019) have highlighted the importance of properly estimating the correction factors, especially in polluted conditions such as those observed in Brussels. The NO2 concentration corresponds to the ratio of dSCD to the light path length dLeff (NO2). Assuming that the NO2 vertical distribution can be approximated by a box profile of height equal to MLH, one can also express it as the ratio between the VCD and the MLH:
Combining Eqs. (3) and (5) and expressing the dSCD as the product of the VCD and a differential air mass factor (dAMF), fc becomes
where MLHMAX-DOAS is the mixing layer height of NO2, dAMF and dAMF are the NO2 and O4 differential air mass factors, and VCD is the typical vertical column density of O4 above the instrument. The dAMF of a trace gas expresses the light path enhancement with respect to the vertical path through the atmosphere. The correction factor depends on the aerosol load in the atmosphere, the solar zenith angle (SZA), the relative solar azimuth angle (RSAA), the MLH of the trace gas and the vertical distribution of the aerosols inside the MLH during the measurement.
2.4.2 Dual-scan MAX-DOAS retrieval in Uccle
In this section, the abovementioned parameterization method is applied to our dual-scan MAX-DOAS measurements in Uccle.
To estimate MLH, we use the NO2 vertical profile information derived in the main azimuthal direction. Assuming homogeneous mixing in the mixing layer, MLH is derived from the ratio of VCD to the near-surface concentration of NO2. Moreover, during one MAX-DOAS scan, the vertical extent of the trace gas profile is considered homogeneous around the measurement site, and the MLH values in the main azimuthal direction can also be applied to the other azimuthal directions. Despite its simplicity, this approach provides robust estimates of the MLH, consistent with local ceilometer observations (for more details, see Sect. 24.4). As indicated by Sinreich et al. (2013) and Ortega et al. (2015), the use of realistic MLH daily variation is a crucial element in the parameterization method. Our approach represents an improvement over the more empirical approach used in previous studies.
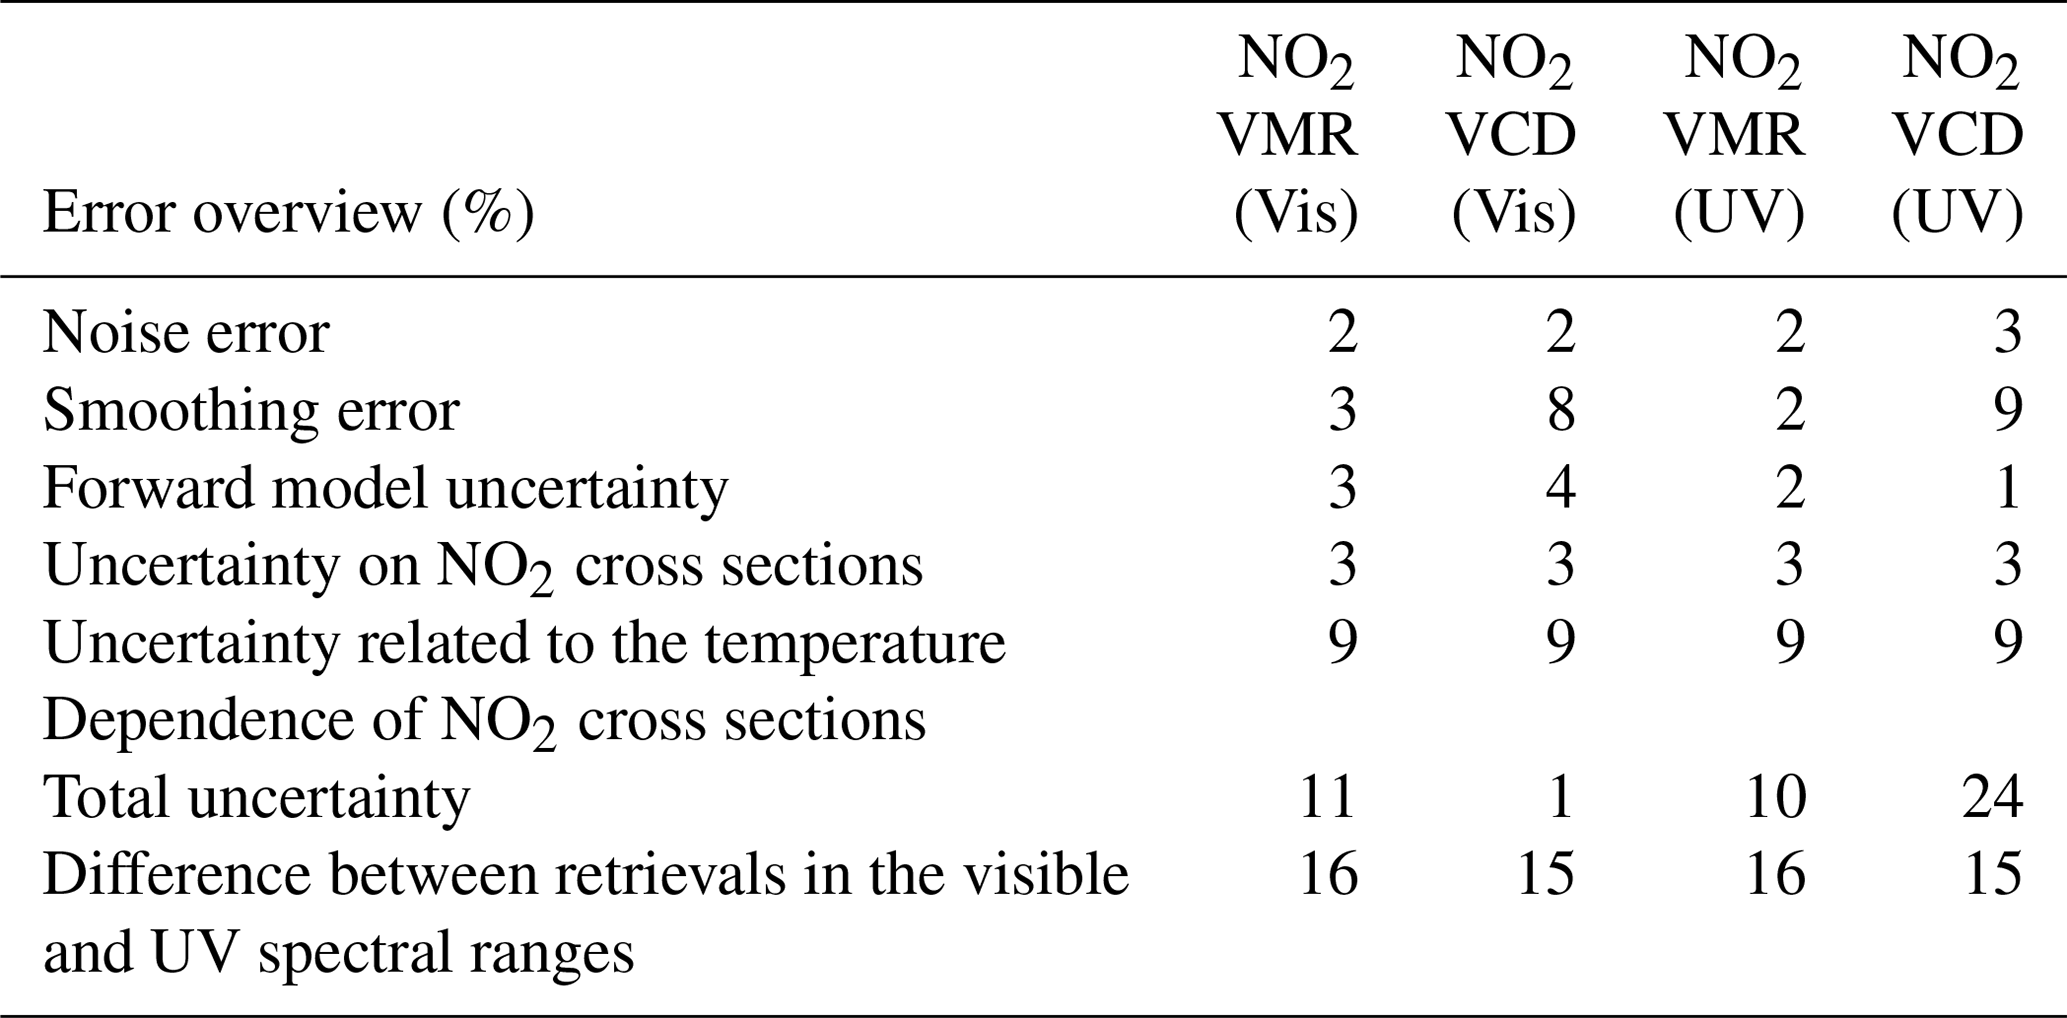
The dAMF depends on the geometry (SZA, RSAA and elevation angle) as well as the aerosol and trace gas concentration profiles. For its calculation, we used VLIDORT (Spurr, 2006) version 2.7. The dAMF of O4 and NO2 was estimated for eight different MLH scenarios (250–2000 m range) and for the visible and UV wavelengths, separately. In these scenarios, the aerosol and NO2 a priori profiles are specified as box profiles with a constant concentration from the surface to the MLH. The AOD varies from 0.30 to 0.60, the asymmetry parameter is set to 0.68 and the SSA to 0.92. The resulting correction factors are represented in Fig. 2a and b as a function of RSAA and for different values of the SZA (for an AOD equal to 0.30). They strongly depend on the RSAA and the MLH. For a low RSAA and a thick MLH fc reaches a maximum, while a minimum is obtained at a high RSAA for a thin MLH. When investigating the dependency of fc on the SZA for different AOD and RSAA values (Fig. 2c, d), we observe that it becomes highly dependent on AOD for a low RSAA and SZA values close to 50–60∘, indicating the limitations of the parameterization technique in those conditions.
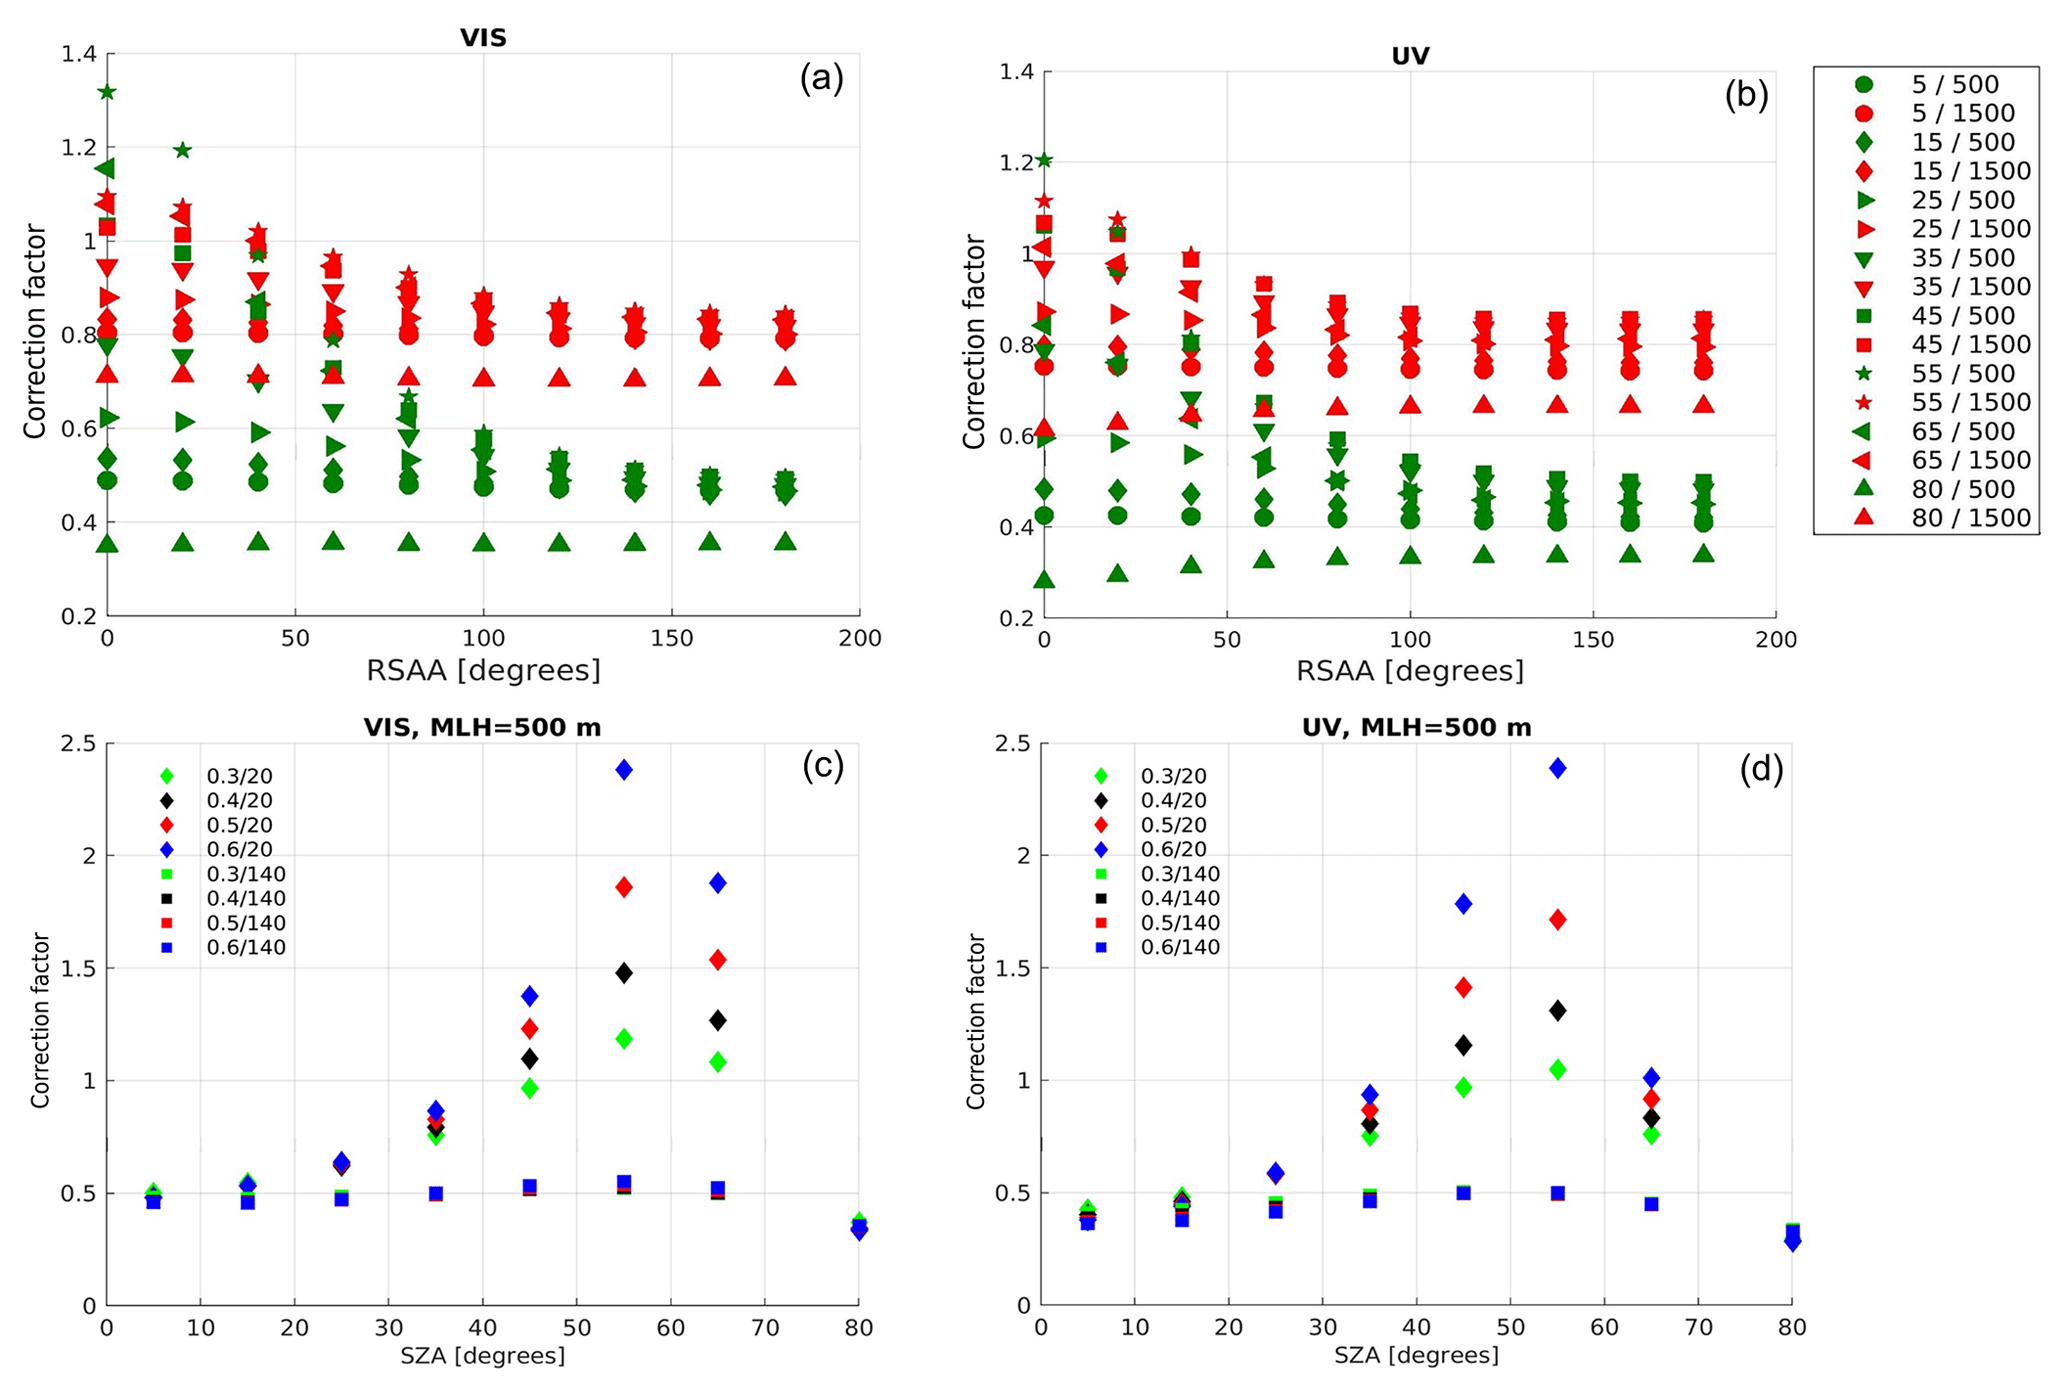
Figure 2Panels (a) and (b) correspond to the correction factors as a function of RSAA for two different MLH values (in every RSAA and MLH value, the different data points correspond to different SZA values) in the visible and UV wavelength ranges. The first value in the list of symbols corresponds to the SZA and the second to the MLH. Panels (c) and (d) show the correction factors as a function of SZA for different AOD scenarios and RSAA values in the visible and UV ranges for an MLH set to 500 m. The first value in the list of symbols corresponds to the AOD and the second to the RSAA.
The correction factor fc provides information about the state of the atmosphere such that each measurement can be classified into one of the following three regimes. For fc equal or close to 1, the effective light paths of O4 and NO2 are similar (Eq. 3), which means that there is a moderate to high aerosol load during the measurement. In contrast, when fc is significantly smaller than 1, the measurement is done under aerosol-free conditions or a thin MLH. Finally, fc can take values larger than 1 for cases of high SZA and low RSAA (Fig. 2), which are special conditions in which the parameterization method becomes highly dependent on the AOD. Such cases are highly uncertain and we excluded them from further analysis.
To estimate fc (Eq. 6) for every MAX-DOAS measurement in the visible and UV wavelengths, O4 and NO2 dAMFs were tabulated for eight different values of MLH (AOD set to 0.3) and for a suitable range of RSAA and SZA values. Using this lookup table, O4 and NO2 dAMFs are interpolated at the SZA, RSAA and MLH of each measurement. The near-surface VMR is then obtained by dividing the concentration of the trace gas (Eq. 4) by the air number density (nair) derived from monthly averaged temperature and pressure profiles extracted from the ERA-Interim reanalysis (see Sect. 2.3.1). The VCD is then estimated from the product of the near-surface concentration with the MLH.
For the analysis, only measurements at SZA smaller than 80∘ were selected. As presented in Sinreich et al. (2013), the method is independent of the actual aerosol load, as long as a sufficient amount of aerosol is present in the troposphere (AOD>0.2). However, it slightly depends on the aerosol layer height. In order to select measurements wherein the near-surface layer can be parameterized as a box profile (i.e., with a homogeneous concentration inside the layer), two conditions should be satisfied. First, the scattering events corresponding to the lowest two elevation angles should occur in a comparable distance; secondly, those scattering events should happen inside the NO2 layer, which can then be considered homogeneous and therefore parameterized as a box profile. In order to ensure that those conditions were satisfied, only scans for which the differences between O4 and NO2 dSCDs in the lowest two elevation angles were smaller than 1044 and 1016 molec. cm−2, respectively, were selected.
Furthermore, when the O4 dSCD, and consequently the dLeff (O4), is negative or too small because of bad weather conditions, the VMR can become close to zero or negative (unphysical). In consequence, measurements with a value of dLeff (NO2) smaller than 5 km (for both visible and UV) are excluded from the study. An upper limit of 30 km is also adopted to exclude numerical outliers.
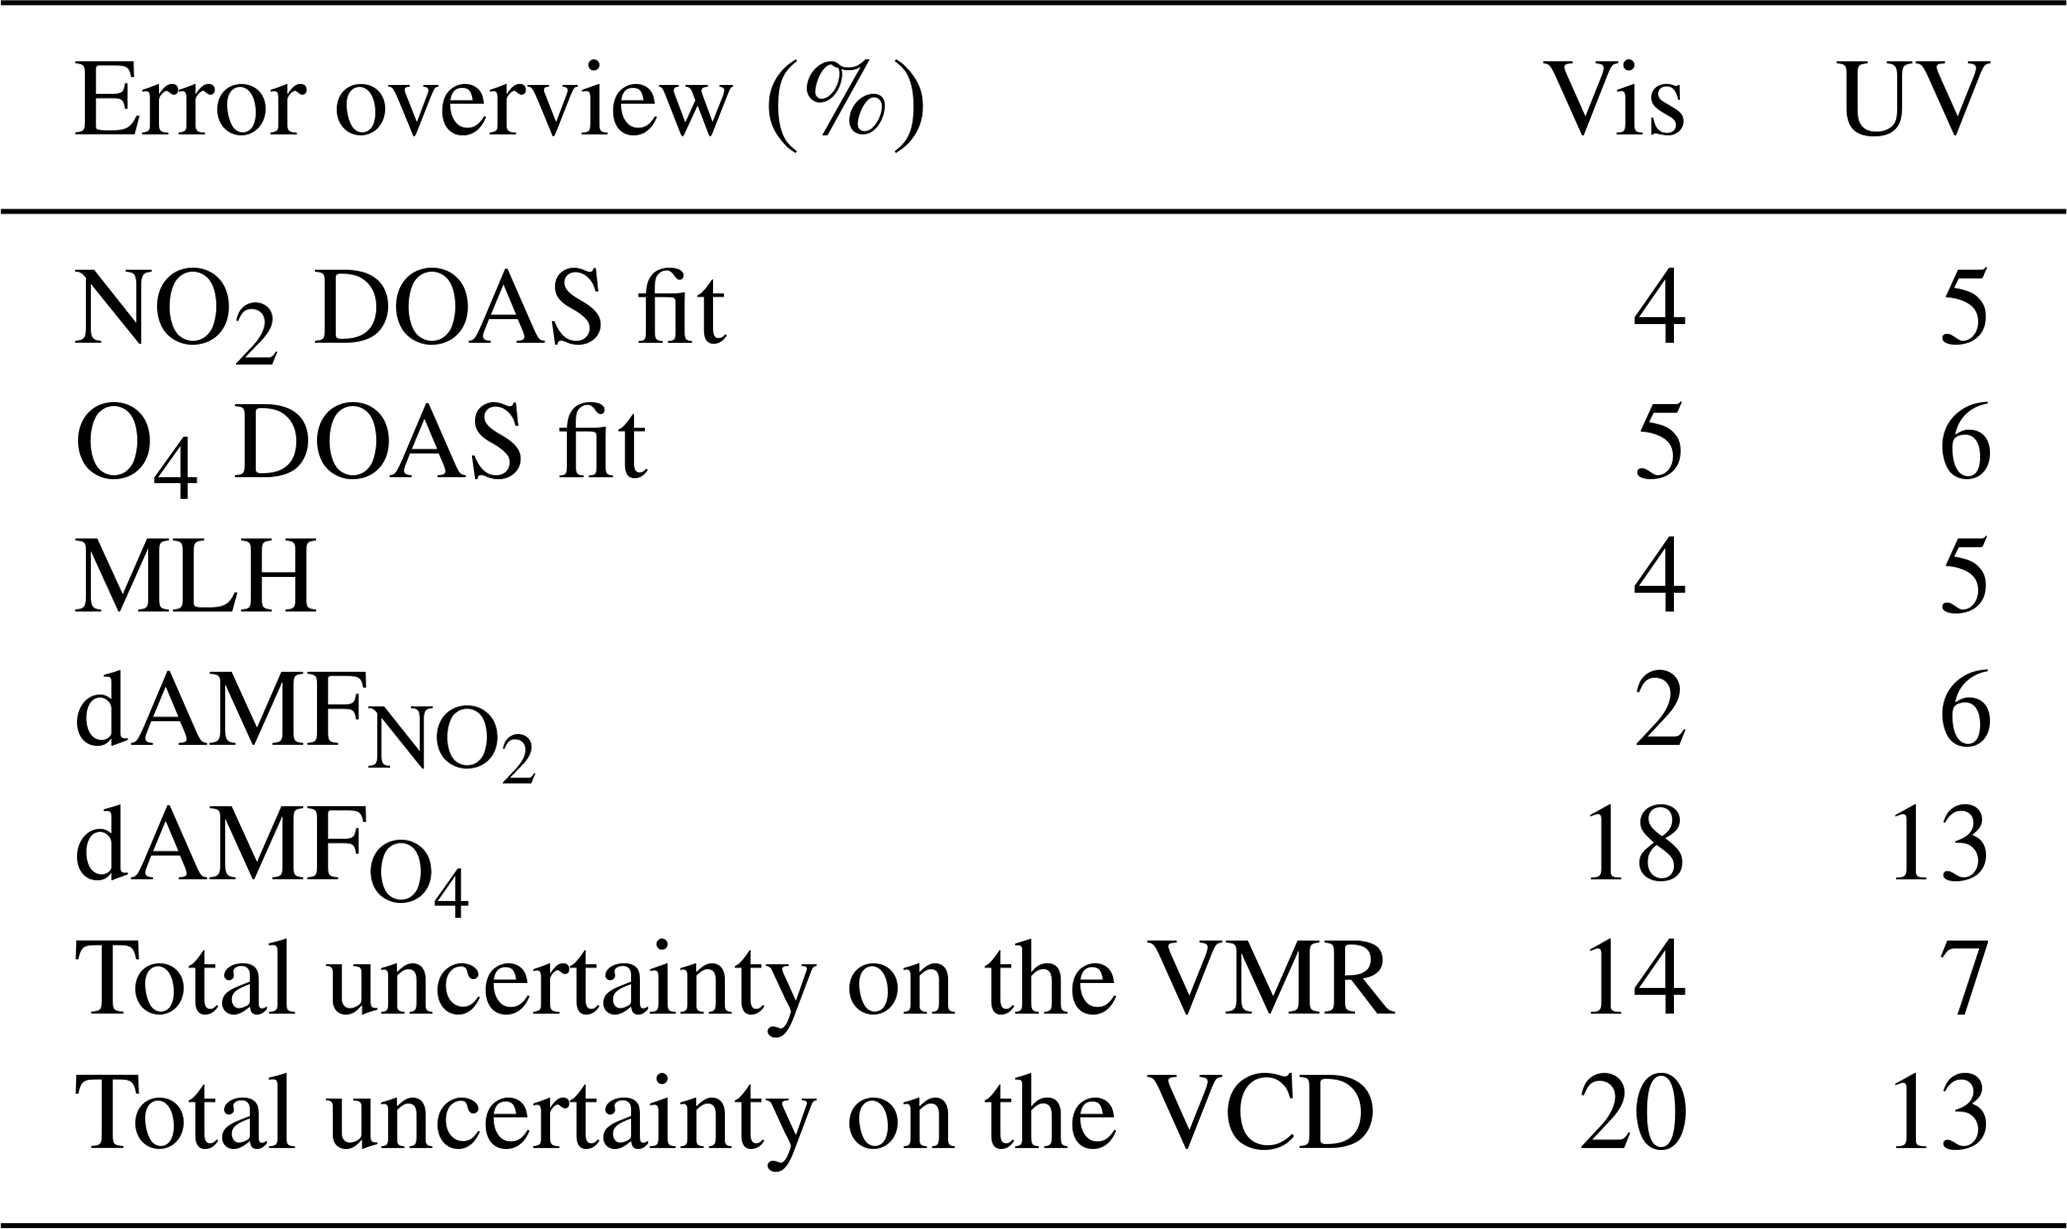
To estimate uncertainties on the retrieved NO2 VMR and VCD using the parameterization method, two main error sources are considered: (1) uncertainties on O4 and NO2 dSCDs and (2) uncertainties related to the estimation of the correction factors. Based on Eq. (4) and using a standard error propagation method, the overall uncertainty on the near-surface VMR is given by
which results in
where
Regarding the σdSCD, Bösch et al. (2018) and Kreher et al. (2020) indicated that, in urban or suburban polluted conditions, the DOAS fit uncertainty of both O4 and NO2 significantly underestimates the actual dSCD uncertainty, which is mostly driven by atmospheric variability as well as spatial and temporal fluctuations in the O4 and NO2 fields. In the present study, based on values derived during the CINDI-2 campaign, conservative values of 3.5×10¹⁵ molec. cm−2 (NO2) and 1.5×1042 molec. cm−5 (O4) were used for the dSCD uncertainties in the UV and visible ranges. This represents an error of up to 5 %–6 % in the O4 dSCD and 4 %–5 % in the NO2 dSCD in both the visible and UV ranges.
The second important error source is related to the correction factors, which depend on the air mass factor and MLHMAX-DOAS calculations (Eq. 9). The uncertainty related to MLHMAX-DOAS can be estimated as a combination of two terms: the total uncertainty of the NO2 near-surface VMR and the NO2 VCD derived by the MMF inversion algorithm. In the visible range, the error related to MLHMAX-DOAS is about 4 % and 5 % in the UV range. In order to estimate the uncertainty related to the air mass factor calculation, sensitivity tests on the input parameters in the RTM simulation were performed. In these sensitivity tests, the main inputs in the RTM calculations, such as the height of the assumed trace gas profile and the aerosol properties, are modified. The corresponding dAMF variability is attributed to the uncertainty of the dAMF calculation. The error related to the dAMF estimation is about 2 % and 6 % in the UV and visible ranges, respectively. The error related to dAMF is larger, reaching 18 % and 13 % in the visible and UV ranges, respectively. Combining all error sources, the total uncertainties on the parameterized NO2 are about 14 % and 20 % for the near-surface VMR and VCD in the visible range, while the corresponding errors in the UV are 7 % and 13 %. A summary of the abovementioned error sources in the parameterized NO2 is presented in Table 5.
Table 5Error budget overview of the parameterized NO2 VMR in the visible and UV spectral ranges.
2.4.3 Horizontal distribution of NO2
Qualitative information about the horizontal distribution of NO2 along each azimuthal direction can be obtained by considering how the dSCDs derived in the visible and UV ranges depend on the retrieved horizontal light path lengths (dLeff (NO2)) (Ortega et al., 2015; Seyler et al., 2019). Indeed, dLeff (NO2) values depend strongly on scattering and atmospheric conditions, and, since scattering processes are more pronounced at shorter wavelengths, dLeff (NO2) is shorter in the UV than in the visible (dLeff (NO2 Vis) > dLeff (NO2 UV)).
During one measurement, four useful pieces of information can be used in order to estimate the distance of the NO2 concentration peak with respect to the instrument: the measured NO2 near-surface VMR and the dLeff (NO2) in the visible and UV ranges. Three different cases can be distinguished.
-
VMR (Vis) > VMR (UV). In this case, the NO2 peak (dVMR = (dSCDVis – dSCDUV)∕dLeff (NO2 UV) nair) is located further away from the measurement site and approximately at the distance dLeff (NO2 UV) < dL < dLeff (NO2 Vis).
-
VMR (Vis) < VMR (UV). Here, the NO2 peak (dVMR = VMR (UV)) is located close to the MAX-DOAS instrument in a distance equal to dLeff (NO2 UV).
-
VMR(Vis) = VMR (UV). If both NO2 VMR in the visible and UV ranges are equal, it can be concluded that the NO2 field (dVMR = VMR (Vis) = VMR (UV)) is homogenously distributed along the line of sight.
This information is further exploited in Sect. 4.1, where the seasonal variation of the dual-scan MAX-DOAS measurements is presented.
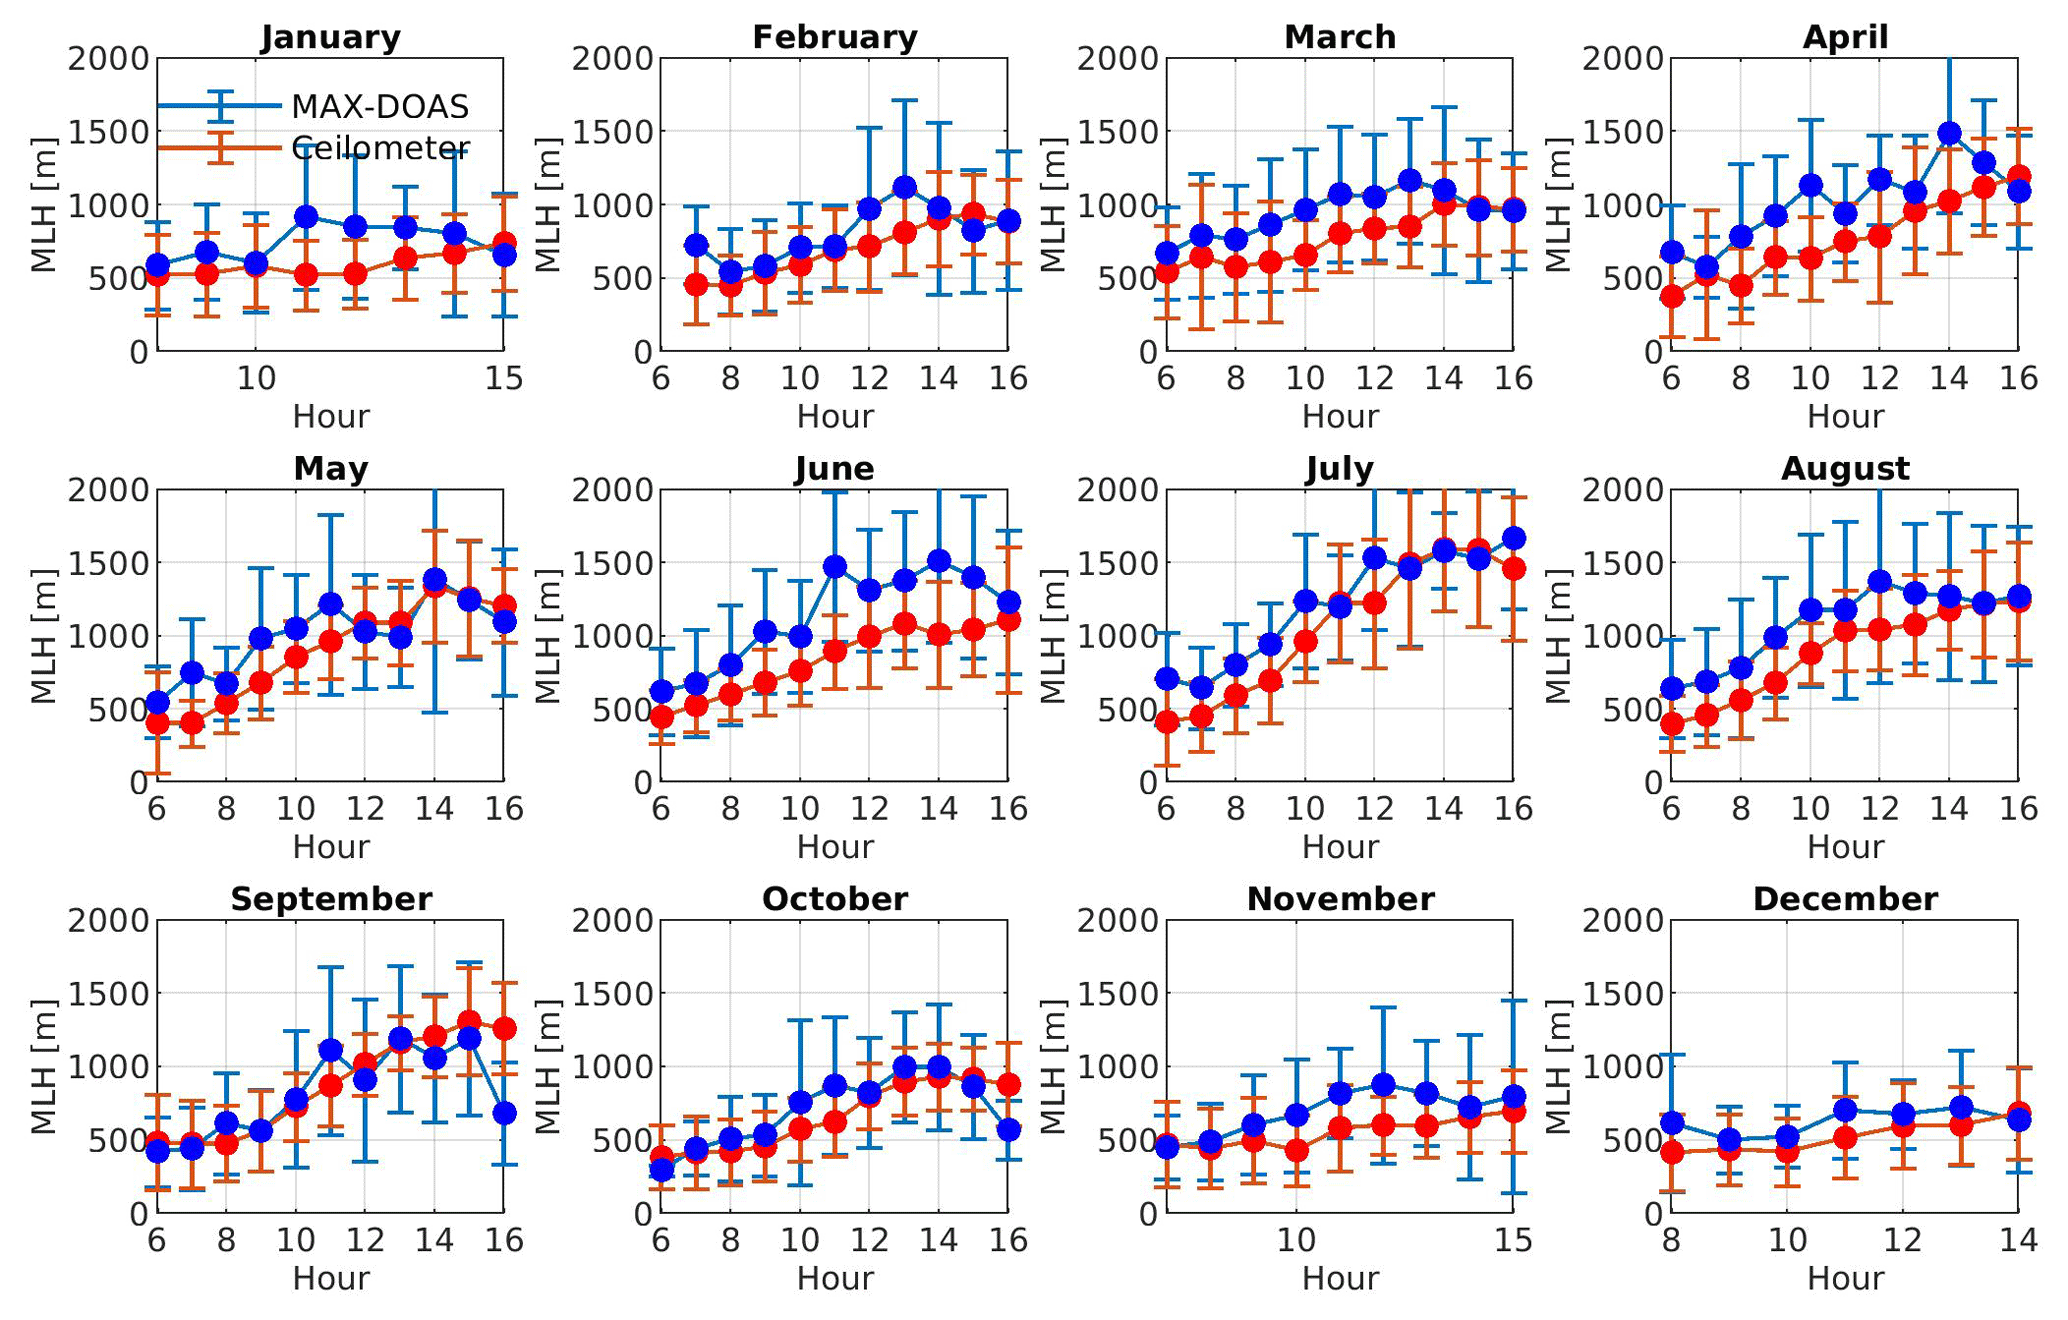
Figure 3Comparison of monthly averaged MLH diurnal variations as estimated by the BIRA-IASB MAX-DOAS measurements and the colocated ceilometer. The error bars for both datasets represent the standard deviation (±1σ) of the hourly mean over 1 month.
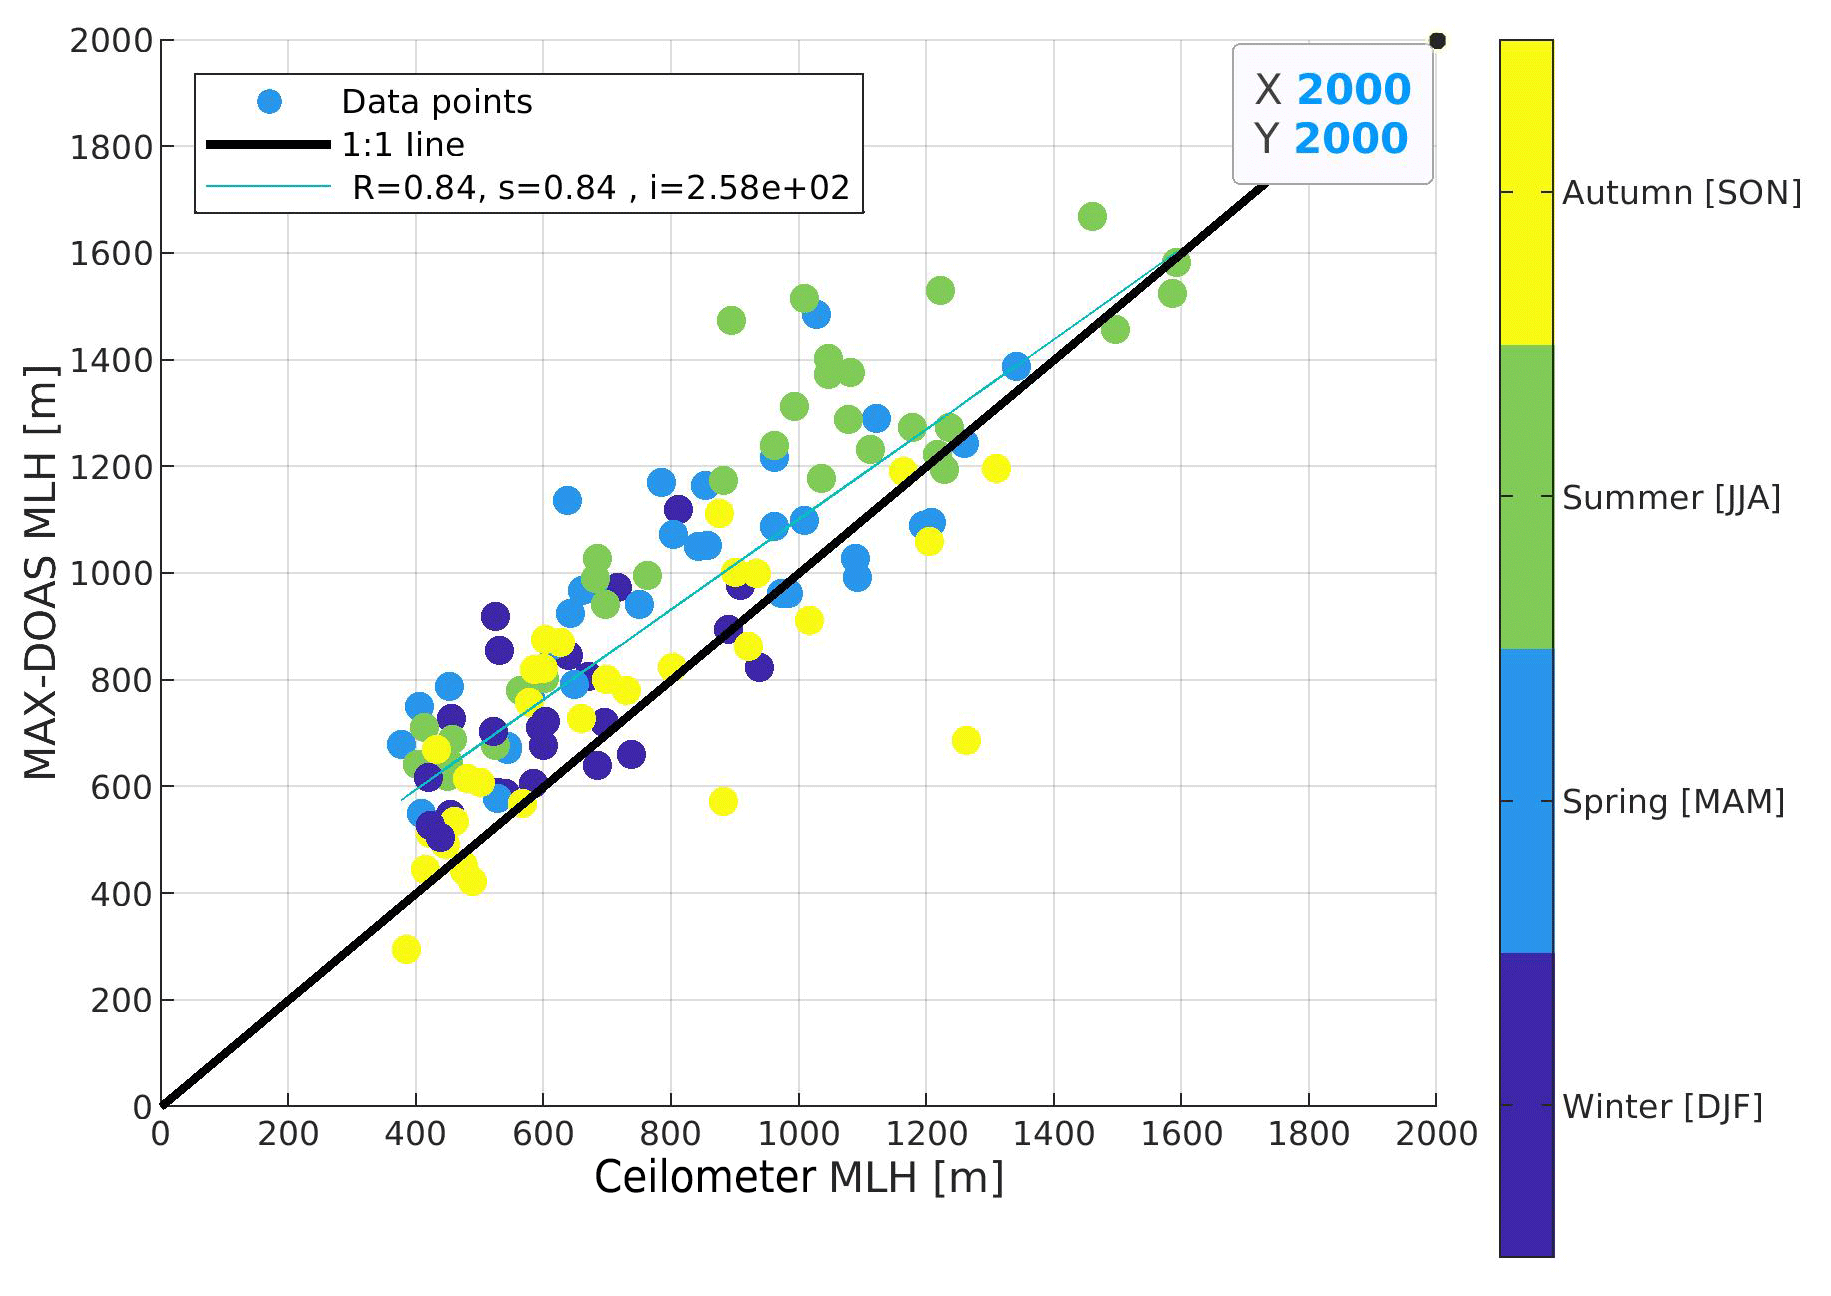
Figure 4Scatter plot of the monthly average MLH diurnal variation values of the MAX-DOAS and the colocated ceilometer. The color bar separates the data by season.
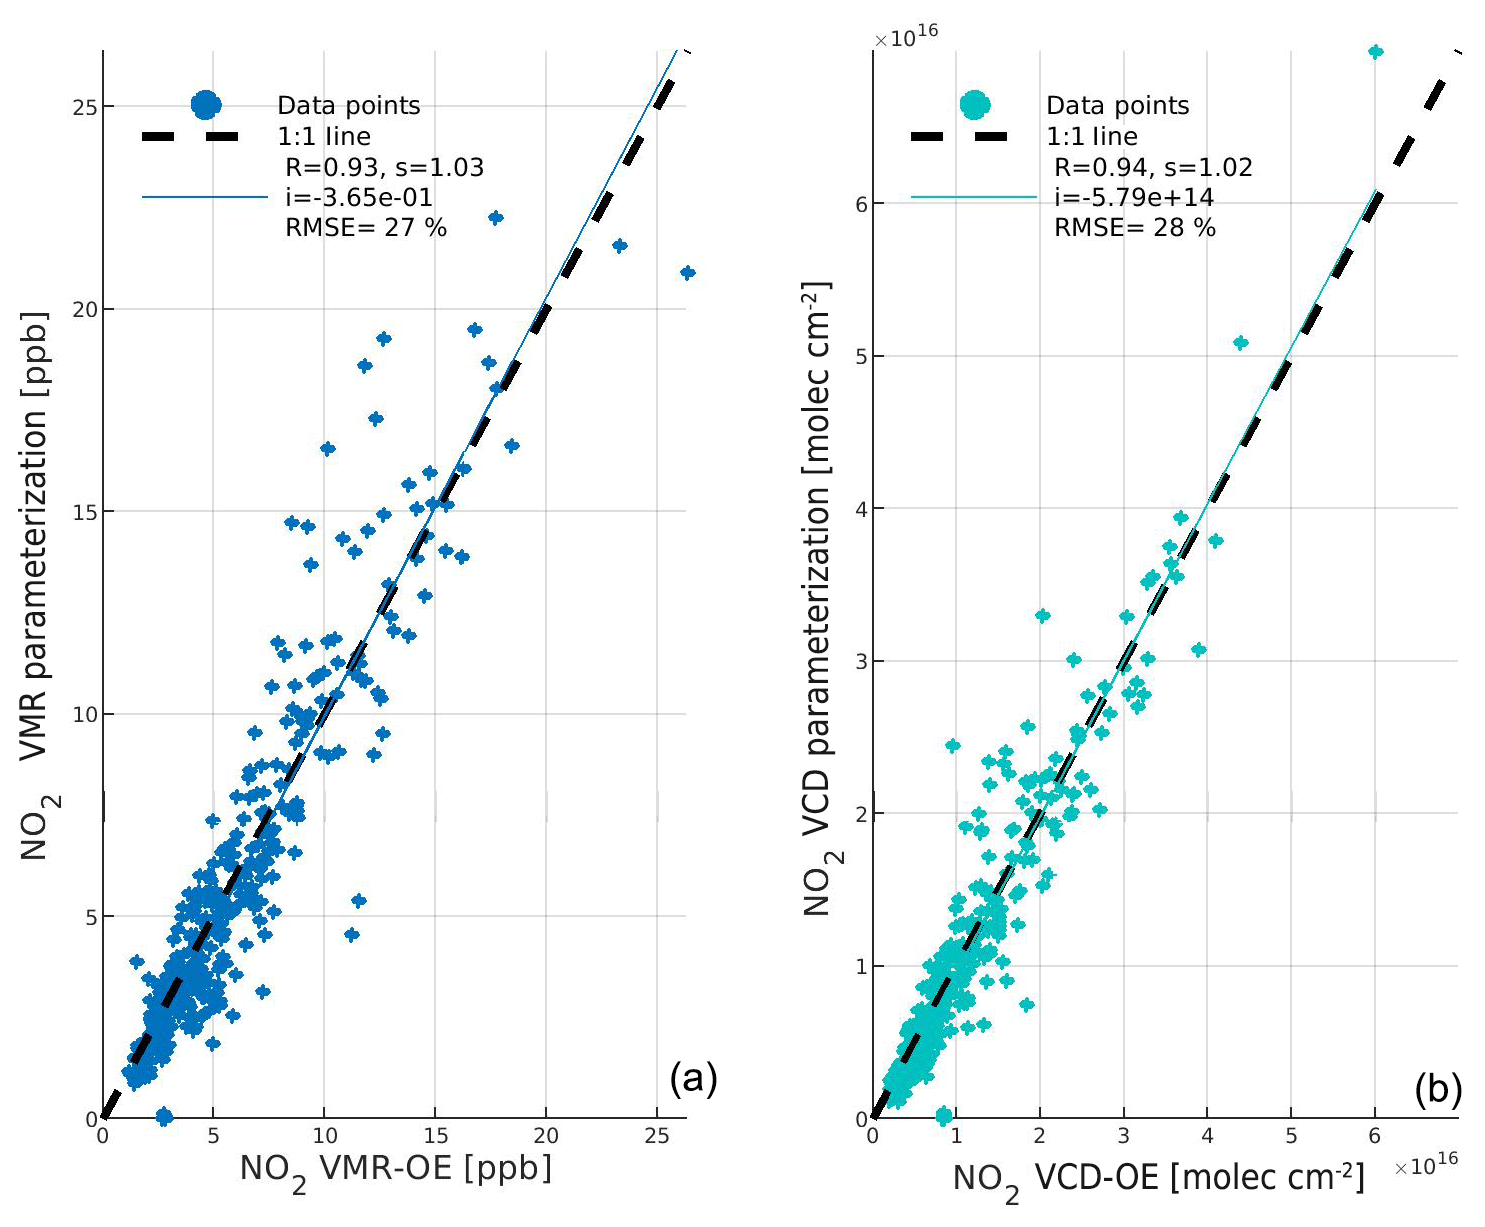
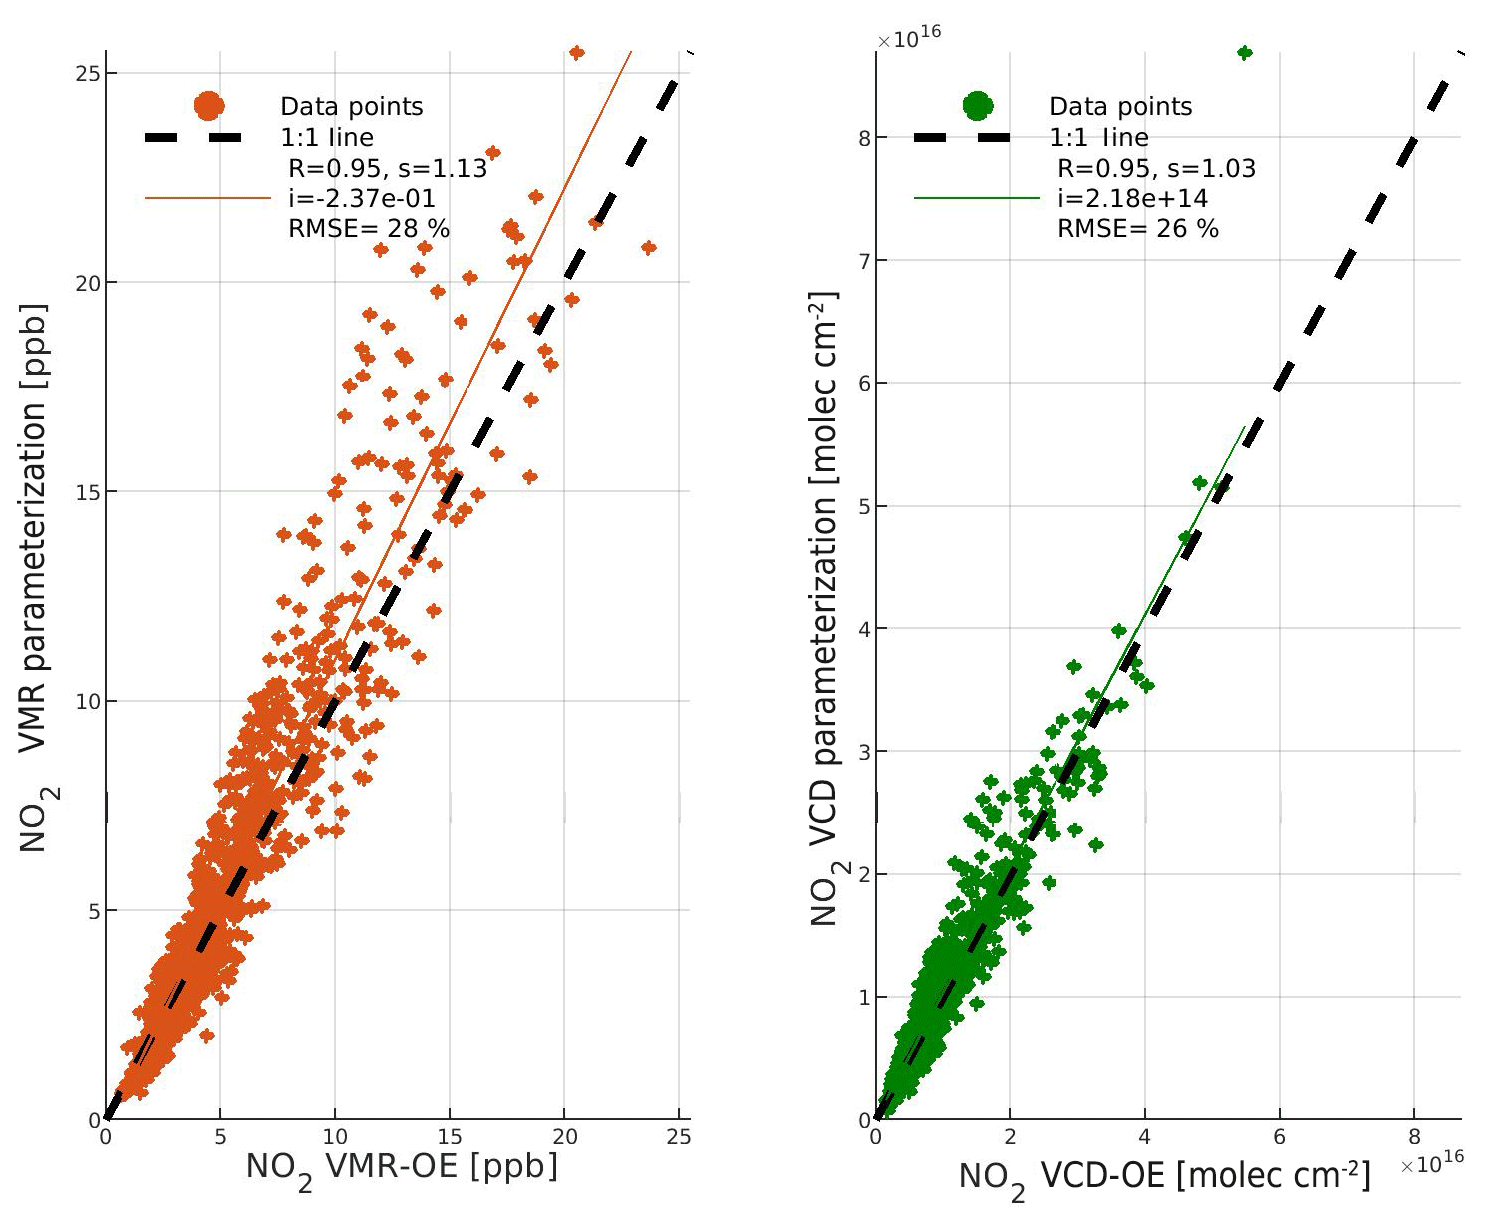
Figure 5Visible range: comparison between (a) MMF and parameterized NO2 near-surface VMR as well as (b) MMF and parameterized NO2 VCD.

2.4.4 Validation of the parameterization method
To validate the dual-scan parameterization method used in this study, two different approaches are adopted. First, the MLH, which is used in the calculation of the correction factors, is compared with MLH measurements using a colocated ceilometer. Second, the NO2 near-surface VMRs and VCDs calculated by the parameterization technique in the main azimuthal angle (35.5∘ with respect to north) are compared to corresponding results obtained with the MMF inversion algorithm.
To validate the MLH estimations, we use a colocated Vaisala CL51 ALC ceilometer operated by RMI. With this instrument, the MLH is retrieved according to an algorithm based on the direct analysis of the backscatter gradient and variance (Haij at al., 2007; Haeffelin et al., 2016; Menut et al., 1999).
Figure 3 displays the diurnal variation of monthly averaged MLH values derived from the ceilometer and MAX-DOAS data during one full year, from March 2018 until March 2019. As can be seen, the MAX-DOAS data capture the diurnal variation of the MLH measured by the ceilometer well. The corresponding scatter plot is presented in Fig. 4. Both datasets are highly correlated (R=0.84); however, the slope value (0.84) indicates that MLHMAX-DOAS tends to slightly overestimate MLHCEIL, with the difference between the two MLH values generally being smaller than 500 m. We note that the offset is larger during spring and summer. Since the ceilometer relies on the aerosol vertical distribution to derive MLH and the MAX-DOAS uses the NO2 vertical profile, differences in the absolute height values are expected. The NO2 tropospheric columns, near-surface concentrations and atmospheric lifetime show a strong seasonality, with maximum values during cold months. During warm months, the solar heating causes warmer air to rise. The typical time for air to rise from the surface to the top of the MLH is about 1 h or less (Stull, 1988). During spring and summer, the differences between the ceilometer and MAX-DOAS MLH could be explained as follows: since the NO2 lifetime is greater than 1 h (Ehhalt et al., 1992) and in combination with air uplifting activity (only present during warm seasons), NO2 could be transported to higher heights than the ones estimated by the ceilometer.
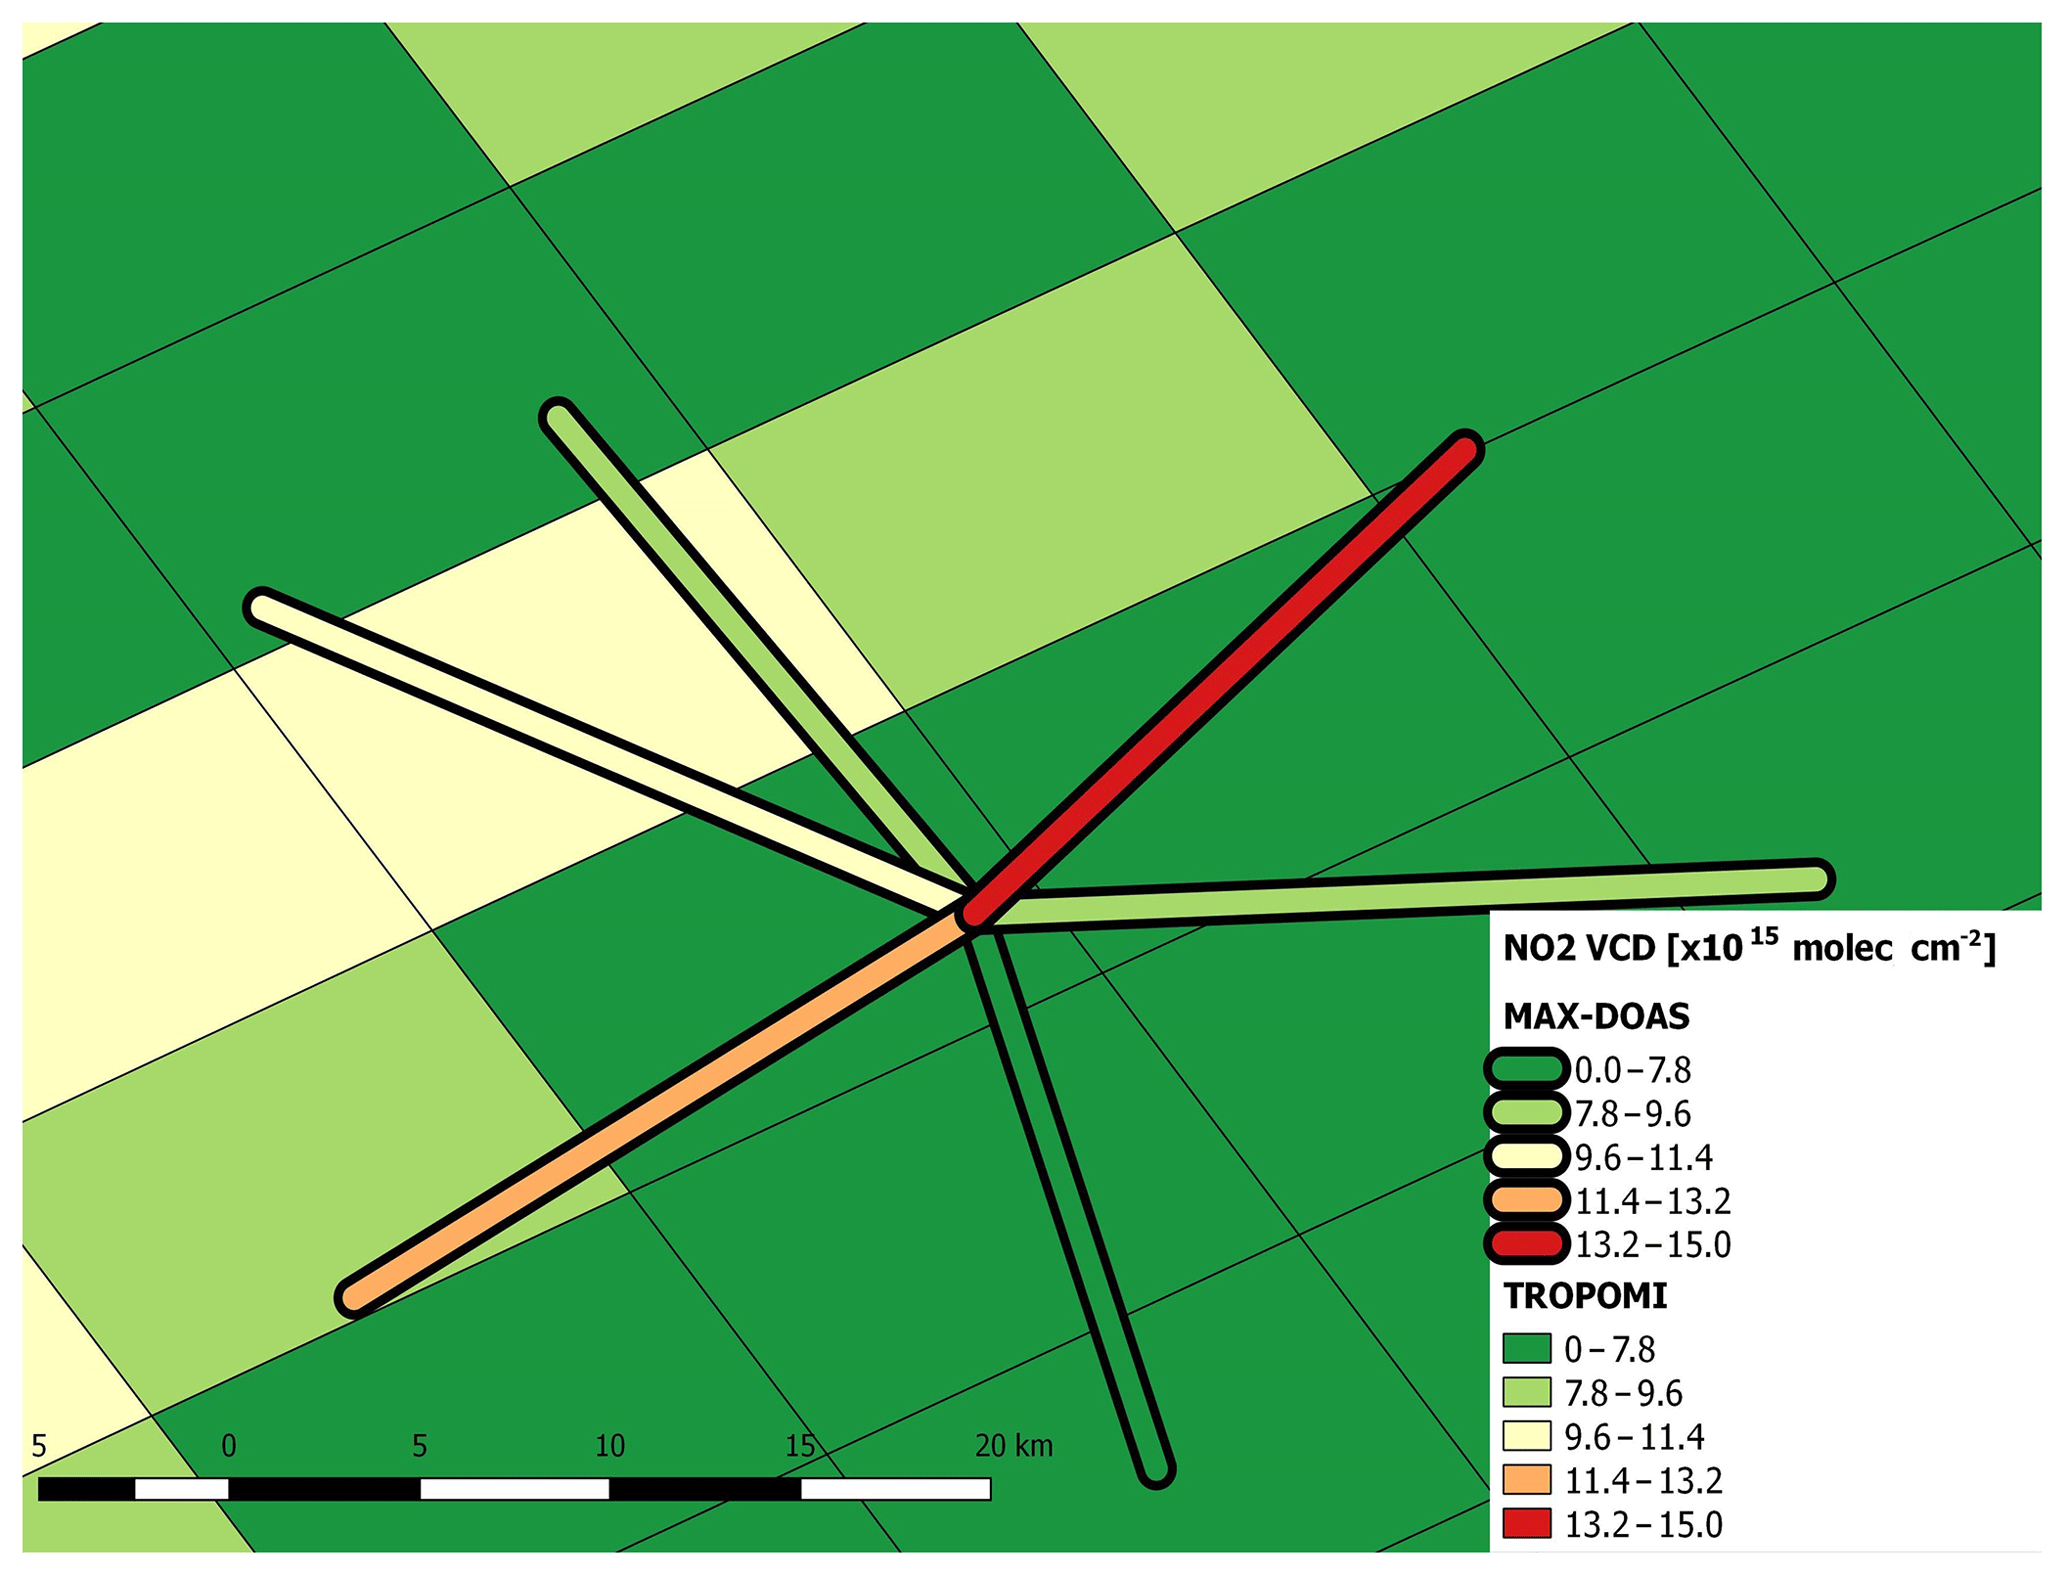
Figure 7Tropospheric NO2 columns derived from TROPOMI (pixel size equal to 7×3.5 km2) and the MAX-DOAS instrument on 6 June 2018 near the measurement site of Uccle.
The second approach to validate the parameterization technique consists of comparing the retrieved NO2 near-surface VMR and VCD to the near-surface VMR (0–200 m) and VCD derived by using the MMF inversion algorithm. The only variable derived from MMF calculations and used in the parameterization technique is the MLH. As we can see in Figs. 5 and 6, results from both methods are highly correlated. The few cases in which the two methods differ more substantially correspond to low dAMF values, which are associated with larger uncertainties.
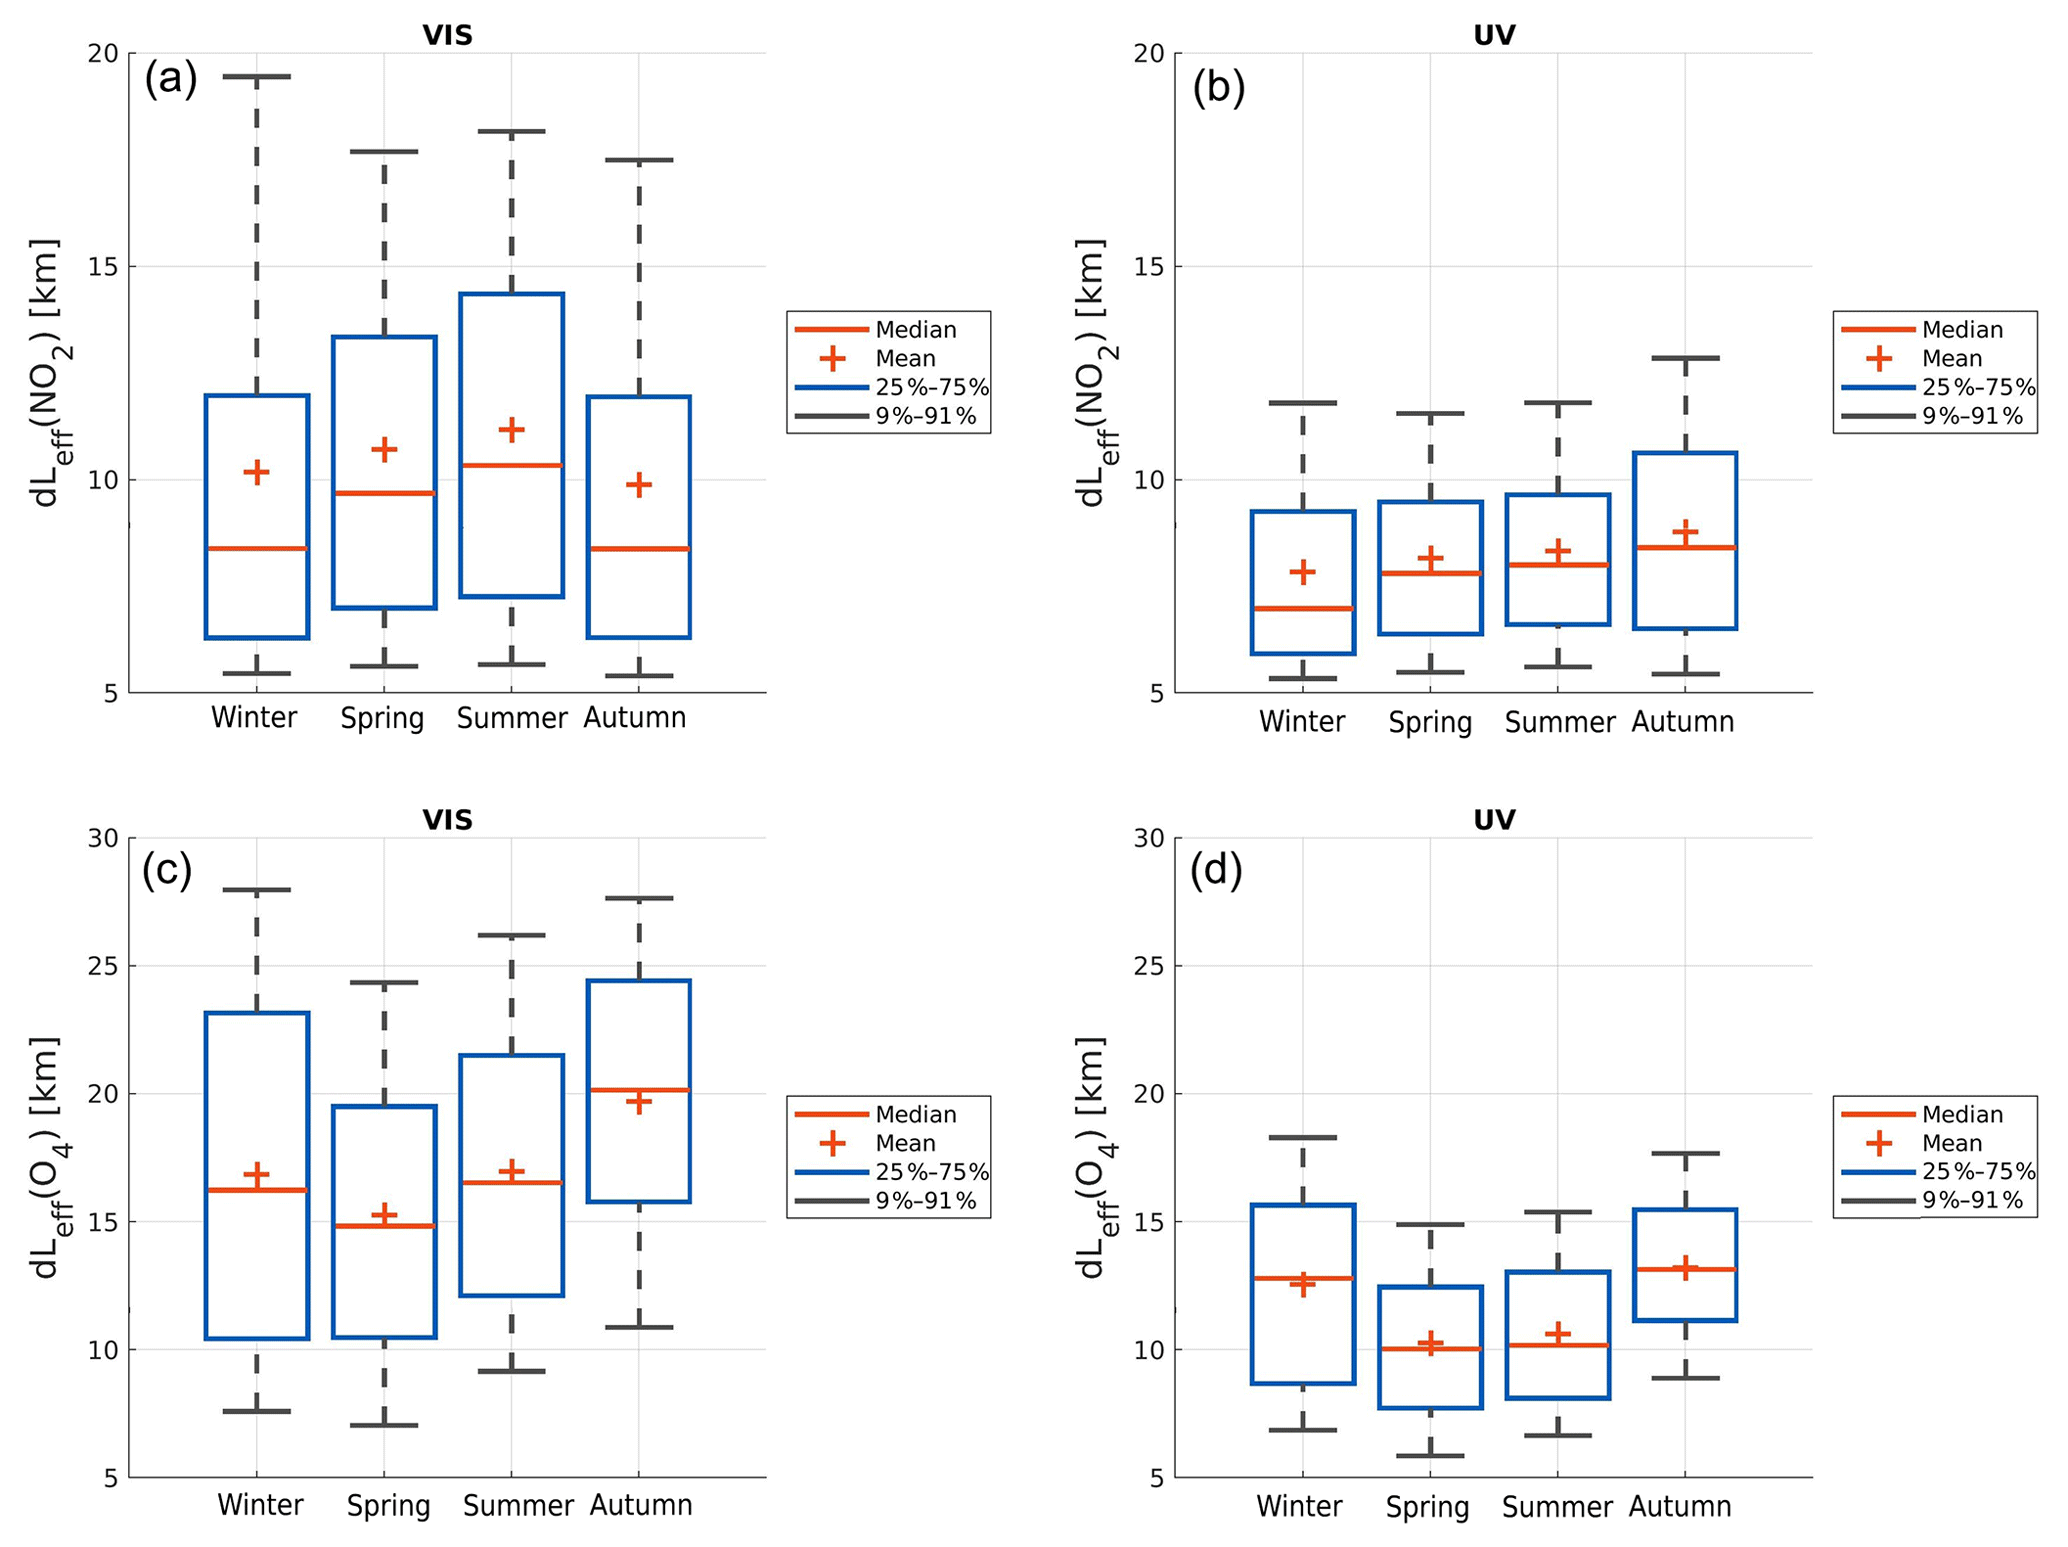
Figure 8Panels (a) and (b) show the box-and-whisker plots representing the seasonal horizontal sensitivity as derived from all the azimuthal viewing directions by applying the parameterization method for the visible (a and c) and UV (b and d) spectral ranges. Every seasonal box contains the estimated dLeff (NO2) of all the azimuthal viewing directions. Panels (c) and (d) show the corresponding estimates of dLeff (O4).
Flying onboard the S5P satellite platform, TROPOMI is a passive grating imaging spectrometer covering the UV–visible (270–500 nm), near-infrared (710–770 nm) and shortwave infrared (2314–2382 nm) spectral ranges (Veefkind et al., 2011). TROPOMI measures the solar backscattered earthshine radiance in a push-broom configuration. With a full swath width as wide as 2600 km, TROPOMI provides daily global coverage with a true-nadir pixel size of 7×3.5 km2 in the UV, visible and near-infrared bands. Since 6 August 2019, the TROPOMI spatial resolution has been even higher, with a pixel size of 5.5×3.5 km2.
Developed at KNMI (van Geffen et al., 2018), the tropospheric NO2 algorithm uses a retrieval–assimilation–modeling system based on the 3-D global TM5 chemistry transport model. This retrieval scheme consists of three main steps. First, the total NO2 slant column density is retrieved from Level-1b radiance and irradiance spectra by applying the DOAS method. In a second step, the total NO2 slant column density is separated into its stratospheric and tropospheric components by using the TM5-based data assimilation system. Finally, the tropospheric and stratospheric NO2 slant column densities are converted to vertical column densities by applying altitude-dependent AMFs. The AMFs are calculated for each individual field of view (FOV) or pixel by using a priori information about the viewing and solar geometry, surface pressure and NO2 profile shape from the TM5-MP model (Williams et al., 2017), surface albedo climatology, cloud fraction, and cloud height.
The present study is based on RPRO and OFFL datasets of the TROPOMI L2 tropospheric NO2 column product (see Table 6 for the corresponding versions). To focus on high-quality measurements, only pixels characterized by a quality assurance value larger than 0.75 are used so that pixels covered by clouds (pixels with a cloud radiance fraction larger than 0.5), snow or ice and erroneous retrievals are excluded from the analysis. The TROPOMI overpass over Brussels is around 13:30 LT. Figure 7 illustrates a typical comparison case. Superimposed on TROPOMI ground pixels as measured above Brussels on 6 June 2018, one can distinguish the different azimuthal viewing directions sampled by the Uccle dual-scan MAX-DOAS system. As can be seen, multiple pixels are coincident with one MAX-DOAS azimuthal direction, showing the high spatial resolution of TROPOMI and the challenges concerning its validation.
4.1 Seasonal variation of dual-scan MAX-DOAS measurements
Box-and-whisker plots of MAX-DOAS horizontal effective light paths (dLeff (NO2), see Eq. 3) determined in each season for all the viewing azimuthal directions are presented in Fig. 8 for the visible and UV wavelength ranges. As can be seen, the dLeff (NO2) shows maximum median values during summer and a minimum during winter for both wavelength ranges. The seasonality of dLeff (NO2) is related to the seasonal variation of the aerosol content in the troposphere. For high aerosol load conditions, the light path tends to become shorter due to increased scattering. In the visible range, dLeff (NO2) can reach values of up to 19 km during winter with a mean value of 10 km, while in the UV, the maximum value is around 12 km with a mean value of 8 km. Similar horizontal distance values have been found by Schreier et al. (2019b) using MAX-DOAS measurements in Vienna. Horizontal sensitivities (dLeff (NO2)) are generally larger in the visible than in the UV because of the more pronounced Rayleigh scattering at UV wavelengths. Similarly, dLeff (O4), which is the horizontal sensitivity before applying the appropriate correction factors, is larger in the visible than in the UV range. The dLeff(O4) visible can reach values of up to 28 km, while the maximum value for UV is around 18 km. The difference between dLeff (NO2) and dLeff (O4) can become quite large by approximately a mean factor of 2 and 1.6 for visible and UV, respectively. For extreme cases, this difference factor can be up to 5 and 4 for visible and UV, respectively.
In Fig. 9, the seasonal variation of the MAX-DOAS near-surface NO2 VMR is presented for both visible and UV channels in each azimuthal direction at 11:00 UTC. The choice of presenting the MAX-DOAS measurements at 11:00 UTC is based on the TROPOMI overpass time, which varies between 10:00 and 12:00 UTC. The length of the lines corresponds to the seasonally averaged dLeff (NO2). As mentioned above, dLeff (NO2) is longer in the visible than in the UV range, which leads to a more extended spatial sensitivity in the visible than in the UV range. As explained in Sect. 2.4.3, the relationship between NO2 VMRs and dLeff (NO2) values contains information about the horizontal distribution of NO2. This relationship and the wavelength dependence of the horizontal effective light path were also used by Seyler et al. (2019) to characterize the horizontal inhomogeneity of the NO2 concentration above a shipping lane.
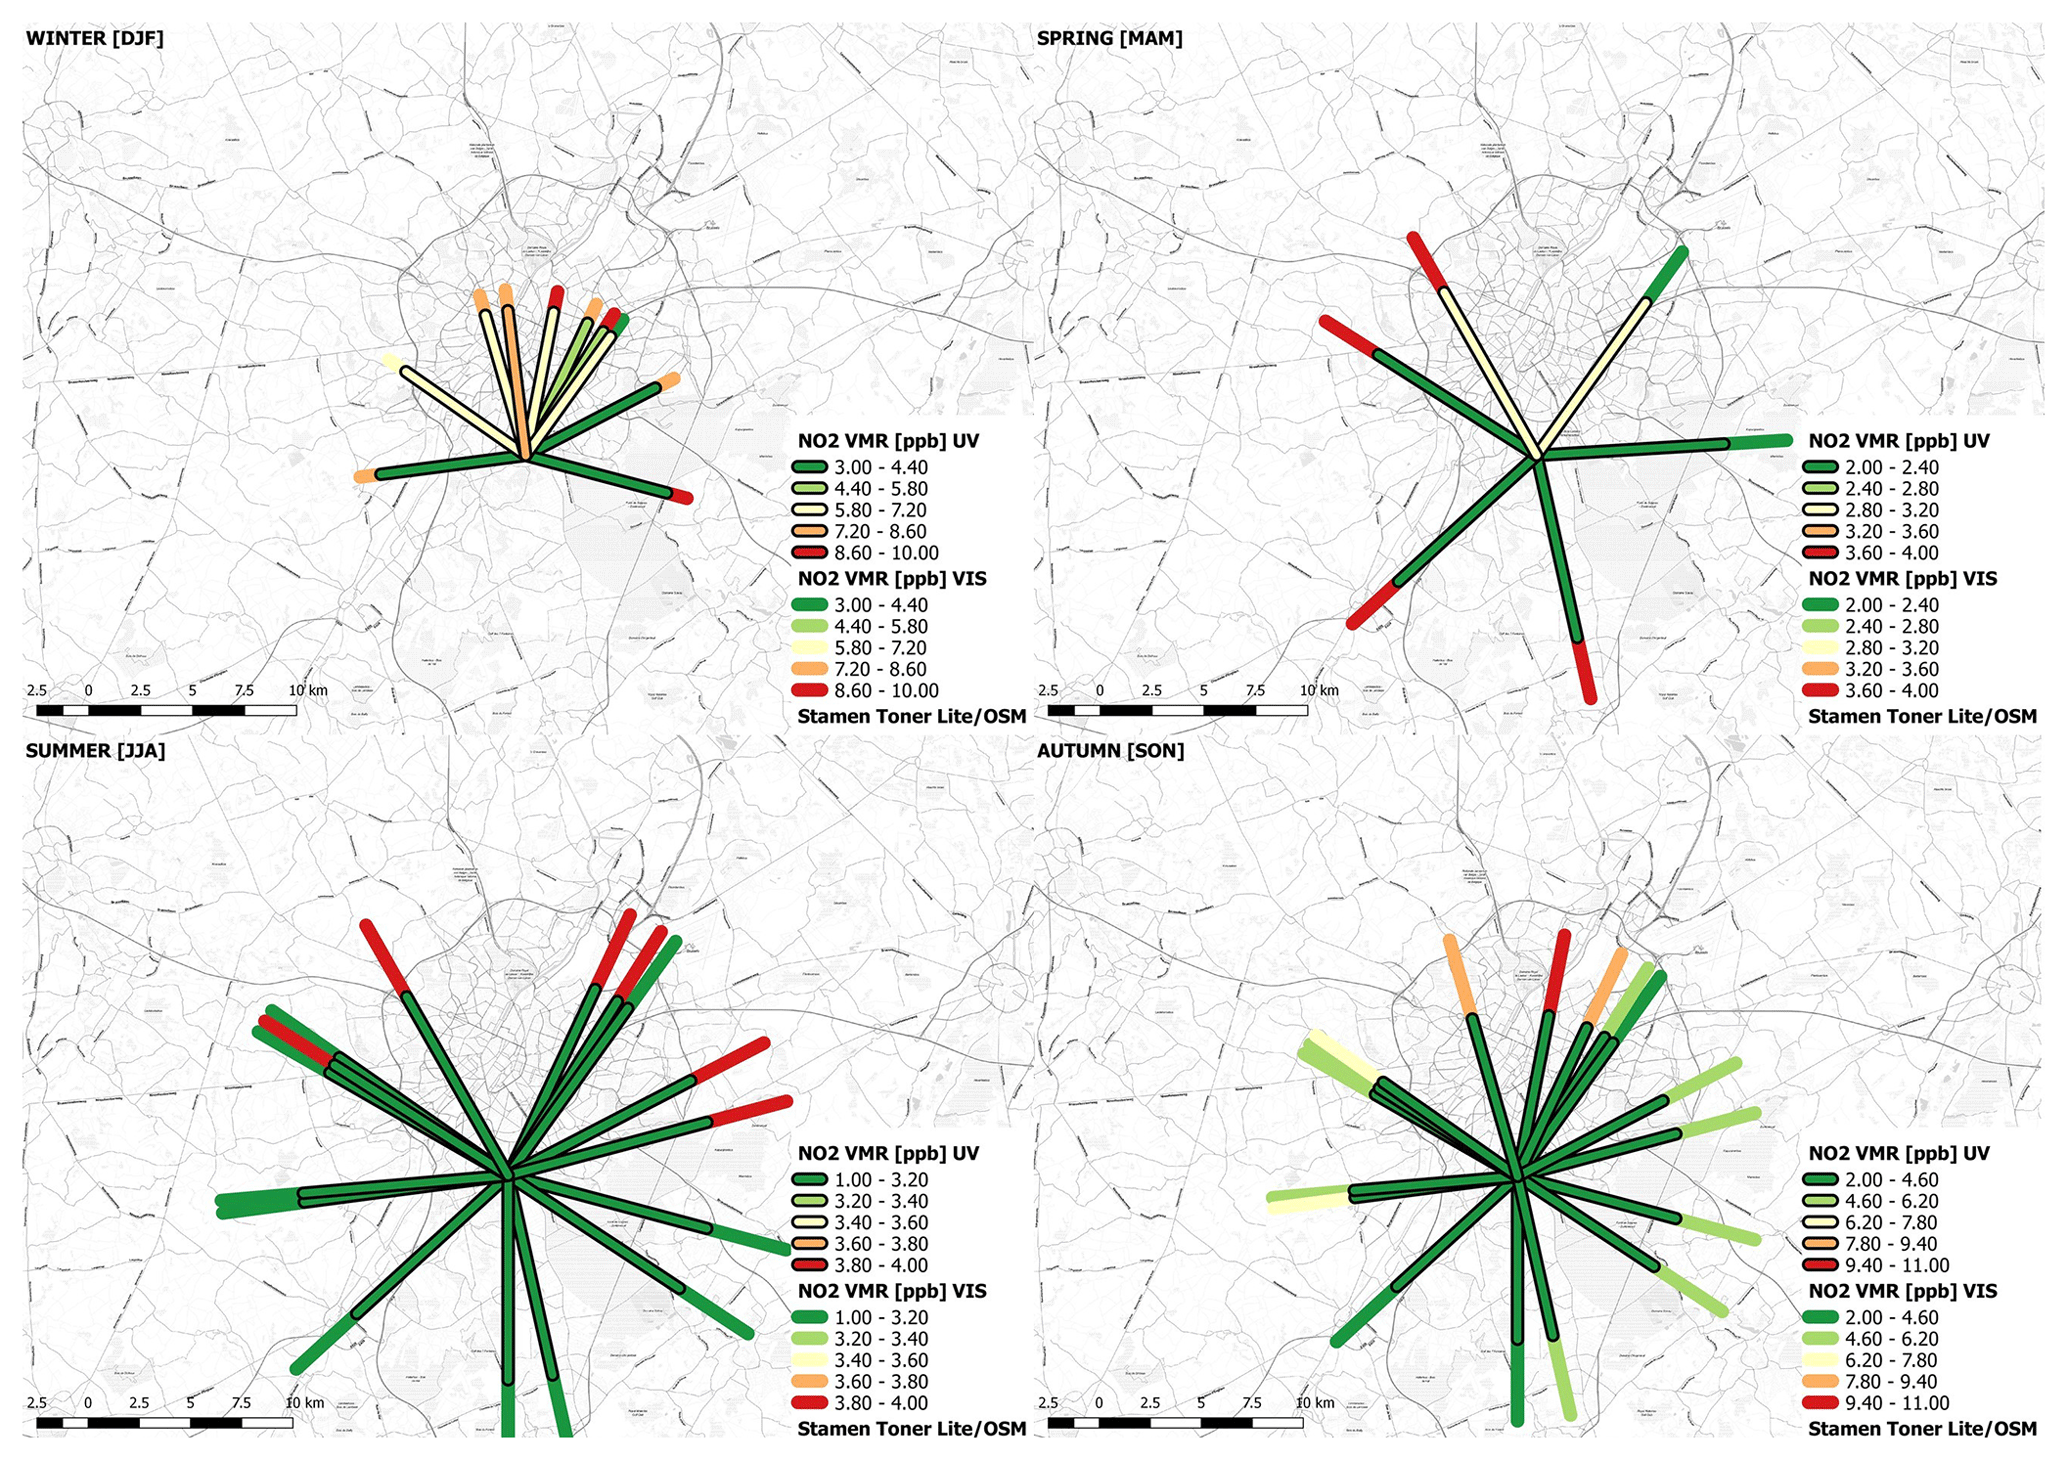
Figure 9Seasonally averaged near-surface NO2 VMR around 11:00 UTC as a function of azimuthal viewing direction derived by the parameterization technique in the visible and UV wavelength ranges. Lines with black borders represent the UV VMRs, and lines without black borders show the visible VMRs. The length of each line represents the seasonally averaged horizontal sensitivity. Different color scales are used per season. © OpenStreetMap contributors 2019. Distributed under a Creative Commons BY-SA License.
The near-surface NO2 VMR has a clear seasonal cycle, with a maximum during winter and autumn due to higher emissions, lower temperature (and thus longer NO2 lifetime) and shallower MLH and a minimum in spring and summer. Moreover, the spatial distribution of NO2 concentrations around Uccle shows a seasonal dependence. It should be noted that the main emission sources are located in the north and west part of the city and are associated mainly with the motorway around Brussels (the so-called Ring), the national airport in Zaventem and the Drogenbos power plant, the latter being located to the west of Uccle (Tack et al., 2017). In the absence of transport by the wind and given the fact that NO2 has a shorter lifetime in the MLH (Beirle et al., 2011), the higher NO2 concentrations should appear at the location of main emission sources. As can be seen in Fig. 9, this is not the case during all seasons due to the influence of seasonal wind patterns. During winter, higher NO2 concentrations are retrieved mainly in the north (N) and northeast (NE) directions. The fact that the NO2 concentration in the NE direction is higher in the visible than in the UV suggests that the NO2 peak is located away from Uccle and closer to the Brussels national airport. On the other hand, in the northwest (NW) direction, the NO2 concentrations are lower in the visible than in the UV. This can be associated with higher anthropogenic activity in the city center of Brussels. During spring and summer, the observed NO2 VMRs are the lowest of the March 2018–March 2019 period. For spring, the maximum concentrations are measured away from the measurement site (visible) in the south (S) and NW direction. It is worth mentioning that in the east (E) direction, the visible and UV measurements have almost the same concentrations, indicating that the NO2 field is homogeneous in those areas. During summer, the maximum NO2 VMRs are retrieved in the visible range and in the NE and NW directions, suggesting that the sources are mainly located away from the measurement site, possibly linked to the airport and city-center activity. One observes that in the south (in the direction of a large forested area), the retrieved concentrations are very low, while they are substantially higher in the NW and NE. Finally, during autumn, higher values are observed away from Uccle in the north direction, corresponding to sources located away from the measurement site and mostly traffic-related.
As already noted, the retrieved NO2 VCDs can be influenced by the wind direction. In Fig. 10, MAX-DOAS NO2 VCDs are represented as a function of the wind direction during the MAX-DOAS observations. The wind direction is measured by the BIRA-IASB meteorological station in Uccle. Generally, when the wind is blowing from the NE and SE direction, higher NO2 columns are retrieved. During winter and autumn, the NO2 VCDs, which are retrieved under different wind directions, differ significantly compared to summer and spring. We conclude that emission sources located away from the measurement site influence the measured NO2 concentration levels when the wind is blowing in the direction of the site.
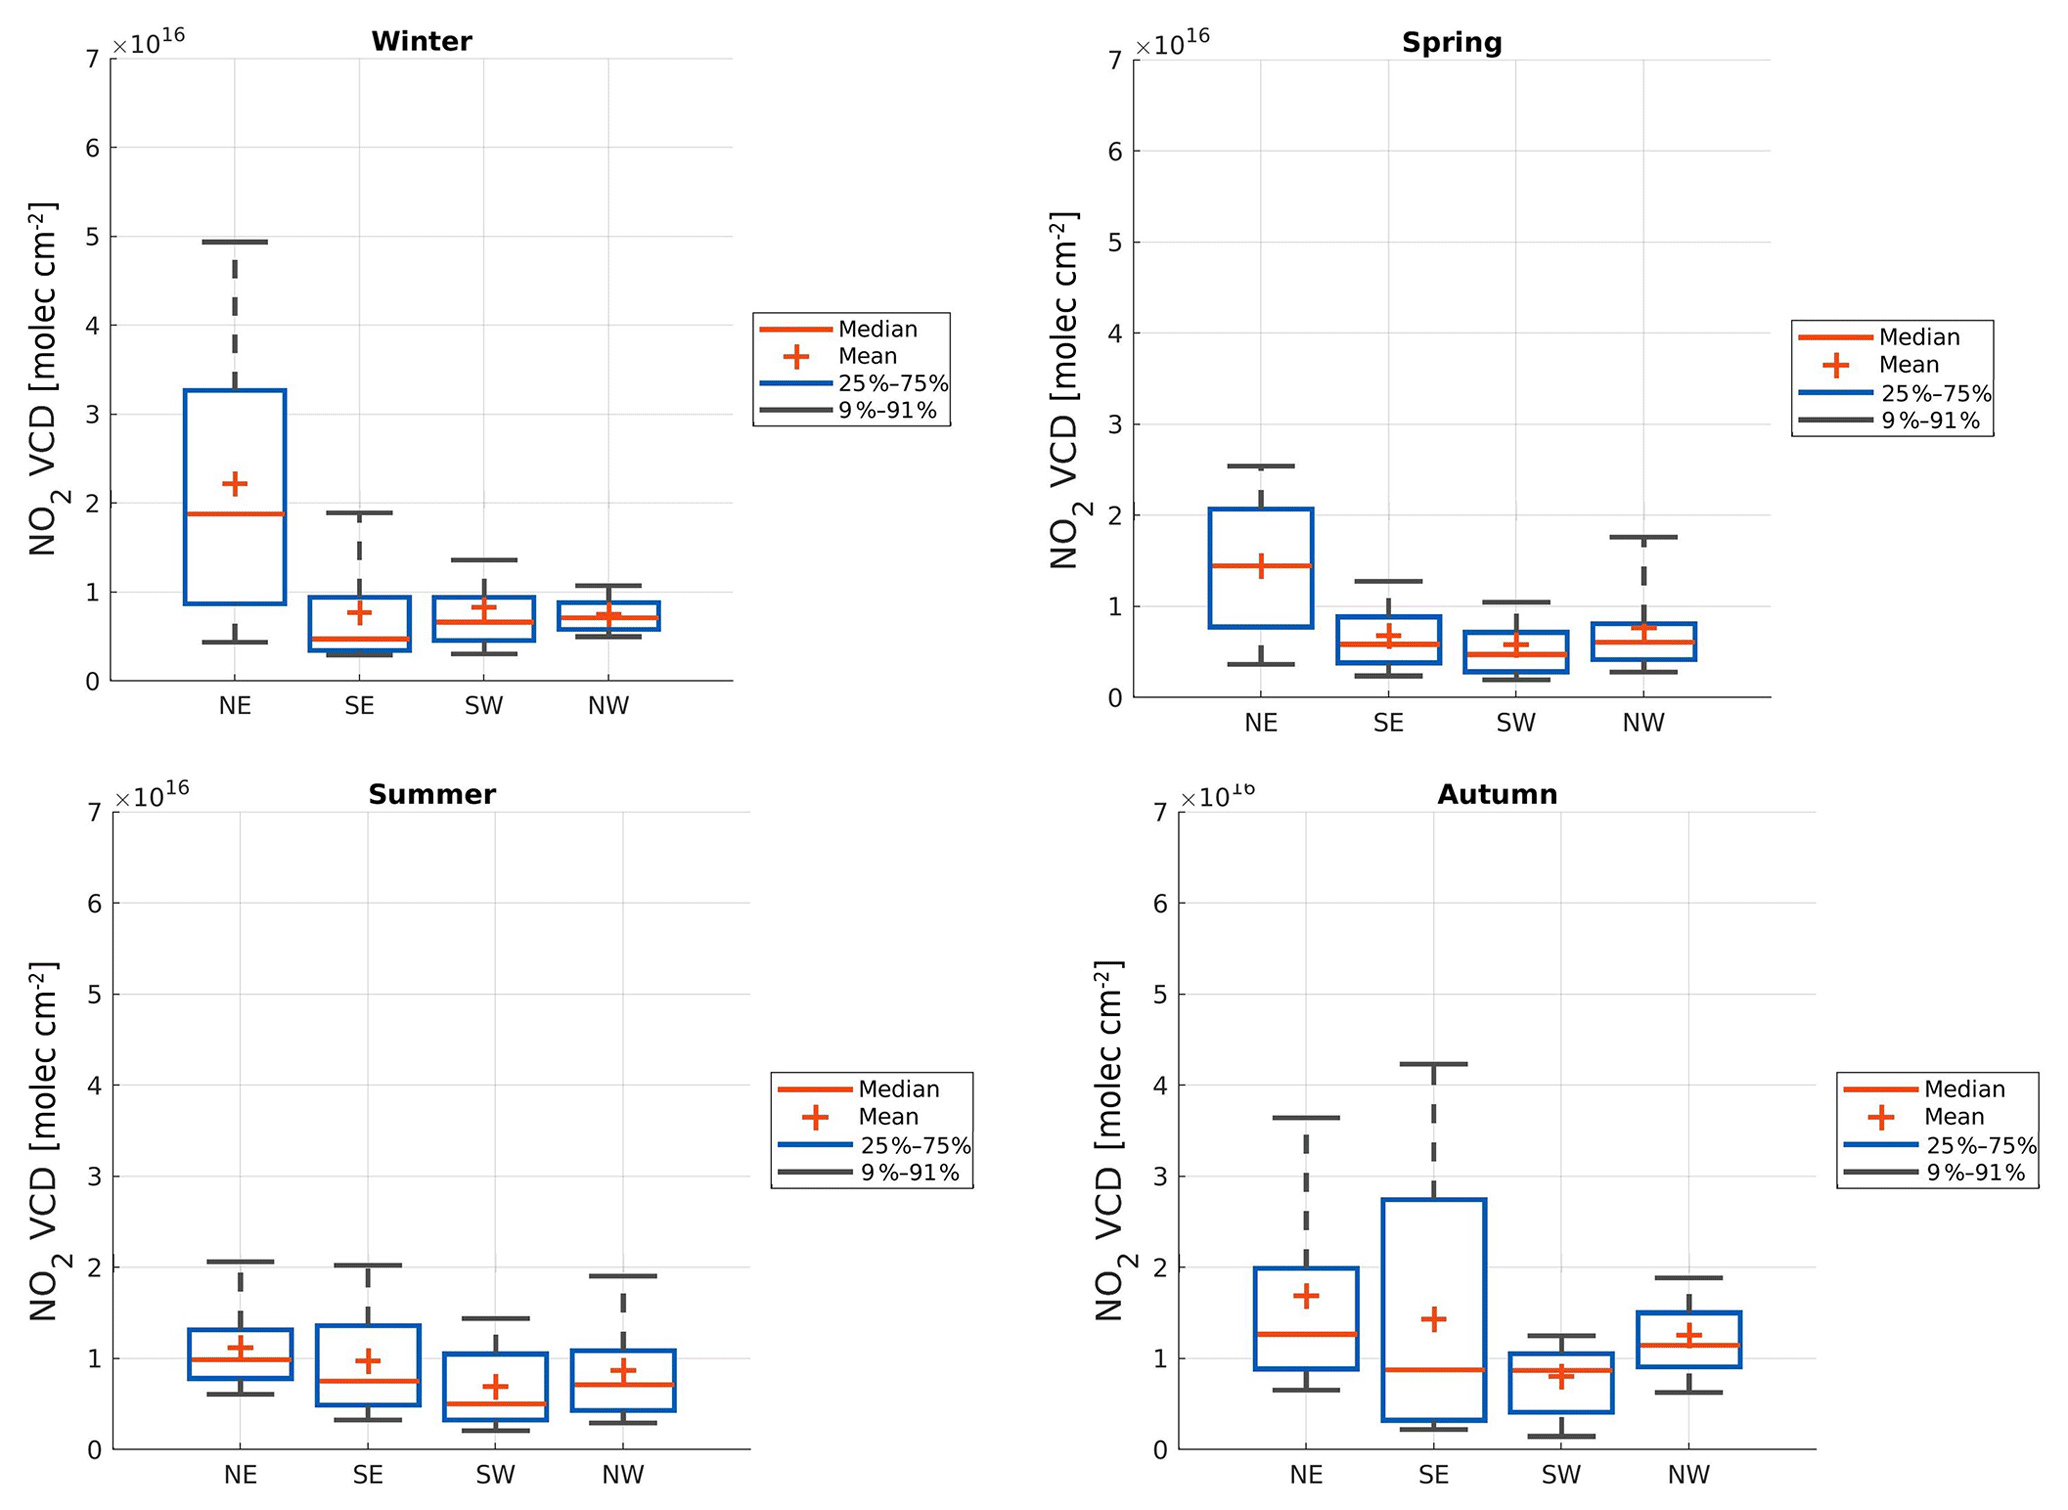
Figure 10Box-and-whisker plots representing, for each season, the tropospheric NO2 column as a function of the wind direction. The MAX-DOAS columns are derived by the parameterization technique in the visible wavelength range (all the azimuthal directions are included) and the wind observations from the meteorological station on the BIRA-IASB rooftop.
4.2 Comparison of MAX-DOAS and in situ measurements
The in situ telemetric air quality network (Bruxelles Environnement/Leefmilieu Brussel) of the Brussels region is used to verify the retrieved near-surface NO2 VMR. Previous studies (e.g., Kramer et al., 2008; Schreier et al., 2019a) have compared NO2 MAX-DOAS measurements with in situ concentrations, concluding that there is a considerable underestimation of NO2 near-surface VMR by the MAX-DOAS instrument.
The present work uses hourly NO2 near-surface concentrations from 10 monitoring stations distributed in the Brussels city area and provided by the Belgian Interregional Environment Agency (see http://www.irceline.be/en, last access: 11 September 2020). Each station is characterized according to its location: urban, urban background, traffic, rural or industrial. In Fig. 1, the location of the different in situ stations is indicated together with the azimuthal viewing directions of the MAX-DOAS instrument.
In some directions, several in situ stations are located in proximity to the MAX-DOAS line of sight so that MAX-DOAS NO2 concentrations can be compared to an average of the in situ values reported at these stations. Because of the different spatial representativeness of the MAX-DOAS and in situ techniques, one expects differences in the observed surface concentrations (e.g., a VMR underestimation by the MAX-DOAS if the in situ station is located close to a strong local emission source). However, for days on which NO2 is homogeneously distributed along the light path, both instruments should measure similar concentration levels. To restrict the comparison to conditions of good horizontal homogeneity, the hourly in situ NO2 near-surface concentrations for each in situ station category were compared to each other, and only measurements wherein the concentrations of the in situ stations differed by less than 2 ppb within a time window of 1 h were selected. Additionally, we only considered MAX-DOAS measurements for which the horizontal sensitivity was less than 10 km. This distance is the maximum between the MAX-DOAS site and all the chosen in situ stations.
Based on the different categories of in situ stations, three groups were created, similarly to the study of Kramer et al. (2008): (1) urban background, (2) urban and (3) traffic. The in situ data were interpolated on the MAX-DOAS time grid and compared with the retrieved MAX-DOAS near-surface VMR. For the comparison, the in situ dataset was averaged in bins of 2.5 ppb length each. In Fig. 11, the results of this comparison show that the MAX-DOAS near-surface NO2 VMRs have a systematic low bias when compared to in situ data. As expected, the best agreement is found at urban background stations. For these sites, correlation coefficients of 0.91 and 0.83 and slope values of 0.39 and 0.39 are obtained for visible and UV data, respectively. The majority of the comparison data points show that the MAX-DOAS NO2 VMRs are lower than the in situ NO2 observations by approximately a factor of 2. However, a more careful inspection of the results indicates that much better agreement is obtained when considering NO2 VMR values smaller than 12 ppb at urban background stations (R close to unity and slope close to 0.69). Such moderately polluted conditions likely correspond to homogeneously distributed NO2 fields similarly sampled by in situ and remote-sensing measurements.
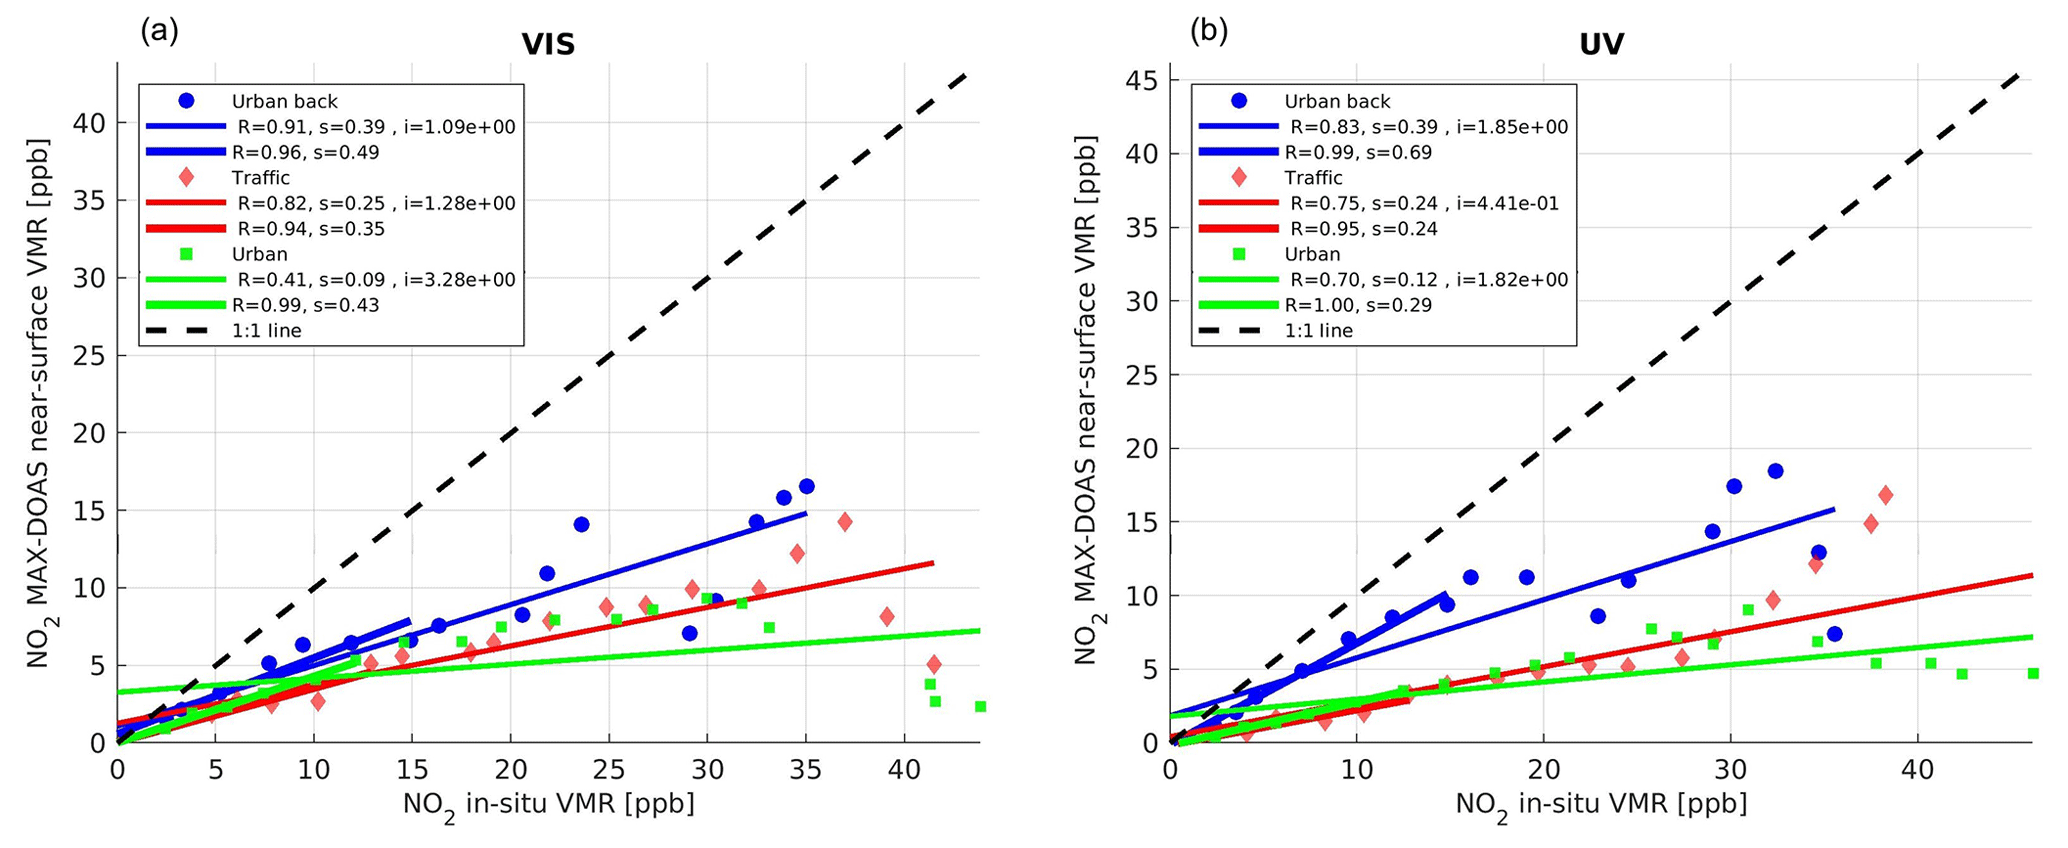
Figure 11Scatter plots of binned MAX-DOAS and in situ NO2 near-surface VMR in the (a) visible and (b) UV channels. The solid thick lines are the regression analysis results for the 0–12 ppb in situ NO2 concentration range.
The worst agreement is found at traffic and urban stations (R in the 0.41–0.82 range). At these stations, the MAX-DOAS NO2 VMRs are lower than the in situ NO2 observations by approximately a factor of 2 and 3, respectively. Three factors can explain these findings. First, MAX-DOAS concentrations are integrated along a long light path, which smooths out the variability of the NO2 field along this path, while the in situ instruments perform measurements at a single location point. Secondly, the in situ stations are typically located at 3–10 m of altitude, while the MAX-DOAS near-surface measurements correspond to a layer extending from the surface to approximately 420 m of altitude for the visible range considering a horizontal distance of 12 km and from the surface to 280 m of altitude for UV based on a horizontal distance of 8 km (see corresponding dLeff in Fig. 8). Hence, the MAX-DOAS near-surface concentration is not fully representative of the in situ surface concentration, as reported in Kramer et al. (2008). Thirdly, the comparison discrepancies could also come from errors in either MAX-DOAS retrievals, as documented in Tables 4 and 5, or surface NO2 measurements because of instrumental errors and biases.
4.3 Validation of TROPOMI tropospheric NO2 columns
To validate the TROPOMI tropospheric NO2 columns, we adopted three successive approaches.
-
A first comparison is performed by selecting only MAX-DOAS data in the main azimuthal direction (35.5∘ with respect to north) and the TROPOMI value from the closest pixel located in the same direction as the MAX-DOAS measurement.
-
To improve the spatial coincidence between MAX-DOAS and TROPOMI observations, a second comparison is performed by using the dual-scan MAX-DOAS observations: measurements in every MAX-DOAS azimuthal direction are compared with a weighted average of TROPOMI columns as measured in coincident pixels with the weighting being determined by the MAX-DOAS horizontal segment crossing every pixel.
-
The impact of possible systematic uncertainties on the satellite retrieval (in particular the a priori profile shape) is investigated.
In order to increase the number of colocation pairs, we compare both UV and visible MAX-DOAS measurements with TROPOMI. It should be emphasized that UV and visible MAX-DOAS VCDs correspond to different dLeff (NO2) values (see Fig. 8 and Sect. 2.3.3) and consequently different sampling of TROPOMI pixels. In the following sections, the regression analysis parameters (correlation coefficient and slope value) refer to both UV and visible MAX-DOAS measurements together.
4.3.1 Validation based on one MAX-DOAS azimuthal direction measurements
In this first approach, the MAX-DOAS tropospheric NO2 VCDs, derived in the main azimuthal direction by applying the MMF algorithm, are compared to TROPOMI observations in the same direction as the MAX-DOAS measurement. We select the closest TROPOMI pixel that intercepts the MAX-DOAS line of sight within a radius of 20 km around Uccle. This approach has generally been used in previous satellite validation studies based on MAX-DOAS observations (e.g., Chen et al., 2009; Irie et al., 2008; Ma et al., 2013). It is adopted for reference against other comparison strategies that make use of more than one azimuthal MAX-DOAS measurement (see Sect. 4.3.2).
We compare TROPOMI daily measurements with MAX-DOAS NO2 VCDs averaged around (±1 h) the TROPOMI overpass time. A first comparison plot is presented in Fig. 12, where the time series of the TROPOMI tropospheric NO2 VCD is displayed together with the visible MAX-DOAS measurements. All TROPOMI and MAX-DOAS data points presented in Fig. 12 satisfy the quality check requirements for both datasets (see Sects. 2.3.1 and 3). The MAX-DOAS error bars represent the standard deviation of the mean values (±1 h) and the typical retrieval uncertainty (see Sect. 2.3), while the TROPOMI bars are equal to the tropospheric column error of the pixel. Results show that MAX-DOAS measurements have larger variability than corresponding TROPOMI observations. In addition, TROPOMI tropospheric NO2 columns are systematically lower than colocated MAX-DOAS data. This finding is in agreement with the recent studies of Griffin et al. (2019), Zhao et al. (2020) and Ialongo et al. (2020).
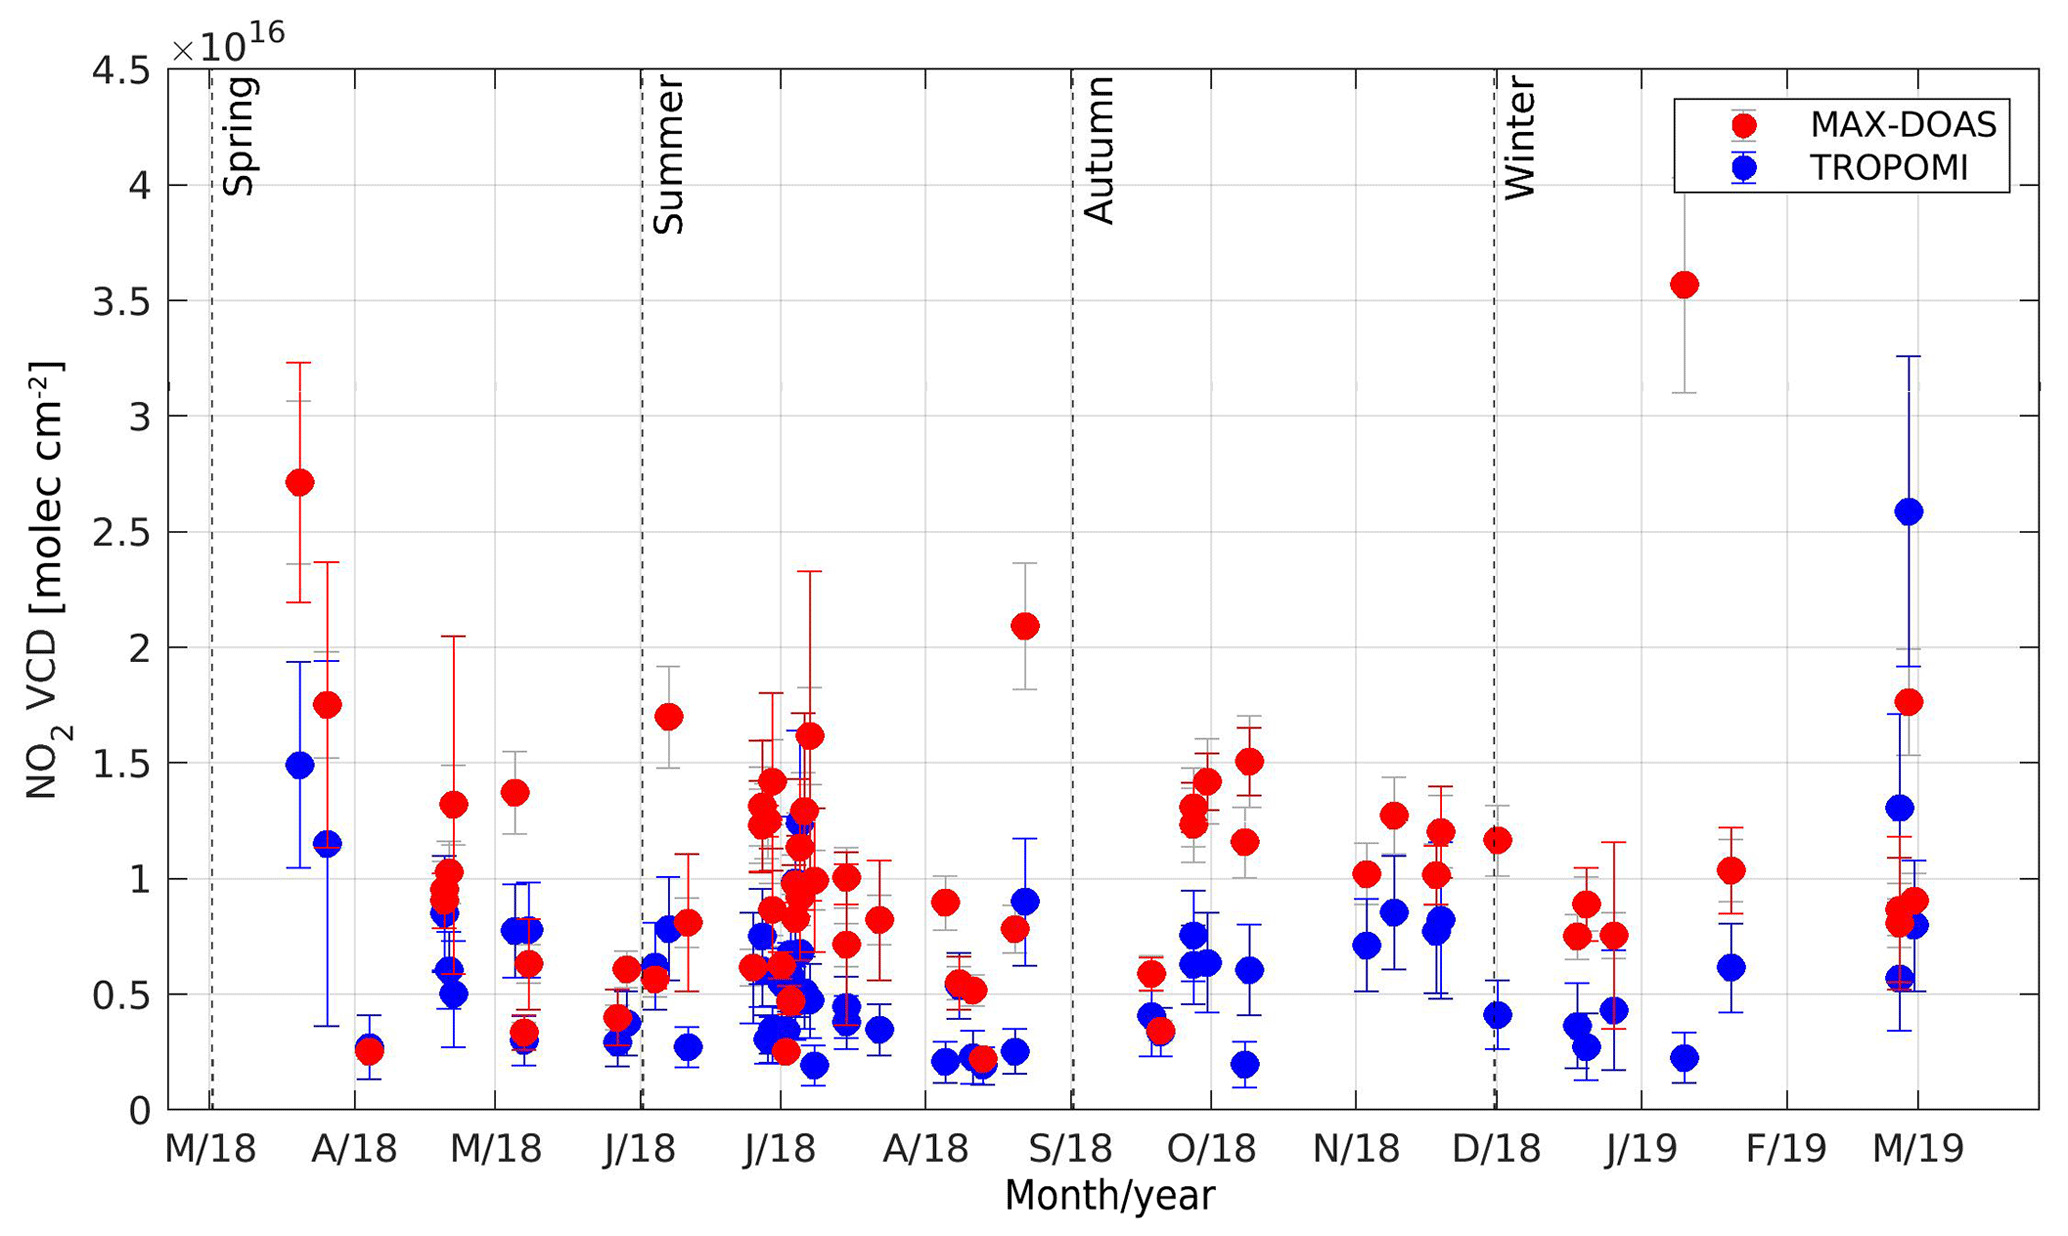
Figure 12Time series of the tropospheric NO2 columns derived from the main azimuthal MAX-DOAS direction observations in the visible range and the closest TROPOMI pixel located along the MAX-DOAS azimuthal direction. The MAX-DOAS error bars (red lines) represent the standard deviation of the averaged values within 1 h before and after TROPOMI's overpass time, and the grey error bars correspond to typical MAX-DOAS inversion uncertainty. The TROPOMI error bars are equal to the TROPOMI VCD error as provided in the data files.
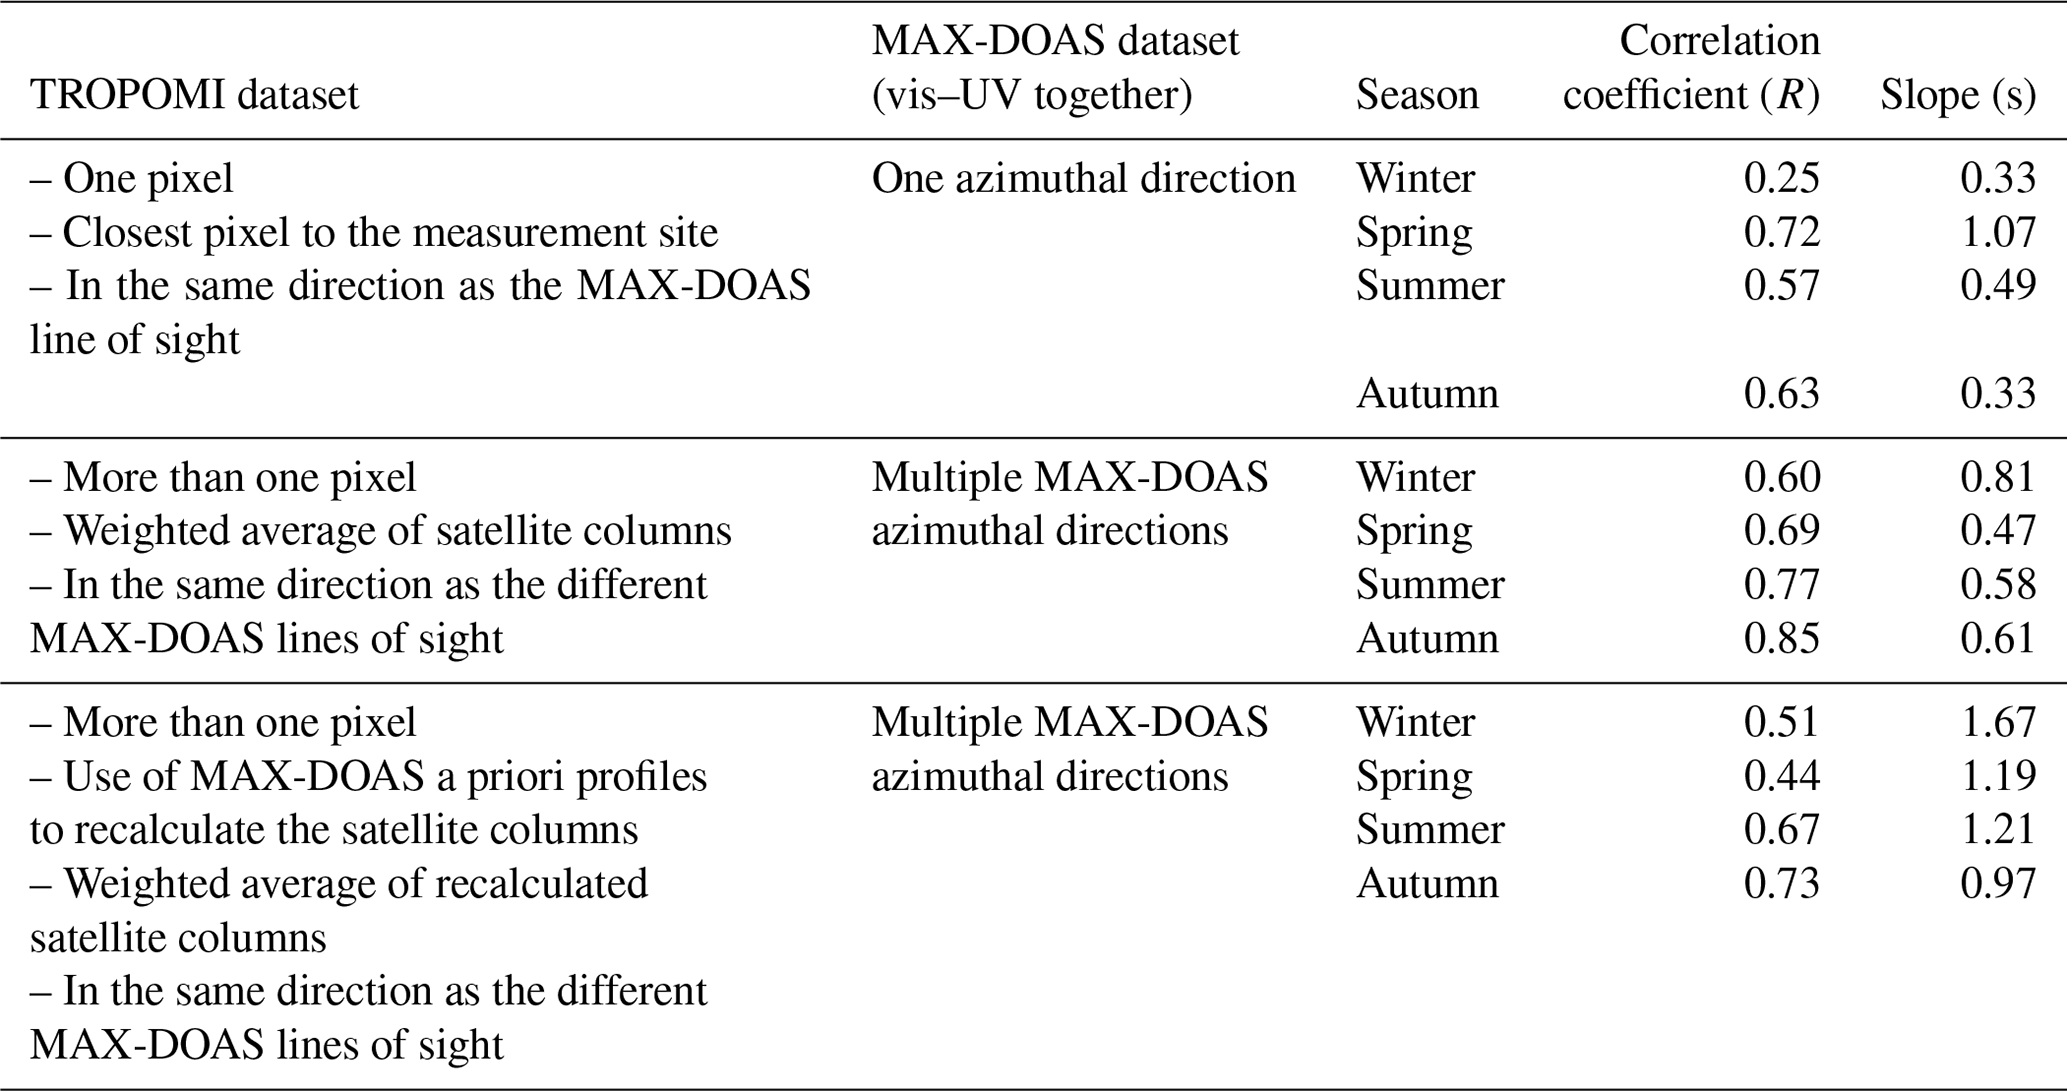
Figure 13 presents scatter plots of TROPOMI tropospheric NO2 VCDs against MAX-DOAS data for the four seasons from March 2018 to March 2019. The highest correlation is found during spring (R=0.71), while lower correlations are obtained in summer, winter and fall, with correlation coefficient values in the 0.25–0.63 range. During autumn 2018, the number of visible data points is significantly smaller than in the UV because of more frequent unrealistic retrieved profiles. On the other hand, during summer, the accepted scans are almost equal for the UV and visible ranges. The same trend of accepted scans to the total number of scans is observed during autumn and summer 2019, indicating that the meteorological conditions (mostly cloud cover) during autumn strongly affect the visible retrieval. Regarding the slope values, they are all smaller than 0.5, except for spring, indicating that TROPOMI columns are about a factor of 2 lower than MAX-DOAS columns (in agreement with the S5P MPC VDAF validation web article, available at: http://mpc-vdaf.tropomi.eu/, last access: 16 January 2020).
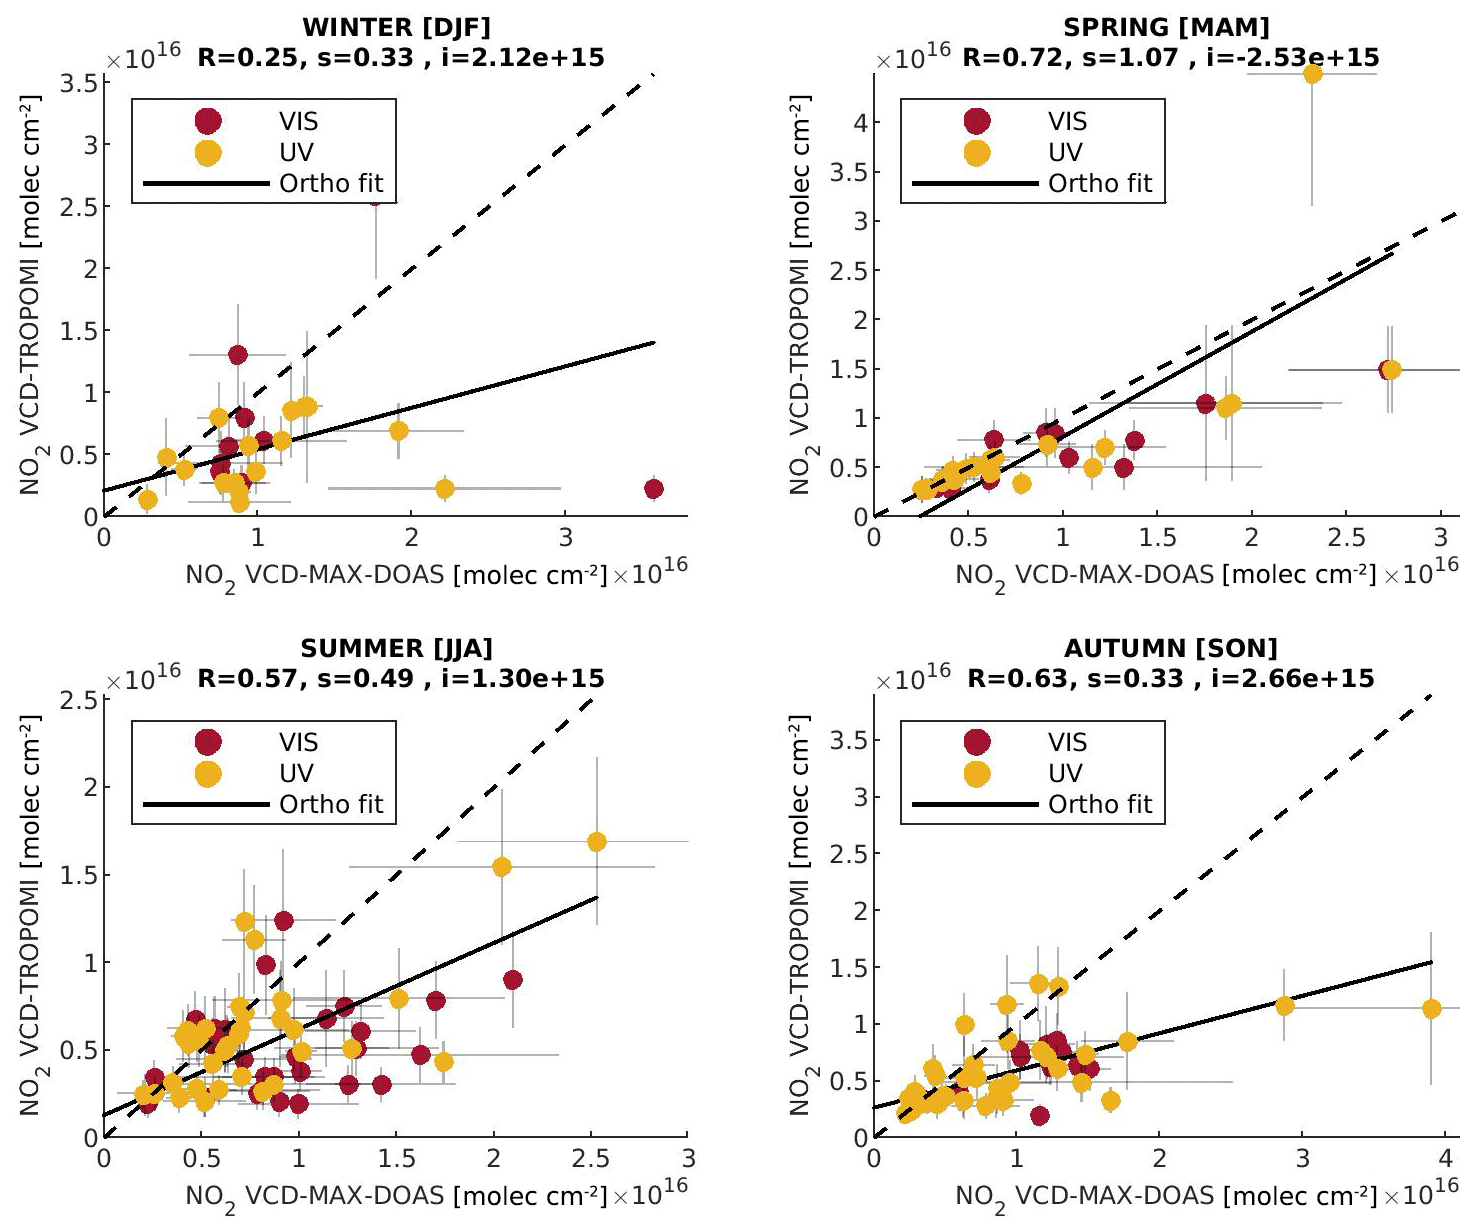
Figure 13Seasonal scatter plots between the tropospheric NO2 columns derived by UV and visible MAX-DOAS observations (yellow and red circles, respectively) in the main azimuthal direction and the closest TROPOMI pixel with respect to the measurement site. The slope is estimated by using orthogonal regression analysis. The error bars are the same as in Fig. 11.
These results indicate that the discrepancy between TROPOMI and MAX-DOAS measurements is significant during all seasons and particularly marked during winter and autumn. A possible explanation could be differences in the air masses probed by the two instruments. The use of only one satellite pixel, even if its direction with respect to the MAX-DOAS line of sight is taken into account, is not necessarily the most appropriate comparison method. One azimuthal MAX-DOAS measurement samples air masses along a light path of several kilometers in a fixed direction, which corresponds to more than one TROPOMI pixel, as outlined in Fig. 7. One expects this horizontal sampling effect to be more marked in winter and fall given the larger NO2 concentration gradients observed during these seasons compared to the other ones (see Sect. 4.1 and Fig. 9).
Validation based on dual-scan MAX-DOAS measurements
In a second step, we compare TROPOMI tropospheric NO2 columns with the dual-scan parameterized MAX-DOAS NO2 VCDs. Two modifications are introduced: (1) the use of more than one MAX-DOAS azimuthal direction and (2) a better spatial selection of the TROPOMI pixels accounting for the MAX-DOAS horizontal sensitivity (dLeff (NO2)). Only satellite pixels located along the segments of length dLeff (NO2) in the different MAX-DOAS azimuthal directions and timely coincident dual-scan MAX-DOAS observations (TROPOMI overpass time ±1 h) are selected. MAX-DOAS NO2 VCDs in every MAX-DOAS azimuthal direction are compared to a weighted average of TROPOMI columns from the different pixels that are crossed by the corresponding MAX-DOAS horizontal line-of-sight segment. The weight of a given pixel is derived from the length of the segment portion that crosses the pixel. We can use Fig. 7 as a simplified scheme to show two important aspects of this comparison: (1) every MAX-DOAS azimuthal line of sight is representative of a segment section that extends from the instrument to a distance equal to dLeff (NO2), and (2) dLeff (NO2) in one azimuthal direction can be separated into different portions that cross each of the selected satellite pixels.
Results displayed in Fig. 14 show that the agreement between TROPOMI and MAX-DOAS datasets is significantly improved, especially in terms of correlation (R in the 0.60–0.85 range instead of 0.25–0.72). Owing to the improved spatial coincidence associated with the use of dual-scan MAX-DOAS data and the better spatial coincident criterion between TROPOMI and MAX-DOAS data, the scatter in the data points is also substantially reduced during all seasons, especially in winter. Another interesting feature is the improvement of the slope values observed in winter and autumn (slopes of 0.81 and 0.61, respectively, instead of 0.33). During seasons (spring, summer) with a more homogeneous NO2 field, the improvement of the slope values is less pronounced than during seasons when the NO2 field can be highly inhomogeneous (i.e., winter and autumn). During spring, the slope value is reduced despite the better correlation. Overall, TROPOMI still underestimates MAX-DOAS measurements by about 40 %–50 %.

Figure 14Seasonal scatter plots between the tropospheric NO2 columns derived from the dual-scan MAX-DOAS observations (in the visible and UV together) and the TROPOMI pixels by using information about the MAX-DOAS horizontal effective light path and the colocation between pixels and azimuthal directions. The MAX-DOAS error bars are the same as in Fig. 11. The TROPOMI error bars represent the standard deviation of the averaged pixel values within a circle with a radius equal to the MAX-DOAS horizontal effective light path.
4.4 Investigation of systematic uncertainties in TROPOMI NO2 retrievals
To identify the origin of the persisting underestimation of TROPOMI NO2 measurements, we investigated the most relevant sources of uncertainties in the satellite retrievals.
Boersma et al. (2004) presented a thorough analysis of satellite tropospheric NO2 column retrieval uncertainties. Main error sources are related to the spectral fitting (dominated by measurement noise), the estimation of the stratospheric NO2 column and knowledge of the main ancillary parameters used for the AMF calculation, i.e., surface albedo, cloud fraction, cloud-top height, aerosols and the a priori NO2 profile shape. In the following subsections, we briefly discuss uncertainties related to cloud, aerosol and surface albedo, and afterwards we investigate in more detail the role of the a priori NO2 profile.
4.4.1 Clouds and aerosols
Clouds can have a major impact on tropospheric NO2 observations from space because of their strong influence on incoming solar radiation (Boersma et al., 2004; Koelemeijer et al., 2001). In the TROPOMI tropospheric NO2 retrieval algorithm, only cloud-free and weakly cloudy scenes are considered valid measurements satisfying the recommended quality assurance value () (see Sect. 3). Although this quality flagging effectively minimizes uncertainties due to clouds on the NO2 product, many selected scenes are still partially cloud-covered and affected by cloud-related errors. In the TROPOMI processor, clouds are characterized by using cloud fraction and cloud-top height parameters, which are both derived from radiance observations in the O2 A band. This cloud information is used as an input in a cloud correction scheme applied to NO2 retrieval (van Geffen et al., 2018). Cloud-induced errors are complex and can lead to positive or negative biases in the tropospheric NO2 column, resulting in considerable scatter in the retrieved columns, especially for small cloud fractions.
Like clouds, aerosols can affect the accuracy of tropospheric NO2 retrieval from space (Heckel et al., 2011; Leitão et al., 2010; McLinden et al., 2014). In the TROPOMI NO2 algorithm, aerosols are not explicitly treated, which means that all AMF calculations are performed for a Rayleigh atmosphere (clouds being treated as simple Lambertian reflectors). The impact of aerosols is, however, considered indirectly through the cloud correction algorithm under the assumption that scattering aerosols will tend to increase the cloud fraction. For non-absorbing aerosols of moderate optical thickness, like typically observed in Brussels, this simplified approach was shown to be effective in accounting for the impact of reflecting aerosols on tropospheric NO2 AMFs (Boersma et al., 2011).
4.4.2 Surface albedo
Surface albedo is another parameter having a significant influence on satellite tropospheric NO2 AMFs. In the study of Boersma et al. (2004), it was shown that the NO2 AMF sensitivity to albedo is large, especially for albedos smaller than 0.2. For albedo values between 0.0 and 0.2, which are common in the blue spectral range over land, a difference of 0.015 in the surface albedo can lead to a 12 % change in the tropospheric NO2 AMF. In order to estimate surface albedo uncertainties in the Uccle conditions, observations from the Airborne Prism Experiment (APEX) performed above Brussels during June 2015 (Tack et al., 2017) were compared with climatological values used in the TROPOMI operational algorithm. The difference between these two independent estimates of the albedo was found to be small on average (smaller than 0.01), suggesting that albedo data used in the TROPOMI algorithm are representative of the Brussels area in June.
However, we should keep in mind that the surface albedo values used in the TROPOMI NO2 AMF calculations have a spatial resolution of and are monthly mean climatology values (Kleipool et al., 2008). In reality, inside an area of an urban environment, we expect to have considerable differences between the albedo values at the scale of TROPOMI pixels. So even if the difference between APEX and TROPOMI albedos was found to be small on average for the June 2015 flight, further investigation is needed to fully assess the impact of albedo uncertainties on the TROPOMI NO2 product (F. Tack, personal communication, 2020). The impact of surface albedo on the NO2 retrievals from satellites, such as GOME-2 and OMI, has been investigated in the recent studies of Liu et al. (2020) and Lamsal et al. (2020), respectively.
4.4.3 A priori NO2 profile shape
The TROPOMI NO2 retrieval algorithm uses NO2 vertical profiles specified by the TM5-MP model for 34 vertical layers at the horizontal resolution of in latitude–longitude (Williams et al., 2017). In comparison to the TROPOMI pixel size (3.5×7 km2), the resolution of TM5-MP (approximately 100×100 km2) is thus very coarse and cannot capture spatial gradients at the scale of a city like Brussels.
A way to test how uncertainties on the a priori profile influence the TROPOMI NO2 VCDs in our observation conditions is to use vertical profiles derived from our MAX-DOAS measurements to recalculate the satellite NO2 VCDs. In order to perform this transformation, we use the averaging kernel (AK) information provided in the TROPOMI NO2 product. The AK describes how the sensitivity of the retrieval depends on altitude. For satellite measurements of tropospheric species in the UV–vis range, the AK generally increases with altitude in the first kilometers above the surface (Fig. 15). Since the NO2 profile has its maximum close to the surface, accurate knowledge of the NO2 vertical distribution in this altitude range is therefore critical for the calculation of the NO2 AMFs.
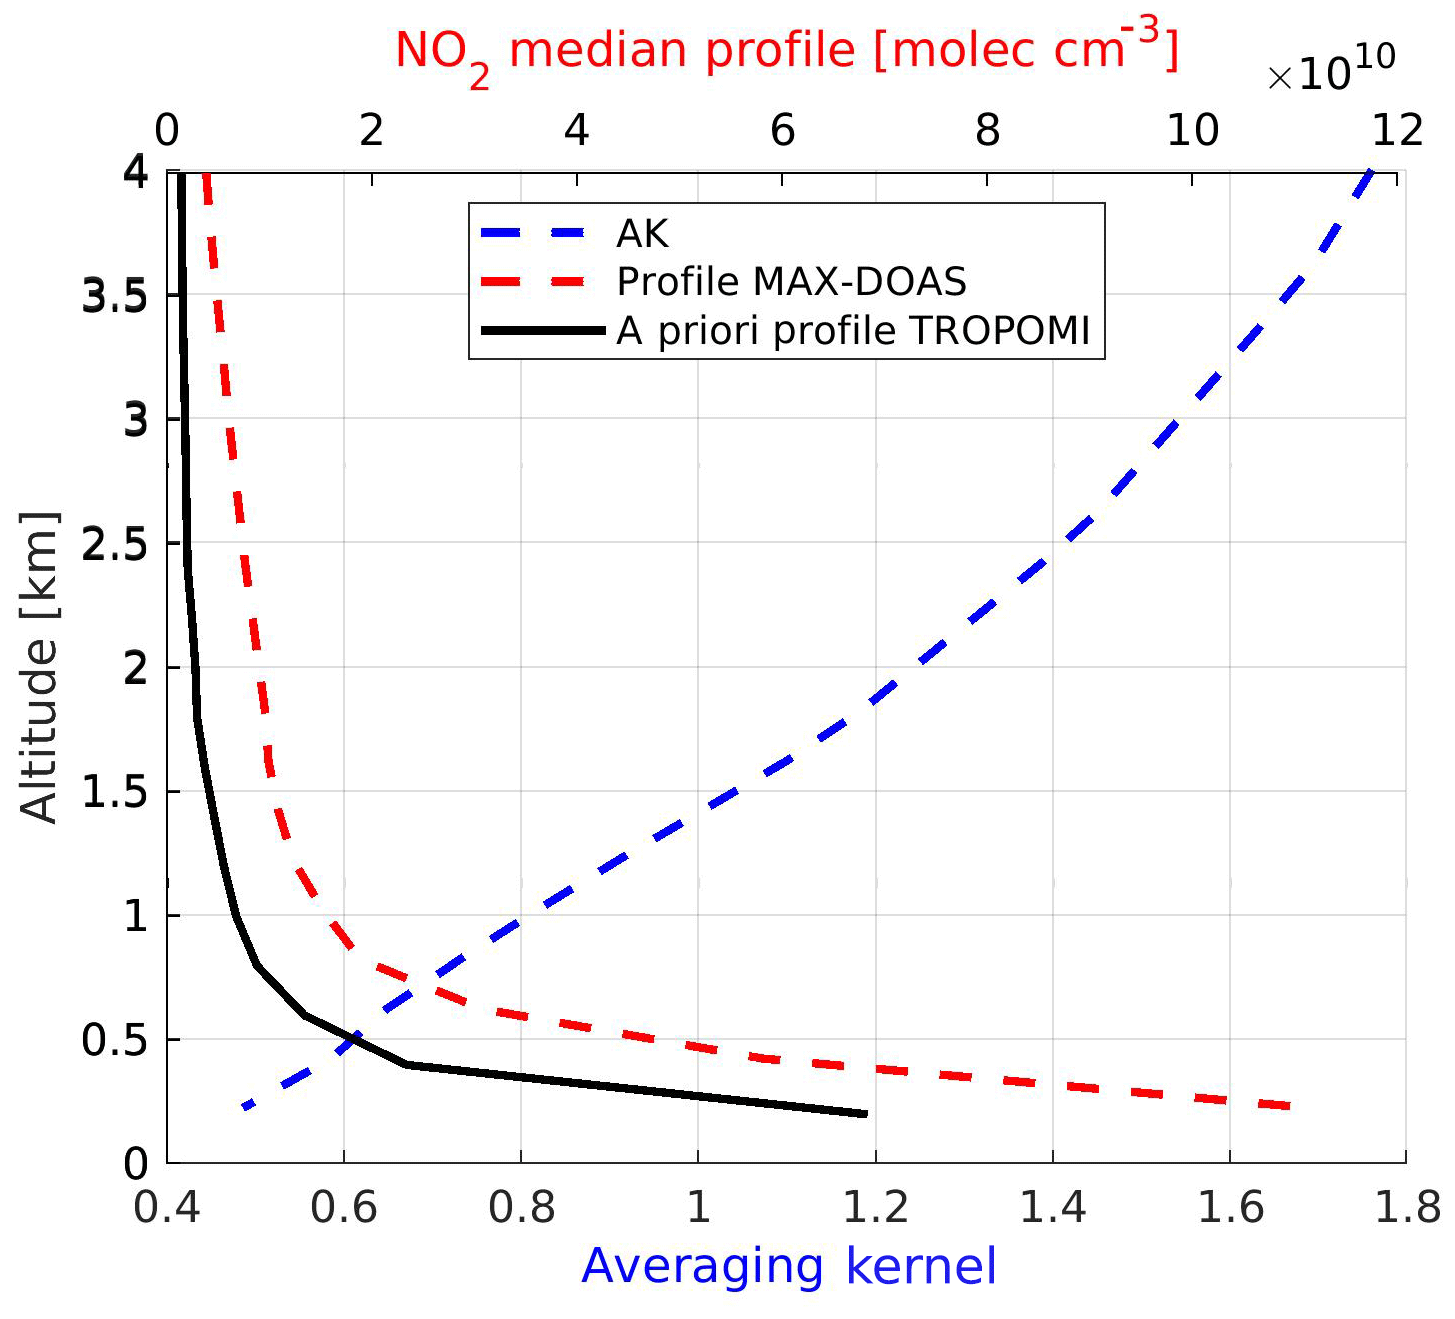
Figure 15Mean TROPOMI averaging kernels (blue line), median MAX-DOAS NO2 profile and median TROPOMI NO2 a priori profiles during summer as a function of altitude.
Using the formula described in Appendix A and daily median MAX-DOAS concentration profiles derived in the main azimuthal direction using the MMF algorithm, a modified version of the TROPOMI tropospheric NO2 column product was generated. Daily median MAX-DOAS profiles were used to minimize the impact of instabilities frequently observed in individual profile retrievals, as illustrated in Fig. 16.
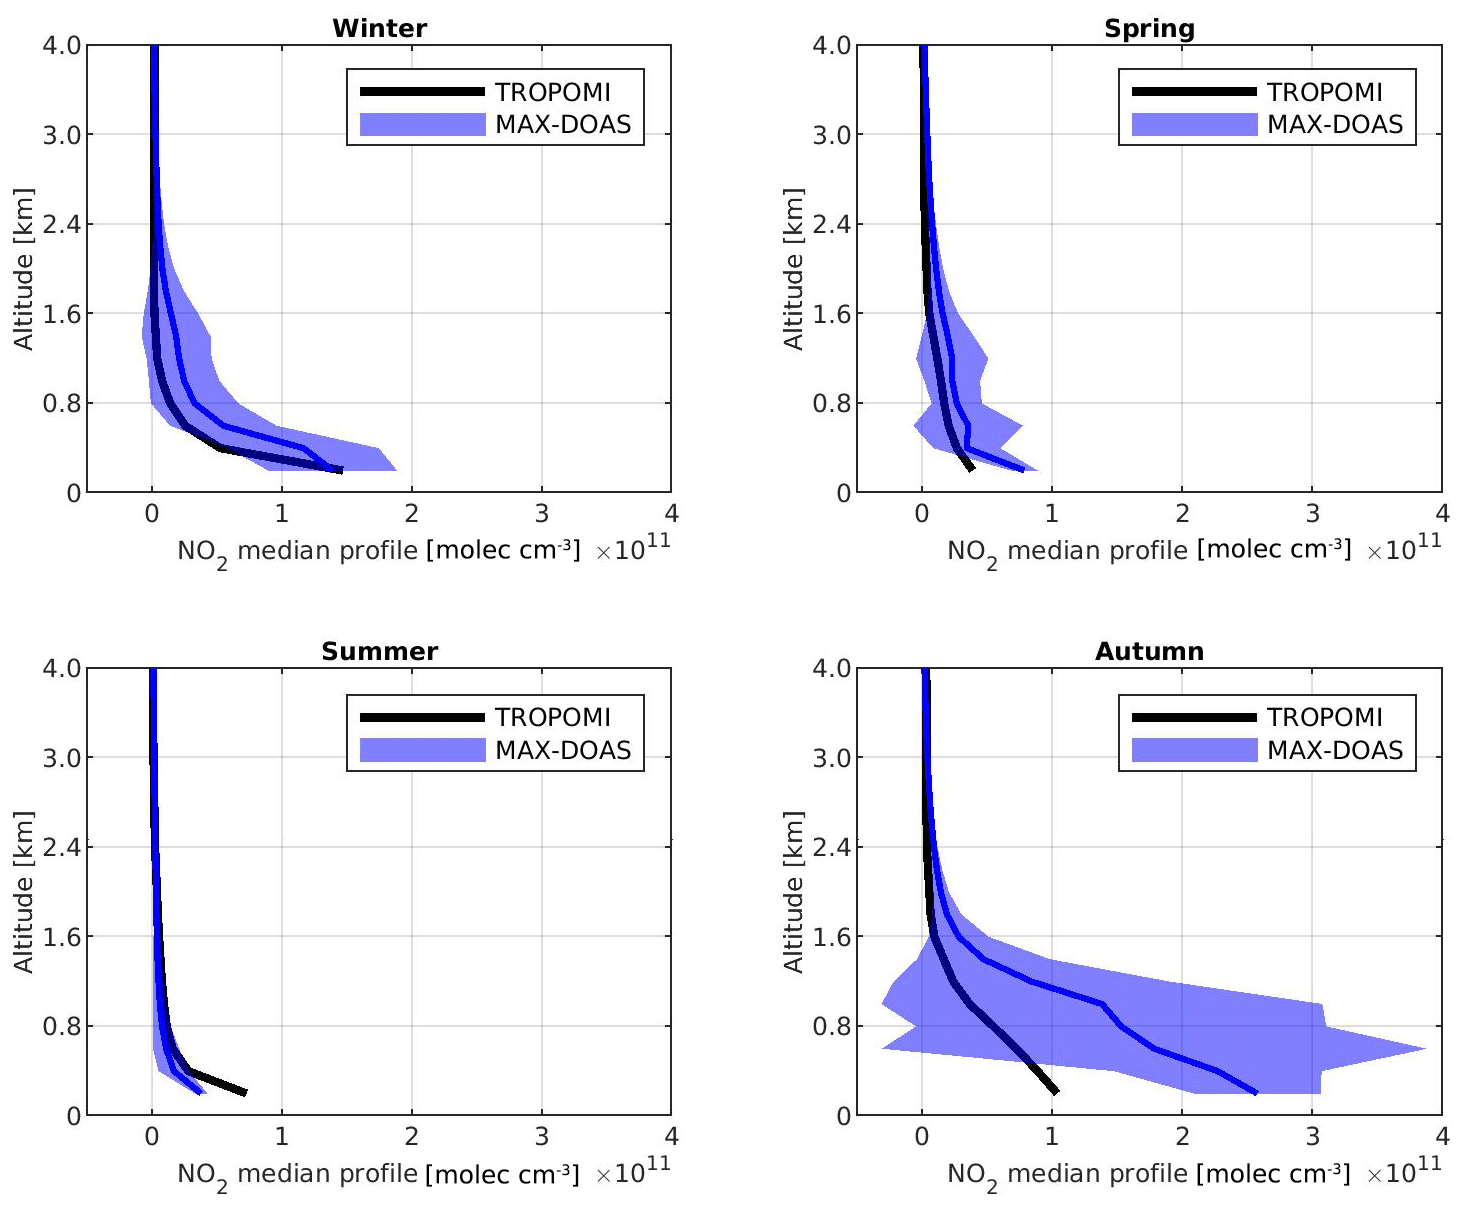
Figure 16Example of median daily MAX-DOAS visible NO2 profiles, which are used for the recalculation of the TROPOMI NO2 columns (one example day per season: 3 March 2019, 12 August 2018, 29 October 2018 and 19 January 2019), and the a priori NO2 profiles used in the TROPOMI retrieval in Uccle during the same example days. The shaded areas (±1σ) represent the variability of the daily profiles.
Figures 15 and 16 present a priori NO2 profiles used in the TROPOMI retrieval. One can see that the a priori TROPOMI NO2 profiles are lower than the median MAX-DOAS NO2 profile (except for the example summer day in Fig. 16). In the first kilometers above the surface, the difference between the two profiles is about 35 % in Fig. 15 and can be up to 80 % for the example autumn day in Fig. 16.
Figure 17 presents validation results corresponding to the recalculated TROPOMI NO2 columns. Comparing with results from Fig. 14, one can see that the change in the NO2 profile shape has a strong impact on validation results, leading to better agreement between satellite and ground-based datasets. During all seasons, the slopes of the linear regressions are largely improved (slopes in the 0.97–1.67 range), which essentially resolves the previously reported underestimation. On average, the recalculated TROPOMI columns increase by about 55 %. Looking more closely at Figs. 14 and 18, one can see that the application of MAX-DOAS NO2 vertical profiles mostly improves the agreement for tropospheric NO2 columns larger than 1.0×10¹⁶ molec. cm−2 (for the cases with NO2 enhancement). One can also note that correlation coefficients are slightly degraded after application of the MAX-DOAS profiles, suggesting that the applied transformation introduces some more scatter in the comparison. Table 7 presents a detailed summary of all the regression analyses conducted.
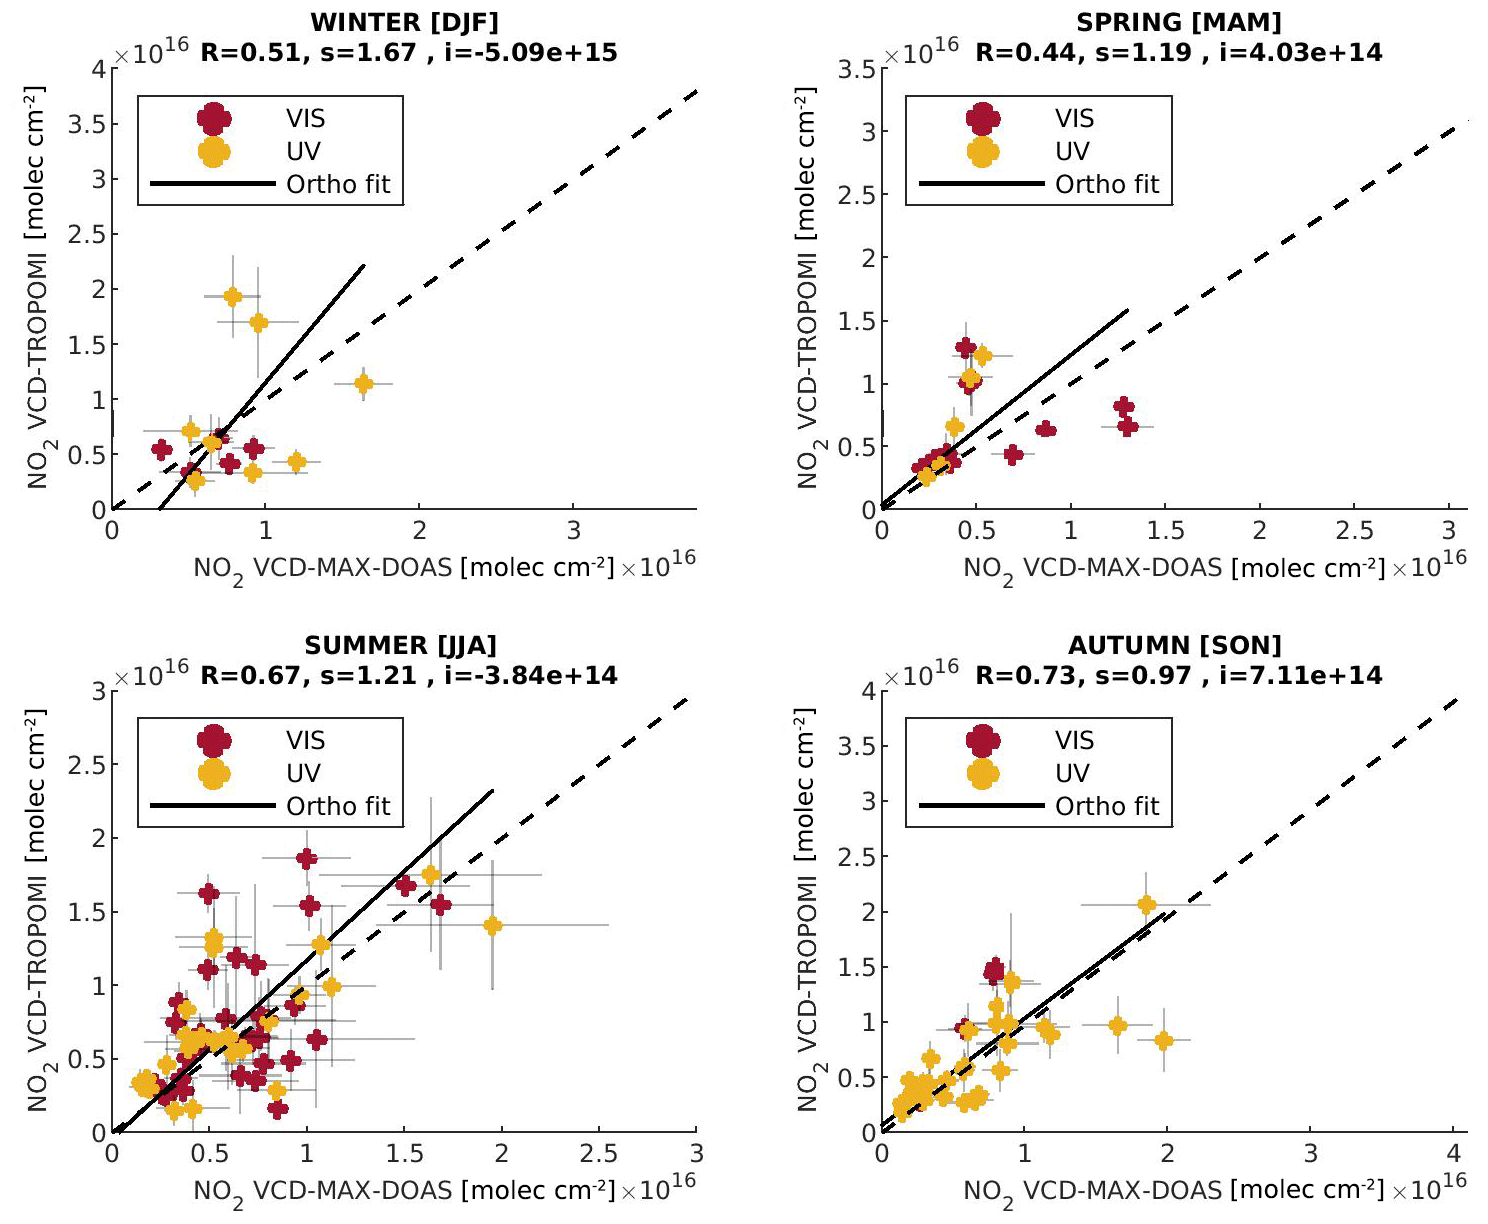
Figure 17Seasonal scatter plots between the tropospheric NO2 columns derived from the 2-D MAX-DOAS UV and visible observations as well as TROPOMI NO2 columns recalculated using the median daily MAX-DOAS vertical profiles as a priori information.
In conclusion, the change of the a priori profile in the TROPOMI retrieval has a significant impact on the agreement between the satellite and MAX-DOAS measurements, leading to a satisfying closure of the validation study. Although based on a different approach, these results are in agreement with the recent studies of Ialongo et al. (2020) and Judd et al. (2019).
A total of 1 year of S5P/TROPOMI tropospheric NO2 columns recorded above Brussels were validated using dual-scan MAX-DOAS measurements. The MAX-DOAS instrument was installed in Uccle, a suburban site located in the south of the Brussels-Capital Region. A standard acquisition scheme was implemented by combining vertical scans in a fixed azimuthal direction (main azimuthal direction pointing to Brussels airport) and horizontal scans in 10 azimuth angles at a fixed elevation angle (2∘). OEM-based profile retrievals were performed in the main azimuthal direction, and a parameterization technique based on Sinreich et al. (2013) was applied in all the other azimuthal directions to retrieve dual-scan NO2 near-surface VMRs and VCDs. An appropriate characterization of the MLH was obtained by using the vertical profile inversion results in the main azimuthal direction.
The dual-scan parameterized NO2 VMRs and VCDs were validated using ancillary measurements. Three different comparisons were carried out: (1) the MAX-DOAS-based MLH values used in the parameterization were compared with measurements from a colocated ceilometer instrument; (2) the parameterized NO2 near-surface VMRs and VCDs retrieved in the main azimuthal direction were compared with the same quantities derived from OEM-based profiles; and (3) the dual-scan NO2 near-surface VMRs were compared with in situ NO2 concentrations. Good overall agreement was found for both comparisons (UV and visible datasets) during the whole year of measurements.
Table 7Summary table of the regression analysis parameters derived by the three validation exercises.
The seasonal variability of the NO2 near-surface VMR around the measurement site was investigated. As expected, higher NO2 concentrations are observed during autumn and winter due to larger emissions, a shallower MLH and lower temperatures, resulting in longer lifetimes. Wind speed and direction are also found to play a significant role in the distribution of NO2 around the site. As the main emission sources are located to the north of Uccle, concentration peaks are associated with wind blowing mainly from the NE direction. The dual-scan MAX-DOAS retrievals were also compared to NO2 measurements from the in situ air quality telemetric network of the Brussels region. For this comparison, in situ stations were selected along the different MAX-DOAS azimuthal directions. Although the in situ measurements show systematically larger values than those derived from the MAX-DOAS instrument, a good correlation is found between the two datasets, especially for urban background sites under moderately polluted conditions.
In a second step, MAX-DOAS data were used to validate TROPOMI tropospheric NO2 measurements. Two different approaches were used. First, the MAX-DOAS NO2 VCDs, derived by applying an OEM-based inversion algorithm in the main azimuthal direction, were compared with the closest TROPOMI pixel located along the main MAX-DOAS pointing direction. Results show a clear seasonal behavior and a tendency for satellite data to underestimate the MAX-DOAS tropospheric NO2 columns during all seasons. In the second approach, the dual-scan parameterized MAX-DOAS tropospheric NO2 columns and corresponding effective horizontal distances were used to define a wider sampling area around the measurement site for the selection of the TROPOMI pixels. MAX-DOAS measurements in every azimuthal direction were compared to a weighted average of TROPOMI columns appropriately selected for optimal matching with MAX-DOAS observation directions and effective horizontal distances. Although dual-scan MAX-DOAS measurements lead to improved agreement with satellite data, a systematic underestimation of the TROPOMI tropospheric columns is still observed.
Further, a detailed investigation of the main ancillary parameters used for the AMF calculation in the TROPOMI tropospheric NO2 columns retrievals revealed that the a priori NO2 profile shape uncertainty has a large impact on the satellite measurements. Recalculating the TROPOMI columns using daily median MAX-DOAS profiles as a priori results in much better agreement between satellite and MAX-DOAS data. This suggests that the use of more appropriate a priori profiles in the TROPOMI retrieval can substantially improve the accuracy of satellite tropospheric NO2 data, especially in urban areas. The improvement is, however, less clear during seasons characterized by highly variable NO2 fields and cloudy conditions.
In conclusion, our study shows that dual-scan MAX-DOAS measurements conducted in an urban area offer the possibility (1) to better characterize the spatial variability of short-lived pollutants like NO2 and (2) to improve the validation of satellite measurements in an urban environment. Moreover, the vertical profiling capability of MAX-DOAS measurements allows for testing the suitability of the a priori profile shape information used in satellite retrievals. Based on our results, additional work could be done to improve future TROPOMI validation exercises. For instance, the horizontal resolution of the satellite a priori profiles could be further improved by performing vertical MAX-DOAS scans during TROPOMI overpass in more than one azimuthal direction. Additionally, the satellite retrieval uncertainties related to clouds and aerosols could be investigated in more detail based on the azimuthal scan capability of MAX-DOAS instruments.
We start from the general formula used to derive the NO2 VCD from satellite measurements (e.g., Boersma et al., 2007):
where SCDSAT stands for the NO2 slant column density and AMFSAT for the NO2 air mass factor as used in the operational algorithm, i.e., based on a priori NO2 vertical profiles specified by the TM5 chemistry transport model.
For optically thin conditions valid in the blue spectral range in which NO2 is retrieved, the satellite AMF (AMFSAT) can be expressed as a linear sum of layer (or box) air mass factors (, weighted by the NO2 VCD contribution in each atmospheric layer:
where represents the a priori NO2 partial column in atmospheric layer i.
In addition, the vertical sensitivity of the NO2 retrieval is given by the averaging kernel (AK) according to
When comparing satellite and ground-based measurements (here from a MAX-DOAS instrument), it is a good practice to smooth the ground-based reference profile using the satellite AK (see, e.g., Eskes and Boersma, 2003):
An alternative approach is to recalculate the satellite VCD using the MAX-DOAS profile as a priori in the satellite retrieval. Only the AMF is concerned and, similarly to Eq. (A2), we can write
or, using Eqs. (A3) and (A4),
which finally leads to
The datasets generated and analyzed in the present work are available from the corresponding author on request.
ED undertook the development and validation of the dual-scan MAX-DOAS retrieval strategy in Uccle, exploited the MAX-DOAS retrievals during 1 year, performed the validation of TROPOMI tropospheric NO2 columns, and wrote the paper. FH supported and guided ED in the MAX-DOAS retrieval exploitation as well as in the different TROPOMI validation approaches and revised and edited the paper. GP provided the dataset of the TROPOMI tropospheric NO2 columns and supported ED in the TROPOMI validation approaches. MMF provided the MMF inversion algorithm and the RTM as well as supporting and guiding ED in the aerosol and NO2 OEM-based profile retrievals in addition to the dAMF forward calculations. AM and FT contributed to scientific discussions and the paper revision. HDL tested different TROPOMI validation approaches in Uccle. CF and CH provided technical and software support for the MAX-DOAS instrument in Uccle. CF developed the QDOAS software and guided ED in the DOAS analysis. QL provided the MLH dataset derived by the ceilometer. FF provided useful information about the in situ dataset. MVR supervised the present work, provided general guidelines and valuable comments during the whole process of the paper preparation, and revised and edited the paper. All authors reviewed, discussed and commented on the paper.
The authors declare that they have no conflict of interest.
This article is part of the special issue “TROPOMI on Sentinel-5 Precursor: first year in operation (AMT/ACP inter-journal SI)”. It is not associated with a conference.
We gratefully acknowledge the Belgian Federal Science Policy Office (BELSPO). The authors would like to thank the AERONET team for providing valuable data.
This research has been supported by the Belgian Science Policy Office BELSPO (Supplementary Researcher, grant no. 60.11.41.30.51).
This paper was edited by Lok Lamsal and reviewed by two anonymous referees.
Beirle, S., Boersma, K. F., Platt, U., Lawrence, M. G., and Wagner, T.: Megacity emissions and lifetimes of nitrogen oxides probed from space, Science, 333, 1737–1739, 2011.
Beirle, S., Dörner, S., Donner, S., Remmers, J., Wang, Y., and Wagner, T.: The Mainz profile algorithm (MAPA), Atmos. Meas. Tech., 12, 1785–1806, https://doi.org/10.5194/amt-12-1785-2019, 2019.
Boersma, K. F., Eskes, H. J., and Brinksma, E. J.: Error analysis for tropospheric NO2 from space, J. Geophys. Res., 109, D04311, https://doi.org/10.1029/2003JD003962, 2004.
Boersma, K. F., Eskes, H. J., Veefkind, J. P., Brinksma, E. J., van der A, R. J., Sneep, M., van den Oord, G. H. J., Levelt, P. F., Stammes, P., Gleason, J. F., and Bucsela, E. J.: Near-real time retrieval of tropospheric NO2 from OMI, Atmos. Chem. Phys., 7, 2103–2118, https://doi.org/10.5194/acp-7-2103-2007, 2007.
Boersma, K. F., Eskes, H. J., Dirksen, R. J., van der A, R. J., Veefkind, J. P., Stammes, P., Huijnen, V., Kleipool, Q. L., Sneep, M., Claas, J., Leitão, J., Richter, A., Zhou, Y., and Brunner, D.: An improved tropospheric NO2 column retrieval algorithm for the Ozone Monitoring Instrument, Atmos. Meas. Tech., 4, 1905–1928, https://doi.org/10.5194/amt-4-1905-2011, 2011.
Bösch, T., Rozanov, V., Richter, A., Peters, E., Rozanov, A., Wittrock, F., Merlaud, A., Lampel, J., Schmitt, S., de Haij, M., Berkhout, S., Henzing, B., Apituley, A., den Hoed, M., Vonk, J., Tiefengraber, M., Müller, M., and Burrows, J. P.: BOREAS – a new MAX-DOAS profile retrieval algorithm for aerosols and trace gases, Atmos. Meas. Tech., 11, 6833–6859, https://doi.org/10.5194/amt-11-6833-2018, 2018.
Bovensmann, H., Burrows, J. P., Buchwitz, M., Frerick, J., Noel, S., Chance, K. V., and Goede, A. P. H.: SCIAMACHY: Mission objectives and measurement modes, J. Atmos. Sci., 56, 127–150, 1999.
Burrows, J. P., Weber, M., Buchwitz, M., Rosanov, V. V., Ladstatter, A., Weissenmayer, A., Richter, A., DeBeek, R., Hoogen, R., Bramstedt, K., and Eichmann, K. U.: The Global Ozone Monitoring Experiment (GOME): Mission concept and first scientific results, J. Atmos. Sci., 56, 151–175, 1999.
Celarier, E. A., Brinksma, E. J., Gleason, J. F., Veefkind, J. P., Cede, A., Herman, J. R, Ionov, D., Goutail, F., Pommereau, J. P., Lambert, J.-C., van Roosendael, M., Pinardi, G., Wittrock, F., Schönhardt, A., Richter, A., Ibrahim, O. W., Wagner, T., Bojkov, B., Mount, G., Spinei, E., Chen, C. M., Pongetti, T. J., Sander, S. P., Bucsela, E. J., Wenig, M. O., Swart, D. P. J., Volten, H., Kroon, M., and Levelt, P. F.: Validation of Ozone Monitoring Instrument Nitrogen Dioxide Columns, J. Geophys. Res., 113, D15S15, https://doi.org/10.1029/2007JD008908, 2008.
Chen, D., Zhou, B., Beirle, S., Chen, L. M., and Wagner, T.: Tropospheric NO2 column densities deduced from zenith-sky DOAS measurements in Shanghai, China, and their application to satellite validation, Atmos. Chem. Phys., 9, 3641–3662, https://doi.org/10.5194/acp-9-3641-2009, 2009.
Clémer, K., Van Roozendael, M., Fayt, C., Hendrick, F., Hermans, C., Pinardi, G., Spurr, R., Wang, P., and De Mazière, M.: Multiple wavelength retrieval of tropospheric aerosol optical properties from MAXDOAS measurements in Beijing, Atmos. Meas. Tech., 3, 863–878, https://doi.org/10.5194/amt-3-863-2010, 2010.
Crutzen, P. J.: The role of NO and NO2 in the chemistry of the troposphere and the stratosphere, Annu. Rev. Earth. Planet. Sci, 7, 443–472, 1979.
Donner, S., Kuhn, J., Van Roozendael, M., Bais, A., Beirle, S., Bösch, T., Bognar, K., Bruchkouski, I., Chan, K. L., Dörner, S., Drosoglou, T., Fayt, C., Frieß, U., Hendrick, F., Hermans, C., Jin, J., Li, A., Ma, J., Peters, E., Pinardi, G., Richter, A., Schreier, S. F., Seyler, A., Strong, K., Tirpitz, J.-L., Wang, Y., Xie, P., Xu, J., Zhao, X., and Wagner, T.: Evaluating different methods for elevation calibration of MAX-DOAS (Multi AXis Differential Optical Absorption Spectroscopy) instruments during the CINDI-2 campaign, Atmos. Meas. Tech., 13, 685–712, https://doi.org/10.5194/amt-13-685-2020, 2020.
Ehhalt, D. H., Rohrer, F., and Wahner, A.: Sources and distribution of NOx in the upper troposphere at northern midlatitudes, J. Geophys. Res., 97, 3725–3738, https://doi.org/10.1029/91JD03081, 1992.
Eskes, H. J. and Boersma, K. F.: Averaging kernels for DOAS total-column satellite retrievals, Atmos. Chem. Phys., 3, 1285–1291, https://doi.org/10.5194/acp-3-1285-2003, 2003.
Fayt, C., De Smedt, I., Letocart, V., Merlaud, A., Pinardi, G., and Van Roozendael, M.: QDOAS Software user manual, available at: http://uv-vis.aeronomie.be/software/QDOAS/index.php (last access: 16 July 2020), 2011.
Fleischmann, O. C., Hartmann, M., Burrows, J. P., and Orphal, J.: New ultraviolet absorption cross-sections of BrO at atmospheric temperatures measured by time-windowing Fourier transform spectroscopy, J. Photoch. Photobio. A, 168, 117–132, 2004.
Friedrich, M. M., Rivera, C., Stremme, W., Ojeda, Z., Arellano, J., Bezanilla, A., García-Reynoso, J. A., and Grutter, M.: NO2 vertical profiles and column densities from MAX-DOAS measurements in Mexico City, Atmos. Meas. Tech., 12, 2545–2565, https://doi.org/10.5194/amt-12-2545-2019, 2019.
Frieß, U., Monks, P. S., Remedios, J. J., Rozanov, A., Sinreich, R., Wagner, T., and Platt, U.: MAX-DOAS O4 measurements: A new technique to derive information on atmospheric aerosols: 2. Modeling studies, J. Geophys. Res., 111, D14203, https://doi.org/10.1029/2005JD006618, 2006.
Frieß, U., Beirle, S., Alvarado Bonilla, L., Bösch, T., Friedrich, M. M., Hendrick, F., Piters, A., Richter, A., van Roozendael, M., Rozanov, V. V., Spinei, E., Tirpitz, J.-L., Vlemmix, T., Wagner, T., and Wang, Y.: Intercomparison of MAX-DOAS vertical profile retrieval algorithms: studies using synthetic data, Atmos. Meas. Tech., 12, 2155–2181, https://doi.org/10.5194/amt-12-2155-2019, 2019.
Gielen, C., Van Roozendael, M., Hendrick, F., Pinardi, G., Vlemmix, T., De Bock, V., De Backer, H., Fayt, C., Hermans, C., Gillotay, D., and Wang, P.: A simple and versatile cloud-screening method for MAX-DOAS retrievals, Atmos. Meas. Tech., 7, 3509–3527, https://doi.org/10.5194/amt-7-3509-2014, 2014.
Gillotay, D., Besnard, T., and Zanghi, F.: A systematic approach of the cloud cover by thermic infrared measurements, Proceedings of 18th Conference on Weather Analysis and Forecasting, Fort Lauderdale, Fl, USA, 30 July–2 August 2001, 292–295, 2001.
Griffin, D., Zhao, X., McLinden, C. A., Boersma, F., Bourassa, A., Dammers, E., Degenstein, D., Eskes, H., Fehr, L., Fioletov, V., Hayden, K., Kharol, S. K., Li, S.-M., Makar, P., Martin, R. V., Mihele, C., Mittermeier, R. L., Krotkov, N., Sneep, M., Lamsal, L. N., terLinden, M., vanGeffen, J., Veefkind,P., and Wolde, M.: High-Resolution Mapping of Nitrogen Dioxide With TROPOMI: First Results and Validation Over the Canadian Oil Sands, Geophys. Res. Lett., 46, 1049–1060, https://doi.org/10.1029/2018GL081095, 2019.
Haeffelin, M., Laffineur, Q., Bravo-Aranda, J.-A., Drouin, M.-A., Casquero-Vera, J.-A., Dupont, J.-C., and De Backer, H.: Radiation fog formation alerts using attenuated backscatter power from automatic lidars and ceilometers, Atmos. Meas. Tech., 9, 5347–5365, https://doi.org/10.5194/amt-9-5347-2016, 2016.
Haij, M. D., Wauben, W., and Klein Baltink, H.: Continuous mixing layer height determination using the LD-40 ceilometer: a feasibility study, Tech. Rep. KNMI Scientific Report WR 2007-01, KNMI, De Bilt, the Netherlands, 2007.
Heckel, A., Kim, S.-W., Frost, G. J., Richter, A., Trainer, M., and Burrows, J. P.: Influence of low spatial resolution a priori data on tropospheric NO2 satellite retrievals, Atmos. Meas. Tech., 4, 1805–1820, https://doi.org/10.5194/amt-4-1805-2011, 2011.
Hendrick, F., Müller, J.-F., Clémer, K., Wang, P., De Mazière, M., Fayt, C., Gielen, C., Hermans, C., Ma, J. Z., Pinardi, G., Stavrakou, T., Vlemmix, T., and Van Roozendael, M.: Four years of ground-based MAX-DOAS observations of HONO and NO2 in the Beijing area, Atmos. Chem. Phys., 14, 765–781, https://doi.org/10.5194/acp-14-765-2014, 2014.
Hönninger, G., von Friedeburg, C., and Platt, U.: Multi axis differential optical absorption spectroscopy (MAX-DOAS), Atmos. Chem. Phys., 4, 231–254, https://doi.org/10.5194/acp-4-231-2004, 2004.
Huijnen, V., Eskes, H. J., Poupkou, A., Elbern, H., Boersma, K. F., Foret, G., Sofiev, M., Valdebenito, A., Flemming, J., Stein, O., Gross, A., Robertson, L., D'Isidoro, M., Kioutsioukis, I., Friese, E., Amstrup, B., Bergstrom, R., Strunk, A., Vira, J., Zyryanov, D., Maurizi, A., Melas, D., Peuch, V.-H., and Zerefos, C.: Comparison of OMI NO2 tropospheric columns with an ensemble of global and European regional air quality models, Atmos. Chem. Phys., 10, 3273–3296, https://doi.org/10.5194/acp-10-3273-2010, 2010.
Ialongo, I., Virta, H., Eskes, H., Hovila, J., and Douros, J.: Comparison of TROPOMI/Sentinel-5 Precursor NO2 observations with ground-based measurements in Helsinki, Atmos. Meas. Tech., 13, 205–218, https://doi.org/10.5194/amt-13-205-2020, 2020.
Irie, H., Kanaya, Y., Akimoto, H., Tanimoto, H., Wang, Z., Gleason, J. F., and Bucsela, E. J.: Validation of OMI tropospheric NO2 column data using MAX-DOAS measurements deep inside the North China Plain in June 2006: Mount Tai Experiment 2006, Atmos. Chem. Phys., 8, 6577–6586, https://doi.org/10.5194/acp-8-6577-2008, 2008.
Irie, H., Takashima, H., Kanaya, Y., Boersma, K. F., Gast, L., Wittrock, F., Brunner, D., Zhou, Y., and Van Roozendael, M.: Eight-component retrievals from ground-based MAX-DOAS observations, Atmos. Meas. Tech., 4, 1027–1044, https://doi.org/10.5194/amt-4-1027-2011, 2011.
Irie, H., Boersma, K. F., Kanaya, Y., Takashima, H., Pan, X., and Wang, Z. F.: Quantitative bias estimates for tropospheric NO2 columns retrieved from SCIAMACHY, OMI, and GOME-2 using a common standard for East Asia, Atmos. Meas. Tech., 5, 2403–2411, https://doi.org/10.5194/amt-5-2403-2012, 2012.
Judd, L. M., Al-Saadi, J. A., Janz, S. J., Kowalewski, M. G., Pierce, R. B., Szykman, J. J., Valin, L. C., Swap, R., Cede, A., Mueller, M., Tiefengraber, M., Abuhassan, N., and Williams, D.: Evaluating the impact of spatial resolution on tropospheric NO2 column comparisons within urban areas using high-resolution airborne data, Atmos. Meas. Tech., 12, 6091–6111, https://doi.org/10.5194/amt-12-6091-2019, 2019.
Kleipool, Q. L., Dobber, M. R., de Haan, J. F., and Levelt, P. F.: Earth surface reflectance climatology from 3 years of OMI data, J. Geophys. Res.-Atmos., 113, D18308, https://doi.org/10.1029/2008JD010290, 2008.
Koelemeijer, R. B. A., Stammes, P., Hovenier, J. W., and de Haan, J. F.: A fast method for retrieval of cloud parameters using oxygen A band measurements from the Global Ozone Monitoring Experiment, J. Geophys. Res., 106, 3475–3490, https://doi.org/10.1029/2000JD900657, 2001.
Kramer, L. J., Leigh, R. J., Remedios, J. J., and Monks, P. S.: Comparison of OMI and ground-based in situ and MAX-DOAS measurements of tropospheric nitrogen dioxide in an urban area, J. Geophys. Res., 113, D16S39, https://doi.org/10.1029/2007JD009168, 2008.
Kreher, K., Van Roozendael, M., Hendrick, F., Apituley, A., Dimitropoulou, E., Frieß, U., Richter, A., Wagner, T., Lampel, J., Abuhassan, N., Ang, L., Anguas, M., Bais, A., Benavent, N., Bösch, T., Bognar, K., Borovski, A., Bruchkouski, I., Cede, A., Chan, K. L., Donner, S., Drosoglou, T., Fayt, C., Finkenzeller, H., Garcia-Nieto, D., Gielen, C., Gómez-Martín, L., Hao, N., Henzing, B., Herman, J. R., Hermans, C., Hoque, S., Irie, H., Jin, J., Johnston, P., Khayyam Butt, J., Khokhar, F., Koenig, T. K., Kuhn, J., Kumar, V., Liu, C., Ma, J., Merlaud, A., Mishra, A. K., Müller, M., Navarro-Comas, M., Ostendorf, M., Pazmino, A., Peters, E., Pinardi, G., Pinharanda, M., Piters, A., Platt, U., Postylyakov, O., Prados-Roman, C., Puentedura, O., Querel, R., Saiz-Lopez, A., Schönhardt, A., Schreier, S. F., Seyler, A., Sinha, V., Spinei, E., Strong, K., Tack, F., Tian, X., Tiefengraber, M., Tirpitz, J.-L., van Gent, J., Volkamer, R., Vrekoussis, M., Wang, S., Wang, Z., Wenig, M., Wittrock, F., Xie, P. H., Xu, J., Yela, M., Zhang, C., and Zhao, X.: Intercomparison of NO2, O4, O3 and HCHO slant column measurements by MAX-DOAS and zenith-sky UV–visible spectrometers during CINDI-2, Atmos. Meas. Tech., 13, 2169–2208, https://doi.org/10.5194/amt-13-2169-2020, 2020.
Lamsal, L. N., Krotkov, N. A., Vasilkov, A., Marchenko, S., Qin, W., Yang, E.-S., Fasnacht, Z., Joiner, J., Choi, S., Haffner, D., Swartz, W. H., Fisher, B., and Bucsela, E.: OMI/Aura Nitrogen Dioxide Standard Product with Improved Surface and Cloud Treatments, Atmos. Meas. Tech. Discuss., https://doi.org/10.5194/amt-2020-200, in review, 2020.
Leitão, J., Richter, A., Vrekoussis, M., Kokhanovsky, A., Zhang, Q. J., Beekmann, M., and Burrows, J. P.: On the improvement of NO2 satellite retrievals – aerosol impact on the airmass factors, Atmos. Meas. Tech., 3, 475–493, https://doi.org/10.5194/amt-3-475-2010, 2010.
Levelt, P. F., van den Oord, G. H. J., Dobber, M. R., Malkki, A., Visser, H., de Vries, J., Stammes, P., Lundell, J., and Saari, H.: The Ozone Monitoring Instrument, IEEE T. Geosci. Remote Sens., 44, 1093–1101, 2006.
Liu, S., Valks, P., Pinardi, G., Xu, J., Argyrouli, A., Lutz, R., Tilstra, L. G., Huijnen, V., Hendrick, F., and Van Roozendael, M.: An improved air mass factor calculation for nitrogen dioxide measurements from the Global Ozone Monitoring Experiment-2 (GOME-2), Atmos. Meas. Tech., 13, 755–787, https://doi.org/10.5194/amt-13-755-2020, 2020.
Ma, J. Z., Beirle, S., Jin, J. L., Shaiganfar, R., Yan, P., and Wagner, T.: Tropospheric NO2 vertical column densities over Beijing: results of the first three years of ground-based MAX-DOAS measurements (2008–2011) and satellite validation, Atmos. Chem. Phys., 13, 1547–1567, https://doi.org/10.5194/acp-13-1547-2013, 2013.
McLinden, C. A., Fioletov, V., Boersma, K. F., Kharol, S. K., Krotkov, N., Lamsal, L., Makar, P. A., Martin, R. V., Veefkind, J. P., and Yang, K.: Improved satellite retrievals of NO2 and SO2 over the Canadian oil sands and comparisons with surface measurements, Atmos. Chem. Phys., 14, 3637–3656, https://doi.org/10.5194/acp-14-3637-2014, 2014.
Meller, R. and Moortgat, G. K.: Temperature dependence of the absorption cross sections of formaldehyde between 223 and 323 K in the wavelength range 225–375 nm, J. Geophys. Res., 105, 7089–7101, 2000.
Menut, L., Flamant, C., Pelon, J., and Flamant, P. H.: Urban boundary-layer height determination from lidar measurements over the Paris area, Appl. Opt., 38, 945–954, 1999.
Munro, R., Lang, R., Klaes, D., Poli, G., Retscher, C., Lindstrot, R., Huckle, R., Lacan, A., Grzegorski, M., Holdak, A., Kokhanovsky, A., Livschitz, J., and Eisinger, M.: The GOME-2 instrument on the Metop series of satellites: instrument design, calibration, and level 1 data processing – an overview, Atmos. Meas. Tech., 9, 1279–1301, https://doi.org/10.5194/amt-9-1279-2016, 2016.
Ortega, I., Koenig, T., Sinreich, R., Thomson, D., and Volkamer, R.: The CU 2-D-MAX-DOAS instrument – Part 1: Retrieval of 3-D distributions of NO2 and azimuth-dependent OVOC ratios, Atmos. Meas. Tech., 8, 2371–2395, https://doi.org/10.5194/amt-8-2371-2015, 2015.
Peters, E., Wittrock, F., Großmann, K., Frieß, U., Richter, A., and Burrows, J. P.: Formaldehyde and nitrogen dioxide over the remote western Pacific Ocean: SCIAMACHY and GOME-2 validation using ship-based MAX-DOAS observations, Atmos. Chem. Phys., 12, 11179–11197, https://doi.org/10.5194/acp-12-11179-2012, 2012.
Pinardi, G., Hendrick, F., Clémer, K., Lambert, J. C., Bai, J., and Van Roozendael, M.: On the use of the MAX-DOAS technique for the validation of tropospheric NO2 column measurements from satellite, Proc. Eumetsat Conf., ISBN 978-92-9110-082-8, 2008.
Pinardi, G., Van Roozendael, M., Abuhassan, N., Adams, C., Cede, A., Clémer, K., Fayt, C., Frieß, U., Gil, M., Herman, J., Hermans, C., Hendrick, F., Irie, H., Merlaud, A., Navarro Comas, M., Peters, E., Piters, A. J. M., Puentedura, O., Richter, A., Schönhardt, A., Shaiganfar, R., Spinei, E., Strong, K., Takashima, H., Vrekoussis, M., Wagner, T., Wittrock, F., and Yilmaz, S.: MAX-DOAS formaldehyde slant column measurements during CINDI: intercomparison and analysis improvement, Atmos. Meas. Tech., 6, 167–185, https://doi.org/10.5194/amt-6-167-2013, 2013.
Pinardi, G., Van Roozendael, M., Hendrick, F., Theys, N., Abuhassan, N., Bais, A., Boersma, F., Cede, A., Chong, J., Donner, S., Drosoglou, T., Frieß, U., Granville, J., Herman, J. R., Eskes, H., Holla, R., Hovila, J., Irie, H., Kanaya, Y., Karagkiozidis, D., Kouremeti, N., Lambert, J.-C., Ma, J., Peters, E., Piters, A., Postylyakov, O., Richter, A., Remmers, J., Takashima, H., Tiefengraber, M., Valks, P., Vlemmix, T., Wagner, T., and Wittrock, F.: Validation of tropospheric NO2 column measurements of GOME-2A and OMI using MAX-DOAS and direct sun network observations, Atmos. Meas. Tech. Discuss., https://doi.org/10.5194/amt-2020-76, in review, 2020.
Platt, U. and Stutz, J.: Differential Optical Absorption Spectroscopy (DOAS), Principle and Applications, Springer Verlag Heidelberg, ISBN 3-340-21193-4, 2008.
Rodgers, C. D.: Inverse Methods for Atmospheric Sounding: Theory and Practice, World Sci., Singapore, 2000.
Rothman, L. S., Gordon, I. E., Barber, R. J., Dothe, H., Gamache, R. R., Goldman, A., Perevalov, V. I., Tashkun, S. A., and Tennyson, J.: HITEMP, the high-temperature molecular spectroscopic database, J. Quant. Spectrosc. Ra., 111, 2139–2150, https://doi.org/10.1016/j.jqsrt.2010.05.001, 2010.
Schreier, S. F., Richter, A., and Burrows, J. P.: Near-surface and path-averaged mixing ratios of NO2 derived from car DOAS zenith-sky and tower DOAS off-axis measurements in Vienna: a case study, Atmos. Chem. Phys., 19, 5853–5879, https://doi.org/10.5194/acp-19-5853-2019, 2019a.
Schreier, S. F., Richter, A., Peters, E., Ostendorf, M., Schmalwieser, A. W., Weihs, P., and Burrows, J. P.: Dual ground-based MAX-DOAS observations in Vienna, Austria: Evaluation of horizontal and temporal NO2, HCHO, and CHOCHO distributions and comparison with independent data sets, Atmos. Environ., 5, 100, https://doi.org/10.1016/j.aeaoa.2019.100059, 2019b.
Seinfeld, J. H. and Pandis, S. N.: Atmospheric Chemistry and Physics: From Air Pollution to Climate Change, John Wiley & Sons, Inc., 1998.
Serdyuchenko, A., Gorshelev, V., Weber, M., Chehade, W., and Burrows, J. P.: High spectral resolution ozone absorption cross-sections – Part 2: Temperature dependence, Atmos. Meas. Tech., 7, 625–636, https://doi.org/10.5194/amt-7-625-2014, 2014.
Seyler, A., Meier, A. C., Wittrock, F., Kattner, L., Mathieu-Üffing, B., Peters, E., Richter, A., Ruhtz, T., Schönhardt, A., Schmolke, S., and Burrows, J. P.: Studies of the horizontal inhomogeneities in NO2 concentrations above a shipping lane using ground-based multi-axis differential optical absorption spectroscopy (MAX-DOAS) measurements and validation with airborne imaging DOAS measurements, Atmos. Meas. Tech., 12, 5959–5977, https://doi.org/10.5194/amt-12-5959-2019, 2019.
Sinreich, R., Frieß, U., Wagner, T., and Platt, U.: Multi axis differential optical absorption spectroscopy (MAX-DOAS) of gas and aerosol distributions, Faraday Discuss., 130, 153–164, https://doi.org/10.1039/b419274p, 2005.
Sinreich, R., Merten, A., Molina, L., and Volkamer, R.: Parameterizing radiative transfer to convert MAX-DOAS dSCDs into near-surface box-averaged mixing ratios, Atmos. Meas. Tech., 6, 1521–1532, https://doi.org/10.5194/amt-6-1521-2013, 2013.
Sinreich, R., Volkamer, R., Filsinger, F., Frieß, U., Kern, C., Platt, U., Sebastián, O., and Wagner, T.: MAX-DOAS detection of glyoxal during ICARTT 2004, Atmos. Chem. Phys., 7, 1293–1303, https://doi.org/10.5194/acp-7-1293-2007, 2007.
Spurr, R. J.: VLIDORT: A linearized pseudo-spherical vector discrete ordinate radiative transfer code for forward model and retrieval studies in multilayer multiple scattering media, J. Quant. Spectrosc. Ra., 102, 316–342, 2006.
Stull, R. B.: Mean Boundary Layer Characteristics, in: An Introduction to Boundary Layer Meteorology, 1–27, Springer Netherlands, Dordrecht, 1988.
Tack, F., Merlaud, A., Iordache, M.-D., Danckaert, T., Yu, H., Fayt, C., Meuleman, K., Deutsch, F., Fierens, F., and Van Roozendael, M.: High-resolution mapping of the NO2 spatial distribution over Belgian urban areas based on airborne APEX remote sensing, Atmos. Meas. Tech., 10, 1665–1688, https://doi.org/10.5194/amt-10-1665-2017, 2017.
Takashima, H., Irie, H., Kanaya, Y., and Syamsudin, F.: NO2 observations over the western Pacific and Indian Ocean by MAX-DOAS on Kaiyo, a Japanese research vessel, Atmos. Meas. Tech., 5, 2351–2360, https://doi.org/10.5194/amt-5-2351-2012, 2012.
Thalman, R. and Volkamer, R.: Temperature dependent absorption cross-sections of O2-O2 collision pairs between 340 and 630 nm and at atmospherically relevant pressure, Phys. Chem. Chem. Phys., 15, 15371–15381, https://doi.org/10.1039/C3CP50968K, 2013.
Tirpitz, J.-L., Frieß, U., Hendrick, F., Alberti, C., Allaart, M., Apituley, A., Bais, A., Beirle, S., Berkhout, S., Bognar, K., Bösch, T., Bruchkouski, I., Cede, A., Chan, K. L., den Hoed, M., Donner, S., Drosoglou, T., Fayt, C., Friedrich, M. M., Frumau, A., Gast, L., Gielen, C., Gomez-Martín, L., Hao, N., Hensen, A., Henzing, B., Hermans, C., Jin, J., Kreher, K., Kuhn, J., Lampel, J., Li, A., Liu, C., Liu, H., Ma, J., Merlaud, A., Peters, E., Pinardi, G., Piters, A., Platt, U., Puentedura, O., Richter, A., Schmitt, S., Spinei, E., Stein Zweers, D., Strong, K., Swart, D., Tack, F., Tiefengraber, M., van der Hoff, R., van Roozendael, M., Vlemmix, T., Vonk, J., Wagner, T., Wang, Y., Wang, Z., Wenig, M., Wiegner, M., Wittrock, F., Xie, P., Xing, C., Xu, J., Yela, M., Zhang, C., and Zhao, X.: Intercomparison of MAX-DOAS vertical profile retrieval algorithms: studies on field data from the CINDI-2 campaign, Atmos. Meas. Tech. Discuss., https://doi.org/10.5194/amt-2019-456, in review, 2020.
Vandaele, A., Hermans, C., Simon, P., Carleer, M., Colin, R., Fally, S., Mérienne, M., Jenouvrier, A., and Coquart, B.: Measurements of the NO2 absorption cross-section from 42000 cm−1 to 10000 cm−1 (238–1000 nm) at 220 K and 294 K, J. Quant. Spectrosc. Ra., 59, 171–184, 1998.
van Geffen, J., Eskes, H., Boersma, K., Maasakkers, J., and Veefkind, J.: TROPOMI ATBD of the total and tropospheric NO2 data products, S5P-KNMI-L2-0005-RP Issue 1.3.0, Royal Netherlands Meteorological Institute (KNMI), available at: https://sentinel.esa.int/documents/247904/2476257/Sentinel-5P-TROPOMI-ATBD-NO2-data-products (last access: December 2019), 2018.
Veefkind, J. P., Boersma, K. F., Wang, J., Kurosu, T. P., Krotkov, N., Chance, K., and Levelt, P. F.: Global satellite analysis of the relation between aerosols and short-lived trace gases, Atmos. Chem. Phys., 11, 1255–1267, https://doi.org/10.5194/acp-11-1255-2011, 2011.
Wagner, T., Dix, B., von Friedeburg, C., Frieß, U., Sanghavi, S., Sinreich, R., and Platt, U.: MAX-DOAS O4 measurements: a new technique to derive information on atmospheric aerosols – principles and information content, J. Geophys. Res., 109, D22205, https://doi.org/10.1029/2004JD004904, 2004.
Wagner, T., Beirle, S., Brauers, T., Deutschmann, T., Frieß, U., Hak, C., Halla, J. D., Heue, K. P., Junkermann, W., Li, X., Platt, U., and Pundt-Gruber, I.: Inversion of tropospheric profiles of aerosol extinction and HCHO and NO2 mixing ratios from MAX-DOAS observations in Milano during the summer of 2003 and comparison with independent data sets, Atmos. Meas. Tech., 4, 2685–2715, https://doi.org/10.5194/amt-4-2685-2011, 2011.
Wagner, T., Apituley, A., Beirle, S., Dörner, S., Friess, U., Remmers, J., and Shaiganfar, R.: Cloud detection and classification based on MAX-DOAS observations, Atmos. Meas. Tech., 7, 1289–1320, https://doi.org/10.5194/amt-7-1289-2014, 2014.
Wang, Y., Li, A., Xie, P. H., Wagner, T., Chen, H., Liu, W. Q., and Liu, J. G.: A rapid method to derive horizontal distributions of trace gases and aerosols near the surface using multi-axis differential optical absorption spectroscopy, Atmos. Meas. Tech., 7, 1663–1680, https://doi.org/10.5194/amt-7-1663-2014, 2014.
Wang, Y., Beirle, S., Lampel, J., Koukouli, M., De Smedt, I., Theys, N., Li, A., Wu, D., Xie, P., Liu, C., Van Roozendael, M., Stavrakou, T., Müller, J.-F., and Wagner, T.: Validation of OMI, GOME-2A and GOME-2B tropospheric NO2, SO2 and HCHO products using MAX-DOAS observations from 2011 to 2014 in Wuxi, China: investigation of the effects of priori profiles and aerosols on the satellite products, Atmos. Chem. Phys., 17, 5007–5033, https://doi.org/10.5194/acp-17-5007-2017, 2017.
Wang, Y., Pukite, J., Wagner, T., Donner, S., Beirle, S., Hilboll, A., Vrekoussis, M., Richter, A., Apituley, A., Piters, A., Allaart, M., Eskes, H., Frumau, A., Roozendael, M. V., Lampel, J., Platt, U., Schmitt, S., Swart, D., and Vonk, J.: Vertical Profiles of Tropospheric Ozone From MAX-DOAS Measurements During the CINDI-2 Campaign: Part 1 – Development of a New Retrieval Algorithm, J. Geophys. Res.-Atmos., 123, 10637–10670, https://doi.org/10.1029/2018JD028647, 2018.
Williams, J. E., Boersma, K. F., Le Sager, P., and Verstraeten, W. W.: The high-resolution version of TM5-MP for optimized satellite retrievals: description and validation, Geosci. Model Dev., 10, 721–750, https://doi.org/10.5194/gmd-10-721-2017, 2017.
Wittrock, F., Oetjen, H., Richter, A., Fietkau, S., Medeke, T., Rozanov, A., and Burrows, J. P.: MAX-DOAS measurements of atmospheric trace gases in Ny-Ålesund - Radiative transfer studies and their application, Atmos. Chem. Phys., 4, 955–966, https://doi.org/10.5194/acp-4-955-2004, 2004.
Zhao, X., Griffin, D., Fioletov, V., McLinden, C., Cede, A., Tiefengraber, M., Müller, M., Bognar, K., Strong, K., Boersma, F., Eskes, H., Davies, J., Ogyu, A., and Lee, S. C.: Assessment of the quality of TROPOMI high-spatial-resolution NO2 data products in the Greater Toronto Area, Atmos. Meas. Tech., 13, 2131–2159, https://doi.org/10.5194/amt-13-2131-2020, 2020.
- Abstract
- Introduction
- MAX-DOAS measurements in Uccle and retrieval methods
- Tropospheric NO2 measurements from TROPOMI
- Results and discussion
- Conclusions
- Appendix A: Profile shape adjustment of TROPOMI NO2 VCDs
- Data availability
- Author contributions
- Competing interests
- Special issue statement
- Acknowledgements
- Financial support
- Review statement
- References