the Creative Commons Attribution 4.0 License.
the Creative Commons Attribution 4.0 License.
 | 09 Aug 2022
Horizontal distribution of tropospheric NO2 and aerosols derived by dual-scan multi-wavelength multi-axis differential optical absorption spectroscopy (MAX-DOAS) measurements in Uccle, Belgium
Ermioni Dimitropoulou
François Hendrick
Martina Michaela Friedrich
Frederik Tack
Gaia Pinardi
Alexis Merlaud
Caroline Fayt
Christian Hermans
Frans Fierens
Michel Van Roozendael
Dual-scan ground-based multi-axis differential optical absorption spectroscopy (MAX-DOAS) measurements of tropospheric nitrogen dioxide (NO2) and aerosols were carried out in Uccle (50.8∘ N, 4.35∘ E; Brussels region, Belgium) for 2 years from March 2018 to February 2020. The MAX-DOAS instrument operated in both UV and visible wavelength ranges in a dual-scan configuration consisting of two submodes: (1) an elevation scan in a fixed viewing azimuthal direction and (2) an azimuthal scan in a fixed low elevation angle (2∘). By analyzing the O4 and NO2 differential slant column density (dSCD) at six different wavelength intervals along every azimuthal direction and by applying a new optimal-estimation-based inversion approach (the so-called mapping MAX-DOAS technique), the horizontal distribution of the NO2 near-surface concentrations and vertical column densities (VCDs) as well as the aerosol near-surface extinction coefficients are retrieved along 10 azimuthal directions. The retrieved horizontal NO2 concentration profiles allow the identification of the main NO2 hotspots in the Brussels area. Correlative comparisons of the retrieved horizontal NO2 distribution were conducted with airborne, mobile, air quality model, and satellite datasets, and overall good agreement is found. The comparison with TROPOMI observations from operational and scientific data products reveals that the characterization of the horizontal distribution of tropospheric NO2 VCDs by ground-based measurements and an adequate a priori NO2 profile shape in TROPOMI retrievals lead to better consistency between satellite and ground-based datasets.
- Article
(20602 KB) - Full-text XML
- Companion paper
-
Supplement
(3882 KB) - BibTeX
- EndNote


Aerosols and nitrogen dioxide (NO2) play a crucial role in tropospheric chemistry. NO2 is an important tropospheric pollutant mainly emitted by combustion processes and nitrogen fertilizers used in agriculture (Seinfeld and Pandis, 2016). Traffic, domestic heating, industrial activities, and power plants are the largest NO2 emitters (Tack et al., 2021). Beyond its harmful effects on human health (Chen et al., 2007), NO2 participates in the formation of tropospheric ozone (O3) by a nonlinear photochemical mechanism, which involves volatile organic compounds (VOCs).
Aerosols with a small diameter can penetrate deeply into the lungs, causing millions of premature deaths around the world per year (Khomenko et al., 2021). Additionally, aerosols influence the Earth's climate system by changing its radiation budget by scattering and absorbing sunlight (Quaas et al., 2008). In the boundary layer of urban regions, the horizontal distribution of NO2 is highly heterogeneous given the fact that it is a short-lived species (Beirle et al., 2003). For those reasons, the regional and global monitoring of NO2 and aerosols at high spatial resolution is crucial.
Since 1995, with the ERS-2 GOME (Global Ozone Monitoring Experiment) instrument (Burrows et al., 1999), satellite nadir air quality measurements of atmospheric backscattered sunlight in the UV–visible range have provided daily global tropospheric column measurements of numerous trace gases, such as NO2. Many satellite missions dedicated to air quality monitoring followed over the next years with increasing spatial resolution. More recently, the TROPOspheric Monitoring Instrument (TROPOMI) launched on board the Sentinel-5P Precursor (S5P) platform in October 2017 reached an initial spatial resolution of 7×3.5 km2 and was augmented on 6 August 2019 to 5.5×3.5 km2. Due to TROPOMI's fine spatial resolution, monitoring the horizontal distribution of NO2 in urban regions and identifying specific emission sources are made easier than with previous satellite missions, but TROPOMI still cannot fully capture the fine-scale (sub-kilometer) structures in the effective NO2 field. Consequently, TROPOMI requires further attention concerning its measurement validation.
Tropospheric vertical columns of many trace gases like NO2, formaldehyde (HCHO), sulfur dioxide (SO2), nitrous acid (HONO), and O3 can be retrieved by the multi-axis differential optical absorption spectroscopy (MAX-DOAS) technique (Hönninger et al., 2004; Wittrock et al., 2004; Pinardi et al., 2008, 2013; Clémer et al., 2010; Hendrick et al., 2014; Irie et al., 2011, 2012; Sinreich et al., 2007; Wagner et al., 2011; Wang et al., 2018). In recent years, MAX-DOAS measurements have been widely used as reference datasets for the validation of nadir airborne and spaceborne air quality measurements. MAX-DOAS instruments measure the scattered sunlight in the UV and visible spectral ranges at multiple elevation angles above the horizon. For absorbers located close to the surface, such as tropospheric NO2, higher sensitivity is achieved for low MAX-DOAS elevation angles. During the last years, MAX-DOAS measurements in more than one azimuthal direction have emerged (Ortega et al., 2016; Wang et al., 2014; Chan et al., 2020; Schreier et al., 2021). Multi-azimuthal MAX-DOAS measurements offer many possibilities for air quality monitoring, such as a better characterization of the effective NO2 field around the station. These ground-based datasets can be valuable for validating satellite missions with fine spatial resolution in regions where the NO2 horizontal distribution is heterogeneous, such as urban and suburban areas.
In this study, a new aerosol and NO2 horizontal distribution inversion approach based on 2 years (March 2018–February 2020) of dual-scan multi-wavelength MAX-DOAS measurements in Uccle (Brussels-Capital Region, Belgium) is presented. We refer to this new approach as the mapping MAX-DOAS technique. In every azimuthal viewing direction, parameterized NO2 near-surface concentrations, NO2 tropospheric columns, and aerosol extinctions measured at six different wavelengths are used as input in a new horizontal distribution inversion approach. On this basis, the near-surface aerosol extinction and NO2 horizontal distributions are retrieved at a spatial resolution of about 3 km in a range of about 20 km around the measurement site. These horizontal profiles are used to validate co-located TROPOMI tropospheric NO2 columns. We use (i) the operational TROPOMI data product, (ii) a so-called diagnostic dataset, which is a small sample but with major updates compared to the operational product (van Geffen et al., 2022), and (iii) a European TROPOMI product for which profiles from the CAMS (Copernicus Atmospheric Monitoring Service) regional chemistry transport model (CTM) ensemble (S5P-CAMS) are used (Douros et al., 2022). One complete year of data (March 2018–March 2019) and two wavelength intervals (one in the UV and one in the visible) have already been used in Dimitropoulou et al. (2020). It is proven that multi-azimuthal (the so-called dual-scan) MAX-DOAS measurements significantly improve the agreement between ground-based and TROPOMI tropospheric NO2 column observations over the Brussels area. By adding the multi-wavelength aspect, the present work represents an extension of the former study.
The paper is organized into seven sections: in Sect. 2, the measurement site with the MAX-DOAS experimental setup and the multi-wavelength DOAS analysis are presented. In Sects. 3 and 4, the TROPOMI tropospheric NO2 measurements and ancillary measurements used in this study are described, respectively. Section 5 is composed of two main parts: Sect. 5.1 is a detailed description of the dual-scan multi-wavelength MAX-DOAS retrieval method, and Sect. 5.2 is the horizontal aerosol and NO2 distribution inversion approach (i.e., the mapping MAX-DOAS technique). In Sect. 6, main results followed by correlative comparisons of the retrieved ground-based and satellite horizontal NO2 distribution are presented. Finally, in Sect. 7, conclusions and future perspectives are given.
2.1 Measurement site and experiment setup
The Brussels-Capital Region is the most densely populated area in Belgium, where pollutant concentrations, such as NO2, are often high because of anthropogenic activities (Tack et al., 2021).
A MAX-DOAS dual-scan instrument was operated by BIRA-IASB (Koninklijk Belgisch Instituut voor Ruimte-Aeronomie – Institut Royal d'Aeronomie Spatiale de Belgique) in Uccle from January 2017 to February 2020. Uccle is located to the south of the city center of Brussels and to the west of a large forested area (Bois de la Cambre). Therefore, it is an ideal site to perform MAX-DOAS observations under moderate to high pollution conditions. Additionally, the characterization of the horizontal distribution of NO2 and aerosols at high spatial resolution is of great interest here because of the heterogeneity of the pollution sources (car traffic, national airport, power plant) in the capital region of Brussels.
The MAX-DOAS dual-scan instrument is composed of the following parts: the optical head mounted on a sun tracker, two spectrometers (UV and visible) inside a thermo-regulated box, and the data acquisition unit. The optical head and the two spectrometers are connected with optical fibers. A more detailed description of the BIRA-IASB MAX-DOAS dual-scan instrument can be found in Dimitropoulou et al. (2020).
From March 2018 to February 2020, the MAX-DOAS instrument operated in a dual-scan viewing mode. Two different submodes compose one complete measurement scan (see Dimitropoulou et al., 2020): (1) a vertical scan in nine different elevation angles (EAs) in one fixed telescope azimuth angle (TAA; northeast direction, i.e., towards the city center and the national airport) and (2) a horizontal scan in nine different azimuthal directions at a fixed elevation angle (2∘ above the horizon).
Several azimuthal viewing directions were tested to obtain an optimal horizontal sampling without any obstacles in the different viewing directions (see Fig. 1). The selection of more azimuthal directions towards the north, northeast, and northwest was made considering the location of the main NO2 emission sources and, consequently, the highly variable NO2 horizontal distribution towards these directions.
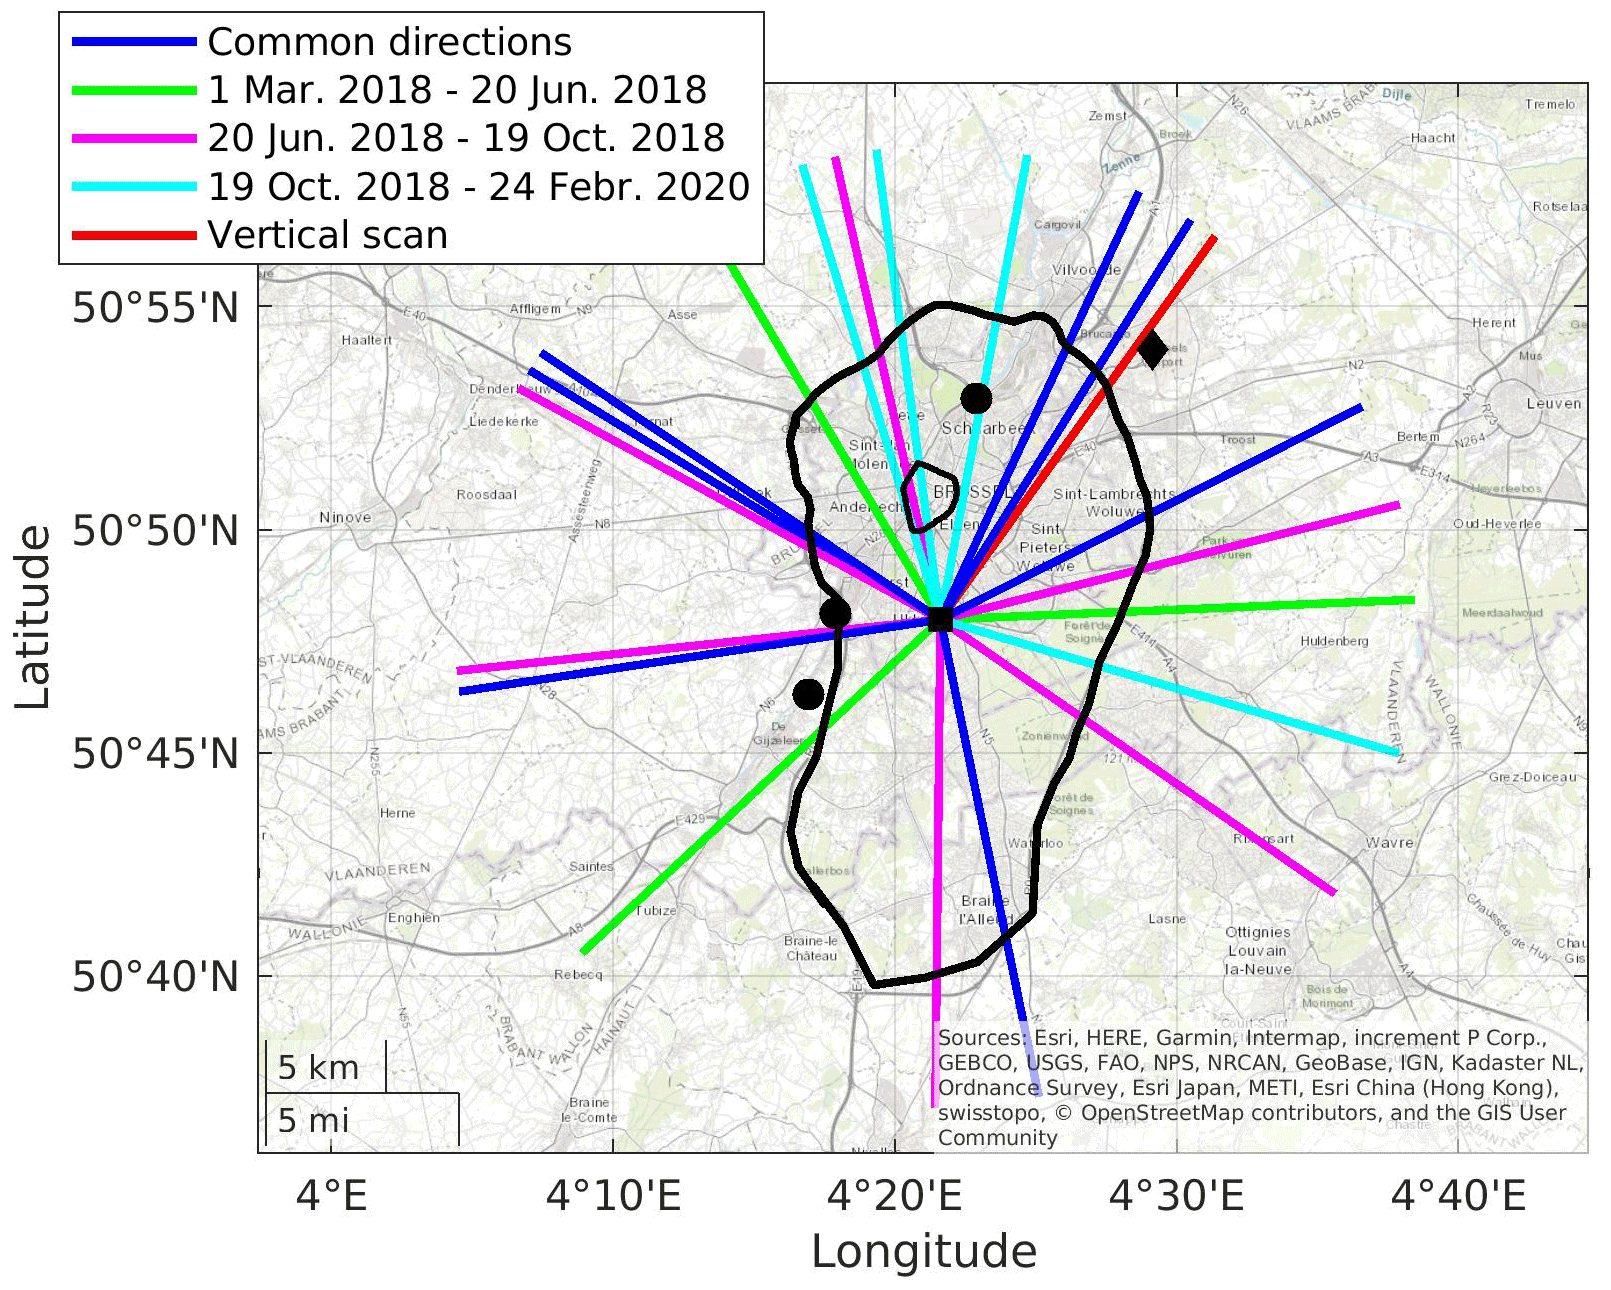
Figure 1The experimental setup of the BIRA-IASB dual-scan MAX-DOAS instrument. Each line is color-coded according to the different setups that were used from March 2018 to February 2020. The length of each line is equal to 20 km, which corresponds to the typical horizontal sensitivity for the MAX-DOAS measurements in the present study (see Fig. 18). The black square shows the MAX-DOAS instrument location, the black polygon the national airport, the black dots the NO2 hotspots emitting more than 10 kg NOx h−1 (Emission Inventory of the Belgian Interregional Environment Agency, 2017; Frederik Tack, personal communication, 2019), and the black line the Brussels Ring motorway.
The integration time for each measured radiance spectrum is 60 s, resulting in a full scan duration of approximately 20 min.
2.2 Multi-wavelength DOAS analysis
The measured radiance spectra of a full measurement scan are analyzed using the QDOAS spectral fitting software developed by BIRA-IASB (Fayt et al., 2017). The DOAS technique separates the narrow absorption features of trace gases in the UV–visible spectral range from a spectral background caused mainly by Mie and Rayleigh scattering and instrumental effects. The trace gas concentration integrated along the light path in a measured spectrum relative to the amount of the same absorber in a reference spectrum is the primary product of the DOAS analysis and is called differential slant column density (dSCD). Here, average zenith spectra before and after each measurement scan are used as a reference.
The O4 and NO2 dSCDs are retrieved in six different wavelength intervals: three intervals in the UV spectral range (330–361, 350–370, and 360–383.5 nm) and three in the visible range (420–460, 450–490, and 510–540.1 nm). These fitting windows were selected to optimize the determination of the O4 and NO2 dSCDs at the maximum number of different O4 absorption bands available in the wavelength domain of the instrument. Figure 2 shows an example of the O4 and NO2 fits in all the intervals used in the present work. In each chosen fitting window, we select a reference wavelength, which corresponds to the maximum of an O4 absorption peak (or close to it) in the respective wavelength intervals (see Fig. 2), and it is subsequently used for radiative transport calculations and further analysis. The different reference wavelengths are 343, 360, 380, 447, 477, and 530 nm (see Fig. 2). To optimize the derivation of the dSCDs at the six selected wavelengths, the fit of a slope parameter, which accounts for the variation of the dSCD within the fitting interval (Puķīte et al., 2010), is necessary. This is especially important when the reference wavelength is not located in the center of the fitting window (i.e., 330–361, 350–370, 420–460, and 450–490 nm). The DOAS settings used for each fitting interval are presented in Table S1 in the Supplement. As shown in this table, two different O4 cross-sections are used in this study: (1) Finkenzeller and Volkamer (2022) in the UV fitting intervals and (2) Thalman and Volkamer (2013) in the visible fitting intervals. The main motivation for using the O4 cross-section from Finkenzeller (measured at 25 ∘C) in the UV fitting intervals is the significant improvement of the fit quality and the reduction of the uncertainties for the UV retrievals. Sensitivity tests and comparisons with radiative transport simulations also show that the resulting O4 and NO2 dSCDs are consistent throughout the whole wavelength range covered by the six intervals. For NO2 and O3, which are the strongest absorbers in all the fitting windows, a correction for the solar I0 effect (Aliwell et al., 2002) is applied. A high-resolution solar atlas (Kurucz et al., 1984) is used for the wavelength calibration of the measured spectra.
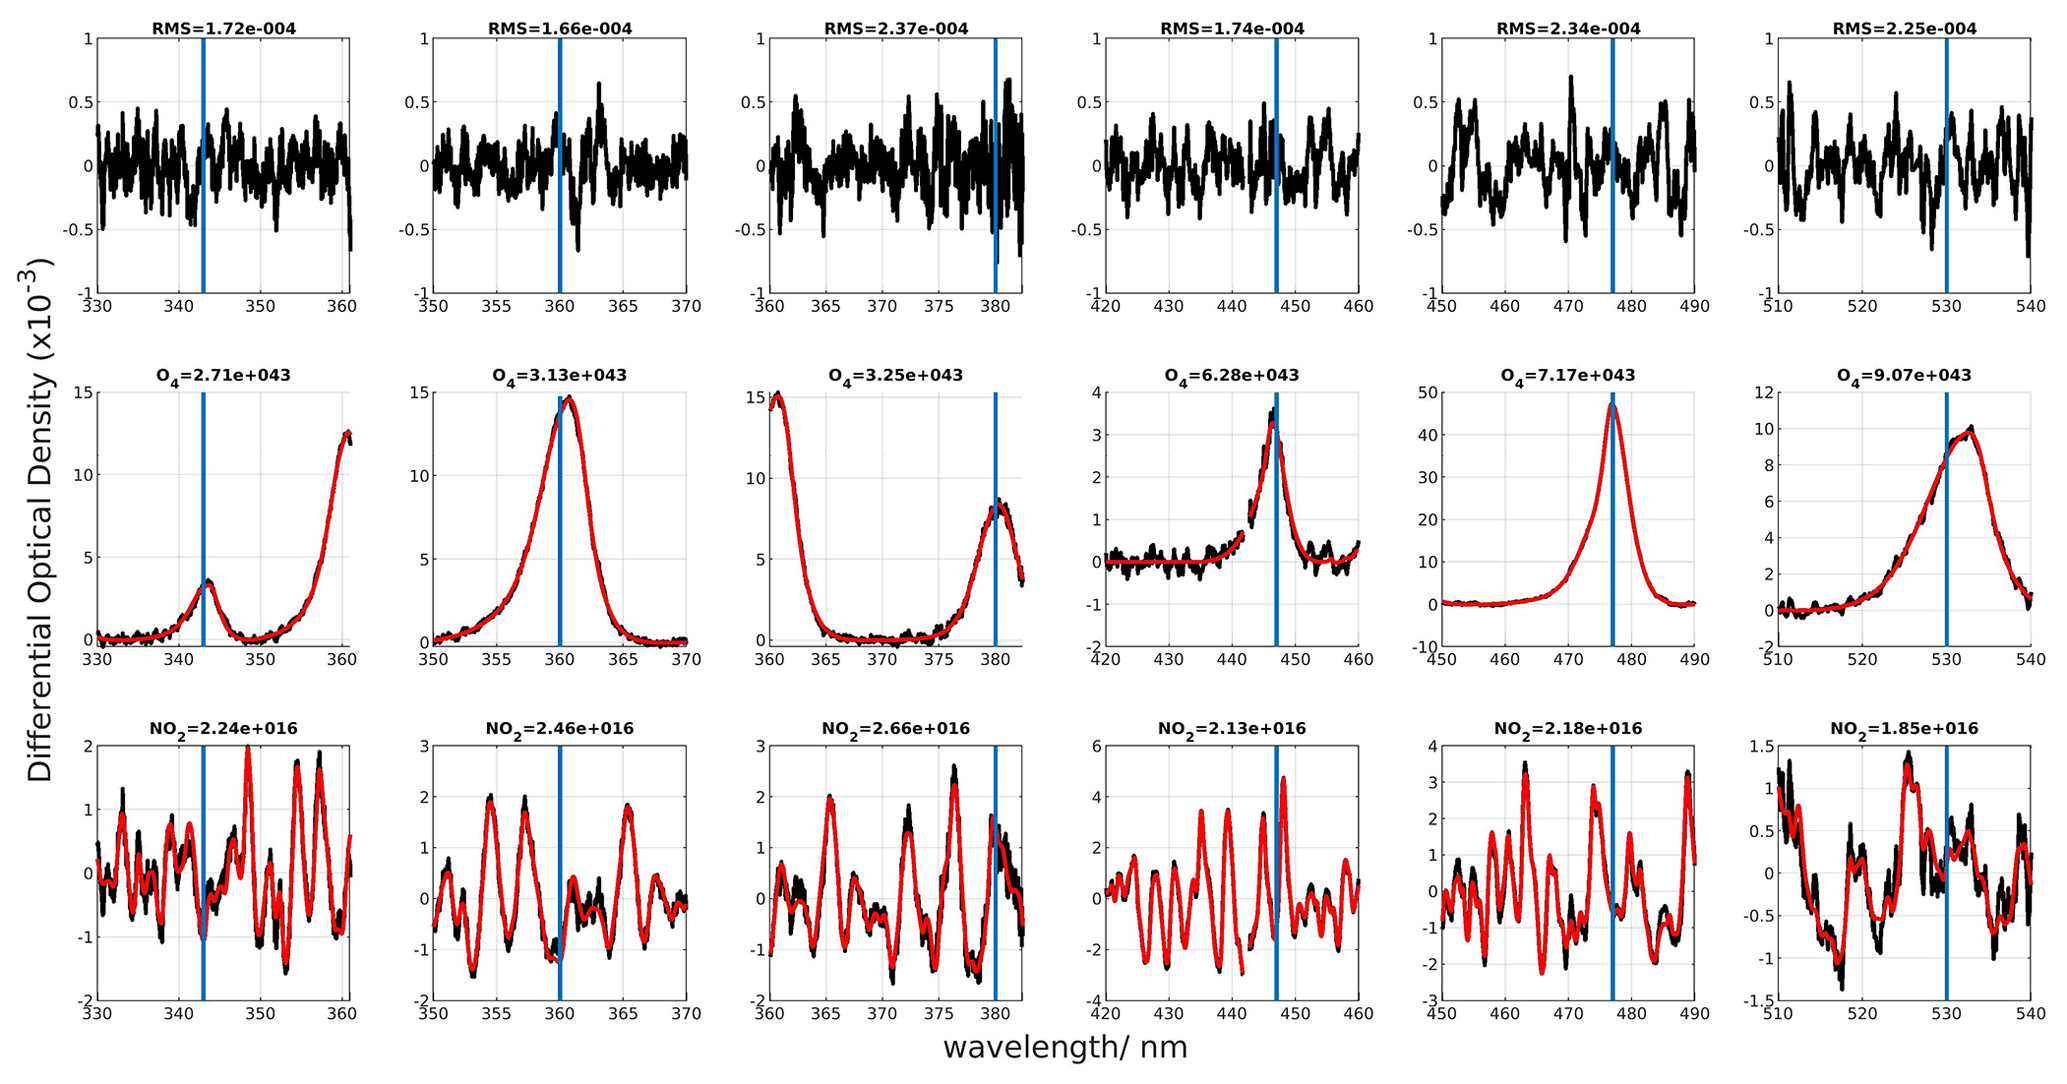
Figure 2Results of the O4 and NO2 fit for the six selected fitting windows from the dual-scan MAX-DOAS measurements in Uccle (2 June 2019 at 07:05 UTC). The measured spectra are represented with black lines, while the fit results are shown with red lines. The blue lines represent the six reference wavelengths.
In the present study, MAX-DOAS tropospheric NO2 VCDs are used to validate co-located TROPOMI satellite observations. TROPOMI is a passive grating imaging spectrometer flying on board the S5P satellite platform. It covers the UV–visible (250–500 nm), near-infrared (710–770 nm), and shortwave infrared (2314–2382 nm) spectral ranges (Veefkind et al., 2011). TROPOMI measures in a push-broom configuration with a full swath width as wide as 2600 km, and it provides daily global coverage at a spatial resolution (true-nadir pixel size) of 7×3.5 km2, which is further improved to 5.5×3.5 km2 on 6 August 2019. The TROPOMI tropospheric NO2 algorithm has been developed at KNMI and uses a retrieval assimilation modeling system that is based on the 3-D global TM5 chemistry transport model (van Geffen et al., 2019; Williams et al., 2017).
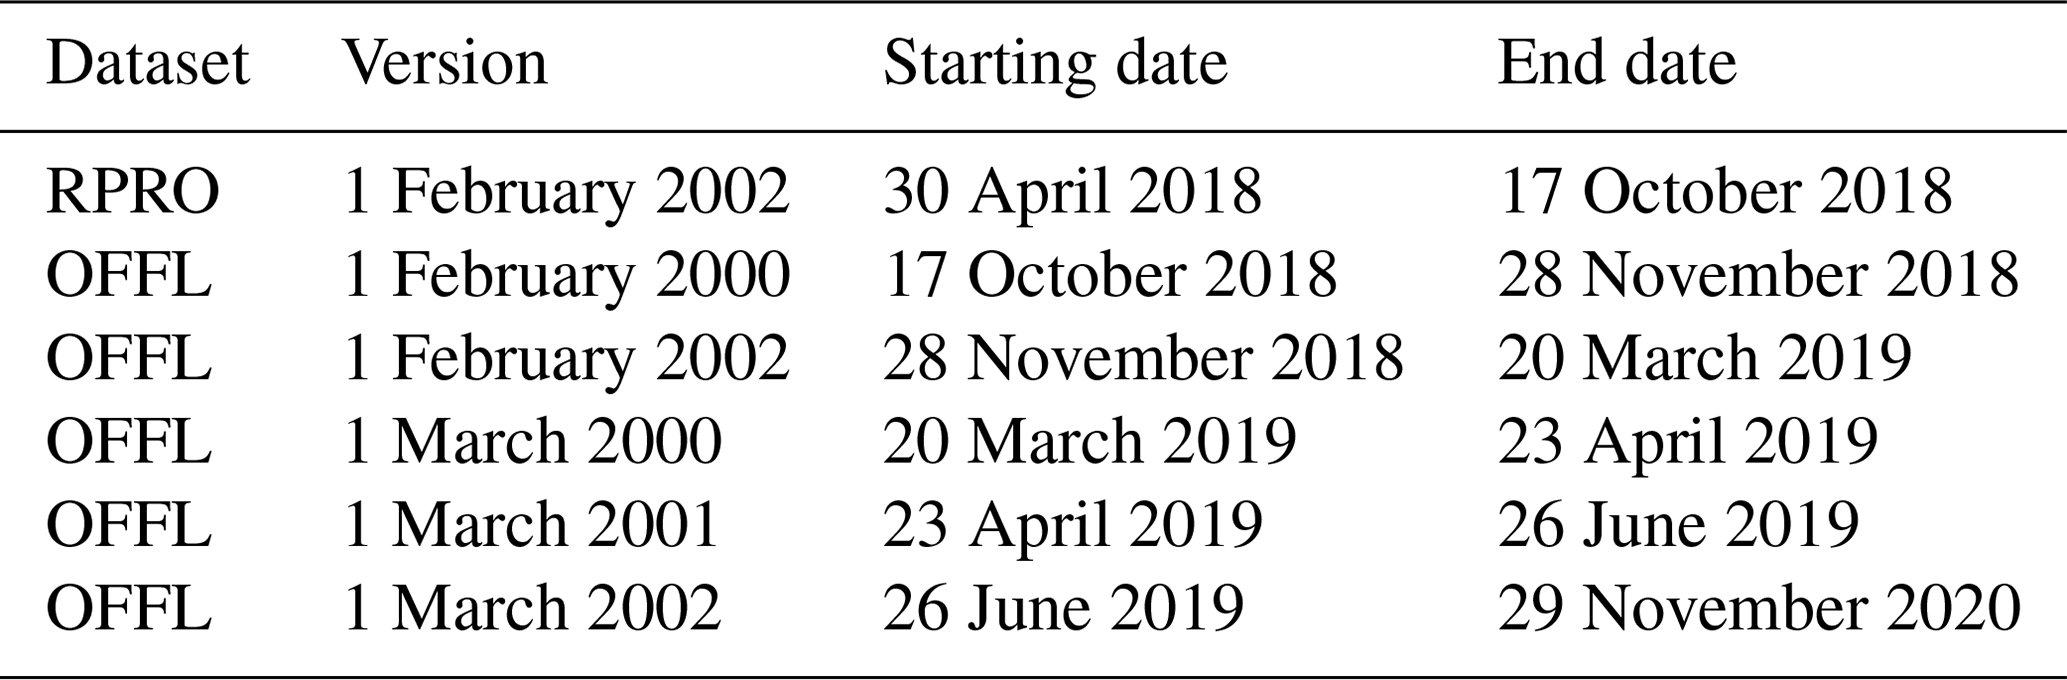
We use the reprocessed (RPRO) and offline (OFFL) datasets of the TROPOMI L2 tropospheric NO2 column product (see Table 1 for the corresponding versions). According to the guidelines provided by van Geffen et al. (2019), RPRO datasets are available only for the first period of the present study (see Table 1). For the remaining periods, OFFL datasets are used, which are the main data products available within 2 weeks from the TROPOMI measurement. To ensure the best measurement quality, only pixels with a quality assurance value larger than 0.75 are used. This quality flagging eliminates pixels with a cloud radiance fraction larger than 0.5, snow or ice, and erroneous retrievals (Eskes and Eichmann, 2022).
Table 1TROPOMI NO2 processor versions used in the present study.
Next to operational products, two additional TROPOMI datasets are also used (see Sect. S2 in the Supplement). In the first one, the TROPOMI retrieval is performed with different a priori profiles (Douros et al., 2022). The coarse TM5-MP a priori NO2 profiles, using a spatial resolution of , are replaced by NO2 profile shapes from the CAMS (Copernicus Atmospheric Monitoring Service) regional chemistry transport model (CTM) ensemble at a spatial resolution of (S5P-CAMS product). The replacement of coarse a priori information with finer information can lead to significant changes in the TROPOMI-retrieved NO2 tropospheric columns. The available dataset covers October 2018 to March 2020 (OFFL dataset, L2, and version 01.02.00 up to 01.04.00; Eskes and Eichmann, 2022).
In the second additional product, the TROPOMI retrieval is performed with an improved cloud product (Eskes et al., 2022; van Geffen et al., 2019). According to van Geffen et al. (2019), the improvement of the FRESCO-S cloud pressure retrieval scheme to the FRESCO-wide product has an impact on the NO2 air mass factors (AMFs) and consequently on the NO2 tropospheric columns over polluted areas. More precisely, the existing FRESCO-S product had a negative bias in the cloud height values, which resulted in a low NO2 tropospheric column (Compernolle et al., 2021). The TROPOMI tropospheric NO2 columns are retrieved using an improved FRESCO-S cloud retrieval scheme, called FRESCO-wide, in v1.4 since 29 November 2020 (Eskes and Eichmann, 2022). In the present study, the diagnostic datasets (DDSv2) are used, which are an ensemble of reprocessed data for past periods analyzed with new versions (van Geffen et al., 2022). Over the MAX-DOAS measurement time period, only DDSv2 data corresponding to OFFL datasets (v1.2 and v1.3) are available. Excluding the spin-up period needed by TM5-MP, only four data periods are available for our comparisons (i.e., 30 June–6 July 2018, 30 December 2018–5 January 2019, 30 March–5 April 2019, and 17–23 September 2019).
In the present study, ancillary measurements are used for two main purposes: (1) as a priori information on the retrieval of the MAX-DOAS NO2 and aerosol horizontal profiles as well as (2) to validate the retrieved MAX-DOAS NO2 horizontal profiles.
First, the CIMEL Sun photometer is a multi-channel photometer, which measured the direct solar irradiance and sky radiance at the Earth's surface in discrete wavelengths in the UV, visible, and near-IR wavelengths of the spectrum. Aerosol optical thickness measurements at the Brussels-Capital Region from a co-located CIMEL Sun photometer of AERONET (https://aeronet.gsfc.nasa.gov/, last access: 11 July 2022) are used in the retrieval of the MAX-DOAS aerosol horizontal profiles (see Sect. 5.3).
Secondly, independent NO2 horizontal profiles, used as a priori information in the new OEM-based (OEM: optical estimation method) horizontal distribution inversion approach, are provided by the RIO model. RIO is a land use regression model based on the interpolation of the hourly NO2 near-surface concentrations measured by the in situ telemetric air quality network in Belgium (Hooyberghs et al., 2006; Janssen et al., 2008; see https://irceline.be/en, last access: 13 July 2022). RIO provides hourly NO2 concentration maps at a 4×4 km2 spatial resolution.
To validate the retrieved MAX-DOAS NO2 horizontal profiles, independent measurements are necessary in the Brussels-Capital Region.
For the S5P validation campaign over Belgium (S5PVAL-BE, https://s5pcampaigns.aeronomie.be/, last access: 11 July 2022), airborne measurements in the two largest urban regions over Belgium, i.e., Antwerp and Brussels, took place from 26 to 29 June 2019 (Tack et al., 2021). The Airborne Prism EXperiment (APEX) imaging spectrometer was used to measure the horizontal distribution of tropospheric NO2 columns with a spatial resolution of approximately 75 m×120 m (Tack et al., 2017, 2019). During the S5PVAL-BE flight over Brussels, car-mobile DOAS observations were performed by the BIRA-IASB mobile DOAS, the so-called AEROMOBIL (Merlaud, 2013). The AEROMOBIL consists of a compact double Avantes spectrometer simultaneously recording scattered light in two elevation angles (i.e., one at 30∘ elevation angle and one at zenith). The AEROMOBIL was used to measure the spatial distribution of tropospheric NO2 columns mainly over the Ring road of Brussels. These airborne and car-mobile measurements are compared with the retrieved MAX-DOAS NO2 horizontal profiles (see Sect. 6.2).
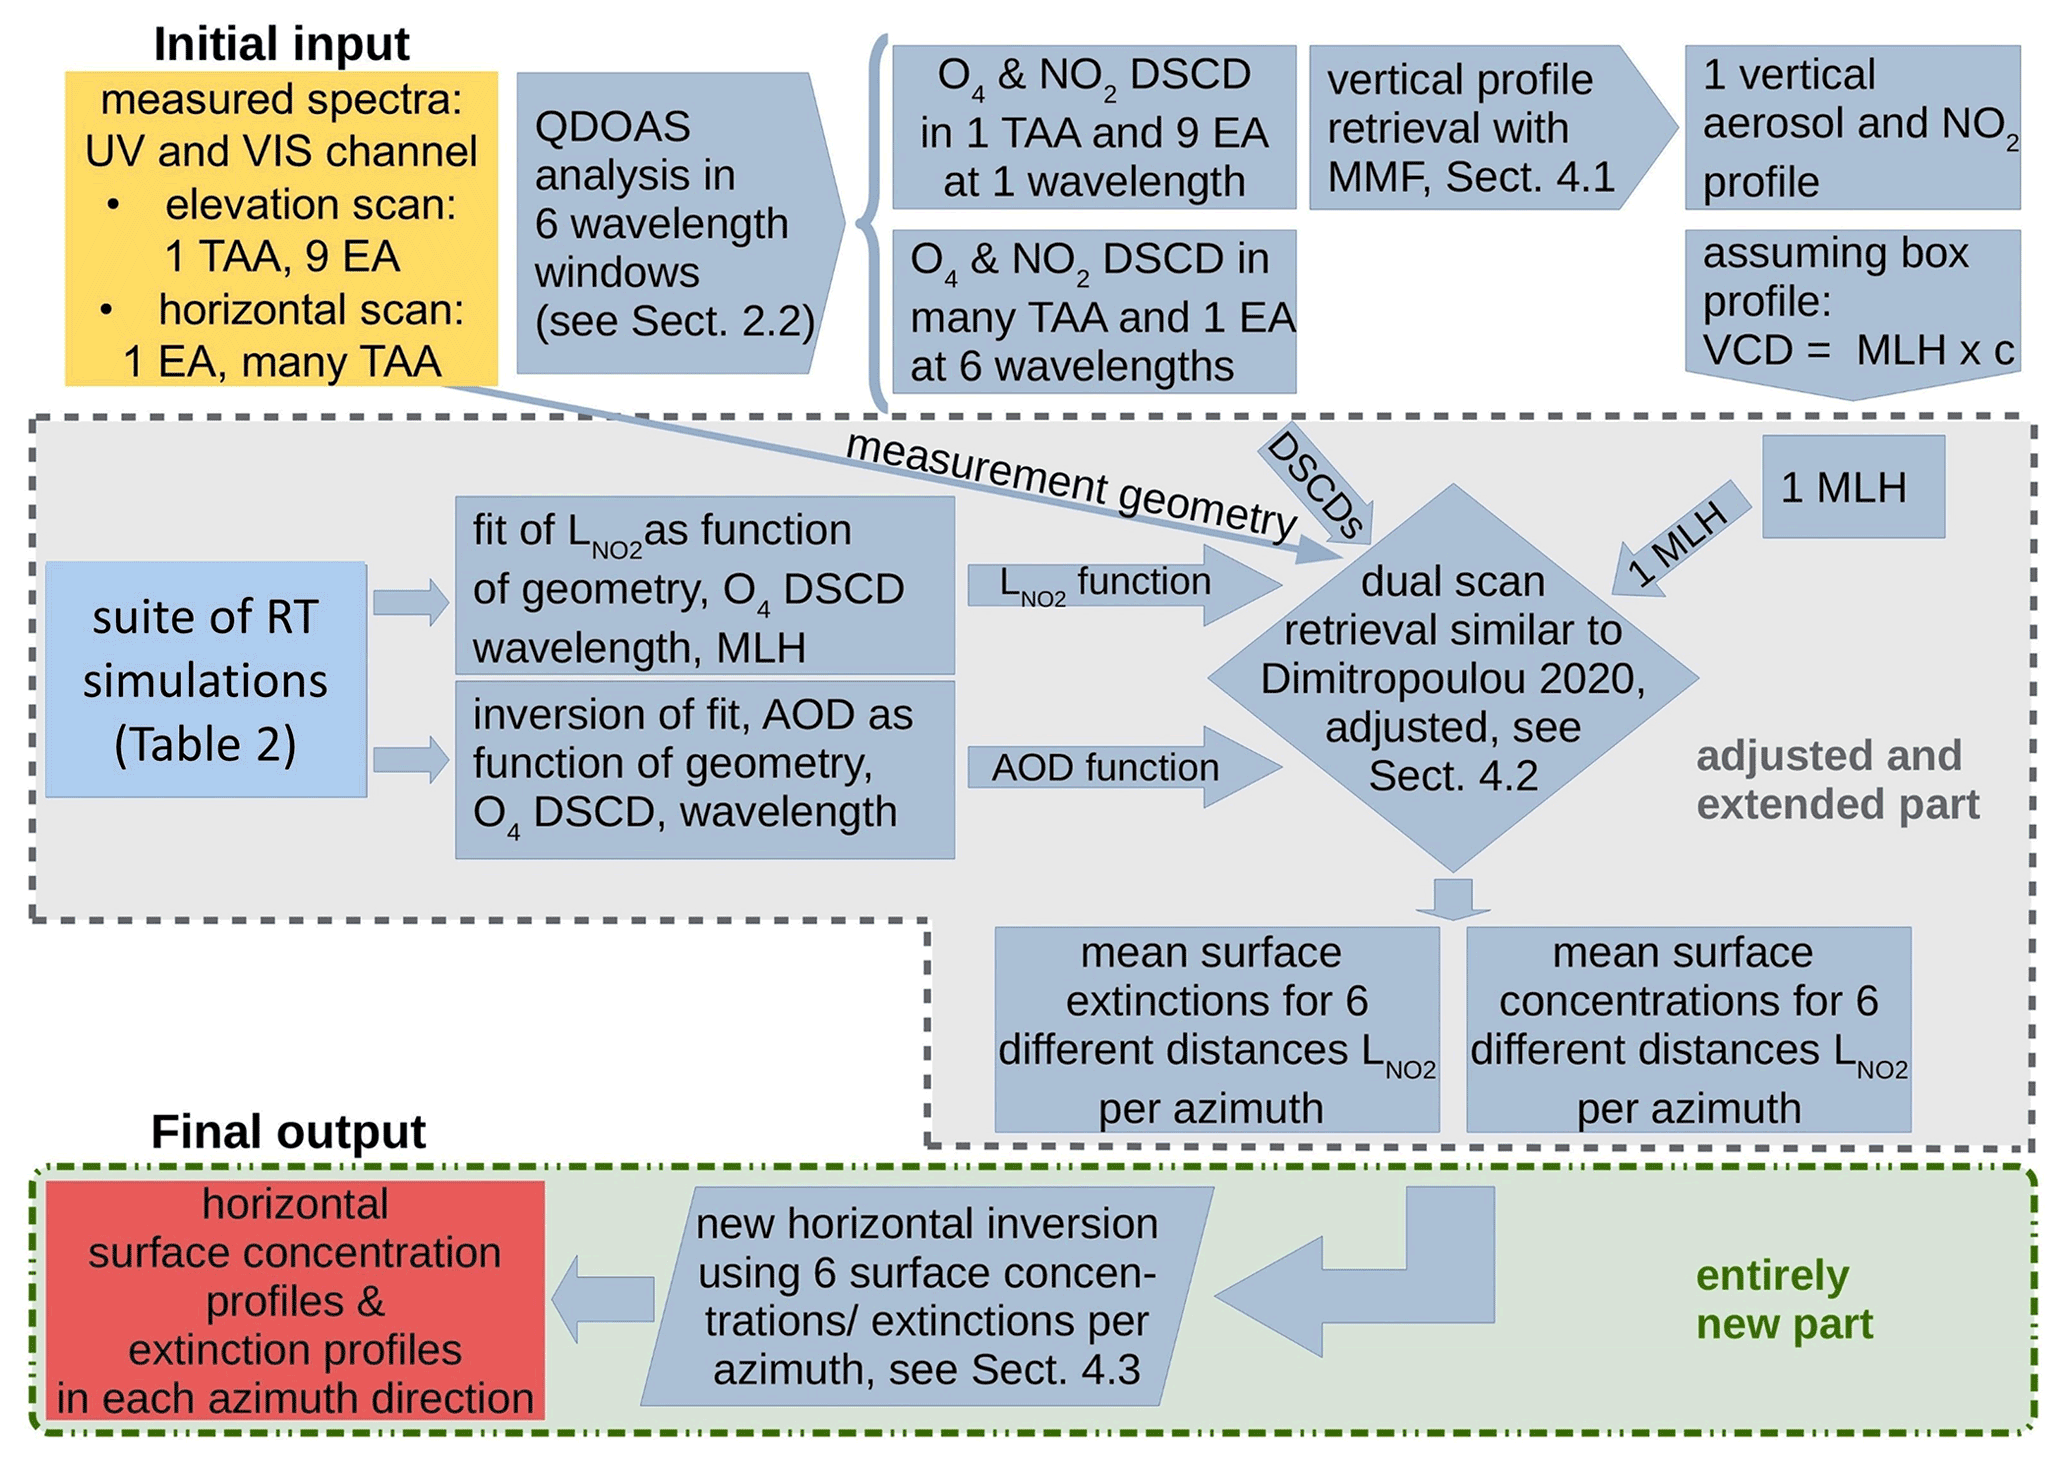
First, the measured radiance spectra in the UV and visible wavelength ranges are analyzed in the six different fitting windows listed in Sect. 2.2. Then, the optimal-estimation-method-based (OEM-based) Mexican MAX-DOAS Fit (MMF) algorithm is applied to the O4 and NO2 dSCDs in the main azimuthal direction (and at 477 nm) to retrieve vertical NO2 profiles and obtain information about the vertical extent of NO2 in the troposphere via the mixing layer height of NO2 (MLH; see Sect. 5.1).
As an intermediate step, radiative transfer model (RTM) simulations are performed (see Table 2 and Sect. 5.2) to obtain information about the horizontal sensitivity () and aerosol optical depth (AOD) as a function of O4 dSCDs, wavelength, and MLH.
Table 2RTM inputs for the simulations of at the six selected wavelengths (343, 360, 380, 447, 477, and 530 nm).

Then, in the next step, a new dual-scan parameterization technique is applied to the O4 and NO2 dSCDs at the six different wavelengths and in all the azimuthal directions with MLH, measured O4 dSCDs, and measurement geometry being the main input parameters to retrieve the horizontal sensitivity of NO2 and, consequently, the NO2 near-surface concentrations, VCDs, and near-surface aerosol extinction as a function of distance from the instrument (see Sect. 5.2).
In the final step, a new OEM-based horizontal distribution inversion approach is developed using the six near-surface NO2 concentrations and aerosol extinction values per azimuthal direction to retrieve NO2 and aerosol extinction horizontal profiles in an output grid of 500 m thickness (see Sect. 5.3).
A flowchart describing the mapping MAX-DOAS technique is shown in Fig. 3.
5.1 Aerosol and NO2 OEM-based profile retrievals
The optimal-estimation-based MMF inversion algorithm (Friedrich et al., 2019) is applied to retrieve the aerosol extinction coefficient and NO2 vertical profiles for each MAX-DOAS elevation scan in the main azimuthal direction at 360 and 477 nm. First, the O4 measurements are used to retrieve the aerosol extinction profile. Several studies indicated the importance of applying a scaling factor (≠1) to the observed O4 dSCDs to bring them in agreement with simulated O4 dSCDs by radiative transfer modeling (Wagner et al., 2009; Clémer et al., 2010; Merlaud et al., 2011; see also Wagner et al., 2019, Table 1 for a comprehensive list of all those studies). However, there is no consensus on the fundamental reason for applying this scaling (see, e.g., Ortega et al., 2016). As found by Tirpitz et al. (2021), the choice of the scaling factor has only a small effect on the performance of the trace gas retrieval, so we decided not to apply it in the present study. The aerosol extinction profile retrieved from each scan is used as an input to the radiative transfer calculations used to retrieve the NO2 profile. Further details about the MMF inversion algorithm, the input a priori parameters, the quality check of each scan, and the estimated uncertainties of the aerosol and NO2 vertical profile can be found in Dimitropoulou et al. (2020).
A broken cloud-filtering approach based on Gielen et al. (2014) is applied to the MAX-DOAS measurements to exclude MAX-DOAS aerosol and NO2 scans influenced by the presence of clouds, which are known to potentially degrade the quality of the retrievals (Gielen et al., 2014; Wagner et al., 2014). Three sky conditions can be distinguished with this flagging approach: (1) clear sky, (2) homogeneous cloud coverage, and (3) broken cloud conditions. Retrievals under broken cloud conditions are rejected from the present study.
The profile retrieval was performed to estimate the mixing layer height of NO2 (MLH). The MLH is estimated per measurement scan, and it is the ratio of VCD to the NO2 near-surface concentration () as retrieved in the main azimuthal direction by the MMF inversion algorithm:
Therefore, during one measurement scan, two assumptions were made: (1) the homogeneous distribution of NO2 inside the MLH and (2) homogeneous MLH around the measurement site and its use in all the azimuthal directions. The validity of the second assumption is tested in Sect. 5.2.3.
5.2 Dual-scan MAX-DOAS retrieval method
A complete MAX-DOAS measurement scan is composed of two different sub-scans, as described in Sect. 2.1. The aerosol and NO2 vertical profiles are retrieved from the elevation scan in the main azimuthal direction. In the other azimuthal directions, measurements are performed only in a single low elevation angle (2∘), and therefore the retrieval of aerosol and NO2 vertical profiles is not possible. Using the fact that the lowest elevation angles have the highest sensitivity to trace gases located near the surface due to the long light path in this layer, a new dual-scan MAX-DOAS retrieval strategy was developed here. This new retrieval strategy is an extension of the work presented in Dimitropoulou et al. (2020) and aims to retrieve the near-surface NO2 box-averaged volume mixing ratios (VMRs) and the NO2 VCDs at six different wavelengths. In Dimitropoulou et al. (2020), the applied dual-scan NO2 MAX-DOAS retrieval was itself an adaptation of the parameterization technique proposed by Sinreich et al. (2013). More precisely, in the presence of sufficient aerosols in the atmosphere (i.e., sufficient aerosols to constrain the light path in a near-surface layer and ensure that the near-surface NO2 concentration can be approximated by a near-surface box profile), the measured NO2 dSCDs at one low elevation angle (2∘) can be related to the near-surface NO2 box-averaged concentration as follows:
where dSCD is the differential slant column density of NO2 and its mean concentration along the differential effective light path, .
Consequently, the knowledge of the differential effective light-path length (i.e., ) is crucial to derive the near-surface NO2 concentrations. The oxygen collisional complex (O4) can be used as a tracer for the effective light path in the atmosphere, as its concentration is well-known (it is the square of O2 concentration). As a result, observed changes in the O4 dSCDs can be directly attributed to changes in the light path due to the presence of particles like aerosols and clouds. is calculated by using Eq. (2) for O4.
However, the direct use of the O4 light-path length in the NO2 retrieval is not possible under moderate to high pollution conditions, such as those in Brussels, because the profile shapes of O4 and NO2 are not the same. In Dimitropoulou et al. (2020), we used radiative transfer model (RTM) simulations to estimate a unitless correction factor, which accounts for these profile shape differences. This unitless correction factor indicates that under moderate to high pollution conditions, is equal to or smaller than . For a correction factor equal or close to 1, is equal to , which means that there is a moderate to high aerosol load in the atmosphere during the measurement. On the other hand, correction factors smaller than unity are obtained for measurements performed under aerosol-free conditions or a thin MLH. Assuming a homogeneous NO2 distribution inside the MLH, the MLH is derived from the NO2 vertical profiles in the main azimuthal direction and is defined as the ratio of the NO2 VCD to the near-surface concentration of NO2. In Dimitropoulou et al. (2020), the RTM simulations were performed for eight different MLH values of aerosols and NO2 in the range of 500–2000 m (i.e., eight different combinations) as well as for different measurement viewing geometries (solar zenith angle – SZA, relative azimuth angle – RAA, and the corresponding elevation angle of 2∘). For every MAX-DOAS measurement, one value of the correction factor is given according to its viewing geometry and MLH value during the measurement. For further information, we refer the reader to Dimitropoulou et al. (2020).
In the present study, a new dual-scan NO2 MAX-DOAS retrieval method, which is more suitable for interpreting multi-wavelength measurements than the previous approach (Dimitropoulou et al., 2020), is developed. It is presented in detail in the following subsection.
5.2.1 Developed dual-scan MAX-DOAS retrieval method
The main advantages of the new dual-scan NO2 MAX-DOAS retrieval method (which are also the main differences with respect to Dimitropoulou et al., 2020) are the following: (1) the direct use of the measured O4 dSCDs to estimate for every measurement, (2) retrieval of near-surface aerosol extinction close to the ground, and (3) the exploitation of the wavelength dependency of the horizontal path representative of MAX-DOAS measurements for the retrieval of the horizontal distribution of aerosols (and therefore NO2) around the measurement site. The latter is done using O4 and NO2 dSCDs measured at six different wavelengths. This new method is described below.
Assuming that the NO2 vertical distribution can be approximated by a box profile of height equal to mixing layer height (MLH), the following equation can be used.
This means that the NO2 near-surface concentration can be expressed as a ratio of the dSCD to the (see Eq. 2) or as a ratio of the VCD to the MLH. When knowing MLH and VCD, can be simulated as follows.
Here, NO2 dSCDs and consequently are simulated using the radiative transfer model VLIDORT version 2.7 (Spurr, 2006). Seasonal median MAX-DOAS NO2 vertical profiles, as retrieved by applying the MMF inversion algorithm in the main azimuthal direction (see Sect. 5.1), show that the bulk (70 %) of the NO2 concentration is located inside the MLH, which is expected since MLH is estimated as the ratio of VCD to the near-surface NO2 concentration. On the other hand, this is not the case for aerosols (only 30 % of the aerosol content is seen to be located inside the MLH). Considering this feature, for the VLIDORT simulations, the NO2 a priori profiles are modeled as box profiles with a constant concentration equal to 1.5×10¹¹ molec. cm−3 from the surface to the MLH. Two layers compose the aerosol a priori profiles: (1) the MLH and (2) the free troposphere. The equation, which is applied to estimate the aerosol extinction profile a(z), is the following (see Wang et al., 2014):
and
where AOD is the aerosol optical depth, p is the fraction of AOD inside the MLH, b is a normalizing constant for the exponential component (Wang et al., 2014), z is the simulation altitude grid, and ξ is the scaling height for the aerosols located outside the MLH, which is set to 5 km (Wang et al., 2014). In the present study, the fraction of AOD located within the MLH is set to p=0.3 (see above). The effect of the p value and the NO2 profile shape on the retrieved NO2 near-surface VMRs and VCDs was investigated and considered in the error budget (see Sect. 5.2.2).
The MLH is a known parameter, and it is estimated per measurement scan as the ratio of VCD to the NO2 near-surface concentration as retrieved in the main azimuthal direction by the MMF inversion algorithm.
The RTM simulations have nine input parameters in total, which are the elevation angle, SZA, RAA, AOD, MLH, , AOD (p and ξ), and wavelength. It should be noted that the elevation angle is kept constant (i.e., 2∘). For the six different wavelengths (343, 360, 380, 447, 477, and 530 nm), we separately perform RTM simulations, and (see Eq. 4) is simulated for the assumed SZA, RAA, MLH, , and AOD input scenarios presented in Table 2.
The simulated O4 dSCDs are a function of the input parameter AOD. The relation between the simulated O4 dSCDs and the input AOD values is shown in Fig. 4a. A piecewise cubic hermite interpolating polynomial fitting through the AOD as a function of the simulated O4 dSCDs for each SZA, RAA, and MLH combination can be used in order to perform an inverse method (i.e., to estimate the near-surface aerosol extinction from the measured O4 dSCDs). Additionally, in Fig. 4b, we can see that the relation between the O4 dSCDs and the AOD values is valid for MAX-DOAS measurements.
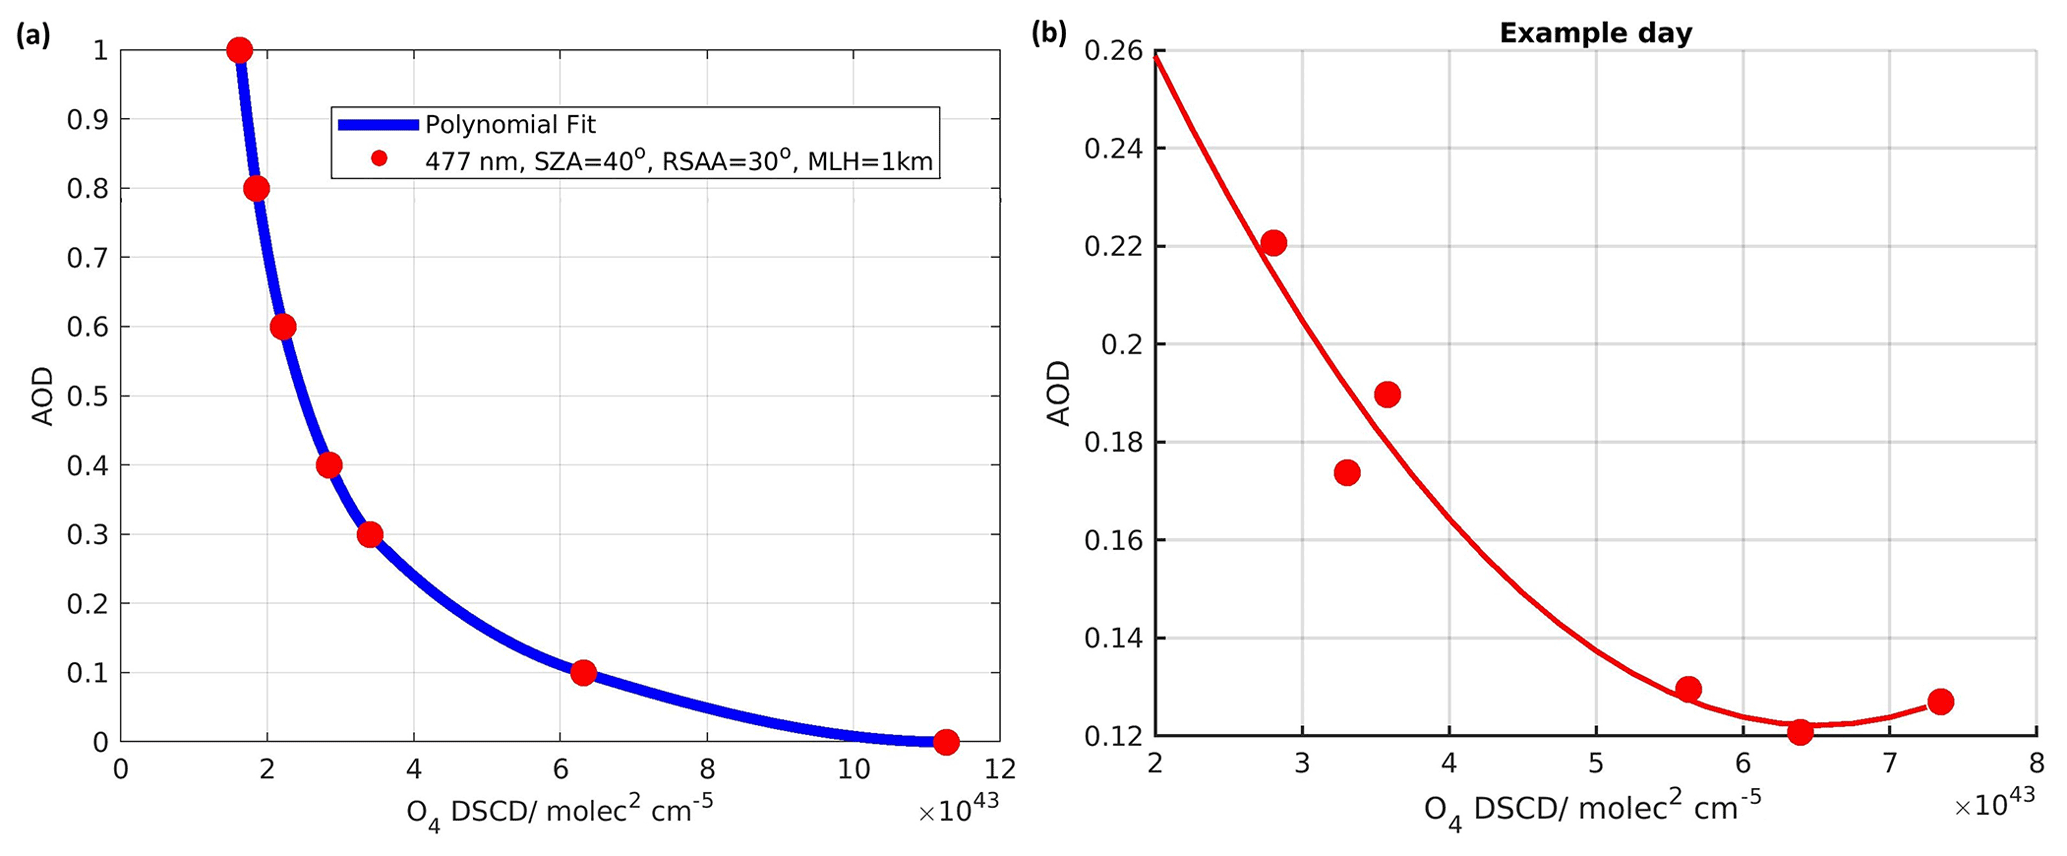
Figure 4(a) Dots: simulated AOD for NO2 box profile of 1 km at 477 nm for an SZA of 40∘ and RAA of 30∘ as a function of the simulated O4 dSCDs for the different AOD values (1, 0.8, 0.6, 0.4, 0.3, 0.1, and 0; see Table 2). Blue line: simulated AOD by applying an exponential fit through the data points. (b) Dots: estimated AOD in the six wavelengths used in the retrieval for 1 example day (11 September 2018). Red line: fitted line through the data points.
For every combination of all eight parameters (i.e., all the parameters of Table 2, except the AOD values), a polynomial fit of simulated as a function of simulated O4 dSCDs is applied. Figure 5a shows simulated as a function of simulated O4 dSCDs, and a second-order polynomial is fitted through the data points. We also observe in Fig. 5b, in which an example day of MAX-DOAS measurements is presented, that the as a function of the measured O4 dSCDs has the same relation as the simulated quantities. Since NO2 is an optically thin absorber, is not a function of c, and consequently an value can be estimated by using the measured O4 dSCD for each measurement. Based on the corresponding SZA, RAA, measured O4 dSCD, and MLH, an is attributed to each low-elevation MAX-DOAS measurement through this polynomial fit. To express as a function of four different parameters (i.e., O4 dSCD, SZA, RAA, and MLH), is interpolated linearly at the O4 dSCD, SZA, RAA, and MLH of each measurement. For example, a MAX-DOAS measurement with SZA =30∘, RAA =60∘, MLH km, and measured O4 dSCD molec.2 cm−5 will have an equal to 15 km at 477 nm (see Fig. 5a).

Figure 5(a) Dots (stars): simulated for NO2 box profile of 1 km at 477 nm (530 nm) for an SZA of 30∘ and RAA of 60∘ as a function of the simulated O4 dSCDs for the different AOD values (1, 0.8, 0.6, 0.4, 0.3, 0.1, and 0; see Table 2). Blue (red) line: second-order polynomial fit through the data points. (b) Dots: estimated in the six wavelengths used in the retrieval for 1 example day (11 September 2018). Red line: fitted line through the data points.
Based on this approach, the near-surface NO2 concentration can be calculated at the six different wavelengths by using the measured dSCD together with the simulated value (Eq. 2). The corresponding near-surface NO2 VMRs are obtained by dividing the NO2 concentrations by the air number density. To derive the air number density, we use monthly averaged pressure and temperature profiles over a 20-year period. These profiles are extracted from the European Centre for Medium-Range Weather Forecasts (ECMWF) ERA-Interim reanalysis. In the last step, the tropospheric NO2 VCD is calculated from the product of the near-surface NO2 concentration with the MLH.
Regarding aerosols, the AOD is estimated for every off-axis measurement (see Fig. 4a). The near-surface aerosol extinction is then calculated as the ratio between the aerosols inside the MLH (i.e., AOD times p) and MLH. The near-surface aerosol extinction refers to the layer that extends from the surface to the MLH. As mentioned above, around 30 % of the total aerosols are expected to be found inside this layer.
The effect of SZA, RAA, and MLH on the simulated is investigated in the Supplement. First, the simulated is presented in Fig. S1 as a function of RAA for different MLH and wavelengths as well as a single AOD and SZA value. strongly depends on MLH. The lower the MLH, the shorter the . The same NO2 concentration and aerosol load are used for the three different MLH scenarios. So, when aerosols are concentrated in a thin layer (i.e., MLH km), becomes shorter. Secondly, we observe that depends on RAA. The larger the RAA, the longer the . In Fig. S2, simulated is plotted for each wavelength and each considered MLH as a function of SZA (at a constant AOD and RAA). depends strongly on SZA. The highest dependency is observed for large SZA values at which becomes maximum. Finally, in both Figs. S1 and S2, we observe that becomes longer with wavelength, which is expected because of the less pronounced Rayleigh and Mie scattering at longer wavelengths.
An example of dual-scan MAX-DOAS retrieval is shown in Fig. 6. Based on the RTM simulations described above, is derived for the wavelengths of interest, and ultimately, near-surface NO2 concentrations and tropospheric NO2 VCDs are estimated. In the last step, the near-surface aerosol extinction values are assigned to the six different wavelengths.

Figure 6(a) Corresponding , (b) near-surface NO2 concentrations, (c) NO2 VCDs, and (d) aerosol optical densities as a function of the six wavelengths used in the retrieval (11 September 2018, 11:51 UTC, 123.5∘ azimuthal direction).
5.2.2 Uncertainty budget
To estimate uncertainties in the dual-scan parameterized NO2 near-surface concentration and VCD, the standard error propagation method is used as
which is solved as
Then,
where
According to Kreher et al. (2020) and Bösch et al. (2018), in urban or suburban polluted conditions, the use of the DOAS fit uncertainty of NO2 for the dSCD uncertainty is not appropriate because the dSCD uncertainty is mostly driven by atmospheric variability as well as spatial and temporal fluctuations in the O4 and NO2 fields. In this study, a conservative value of 3.5×10¹⁵ molec. cm−2 is attributed to (Kreher et al., 2020). This represents an error of up to 6.0 % in the NO2 dSCDs in the visible range (477 nm).
The second error source is related to the estimation of from the RTM simulations. To estimate this error, sensitivity tests on the input aerosol and NO2 vertical profiles were performed. The fraction of aerosols located inside the MLH (40 % and 60 % instead of 30 %) and the NO2 profile shape (linearly decreasing instead of box) were modified. The error related to the RTM simulations of the simulated dSCD is about 9.6 % in the visible range (477 nm). Additionally, according to Dimitropoulou et al. (2020), the uncertainty related to MLH is about 4 % in the visible range (477 nm).
Combining all the error sources, the total uncertainties in the NO2 near-surface concentration are about 12.7 %, 12.4 %, 11.4 %, 11.1 %, 11.3 %, and 12.6 % at 343, 360, 380, 447, 477, and 530 nm, respectively.
Finally, the total uncertainties in the NO2 VCD are about 12.0 %, 11.7 %, 10.7 %, 10.3 %, 10.6 %, and 11.9 % at 343, 360, 380, 447, 477, and 530 nm, respectively.
5.2.3 Verification of the dual-scan MAX-DOAS retrieval method
The consistency check and verification of the dual-scan MAX-DOAS retrieval method in Uccle are based on two different correlative comparisons.
The consistency check compares the NO2 near-surface VMRs and tropospheric VCDs retrieved by the dual-scan parameterization in the main azimuthal direction to the same quantities retrieved with the MMF inversion algorithm at the two main wavelengths (360 and 477 nm). As can be seen in Figs. 7 and 8, both datasets are in good agreement, with correlation coefficient values in the range of 0.86 to 0.95 and slope values close to unity for all four comparisons.

Figure 7Comparison between MMF and parameterized NO2 near-surface VMR at 477 nm (visible, a) and 360 nm (UV, b), as derived from the main azimuthal direction (i.e., 35.5∘ azimuthal direction).
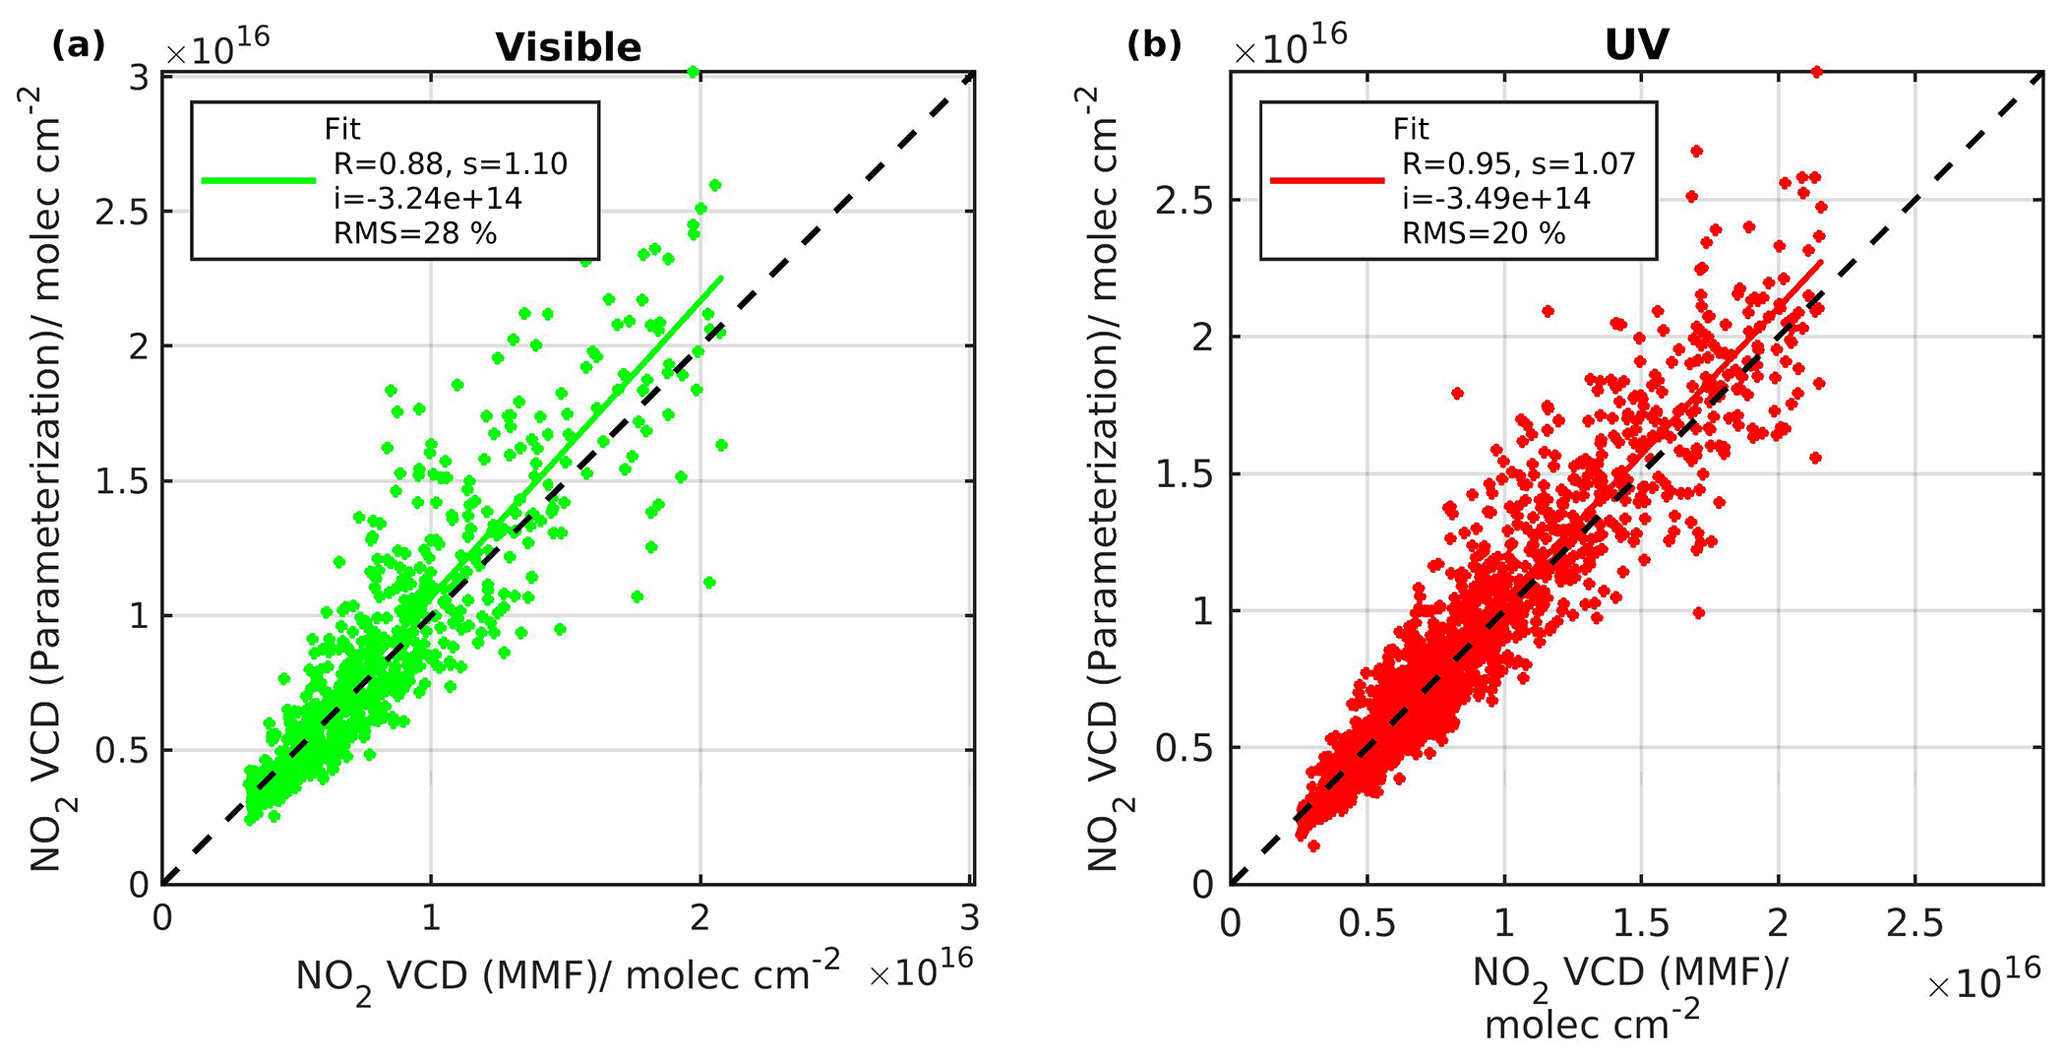
Figure 8Comparison between MMF and parameterized NO2 VCD at 477 nm (visible, a) and 360 nm (UV, b), as derived from the main azimuthal direction (i.e., 35.5∘ azimuthal direction).
The verification step is based on the same type of comparison as the first one but for three additional azimuthal directions in which elevation scans, and hence profile retrievals, are available for some periods. Onward from 3 July 2019, elevation scans were performed in these three additional azimuthal directions to complement the already existing measurement setup. These elevation scans were performed once per day around noon in the 11, 105, and 262.5∘ azimuthal directions. Figure 9 shows the comparison between near-surface NO2 VMRs and tropospheric VCDs retrieved by the dual-scan parameterization method and the corresponding results obtained with the MMF inversion algorithm. Overall good agreement is obtained (R=0.79 and 0.84 for near-surface VMR and VCD, respectively). We observe that the comparison concerning the near-surface NO2 VMR seems to be noisier than in the main azimuth direction. This is mainly due to the use of the MLH calculated in the main azimuthal direction for all the different azimuth angles in the dual-scan method. Additionally, the parameterization technique slightly underestimated the near-surface NO2 VMR (s=0.84), while a slope value of 1.00 is obtained for tropospheric VCDs.
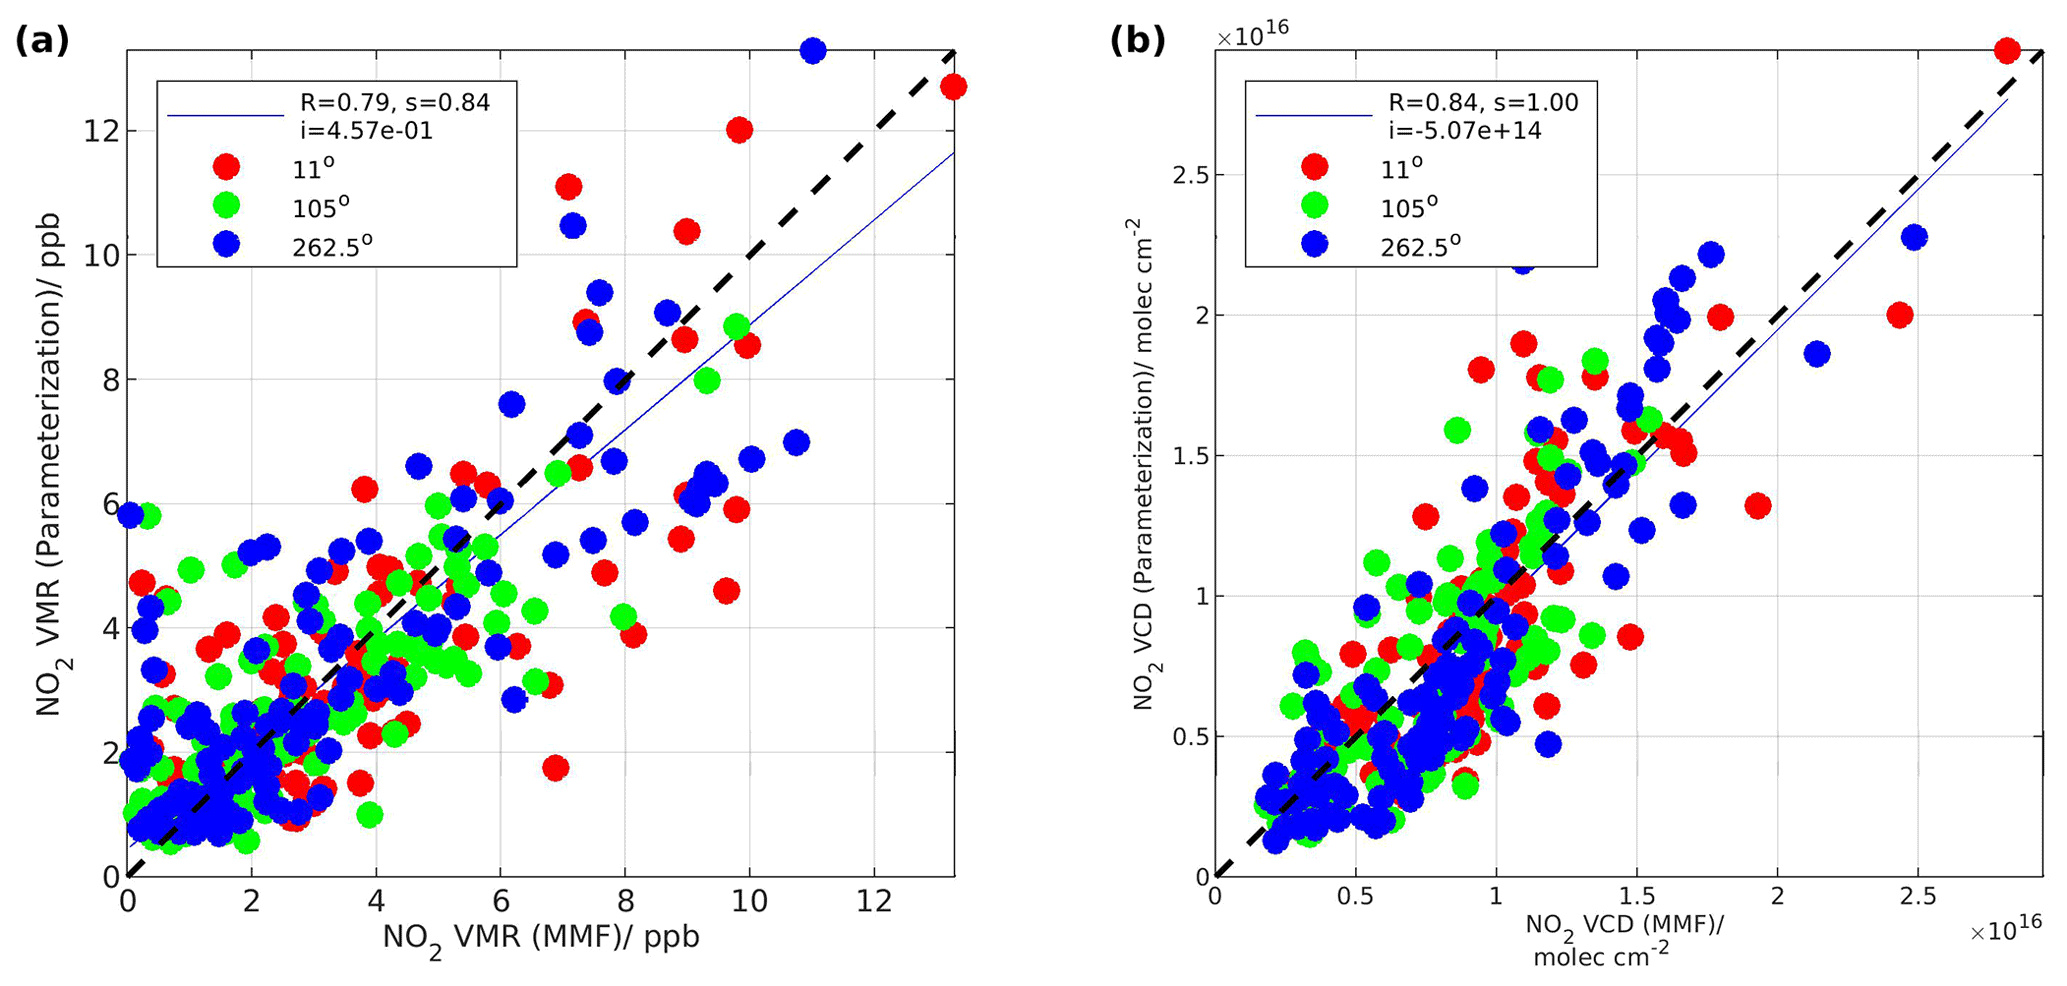
Figure 9Visible range: comparison between MMF and (a) parameterized NO2 near-surface VMR as well as (b) parameterized NO2 VCD at three different azimuthal directions, as indicated in the color bar (11, 105, and 262.5∘ azimuthal directions). The elevation scans in these azimuthal directions were performed once per day from 3 July 2019.
5.3 Horizontal distribution inversion approach
The parameterized NO2 near-surface concentrations at the six different wavelengths are used as input in a new horizontal distribution inversion approach. As parameterized NO2 near-surface concentrations, we refer to the conversion of the measured NO2 dSCDs (i.e., at the elevation angle of 2∘) to near-surface NO2 concentrations by applying the dual-scan MAX-DOAS retrieval method as described in Sect. 5.2. Figure 10 shows a sketch of the assumed horizontal box model configuration, in which successive boxes of concentration cN between the horizontal distances dN−1 and dN from the MAX-DOAS instrument are considered along the light path. The index N is equal to the total number of successive boxes.

Figure 10Schematic representation of the six different (i.e., one horizontal line for each wavelength) used in the new horizontal distribution inversion approach. The length of each line shows the sensitivity of each wavelength as a function of the horizontal distance. The shortest line represents the smallest wavelength.
The different horizontal lines illustrate the horizontal extent (or differential effective light path as described in Sect. 5.2) in which the NO2 near-surface concentrations are extended for the six different wavelengths. Generally, the MAX-DOAS horizontal sensitivities are longer for larger wavelengths because of the less pronounced Rayleigh scattering (see also Fig. 6; Ortega et al., 2016; Dimitropoulou et al., 2020). In Fig. 10, the shortest line represents the smallest wavelength's horizontal sensitivity (343 nm) and the longest line the largest wavelength's horizontal sensitivity (530 nm). As can be seen in the sketch, the effective horizontal light path at the six different wavelengths passes through a different number of horizontal bins.
The parameterized NO2 near-surface concentrations at the different wavelengths are the mean concentrations along the horizontal effective light paths (see Sect. 5.2), which are also called differential effective light paths because they are linked to the dSCD. When having information coming from one wavelength only, it is not possible to know how the NO2 is distributed along this light path. In the present work, the knowledge of mean NO2 concentrations at six different wavelengths is used to retrieve a horizontal NO2 profile, assuming the horizontal box model described in Fig. 10. This new retrieval method is described below.
The measurement vector y consists of the six retrieved surface concentrations (called ; see the method presented in Sect. 5.2) at the six different wavelengths. These near-surface concentrations can be expressed as functions of the different effective light paths () and correspond to the average surface concentrations along those .
Fcalcul, which represents the forward model, can be expressed as follows:
where x is the horizontal distance, a is the elevation angle of the measurement, and is NO2 near-surface concentration as a function of x, the distance from the MAX-DOAS instrument.
Our retrieval of the horizontal distribution of is based on the inversion theory (Rodgers, 2000), in which a horizontal profile (state vector) is retrieved given an a priori horizontal profile xα, the measurement vector y, the matrix of the weighting function K, the uncertainty covariance matrix of the a priori Sα and the uncertainty covariance matrix of the measurement Se.
The weighting function indicates the sensitivity of the measurement vector to a change in the horizontal profile. Following the Beer–Lambert law, the weighting functions follow an exponential decrease between the instrument and . Additionally, we should consider that the light path through the horizontal boxes is slanted and not horizontal by including the cosine of the elevation angle (i.e., 2∘ elevation angle). The weighting functions are given by the following equation.
An example of weighting functions is presented in Fig. 11. The sensitivity decreases exponentially up to a distance corresponding to the differential effective light-path length of each measurement. More precisely, each measurement is highly sensitive to the MAX-DOAS instrument location. This sensitivity decreases exponentially as a function of the horizontal distance. Then, it reaches a value equal to to the horizontal distance equal to the differential effective light-path length of each measurement. It should be noted that since NO2 is an optically thin absorber, the measurements depend linearly on each horizontal box's concentration. For this reason, OEM for the linear case is considered here, and only one inversion step is needed (see Eq. 12).
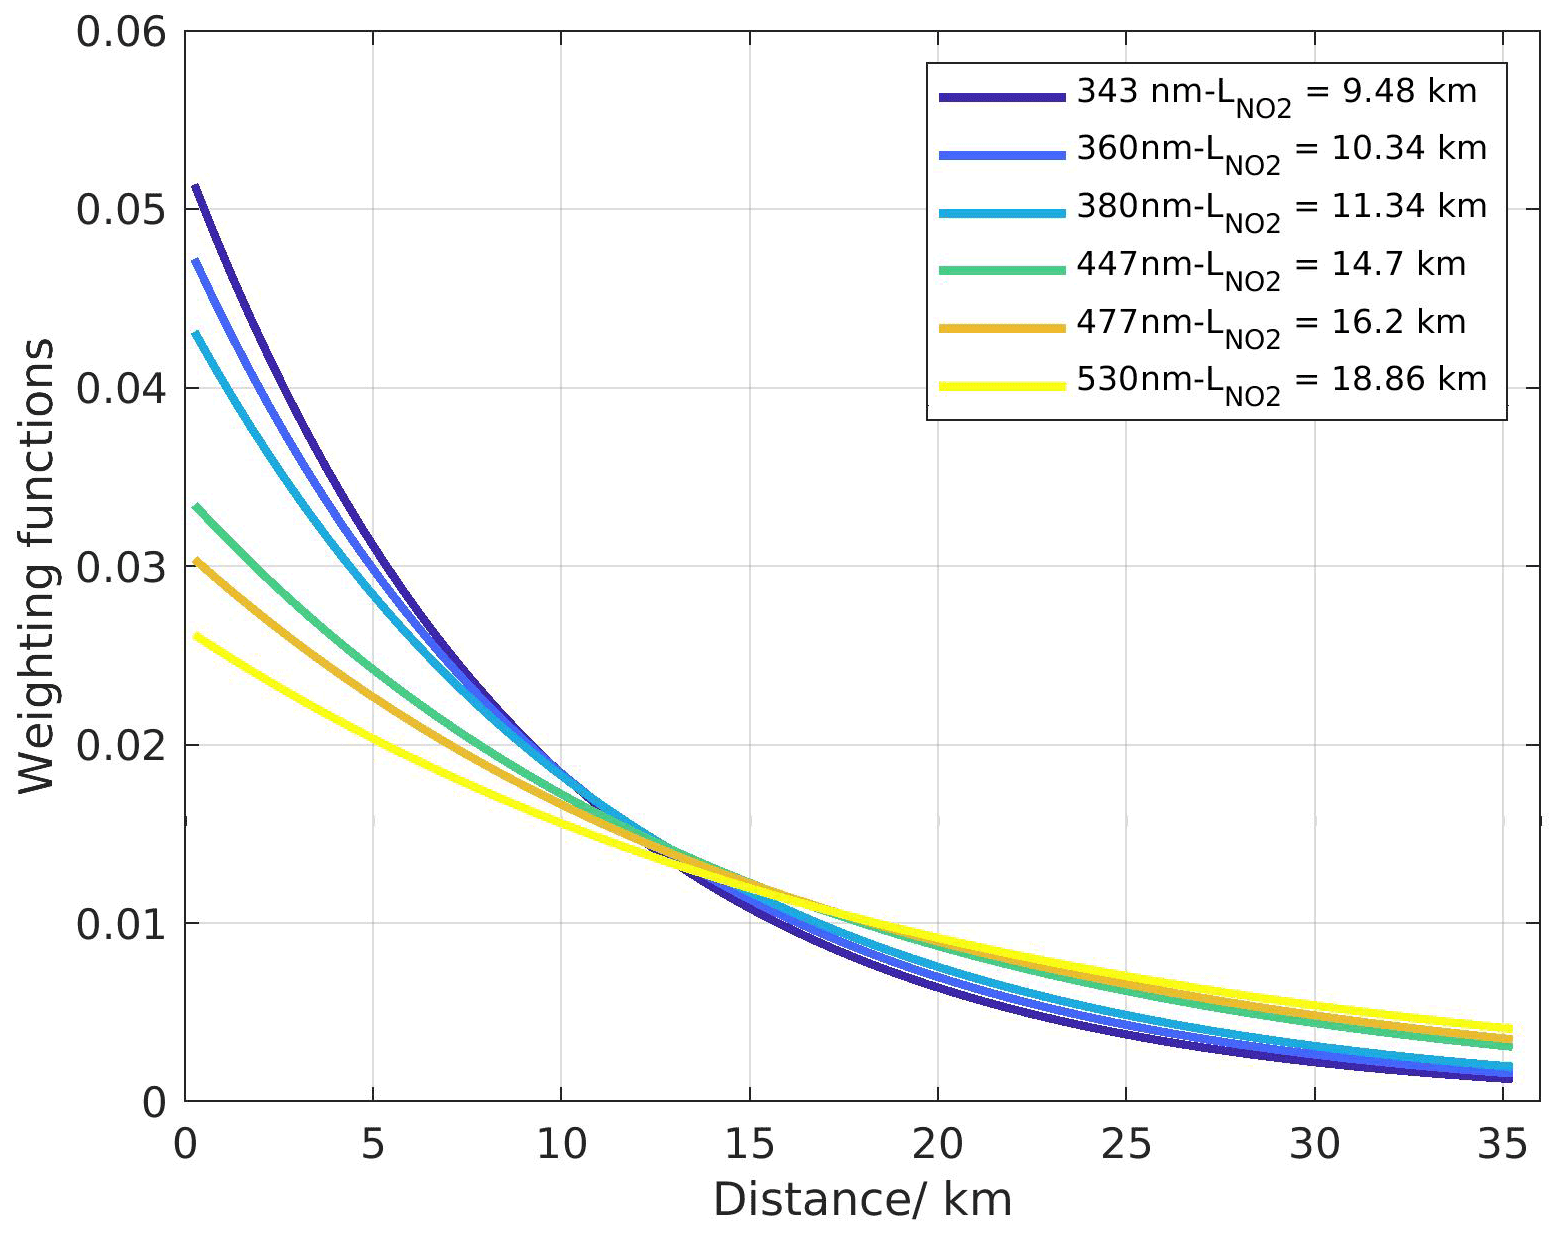
Figure 11Examples of weighting functions used in the new horizontal distribution inversion approach (11 September 2018, 11:26 UTC).
The selected output horizontal grid for the retrieval extends from the MAX-DOAS instrument to the horizontal distance in which the weighting function of the largest wavelength (i.e., 530 nm) decreases at 10 % of its value at the MAX-DOAS instrument's location per azimuthal direction and consists of successive boxes of 0.5 km thickness on the horizontal axis.
Since this inversion problem is ill-conditioned, more than one horizontal NO2 profile can be consistent with the measurement vector. To reject unrealistic solutions, the a priori profile xa and its uncertainty covariance matrix must be included in the retrieval. In the OEM, the a priori information usually comes from an independent source, like a model or other correlative measurements. In the present study, RIO model data were chosen as a priori. Seasonal average maps of RIO NO2 near-surface concentration are constructed (see Fig. S3), and then seasonal averages of RIO NO2 near-surface concentration horizontal profiles were calculated in each azimuthal direction and interpolated on the retrieval's horizontal grid by regridding the initial 4×4 km2 spatial resolution to a finer one (see Fig. 12). The shape of the RIO a priori NO2 profiles per azimuthal direction stays the same during different seasons of the year, indicating that the wind effect on NO2 transportation disappears by the seasonal averaging and that the same sources contribute to the NO2 horizontal field. A mean scaling factor equal to the mean ratio between the measured and RIO NO2 near-surface concentrations is applied because of the systematic underestimation of NO2 near-surface concentrations by MAX-DOAS when compared to in situ measurements (see Dimitropoulou et al., 2020, and Sect. S1).
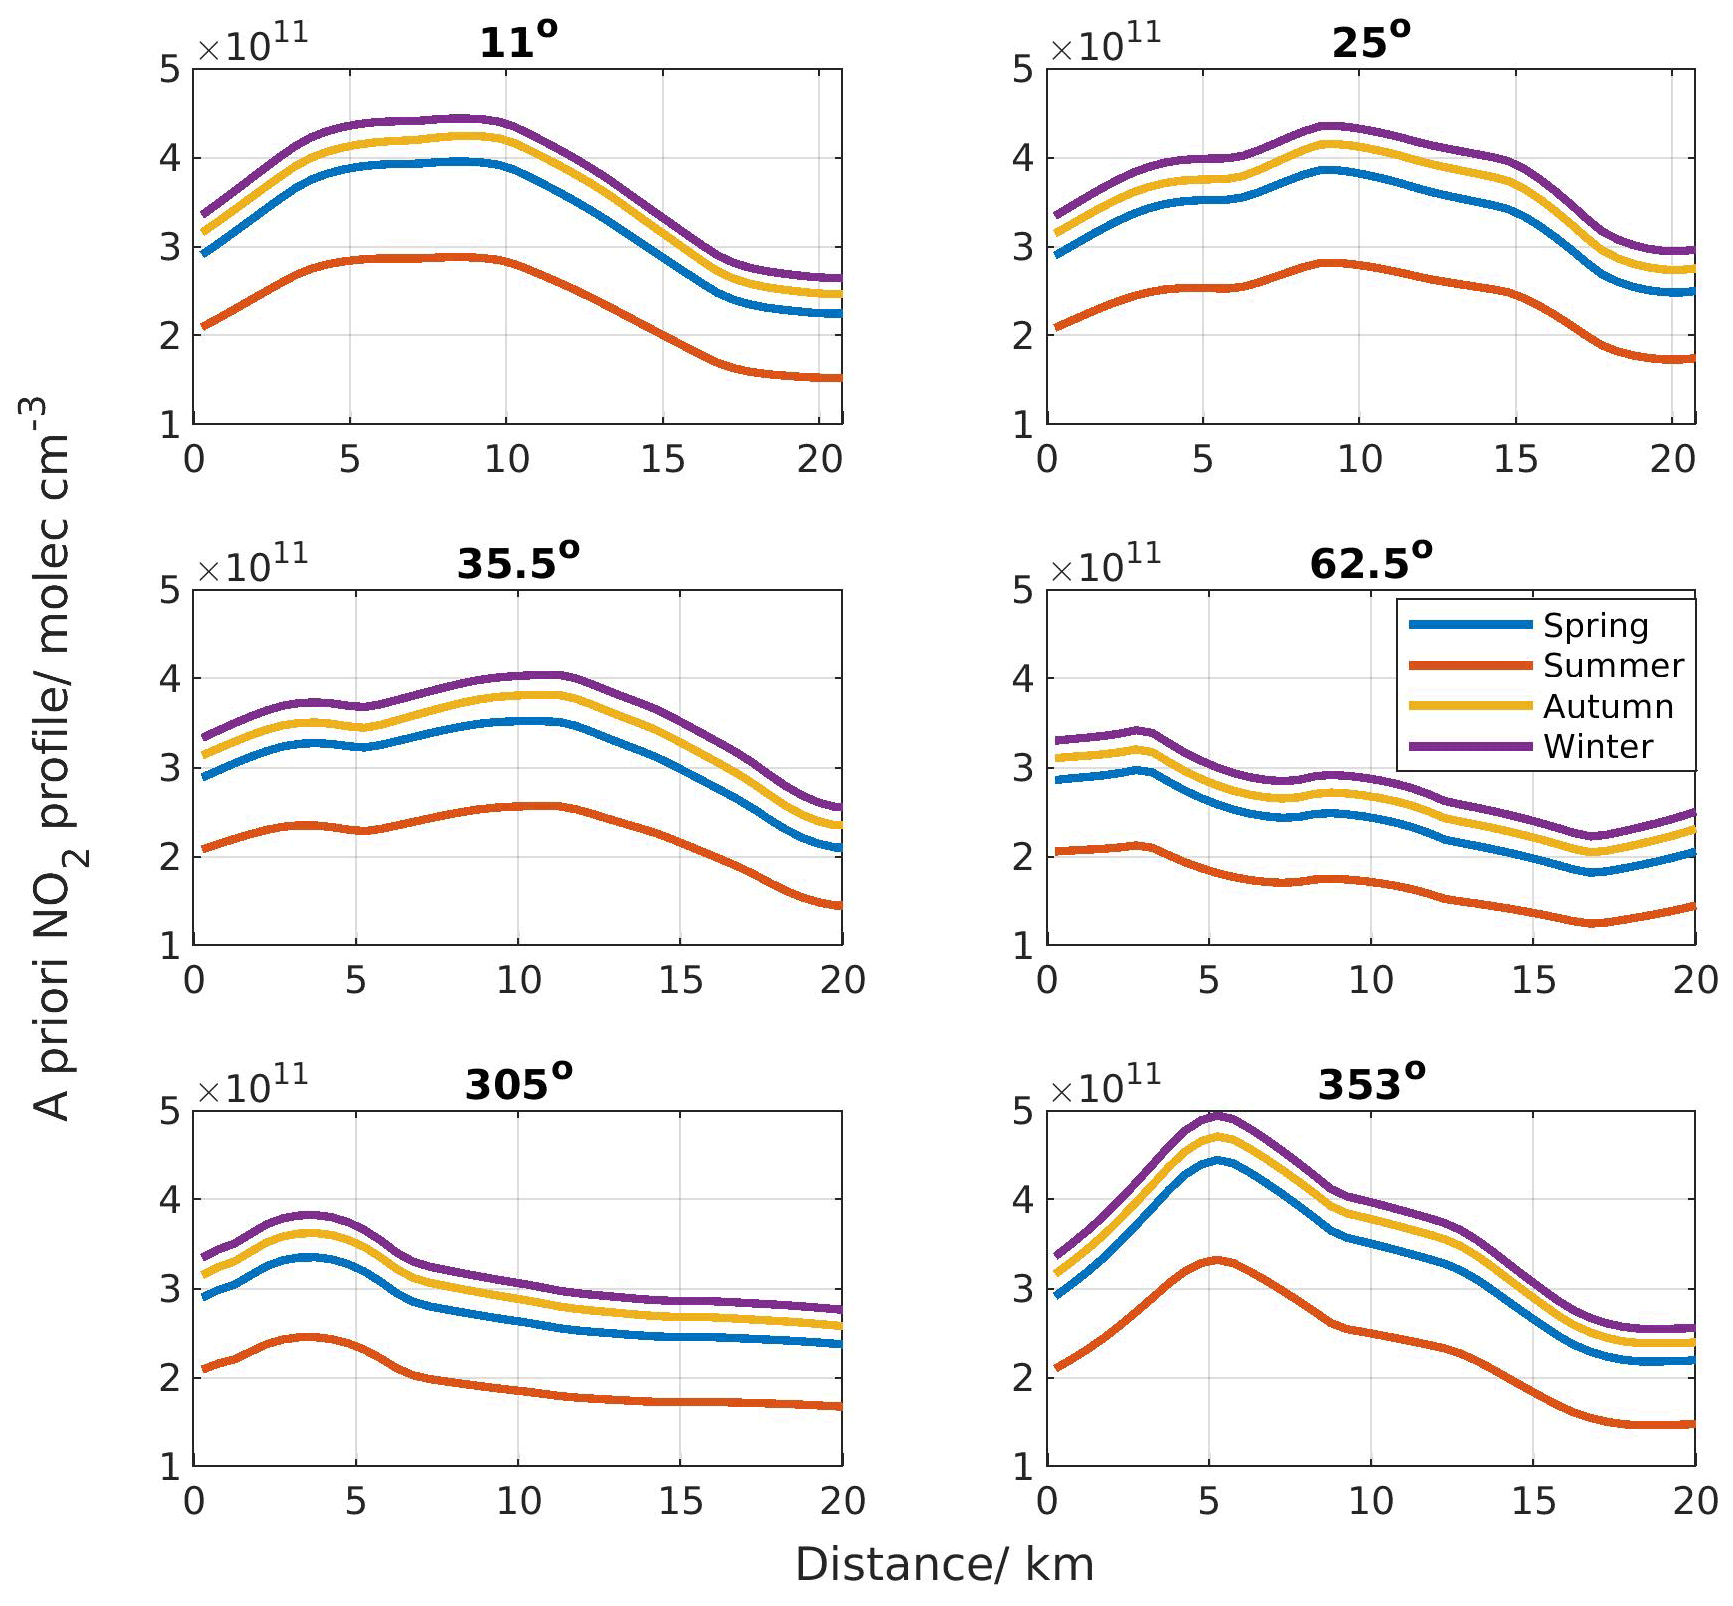
Figure 12Example of seasonal RIO a priori NO2 horizontal profiles for the new horizontal distribution inversion approach as a function of the horizontal distance from the MAX-DOAS instrument in six different azimuthal viewing directions, before the application of the scaling factor.
For the aerosol horizontal distribution retrieval, there are no sufficient independent measurements that provide information about the horizontal distribution of AOD and can serve as an a priori AOD profile. Therefore, a constant a priori AOD profile is used in the AOD retrieval based on CIMEL observations. An AOD equal to 0.18, which is the yearly averaged AOD value from CIMEL at 477 nm, is used. To construct the near-surface aerosol extinction a priori profiles, 30 % of the total amount of AOD is considered to be located inside the MLH (i.e., known for each MAX-DOAS vertical scan from the MMF inversion algorithm; see Sect. 5.1).
The diagonal elements of the Sa matrix are set equal to the square of a scaling factor times the NO2 concentration a priori profile. The non-diagonal elements, which account for correlation between the different horizontal grid cells, are set as follows (Barret et al., 2002):
where xi and xj are the horizontal distances at the ith and jth horizontal boxes, and γ is half of the correlation length. For NO2, γ is set equal to 3.5 km, and for aerosols, γ is set equal to 2 km. To eliminate inversion instabilities, Sa elements which are smaller than 0.1 % of the maximum Sa element are set equal to zero.
To estimate the correlation length, a covariance matrix was constructed by exploiting the airborne observations above Brussels (28 June 2019). The airborne observations have a spatial resolution of approximately 100×100 m2. NO2 horizontal profiles were constructed in different azimuthal directions at a spatial resolution of 500×500 m2, expanding from the MAX-DOAS position to a maximum distance of 20 km, and were used to calculate a covariance matrix. A correlation length equal to 7 km and, consequently, a gamma value equal to 3.5 km are found to be representative for the NO2 horizontal profiles in Brussels.
Using this correlation length, a variance of 45 % is used. This choice was made based on the seasonal variance of the RIO a priori profiles compared to their seasonal mean value. It is found that the seasonal variance of RIO observations has a mean value of 45 %. Additionally, it is found to be a good compromise for obtaining reasonable retrieval results, e.g., in terms of information content, while avoiding unrealistic oscillations in the retrieved aerosol and NO2 profiles. It should be noted that for aerosols, a variance of 65 % is used.
The measurement covariance matrix Se is chosen to be diagonal, with elements corresponding to the uncertainties of the dual-scan parameterized NO2 near-surface concentration (see Sect. 5.2.2).
Three examples of the retrieved NO2 horizontal profile are presented in Fig. 13, together with corresponding measured and simulated at the six different wavelengths for 2 July 2018 (Fig. 13a; low NO2 abundance condition), 11 September 2018 (Fig. 13b; medium NO2 abundance condition), and 30 September 2018 (Fig. 13c; medium NO2 abundance condition). The root mean square (rms) is calculated between measured and simulated NO2 near-surface concentrations of the horizontal retrieval normalized by the mean of the measured NO2 near-surface concentrations (upper panels in Fig. 13). As the NO2 values become larger, the agreement between measured and simulated , expressed via the rms value, is improved.
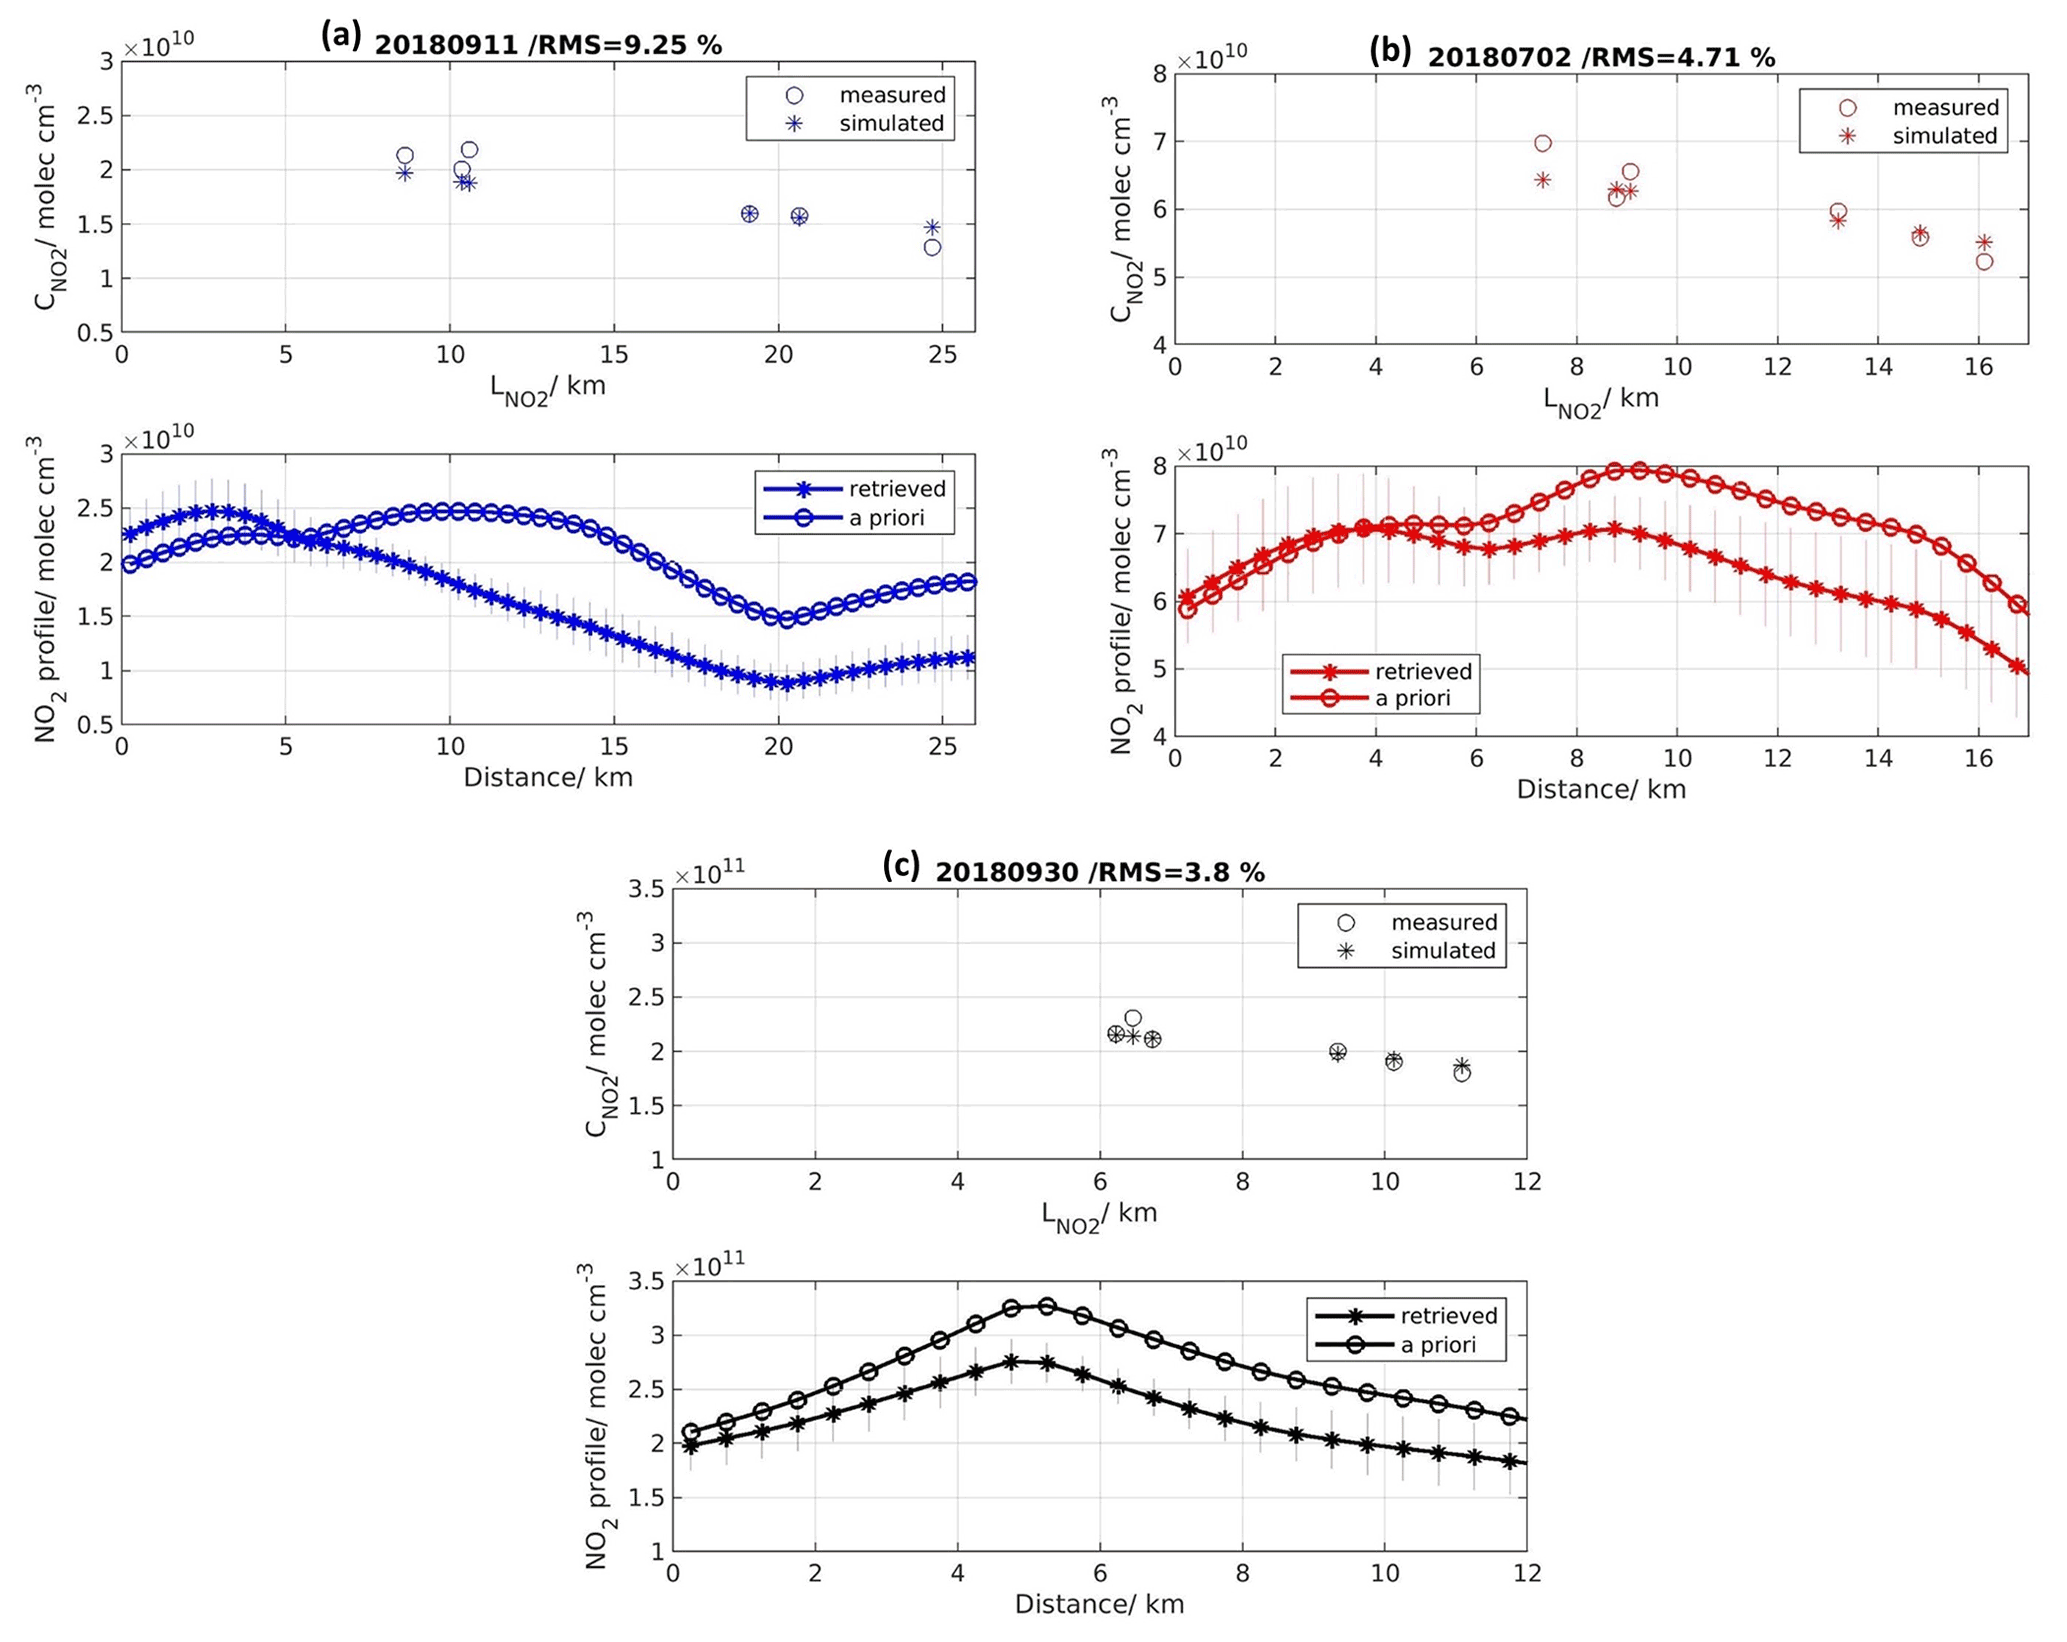
Figure 13Measured and retrieved NO2 near-surface concentrations (upper panels in a, b, and c) at the six different wavelengths (i.e., horizontal distances) as a function of the estimated horizontal distances and (lower panels in a, b, and c) the retrieved NO2 near-surface horizontal profile and a priori profile. The panels correspond to (a) 11 September 2018 at 12:91 UTC with a 265∘ azimuthal direction, (b) 2 July 2018 at 10:42 UTC with a 25∘ azimuthal direction, and (c) 30 September 2018 at 07:96 UTC with a 167.5∘ azimuthal direction.
Similarly, examples of measured and retrieved near-surface aerosol extinction coefficients and retrieved aerosol horizontal profiles are shown in Fig. 14 for different aerosol load conditions (low, Fig. 14a; medium, Fig. 14b; and high, Fig. 14c) over the Brussels-Capital Region. We observe that the agreement between simulated and measured near-surface aerosol extinction coefficients at the six different wavelength tends to be worse than for NO2. This could be due to the use of a constructed (constant) a priori aerosol horizontal profile due to the lack of information on the aerosol extinction horizontal distribution in the Brussels-Capital region.
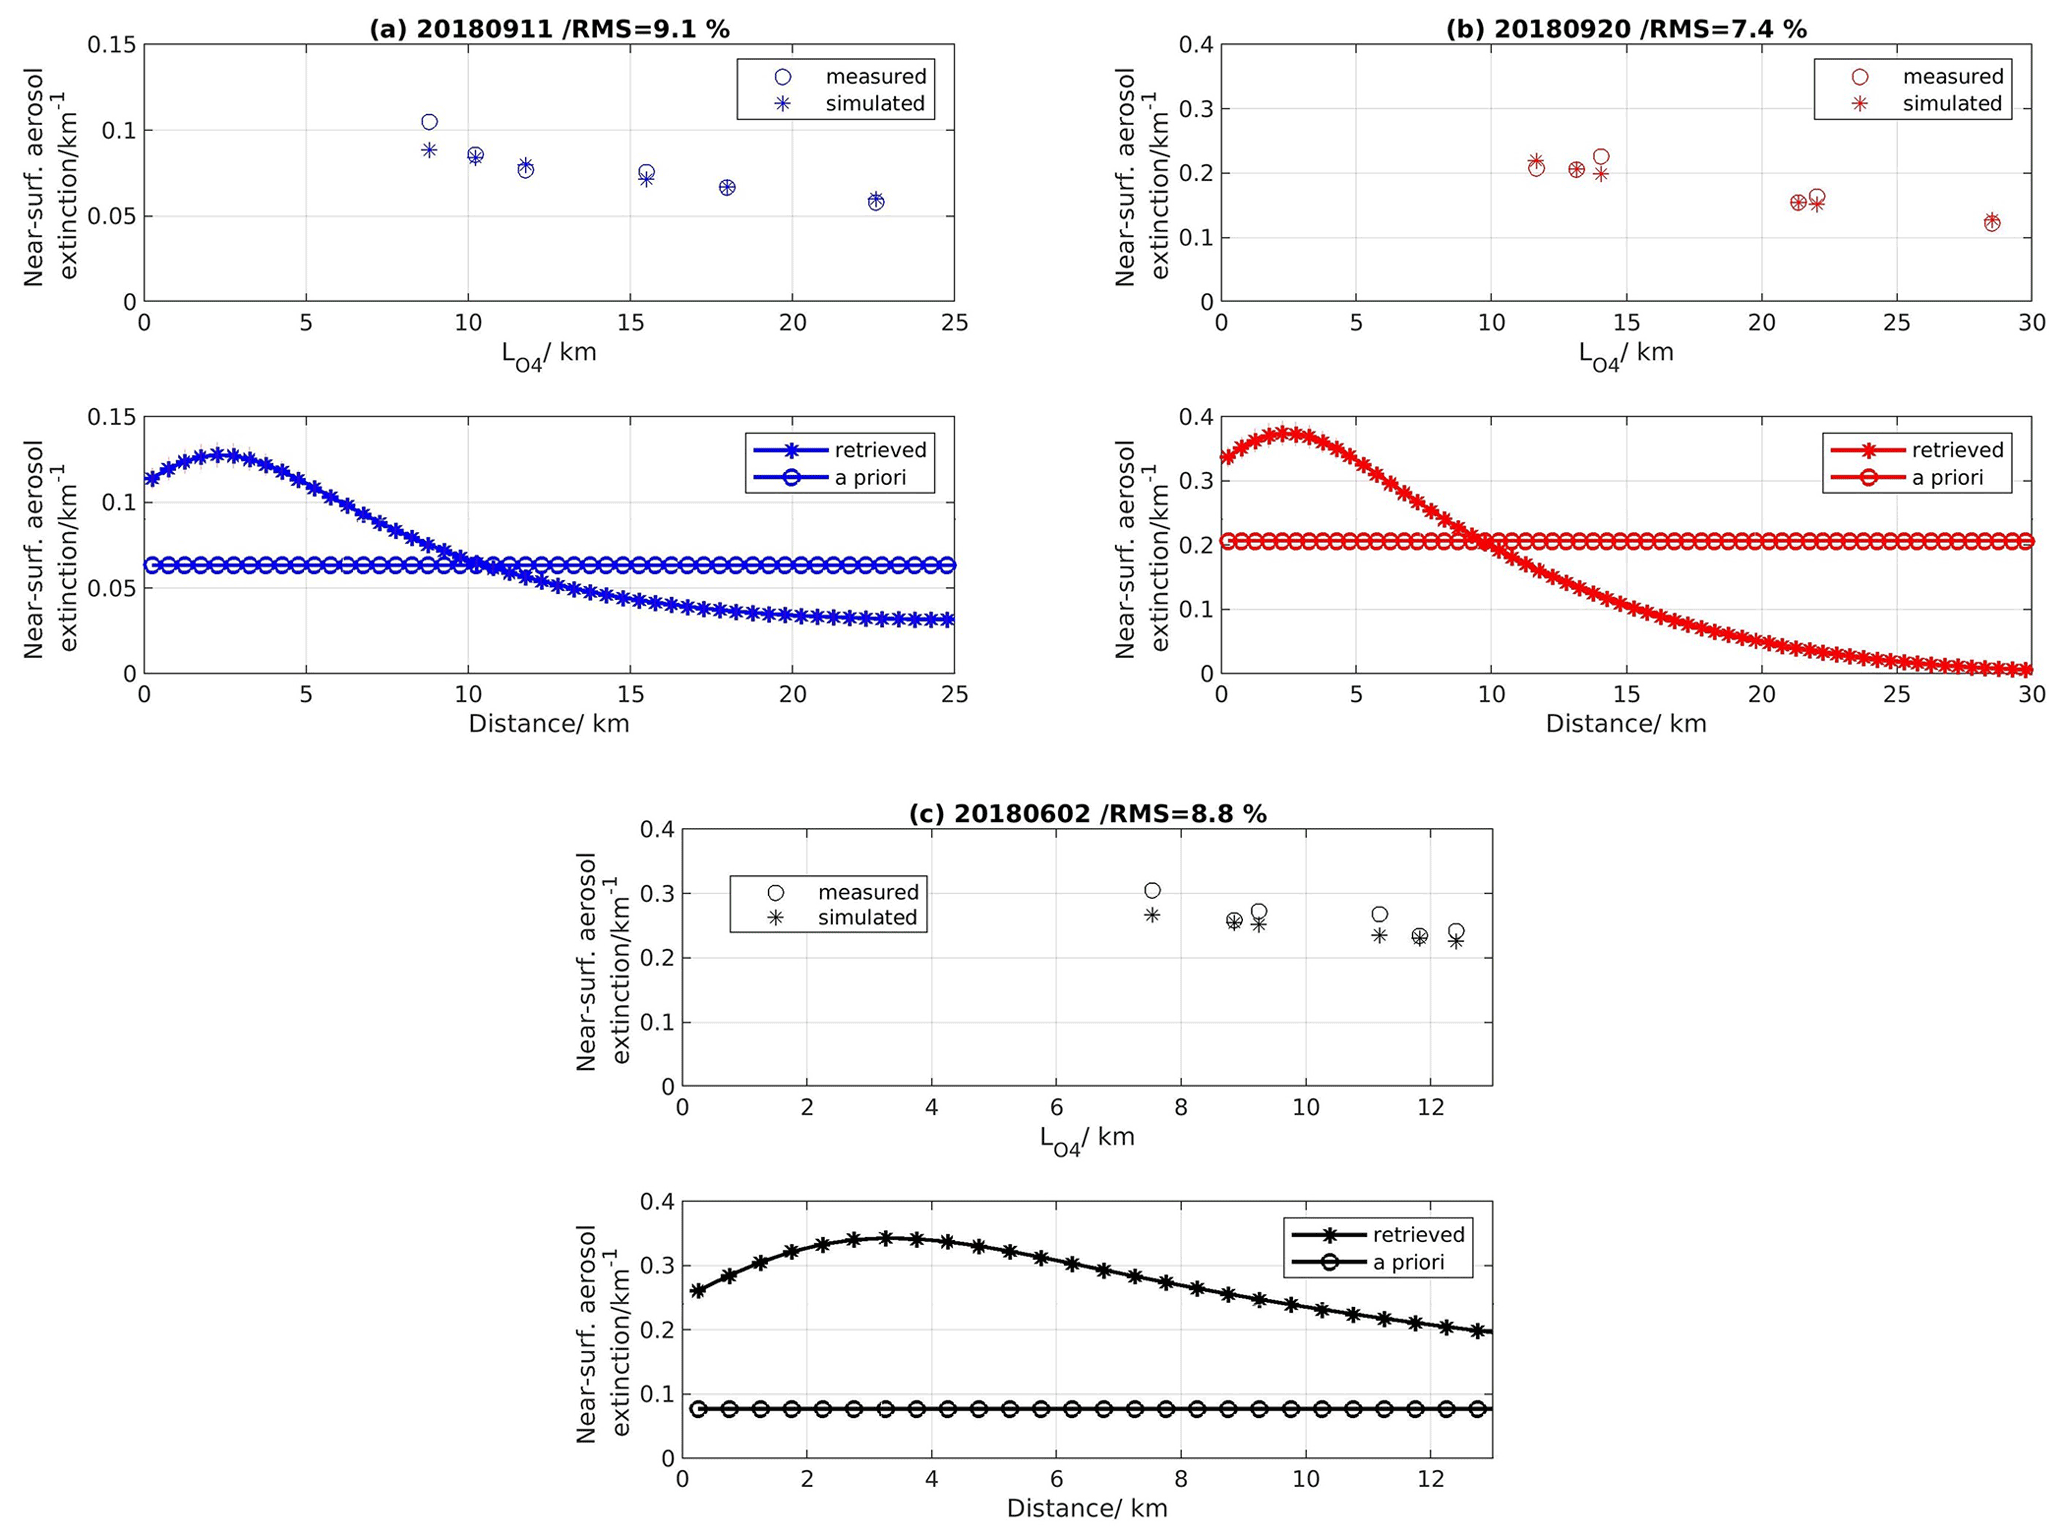
Figure 14Measured and retrieved near-surface aerosol extinction (upper panels in a, b, and c) at the six different wavelengths (i.e., horizontal distances) as a function of the estimated horizontal distances and (lower panels in a, b, and c) the retrieved near-surface aerosol extinction horizontal profile. The panels correspond to (a) 11 September 2018 at 11:48 UTC with a 167.5∘ azimuthal direction, (b) 20 September 2018 at 07:08 UTC with a 25∘ azimuthal direction, and (c) 2 June 2018 at 18:16 UTC with a 35.5∘ azimuthal direction.
An essential condition of the dual-scan MAX-DOAS retrieval and the new horizontal inversion approach at six different wavelengths is the increasing trend of the horizontal sensitivity as a function of wavelength. Consequently, every wavelength is sensitive to a different horizontal region, and the six different wavelengths can be used to retrieve the horizontal distribution of aerosols and trace gases. Sensitivity tests were conducted in which simulated is expressed as a function of the six different wavelengths for different aerosol conditions. As can be seen in Fig. S4, the linear relationship between (and ) and wavelength exists for AOD values ranging from 0 to 1. An AOD equal to unity is chosen as the maximum AOD of the simulations because in Uccle AOD values rarely exceed 1 (see in https://aeronet.gsfc.nasa.gov/, last access: 11 July 2022, for the Brussels measurement site). Therefore, the relation stays linear as the aerosol load changes for the conditions observed in Uccle. The only condition leading to nonlinearity is when clouds are present. However, as explained in Sect. 5.1, a cloud-filtering approach is applied, rejecting the broken cloud scenes, which are the more problematic ones.
5.4 Characterization of the retrieval
To characterize the retrieval, the averaging kernels, AK, play a crucial role. The AK matrix is calculated as follows (Rodgers, 2000).
The AKs are the rows of the AK matrix. They present the sensitivity of the retrieved () to the true () atmospheric profile. Ideally, the AK matrix should be an identity matrix. In Fig. 15, an example of selected AKs is shown. As can be seen that, for distances smaller than the first measurement (e.g., near-surface NO2 concentration retrieved at 343 nm), the AKs have maximum values and decrease exponentially as a function of the horizontal distance from the instrument. For this particular example, the AKs do not exceed the values of 0.12.
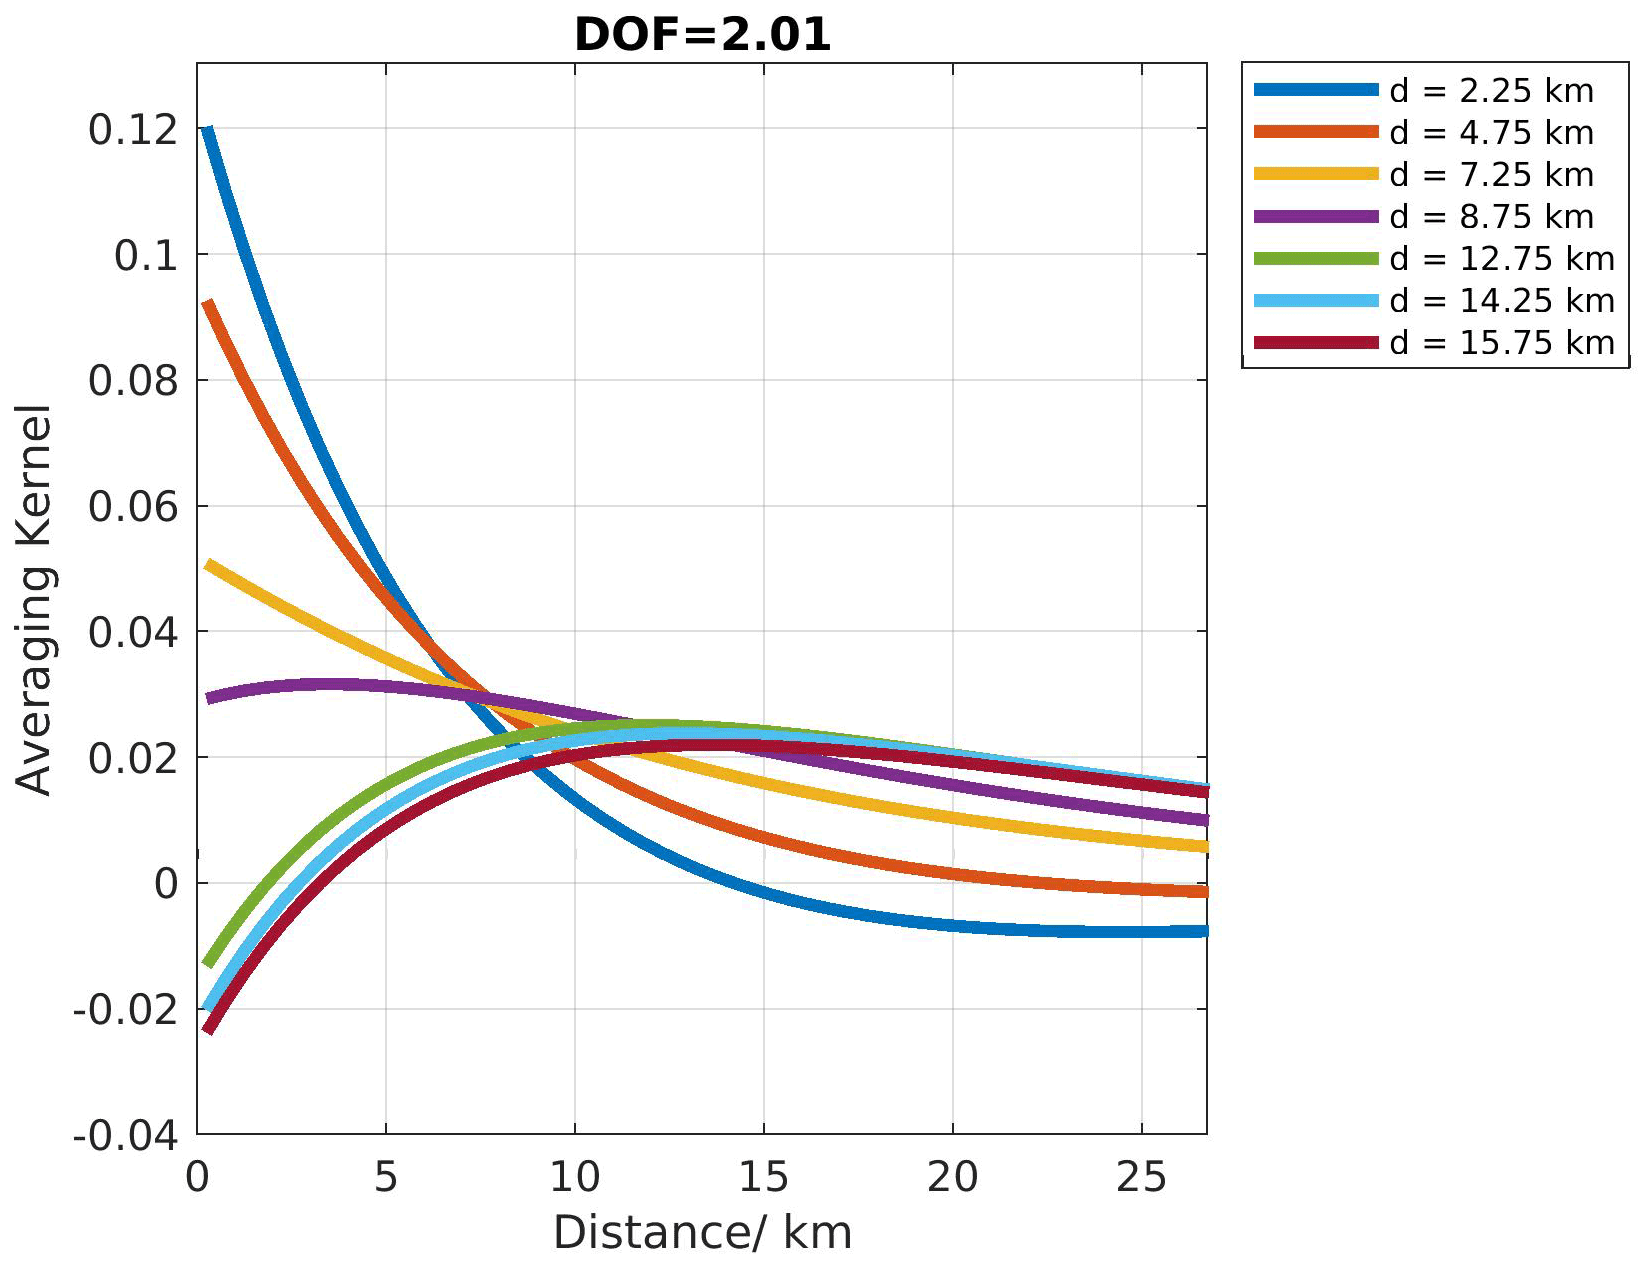
Figure 15Example of NO2 averaging kernels. They are calculated for observations on 11 September 2018 at 11:51 UTC and 300∘ azimuthal direction.
Another important point about the retrieval is the trace of the AK matrix, which refers to the number of degrees of freedom for signal (DOFS). The DOFS are an indication of the number of independent pieces of information that one can retrieve from the measurements. Ideally, the DOFS would be equal to the number of horizontal boxes for the horizontal distribution. In reality, the DOFS are lower because of the limited horizontal resolution of the measurements. In Fig. 15, the DOFS are close to 2, which means that two independent pieces of information are contained in the measurements for this particular example.
In the present work, the total retrieval error is equal to the error related to the measurement noise and the smoothing of the true atmospheric profile. According to Rodgers (2000), the noise covariance matrix is estimated as
with G being the gain matrix:
Then, the retrieval noise error is given as the square root of the diagonal elements of the noise covariance matrix.
The smoothing error is calculated as follows:
with Sx being a realistic covariance metric of the true NO2 horizontal profile.
The horizontal profiles of the measurement and smoothing error in percentage are shown in Fig. 16. As can be seen, the smoothing error is significantly larger than the measurement error (range of 3 %–10 % and 14 %–40 %, respectively). The smoothing error also becomes larger as the horizontal distances from the instrument become larger. This is mainly because of the exponential decrease in the sensitivity as a function of the horizontal distance (see weighting functions in Fig. 11) and, consequently, the larger impact of the difference between the a priori profile and the true state of the atmosphere.
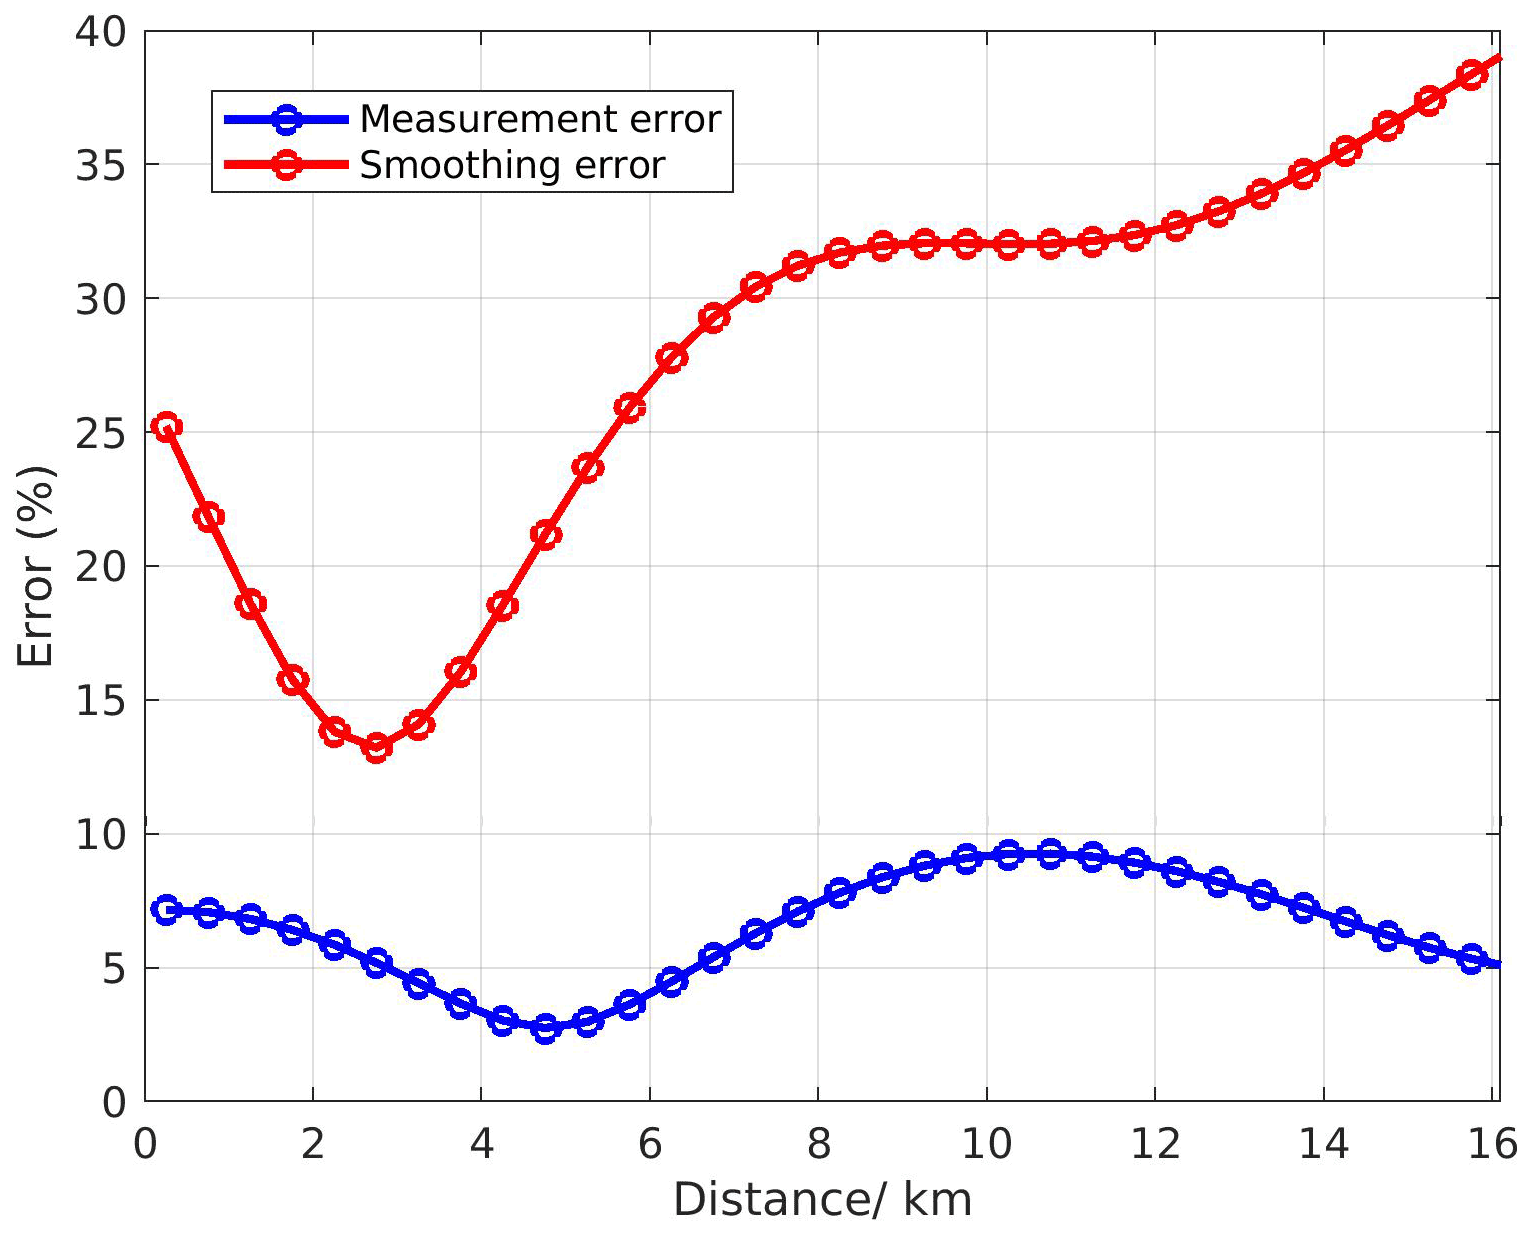
Figure 16Example of the NO2 measurement and smoothing error in percentage for 2 July 2018 at 10:42 UTC and 25∘ azimuthal direction.
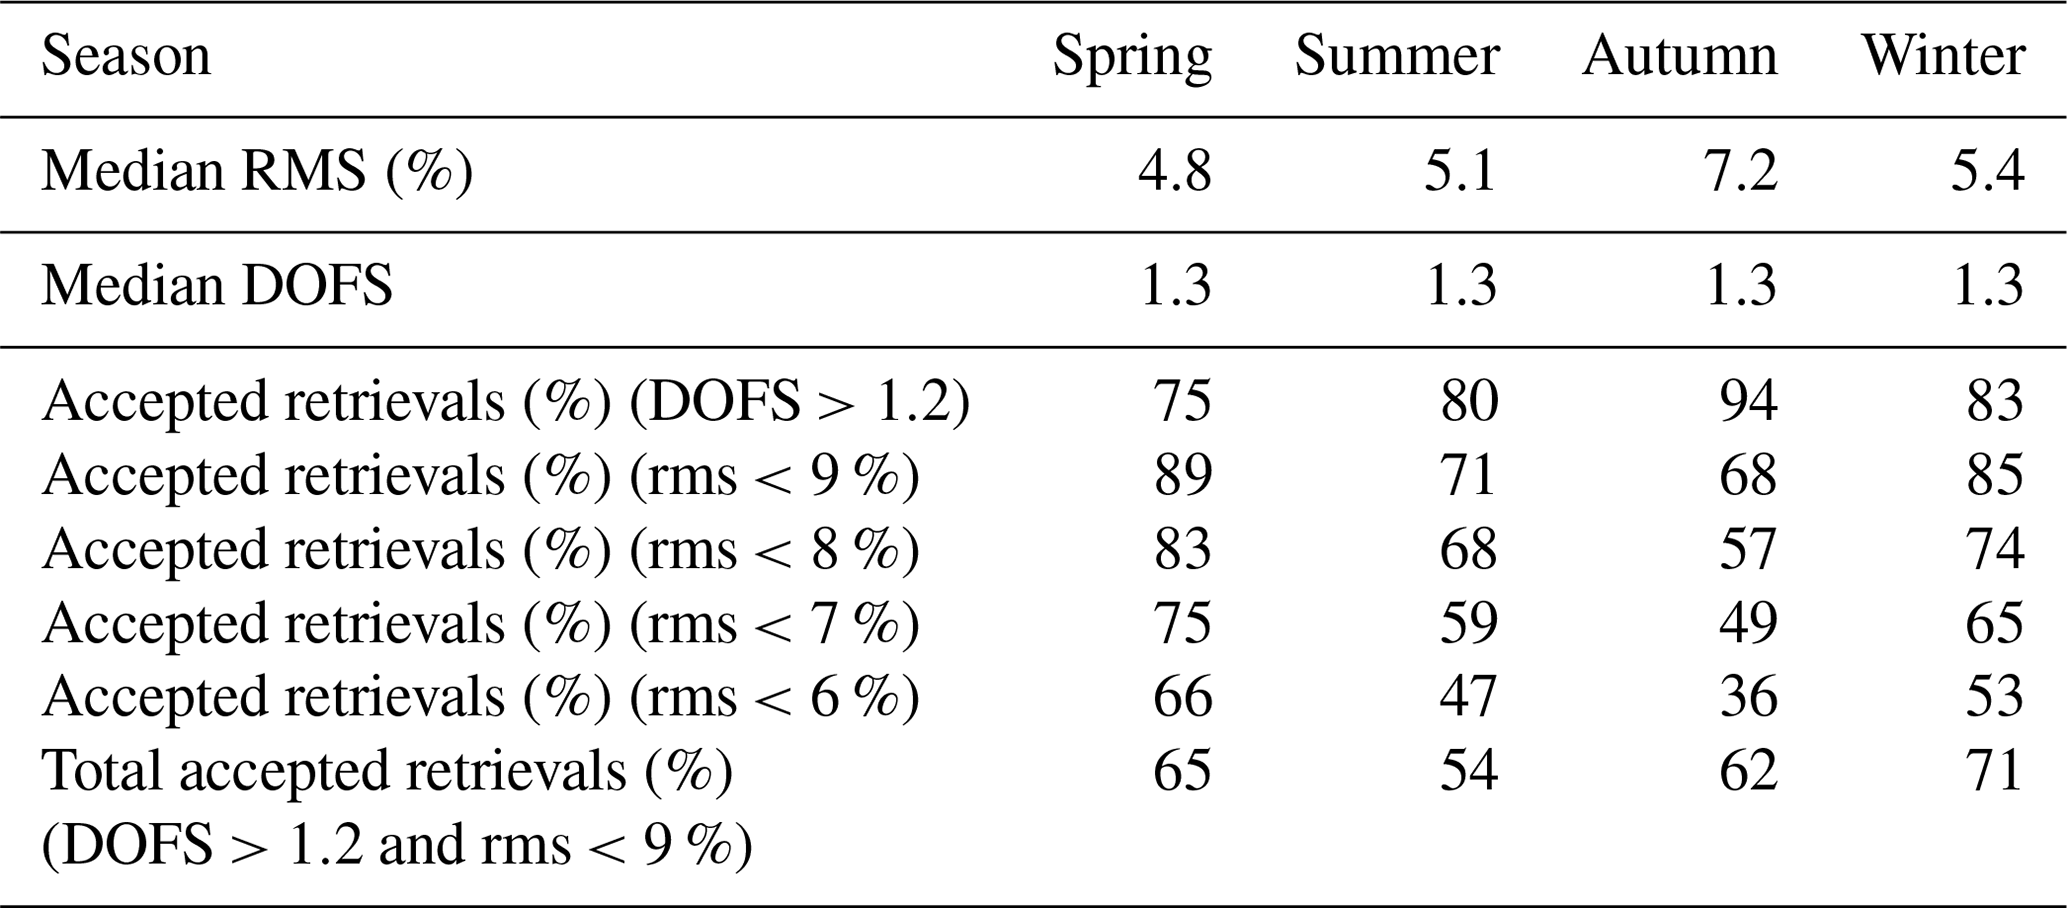
To eliminate the unsuccessful retrievals, the percentage of accepted retrievals with respect to the total number of retrievals during the four seasons is investigated when a specific filtering on rms and DOFS is applied (see Table 3 and Figs. S7 and S8). As we can see in Fig. S8, DOFS are in the range of 1.0–1.6. From these tests, it is found that most of the retrievals have DOFS larger than 1.2 (see Fig. S8). The rms is defined as the root mean square deviation between measured and simulated normalized by the mean of the measured (e.g., same rms as in Fig. 13). Table 3 and Fig. S7 indicate that rms values are in the range of 0 %–30 %, and most of the retrievals have an rms smaller than 9 % with a median rms value of around 5.6 % during all seasons. Based on these investigations, DOFS >1.2 and rms <9 % are used as retrieval quality control criteria.
Table 3Seasonally averaged root mean square (rms) and DOFS values. The rms is calculated between measured and retrieved NO2 near-surface concentrations of the horizontal retrieval (Fig. 13). DOFS represent the degrees of freedom of the horizontal retrieval (Fig. 15). The percentage of the accepted retrievals is presented for the different selection criteria.
6.1 Example of daily horizontal NO2 distribution
The variation of the MAX-DOAS horizontal distribution of tropospheric NO2 VCDs as a function of time over the course of 28 June 2019 is presented in Fig. 17. This particular day is chosen because airborne measurements took place above the Brussels region (see Sect. 6.2). The horizontal NO2 profiles are plotted per azimuthal direction with the horizontal axis showing the time in UTC and the vertical axis the horizontal distance in kilometers. Because of the quality check on the retrieved NO2 horizontal profiles (see Sect. 5.3), some profiles were rejected (e.g., azimuthal direction equal to 262.5 and 265∘).

Figure 17Diurnal variation of the retrieved NO2 horizontal profiles per azimuthal direction as a function of time (UTC) for 28 June 2019.
During this day, maximum NO2 columns are mainly observed around 05:00 and 10:00 UTC, which correspond to 07:00 and noon local time. Early in the morning (05:00 UTC), high NO2 columns are expected to be observed because of the low MLH (MLH in the range of 300–600 m height) in combination with the morning rush-hour NO2 emissions. Around 10:00 UTC, the maximum NO2 columns are detected in the north (N), northeast (NE), and northwest (NW) direction (see Fig. 18). The same NO2 horizontal distribution is found when investigating the NO2 near-surface concentrations for this day (see Fig. S5). In the Brussels region, the main emission sources are located in the N and west (W) parts of the city and are linked to the motorway around Brussels (the so-called Ring), the Brussels city center, and the Drogenbos power plant (NW direction). Concerning the NO2 peaks, they are located at a distance of around 0 to 8 km from the measurement site. It can be seen from Fig. 18 that the Ring, the Brussels city center, and the Drogenbos power plant are located within these distances. As measured by the meteorological station on the BIRA-IASB rooftop, the wind was coming from the E direction during that day, resulting in the progressive displacement of the NO2 peak from the NNE to the W direction. On the contrary, the azimuthal directions pointing towards a large forested area (i.e., 62.5, 75, and 105∘), the Bois de la Cambre, detect considerably lower NO2 columns than the other directions.
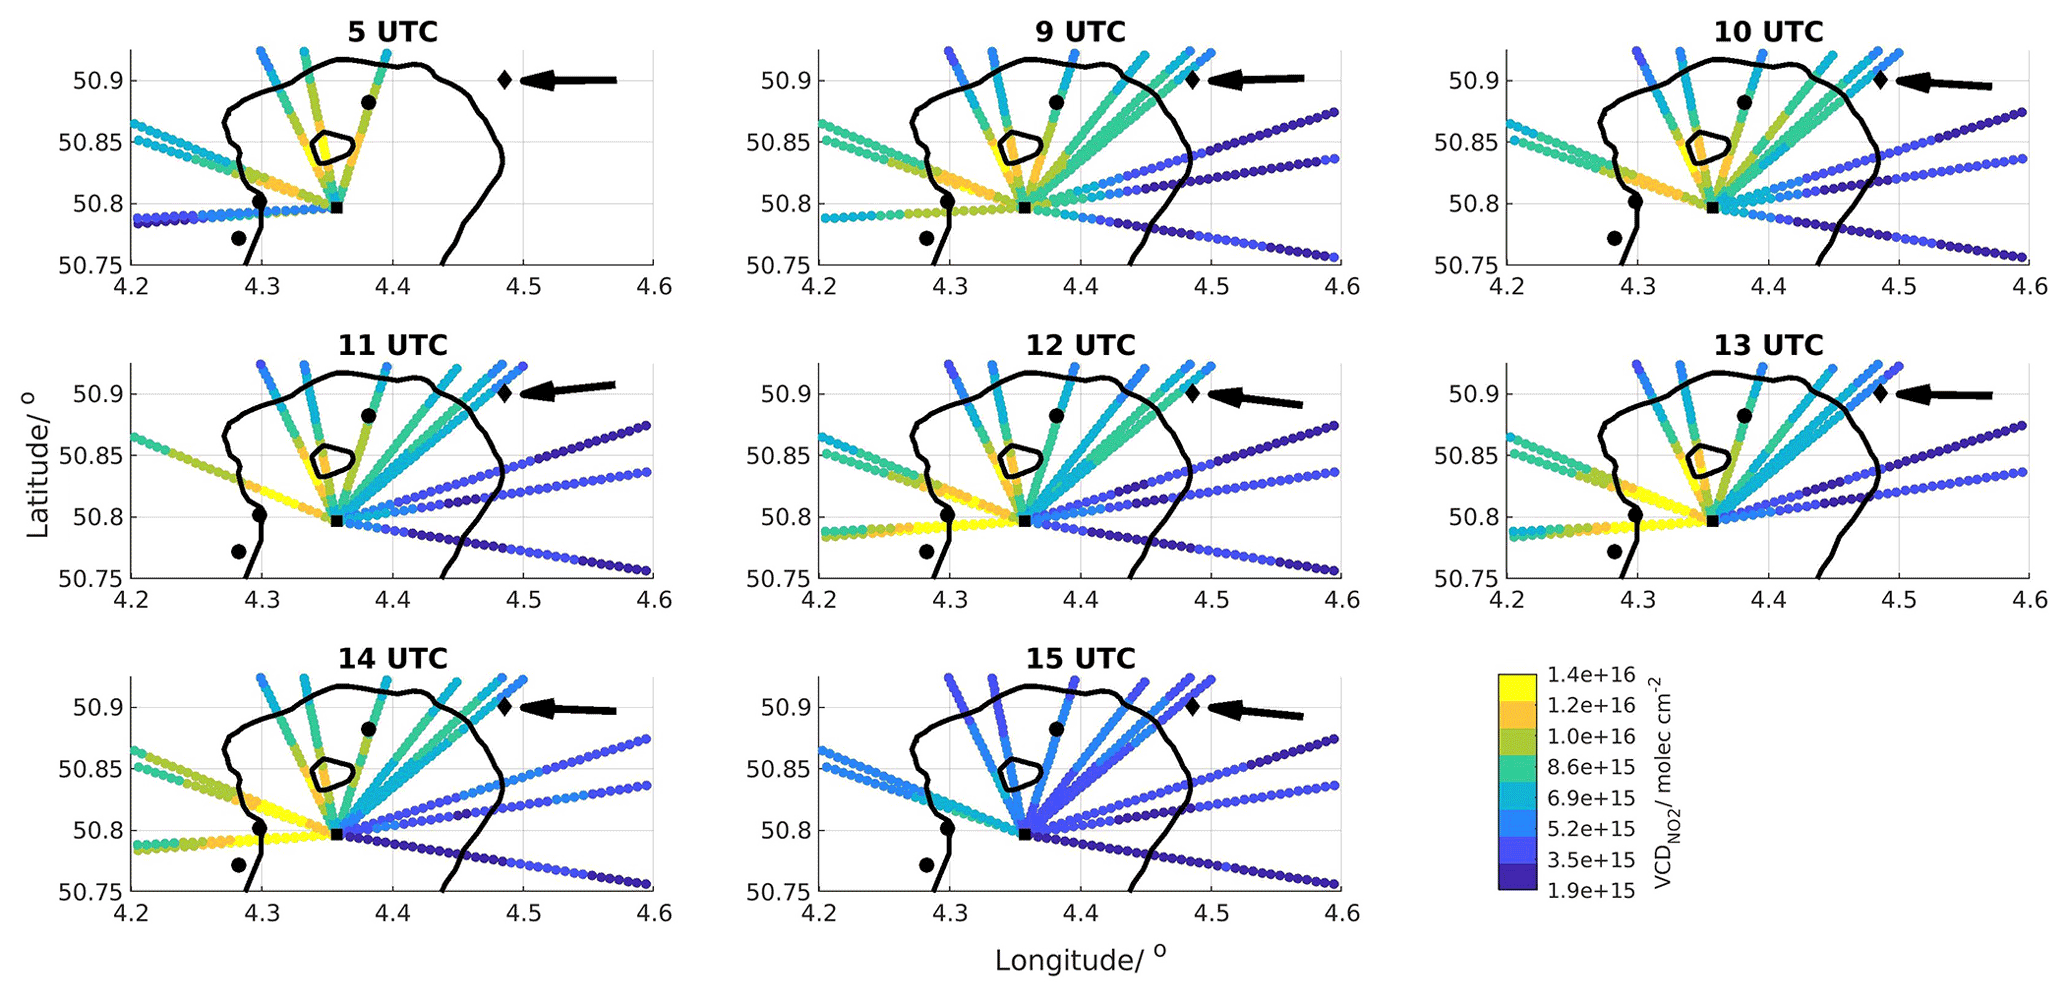
Figure 18Maps of hourly averaged NO2 horizontal profiles per azimuthal direction for 28 June 2019 corresponding to Fig. 17. The wind direction is shown with the black arrow. The black square shows the MAX-DOAS instrument location, the black polygon the national airport, the black dots the NO2 hotspots emitting more than 10 kg NOx h−1 (Emission Inventory of the Belgian Interregional Environment Agency, 2017; Frederik Tack, personal communication, 2019), and the black line the Brussels Ring road.
Maximum near-surface aerosol extinction coefficient values are observed all day long and detected in the N, NW, and NE direction (see Fig. S6). NO2 and aerosol peaks are co-located towards the N and NW direction.
6.2 MAX-DOAS horizontal NO2 distribution versus airborne, car-mobile DOAS, and TROPOMI: 28 June 2019 case study
The APEX tropospheric NO2 columns are compared to the tropospheric NO2 horizontal distribution as retrieved by applying our new mapping MAX-DOAS technique to the 28 June 2019 measurements. During the same day, TROPOMI pixels (OFFL 010302 product; see Table 1) selected over the Brussels region are compared to MAX-DOAS observations. During this day, the TROPOMI overpass time was at 12:19 UTC. MAX-DOAS horizontal profiles of tropospheric NO2 VCDs are selected around the TROPOMI overpass time (±1 h). The horizontal profile of MAX-DOAS NO2 VCDs for each horizontal line of sight has a horizontal sampling of 0.5 km (see Fig. 13). The MAX-DOAS NO2 VCDs for the horizontal segment crossing a TROPOMI pixel and located inside the pixel are averaged and compared to the corresponding TROPOMI NO2 VCD. It should be noted that the MAX-DOAS segments are weighted by their relative length inside each pixel. APEX observations located inside each TROPOMI pixel were used to assign one APEX NO2 VCD value per pixel. Maps of co-located TROPOMI, AEROMOBIL, averaged MAX-DOAS, and averaged APEX NO2 VCDs for 28 June 2019 are shown in Fig. 19. Two maps of APEX and MAX-DOAS observations are presented: one with APEX and MAX-DOAS in their initial resolution and one with spatially averaged APEX and MAX-DOAS observations in the area covered by a TROPOMI pixel. The NO2 plume as detected by APEX is covering the NW, N, and NE parts of the Brussels region. MAX-DOAS successfully detected the same NO2 plume in the NW and N but not in the NE direction. The correlation and agreement between APEX and MAX-DOAS observations are very good (R=0.89 and s=1.22).
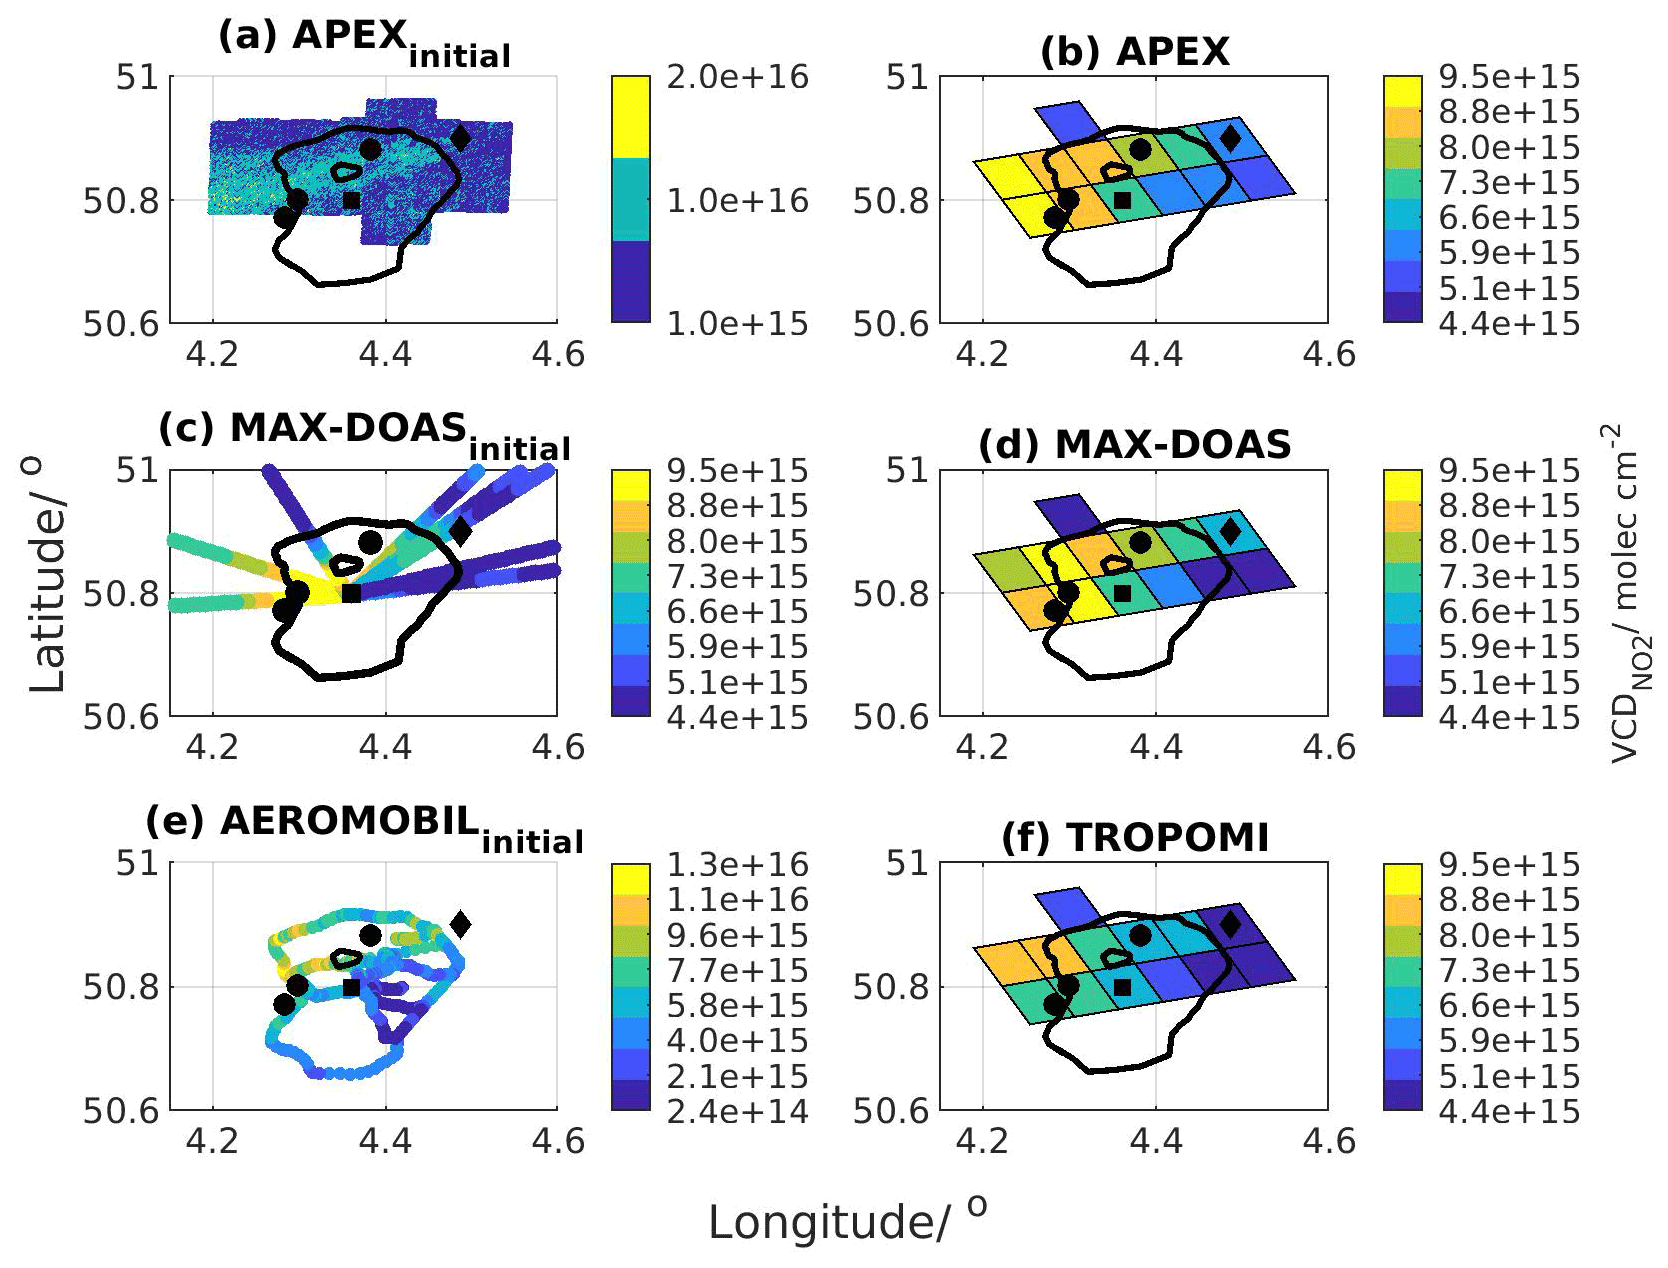
Figure 19(a) Tropospheric NO2 VCD as detected by the APEX instrument in its initial spatial resolution. Tropospheric NO2 VCD maps (TROPOMI pixels) as retrieved over Brussels on 28 June 2019 by (b) APEX, (d) MAX-DOAS, and (f) TROPOMI (overpass time at 12:19 UTC). Tropospheric NO2 VCD as retrieved by (c) MAX-DOAS and (e) AEROMOBIL (between 08:30 and 15:42 UTC) in its initial spatial resolution. The black square shows the MAX-DOAS instrument location, the black polygon the national airport, the black dots the NO2 hotspots emitting more than 10 kg NOx h−1 (Emission Inventory of the Belgian Interregional Environment Agency, 2017; Frederik Tack, personal communication, 2019), and the black line the Brussels Ring road.
During the S5PVAL-BE flight over Brussels, the AEROMOBIL was used to measure the spatial distribution of tropospheric NO2 columns, mainly over the Ring road of Brussels, with a measurement start time at 08:30 UTC and end time at 15:42 UTC. The AEROMOBIL NO2 VCDs, which are located closest in both time and space to each MAX-DOAS horizontal grid, are compared to the corresponding MAX-DOAS VCDs (see Fig. 19c and e). AEROMOBIL and MAX-DOAS agree perfectly on the location of maximum (i.e., NW direction) and minimum (i.e., SE direction) NO2 tropospheric VCDs (Fig. 19c and e). We can observe in Fig. 20b that the correlation coefficient is moderate (R equal to 0.79) and the slope value is equal to 0.59. The correlation plot between the two datasets reveals that AEROMOBIL gives higher NO2 tropospheric VCDs compared to MAX-DOAS ones. This finding could be partly explained by the fact that AEROMOBIL follows busy routes on which the NO2 tropospheric VCDs reach maximum values because of the contribution of NO2 production from vehicle engines via fossil fuel combustion.
During the TROPOMI overpass (i.e., 12:19 UTC) above the Brussels-Capital Region, dual-scan MAX-DOAS tropospheric NO2 columns are retrieved, as can be seen in Fig. 18. The correlation between TROPOMI and MAX-DOAS tropospheric NO2 columns during the day of the airborne measurements above Brussels is presented in Fig. 20c. Excellent agreement is obtained, with a correlation coefficient value equal to 0.88. The slope value is equal to 0.70. During that day, MAX-DOAS and TROPOMI are in good agreement but TROPOMI tends to underestimate the tropospheric NO2 columns. It should be noted that during that day, the range of observed NO2 VCDs is from 4.4×10¹⁵ to 9.5×10¹⁵ molec. cm−2, as retrieved by the MAX-DOAS observations.
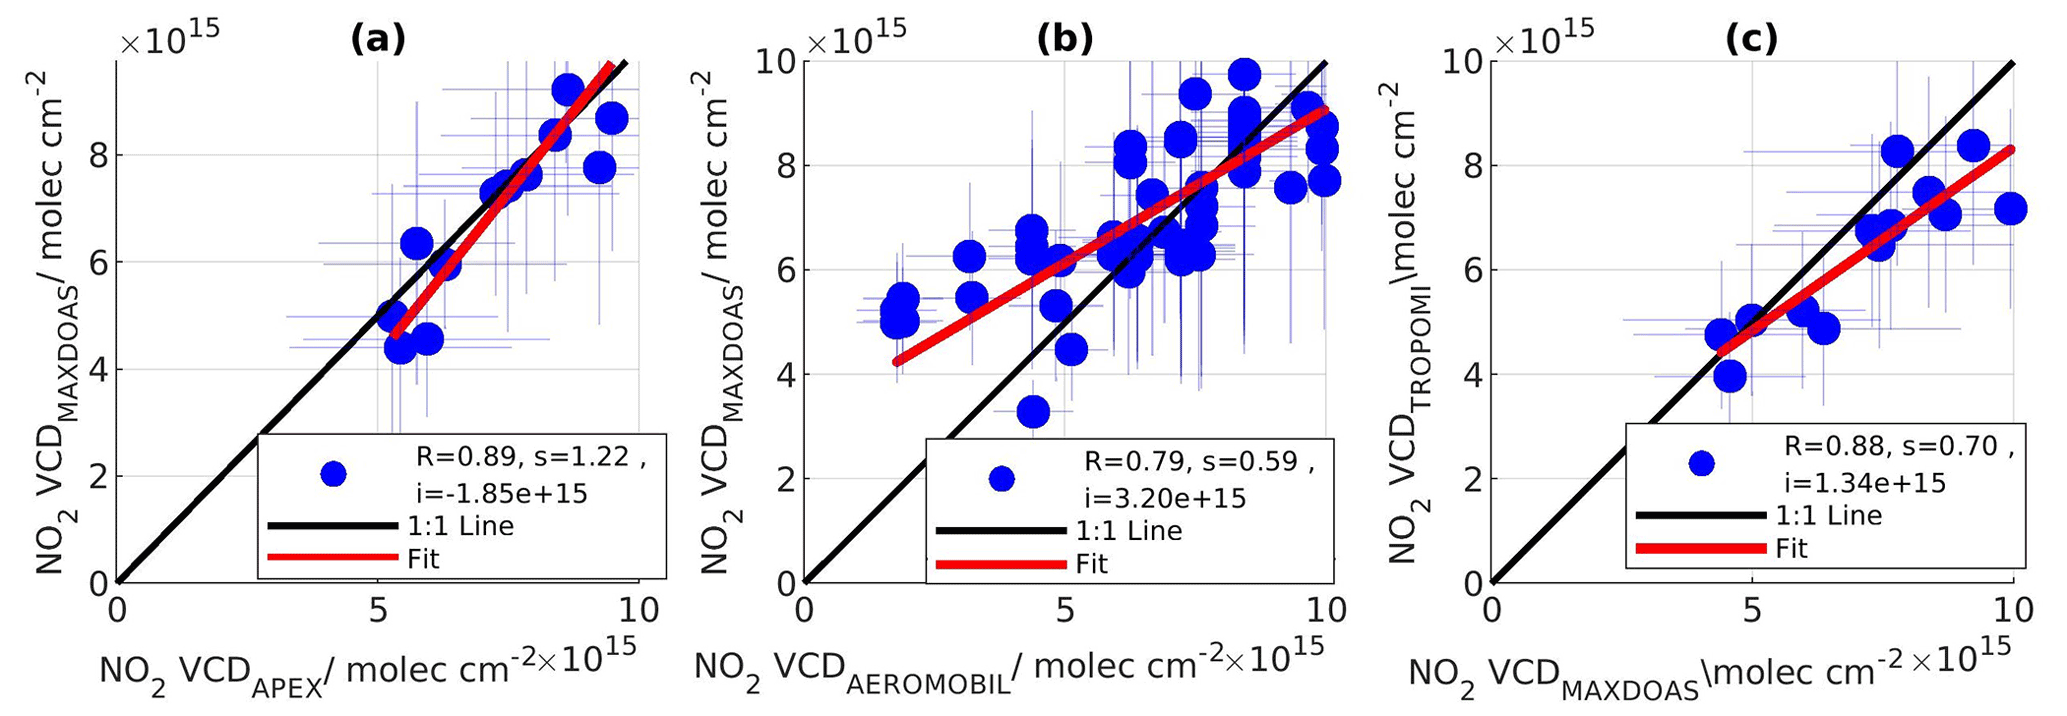
Figure 20Scatter plot between (a) the tropospheric NO2 columns derived by airborne measurements (APEX) and the MAX-DOAS observations, (b) the tropospheric NO2 columns derived by car-mobile DOAS measurements (AEROMOBIL) and the MAX-DOAS observations, and (c) the tropospheric NO2 columns derived by MAX-DOAS observations and the TROPOMI tropospheric NO2 columns over Brussels on 28 June 2019.
6.3 Comparison between MAX-DOAS horizontal NO2 distribution and TROPOMI observations
To compare the TROPOMI and MAX-DOAS tropospheric NO2 columns, a similar approach is used as in Sect. 6.2. Additionally, TROPOMI and MAX-DOAS tropospheric NO2 columns are compared on a seasonal basis, and seasonally averaged maps of those VCDs in the area covered by the TROPOMI pixels are created. To generate these maps, the ensemble of TROPOMI pixels recorded on 28 June 2019 is chosen as a reference and TROPOMI pixels that coincide with this reference grid are averaged. The daily horizontal profiles of MAX-DOAS NO2 columns are averaged on the daily TROPOMI grids and then the reference grid is used to create the seasonally averaged MAX-DOAS maps.
The seasonally and annually averaged maps of TROPOMI and MAX-DOAS NO2 VCDs are presented in Figs. 21 and 22. Only pixels including at least 20 comparison days are taken into account in the analysis. It is found that the locations of the NO2 peaks and dips show a reasonably high degree of similarity between TROPOMI and MAX-DOAS during all seasons, except summer. The NO2 peaks appear mainly above Brussels city center, the Drogenbos power plant (W direction), and the NW part of the Ring road, which are the main known emission sources, as mentioned earlier. These maps also indicate that the tropospheric NO2 column over the Brussels area has a clear seasonal cycle, with a maximum during winter.
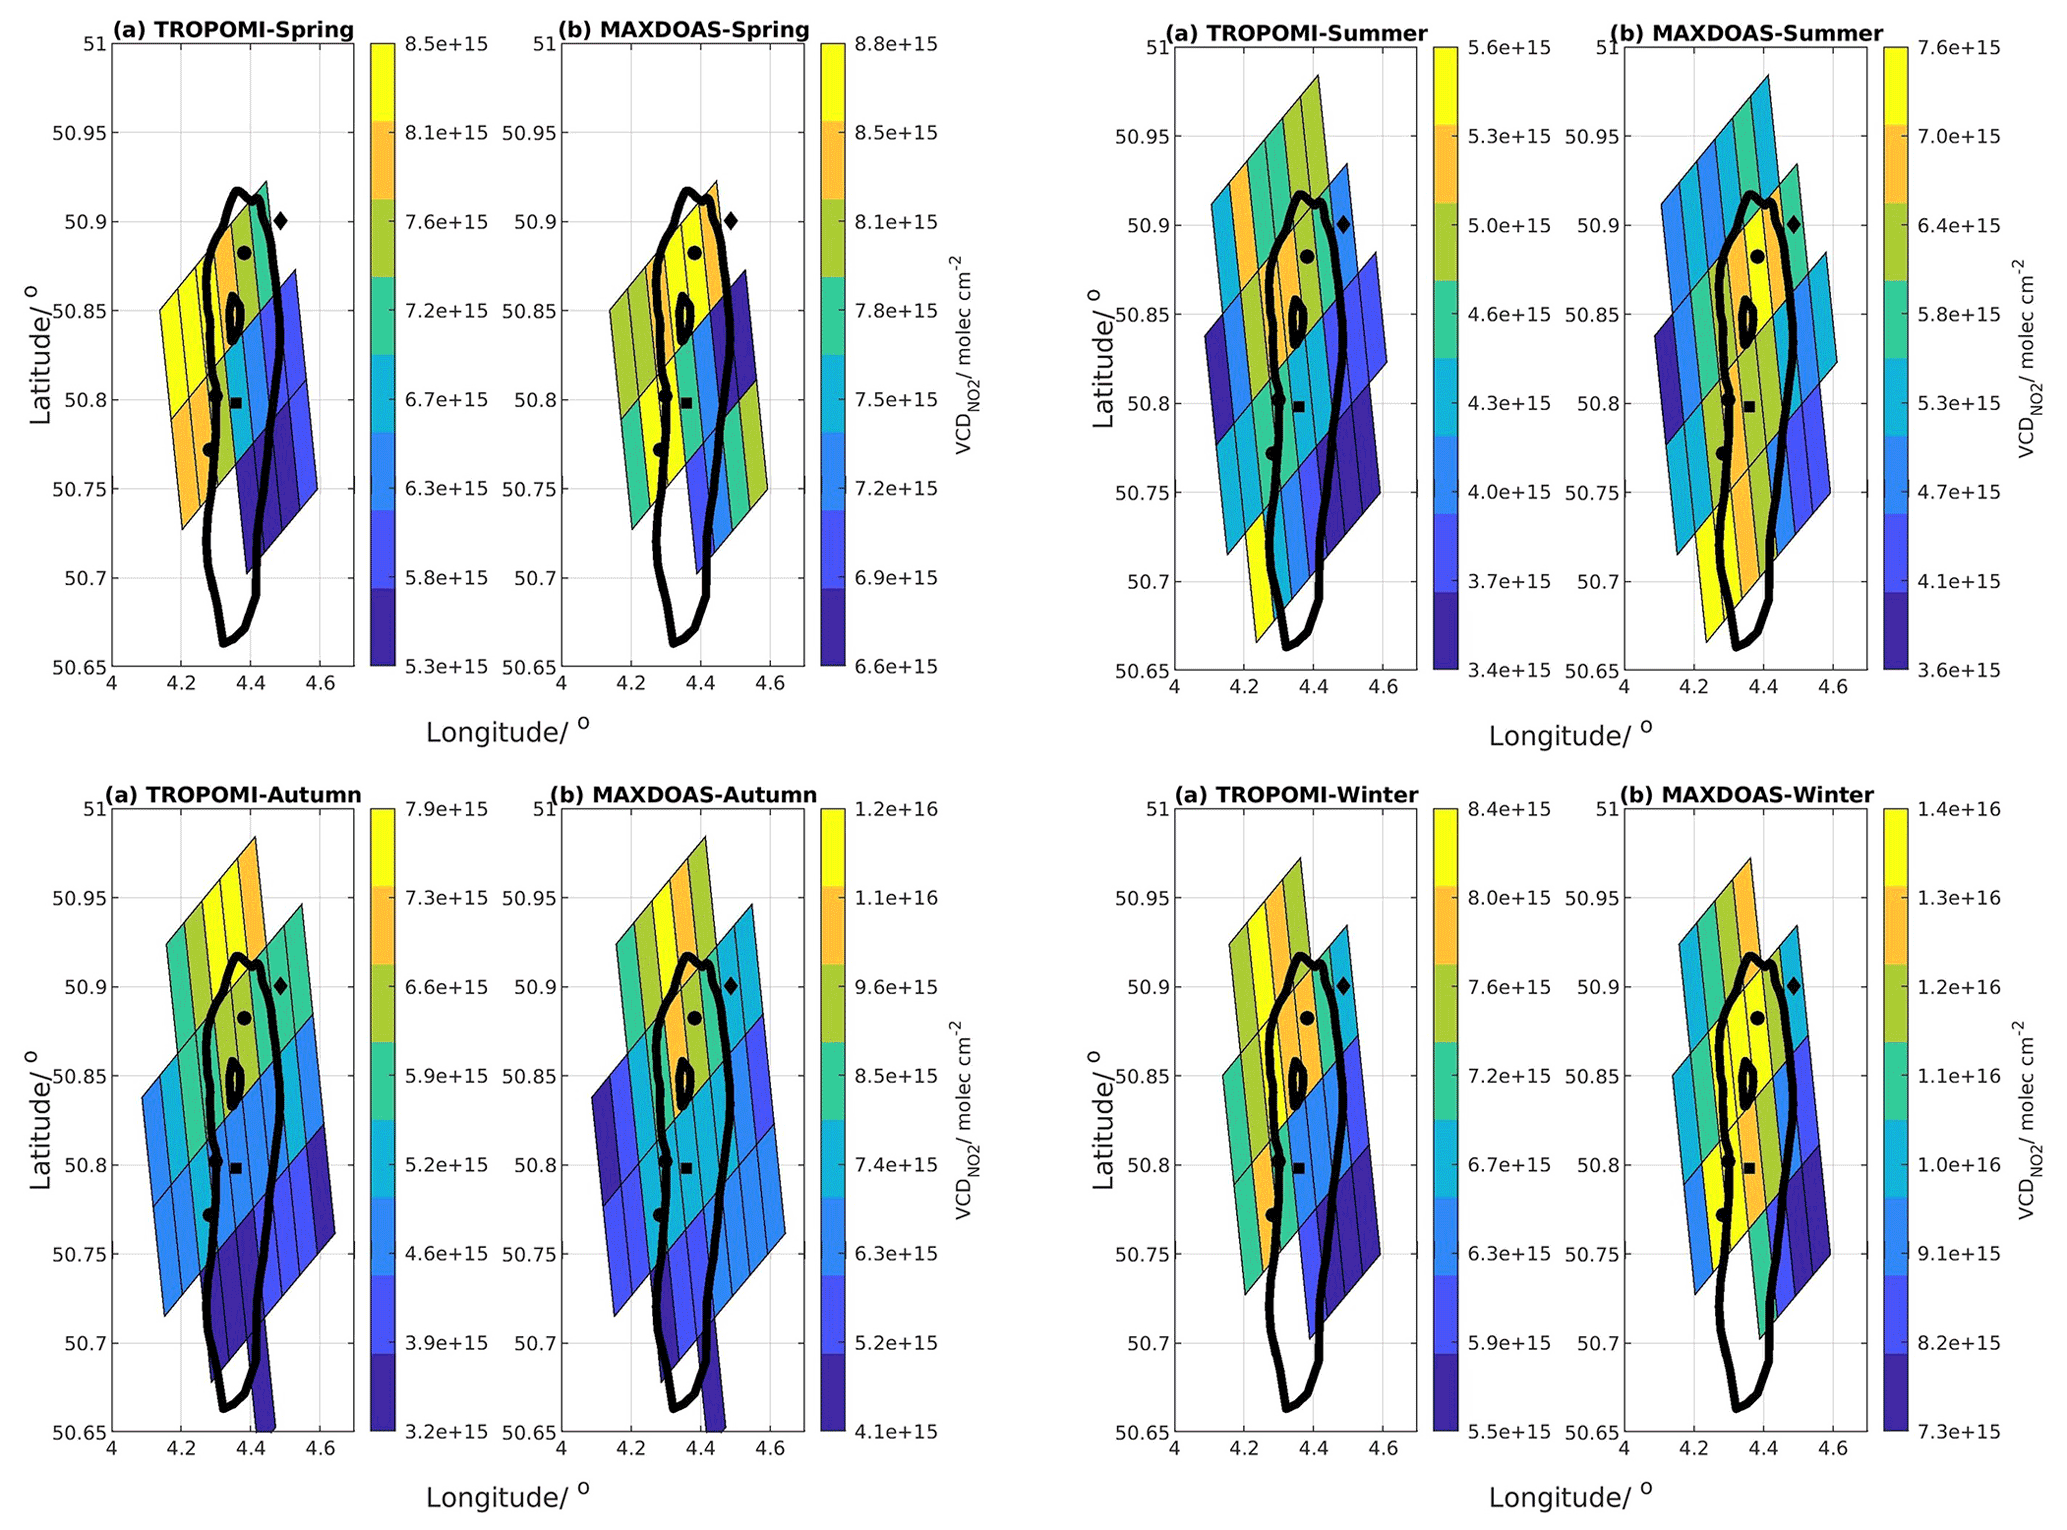
Figure 21Seasonal tropospheric NO2 VCD grids (TROPOMI grids) as retrieved over Brussels by TROPOMI and MAX-DOAS. The black square shows the MAX-DOAS position, the black polygon the national airport, the black dots the NO2 hotspots, and the black line the Brussels Ring motorway.
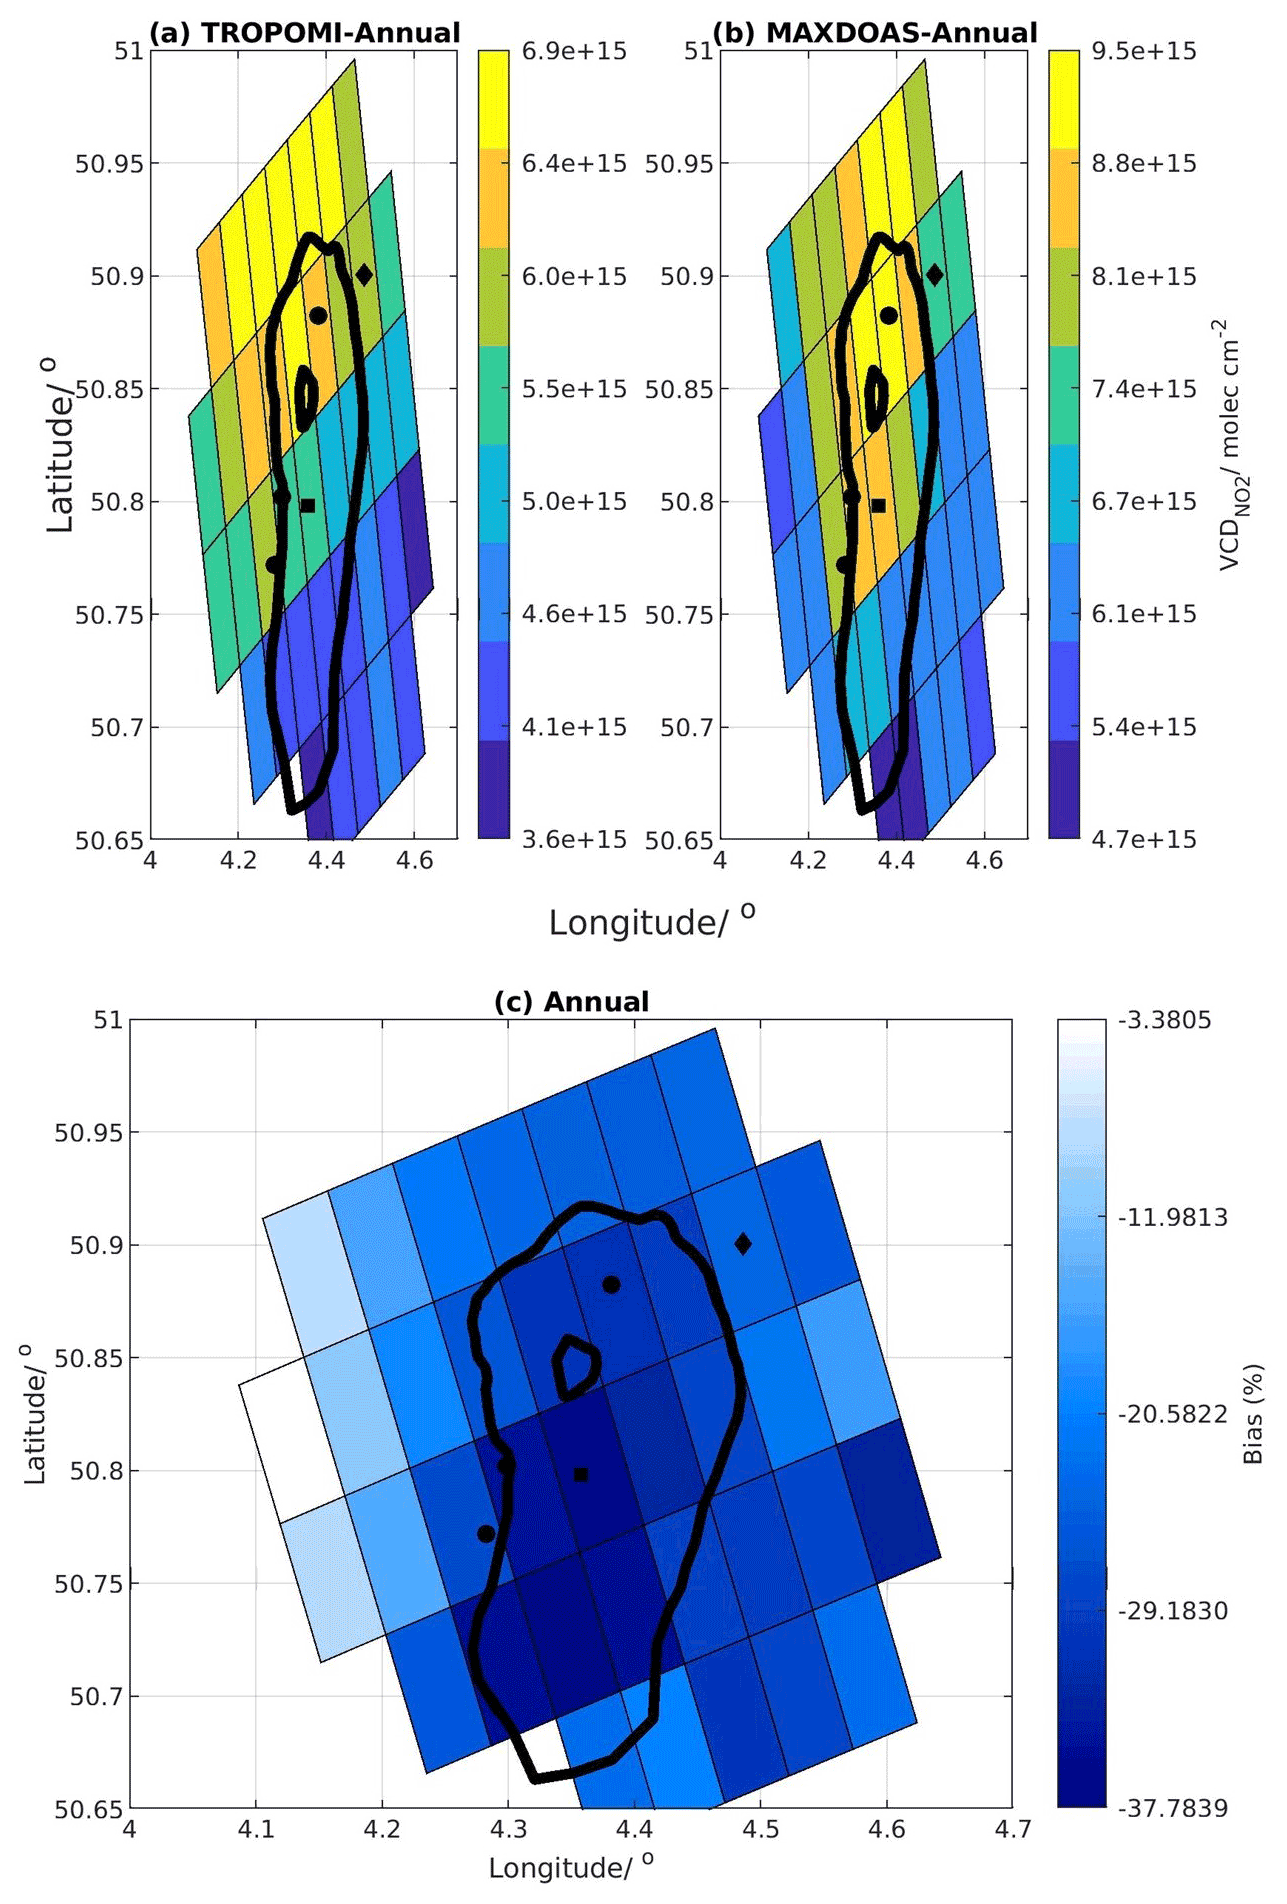
Figure 22Annual (e.g., based over the 2 years of observations) tropospheric NO2 VCD grids (TROPOMI grids) as retrieved over Brussels by (a) TROPOMI and (b) MAX-DOAS. (c) Annual bias between tropospheric NO2 VCD as observed by TROPOMI and MAX-DOAS (the negative values are shown with blue, zero with white, and positive with red). The black square shows the MAX-DOAS instrument location, the black polygon the national airport, the black dots the NO2 hotspots, and the black line the Brussels Ring road.
Figure 22c shows the annual relative biases (e.g., ) per pixel. It is found that negative biases (i.e., MAX-DOAS larger than TROPOMI), ranging from −3 % to −38 %, are found for all the pixels.
The seasonal correlation plots for April 2018-February 2020 are displayed in Fig. 23. The highest correlation is found during spring (R=0.70), while lower correlations are reported in autumn, summer, and winter, with correlation coefficient values of 0.67, 0.61, and 0.57, respectively. It should be noted that during spring (2018 and 2019), the number of comparison points is smaller than for the other seasons because TROPOMI data start from the end of April 2018. During spring, the slope value is equal to 0.88, while during winter, summer, and autumn, the slope values are smaller (0.67, 0.45, and 0.56, respectively). Similar findings have been reported in several studies (Verhoelst et al., 2021; Tack et al., 2021; Judd et al., 2020; Dimitropoulou et al., 2020; Ialongo et al., 2019). When seasonally averaged TROPOMI and MAX-DOAS pixels (the pixels shown in Fig. 21) are compared one by one (see seasonal, SEAS, in Fig. 23), both the correlation coefficient (R in the range of 0.62–0.85) and slope values (s in the range of 0.36–1.84) improve considerably for spring and autumn.
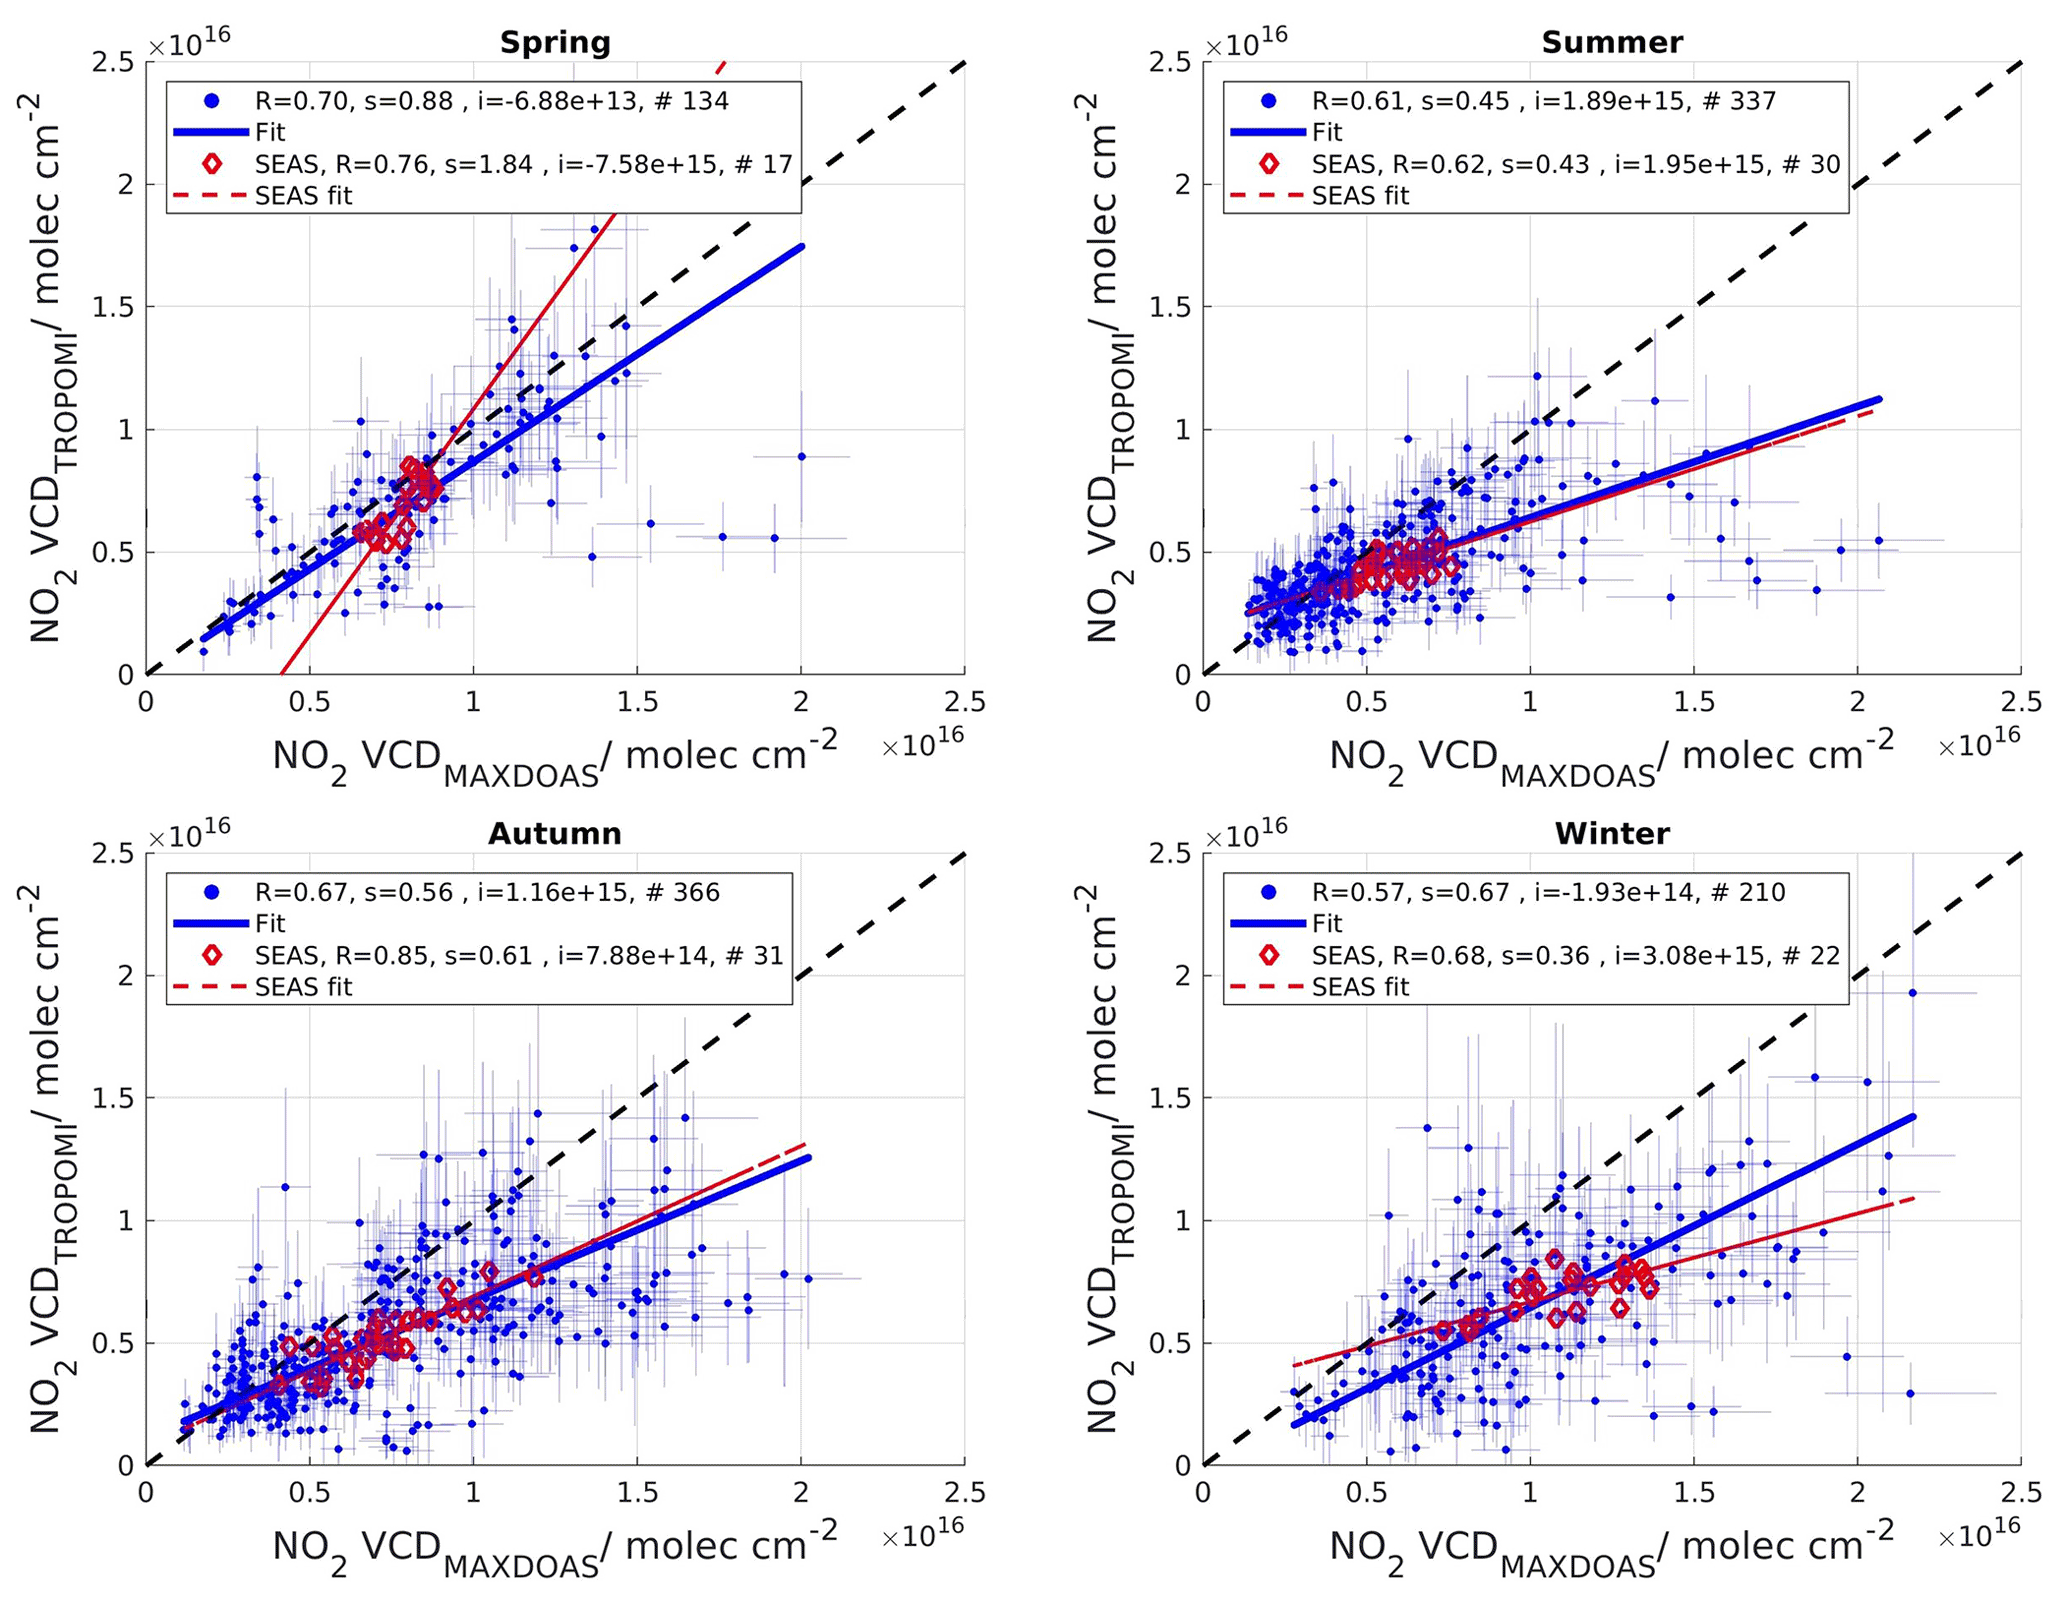
Figure 23Seasonal scatter plots of tropospheric NO2 columns derived from the dual-scan MAX-DOAS and TROPOMI measurements over Brussels. Blue line: regression analysis results when all the MAX-DOAS and TROPOMI pixels are included in the comparison. Red line: seasonal average analysis generated by the pixels in Fig. 21.
The seasonal regression analysis parameters between TROPOMI and dual-scan MAX-DOAS measurements derived in the present study are compared to the same parameters presented in Dimitropoulou et al. (2020); see Table 4. Both studies make use of the dual-scan MAX-DOAS instrument in Uccle. In addition to the different approach (i.e., the retrieval of NO2 horizontal profiles), in the present study, almost 2 years of measurements are used, while in Dimitropoulou et al. (2020), only 1 year is exploited for the TROPOMI validation. In Table 4, for the present study, only 1 year of measurements is used to have comparable time coverage for both studies. As presented in Table 4, the largest slope value is found in winter in both the present study and in Dimitropoulou et al. (2020). The season in which the highest correlation coefficient is obtained differs between the two studies (here in spring and in autumn in Dimitropoulou et al., 2020). The main advantage of the new mapping MAX-DOAS technique is the larger number of comparison points between TROPOMI and MAX-DOAS, leading to significantly more reliable statistics. In the present study, the deviation of the comparison points from the fitted regression line is increased, mainly because of the uncertainties in the horizontal inversion approach. The scatter increase is reflected in the correlation coefficient values, which are smaller for all seasons, except spring and winter. Regarding the slope value, it is larger during all seasons.
Table 4Summary of the regression analysis parameters (e.g., correlation coefficient, R, and slope, s) and the number of data points (N) derived in the present study during only 1 year of observations (i.e., number of pixels) and in Dimitropoulou et al. (2020). Please note that R (seasonal) and s (seasonal) correspond to SEAS in Fig. 23.

A total of 2 years (March 2018 to February 2020) of dual-scan MAX-DOAS measurements in Uccle (urban background site located in the south of the Brussels-Capital Region) were used to develop a new strategy for the retrieval of near-surface NO2 concentrations and aerosol extinction horizontal profiles. A full dual-scan measurement is composed of one vertical scan at a fixed azimuthal direction pointing towards the city center and horizontal scans in 10 azimuthal directions at a fixed low elevation angle (2∘).
The first step of this new retrieval strategy is to analyze measured radiance spectra in six different fitting windows. This provides O4 and NO2 dSCDs at the following six wavelengths: 343, 360, 380, 447, 477, and 530 nm. Then, information about the vertical extent of NO2 in the troposphere (MLH) is derived from profile retrievals in the main azimuthal direction performed using the OEM-based MMF algorithm. In the third step, a new parameterization technique is applied, with MLH, measured O4 dSCDs, and measurement geometry being used as input parameters to retrieve the horizontal sensitivity of NO2 and, consequently, the NO2 near-surface concentrations, VCDs, near-surface aerosol extinction, and AODs in all the azimuthal directions for the six different wavelengths. Compared to the method presented in Dimitropoulou et al. (2020), the new retrieval method offers the possibility of the direct determination of and near-surface aerosol extinction based on the measured O4 dSCDs.
The retrieved dual-scan NO2 near-surface concentrations and VCDs are verified via comparisons to the MMF NO2 vertical profiles derived in the main azimuthal directions and in three additional azimuthal directions. Good overall agreement is found for the two comparisons during the 2 years of measurements.
The dependence of the horizontal sensitivity on the wavelength is then used to develop a new OEM-based horizontal distribution inversion approach. Considering a horizontal box model, horizontal NO2 and aerosol extinction profiles are retrieved in an output horizontal grid of 500 m thickness starting from the instrument to each of the measurement maximum horizontal representative distances.
The daily variability of NO2 horizontal profiles in all the azimuthal directions provides information about the location of the NO2 hotspots in the Brussels-Capital Region and how the plumes are transported. Similarly, the NO2 horizontal profiles' seasonal variability over March 2018–February 2020 reveals that the NO2 hotspots are mainly found above the Brussels city center, the Drogenbos power plant, and the NW part of the Ring road during all seasons.
On 28 June 2019, airborne measurements (APEX) of NO2 were performed over Brussels. The MAX-DOAS NO2 VCD horizontal profiles are compared to APEX, car-mobile DOAS (i.e., AEROMOBIL), and TROPOMI measurements, and good overall agreement is found between the different datasets for this day.
In the last part of the study, MAX-DOAS retrievals are compared to TROPOMI tropospheric NO2 observations over the March 2018–February 2020 period. The comparison of seasonal maps shows good overall agreement between the two datasets as to the NO2 horizontal distribution over the Brussels area. Results also show that during all seasons, TROPOMI underestimates the MAX-DOAS tropospheric NO2 columns.
Overall, our investigation about the spatial sampling led to the following two important findings.
-
The dual-scan multi-wavelength approach allows a good identification of the main emissions sources in urban regions, in agreement with the spatial allocation of the main emission sources observed by APEX and TROPOMI.
-
The characterization of the NO2 concentration horizontal field using the dual scan multi-wavelength approach results in obtaining slope values closer to unity between TROPOMI and MAX-DOAS observations. The high spatial resolution of TROPOMI requires ground-based measurement that can provide information about the horizontal distribution of tropospheric NO2 columns in urban regions.
To conclude, our study presents a new horizontal distribution inversion approach for NO2 and aerosols developed by using dual-scan multi-wavelength MAX-DOAS measurements over an urban area. This approach provides a better characterization of the horizontal distribution of an important urban pollutant, NO2, which leads to improved agreement between satellite and MAX-DOAS measurements in moderate to highly polluted conditions. Based on our study, further modifications of the measurement mode aiming at a better sampling of the vertical and horizontal NO2 distribution could be implemented and investigated. For instance, performing vertical scans in several azimuthal directions throughout the day and/or horizontal scans in more than 10 azimuthal directions could further improve our knowledge about the tropospheric NO2 spatial variability in urban regions and therefore the satellite validation results in those conditions.
The datasets generated and analyzed in the present work are available from the corresponding author on request.
The supplement related to this article is available online at: https://doi.org/10.5194/amt-15-4503-2022-supplement.
ED undertook the development and validation of the dual-scan multi-wavelength MAX-DOAS retrieval strategy in Uccle, exploited the MAX-DOAS retrievals during 2 years, performed the validation of the TROPOMI tropospheric NO2 columns, and wrote the paper. FH supported and guided ED in the development of the dual-scan multi-wavelength MAX-DOAS retrieval strategy, provided general guidelines, and revised and edited the paper. MMF provided the MMF inversion algorithm and the RTM as well as supporting and guiding ED in the new OEM-based horizontal profile retrieval. FT provided the airborne APEX dataset and contributed to scientific discussions. GP provided the dataset of the TROPOMI tropospheric NO2 columns and supported ED in the TROPOMI validation approaches. AM provided the AEROMOBIL dataset and contributed to scientific discussions. CF and CH provided technical and software support for the MAX-DOAS instrument in Uccle. CF developed the QDOAS software and guided ED in the DOAS analysis. FF provided the RIO model dataset. MVR supervised the present work, provided general guidelines and valuable comments during the whole process of the paper preparation, and revised and edited the paper. All authors reviewed, discussed, and commented on the paper.
At least one of the (co-)authors is a member of the editorial board of Atmospheric Measurement Techniques. The peer-review process was guided by an independent editor, and the authors also have no other competing interests to declare.
Publisher's note: Copernicus Publications remains neutral with regard to jurisdictional claims in published maps and institutional affiliations.
We gratefully acknowledge the Belgian Federal Science Policy Office (BELSPO). The authors would like to thank the AERONET team for providing valuable data.
This paper was edited by Thomas von Clarmann and reviewed by three anonymous referees.
Aliwell, S. R., Van Roozendael, M., Johnston, P. V., Richter, A., Wagner, T., Arlander, D. W., Burrows, J. P., Fish, D. J., Jones, R. L., Tørnkvist, K. K., and Lambert, J. C.: Analysis for BrO in zenith-sky spectra: An intercomparison exercise for analysis improvement, J. Geophys. Res., 107, ACH 10-1–ACH 10-20, 2002.
Barret, B., De Maziere, M., and Demoulin, P.: Retrieval and characterisation of ozone profiles from solar infrared spectra at the Jungfraujoch, J. Geophys. Res., 107, 4788, https://doi.org/10.1029/2001JD001298, 2002.
Beirle, S., Platt, U., Wenig, M., and Wagner, T.: Weekly cycle of NO2 by GOME measurements: a signature of anthropogenic sources, Atmos. Chem. Phys., 3, 2225–2232, https://doi.org/10.5194/acp-3-2225-2003, 2003.
Bösch, T., Rozanov, V., Richter, A., Peters, E., Rozanov, A., Wittrock, F., Merlaud, A., Lampel, J., Schmitt, S., de Haij, M., Berkhout, S., Henzing, B., Apituley, A., den Hoed, M., Vonk, J., Tiefengraber, M., Müller, M., and Burrows, J. P.: BOREAS – a new MAX-DOAS profile retrieval algorithm for aerosols and trace gases, Atmos. Meas. Tech., 11, 6833–6859, https://doi.org/10.5194/amt-11-6833-2018, 2018.
Burrows, J. P., Weber, M., Buchwitz, M., Rosanov, V. V., Ladstatter, A., Weissenmayer, A., Richter, A., DeBeek, R., Hoogen, R., Bramstedt, K., and Eichmann, K. U.: The Global Ozone Monitoring Experiment (GOME): Mission concept and first scientific results, J. Atmos. Sci., 56, 151–175, 1999.
Chan, K. L., Wiegner, M., van Geffen, J., De Smedt, I., Alberti, C., Cheng, Z., Ye, S., and Wenig, M.: MAX-DOAS measurements of tropospheric NO2 and HCHO in Munich and the comparison to OMI and TROPOMI satellite observations, Atmos. Meas. Tech., 13, 4499–4520, https://doi.org/10.5194/amt-13-4499-2020, 2020.
Chen, T. M., Kuschner, W. G., Gokhale, J., and Shofer, S.: Outdoor air pollution: nitrogen dioxide, sulfur dioxide, and carbon monoxide health effects, Am. J. Med. Sci., 333, 249–256, 2007.
Clémer, K., Van Roozendael, M., Fayt, C., Hendrick, F., Hermans, C., Pinardi, G., Spurr, R., Wang, P., and De Mazière, M.: Multiple wavelength retrieval of tropospheric aerosol optical properties from MAXDOAS measurements in Beijing, Atmos. Meas. Tech., 3, 863–878, https://doi.org/10.5194/amt-3-863-2010, 2010.
Compernolle, S., Argyrouli, A., Lutz, R., Sneep, M., Lambert, J.-C., Fjæraa, A. M., Hubert, D., Keppens, A., Loyola, D., O'Connor, E., Romahn, F., Stammes, P., Verhoelst, T., and Wang, P.: Validation of the Sentinel-5 Precursor TROPOMI cloud data with Cloudnet, Aura OMI O2–O2, MODIS, and Suomi-NPP VIIRS, Atmos. Meas. Tech., 14, 2451–2476, https://doi.org/10.5194/amt-14-2451-2021, 2021.
Dimitropoulou, E., Hendrick, F., Pinardi, G., Friedrich, M. M., Merlaud, A., Tack, F., De Longueville, H., Fayt, C., Hermans, C., Laffineur, Q., Fierens, F., and Van Roozendael, M.: Validation of TROPOMI tropospheric NO2 columns using dual-scan multi-axis differential optical absorption spectroscopy (MAX-DOAS) measurements in Uccle, Brussels, Atmos. Meas. Tech., 13, 5165–5191, https://doi.org/10.5194/amt-13-5165-2020, 2020.
Douros, J., Eskes, H., van Geffen, J., Boersma, K. F., Compernolle, S., Pinardi, G., Blechschmidt, A.-M., Peuch, V.-H., Colette, A., and Veefkind, P.: Comparing Sentinel-5P TROPOMI NO2 column observations with the CAMS-regional air quality ensemble, EGUsphere [preprint], https://doi.org/10.5194/egusphere-2022-365, 2022.
Eskes, H. J. and Eichmann, K. U.: S5P MPC Product Readme Nitrogen Dioxide, Report S5P-MPC-KNMI PRF-NO2, version 02.04.00, 20 July 2022, ESA,https://sentinel.esa.int/documents/247904/3541451/Sentinel-5P-Nitrogen-Dioxide-Level-2-Product-Readme-File, last access: 5 August 2022.
Fayt, C., Danckaert, T., and Van Roozendael, M.: QDOAS software user manual, BIRA-IASB, Uccle, Belgium, http://uv-vis.aeronomie.be/software/QDOAS/QDOAS_manual.pdf (last access: 11 June 2022), 2017.
Finkenzeller, H. and Volkamer, R.: O2–O2 CIA in the gas phase: Cross-section of weak bands, and continuum absorption between 297–500 nm, J. Quant. Spectrosc. Ra., 279, 108063, https://doi.org/10.1016/j.jqsrt.2021.108063, 2022.
Friedrich, M. M., Rivera, C., Stremme, W., Ojeda, Z., Arellano, J., Bezanilla, A., García-Reynoso, J. A., and Grutter, M.: NO2 vertical profiles and column densities from MAX-DOAS measurements in Mexico City, Atmos. Meas. Tech., 12, 2545–2565, https://doi.org/10.5194/amt-12-2545-2019, 2019.
Gielen, C., Van Roozendael, M., Hendrick, F., Pinardi, G., Vlemmix, T., De Bock, V., De Backer, H., Fayt, C., Hermans, C., Gillotay, D., and Wang, P.: A simple and versatile cloud-screening method for MAX-DOAS retrievals, Atmos. Meas. Tech., 7, 3509–3527, https://doi.org/10.5194/amt-7-3509-2014, 2014.
Hendrick, F., Müller, J.-F., Clémer, K., Wang, P., De Mazière, M., Fayt, C., Gielen, C., Hermans, C., Ma, J. Z., Pinardi, G., Stavrakou, T., Vlemmix, T., and Van Roozendael, M.: Four years of ground-based MAX-DOAS observations of HONO and NO2 in the Beijing area, Atmos. Chem. Phys., 14, 765–781, https://doi.org/10.5194/acp-14-765-2014, 2014.
Hönninger, G., von Friedeburg, C., and Platt, U.: Multi axis differential optical absorption spectroscopy (MAX-DOAS), Atmos. Chem. Phys., 4, 231–254, https://doi.org/10.5194/acp-4-231-2004, 2004.
Hooyberghs, J., Mensink, C., Dumont, G., and Fierens, F.: Spatial interpolation of ambient ozone concentrations from sparse monitoring points in Belgium, J. Environ. Monitor., 8, 1129–1135, 2006.
Ialongo, I., Virta, H., Eskes, H., Hovila, J., and Douros, J.: Comparison of TROPOMI/Sentinel-5 Precursor NO2 observations with ground-based measurements in Helsinki, Atmos. Meas. Tech., 13, 205–218, https://doi.org/10.5194/amt-13-205-2020, 2020.
Irie, H., Takashima, H., Kanaya, Y., Boersma, K. F., Gast, L., Wittrock, F., Brunner, D., Zhou, Y., and Van Roozendael, M.: Eight-component retrievals from ground-based MAX-DOAS observations, Atmos. Meas. Tech., 4, 1027–1044, https://doi.org/10.5194/amt-4-1027-2011, 2011.
Irie, H., Boersma, K. F., Kanaya, Y., Takashima, H., Pan, X., and Wang, Z. F.: Quantitative bias estimates for tropospheric NO2 columns retrieved from SCIAMACHY, OMI, and GOME-2 using a common standard for East Asia, Atmos. Meas. Tech., 5, 2403–2411, https://doi.org/10.5194/amt-5-2403-2012, 2012.
Janssen, S., Dumont, G., Fierens, F., and Mensink, C.: Spatial interpolation of air pollution measurements using CORINE land cover data, Atmos. Environ., 42, 4884–4903, 2008.
Judd, L. M., Al-Saadi, J. A., Szykman, J. J., Valin, L. C., Janz, S. J., Kowalewski, M. G., Eskes, H. J., Veefkind, J. P., Cede, A., Mueller, M., Gebetsberger, M., Swap, R., Pierce, R. B., Nowlan, C. R., Abad, G. G., Nehrir, A., and Williams, D.: Evaluating Sentinel-5P TROPOMI tropospheric NO2 column densities with airborne and Pandora spectrometers near New York City and Long Island Sound, Atmos. Meas. Tech., 13, 6113–6140, https://doi.org/10.5194/amt-13-6113-2020, 2020.
Khomenko, S., Cirach, M., Pereira-Barboza, E., Mueller, N., Barrera-Gómez, J., Rojas-Rueda, D., de Hoogh, K., Hoek, G., and Nieuwenhuijsen, M.: Premature mortality due to air pollution in European cities: a health impact assessment, The Lancet Planetary Health, 5, e121–e134, 2021.
Kreher, K., Van Roozendael, M., Hendrick, F., Apituley, A., Dimitropoulou, E., Frieß, U., Richter, A., Wagner, T., Lampel, J., Abuhassan, N., Ang, L., Anguas, M., Bais, A., Benavent, N., Bösch, T., Bognar, K., Borovski, A., Bruchkouski, I., Cede, A., Chan, K. L., Donner, S., Drosoglou, T., Fayt, C., Finkenzeller, H., Garcia-Nieto, D., Gielen, C., Gómez-Martín, L., Hao, N., Henzing, B., Herman, J. R., Hermans, C., Hoque, S., Irie, H., Jin, J., Johnston, P., Khayyam Butt, J., Khokhar, F., Koenig, T. K., Kuhn, J., Kumar, V., Liu, C., Ma, J., Merlaud, A., Mishra, A. K., Müller, M., Navarro-Comas, M., Ostendorf, M., Pazmino, A., Peters, E., Pinardi, G., Pinharanda, M., Piters, A., Platt, U., Postylyakov, O., Prados-Roman, C., Puentedura, O., Querel, R., Saiz-Lopez, A., Schönhardt, A., Schreier, S. F., Seyler, A., Sinha, V., Spinei, E., Strong, K., Tack, F., Tian, X., Tiefengraber, M., Tirpitz, J.-L., van Gent, J., Volkamer, R., Vrekoussis, M., Wang, S., Wang, Z., Wenig, M., Wittrock, F., Xie, P. H., Xu, J., Yela, M., Zhang, C., and Zhao, X.: Intercomparison of NO2, O4, O3 and HCHO slant column measurements by MAX-DOAS and zenith-sky UV–visible spectrometers during CINDI-2, Atmos. Meas. Tech., 13, 2169–2208, https://doi.org/10.5194/amt-13-2169-2020, 2020.
Kurucz, R. L., Furenlid, I., Brault, J., and Testerman, L.: Solar flux atlas from 296 to 1300 nm, National Solar Observatory, Sunspot, New Mexico, USA, 1984.
Merlaud, A.: Development and use of compact instruments for tropospheric investigations based on optical spectroscopy from mobile platforms, Presses Universitaires de Louvain, ISBN 978-2875581280, 2013.
Merlaud, A., Van Roozendael, M., Theys, N., Fayt, C., Hermans, C., Quennehen, B., Schwarzenboeck, A., Ancellet, G., Pommier, M., Pelon, J., Burkhart, J., Stohl, A., and De Mazière, M.: Airborne DOAS measurements in Arctic: vertical distributions of aerosol extinction coefficient and NO2 concentration, Atmos. Chem. Phys., 11, 9219–9236, https://doi.org/10.5194/acp-11-9219-2011, 2011.
Pinardi, G., Hendrick, F., Clémer, K., Lambert, J. C., Bai, J., and Van Roozendael, M.: On the use of the MAX-DOAS technique for the validation of tropospheric NO2 column measurements from satellite, Proc. Eumetsat Conf., ISBN 978-92-9110-082-8, 2008.
Pinardi, G., Van Roozendael, M., Abuhassan, N., Adams, C., Cede, A., Clémer, K., Fayt, C., Frieß, U., Gil, M., Herman, J., Hermans, C., Hendrick, F., Irie, H., Merlaud, A., Navarro Comas, M., Peters, E., Piters, A. J. M., Puentedura, O., Richter, A., Schönhardt, A., Shaiganfar, R., Spinei, E., Strong, K., Takashima, H., Vrekoussis, M., Wagner, T., Wittrock, F., and Yilmaz, S.: MAX-DOAS formaldehyde slant column measurements during CINDI: intercomparison and analysis improvement, Atmos. Meas. Tech., 6, 167–185, https://doi.org/10.5194/amt-6-167-2013, 2013.
Puķīte, J., Kühl, S., Deutschmann, T., Platt, U., and Wagner, T.: Extending differential optical absorption spectroscopy for limb measurements in the UV, Atmos. Meas. Tech., 3, 631–653, https://doi.org/10.5194/amt-3-631-2010, 2010.
Quaas, J., Boucher, O., Bellouin, N., and Kinne, S.: Satellite-based estimate of the direct and indirect aerosol climate forcing, J. Geophys. Res., 113, D05204, https://doi.org/10.1029/2007JD008962, 2008.
Rodgers, C. D.: Inverse Methods for Atmospheric Sounding: Theory and Practice, Series on Atmospheric, Oceanic and Planetary Physics, Vol. 2, World Scientific Publishing Co, 256 pp., https://doi.org/10.1142/3171, 2000.
Schreier, S. F., Bösch, T., Richter, A., Lange, K., Revesz, M., Weihs, P., Vrekoussis, M., and Lotteraner, C.: Evaluation of UV–visible MAX-DOAS aerosol profiling products by comparison with ceilometer, sun photometer, and in situ observations in Vienna, Austria, Atmos. Meas. Tech., 14, 5299–5318, https://doi.org/10.5194/amt-14-5299-2021, 2021.
Seinfeld, J. H. and Pandis, S. N.: Atmospheric Chemistry and Physics: From Air Pollution to Climate Change, John Wiley & Sons, Inc., ISBN 978-1-118-94740-1, 2016.
Sinreich, R., Volkamer, R., Filsinger, F., Frieß, U., Kern, C., Platt, U., Sebastián, O., and Wagner, T.: MAX-DOAS detection of glyoxal during ICARTT 2004, Atmos. Chem. Phys., 7, 1293–1303, https://doi.org/10.5194/acp-7-1293-2007, 2007.
Sinreich, R., Merten, A., Molina, L., and Volkamer, R.: Parameterizing radiative transfer to convert MAX-DOAS dSCDs into near-surface box-averaged mixing ratios, Atmos. Meas. Tech., 6, 1521–1532, https://doi.org/10.5194/amt-6-1521-2013, 2013.
Spurr, R. J.: VLIDORT: A linearized pseudo-spherical vector discrete ordinate radiative transfer code for forward model and retrieval studies in multilayer multiple scattering media, J. Quant. Spectrosc. Ra., 102, 316–342, 2006.
Tack, F., Merlaud, A., Iordache, M.-D., Danckaert, T., Yu, H., Fayt, C., Meuleman, K., Deutsch, F., Fierens, F., and Van Roozendael, M.: High-resolution mapping of the NO2 spatial distribution over Belgian urban areas based on airborne APEX remote sensing, Atmos. Meas. Tech., 10, 1665–1688, https://doi.org/10.5194/amt-10-1665-2017, 2017.
Tack, F., Merlaud, A., Meier, A. C., Vlemmix, T., Ruhtz, T., Iordache, M.-D., Ge, X., van der Wal, L., Schuettemeyer, D., Ardelean, M., Calcan, A., Constantin, D., Schönhardt, A., Meuleman, K., Richter, A., and Van Roozendael, M.: Intercomparison of four airborne imaging DOAS systems for tropospheric NO2 mapping – the AROMAPEX campaign, Atmos. Meas. Tech., 12, 211–236, https://doi.org/10.5194/amt-12-211-2019, 2019.
Tack, F., Merlaud, A., Iordache, M.-D., Pinardi, G., Dimitropoulou, E., Eskes, H., Bomans, B., Veefkind, P., and Van Roozendael, M.: Assessment of the TROPOMI tropospheric NO2 product based on airborne APEX observations, Atmos. Meas. Tech., 14, 615–646, https://doi.org/10.5194/amt-14-615-2021, 2021.
Thalman, R. and Volkamer, R.: Temperature dependent absorption cross-sections of O2–O2 collision pairs between 340 and 630 nm and at atmospherically relevant pressure, Phys. Chem. Chem. Phys., 15, 15371–15381, https://doi.org/10.1039/C3CP50968K, 2013.
Tirpitz, J.-L., Frieß, U., Hendrick, F., Alberti, C., Allaart, M., Apituley, A., Bais, A., Beirle, S., Berkhout, S., Bognar, K., Bösch, T., Bruchkouski, I., Cede, A., Chan, K. L., den Hoed, M., Donner, S., Drosoglou, T., Fayt, C., Friedrich, M. M., Frumau, A., Gast, L., Gielen, C., Gomez-Martín, L., Hao, N., Hensen, A., Henzing, B., Hermans, C., Jin, J., Kreher, K., Kuhn, J., Lampel, J., Li, A., Liu, C., Liu, H., Ma, J., Merlaud, A., Peters, E., Pinardi, G., Piters, A., Platt, U., Puentedura, O., Richter, A., Schmitt, S., Spinei, E., Stein Zweers, D., Strong, K., Swart, D., Tack, F., Tiefengraber, M., van der Hoff, R., van Roozendael, M., Vlemmix, T., Vonk, J., Wagner, T., Wang, Y., Wang, Z., Wenig, M., Wiegner, M., Wittrock, F., Xie, P., Xing, C., Xu, J., Yela, M., Zhang, C., and Zhao, X.: Intercomparison of MAX-DOAS vertical profile retrieval algorithms: studies on field data from the CINDI-2 campaign, Atmos. Meas. Tech., 14, 1–35, https://doi.org/10.5194/amt-14-1-2021, 2021.
van Geffen, J. H. G. M., Eskes, H. J., Boersma, K. F., and Veefkind, J. P.: TROPOMI ATBD of the total and tropospheric NO2 data products, Report S5P-KNMI-L2-0005-RP, version 1.4.0, released 6 February 2019, KNMI, De Bilt, the Netherlands, https://sentinel.esa.int/documents/247904/2476257/Sentinel-5P-TROPOMI-ATBD-NO2-data-products.pdf/7a4fdde7-516e-48e7-bf44-da60c62b1e4d?version=1.4 (last access: 5 August 2022), 2019.
van Geffen, J., Eskes, H., Compernolle, S., Pinardi, G., Verhoelst, T., Lambert, J.-C., Sneep, M., ter Linden, M., Ludewig, A., Boersma, K. F., and Veefkind, J. P.: Sentinel-5P TROPOMI NO2 retrieval: impact of version v2.2 improvements and comparisons with OMI and ground-based data, Atmos. Meas. Tech., 15, 2037–2060, https://doi.org/10.5194/amt-15-2037-2022, 2022.
Veefkind, J. P., Boersma, K. F., Wang, J., Kurosu, T. P., Krotkov, N., Chance, K., and Levelt, P. F.: Global satellite analysis of the relation between aerosols and short-lived trace gases, Atmos. Chem. Phys., 11, 1255–1267, https://doi.org/10.5194/acp-11-1255-2011, 2011.
Verhoelst, T., Compernolle, S., Pinardi, G., Lambert, J.-C., Eskes, H. J., Eichmann, K.-U., Fjæraa, A. M., Granville, J., Niemeijer, S., Cede, A., Tiefengraber, M., Hendrick, F., Pazmiño, A., Bais, A., Bazureau, A., Boersma, K. F., Bognar, K., Dehn, A., Donner, S., Elokhov, A., Gebetsberger, M., Goutail, F., Grutter de la Mora, M., Gruzdev, A., Gratsea, M., Hansen, G. H., Irie, H., Jepsen, N., Kanaya, Y., Karagkiozidis, D., Kivi, R., Kreher, K., Levelt, P. F., Liu, C., Müller, M., Navarro Comas, M., Piters, A. J. M., Pommereau, J.-P., Portafaix, T., Prados-Roman, C., Puentedura, O., Querel, R., Remmers, J., Richter, A., Rimmer, J., Rivera Cárdenas, C., Saavedra de Miguel, L., Sinyakov, V. P., Stremme, W., Strong, K., Van Roozendael, M., Veefkind, J. P., Wagner, T., Wittrock, F., Yela González, M., and Zehner, C.: Ground-based validation of the Copernicus Sentinel-5P TROPOMI NO2 measurements with the NDACC ZSL-DOAS, MAX-DOAS and Pandonia global networks, Atmos. Meas. Tech., 14, 481–510, https://doi.org/10.5194/amt-14-481-2021, 2021.
Wagner, T., Deutschmann, T., and Platt, U.: Determination of aerosol properties from MAX-DOAS observations of the Ring effect, Atmos. Meas. Tech., 2, 495–512, https://doi.org/10.5194/amt-2-495-2009, 2009.
Wagner, T., Beirle, S., Brauers, T., Deutschmann, T., Frieß, U., Hak, C., Halla, J. D., Heue, K. P., Junkermann, W., Li, X., Platt, U., and Pundt-Gruber, I.: Inversion of tropospheric profiles of aerosol extinction and HCHO and NO2 mixing ratios from MAX-DOAS observations in Milano during the summer of 2003 and comparison with independent data sets, Atmos. Meas. Tech., 4, 2685–2715, https://doi.org/10.5194/amt-4-2685-2011, 2011.
Wagner, T., Apituley, A., Beirle, S., Dörner, S., Friess, U., Remmers, J., and Shaiganfar, R.: Cloud detection and classification based on MAX-DOAS observations, Atmos. Meas. Tech., 7, 1289–1320, https://doi.org/10.5194/amt-7-1289-2014, 2014.
Wagner, T., Beirle, S., Benavent, N., Bösch, T., Chan, K. L., Donner, S., Dörner, S., Fayt, C., Frieß, U., García-Nieto, D., Gielen, C., González-Bartolome, D., Gomez, L., Hendrick, F., Henzing, B., Jin, J. L., Lampel, J., Ma, J., Mies, K., Navarro, M., Peters, E., Pinardi, G., Puentedura, O., Puķīte, J., Remmers, J., Richter, A., Saiz-Lopez, A., Shaiganfar, R., Sihler, H., Van Roozendael, M., Wang, Y., and Yela, M.: Is a scaling factor required to obtain closure between measured and modelled atmospheric O4 absorptions? An assessment of uncertainties of measurements and radiative transfer simulations for 2 selected days during the MAD-CAT campaign, Atmos. Meas. Tech., 12, 2745–2817, https://doi.org/10.5194/amt-12-2745-2019, 2019.
Wang, Y., Li, A., Xie, P. H., Wagner, T., Chen, H., Liu, W. Q., and Liu, J. G.: A rapid method to derive horizontal distributions of trace gases and aerosols near the surface using multi-axis differential optical absorption spectroscopy, Atmos. Meas. Tech., 7, 1663–1680, https://doi.org/10.5194/amt-7-1663-2014, 2014.
Wang, Y., Pukite, J., Wagner, T., Donner, S., Beirle, S., Hilboll, A., Vrekoussis, M., Richter, A., Apituley, A., Piters, A., Allaart, M., Eskes, H., Frumau, A., Roozendael, M. V., Lampel, J., Platt, U., Schmitt, S., Swart, D., and Vonk, J.: Vertical Profiles of Tropospheric Ozone From MAX-DOAS Measurements During the CINDI-2 Campaign: Part 1 – Development of a New Retrieval Algorithm, J. Geophys. Res.-Atmos., 123, 10637–10670, https://doi.org/10.1029/2018JD028647, 2018.
Williams, J. E., Boersma, K. F., Le Sager, P., and Verstraeten, W. W.: The high-resolution version of TM5-MP for optimized satellite retrievals: description and validation, Geosci. Model Dev., 10, 721–750, https://doi.org/10.5194/gmd-10-721-2017, 2017.
Wittrock, F., Oetjen, H., Richter, A., Fietkau, S., Medeke, T., Rozanov, A., and Burrows, J. P.: MAX-DOAS measurements of atmospheric trace gases in Ny-Ålesund – Radiative transfer studies and their application, Atmos. Chem. Phys., 4, 955–966, https://doi.org/10.5194/acp-4-955-2004, 2004.
- Abstract
- Introduction
- Dual-scan multi-wavelength MAX-DOAS measurements
- TROPOMI tropospheric NO2 measurements
- Ancillary measurements
- Description of the mapping MAX-DOAS technique
- Retrieval results and discussion
- Conclusions
- Data availability
- Author contributions
- Competing interests
- Disclaimer
- Acknowledgements
- Review statement
- References
- Supplement