the Creative Commons Attribution 4.0 License.
the Creative Commons Attribution 4.0 License.
 | 09 Oct 2020
Combining low-cost, surface-based aerosol monitors with size-resolved satellite data for air quality applications
Ralph A. Kahn
James A. Limbacher
Eloise A. Marais
Fábio Duarte
Carlo Ratti
Poor air quality is the world's single largest environmental health risk, and air quality monitoring is crucial for developing informed air quality policies. Efforts to monitor air pollution in different countries are uneven, largely due to the high capital costs of reference air quality monitors (AQMs), especially for airborne particulate matter (PM). In sub-Saharan Africa, for example, few cities operate AQM systems. It is thus important to examine the potential of alternative monitoring approaches. Although PM measurements can be obtained from low-cost optical particle counters (OPCs), data quality can be an issue.
This paper develops a new method using raw aerosol size distributions from multiple, surface-based low-cost OPCs to constrain the Multiangle Imaging SpectroRadiometer (MISR) component-specific, column aerosol optical depth (AOD) data, which contain some particle-size-resolved information. The combination allows us to derive surface aerosol concentrations for particles as small as ∼0.1 µm in diameter, which MISR detects but are below the OPC detection limit of ∼0.5 µm. As such, we obtain better constraints on the near-surface particulate matter (PM) concentration, especially as the smaller particles tend to dominate urban pollution.
We test our method using data from five low-cost OPCs deployed in the city of Nairobi, Kenya, from 1 May 2016 to 2 March 2017. As MISR passes over Nairobi only once in about 8 d, we use the size-resolved MISR AODs to scale the more frequent Moderate Resolution Imaging Spectrometer (MODIS)-derived AODs over our sites. The size distribution derived from MISR and MODIS agrees well with that from the OPCs in the size range where the data overlap (adjusted-R2∼0.80). We then calculate surface-PM concentration from the combined data. The situation for this first demonstration of the technique had significant limitations. We thus identify factors that will reduce the uncertainty in this approach for future experiments. Within these constraints, the approach has the potential to greatly expand the range of cities that can afford to monitor long-term air quality trends and help inform public policy.
- Article
(1008 KB) - Full-text XML
-
Supplement
(2449 KB) - BibTeX
- EndNote


Near-surface particulate matter (PM), airborne particles, also known as aerosol, is a major pollutant that affects air quality, and many countries are taking measures to decrease PM levels. However, efforts to monitor air pollution in different countries are uneven. In sub-Saharan Africa, for example, few countries operate air quality monitoring systems, and most countries lack any air quality monitoring capabilities at all, even though the limited observations that do exist show PM levels harmful to human health (deSouza, 2020; Petkova et al., 2013). This is because air quality monitoring equipment tends to be costly to purchase (capital costs are in the range of several thousands of US dollars) and maintain, and data processing and analysis require additional expertise and resources (deSouza et al., 2017; Kumar et al., 2015; Mead et al., 2013).
Given this context, other technologies, such as low-cost air quality sensors and satellite imagery, are being examined as alternative means of monitoring air quality. Low-cost air quality sensors, usually costing less than USD 2000 (Morawska et al., 2018), have the potential to move us from a paradigm of high-cost, highly accurate, sparse reference air quality monitoring to low-cost, more widely available air quality monitoring networks. One of the major drawbacks of using the lower-cost sensors is the quality of the data they produce is of concern (Carotenuto et al., 2020; Cavaliere et al., 2018; Lewis and Edwards, 2016; US EPA, 2016).
Satellite imagery, in particular space-based aerosol datasets derived from the NASA Earth Observing System's Moderate Resolution Imaging Spectrometer (MODIS) and Multiangle Imaging SpectroRadiometer (MISR), have also been used to estimate near-surface particulate matter concentrations from the retrieved total-column aerosol optical depth (AOD), with the help of aerosol transport modeling (e.g., Liu et al., 2007; Martin, 2008; van Donkelaar et al., 2010). The advantages of satellite technology for air quality monitoring arise from the spatially extensive measurements over time (2000–present for MISR and MODIS) and include global coverage, instrument calibration stability and the low incremental cost of data acquisition.
However, the challenges of using these datasets for air quality applications are also considerable. Among the main challenges in using satellite-derived AOD for this application are the following.
-
The low temporal frequency of measurements from polar-orbiting instruments (i.e., at most, about once daily for MODIS, and between 2 and 9 d for MISR, depending on latitude) compared to diurnally varying pollution levels in many settings.
-
Inaccuracies introduced in satellite aerosol retrieval algorithms by uncertain aerosol and surface optical properties.
-
The relatively coarse retrieval-product spatial resolution and aerosol species discrimination.
-
Inability to retrieve aerosol in the presence of cloud cover, and possible subpixel cloud contamination elsewhere (Duncan et al., 2014; Martonchik et al., 2009).
-
The relationship between satellite-derived AOD and PM2.5 is not straightforward. AOD is the integral of atmospheric optical extinction from the surface to the top of the atmosphere under ambient temperature and humidity conditions, whereas PM2.5 is the near-surface aerosol mass concentration of dry particles with diameters <2.5 µm. The relationship depends upon the aerosol vertical distribution, hygroscopic growth factor, mass extinction efficiency, and ambient atmospheric relative humidity profile (Gupta et al., 2006). The relationship is also time dependent and can vary across typical satellite grid cells (Engel-Cox et al., 2004; Hu, 2009; Lee et al., 2011).
Some recent studies that apply models to derive near-surface PM2.5 from satellite AOD measurements combine AOD with ground-based PM2.5 measurements from reference air quality monitors. Many early methods derived simple empirical relationships between PM2.5 and AOD (Engel-Cox et al., 2004; Wang and Christopher, 2003; Zhang et al., 2009). More advanced approaches applied chemical transport models to derive near-surface PM2.5 from the total-column aerosol optical depths of different aerosol components, which can be done, e.g., using the model-simulated aerosol vertical distribution and aerosol-type constraints from MISR (Friberg et al., 2018; Liu et al., 2007; Patadia et al., 2013).
Many studies have focused on the continental US due to the extensive surface measurements available for model validation (Al-Saadi et al., 2005; Liu et al., 2005; Tai et al., 2010). Gupta et al. (2006) were among the first to examine the derivation of PM2.5 from AOD in cities on different continents: Sydney, Delhi, Hong Kong and New York. Van Donkelaar et al. (2010) used the GEOS-Chem model to determine the scaling factors between AOD and PM2.5 for the entire globe. Because the AOD–PM2.5 relationship varies by region and season, it is particularly important to test existing models and modify them appropriately in the data-sparse regions of the world.
To respond to this challenge, the Surface Particulate Matter Network (SPARTAN) is adding numerous reference-grade surface stations in poorly sampled areas to evaluate and enhance satellite-derived PM results (Snider et al., 2016; Weagle et al., 2018). Given that it is unlikely many cities will have access to reference air quality monitoring instruments due to their high cost, it is important to start examining the fusion of data from low-cost air quality monitors with that from satellites and to develop insights from the combination of these measurements. This paper represents the first attempt, to the best of our knowledge, to do so.
Part of the challenge of attempting to combine these datasets is that low-cost air quality monitors on the market are not very reliable, and their measurements tend to be much less accurate than reference monitors (Lewis and Edwards, 2016). Many PM monitors, termed optical particle counters (OPCs), measure particle counts instead of particulate mass and do so reliably only for particles within certain diameter ranges. For example, assumptions about particle density as well as the number of ultrafine particles not sampled by these instruments must be made to convert the particle counts to PM2.5 (Hagan and Kroll, 2020). These assumptions introduce additional uncertainties into the results.
This paper presents a novel method linking the size-resolved information in MISR AOD component-specific retrievals with the ground-based aerosol size distribution derived from the raw particle counts of surface-based OPCs. As MISR passes over countries near the Equator only once in about 8 d, we use monthly-MISR aerosol climatology to scale the more frequent (twice daily near the Equator) MODIS-derived AOD.
As a first attempt at testing the method, we apply it to five Alphasense OPC-N2 low-cost monitors (Alphasense OPC-N2 product page URL: http://www.alphasense.com/index.php/products/optical-particle-counter/, last access: 15 December 2016) deployed from May 2016 to March 2017 in Nairobi, a growing metropolitan area in sub-Saharan Africa. The Nairobi case entails some important limitations for the current application; the AOD over the region was relatively low, and there were no independent measurements of aerosol vertical distribution or any surface-based, high-quality reference air quality monitors to help with validation. However, it is the only location where we have a significant record of coincident, ground-based low-cost OPC data. As such, we have to make assumptions in this first demonstration of the technique, which we detail, and mitigate to the extent possible, in this paper.
Section 2 provides an overview of the ground-based and satellite datasets involved in this study, as well as the model simulations used to constrain the aerosol vertical distribution. Section 3 describes in detail the method we developed for combining the surface and satellite data. Section 4 contains the results of applying this method in Nairobi. Our conclusions appear in Sect. 5, where we also summarize the factors that will reduce the uncertainties involved in combining data from low-cost monitors with satellite observations in future deployments.
2.1 Ground-based measurements
The Alphasense OPC-N2 monitor is a low-cost optical particle counter, costing USD 450, that works by (i) using focused light from a (∼5 V, 175 mA, 658 nm) laser to illuminate one aerosol particle at a time and (ii) then measuring the intensity of light scattered. The amount of scattering is a function of the size, shape and composition of the aerosol, and especially for spherical particles such as those most likely to dominate in the study region, the measurements can be calibrated using monodisperse particles of known size (Sousan et al., 2016). The Alphasense OPC-N2 is unique among low-cost sensors as, in addition to PM estimates, it reports the raw particle counts in 16 bins based on particle diameter, ranging from 0.38 to 17.5 µm, which is critical to our method. The bins are tabulated in Table S1 in the Supplement. Sousan et al. (2016) discuss the accuracy of these count measurements in detail and note that they agree well with reference instrument measurements for coarser particles (>0.78 µm in diameter) but underestimate the particle counts for finer particles.
As the OPCs cannot detect particles with diameters < 0.38 µm, Alphasense provides software to extrapolate the particle counts as needed to estimate the contribution from aerosols having diameters <0.38 µm. The number of particles per volume of air in all bins can be obtained by dividing the particle counts of each bin by the flow rate and sampling duration. The Alphasense company proprietary data reduction algorithm makes assumptions about the particle density and volume of aerosols in each bin to calculate PM1, PM2.5 and PM10 data from the particle count data.
Details about the Nairobi OPC deployment can be found in Sect. S1.1 in the Supplement.
2.2 Satellite data
Although passive remote sensing has significant limitations for air quality applications at present, it offers substantially more frequent, global-scale aerosol constraints than any other measurement technique. Starting in December 1999, the National Aeronautics and Space Administration (NASA) launched a series of Earth Observing System satellite sensors, including the two instruments we use in this experiment: the Multiangle Imaging SpectroRadiometer (MISR) on board the Terra satellite (Diner et al., 1998) and two Moderate Resolution Imaging Spectroradiometer (MODIS) sensors (e.g., Remer et al., 2005), one each aboard the Terra and Aqua satellite platforms.
2.2.1 MISR research algorithm AOD and particle properties
MISR is one of five instruments aboard the Terra satellite. It measures sunlight reflected from Earth in each of nine cameras pointed at different view angles, from +70∘ through nadir to −70∘ along the satellite flight path, in each of four spectral bands (446, 558, 672 and 866 nm) (Diner et al., 1998). This multiangle design allows MISR to observe the atmosphere through effective slant paths ranging from one (i.e., vertically down) to three (i.e., at steep forward and aft angles). This geometry produces scattering angles between the sun and viewing vectors ranging from approximately 60 to 160∘ in midlatitudes. The combination of multispectral and multiangular observations provides information about aerosol amount and microphysical properties, such as particle size and shape (Kahn et al., 2001; Kahn and Gaitley, 2015).
MISR algorithms retrieve aerosol properties by selecting from among the optical models for an assumed set of aerosol component mixtures. A “component” is a candidate aerosol type of specified, uniform composition and size distribution. The top-of-atmosphere reflectances simulated for each mixture are calculated and compared with the corresponding MISR observations to determine the mixtures that fit the data within certain acceptance criteria; these are reported by the algorithm as the “successful mixtures” likely to be present (Diner et al., 2005; Limbacher and Kahn, 2014; Martonchik et al., 2009). Each mixture contains up to three individual aerosol components, where the percent contributions of all the components to the mixture midvisible AOD sum to 100 %.
The MISR standard aerosol retrieval algorithm uses a universe of 74 mixtures. The eight aerosol components in the MISR standard version 22 and 23 products are labeled 1, 2, 3, 6, 8, 14, 19 and 21 as reported in Tables 1 and 2 in Kahn and Gaitley (2015) and reproduced in Table S3 in the Supplement. The components are named based on single-scattering albedo (SSA): light-absorbing or nonabsorbing; particle shape: spherical, nonspherical grains or spheroids; and effective radius. Under favorable retrieval conditions (e.g., when total-column midvisible AOD exceeds about 0.15 or 0.2), the MISR algorithm is able to distinguish between three and five bins in column-effective particle size (Kahn and Gaitley, 2015).
The spectral extinction coefficients for each aerosol component are included in the MISR Aerosol Physical and Optical Properties (APOP) file, available from the NASA Langley Research Center (LARC) Atmospheric Sciences Data Center (ASDC, https://asdc.larc.nasa.gov/data/MISR/MIANACP.001/2004.08.16/, last access: 12 August 2019). The MISR standard aerosol data product provides AOD values and success flags – i.e., whether a mixture is an adequate fit to the observations to be considered a successful match – for each aerosol mixture, based on estimated measurement uncertainties.
In this paper, we use the MISR research aerosol retrieval algorithm (RA; Limbacher and Kahn, 2014, 2017) applied to MISR Level 1B2 radiance data to derive AOD estimates for the eight MISR aerosol components. The RA can be run with different sets of aerosol components, including the 74-mixture set used in the MISR standard algorithm, and reports column-effective aerosol properties at any desired spatial resolution down to the MISR pixel resolution of 1.1 km × 1.1 km. In addition to producing results at a finer spatial resolution than the MISR standard aerosol product, the RA also offers significantly better MISR aerosol retrieval results for air quality and other applications because of empirical calibration corrections (Limbacher and Kahn, 2015), better treatment of surface boundary conditions, and other refinements (Limbacher and Kahn, 2017, 2019, 2014).
Data from MISR on their own rarely contain more detail than qualitative particle size and shape, so particle-composition-related information that could be used to distinguish different sources or to assess particle moisture content is lacking, except where detectable differences in other parameters, such as particle shape (e.g., nonspherical dust vs. spherical smoke or pollution particles) and particle light absorption (e.g., “dirty” vs. “clean”), make these distinctions possible (Kahn et al., 2001; Kahn and Gaitley, 2015; Liu et al., 2007). MISR aerosol-type retrieval uncertainty, based on the range of particle size, single scattering albedo (SSA), and the fraction of nonspherical values among the aerosol mixtures from the algorithm climatology, is assessed generally by Kahn and Gaitley (2015), and we rely on these results to indicate the expected uncertainties here. Specifically, we enforce a lower bound of 0.15 on midvisible AOD for accepting MISR-retrieved particle size distributions. We assume that the aerosol components follow lognormal size distributions, and we extract the size distribution of the MISR aerosol components at diameters ranging over the MISR size-detection range of about 0.1–3 µm.
For more details of the MISR data over the OPC-N2s in Nairobi, refer to Sect. S1.2.1 in the Supplement.
2.2.2 MODIS-MAIAC AOD
MODIS samples every location on the globe about twice a day but lacks particle size information over land (e.g., Levy et al., 2013). As aerosol type appears to be fairly constant on monthly timescales, we scale the MODIS-MAIAC (Multi-Angle Implementation of Atmospheric Correction) AOD retrieval product (Lyapustin et al., 2011a, b, 2012), with available particle-size-resolved AOD from MISR over each month.
MODIS has 36 spectral channels, designed to provide a wide variety of biogeophysical information. Unlike MISR, which uses near-simultaneous, multiangle observations for aerosol-surface retrievals, MODIS offers single-view, broad-swath, multispectral data. The MAIAC algorithm applies image-based processing techniques to analyze MODIS time-series, i.e., multiple views of each surface location, in different parts within the MODIS swath (and therefore different view angles), acquired over a sliding, 16 d orbit-repeat cycle. This noncoincident multiangle approach produces cloud detection, AOD and atmospheric correction over both dark vegetated land and a range of brighter surfaces at 1 km × 1 km resolution (Lyapustin et al., 2012). Compared to operational MODIS retrievals, MAIAC AOD has similar accuracy over dark and vegetated surfaces and higher accuracy over brighter surfaces (Lyapustin et al., 2011b, a).
For details about MAIAC AOD over Nairobi during the study period, refer to Sect. S1.2.2 in the Supplement.
2.3 GEOS-Chem aerosol vertical scaling
GEOS-Chem simulations were used in our study to provide a constraint on the vertical distribution of the aerosols, because AOD from the satellites is a column-integrated quantity, whereas PM2.5 is assessed near the surface. The GEOS-Chem model is driven with GEOS-5 assimilated meteorology from the NASA Global Modeling and Assimilation Office (GMAO) at horizontal resolution (Bey et al., 2001). The model is nested over the African continent, and boundary conditions are from a global simulation at . Open fire (biomass burning) emissions are from GFED4 (van der Werf et al., 2010). Inventories of anthropogenic emissions in Africa include DICE-Africa for cars, motorcycles, traditional biofuel use (fuelwood, charcoal, crop residue), charcoal production, ad hoc oil refining, backup generators, kerosene use, and gas flares (Marais and Wiedinmyer, 2016). Pollution measurements from industrial and on-grid power generation for black carbon (BC) and organic carbon (OC) are from Bond et al. (2007). Detailed aerosol chemistry is described by Mao et al. (2010, 2013).
Details about the model simulations we used for the Nairobi case, as well as our attempts to validate the vertical distribution of aerosol obtained from the GEOS-Chem model, are provided in Sect. S1.3 in the Supplement.
Our approach uses the size distribution of the aerosol components from MISR retrievals to constrain the size distribution derived from low-cost OPCs. The satellite size distribution data are encoded in the fractional contribution of each MISR component AOD to the total MISR AOD. We use the monthly effective fraction of each MISR component AOD to scale the more frequent MAIAC AODs, yielding AOD values parsed out for the individual MISR components on a more frequent basis. In particular, the constraint on the aerosol size distribution from MISR remote-sensing data is especially important for particles with diameters <0.54 µm, which the OPC cannot detect with confidence. Obtaining an understanding of the size distribution between 0.1 and 0.54 µm allows for better estimation of PM2.5 from the combined MISR and OPC measurements. We assess the assumptions required for this analysis in Sect. 5.
We provide an overview of the methodology using a flowchart (Fig. 1).
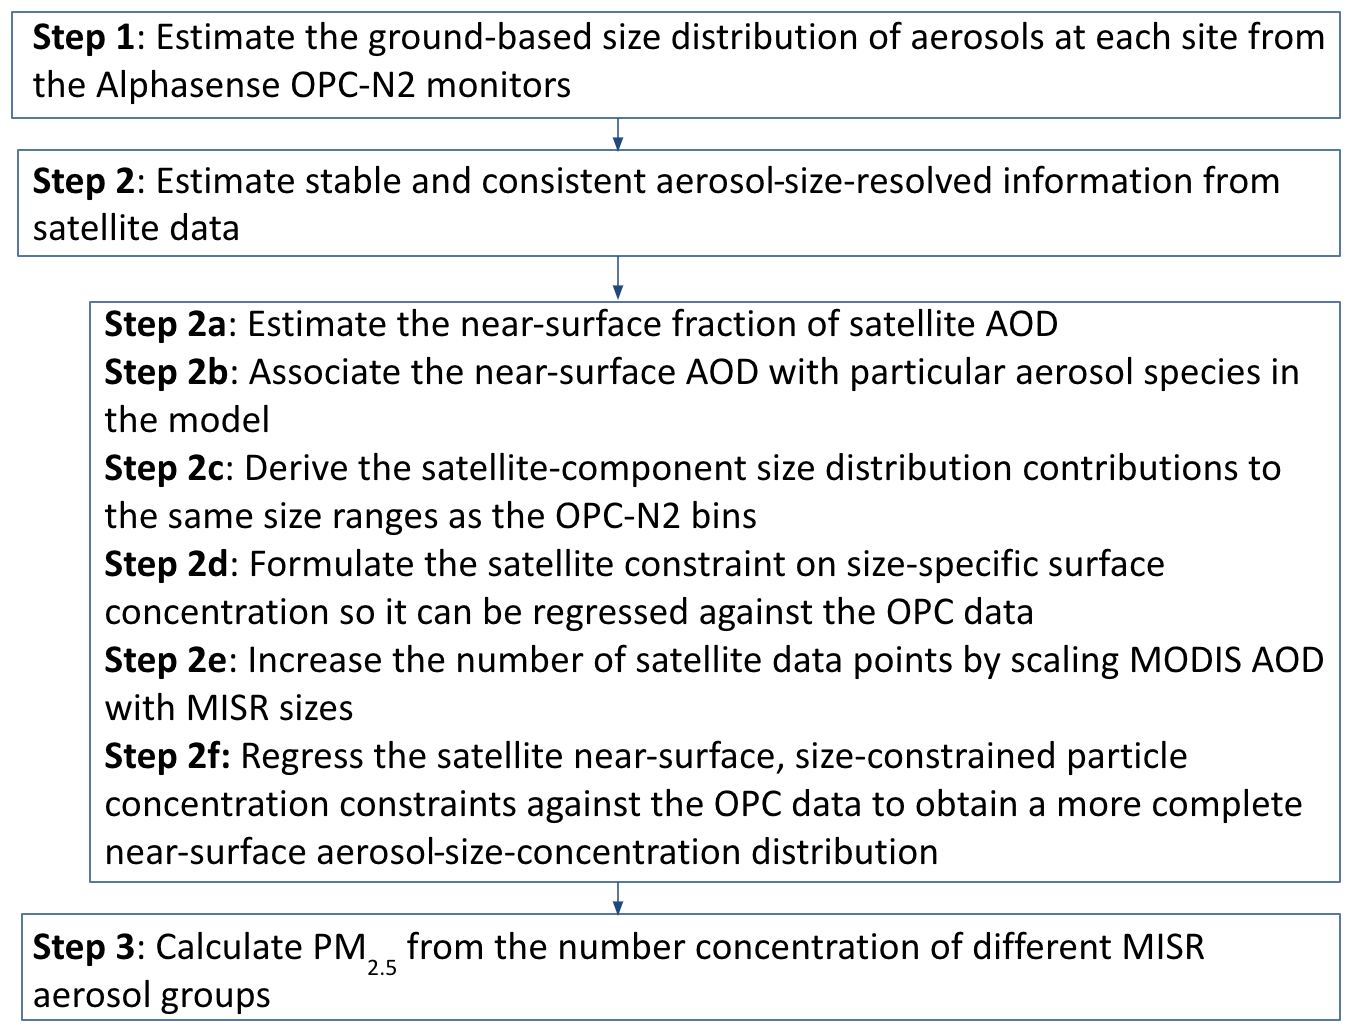
3.1 Step 1: estimate the ground-based size distribution of aerosols at each site from the Alphasense OPC-N2 monitors
We obtain the lognormal size distribution dN∕d(ln (d)) from the Alphasense OPC-N2 ground-based data, at the time of the Terra overpass, for the diameter at the midpoint of each OPC bin using Eq. (1).
Here Dupper and Dlower are the upper and lower diameters of each OPC bin. Δn is the number of particle counts in each bin. N is the averaged number concentration of particles (units: number of particles per volume of air) over the 7 min Terra overpass. The number concentration units derived from Eq.(1) are number of particles per milliliter. We thus multiply the result by 106 to convert the number concentration from our surface monitors to number of particles per cubic meter (number m−3).
Equation (1) uses only the raw particle counts from the OPC. We do not include the first bin (0.38–0.54 µm) in this analysis, as the error in the number concentration measurement for this bin is the highest (Sousan et al., 2016). Note that the mode diameter of urban aerosol tends to be ∼0.2 µm. Unfortunately, the Alphasense OPC-N2 only “sees” larger aerosols. This is a key reason for combining the OPC data with the satellite retrievals. In future deployments, other instruments that can see the smaller particles can be used.
3.2 Step 2: estimate stable and consistent aerosol-size-resolved information from satellite data
We estimate the corresponding size distribution of surface particulate matter from MISR and MAIAC AOD information by calculating the monthly effective near-surface AOD for each of the eight MISR aerosol components.
We denote the column fractional AOD for each aerosol component (listed in Table S3 in the Supplement) as AODi,k: the midvisible AOD fraction of component i in the kth MISR atmospheric column retrieval. It is calculated as the mixture-AOD-weighted AOD from all passing mixtures for component i in the MISR RA aerosol climatology.
3.2.1 Step 2a: estimate the near-surface fraction of the satellite AOD
We estimate the fractional AOD for each aerosol component residing in the lowest atmospheric layer of the GEOS-Chem model (up to ∼130 m above the surface) by scaling the total-column fractional AOD with the simulated aerosol vertical profiles from GEOS-Chem using Eq. (2).
Here N-S denotes near-surface.
3.2.2 Step 2b: associate the near-surface AOD with particular aerosol species in the model
Given the difference between the MISR aerosol components and the GEOS-Chem aerosol species, we use an approach similar to Liu et al. (2007) to connect the two. Specifically, we sum GEOS-Chem AOD values for spherical species, SO4-NH4-NO3, OC and BC. We then calculate the ratio of the AOD for these species in the lowest GEOS-Chem atmospheric layer to the total-column spherical-species AOD as the scaling factor for the MISR spherical components. For the very large spherical (MISR aerosol component 6) and nonspherical components (MISR aerosol components 19 and 21), we use the ratio of GEOS-Chem dust AOD in the lowest layer to the total-column dust AOD (Kahn and Gaitley, 2015). Henceforth, we refer to MISR component-specific, near-surface fractional AODs as MISR fractional AODs.
3.2.3 Step 2c: derive the satellite-component size distribution contributions to specific sizes
We now obtain the particle properties from the MISR RA needed to constrain the OPC aerosol size distribution for sizes smaller than 0.54 µm. Depending on retrieval conditions, if the aerosol retrieval is successful, MISR is able to distinguish aerosols in about three to five size bins (Sect. 2.2.1). The MISR RA uses these data to constrain a universe of possible aerosol mixtures to a subset of components that fit the data best. Although there is uncertainty in the details of the size distribution, the instrument provides consistent and stable retrievals over large areas and for a long period of time. Similarly, the process of constraining the universe of MISR aerosol types present is also consistent and stable over time. The corresponding lognormal size distribution dN∕d(ln (d)) of all the aerosol components from the satellite data is obtained from Eqs. (3) and (4a).
In Eq. (3), Si(d) is the normalized size distribution of MISR aerosol component i. The representative size parameters are, specifically, the characteristic diameter (dci) and the distribution width (σi) for each of the eight MISR aerosol components. Note that the upper and lower diameters of each aerosol component are considered in this analysis. Based on the retrieval algorithm assumptions, the size distribution of an aerosol component for diameters outside the range of each component is 0. For the Nairobi cases, only small, spherical particles and medium-coarse particles contribute significantly to the MISR-retrieved AOD (Table 2). is the total number concentration of each MISR aerosol component present near the surface for each observation.
The size distributions Si(D) for MISR aerosol components 2, 8 and 14 are the same (Table S3). MISR aerosol components 2, 8 and 14 represent optical analogs of typical urban pollution with different light-absorption properties. We rewrite Eq. (4a), grouping these three components into one aggregate term in Eq. (4b). Here is the total near-surface number concentration of components 2, 8 and 14. The index i here runs only over the remaining MISR aerosol components: 1, 3, 6, 19 and 21.
Importantly, the column-effective size distribution from Eq. (4b), derived from the MISR retrievals, corresponds to the surface-measured value from Eq. (1) only if the near-surface aerosol properties are representative of the entire atmospheric column. Due to a lack of additional observational constraints, we must accept this as an assumption, along with the corresponding uncertainty. The assumption will be favored in places where the aerosol load is concentrated near the surface, which is common when the aerosol column is dominated by local sources. This is likely the case for many urban regions and is supported by the high correlation between MISR or MAIAC AODN-S and OPC PM2.5 in Nairobi when AOD >0.15 (see Sect. S2 in the Supplement). The size distribution of the total aerosol derived from a MISR retrieval is a sum of the size distributions of individual aerosol components, as represented in Eq. (4).
3.2.4 Step 2d: formulate the satellite constraint on size-specific surface concentration so it can be regressed against the OPC data
By definition, AOD558 is proportional to [the number concentration of aerosols] × [the extinction area of each particle at 558 nm wavelength] × [the path over which AOD is assessed (which for MISR is the entire column – here, we scale the AOD to provide the near-surface component residing in the lowest layer of the GEOS-Chem model, which is 130 m vertically)]. In order to obtain near-surface number concentration of each aerosol component using this physical definition of AOD, we assume a uniformly mixed, near-surface aerosol, with the AOD measured in all cases over a vertical path through the first 130 m of the GEOS-Chem model. As shown in Eq. (5), for each aerosol component, a dimensionless proportionality constant multiplied by the AODN-S ∕ path length (130 meters) × spectral extinction coefficient is the number concentration of particles, summed over the path, per unit area. The spectral extinction coefficients of each aerosol component can be found in Table S3. The near-surface number concentration of each aerosol group is thus represented as follows.
For MISR aerosol components 1, 3, 6, 19 and 21,
For the aggregate MISR aerosol group comprised of MISR aerosol components 2, 8 and 14,
The spectral extinction coefficients obtained from Table S3 are in units of square micrometers (µm2). To convert this to square meters (m2), we multiply these coefficients by 10−12. The number concentration in Eq. (5a) and (5b) has units of number of particles per cubic meter (number m−3). Γi is a dimensionless scaling parameter needed to relate the modeled aerosol number concentration of each component to the actual number concentration present from the OPC measurements. We expect this value to be a constant, because the MISR retrievals are stable and consistent over time. We derive this parameter using the ground-based size distribution from the OPC-N2s, in the size range where the surface instruments have sensitivity.
3.2.5 Step 2e: increase the number of satellite data points by scaling MODIS AOD with MISR sizes
To increase the satellite dataset, we use the average fractional AOD of each MISR aerosol component for a given month over a specific site to parse the total AOD from the more frequently sampled MAIAC product, using Eq. (6) to represent the MISR component fraction and Eq. (7) to calculate the corresponding MAIAC value.
Here MISR AODN-S,month,i is the effective MISR near-surface AOD for component i over a given surface site for a specific month of the year (obtained by averaging the available data, with the assumption of negligible change in particle properties over the month, as discussed in Sect. 2.2.1), and n is the number of MISR AODi retrievals for that month. The AOD assigned to each MISR component i, based on scaling a given MAIAC AOD retrieval, is denoted MAIACi, For the remaining analysis, we use the scaled MAIAC instead of MISR in Eq. (5a) and (5b).
3.2.6 Step 2f: regress the satellite near-surface, size-constrained particle concentration constraints against the OPC data to obtain a more complete near-surface aerosol-size-concentration distribution
To appropriately link the size-distribution from the OPCs with the MISR retrievals, we would ideally aggregate the OPC size bins in a similar way to that of MISR – very small, small, medium and large; calculate the OPC size distribution at the midpoint of these bins; and fit these size distributions with the size distribution derived from MISR. However, as the OPC has predefined bins, we assume that for favorable retrievals, each aerosol component follows a lognormal size distribution, consistent with the MISR algorithm assumptions. We use Eq. (4) to extract the size distribution of the total aerosol from MISR measurements that corresponds to the midpoint of each preexisting OPC bin within its range of sensitivity. Although the OPC counts particles for 16 diameter bins between 0.38 and 17 µm (Table S1), we perform the OPC-MISR regression analysis only within the diameter range 0.54–2.55 µm for which both MISR and the OPCs have adequate sensitivity. This corresponds to 6 of 16 OPC size bins, bin 2–bin 7 (Table S1). When we use the MAIAC data, we still rely on the size information obtained from the MISR retrievals to represent the aerosol size distribution.
We perform the regression analysis, substituting the right side of Eq. (1) into the left side of Eq. (4b) and substituting the right side of Eq. (5a) and (5b) for the two terms on the right side of Eq. 4b. We can then evaluate the Γi, based on the relationship between the surface-monitor size distribution on the left side of this equation (obtained from Eq. 1) and the satellite values represented on the right side, for each coincident observation. The Γi's are essentially the aerosol-group-specific adjustment factors required to equate the near-surface aerosol number concentration measured by the surface monitor with that derived from the satellite. After calculating Γi, we can calculate using Eq. (5a) and (5b).
3.3 Step 3: calculate PM2.5 from the number concentration of the different MISR aerosol groups
In the final step, we calculate PM2.5 using the OPC-calibrated aerosol size distribution from MISR. As is already evident from the discussion above, it is not straightforward to obtain quantitative PM2.5 values from the particle size distribution information derived from satellite passive remote sensing. Further, Alphasense uses a proprietary algorithm to convert particle counts to dry mass. Particle counts in each of the 16 bins are multiplied by the volume of particles under ambient conditions in each bin assuming spherical particle shape, an assumed particle density and a factor corresponding to the ISO respirable convention for PM2.5. Assumptions are made about the efficiency of the instrument inlet as a function of particle size and about the size distribution functional form to obtain the volume of particles within each size bin. The total is then divided by the sampling time and sample flow rate to calculate the mass obtained per unit volume of air. Given these assumptions, we have more confidence in observed differences in the measurements than in the reported absolute concentration values. Our interpretation of the results in the next section proceeds with this in mind. Assuming spherical particles, the normalized volume distribution per particle for MISR aerosol component i is
Note that here the index i corresponds to MISR aerosol components 1, 3, 6, 19, and 21 or the aggregate group 2, 8 and 14. In Eq. (8), vi(d) is the total normalized volume distribution of each aerosol component or group per volume of air. The total volume of the aerosol group with diameters between d and d+Δd per volume of air is provided by V(d) in Eq. (9). is the ambient value of the total near-surface aerosol number concentration for MISR component/group i. The value in Eq. (9) will be the same as that derived directly from the MISR data in Eq. (5a) and (5b) only to the extent that the near-surface aerosol type represents the total-column aerosol type, an assumption we make consistently in this analysis.
The integration of vi(d) for each aerosol component/group from 0 to a finite diameter is nontrivial. We solve this integral numerically using Eq. (10) to obtain the total volume contributed by each aerosol component per volume of air. When doing this integration, we are careful to take into consideration the lower and upper limits on the radius for each MISR aerosol component in each aerosol component/group.
The unit of volume (Vi) here is cubic micrometers (µm3), as the unit of the diameter we use here is in micrometers (µm). To calculate PM2.5 we need to multiply the total volume of each of the eight aerosol components for particles calculated using Eq. (10) by the particle density, as shown in Eq. (11).
In this analysis, we assume the same particle density that Alphasense uses in its algorithm. We compute PM2.5 in units of micrograms per cubic meter (µg m−3) from the volume obtained: 1.65 g cm−3 or µg m−3 .
Note that the Alphasense algorithm to convert particle counts to mass is proprietary, and we do not have access to its methodology.
In this section we apply the method described in Sect. 3 above to the OPC and satellite data collected in Nairobi from May 2016 through early March 2017. We present the results using the limited coincident MISR data and also using the larger scaled MODIS dataset, and we then summarize the assumptions and mitigating factors in the current analysis, which includes a discussion of possible improvements for future deployments. Some details about the Nairobi experiment are given in the Supplement; the main points and key results are presented here.
4.1 Application of the method to the 2016–2017 Nairobi OPC deployment
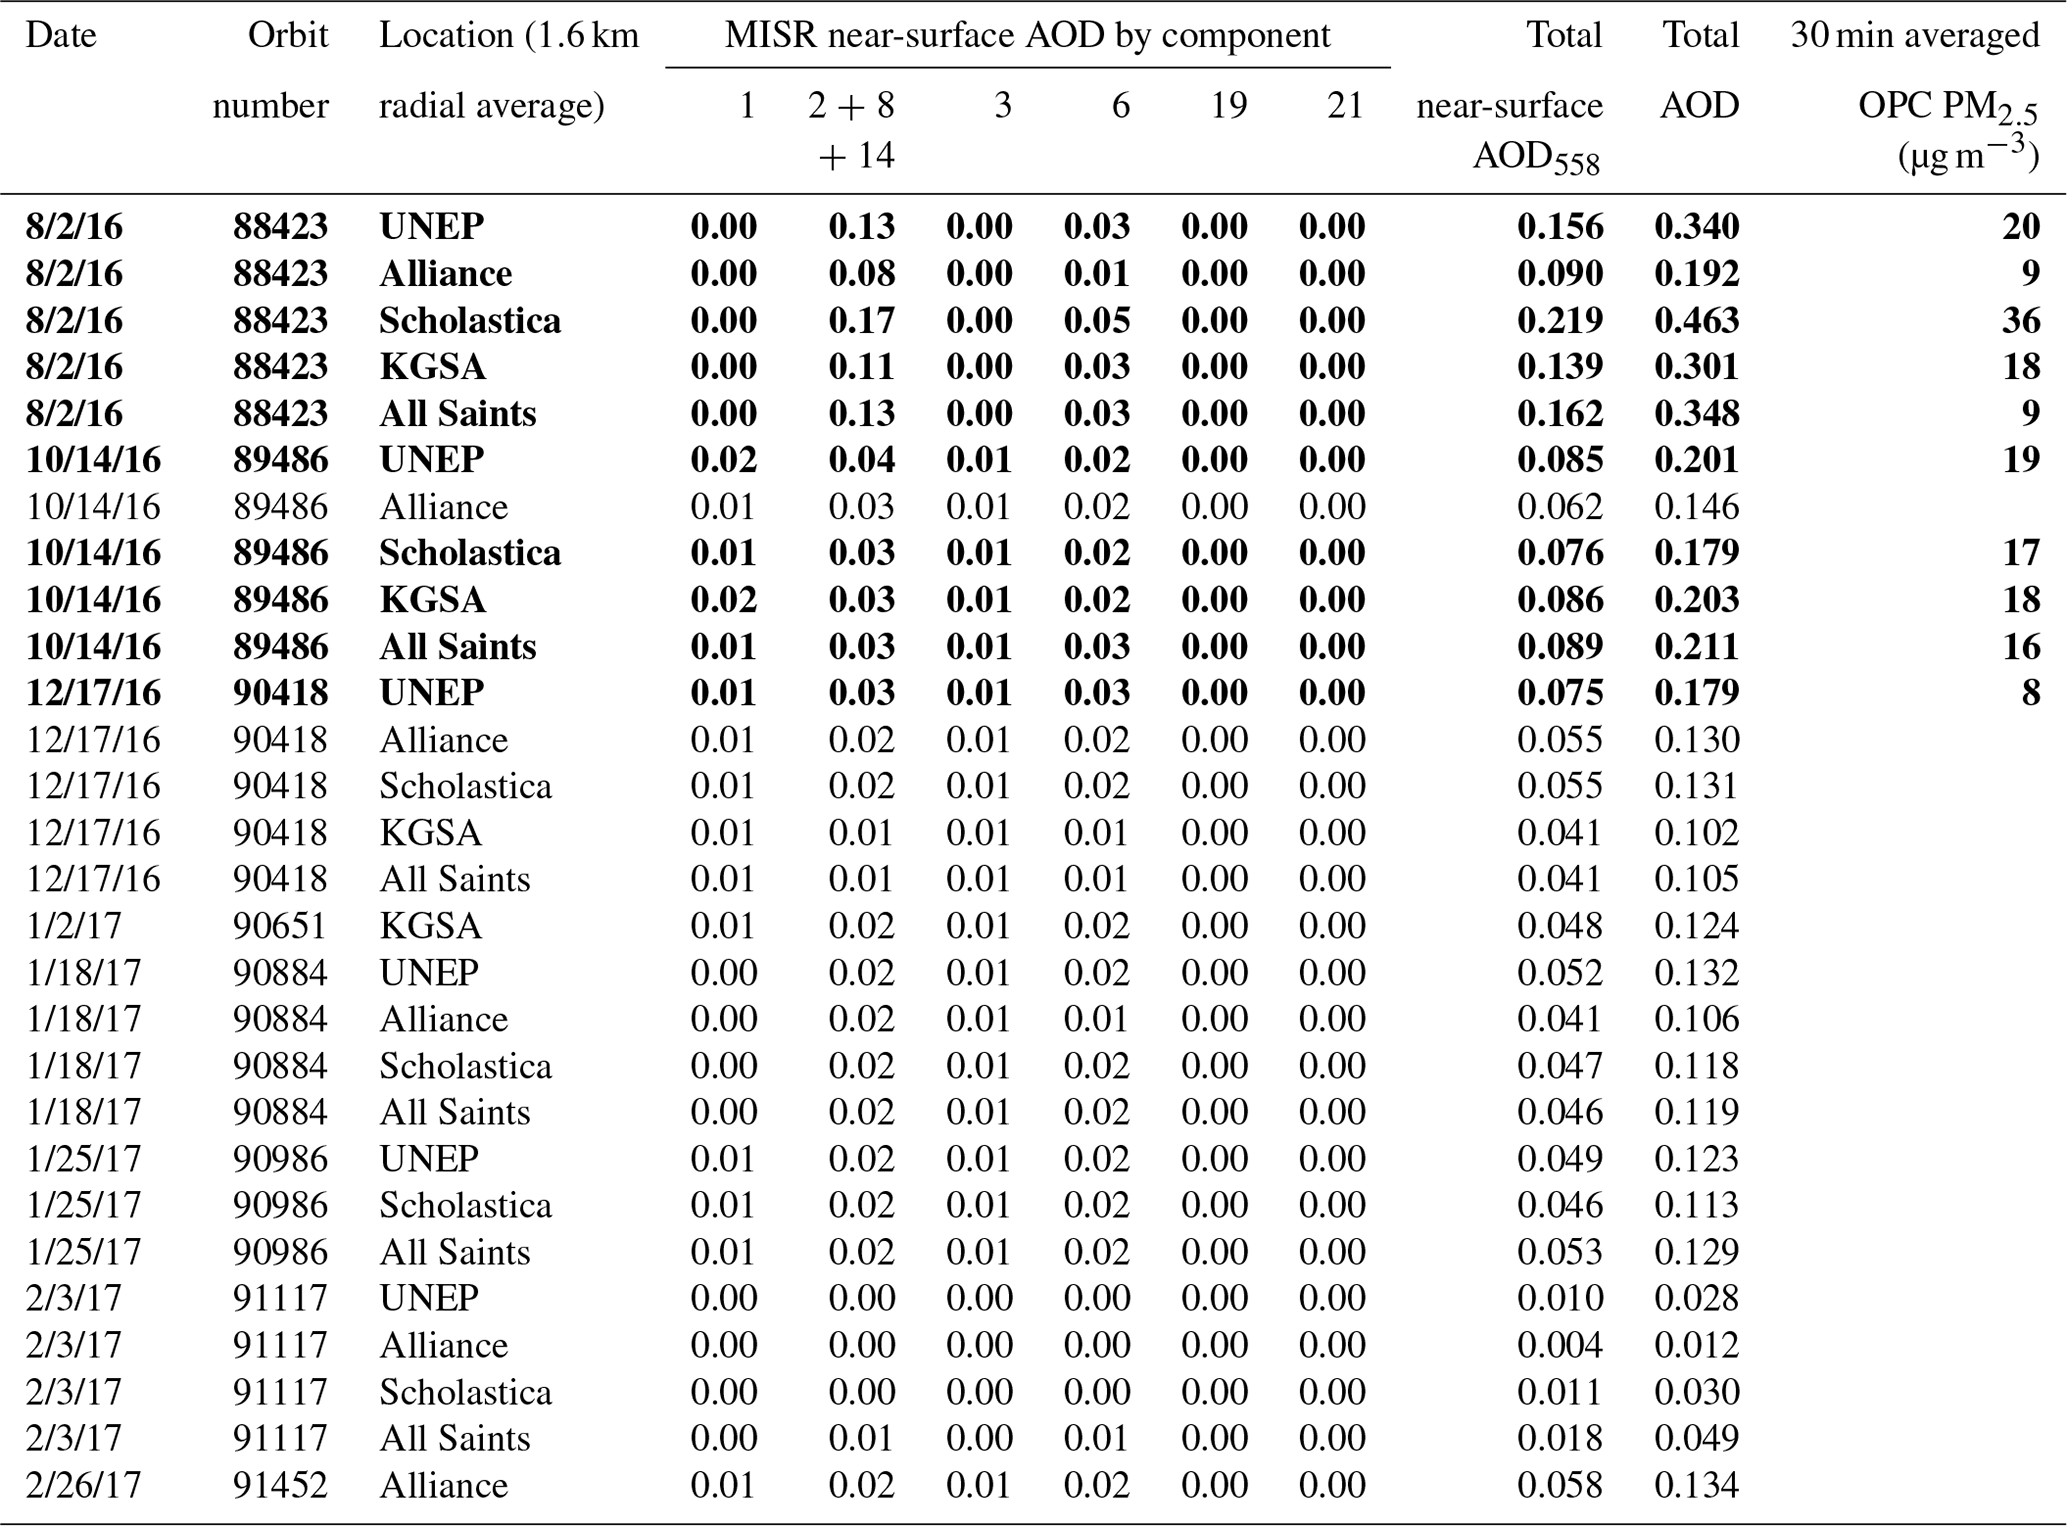
Following steps 1, 2a and 2b of the methodology described in Sect. 3, Table 1 shows the near-surface AOD for the Nairobi data obtained from the vertically scaled MISR research algorithm for aerosol components 1, 3, 6, 19 and 21, as well as that for the aerosol group comprised of components 2, 8 and 14, using the standard universe of 74 mixtures. Near-surface values were obtained by scaling total-column AOD based on GEOS-Chem simulated aerosol vertical distributions. The 10 rows in bold font correspond to observations that have a MISR total AOD (sum of the AOD of the eight MISR aerosol components) >0.15. The corresponding surface PM2.5 from the ground-based OPC for the 10 favorable MISR retrievals is also presented. Table S2 in the Supplement shows the lognormal size distribution (dN∕d(ln D)) from the OPCs for the coincident surface observations that correspond to the 10 successful MISR retrievals where the total AOD558>0.15.
Table 1Successful near-surface MISR aerosol optical depth retrievals for each MISR aerosol component (including the aggregate scaled AOD from components 2, 8 and 14), the total near-surface MISR AOD and the total MISR AOD, averaged over a radial distance of 1.6 km2 from each surface-monitoring site. These values were obtained for each of the 28 coincident observations from the MISR research algorithm, run with the standard universe of 74 mixtures. The AOD is set to zero for aerosol components not present among the MISR-retrieved aerosol types. The retrieved amounts of components 19 and 21 were negligible or zero in all the retrievals. Near-surface values were obtained by scaling total-column AOD based on GEOS-Chem simulated aerosol vertical distributions. The 10 rows in bold correspond to observations that have a MISR total AOD (sum of the AOD of the eight MISR aerosol components) >0.15. The corresponding surface PM2.5 from the ground-based OPC for the 10 favorable MISR retrievals is also presented. Note that we have rounded the PM2.5 values to the nearest integer to acknowledge the uncertainties in the OPC PM2.5 measurements. Dates are given as month/day/year.
We obtain the group-specific particle size data from MISR (Step 2c) and the associated number concentrations () from Eq. (5a) and (5b) (Step 2d). We then linked the size distribution of the MISR aerosol groups with that of the OPCs (Step 2f). The regression analysis was conducted using the total dN∕d(ln D) derived from the MISR measurements as the predictor of the dN∕d(ln D), with the ground-based measurements as the dependent variable, assessed at six different diameters corresponding to the midpoints of the OPC size bins 2–7 (Eq. 1), where the datasets overlap. For each of the 10 high-AOD MISR cases, we have six dN∕dln (D) measurements (=60 rows in our regression analyses).
We have performed multiple analyses making different assumptions to explore the range of impacts these choices have on the results. The different analyses are summarized here.
-
Analysis 1. We only consider observations from MISR for all MISR aerosol components except for component 21.
-
Analysis 2. We only consider observations from MISR for all components except for components 1 and 21.
-
Analysis 3. We consider the scaled MAIAC AODs for all MISR components except 21.
-
Analysis 4. We considered scaled MAIAC AODs for all components except 1 and 21.
-
Analysis 5. We considered scaled MAIAC AODs where the total MAIAC AOD ≥0.15, for all components except 1 and 21.
4.1.1 Only MISR retrievals considered (analyses 1 and 2)
For all regression analyses we excluded MISR component 21 as the AOD retrieved for this component is 0.
In regression Analysis 1, we included the remaining MISR components. Not all of the coefficients in the regression are significant, and some are negative. Each coefficient in the regression represents the total number concentration of the respective aerosol group, which physically cannot be negative. However, it is possible for a statistical weight to be negative, as the regression approach aims to formally match the retrieved values with available observations, and there can be aerosol components and mixtures missing from the MISR algorithm climatology (Kahn et al., 2010). As such, leveraging from the better-fitting components can skew the coefficients for other particles negative. Provided the negative weights are small compared to the dominant retrieved components, the negative values represent noise in the results. This can apply to components 1 and 8 that are often retrieved in relatively small quantities, as well as to component 19, a dust optical analog, that very likely does not match actual dust in the region. Moreover, MISR component 1, with re(effective radius)=0.06 µm, is well below the OPC lowest size sensitivity limit.
Regression Analysis 2 was thus run without components 1 and 19.
Table 2Results from multiple linear regression analyses using the size distribution of MISR aerosol components as the independent variable and the size distribution from the OPC as the dependent variable. In analyses 1 and 2, the size distribution of components for MISR observations with a total AOD >0.15 is used. In analyses 3, 4 and 5 MISR component AODs were obtained by scaling MAIAC AODs using the monthly effective MISR aerosol component AOD fractions. Equations (5a) and (5b) are used to derive the total number concentration of each MISR aerosol group (). Because the AOD retrieved for MISR aerosol component 21 is 0, we do not consider this component in the regression analysis. Analysis 1 and 3 includes MISR aerosol component 1 and 19, whereas analyses 2, 4 and 5 do not. In Analysis 5, we restricted the MAIAC retrievals considered to those where the total AOD ≥0.15.
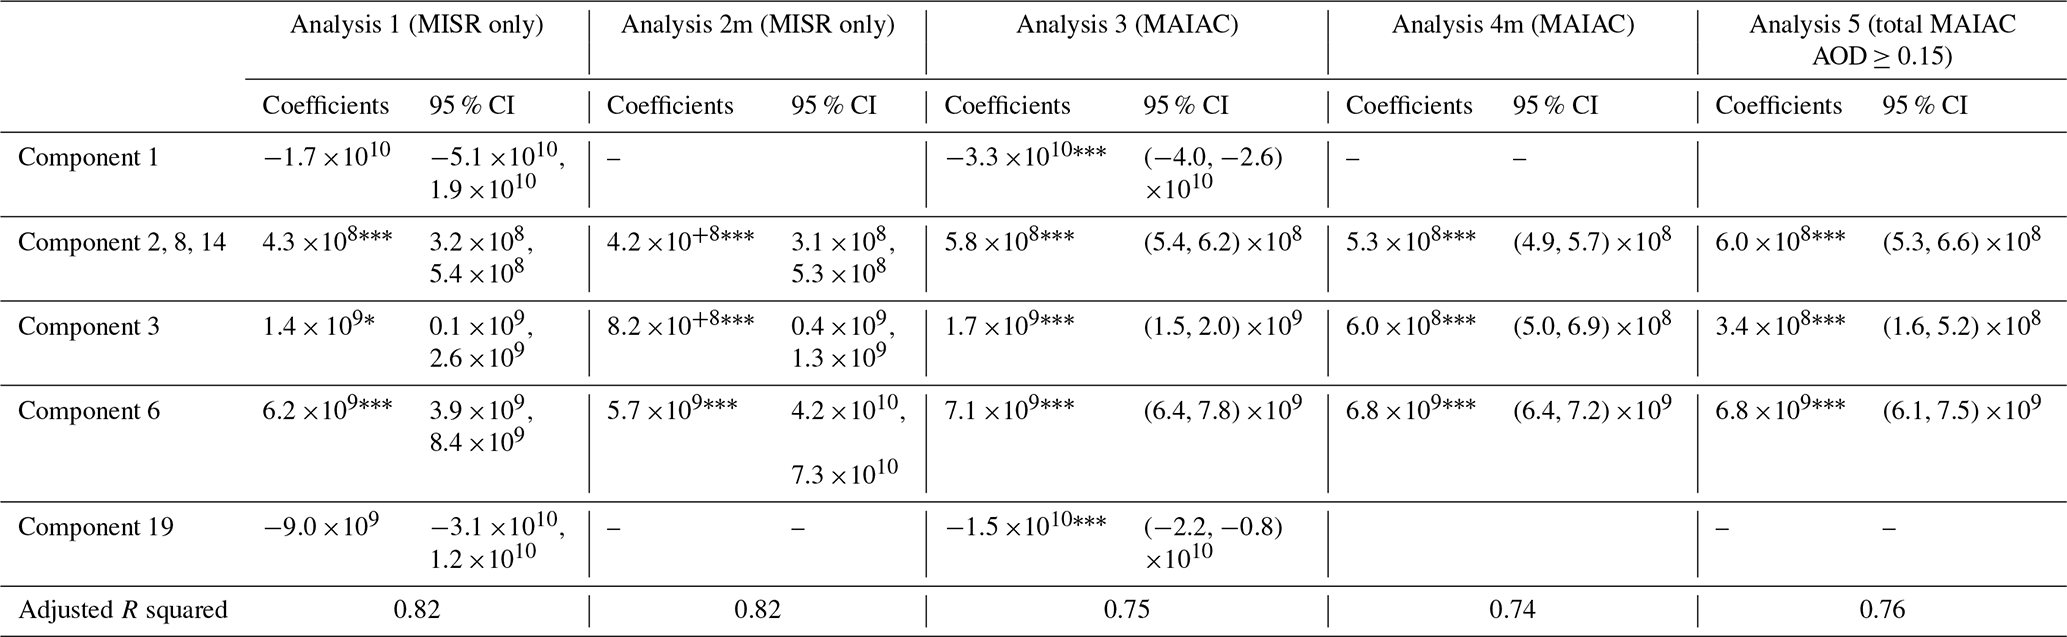
The p values of coefficients: ∗ ≤0.05; ≤0.01; ≤0.001.
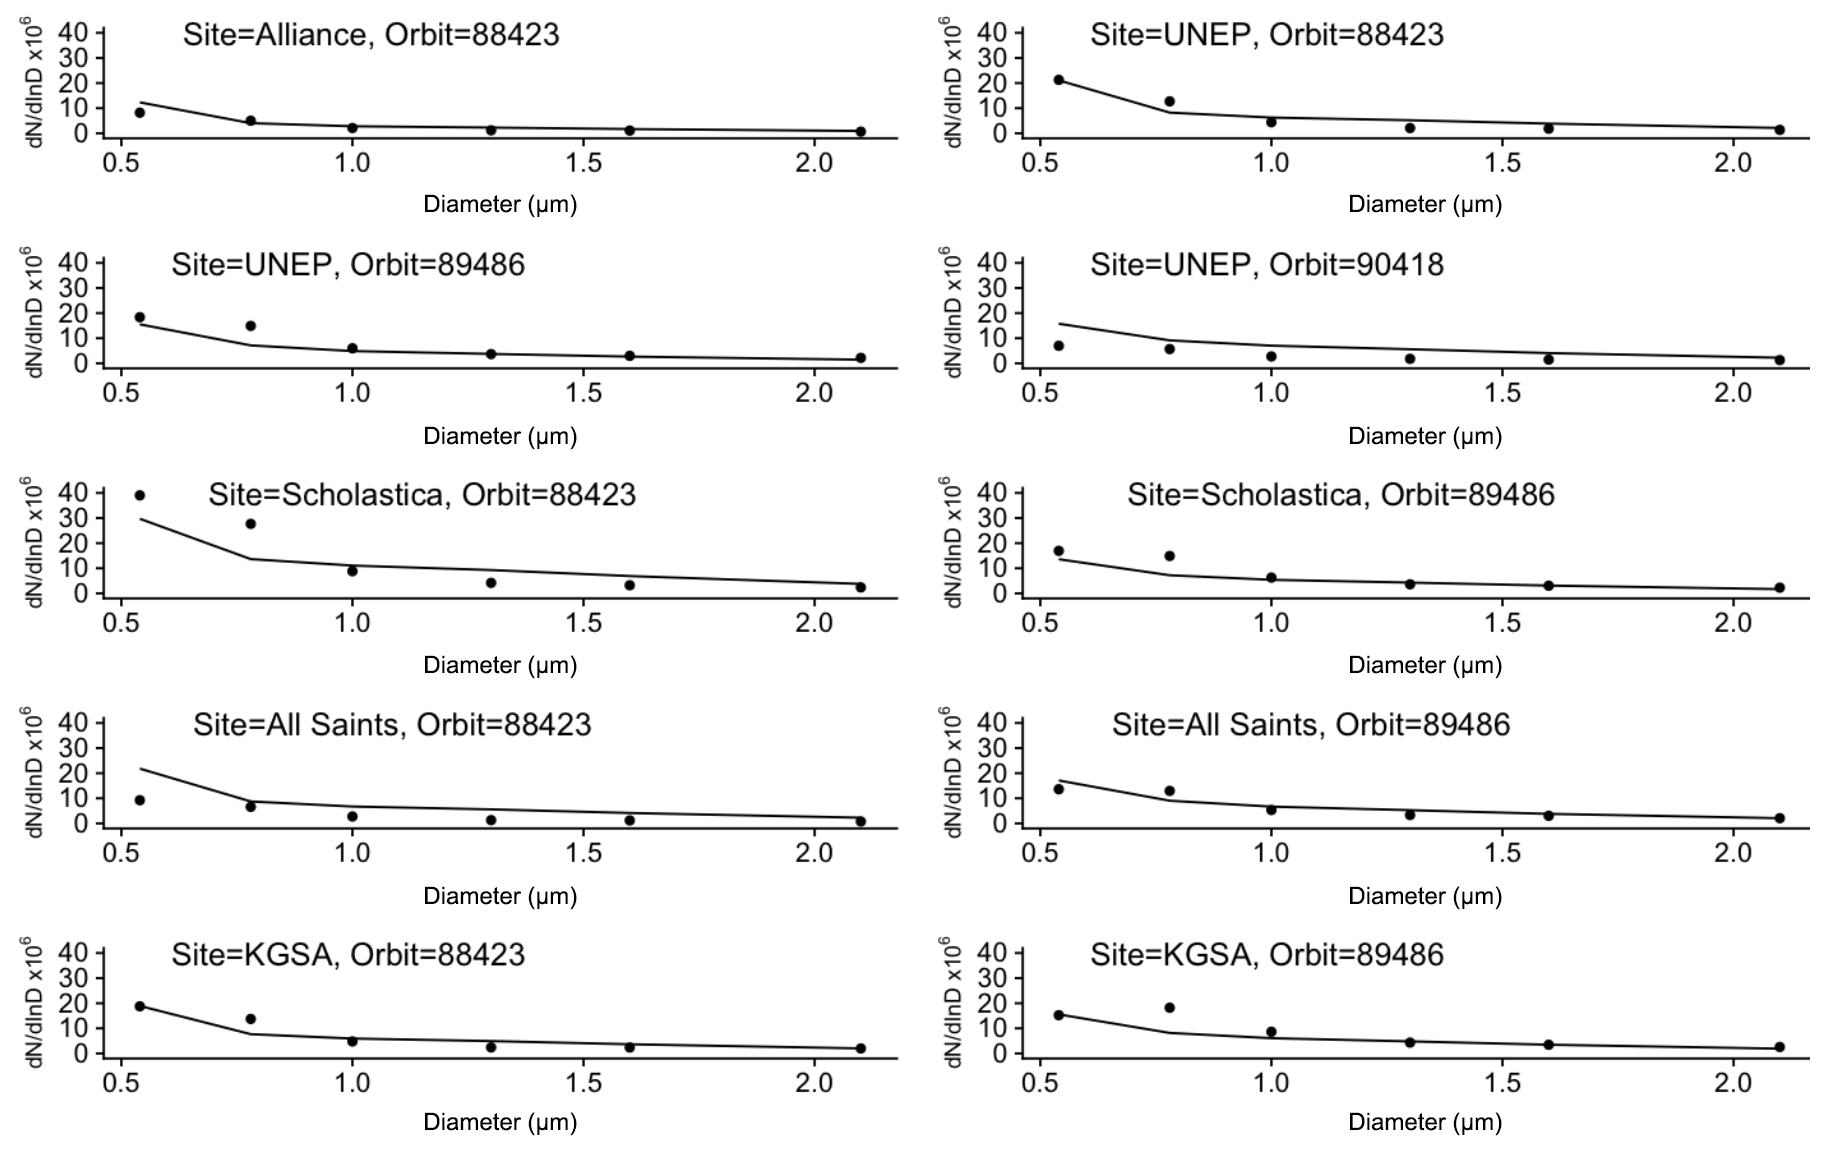
Figure 2Ground-based size distributions (number m−3) obtained from the low-cost air quality monitors, represented by points at the bin-center diameters (µm) for each of the OPC bins 2–7, and the corresponding size distribution derived from the 10 favorable MISR retrievals (represented by lines). The orbit number of the satellite observation is provided along with which ground-based monitor location with which the satellite pixel overlapped.
The results of regression analyses 1 and 2 are given in Table 2. Figure 2 shows the particle size distributions (dN∕dln D) from the air quality monitors obtained for all relevant ground-based observations, superimposed on the size distributions derived from the regression analysis results of Analysis 2. The derived size distributions from each instrument are quite well matched in nearly all cases, despite the assumptions involved. The Nairobi aerosol has a size distribution that is sampled by MISR. The large-end tail is sampled by the OPCs, and our method uses the region of size overlap to perform the particle size scaling. The results in Fig. 2 indicate that the two instruments are in fact sampling parts of the same particle size distribution. For Analysis 2, the adjusted R squared is 0.82.
4.1.2 Using scaled MAIAC retrievals (analyses 3, 4, and 5)
To increase satellite sampling, we repeated the regression analysis by scaling MAIAC AODs using the monthly effective MISR aerosol component AOD fractions (steps 2e and 2f). We have 1712 MAIAC AOD retrievals that fall within a radial distance of 1.6 km of a ground station. However, there are only 10 favorable MISR particle property retrievals, on three unique days. Using the MISR component AOD values to parse the MAIAC total AOD, even on a monthly basis, leaves 304 MAIAC retrievals on 20 unique days (Fig. S6 in the Supplement). Yet this provides about 30 times as much data as the MISR data alone.
Like Analysis 1, Analysis 3 includes all MISR aerosol components but was run using the scaled MAIAC dataset. We also ran analyses 4 and 5 with the MAIAC data – this time excluding MISR components 1 and 19. For Analysis 5, we further restricted the MAIAC retrievals to those with the total AOD ≥0.15 (85 MAIAC AODs) to ensure that near-surface aerosols dominate in this analysis. The adjusted R squared for Analysis 5 is 0.76. When we used MAIAC AODs at a radial distance of 1 and 0.5 km from each site (instead of 1.6 km), repeating Analysis 5 yielded adjusted R squared values of 0.77 in both cases. This suggests that our results are robust to the radius considered.
The results for the five analyses are given in Table 2. All the coefficients for the remaining aerosol groups included in analyses 2, 4 and 5 are positive and statistically significant (p value almost equal to or less than 0.05). Figure 3a shows PM2.5 from the ground-based OPCs (scaled by a factor of 4 for the sake of comparison) and the corresponding PM2.5 calculated from MISR (Step 3), using the results of Analysis 2. The MISR-derived and OPC PM tend to show similar peaks, with the exception of All Saints. Taking all points into consideration, the correlation between the two PM datasets is 0.56. The OPC at All Saints is situated in a particularly clean area, surrounded by hotspots of pollution due to informal settlements nearby. The average pollution in the coincident satellite grid cell is higher than that observed by the OPC at this particular site, likely caused by the difference in spatial sampling. When we drop measurement at All Saints from this analysis, the correlation between the derived PM2.5 from MISR and that of the OPC is 0.76 (Fig. 3b).
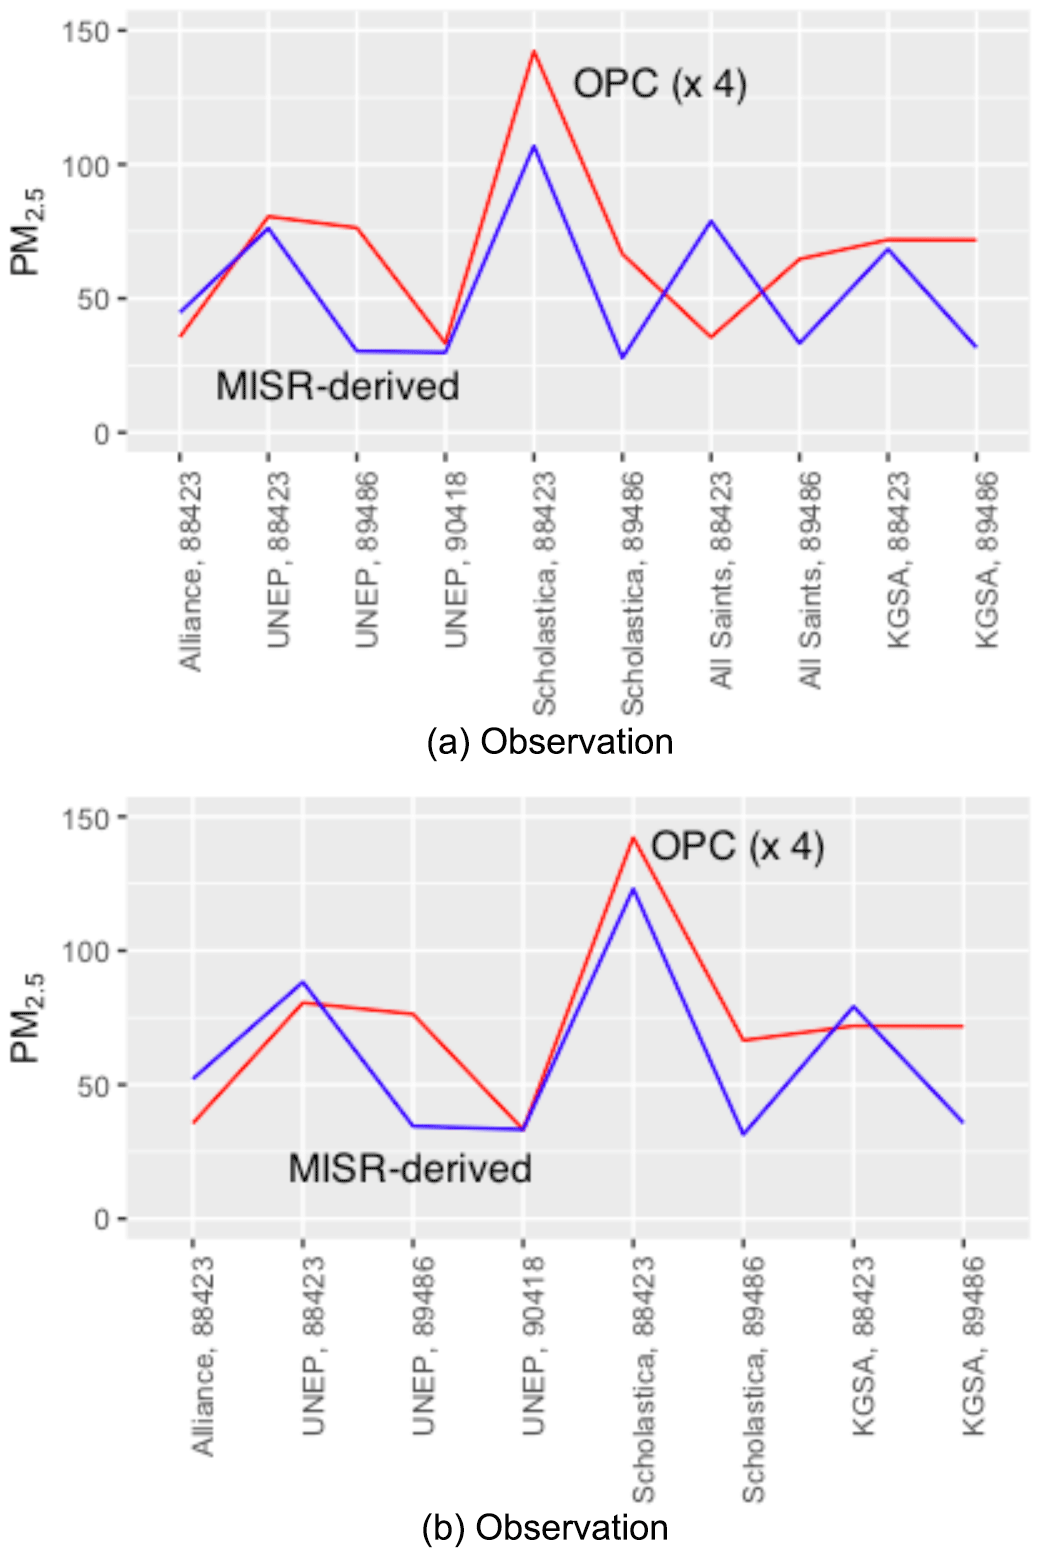
Figure 3(Red) PM2.5 (µg m−3) measured from the OPC-N2 (scaled up by a factor of 4 to compare with the PM derived from MISR) and (blue) PM2.5 calculated from coincident MISR observations for the (a) 10 cases where MISR AOD >0.15 (identified by the MISR orbit number and the coincident site name along the horizontal axis) and (b) coincident MISR observations at all sites but All Saints, using model coefficients from Analysis 2 in Table 2. The regression analysis yields a correlation of 0.56 for the data in panel (a), whereas the correlation is 0.76 for panel (b). A major factor contributing to the quantitative difference is probably the lack of OPC sensitivity to particles <0.54 µm in diameter.
Similarly, Fig. S7 in the Supplement displays the derived PM2.5 concentrations from MAIAC/MISR AOD estimates using coefficients from Analysis 5 and the corresponding surface PM2.5 from the OPCs. The correlation between the two PM values is 0.47. When we drop All Saints, the correlation increased to 0.48. However, the adjusted R squared is ∼0.8 when working directly with size distribution information (Step 2f) rather than the PM2.5 values due to the additional assumptions involved (Step 3).
The satellite-derived PM values are very high relative to the OPCs in nearly all cases. The dominant contributing factor is that a large fraction of aerosols in Nairobi are primary combustion aerosols with diameters <0.54 µm that MISR detects (Fig. S4 and Table S3) but that are not included in the OPC data due to a lack of sensitivity. In addition, any secondary aerosol formation from the many sources of gaseous precursors would produce small particles, and any underestimate in the particle density assumed in the OPC retrieval might also play a role. A further possible contributing factor, at least at one site (Kibera Girls Soccer Academy), is the frequent dominance of coarse-mode particles, which contribute to the total AOD observed by MISR. However, MISR does not retrieve specific size information for particles larger than about 2–3 µm (Sect. 2.2.1 above), so the MISR total AOD is ascribed to smaller-sized particles, where the retrieval is sensitive; this can inflate the number concentration of these particles. Given these issues, our method focuses on the size range over which both the OPC and MISR measurements are sensitive (Fig. 2). As most of the particles retrieved over the urban Nairobi region are components within the typical combustion-particle size distribution (see Sect. S1.2.1 in the Supplement), the method yields a high correlation despite the limitations of the data and actually uses the satellite data to account for smaller particles that the OPCs miss.
4.2 Assumptions and mitigating factors in the current analysis, with advice for future deployments
The data collected during the 2016–2017 Nairobi experiment are not ideal for the current application. However, there were also mitigating factors, which we summarize here, along with the lessons learned for the benefit of future deployments.
-
MISR sampling frequency. Generally low AOD over Nairobi, combined with the relatively narrow MISR swath width and low latitude of the target region, left just 10 cases meeting the criteria for good aerosol-type retrievals from MISR during the OPC surface-network deployment. As such, we were forced to assume that single or pairs of MISR particle-type retrievals in a given month represent the aerosol properties for the entire month. However, the observation that the MISR-retrieved particles varied little among the available observations (Fig. S3) and are typical of urban pollution from the local sources expected in Nairobi favors this approach. Selecting cases having midvisible AOD ≥0.15 also favors conditions where local sources dominate. The assumption is further supported by GEOS-Chem model aerosol-type simulations (Sect. 2.3 above, and Fig. S5). As AOD varies considerably more than aerosol type at the Nairobi site, we addressed that aspect of limited MISR sampling by using MISR monthly size-resolved information to scale the much more frequent MODIS-MAIAC AOD retrievals. In future experiments, sites typically experiencing higher AOD, preferably also at higher latitude, as well as longer deployments could greatly improve the MISR sampling statistics for this application.
-
Aerosol vertical distribution. We also use the GEOS-Chem AOD vertical distribution to obtain the near-surface component of the MISR total-column AOD and assume that MISR-retrieved total-column particle properties are dominated by near-surface particles in the study region. As expected, our analysis works best on days when the satellite-derived AOD was ≥0.15 and near-surface urban aerosols dominate the column (Fig. S5). The observation that the MISR-retrieved particles are typical of urban pollution from local sources in Nairobi (Table 1 and Sect. 1.2.1 in the Supplement) also favors this assumption. Further, dust is the most likely transported species, and it is distinguished from pollution particles in MISR retrievals based on large size and nonspherical shape. AOD is derived from satellite instruments under ambient RH conditions. If the particles were hygroscopic, however, they could adsorb water vapor and appear larger than they would be under dry conditions, which is how PM2.5 is usually assessed. Yet, the RH at the Nairobi site was generally low during the study period (Table S2), pollution particles are not very hygroscopic and the OPC measurements were also obtained at ambient RH (Sect. 2.1 above), all mitigating the RH issue. Unfortunately, there were no local lidar observations to validate the model vertical aerosol distribution, and neither the CALIPSO nor the CATS space-based lidars acquired data useful for this purpose, as discussed in Sect. S1.3 in the Supplement. In future deployments, a single, well-placed surface lidar in the region could test the assumptions about aerosol vertical distribution and determine whether any aerosol layers aloft contribute significantly to the satellite column-effective particle property retrievals.
-
OPC small-particle sampling. Pollution particles typically have diameters in the range 0.1–0.3 µm, and the pollution particles MISR retrieved had effective radii of 0.12 µm (effective diameter 0.24 µm). Yet, the Alphasense OPC-N2 instruments used in the current study do not register particles <0.38 µm in diameter, and the smallest size bin is noisy, effectively limiting the OPC size sensitivity to particles >0.54 µm. As such, particle size regressions in this study were performed over six size bins spanning 0.54–3 µm, capturing the range over which both satellite and surface instruments are sensitive. The small-particle-observation limitations represent a significant uncertainty in the results. However, the particle size comparisons shown in Fig. 2 demonstrate very good agreement over the six-bin range, and, further, we obtained ∼0.8R2 model fits for the aerosol size distribution formally, when considering either the MISR retrievals alone or the better-sampled MAIAC AODs parsed to the MISR component fractions. As MISR sensitivity extends to particles ∼0.1 µm, the satellite data help account for fine aerosols having diameters < 0.54 µm in our analysis. For future deployments where the dominant particle type is urban pollution, including surface instruments that have sensitivity to particles down to ∼0.1–0.2 µm in diameter would make the surface-station dataset substantially more robust. Further, at least one coincident, strategically located reference air quality monitor would make it possible to quantify retrieval sensitivity with greater confidence.
For many locations around the world, the alternative to deploying low-cost air quality monitors is having no ground-monitoring at all. Surface monitors are essential to help characterize the near-surface aerosol components within total-column satellite observations, but they offer only limited coverage, and the PM measurements from low-cost monitors in themselves are generally not well calibrated.
This paper develops and presents a novel method that moves away from the conventional approach of linking remotely sensed, total-column AOD from satellites with directly sampled particulate mass per volume of air from surface monitors. Instead, it combines satellite, component-specific AOD retrievals with particle counts from low-cost monitors to constrain the size distribution of surface aerosol and PM2.5. Retrieving some particle size information is possible with data from the space-based MISR instrument under favorable retrieval conditions. The MISR-retrieved particle effective cross-sectional area is linked with the size distribution of particulates as observed by the low-cost OPC-N2 observations. As far as we know, size-resolved particle counts have not previously been used to associate remote-sensing and direct-surface aerosol data, as most standard reference monitors provide particulate mass measurements and not particle counts partitioned by particle size.
We applied the method presented in Sect. 3 to data from a 2016–2017 10-month Nairobi experiment, due to the relative longevity of that data record. Limitations in the experiment design and implementation included relatively infrequent MISR sampling and low AOD, as well as the lack of a lidar or high-quality reference particle sampler in the field to validate assumptions about aerosol vertical distribution and satellite-retrieved small-particle surface concentration, respectively. However, the dominance of locally generated urban pollution particles concentrated near the surface, low relative humidity, and an effective approach for scaling more frequent MODIS data with the MISR-retrieved size distributions are mitigating factors. The method produced high correlations (∼0.8) between satellite-derived and surface-station-measured PM2.5, and, most importantly, the satellite data helped significantly to account for smaller particles that tend to dominate urban aerosol pollution but are below the detection size limit of the OPCs.
Our analysis also led to specific suggestions for performing future deployments with fewer assumptions, such as including at least one carefully sited, surface-based lidar and reference air quality monitor. Applying the technique under conditions more favorable for this approach could help assess air quality in rapidly urbanizing cities in developing countries, where pollution increases are having dramatic public health consequences and where monitoring is limited or entirely absent. We hope that, with the increasing focus on air quality (e.g., the expansion of the SPARTAN network, Weagle et al., 2018), broader application of low-cost monitoring can occur. Further, the planned MAIA instrument (expected launch year: 2022), like MISR, will be able to provide size-resolved information about aerosols from space for a subset of cities at higher temporal resolution (Diner et al., 2018). As such, it should better capture the variability in aerosol type, and the data can be incorporated into our methodology.
The tables contain all the data used in this analysis. The code is available on request.
The supplement related to this article is available online at: https://doi.org/10.5194/amt-13-5319-2020-supplement.
PdS had the original idea. PdS and RAK developed and conceptualized the methodology. RAK supervised this work. PdS was part of the team that deployed the Nairobi low-cost OPC-N2 network. JAL provided the MISR RA AOD estimates. EAM provided the GEOS-Chem results. PdS wrote the original manuscript. PdS carried out the analysis and wrote the code. RAK and PdS rewrote, edited and reviewed the manuscript. FD and CR were responsible for funding acquisition and reviewed and edited the manuscript.
The authors declare that they have no conflict of interest.
The authors gratefully acknowledge the United Nations Environment Program (UNEP) for piloting the low-cost air quality monitor deployment in Nairobi. In particular, many thanks go to Jacqueline McGlade, Sami Dimassi, Valentin Foltescu and Victor Nthusi. The authors thank Colette Heald and David Ridley for several useful discussions; Michael Garay for help with using the MISR Toolkit; John Yorks for help with interpreting the data from CATS; Jason Tackett, Ali Omar and David Winker for help with interpreting data from CALIPSO; and Dave Diner for inviting Priyanka deSouza to present an early version of this work at the 2016 MISR Science Team meeting. The work of Priyanka deSouza, Fábio Duarte and Carlo Ratti is supported by the MIT Senseable City Lab Consortium. The work of Ralph A. Kahn is supported in part by NASA's Climate and Radiation Research and Analysis Program under Hal Maring, as well as NASA's Atmospheric Composition Program under Richard Eckman.
This paper was edited by Daniel Perez-Ramirez and reviewed by three anonymous referees.
Al-Saadi, J., Szykman, J., Pierce, R. B., Kittaka, C., Neil, D., Chu, D. A., Remer, L., Gumley, L., Prins, E., Weinstock, L., MacDonald, C., Wayland, R., Dimmick, F., and Fishman, J.: Improving National Air Quality Forecasts with Satellite Aerosol Observations, B. Am. Meteorol. Soc., 86, 1249–1262, https://doi.org/10.1175/BAMS-86-9-1249, 2005.
Bond, T. C., Bhardwaj, E., Dong, R., Jogani, R., Jung, S., Roden, C., Streets, D. G., and Trautmann, N. M.: Historical emissions of black and organic carbon aerosol from energy-related combustion, 1850–2000, Global Biogeochem. Cy., 21, 2, https://doi.org/10.1029/2006GB002840, 2007.
Carotenuto, F., Brilli, L., Gioli, B., Gualtieri, G., Vagnoli, C., Mazzola, M., Viola, A. P., Vitale, V., Severi, M., Traversi, R., and Zaldei, A.: Long-Term Performance Assessment of Low-Cost Atmospheric Sensors in the Arctic Environment, Sensors, 20, 1919, https://doi.org/10.3390/s20071919, 2020.
Cavaliere, A., Carotenuto, F., Di Gennaro, F., Gioli, B., Gualtieri, G., Martelli, F., Matese, A., Toscano, P., Vagnoli, C., and Zaldei, A.: Development of Low-Cost Air Quality Stations for Next Generation Monitoring Networks: Calibration and Validation of PM2.5 and PM10 Sensors, Sensors, 18, 2843, https://doi.org/10.3390/s18092843, 2018.
deSouza, P.: Air pollution in Kenya: a review, Air Qual. Atmos. Hlth., 15, 1–9, https://doi.org/10.1007/s11869-020-00902-x, 2020.
deSouza, P., Nthusi, V., Klopp, J. M., Shaw, B. E., Ho, W. O., Saffell, J., Jones, R., and Ratti, C.: A Nairobi experiment in using low cost air quality monitors, Clean Air J. Tydskr. Vir Skoon Lug, 27, 12–42, 2017.
Diner, D. J., Beckert, J. C., Reilly, T. H., Bruegge, C. J., Conel, J. E., Kahn, R. A., Martonchik, J. V., Ackerman, T. P., Davies, R., Gerstl, S. A. W., Gordon, H. R., Muller, J.-P., Myneni, R. B., Sellers, P. J., Pinty, B., and Verstraete, M. M.: Multi-angle Imaging SpectroRadiometer (MISR) instrument description and experiment overview, IEEE T. Geosci. Remote, 36, 1072–1087, https://doi.org/10.1109/36.700992, 1998.
Diner, D. J., Boland, S. W., Brauer, M., Bruegge, C., Burke, K. A., Chipman, R., Di Girolamo, L., Garay, M. J., Hasheminassab, S., Hyer, E., Jerrett, M.: Advances in multiangle satellite remote sensing of speciated airborne particulate matter and association with adverse health effects: from MISR to MAIA, J. Appl. Remote Sens., 12, 042603, https://doi.org/10.1117/1.JRS.12.042603, 2018.
Diner, D. J., Braswell, B. H., Davies, R., Gobron, N., Hu, J., Jin, Y., Kahn, R. A., Knyazikhin, Y., Loeb, N., Muller, J.-P., Nolin, A. W., Pinty, B., Schaaf, C. B., Seiz, G., and Stroeve, J.: The value of multiangle measurements for retrieving structurally and radiatively consistent properties of clouds, aerosols, and surfaces, Remote Sens. Environ., 97, 495–518, https://doi.org/10.1016/j.rse.2005.06.006, 2005.
Duncan, B. N., Prados, A. I., Lamsal, L. N., Liu, Y., Streets, D. G., Gupta, P., Hilsenrath, E., Kahn, R. A., Nielsen, J. E., Beyersdorf, A. J., Burton, S. P., Fiore, A. M., Fishman, J., Henze, D. K., Hostetler, C. A., Krotkov, N. A., Lee, P., Lin, M., Pawson, S., Pfister, G., Pickering, K. E., Pierce, R. B., Yoshida, Y., and Ziemba, L. D.: Satellite data of atmospheric pollution for U.S. air quality applications: Examples of applications, summary of data end-user resources, answers to FAQs, and common mistakes to avoid, Atmos. Environ., 94, 647–662, https://doi.org/10.1016/j.atmosenv.2014.05.061, 2014.
Engel-Cox, J. A., Holloman, C. H., Coutant, B. W., and Hoff, R. M.: Qualitative and quantitative evaluation of MODIS satellite sensor data for regional and urban scale air quality, Atmos. Environ., 38, 2495–2509, https://doi.org/10.1016/j.atmosenv.2004.01.039, 2004.
Friberg, M. D., Kahn, R. A., Limbacher, J. A., Appel, K. W., and Mulholland, J. A.: Constraining chemical transport PM2.5 modeling outputs using surface monitor measurements and satellite retrievals: application over the San Joaquin Valley, Atmos. Chem. Phys., 18, 12891–12913, https://doi.org/10.5194/acp-18-12891-2018, 2018.
Gupta, P., Christopher, S. A., Wang, J., Gehrig, R., Lee, Y., and Kumar, N.: Satellite remote sensing of particulate matter and air quality assessment over global cities, Atmos. Environ., 40, 5880–5892, https://doi.org/10.1016/j.atmosenv.2006.03.016, 2006.
Hagan, D. H. and Kroll, J. H.: Assessing the accuracy of low-cost optical particle sensors using a physics-based approach, Atmos. Meas. Tech. Discuss., https://doi.org/10.5194/amt-2020-188, in review, 2020.
Hu, Z.: Spatial analysis of MODIS aerosol optical depth, PM2.5, and chronic coronary heart disease, Int. J. Health Geogr., 8, 27, https://doi.org/10.1186/1476-072X-8-27, 2009.
Kahn, R. A. and Gaitley, B. J.: An analysis of global aerosol type as retrieved by MISR, J. Geophys. Res.-Atmos., 120, 4248–4281, https://doi.org/10.1002/2015JD023322, 2015.
Kahn, R. A., Banerjee, P., and McDonald, D.: Sensitivity of multiangle imaging to natural mixtures of aerosols over ocean, J. Geophys. Res.-Atmos., 106, 18219–18238, https://doi.org/10.1029/2000JD900497, 2001.
Kahn, R. A., Gaitley, B. J., Garay, M. J., Diner, D. J., Eck, T. F., Smirnov, A., and Holben, B. N.: Multiangle Imaging SpectroRadiometer global aerosol product assessment by comparison with the Aerosol Robotic Network, J. Geophys. Res.-Atmos., 115, D23, https://doi.org/10.1029/2010JD014601, 2010.
Kumar, P., Morawska, L., Martani, C., Biskos, G., Neophytou, M., Di Sabatino, S., Bell, M., Norford, L., and Britter, R.: The rise of low-cost sensing for managing air pollution in cities, Environ. Int., 75, 199–205, https://doi.org/10.1016/j.envint.2014.11.019, 2015.
Lee, H. J., Liu, Y., Coull, B. A., Schwartz, J., and Koutrakis, P.: A novel calibration approach of MODIS AOD data to predict PM2.5 concentrations, Atmos. Chem. Phys., 11, 7991–8002, https://doi.org/10.5194/acp-11-7991-2011, 2011.
Levy, R. C., Mattoo, S., Munchak, L. A., Remer, L. A., Sayer, A. M., Patadia, F., and Hsu, N. C.: The Collection 6 MODIS aerosol products over land and ocean, Atmos. Meas. Tech., 6, 2989–3034, https://doi.org/10.5194/amt-6-2989-2013, 2013.
Lewis, A. and Edwards, P.: Validate personal air-pollution sensors, Nature, 535, 29–31, https://doi.org/10.1038/535029a, 2016.
Limbacher, J. A. and Kahn, R. A.: MISR research-aerosol-algorithm refinements for dark water retrievals, Atmos. Meas. Tech., 7, 3989–4007, https://doi.org/10.5194/amt-7-3989-2014, 2014.
Limbacher, J. A. and Kahn, R. A.: MISR empirical stray light corrections in high-contrast scenes, Atmos. Meas. Tech., 8, 2927–2943, https://doi.org/10.5194/amt-8-2927-2015, 2015.
Limbacher, J. A. and Kahn, R. A.: Updated MISR dark water research aerosol retrieval algorithm – Part 1: Coupled 1.1 km ocean surface chlorophyll a retrievals with empirical calibration corrections, Atmos. Meas. Tech., 10, 1539–1555, https://doi.org/10.5194/amt-10-1539-2017, 2017.
Limbacher, J. A. and Kahn, R. A.: Updated MISR over-water research aerosol retrieval algorithm – Part 2: A multi-angle aerosol retrieval algorithm for shallow, turbid, oligotrophic, and eutrophic waters, Atmos. Meas. Tech., 12, 675–689, https://doi.org/10.5194/amt-12-675-2019, 2019.
Liu, Y., Sarnat, J. A., Kilaru, V., Jacob, D. J., and Koutrakis, P.: Estimating Ground-Level PM2.5 in the Eastern United States Using Satellite Remote Sensing, Environ. Sci. Technol., 39, 3269–3278, https://doi.org/10.1021/es049352m, 2005.
Liu, Y., Koutrakis, P., and Kahn, R.: Estimating Fine Particulate Matter Component Concentrations and Size Distributions Using Satellite-Retrieved Fractional Aerosol Optical Depth: Part 1 – Method Development, J. Air Waste Manage., 57, 1351–1359, https://doi.org/10.3155/1047-3289.57.11.1351, 2007.
Lyapustin, A., Martonchik, J., Wang, Y., Laszlo, I., and Korkin, S.: Multiangle implementation of atmospheric correction (MAIAC): 1. Radiative transfer basis and look-up tables, J. Geophys. Res.-Atmos., 116, D03210, https://doi.org/10.1029/2010JD014985, 2011a.
Lyapustin, A., Wang, Y., Laszlo, I., Kahn, R., Korkin, S., Remer, L., Levy, R., and Reid, J.: Multiangle implementation of atmospheric correction (MAIAC): 2. Aerosol algorithm, J. Geophys. Res.-Atmos., 116, D03210, https://doi.org/10.1029/2010JD014985, 2011b.
Lyapustin, A. I., Wang, Y., Laszlo, I., Hilker, T., Hall, F. G., Sellers, P. J., Tucker, C. J., and Korkin, S. V.: Multi-angle implementation of atmospheric correction for MODIS (MAIAC): 3. Atmospheric correction, Remote Sens. Environ., 127, 385–393, https://doi.org/10.1016/j.rse.2012.09.002, 2012.
Mao, J., Ren, X., Chen, S., Brune, W. H., Chen, Z., Martinez, M., Harder, H., Lefer, B., Rappenglück, B., Flynn, J., and Leuchner, M.: Atmospheric oxidation capacity in the summer of Houston 2006: Comparison with summer measurements in other metropolitan studies, Atmos. Environ., 44, 4107–4115, https://doi.org/10.1016/j.atmosenv.2009.01.013, 2010.
Mao, J., Paulot, F., Jacob, D. J., Cohen, R. C., Crounse, J. D., Wennberg, P. O., Keller, C. A., Hudman, R. C., Barkley, M. P., and Horowitz, L. W.: Ozone and organic nitrates over the eastern United States: Sensitivity to isoprene chemistry, J. Geophys. Res.-Atmos., 118, 11256–11268, https://doi.org/10.1002/jgrd.50817, 2013.
Marais, E. A. and Wiedinmyer, C.: Air Quality Impact of Diffuse and Inefficient Combustion Emissions in Africa (DICE-Africa), Environ. Sci. Technol., 50, 10739–10745, https://doi.org/10.1021/acs.est.6b02602, 2016.
Martin, R. V.: Satellite remote sensing of surface air quality, Atmos. Environ., 42, 7823–7843, https://doi.org/10.1016/j.atmosenv.2008.07.018, 2008.
Martonchik, J. V., Kahn, R. A., and Diner, D. J.: Retrieval of aerosol properties over land using MISR observations, in Satellite Aerosol Remote Sensing over Land, edited by: Kokhanovsky, A. A. and de Leeuw, G., Springer, Berlin, Heidelberg, Germany, 267–293, 2009.
Mead, M. I., Popoola, O. A. M., Stewart, G. B., Landshoff, P., Calleja, M., Hayes, M., Baldovi, J. J., McLeod, M. W., Hodgson, T. F., Dicks, J., Lewis, A., Cohen, J., Baron, R., Saffell, J. R., and Jones, R. L.: The use of electrochemical sensors for monitoring urban air quality in low-cost, high-density networks, Atmos. Environ., 70, 186–203, https://doi.org/10.1016/j.atmosenv.2012.11.060, 2013.
Morawska, L., Thai, P. K., Liu, X., Asumadu-Sakyi, A., Ayoko, G., Bartonova, A., Bedini, A., Chai, F., Christensen, B., Dunbabin, M., Gao, J., Hagler, G. S. W., Jayaratne, R., Kumar, P., Lau, A. K. H., Louie, P. K. K., Mazaheri, M., Ning, Z., Motta, N., Mullins, B., Rahman, M. M., Ristovski, Z., Shafiei, M., Tjondronegoro, D., Westerdahl, D., and Williams, R.: Applications of low-cost sensing technologies for air quality monitoring and exposure assessment: How far have they gone?, Environ. Int., 116, 286–299, https://doi.org/10.1016/j.envint.2018.04.018, 2018.
Patadia, F., Kahn, R. A., Limbacher, J. A., Burton, S. P., Ferrare, R. A., Hostetler, C. A., and Hair, J. W.: Aerosol airmass type mapping over the Urban Mexico City region from space-based multi-angle imaging, Atmos. Chem. Phys., 13, 9525–9541, https://doi.org/10.5194/acp-13-9525-2013, 2013.
Petkova, E. P., Jack, D. W., Volavka-Close, N. H., and Kinney, P. L.: Particulate matter pollution in African cities, Air Qual. Atmos. Hlth., 6, 603–614, https://doi.org/10.1007/s11869-013-0199-6, 2013.
Remer, L. A., Kaufman, Y. J., Tanré, D., Mattoo, S., Chu, D. A., Martins, J. V., Li, R.-R., Ichoku, C., Levy, R. C., Kleidman, R. G., Eck, T. F., Vermote, E., and Holben, B. N.: The MODIS Aerosol Algorithm, Products, and Validation, J. Atmos. Sci., 62, 947–973, https://doi.org/10.1175/JAS3385.1, 2005.
Snider, G., Weagle, C. L., Murdymootoo, K. K., Ring, A., Ritchie, Y., Stone, E., Walsh, A., Akoshile, C., Anh, N. X., Balasubramanian, R., Brook, J., Qonitan, F. D., Dong, J., Griffith, D., He, K., Holben, B. N., Kahn, R., Lagrosas, N., Lestari, P., Ma, Z., Misra, A., Norford, L. K., Quel, E. J., Salam, A., Schichtel, B., Segev, L., Tripathi, S., Wang, C., Yu, C., Zhang, Q., Zhang, Y., Brauer, M., Cohen, A., Gibson, M. D., Liu, Y., Martins, J. V., Rudich, Y., and Martin, R. V.: Variation in global chemical composition of PM2.5: emerging results from SPARTAN, Atmos. Chem. Phys., 16, 9629–9653, https://doi.org/10.5194/acp-16-9629-2016, 2016.
Sousan, S., Koehler, K., Hallett, L., and Peters, T. M.: Evaluation of the Alphasense optical particle counter (OPC-N2) and the Grimm portable aerosol spectrometer (PAS-1.108), Aerosol Sci. Tech., 50, 1352–1365, https://doi.org/10.1080/02786826.2016.1232859, 2016.
Tai, A. P. K., Mickley, L. J., and Jacob, D. J.: Correlations between fine particulate matter (PM2.5) and meteorological variables in the United States: Implications for the sensitivity of PM2.5 to climate change, Atmos. Environ., 44, 3976–3984, https://doi.org/10.1016/j.atmosenv.2010.06.060, 2010.
US EPA: Evaluation of Emerging Air Sensor Performance, US EPA, available at: https://www.epa.gov/air-sensor-toolbox/evaluation-emerging-air-sensor-performance (last access: 16 August 2020), 2016.
van der Werf, G. R., Randerson, J. T., Giglio, L., Collatz, G. J., Mu, M., Kasibhatla, P. S., Morton, D. C., DeFries, R. S., Jin, Y., and van Leeuwen, T. T.: Global fire emissions and the contribution of deforestation, savanna, forest, agricultural, and peat fires (1997–2009), Atmos. Chem. Phys., 10, 11707–11735, https://doi.org/10.5194/acp-10-11707-2010, 2010.
Van Donkelaar, A., Martin, R. V., Brauer, M., Kahn, R., Levy, R., Verduzco, C., and Villeneuve, P. J.: Global Estimates of Ambient Fine Particulate Matter Concentrations from Satellite-Based Aerosol Optical Depth: Development and Application, Environ. Health Perspect., 118, 847–855, https://doi.org/10.1289/ehp.0901623, 2010.
Wang, J. and Christopher, S.A.: Intercomparison between satellite‐derived aerosol optical thickness and PM2.5 mass: Implications for air quality studies, Geophys. Res. Lett., 30, 2095, https://doi.org/10.1029/2003GL018174, 2003.
Weagle, C. L., Snider, G., Li, C., van Donkelaar, A., Philip, S., Bissonnette, P., Burke, J., Jackson, J., Latimer, R., Stone, E., Abboud, I., Akoshile, C., Anh, N. X., Brook, J. R., Cohen, A., Dong, J., Gibson, M. D., Griffith, D., He, K. B., Holben, B. N., Kahn, R., Keller, C. A., Kim, J. S., Lagrosas, N., Lestari, P., Khian, Y. L., Liu, Y., Marais, E. A., Martins, J. V., Misra, A., Muliane, U., Pratiwi, R., Quel, E. J., Salam, A., Segev, L., Tripathi, S. N., Wang, C., Zhang, Q., Brauer, M., Rudich, Y., and Martin, R. V.: Global Sources of Fine Particulate Matter: Interpretation of PM2.5 Chemical Composition Observed by SPARTAN using a Global Chemical Transport Model, Environ. Sci. Technol., 52, 11670–11681, https://doi.org/10.1021/acs.est.8b01658, 2018.
Zhang, H., Hoff ,R. M., and Engel-Cox, J. A.: The relation between Moderate Resolution Imaging Spectroradiometer (MODIS) aerosol optical depth and PM2.5 over the United States: a geographical comparison by US Environmental Protection Agency regions, J. Air Waste Manage., 59, 1358–1369, https://doi.org/10.3155/1047-3289.59.11.1358, 2009.