the Creative Commons Attribution 4.0 License.
the Creative Commons Attribution 4.0 License.
 | 19 Nov 2020
Interferences with aerosol acidity quantification due to gas-phase ammonia uptake onto acidic sulfate filter samples
Benjamin A. Nault
Pedro Campuzano-Jost
Douglas A. Day
Hongyu Guo
Duseong S. Jo
Anne V. Handschy
Demetrios Pagonis
Jason C. Schroder
Melinda K. Schueneman
Michael J. Cubison
Jack E. Dibb
Alma Hodzic
Weiwei Hu
Brett B. Palm
Jose L. Jimenez
Measurements of the mass concentration and chemical speciation of aerosols are important to investigate their chemical and physical processing from near emission sources to the most remote regions of the atmosphere. A common method to analyze aerosols is to collect them onto filters and analyze the filters offline; however, biases in some chemical components are possible due to changes in the accumulated particles during the handling of the samples. Any biases would impact the measured chemical composition, which in turn affects our understanding of numerous physicochemical processes and aerosol radiative properties. We show, using filters collected onboard the NASA DC-8 and NSF C-130 during six different aircraft campaigns, a consistent, substantial difference in ammonium mass concentration and ammonium-to-anion ratios when comparing the aerosols collected on filters versus an Aerodyne aerosol mass spectrometer (AMS). Another online measurement is consistent with the AMS in showing that the aerosol has lower ammonium-to-anion ratios than obtained by the filters. Using a gas uptake model with literature values for accommodation coefficients, we show that for ambient ammonia mixing ratios greater than 10 ppbv, the timescale for ammonia reacting with acidic aerosol on filter substrates is less than 30 s (typical filter handling time in the aircraft) for typical aerosol volume distributions. Measurements of gas-phase ammonia inside the cabin of the DC-8 show ammonia mixing ratios of 45±20 ppbv, consistent with mixing ratios observed in other indoor environments. This analysis enables guidelines for filter handling to reduce ammonia uptake. Finally, a more meaningful limit of detection for University of New Hampshire Soluble Acidic Gases and Aerosol (SAGA) filters collected during airborne campaigns is ∼0.2 µg sm−3 of ammonium, which is substantially higher than the limit of detection of ion chromatography. A similar analysis should be conducted for filters that collect inorganic aerosol and do not have ammonia scrubbers and/or are handled in the presence of human ammonia emissions.
- Article
(2512 KB) - Full-text XML
-
Supplement
(2492 KB) - BibTeX
- EndNote


Particulate matter (PM), or aerosol, impacts human health, ecosystem health, visibility, climate, cloud formation and lifetime, and atmospheric chemistry (Meskhidze et al., 2003; Abbatt et al., 2006; Seinfeld and Pandis, 2006; Jimenez et al., 2009; Myhre et al., 2013; Cohen et al., 2017; Hodzic and Duvel, 2018; Heald and Kroll, 2020; Pye et al., 2020). Quantitative measurements of chemical composition and aerosol mass concentration are necessary to understand these impacts and to constrain and improve chemical transport models (CTMs). The inorganic portion of aerosol, which includes both volatile (e.g., nitrate, ammonium) and nonvolatile (e.g., calcium, sodium) species, controls many of these impacts through the regulation of charge balance, aerosol pH, and aerosol liquid water concentration (Guo et al., 2015, 2018; Hennigan et al., 2015; Nguyen et al., 2016; Pye et al., 2020). Further, the inorganic portion of aerosol is an important fraction of the aerosol budget, both in polluted cities (e.g., Jimenez et al., 2009; Song et al., 2018) and remote regions (e.g., Hodzic et al., 2020), and the chemistry controlling the inorganic portion of aerosol is still not well known (e.g., Liu et al., 2020).
There are numerous methods to quantify inorganic aerosol composition and mass concentration, including by mass spectrometry (DeCarlo et al., 2006; Canagaratna et al., 2007; Pratt and Prather, 2010; Froyd et al., 2019), online ion chromatography (Talbot et al., 1997; Weber et al., 2001; Nie et al., 2010), and collection onto filters to be extracted and measured offline by ion chromatography (Malm et al., 1994; Dibb et al., 2002, 2003; Coury and Dillner, 2009; Watson et al., 2009). Each method has different advantages and disadvantages (e.g., time resolution, sample preparation, range of species identified, cost, and personnel needs). These results, in turn, have been used to inform and improve the results of CTMs, influencing our understanding of processes such as the direct radiative effect (Wang et al., 2008b), transport of ammonia in deep convection (Ge et al., 2018), aerosol pH (Pye et al., 2020; Zakoura et al., 2020) and subsequent chemistry, and precursor emissions (Henze et al., 2009; Heald et al., 2012; Walker et al., 2012; Mezuman et al., 2016).
Filter measurements have been shown to be most prone to artifacts during sample collection, handling, storage of the filter, and extraction of the aerosol from the filter prior to analysis. These artifacts include evaporation of volatile compounds such as organics (Watson et al., 2009; Chow et al., 2010; Cheng and He, 2015) and ammonium nitrate (Hering and Cass, 1999; Chow et al., 2005; Nie et al., 2010; Liu et al., 2014, 2015; Heim et al., 2020), as well as chemical reactions of gas-phase species with the accumulated particles (e.g., Schauer et al., 2003; Dzepina et al., 2007). Further, early research indicated potential artifacts from gas-phase ammonia uptake onto acidic aerosol collected onto filters, leading to a positive bias for particulate ammonium (Klockow et al., 1979; Hayes et al., 1980; Koutrakis et al., 1988). This led to debates about whether aerosol in the lower stratosphere was sulfuric acid or ammonium sulfate (Hayes et al., 1980); however, after improved filter handling practices and online measurements (i.e., mass spectrometry), it has been generally well accepted that the sulfate in the stratosphere is mainly sulfuric acid (Murphy et al., 2014).
This artifact may impact aerosols collected in remote locations (e.g., the lower stratosphere, but also the free troposphere over the Pacific Ocean basin). Comparisons for a major cation, ammonium, in a similar location (middle of the Pacific Ocean) have shown very different results (Dibb et al., 2003; Paulot et al., 2015). This, in turn, affects the observed charge balance of anions (sulfate and nitrate) with ammonium, which can indicate a different aerosol phase state (Colberg et al., 2003; Wang et al., 2008a) and aerosol pH (Pye et al., 2020), leading to potentially important chemical and physical differences between the real state of the particles and that concluded from the measurements. An example of the differences in the observed charge balance of ammonium to sulfate for different studies of the same remote Pacific Ocean region is highlighted in Fig. 1. This difference leads to the inorganic portion of aerosol potentially being solid (filters) and hence acting as good ice-nucleating particles (Abbatt et al., 2006), versus it being liquid (online measurements), leading to important differences in the calculated radiative balance. It should be noted that other measurements (both filter and online) in a similar location from another study (bar at the surface; Paulot et al., 2015) are more in line with the online observations. A large decrease in the ambient ammonia mixing ratio is required to change from ammonium-sulfate-like aerosols to sulfuric-acid-like aerosols between the years, contradictory to the increasing trends of ammonia globally (Warner et al., 2016, 2017; Weber et al., 2016; Liu et al., 2019; Tao and Murphy, 2019). Further, oceanic emissions of ammonia are not high enough to lead to full charge neutralization of sulfate, since these emissions are approximately an order of magnitude less than those of sulfate precursors (Faloona, 2009; Paulot et al., 2015). A debate about the acidity and potential impact of ammonia uptake artifacts on acidic filters for remote locations has not occurred as it did for stratospheric observations.
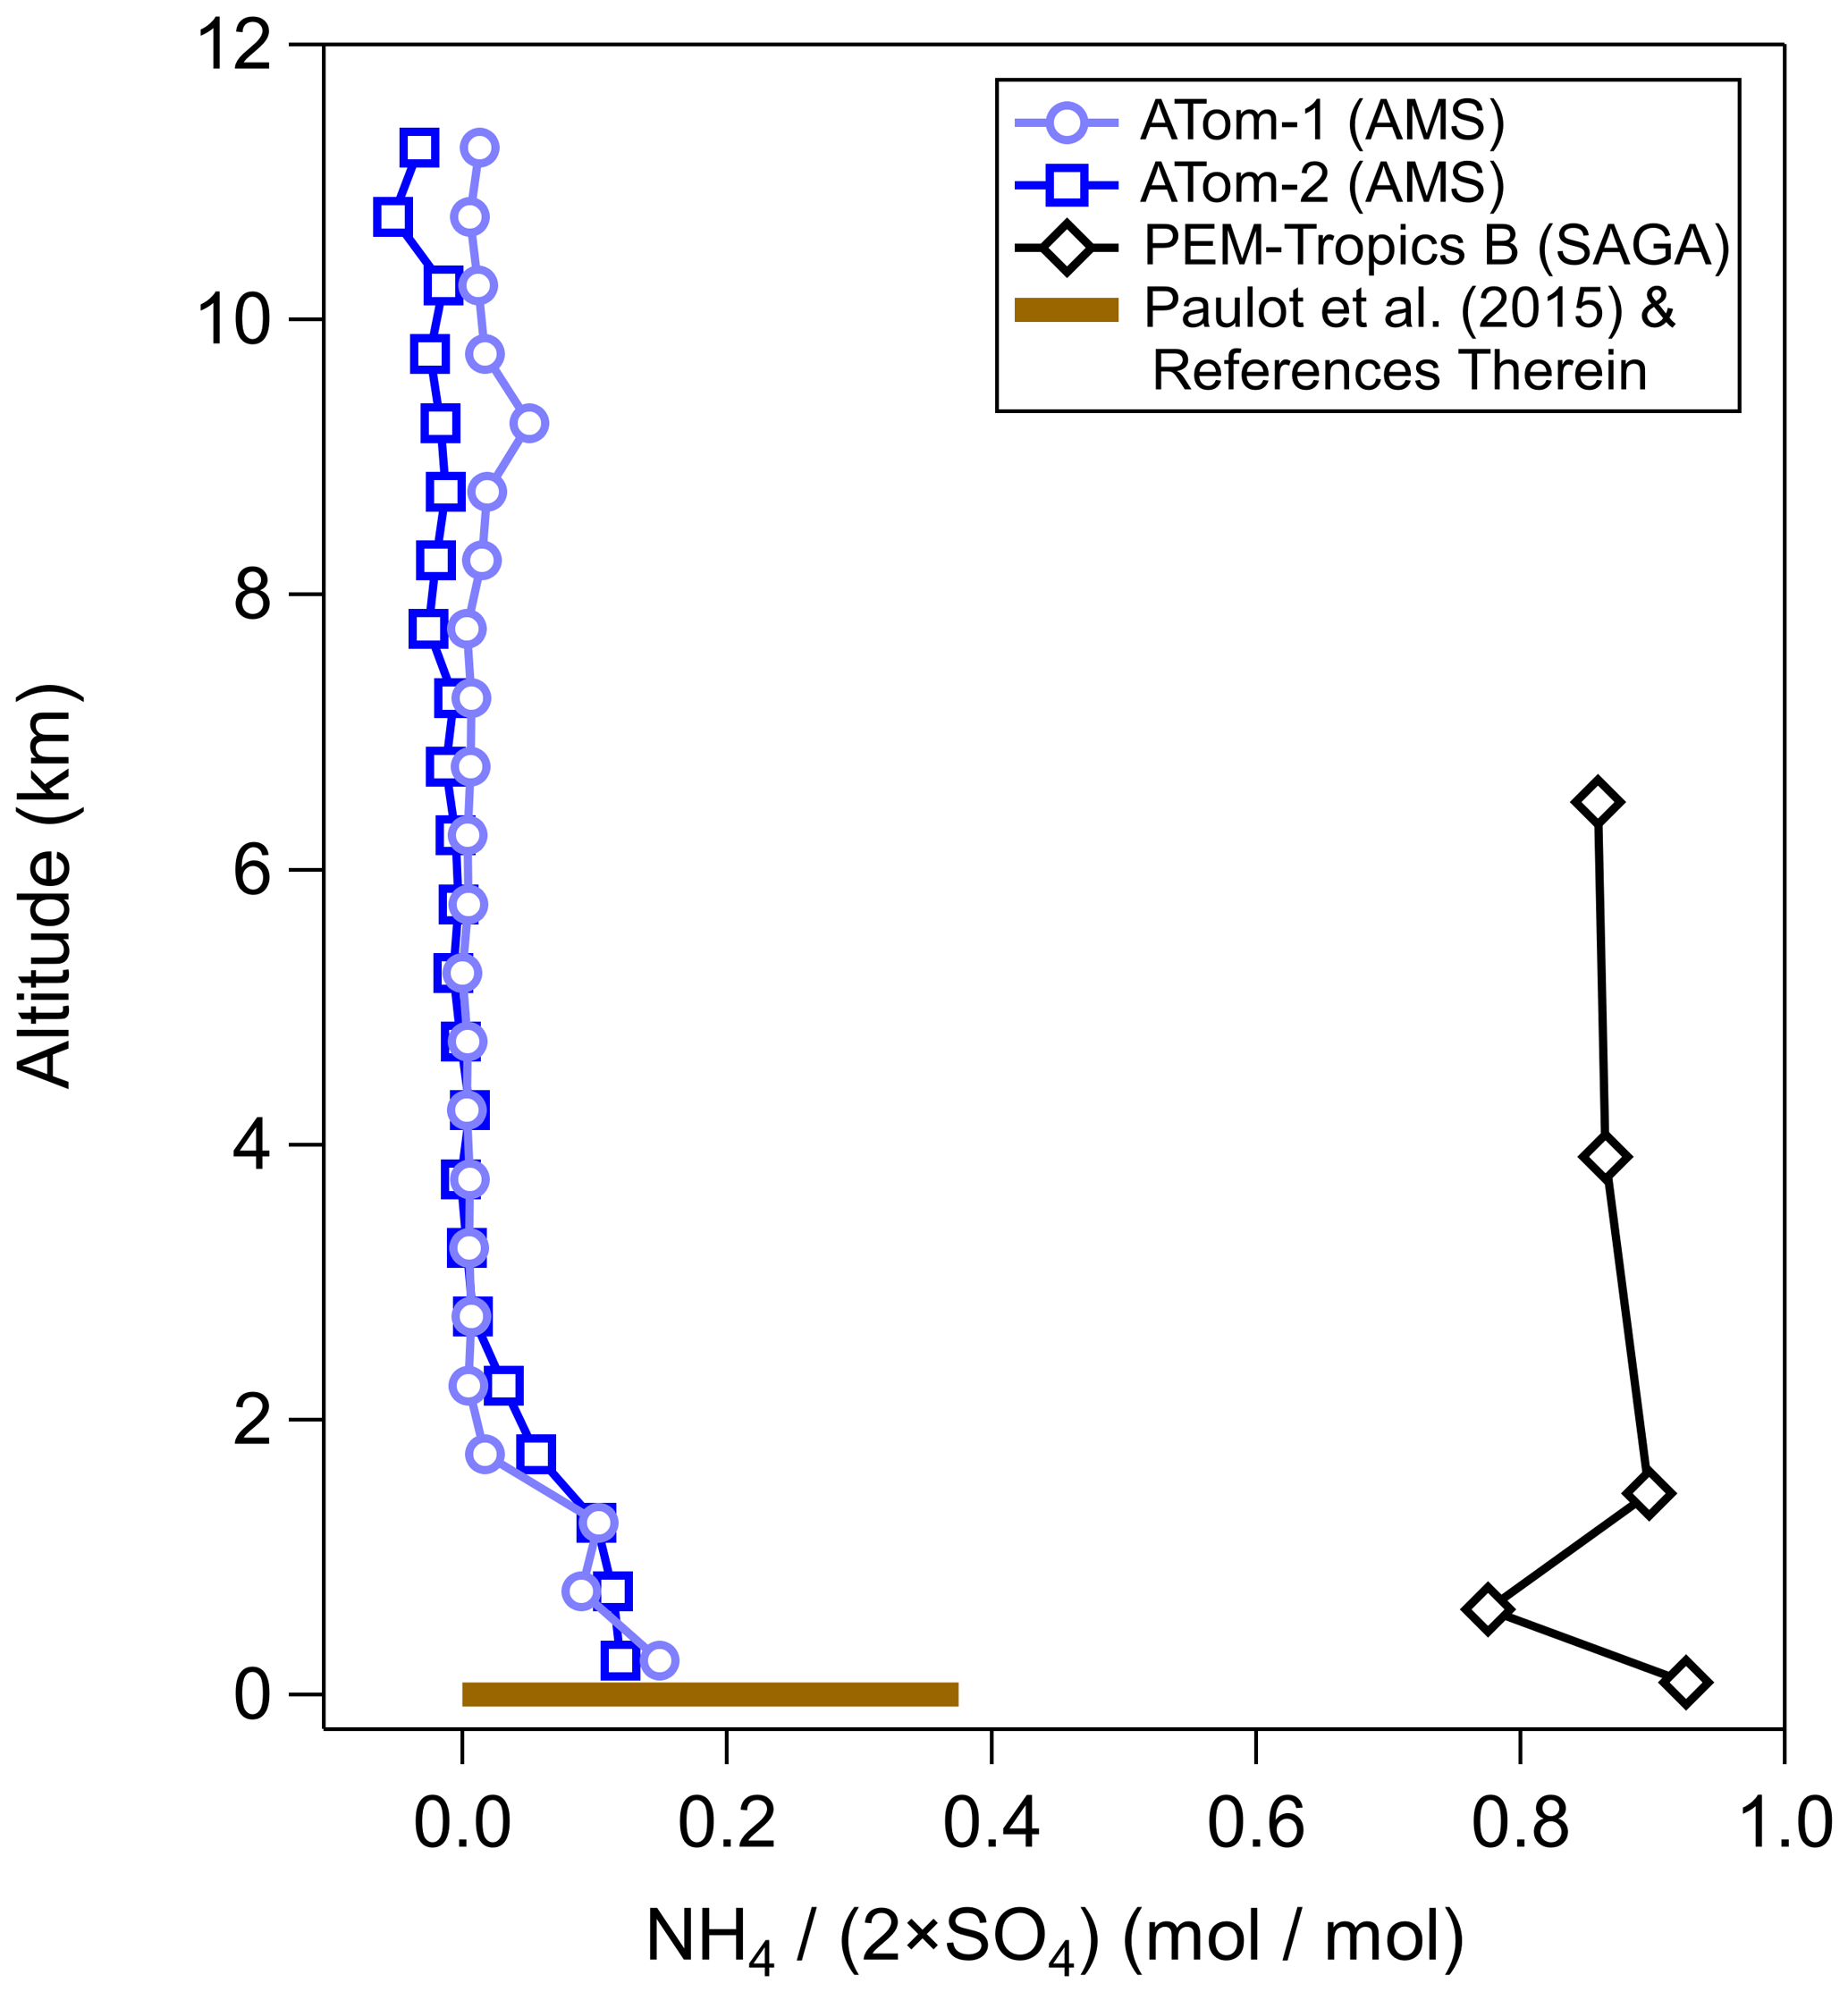
Figure 1Vertical profile of sulfate-only ion molar balance (moles(NH4) ∕ moles(SO4)) measured during PEM-Tropics by collecting aerosol on filters and analyzing it offline with ion chromatography (Dibb et al., 2002) and during ATom-1 and ATom-2 by AMS (Hodzic et al., 2020). The ammonium balance profile is for observations collected during ATom-1 and ATom-2 between −20∘ S and 20∘ N in the Pacific basin, so the observations were in a similar location as the PEM-Tropics samples. Also shown is the ammonium balance from observations summarized in Paulot et al. (2015), and references therein, for the area around the same location as PEM-Tropics.
Previous laboratory studies have suggested that exposure of acidic aerosol, both suspended in air in a flow tube and on a filter, to gas-phase ammonia will lead to the formation of ammonium salts in a short time (≤10 s) (Klockow et al., 1979; Huntzicker et al., 1980); however, it has not been investigated if this time frame applies for acidic aerosol collected on filters handled in a typical indoor environment. Though human emissions of ammonia are variable and depend on various factors (e.g., temperature, clothing) (Li et al., 2020), emissions of ammonia, specifically from perspiration but also from breath, can lead to high accumulated mixing ratios of ammonia indoors (e.g., Ampollini et al., 2019; Finewax et al., 2020, and references therein) depending on the ventilation rate. The mixing ratios of ammonia can be a factor of 2 to 2000 higher indoors versus outdoors. This higher mixing ratio of ammonia leads to similarly high mixing ratios used in prior studies, leading to partially to fully neutralized sulfuric acid (Klockow et al., 1979; Huntzicker et al., 1980; Daumer et al., 1992; Liggio et al., 2011).
Here, we investigate whether previous laboratory observations of ammonium uptake to acidic particulate lead to the large differences in ammonium, both in mass concentration and in ammonium-to-sulfate ratios or ammonium-to-anion ratios, between in situ measurements and offline filter measurements during five NASA airborne campaigns and one NSF airborne campaign that sampled air over remote continental and oceanic regions. An uptake model for gas-phase ammonia interacting with acidic PM on a filter along with constraints from observations of gas-phase ammonia in the cabin of the airplane are used to further probe the reason behind the differences between the in situ and offline measurements of ammonium. The results provide insight into how to interpret prior aircraft measurements and other filter-based measurements for which the filters are handled in environments (i.e., indoors) where rapid uptake of ammonia to acidic PM will occur.
2.1 Aircraft campaigns
Five different NASA aircraft campaigns onboard the DC-8 research aircraft and one NSF aircraft campaign onboard the C-130 research aircraft are used in this study. As described below, though the campaigns were sampling ambient (outside) air in various locations around the world, the filters were handled and exposed to both aircraft cabin air and temporary indoor laboratory air, where between 20 and 40 people were operating instruments. The campaigns include the Arctic Research of the Composition of the Troposphere from Aircraft and Satellites (ARCTAS-A, April 2008; ARCTAS-B, June–July 2008) campaigns (Jacob et al., 2010), the Studies of Emissions and Atmospheric Composition, Clouds, and Climate Coupling by Regional Surveys (SEAC4RS, August–September 2013) campaign (Toon et al., 2016), the Wintertime INvestigation of Transport, Emissions, and Reactivity (WINTER, February–March 2015) (Schroder et al., 2018), and the Atmospheric Tomography (ATom-1, July–August 2016; ATom-2, January–February 2017) campaigns (Hodzic et al., 2020). ARCTAS-A was based in Fairbanks (Alaska), Thule (Greenland), and Iqaluit (Nunavut) and sampled the Arctic Ocean and Arctic regions of Alaska, Canada, and Greenland, while ARCTAS-B was based in Cold Lake, Alberta, Canada, and sampled the boreal Canadian forest, including wildfire smoke. SEAC4RS was based in Houston, Texas, and sampled biomass burning from western forest fires and agricultural burns along the Mississippi River and the southern United States, isoprene chemistry over the southern United States and midwestern deciduous forests, and deep convection associated with isolated thunderstorms, the North American monsoon, and tropical depressions. WINTER was based in Langley, Virginia, and sampled urban, power plant, and continental background chemistry during daytime and nighttime winter chemistry. Finally, ATom-1 and ATom-2 sampled the remote atmosphere over the Arctic, Pacific, Southern, and Atlantic oceans during the Northern (Southern) Hemisphere summer (winter) and winter (summer).
For ARCTAS-A, ARCTAS-B, SEAC4RS, and WINTER the general sampling scheme was regional, sampling large regions at level flight tracks. ATom-1 and ATom-2, being global in nature, only sampled at level legs for short durations (5–15 min) at low (∼300 m) and high (10–12 km) altitude and did not measure at level altitudes between the low and high altitude. Due to the sampling time of the filters (see Sect. 2.2.2), the entirety of the ascent and descent time was needed for one filter sample. Therefore, all data during the ascents and descents have not been considered in this study to minimize any issues due to the mixing of aerosols of different compositions and acidities.
2.2 Aerosol measurements
2.2.1 Aerosol mass spectrometer
An Aerodyne high-resolution time-of-flight aerosol mass spectrometer, flown by the University of Colorado, Boulder (CU for short), was flown during the six campaigns used here. The general features of the AMS have been described in prior studies (DeCarlo et al., 2006; Canagaratna et al., 2007), and the specifics of the CU AMS for each campaign have been described elsewhere (Cubison et al., 2011; Liu et al., 2017; Nault et al., 2018; Schroder et al., 2018; Guo et al., 2020; Hodzic et al., 2020). In brief, the AMS measured the mass concentration of non-refractory species in PM1 (PM with an aerodynamic diameter less than 1 µm; see Guo et al., 2020 for details). Ambient air was sampled by drawing air through an NCAR High-Performance Instrumental Platform for Environmental Modular Inlet (HIMIL; Stith et al., 2009) at a constant standard flow rate of 9 L min−1 (T=273.15 K and P=1013 hPa). The best estimated upper size cutoff for the HIMIL inlet is ∼1 µm diameter (geometric, David Rogers, personal communication, 2011). This diameter is larger than the size cutoff of the AMS inlet (∼0.5–0.7 µm diameter, geometric, depending on the composition), with no losses in the tubing between the HIMIL and AMS inlet expected (see Guo et al., 2020, for more details). Multiple comparisons with instruments sampling from an isokinetic inlet PM4 inlet (Brock et al., 2019; Guo et al., 2020) indicate that no significant sampling biases were incurred over the size range of the AMS. No active drying of the sampling flow was used to minimize artifacts for semi-volatile species, but the temperature differential between ambient and cabin air typically ensured a relative humidity (RH) inside the sampling line less than 40 % (e.g., Nault et al., 2018). An exception to this was during ATom-1 and ATom-2, during which the cabin temperature, along with the high RH in tropics, led to higher RH in the sample lines in a few instances in the boundary layer, which was accounted for in the final mass concentrations (Guo et al., 2020). To minimize any potential losses of volatile aerosol components, the residence time between the inlet and AMS was less than 1 s (Nault et al., 2018; Schroder et al., 2018; Guo et al., 2020). Prior studies (Guo et al., 2016; Shingler et al., 2016) have shown minimal loss of semivolatile components for this residence time.
The air sample was introduced into the AMS via an aerodynamic focusing lens (Zhang et al., 2002, 2004), which was operated at 2.00 hPa (1.50 Torr) via a pressure-controlled inlet operated at various pressures (94–325 Torr) (Bahreini et al., 2008), depending on the ceiling of the campaign and lens transmission calibrations (Hu et al., 2017b; Nault et al., 2018). The aerosol, once focused, was introduced into a detection chamber after three differential pumping stages. The aerosol impacted on an inverted-cone porous tungsten “standard” vaporizer under high vacuum, which was held at ∼600 ∘C. Upon impaction, the non-refractory portion of the aerosol (organic, ammonium, nitrate, sulfate, and chloride) was flash-vaporized, and the vapors were ionized by 70 eV electron ionization. The ions were then extracted and analyzed with an H-TOF time-of-flight mass spectrometer (TOFWERK AG). The AMS was operated in the “V-mode” ion path (DeCarlo et al., 2006), with a spectral resolution (m∕Δm) of 2500 at m∕z 44 and 2800 at m∕z 184. The collection efficiency (CE) for the AMS was estimated with the parameterization of Middlebrook et al. (2012), which has been shown to perform well for ambient aerosols (Hu et al., 2017a, 2020). The AMS nominally samples aerosol with a vacuum aerodynamic diameter between 40 and 1400 nm, which was calibrated for in SEAC4RS, ATom-1, and ATom-2 (Liu et al., 2017; Guo et al., 2020). Mass and/or volume closure has been investigated between the AMS and other measurements for all campaigns discussed here (Cubison et al., 2011; Aknan, 2015; Liu et al., 2017; Nault et al., 2018; Schroder et al., 2018; Guo et al., 2020). The closure was complete for the size range of the AMS and did not show any dependence with altitude (Guo et al., 2020). The software packages Squirrel and PIKA under Igor Pro 7 (WaveMetrics, Lake Oswego, OR) (DeCarlo et al., 2006; Sueper, 2018) were used to analyze all AMS data.
A cryogenic pump, to reduce the background of ammonium and organics (Nault et al., 2018; Schroder et al., 2018), was flown on the AMS for SEAC4RS, WINTER, ATom-1, and ATom-2 but not for ARCTAS-A and ARCTAS-B. The cryogenic pump lowers the temperature of a copper cylinder surrounding the vaporizer to ∼90 K. This freezes out the background gases and ensures low detection limits from the beginning of the flight, which is critical since aircraft instruments can typically not be pumped continuously and hence suffer from high backgrounds at switch-on. The 2σ accuracy for the AMS for inorganic aerosol is estimated to be 35 % (Bahreini et al., 2009; Guo et al., 2020).
2.2.2 Aerosol filters
Fast collection of aerosol particles onto filters during airborne sampling, via the University of New Hampshire Soluble Acidic Gases and Aerosol (SAGA) technique, has been described elsewhere (Dibb et al., 2002, 2003) and was used during the six campaigns investigated here. Briefly, air is sampled into the airplane via a curved leading-edge nozzle (Dibb et al., 2002). The inlet is operated isokinetically during flight and typically has a 50 % collection efficiency for aerosol with an aerodynamic diameter of 4.1 µm (Dibb et al., 2002; McNaughton et al., 2007), with some altitude dependence (Guo et al., 2020). The lower size cutoffs for SAGA and AMS are similar (Guo et al., 2020). As discussed by Guo et al. (2020; their Fig. 8) the difference in mass sampled at the smaller sizes between SAGA and AMS is generally negligible at all altitudes.
Aerosol was collected onto Millipore Fluoropore Teflon filters (90 mm diameter with 1 µm pore size). Collection time was dependent on altitude and estimated mass concentration, but generally 2 to 3 sm3 (sm3: standard square meters at T=273 K and P=1013 hPa) of air is collected to ensure detectable masses of species (Dibb et al., 2002). The aerosol inlet flow is close to 400 slpm in the marine boundary layer and approximately 150 slpm at maximum altitude. Further, two blank filters are collected each flight. The filters were contained in a Delrin holder during collection. After collection, the filters were transferred to a particle-free polyethylene “clean-room” bag, which was filled with zero air, sealed, and stored over dry ice. No acid scrubbers were inserted into the bags to prevent any artifact from off-gassing of ammonia. The samples from the filters were then extracted during non-flight days with 20 mL of ultrapure water and preserved with 100 µL of chloroform (see Sect. S2 in the Supplement). The preserved samples were sent to the University of New Hampshire to be analyzed by ion chromatography. The estimated limit of detection for both sulfate and ammonium is 0.01 µg sm3 for all missions evaluated here (Dibb et al., 1999).
2.2.3 Other aerosol measurements
The NOAA Particle Analysis by Laser Mass Spectrometer (herein PALMS) was flown during ATom-1 and ATom-2. Details of the PALMS instrument configured for ATom-1 and ATom-2 are described in Froyd et al. (2019). Briefly, PALMS measures the chemical composition of single aerosol particles via laser ablation and ionization (Murphy and Thomson, 1995; Thomson et al., 2000), whereby the ions are extracted and detected by a time-of-flight mass spectrometer. The instrument measures particles between 100 nm and 4.8 µm (geometric diameter) (Froyd et al., 2019). The measurement of PALMS used in this study is the “sulfate acidity indicator” (Froyd et al., 2009). Froyd et al. (2009) reported that in the negative ion mode, there is a prominent peak at m∕z 97, corresponding to , and another peak at m∕z 195, corresponding to the cluster . The first peak was independent of acidity, whereas the second peak was dependent on acidity. Froyd et al. (2009) calibrated the PALMS ratio of to Particle-into-Liquid Sampler (PILS) measurements to achieve an estimate of ammonium balance.
Besides the chemical composition, the particle number and volume distributions are used here. For SEAC4RS, the measurements have been described elsewhere (e.g., Liu et al., 2016). The laser aerosol spectrometer (from TSI), which measured aerosol from a geometric diameter of 100 nm to 6.3 µm, is used here for volume distribution. For the ATom missions, the measurements have been described elsewhere (Kupc et al., 2018; Williamson et al., 2018; Brock et al., 2019). Briefly, the dry particle size distribution for geometric diameters of 2.7 nm to 4.8 µm was measured by a series of optical particle spectrometers, including a nucleation model aerosol size spectrometer (3 to 60 nm, custom-built; Williamson et al., 2018), an ultrahigh-sensitivity aerosol spectrometer (60 nm to 1 µm) from Droplet Measurement Technologies (Kupc et al., 2018), and a laser aerosol spectrometer (120 nm to 4.8 µm) from TSI. These measurements have been split into nucleation mode (3 to 12 nm), Aitken mode (12 to 60 nm), accumulation mode (60 to 500 nm), and coarse mode (500 nm to 4.8 µm).
2.3 Gas-phase and other measurements
2.3.1 Ammonia measurements
Gas-phase ammonia was measured inside the cabin of the NASA DC-8 during the FIREX-AQ campaign (Warneke et al., 2018), a subsequent DC-8 campaign that shared many instrument installations and a similar level of aircraft personnel as the campaigns analyzed here. The location of the instrument and where it sampled cabin ammonia (in relation to where the SAGA filters are located) is shown in Fig. S1 in the Supplement. Ammonia was measured by a Picarro G2103 gas concentration analyzer (von Bobrutzki et al., 2010; Sun et al., 2015; Kamp et al., 2019). The instrument is a continuous cavity ring-down spectrometer. Cabin air is brought into a cavity at low pressure (18.7 kPa, 140 Torr), at which laser light is pulsed into the cavity. The light is reflected by mirrors in the cavity, providing an effective path length of kilometers. A portion of the light penetrates the mirrors, reaching the detectors, where the intensity of the light is measured to determine the mixing ratio of ammonia from the time decay of the light intensity via the Beer–Lambert law. The instrument measures the absorption of infrared light from 6548.5 to 6549.2 cm−1 (Martin et al., 2016). Absorption of gas-phase water is also measured and corrected for. This water vapor measurement is also used to calculate RH inside the cabin of the DC-8 (Filges et al., 2018). Data were logged at 1 Hz.
2.3.2 Carbon dioxide and temperature measurements
Carbon dioxide inside the cabin of the NASA DC-8 during FIREX-AQ was measured by a HOBO MX1102 carbon dioxide data logger (HOBO by Onset). It is a self-calibrating carbon dioxide sensor with a range of 0 to 5000 ppm of carbon dioxide and an accuracy of ±50 ppm. A nondispersive infrared sensor is used to measure carbon dioxide. Data were acquired once every 10 s to once every 2 min. Besides carbon dioxide, RH and temperature are also recorded by the instrument. Prior to each flight, the instrument was turned on and measured ambient carbon dioxide outside the cabin of the DC-8 to ensure the accuracy of the instrument compared to ambient carbon dioxide measurements.
Ambient carbon dioxide during FIREX-AQ was measured by an updated version of the instrument known as Atmospheric Vertical Observations of CO2 in the Earth's Troposphere (AVOCET) (Vay et al., 2003, 2011). The updated instrument used a modified LI-COR model 7000 nondispersive infrared spectrometer and measured carbon dioxide at 5 Hz.
Temperature in the cabin was measured by a thermocouple (SEAC4RS) or thermistor (ATom-1 and 2) located in the AMS rack or a Vaisala probe located at the front of the airplane (ARCTAS-A, ARCTAS-B, and SEAC4RS).
2.4 Theoretical ammonia flux model
To investigate the possibility that the ammonia mixing ratio in the cabin of the DC-8 is high enough to be taken up by acidic PM on a filter during the short time the filter is exposed to cabin air prior to final storage, a theoretical uptake model was constructed to estimate the timescale for ammonia to interact with all the acidic particles (Seinfeld and Pandis, 2006). The equations used for the model can be found in the Supplement (Sect. S3). The model was initialized with a range of ammonia mixing ratios (1 to 200 ppb) and a range of PM diameters (10 to 1000 nm). The calculations were conducted at 298 K, which is within ±10 K of typical temperatures inside the cabin of the NASA DC-8 during the five campaigns (Fig. S2). An accommodation coefficient of 1 for ammonia onto acidic PM was assumed (Hanson and Kosciuch, 2003), with a density of 1.8 g cm−3 for sulfuric acid (Rumble, 2019). For the mass transfer calculations, the transition regime (between the free molecular and continuum regimes) equations were used with the Fuchs and Sutugin parameterization (Fuchs and Sutugin, 1971). The model was used to estimate the ammonia molecular flux to acidic PM on the filter (Eq. S3 in the Supplement). Finally, the molecular flux was used to estimate the time it would take all the particles to be partially neutralized by ammonia in the cabin (Eq. S4), though this may be a lower limit (Robbins and Cadle, 1958; Daumer et al., 1992).
3.1 Comparison of online and offline ion balances across the tropospheric column
SAGA and AMS co-sampled aerosols during multiple aircraft campaigns. Nitrate quickly evaporates from aerosols as the aerosols are transported away from source regions and is typically low in the global troposphere (DeCarlo et al., 2008; Hennigan et al., 2008; Hodzic et al., 2020). Thus, in Fig. 2 the mass concentrations for the two most important submicron contributors to ammonium balance, ammonium and sulfate, are compared from the aircraft campaigns. The campaigns generally sampled remote air, either continental or oceanic, except for biomass burning sampled during ARCTAS-B and SEAC4RS and downwind of urban areas during WINTER. The measurements for mass concentrations greater than 0.1 µg sm−3 are generally within the combined uncertainties of the two instruments. Sulfate generally remains on the one-to-one line, even at low mass concentrations. However, ammonium shows a large divergence between the two measurements for mass concentrations less than 0.1 µg sm−3 during all six aircraft campaigns. As shown in Fig. 2, the divergence in ammonium occurs well above the limit of detection for both instruments, namely ∼4 ng sm−3 for AMS for a 5 min average (DeCarlo et al., 2006; Guo et al., 2020) and 10 ng sm−3 for SAGA (Dibb et al., 1999), for both ammonium and sulfate.
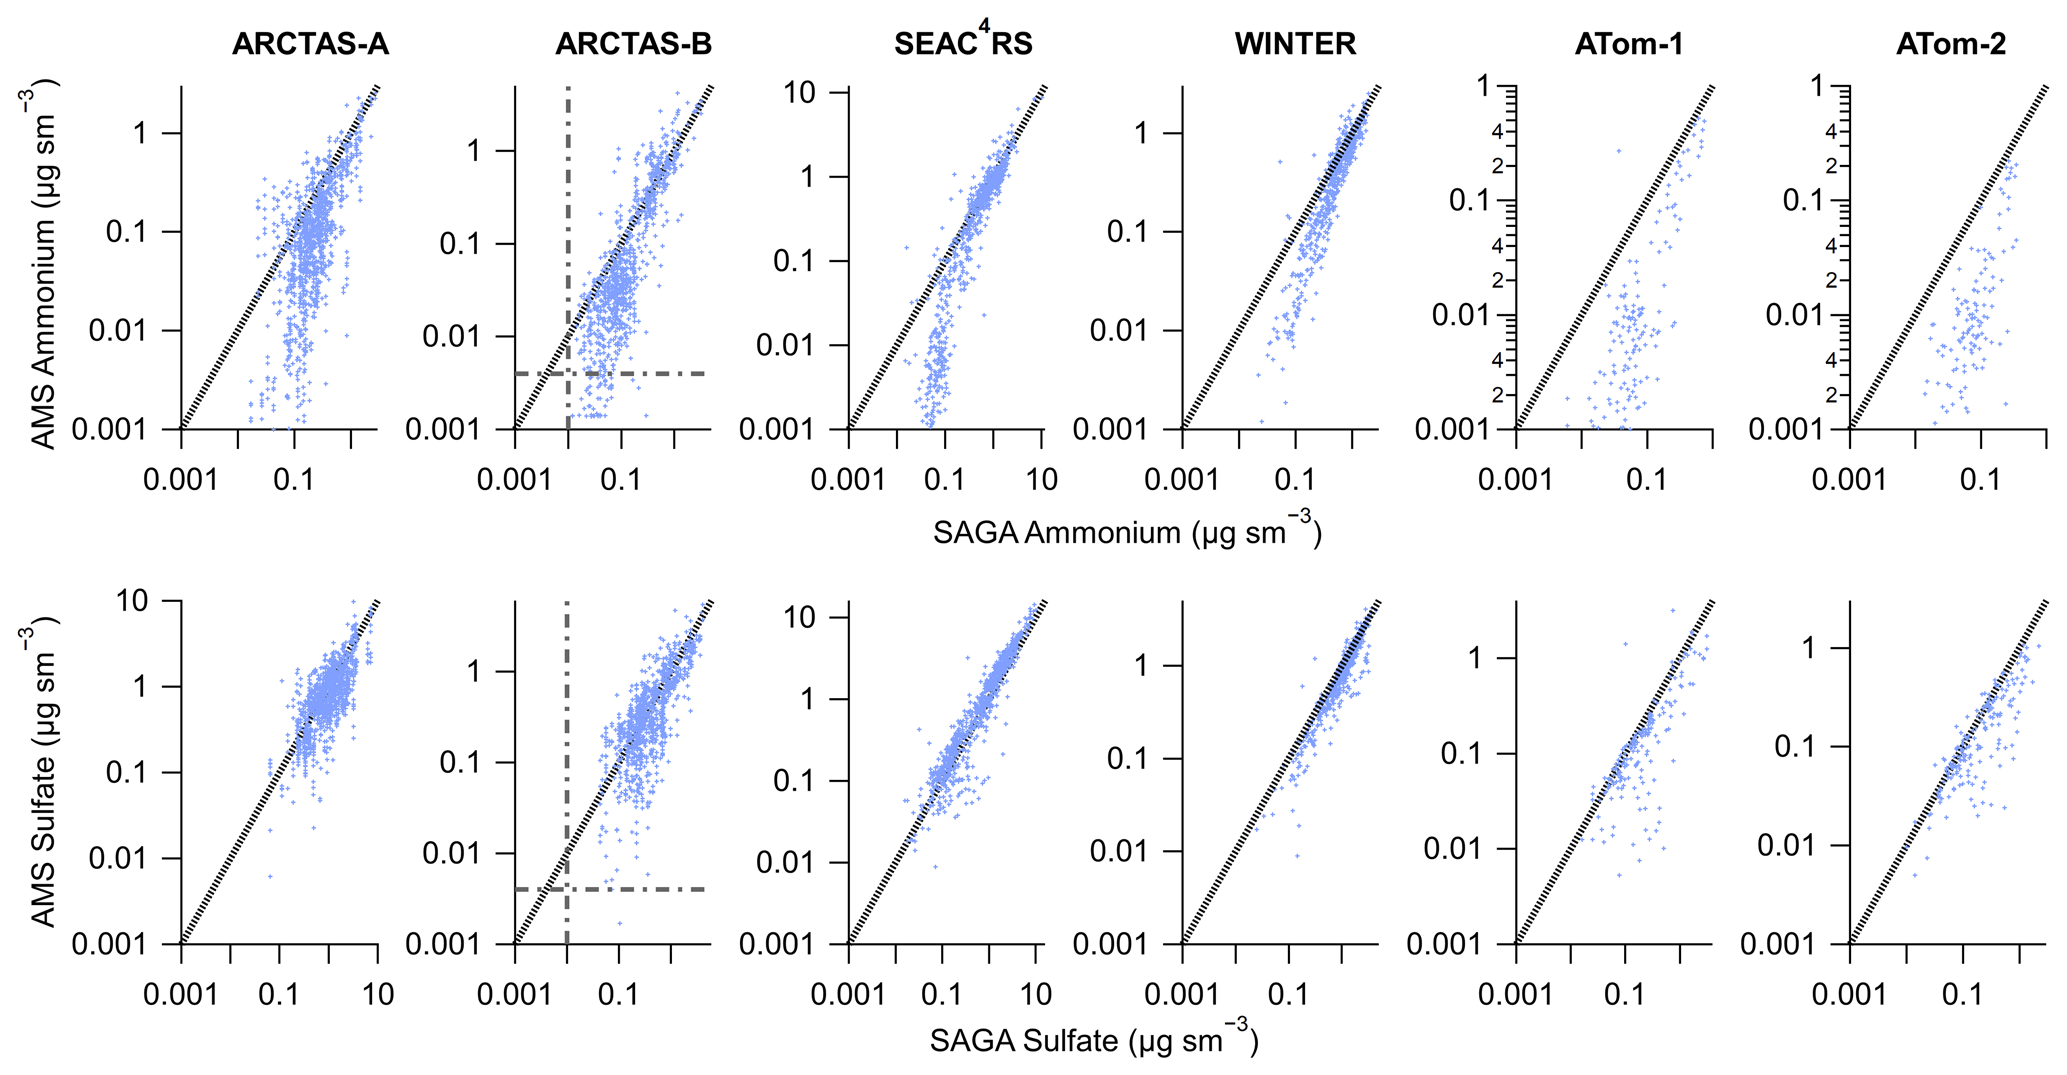
Figure 2Scatter plot of AMS (y axis) versus SAGA filter (x axis) ammonium (top) and sulfate (bottom) mass concentration from six different aircraft campaigns. AMS data have been averaged over the SAGA filter collection times. The black line is the one-to-one line and the grey dash–dot lines are the estimated detection limits for AMS (DeCarlo et al., 2006; Guo et al., 2020) at the SAGA filter collection interval (∼5 min) and the estimated detection limits for SAGA (Dibb et al., 1999). Data have been averaged to the sampling time of SAGA and have not been filtered for supermicron particles. For ATom-1 and ATom-2, data during ascent and descent have been removed (only level sampling at low altitude and high altitude).
This divergence in ammonium mass concentration is thus reflected in the ammonium balance, defined as the ratio of ammonium to sulfate plus nitrate in moles (Fig. 3). For all campaigns, the two measurements show differences in ammonium balance, especially at higher altitudes where aerosol is distant from ammonia emissions (Dentener and Crutzen, 1994; Paulot et al., 2015) but sulfate production can continue due to vertical transport of precursors such as SO2. On average, the SAGA measurements indicate an ammonium balance rarely below 0.5 throughout the troposphere, whereas the AMS measurements indicate that the ammonium balance generally drops to below 0.2 for pressures less than 400 hPa. Figures 2 and 3 indicate either differences in the ammonium balance due to differences in the aerosol populations sampled, as SAGA measures larger aerosol diameters than AMS (Guo et al., 2020), or potential artifacts in one of the measurements.
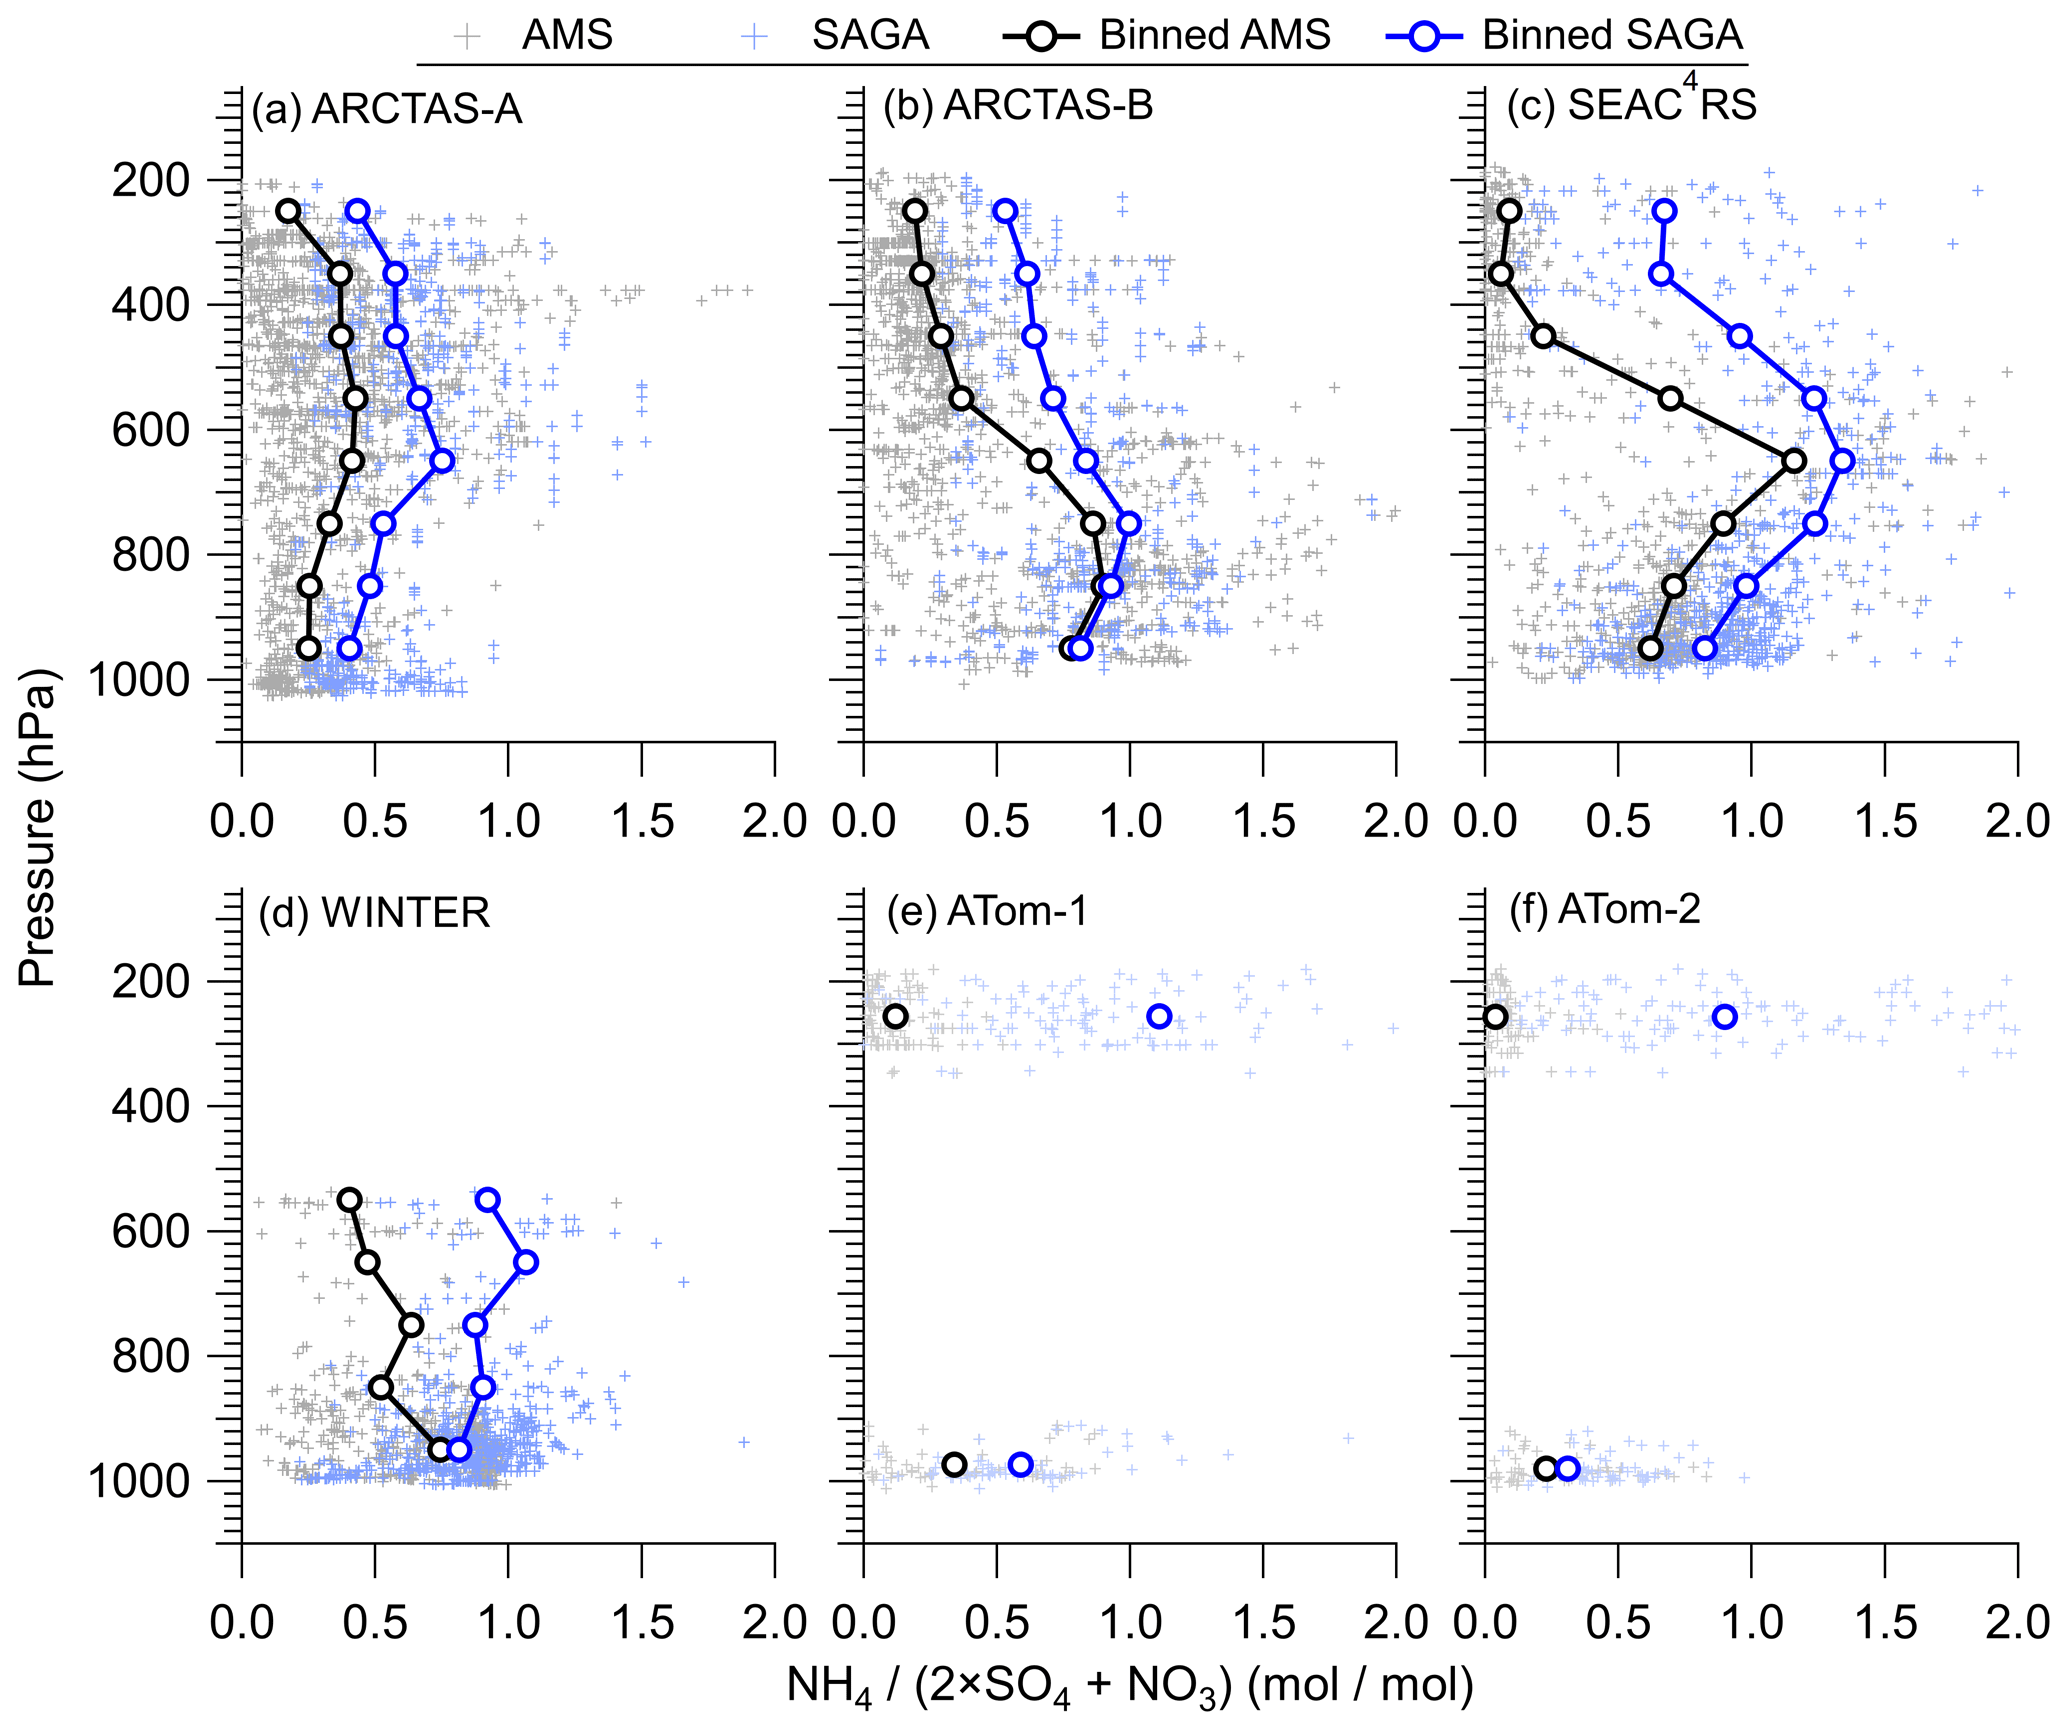
Figure 3Vertical profiles of ammonium balance () for (a) ARCTAS-A, (b) ARCTAS-B, (c) SEAC4RS, (d) WINTER, (e) ATom-1, and (f) ATom-2 for AMS and SAGA. The binned data represent the mean for each 100 hPa pressure level. The data have been averaged to the sampling time of SAGA filters.
Both the AMS and the filters sample most submicron aerosols (see Guo et al., 2020, for details), but the filters also sample supermicron particles that the AMS does not. Therefore, it is possible in principle that the difference could be due to ammonium present in supermicron particles. As discussed in Guo et al. (2020), nearly 100 % of the measured volume occurs for aerosols <1 µm above the marine boundary layer, where the largest difference in ammonium balance between the filters and AMS occurs (Fig. 3). Further, ammonium has been observed to be a small fraction of the supermicron mass (Kline et al., 2004; Cozic et al., 2008; Pratt and Prather, 2010), except for instances of continental fog (Yao and Zhang, 2012) and Asian dust events (Heim et al., 2020). An upper estimate of supermicron ammonium can be calculated using results from prior studies (Kline et al., 2004; Cozic et al., 2008). In these prior studies, ∼90 % of the ammonium was submicron. With the average ammonium observed during ATom-1 and ATom-2 (∼10 to 50 ng sm−3) (Hodzic et al., 2020), that would suggest an upper limit of ∼1 to 5 ng sm−3 of ammonium in the supermicron aerosols. This upper estimate does not explain the differences between AMS and filters during ATom-1 and ATom-2 (Fig. S3), as the percent difference increases with a decreasing estimated supermicron ammonium volume. As the largest differences between the AMS and filters occur well above the boundary layer (Fig. 3) away from continental ammonia sources (Dentener and Crutzen, 1994) and Asian dust events, we conclude that the sampling of supermicron aerosols by filters does not lead to the observed differences in ammonium.
The only useful comparison, other than SAGA versus AMS, is with PALMS during ATom. Prior studies by PALMS have shown aerosols observed for pressure <400 hPa to be acidic, depending on the potential recent influence of boundary layer air via convection (Froyd et al., 2009; Liao et al., 2015), similar to observations by other single-particle mass spectrometers (Pratt and Prather, 2010). Though not reaching similarly low values as the AMS, the PALMS acidity marker shows much lower values than were determined from the aerosols collected on the filters (Fig. S4). Different reasons for PALMS not achieving as low values as AMS may include differences in aerosol sizes sampled by PALMS versus AMS (Guo et al., 2020) and the sensitivity of the acidity marker to laser power (Liao et al., 2015). Thus, two different online measurements indicate that the ammonium balance is lower than the aerosols collected on filters, potentially suggesting more acidic aerosols.
Differences in ammonium balance between AMS and SAGA are detectable for sulfate mass concentrations ≤1 µg sm−3 (Fig. 4) for all six aircraft campaigns. As the sulfate mass concentration decreases, the relative differences in ammonium, and thus the ammonium balance, increase. The large majority of the troposphere contains sulfate mass concentrations in which differences in ammonium are observed, highlighting the importance of this problem (Fig. 4a). Thus, except for more polluted conditions (>1 µg sm−3 sulfate), which mainly occur in continental (Jimenez et al., 2009; Kim et al., 2015; Malm et al., 2017) and urban regions (Jimenez et al., 2009; Hu et al., 2016; Kim et al., 2018; Nault et al., 2018), this bias between filters and online measurements is critically important, especially since airborne measurements are often the only meaningful observational constraints for remote regions. Thus, this analysis suggests that for SAGA filters, a more meaningful ammonium limit of detection would be equivalent to 1 µg sm−3 of sulfate, which would be ∼0.2 µg sm−3 of ammonium. This also provides the framework to define the limit of detection for other filter-based measurements not associated with ion chromatography.

Figure 4(a) Predicted normalized probability distribution function (PDF) for tropospheric (pressure >250 hPa) sulfate from GEOS-Chem for 1 model year (see the Supplement). (b) Difference between SAGA and AMS ammonium (mol sm−3) divided by AMS sulfate and nitrate (mol sm−3) versus AMS sulfate (µg sm−3) for the six different airborne campaigns. The values shown are binned deciles for the six different airborne campaigns. The fit shown in (b) is for all data from all campaigns.
3.2 Ammonia levels in the NASA DC-8 cabins
Prior studies have suggested that various sources of ammonia could impact acidic filter measurements (Klockow et al., 1979; Hayes et al., 1980; Koutrakis et al., 1988). Some of these studies found that the materials of the containers in which the filters are stored, unless thoroughly cleaned and not stored around humans, are a source of ammonia gas that reacts with the sulfuric acid on the filters to become ammonium, leading to ammonium bisulfate or ammonium sulfate (Hayes et al., 1980). Further, handling of acidic filters in rooms with people or acidic aerosol in the presence of human breath can also lead to near to complete neutralization of acidic aerosol (Larson et al., 1977; Hayes et al., 1980; Clark et al., 1995). Finally, various studies have suggested that the SAGA filters specifically may be impacted by various ammonia sources prior to sampling with ion chromatography (Dibb et al., 1999, 2000; Fisher et al., 2011).
During SAGA sampling, the filters with collected aerosol are moved from the sample collector to a polyethylene bag that is filled with clean air. During this step, the filter is exposed to the cabin air of the DC-8 for ∼10 s. As humans are a source of ammonia (Larson et al., 1977; Clark et al., 1995; Sutton et al., 2000; Finewax et al., 2020; Li et al., 2020), this source sustains significant ammonia concentrations in indoor environments, which could potentially bias the filter measurements. Online measurements would not be subject to this effect since the sampled air is not exposed to cabin air before measurement. While inlet lines for online instruments could in theory lead to some memory effects, there is no evidence of such effects in the data (e.g., the response going from a large, neutralized plume into the acidic free troposphere is nearly instantaneous; Schroder et al., 2018).
During a recent 2019 NASA DC-8 aircraft campaign, FIREX-AQ, ammonia was measured onboard the DC-8 during several research flights. An example time series of cabin ammonia, temperature, and RH is shown in Fig. 5. Prior to takeoff, as scientists were slowly boarding the airplane, the ammonia mixing ratio was low (<20 ppbv) and similar to ambient levels of ammonia outside the aircraft. As scientists started boarding before takeoff, the ammonia mixing ratio increased. Upon doors closing, the mixing ratio leveled off at ∼40 ppbv. After takeoff, the mixing ratio remained ∼40 ppbv, though there were changes related to changes in cabin temperature and humidity, which would affect emission rates and also adsorption of ammonia onto cabin surfaces (Sutton et al., 2000; Finewax et al., 2020; Li et al., 2020), and movement of scientists throughout the cabin, which would affect emission rates and their location.

Figure 5Time series of ammonia (left) and relative humidity and temperature (right) measured inside the cabin of the NASA DC-8 during a flight during the FIREX-AQ campaign. Time spent prior to takeoff is marked with a grey background.
The average (±1σ spread of the observations) and median ammonia in the cabin of the DC-8 during FIREX-AQ were 45.4±19.9 and 41.9 ppbv (Fig. 6). There was a large positive tail in the ammonia mixing ratio related to high temperatures (Fig. S5), which causes the scientists to perspire more and release more ammonia (Sutton et al., 2000; Finewax et al., 2020; Li et al., 2020). Compared to outdoor ammonia mixing ratios, ranging from urban to remote locations, the ammonia in the cabin of the DC-8 is higher by a factor of 2 to 2000 (Fig. 6). On the other hand, the ammonia measured in the cabin of the DC-8 is similar but towards the lower end of the mixing ratios measured during various indoor studies (Table S1 in the Supplement for a compilation of references).
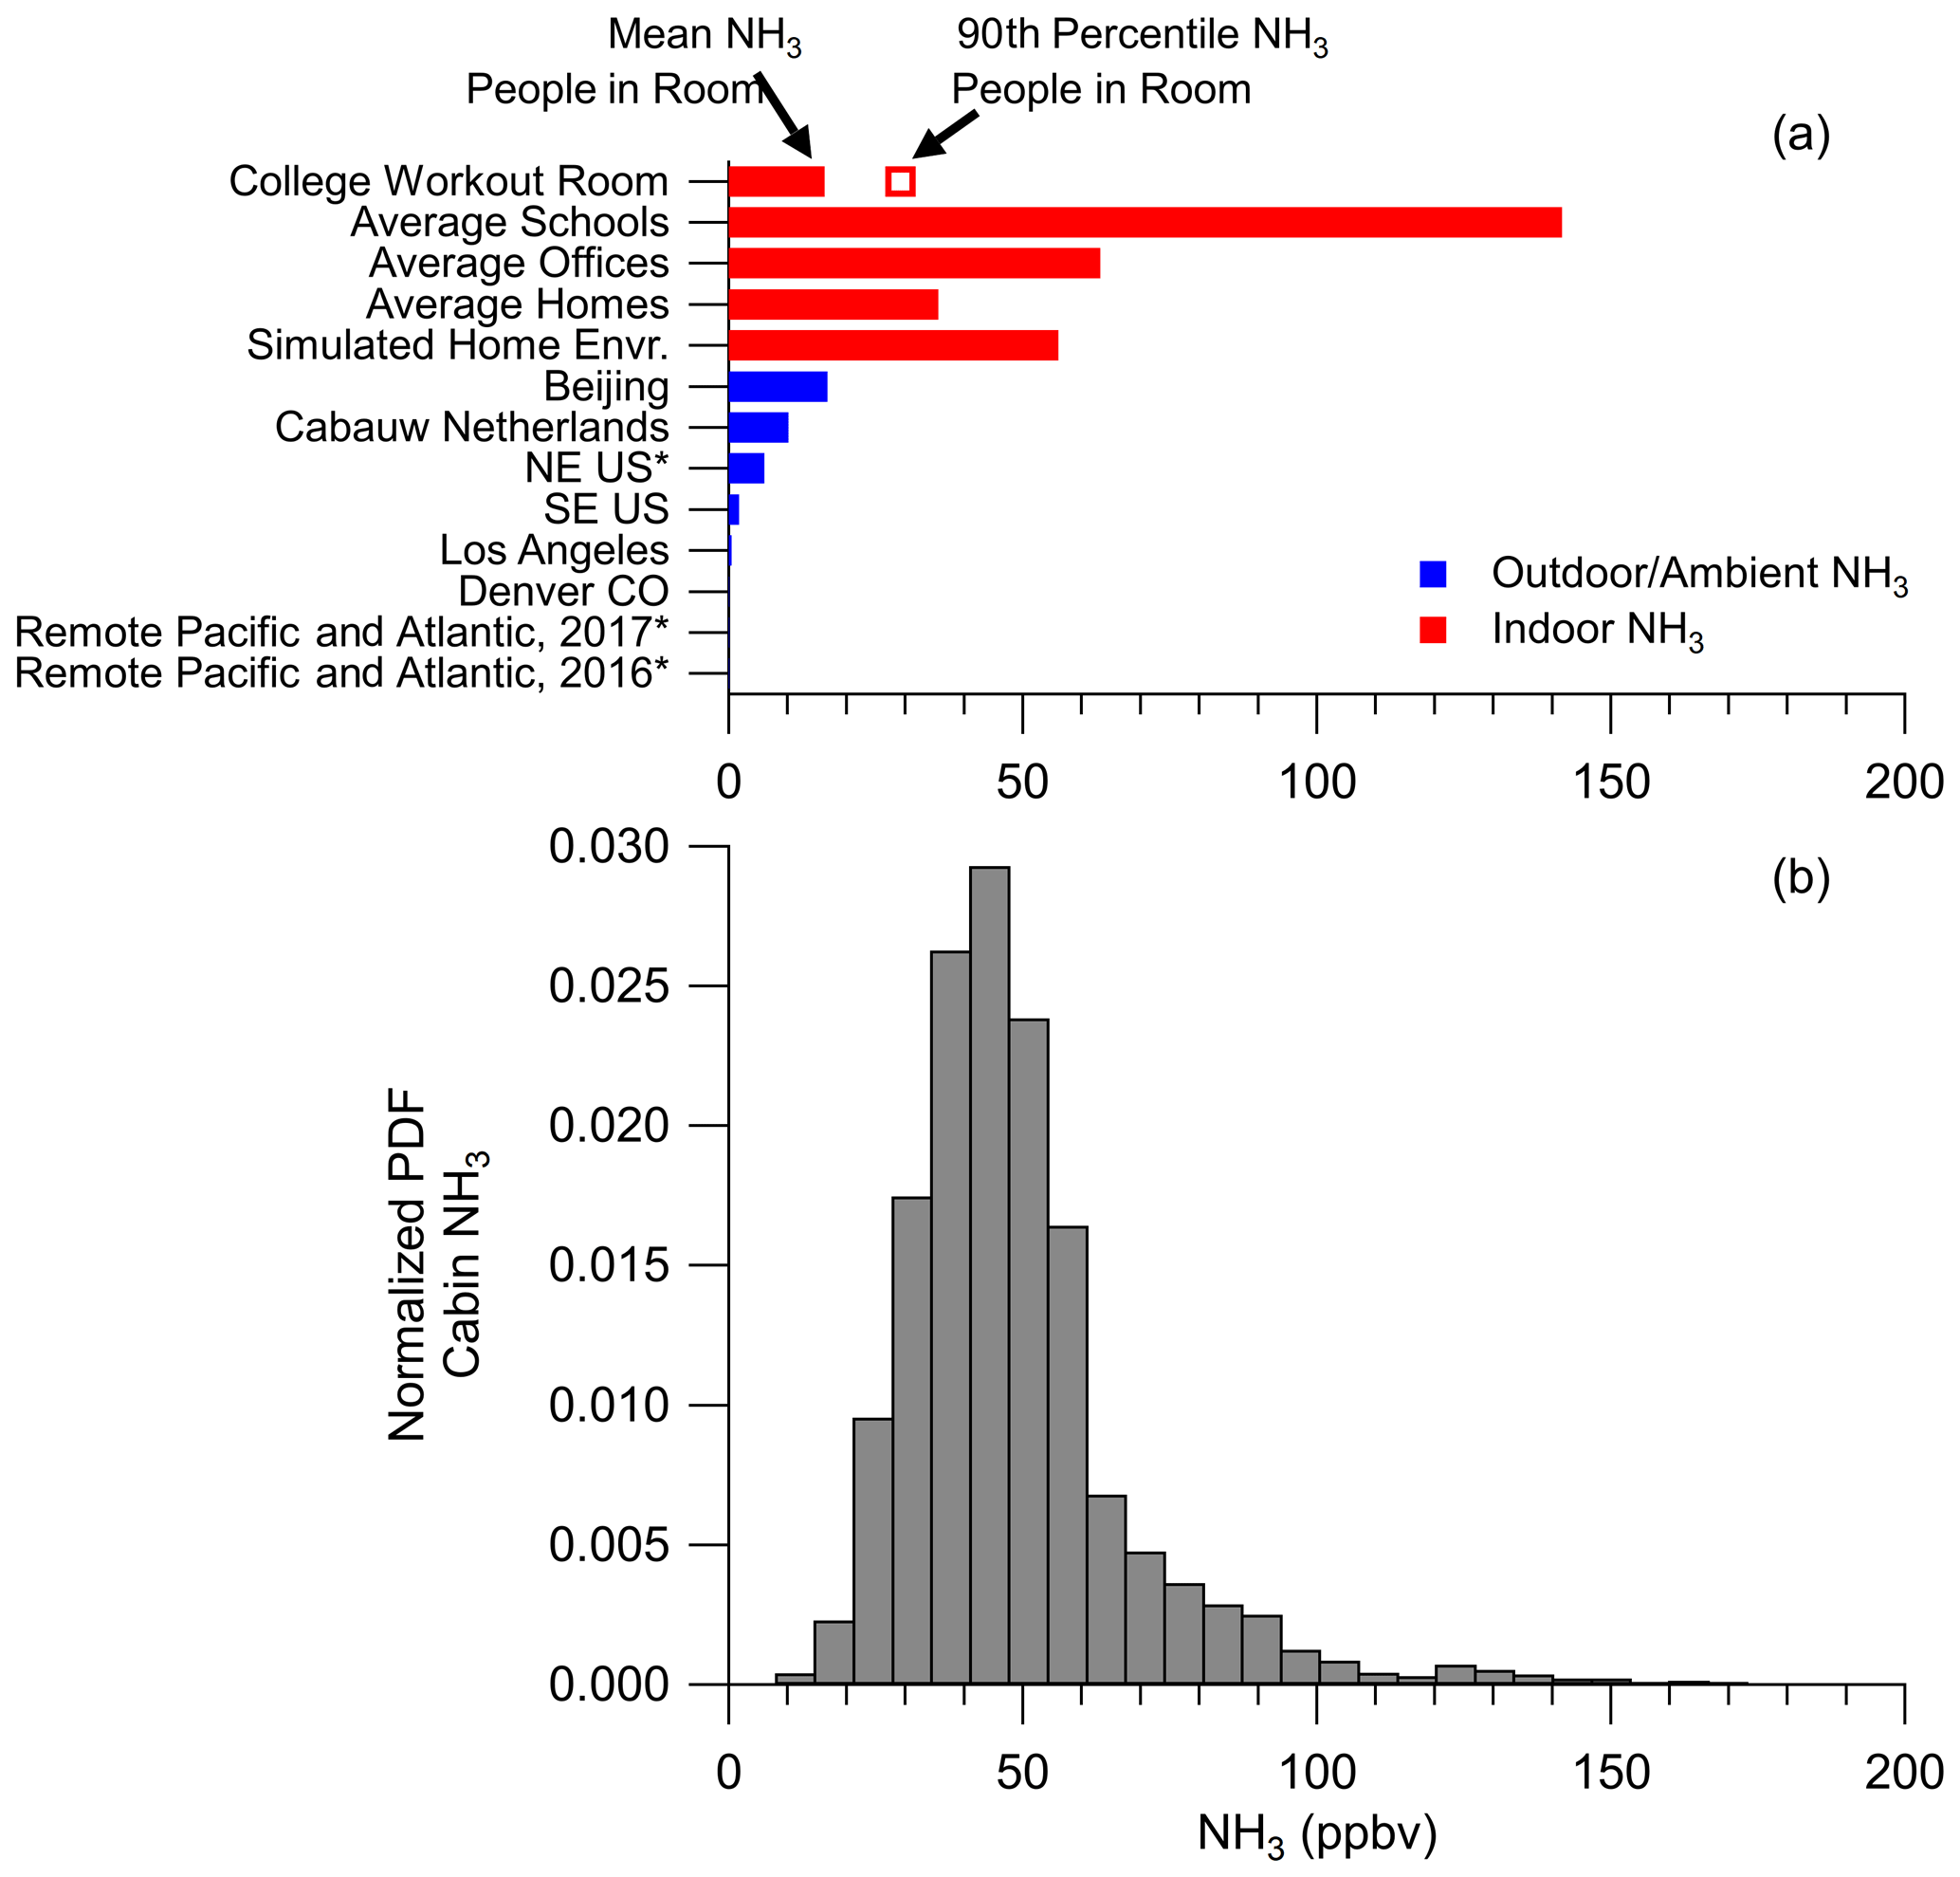
Figure 6(a) Ammonia (NH3) (ppbv) reported for various studies. See Table S1 for references. An asterisk after the study name indicates NH3 predicted by a thermodynamic model instead of being measured. (b) Normalized probability distribution function (PDF) for NH3 measured in the cabin of the NASA DC-8 during FIREX-AQ.
The ammonia mixing ratios observed in the cabin were verified by investigating the cabin air exchange rates (see Sect. S5). Using carbon dioxide measurements, the exchange rate in the cabin was calculated to be 9.9 h−1 (Fig. S6), which is similar to literature values for the cabin exchange rate of other passenger airliners (Hunt and Space, 1994; Hocking, 1998; Brundrett, 2001; National Research Council, 2002). This value is a factor of 2 to 5 higher than typical exchange rates for commercial buildings (Hunt and Space, 1994; Pagonis et al., 2019), which would suggest lower mixing ratios than observed in other indoor environments. Using this exchange rate, the literature total ammonia emission rates from humans (1940 µg h−1 per person; Sutton et al., 2000), and the average of ambient ammonia mixing ratios as an outdoor background onto which human emissions in the cabin are added (∼4.4 ppbv, Fig. 6), the ammonia mixing ratio in the cabin of the DC-8 was estimated to be 43.4 ppbv, which is within the uncertainty of the average ammonia (45.4±19.9 ppbv) inside the cabin of the DC-8. Thus, the observed ammonia mixing ratios in the cabin of the DC-8 are consistent with the cabin air exchange rates and literature values for human ammonia emissions. These mixing ratios are approximately a factor of 9 higher than in a typical laboratory environment (Fig. S7), as there are fewer people (1 to 4 versus 20 to 40), making the cabin of the DC-8 an extreme laboratory environment for handling acidic filters. As shown in Fig. 6, ammonia mixing ratios in indoor environments are high enough to change the thermodynamics of inorganic aerosol, leading to higher ammonium balances (Weber et al., 2016). Thus, similar to the conclusions of other studies, the cabin of the DC-8 is an important source of ammonia that could lead to biases with acidic aerosols collected on filters.
During FIREX-AQ, the DC-8 frequently sampled air impacted by biomass burning, which is an important source of ammonia (Sutton et al., 2013) and could potentially increase the background ammonia being brought into and mixing with the cabin air being sampled by the Picarro. Splitting the cabin ammonia ratios between sampling air impacted by biomass burning versus nominal background air, the normalized PDF did not shift to higher ammonia mixing ratios (Fig. S8). Further, the average of the observed cabin ammonia was statistically similar, at the 95 % confidence interval, between the DC-8 sampling biomass burning and nominal background air (48.1±13.4 versus 44.1±14.4 ppbv for biomass burning and background air, respectively). Finally, the majority of the time the cabin air was sampled by the Picarro for cabin ammonia, the DC-8 was sampling agricultural fires in the southeastern US, which are shorter in duration (seconds) versus the large wildfires in the western US (minutes to hours). This is reflected in the low average ambient value for ammonia, as measured by a proton transfer reaction mass spectrometer (Müller et al., 2014) when the DC-8 was sampling biomass-burning-influenced air observed during this time (∼10 ppbv) and very low average value for non-biomass-burning-influenced air (∼0.8 ppbv) (Fig. S8). Thus, ammonia from biomass burning would at most have a small impact on the ammonia measured in the cabin of the DC-8, further indicating the ammonia in the cabin was mainly from human emissions.
3.3 Can uptake of cabin ammonia explain the higher ammonium concentrations on filters?
As shown in Fig. 6, the cabin of the DC-8 is an important source of ammonia from the breathing and perspiring of scientists. Prior studies (Klockow et al., 1979; Huntzicker et al., 1980; Daumer et al., 1992; Liggio et al., 2011) have shown in laboratory settings that 10 s is fast enough to partially to fully neutralize sulfuric acid. Thus, here we investigate whether the filter handling time of 10 s will lead to partial to full neutralization of sulfuric acid from cabin ammonia or whether this time is fast enough to limit exposure of the acidic filter to cabin ammonia. Huntzicker et al. (1980) showed that for typical aerosol modal distributions (Fig. 7) and cabin RH (Fig. S9), an initial pure sulfuric acid aerosol suspended in a flow reactor reaches equal molar amounts of ammonium and sulfate (i.e., ammonium bisulfate) when exposed to 70 ppb of ammonia in 10 s. This indicates the plausibility that acidic aerosol filters, which typically have lower sulfate mass concentrations than in Huntzicker et al. (1980) (∼2 µg versus ∼55 µg of sulfate equivalent on filters), would interact with cabin ammonia to form at least ammonium bisulfate. Further, other studies found that in less than 10 s, sulfuric acid aerosol suspended in a flow reactor at RH≤45 % will completely react with gas-phase ammonia to form ammonium sulfate (Robbins and Cadle, 1958; Daumer et al., 1992). The latter study used ammonia mixing ratios similar to the amount observed in the cabin of the DC-8 (∼30 ppbv), whereas the former study used excess ammonia (∼9 ppmv). Some studies have suggested that the bags used to store the filters may be a source of ammonia (e.g., Hayes et al., 1980); however, calculations indicate the bags would be a small source of ammonia (see Sect. S4).

Figure 7Theoretical calculation for the amount of time it would take for all the sulfuric acid on the filter to react with one ammonia molecule to become ammonium bisulfate. The volume distribution is the average from SEAC4RS and ATom-2 (adapted from Guo et al., 2020), and the normalized probability distribution function (norm. PDF) is from Fig. 6. The representative diameter and ammonia mixing ratio are shown as dashed lines in the calculated timescale.
First, the diffusion time of ammonia gas from the surface to the interior of the filter was investigated, as there is potential for the PM to be embedded deep into the filter (Seinfeld and Pandis, 2006):
where is the depth of the Teflon (∼0.015 cm) and Dg is the diffusion coefficient of ammonia in air (0.228 cm2 s−1) (Spiller, 1989). Therefore, the estimated timescale for ammonia to diffuse through the depth of the Teflon filter is s, meaning that the surface of PM will always be in contact with cabin-level mixing ratios of ammonia. Even though the filters have a porous membrane for molecular diffusion, the membrane only slightly increases the pathway that the ammonia molecules have to travel, thus not changing the estimated time. Second, as the particles are liquid (Wilson, 1921), the diffusion will be similar as through water. A typical value for diffusivity in water is cm2 s−1 (Seinfeld and Pandis, 2006). For the size ranges observed (Fig. 7, ∼40–700 nm), this corresponds to a timescale of to s. Thus, diffusion through the filter and through the PM is nearly instantaneous for ammonia.
A theoretical uptake model for ammonia to acidic PM on filters was run for a range of ammonia mixing ratios and PM diameters (Fig. 7). As shown in Fig. 7, only at the lowest ammonia mixing ratios (<10 ppbv) is the flux of ammonia to acidic PM slower (>20 s) than the typical filter handling time (∼10 s) for typical aerosol diameters in the remote atmosphere. For the conditions of the DC-8, similar to other indoor environments (>20 ppbv ammonia; Fig. 6), and ambient aerosol diameters in the accumulation mode that contains most ambient sulfate (Fig. 7), the amount of time needed for cabin ammonia to interact with acidic PM on filters to form ammonium bisulfate is ≤10 s, similar to the results of Huntzicker et al. (1980). Also, studies show that the kinetic limitation to form ammonium sulfate ((NH4)2SO4) versus ammonium bisulfate (NH4HSO4) is relatively low and can occur within the 10 s time frame (Robbins and Cadle, 1958; Daumer et al., 1992). A laboratory setting with ∼5 ppbv of NH3 would result in the filters needing to be exposed to laboratory air for at least 40 s to form ammonium bisulfate (Fig. S10) versus 3 to 10 s for conditions in the cabin of the DC-8 (Fig. 7), further exemplifying the challenging conditions of the DC-8 cabin for filter sampling.
Prior analysis made the assumption that PM maintained a spherical shape upon impacting the Teflon filter. More viscous (i.e., solid) PM is more likely to maintain a spherical shape on filters, whereas less viscous (i.e., liquid) PM will spread and become more similar to a cylindrical shape (e.g., Slade et al., 2019). As more acidic aerosol is more likely to be liquid (e.g., Murray and Bertram, 2008), an exploration of cylindrical shape was conducted. Depending on the assumed height of the cylindrical shape, the timescale for a molecule of ammonia to interact with a molecule of sulfuric acid decreases from ∼5 s (for maximum ammonia and aerosol volume) to ∼4 s (assuming the height of a cylinder equals the radius of a sphere) to less than 1 s as the height decreases from 25 nm or less. The aerosol deforming and spreading upon impacting the filters increases the particle surface area and decreases the amount of time for cabin ammonium to interact with the acidic PM. Thus, less viscous aerosol has more rapid uptake and interaction with ammonia due to the higher surface area.
A potential limitation of the model is the accommodation coefficient of ammonia to acidic PM, as there are conflicting reports on its value (Hanson and Kosciuch, 2004; Worsnop et al., 2004). However, as shown in Worsnop et al. (2004), once the sulfuric acid weight percentage is 50 % or greater, the different studies converge to an accommodation coefficient of ∼1. Various studies indicate that the RH in the cabin of jet airplanes is low due to how air is brought into the airplane, typically <20 % (Hunt and Space, 1994; Brundrett, 2001; National Research Council, 2002). Even though the ambient RH may be higher than the RH in the cabin of the DC-8, the water equilibration is rapid (<1 s) for the temperature of the cabin of the DC-8, even for very viscous aerosol (Shiraiwa et al., 2011; Price et al., 2015; Ma et al., 2019), meaning the PM on the filter would rapidly reach equilibrium with the cabin RH upon exposure. This would result in a ≥60 % sulfuric acid weight percentage (Wilson, 1921) for the typical RH ranges in the cabin of typical airlines. However, various measurements in the DC-8 cabin indicate the RH is ≤40 % (Fig. S9), leading to a sulfuric acid weight percentage of 50 % or greater (Wilson, 1921). Therefore, the accommodation coefficient of ∼1 is well constrained by the literature. Thus, the handling of the filters between the sampling inlet and the polyethylene bag exposes the acidic PM to enough gas-phase ammonia to form ammonium bisulfate or ammonium sulfate, biasing high ammonium from the filters. This explains the differences seen in Figs. 1–4.
Another potential limitation is that the PM on the filters could form a layer as multiple particles pile up on top of each other, slowing the diffusion of ammonia to be taken up by acidic PM. The filters have a one-sided surface area of m2, while an individual particle at the mode of the volume distribution (Fig. 7) has a projected surface area of m2. Thus, particles would need to be collected to form a single layer of PM on the filter. The number of molecules in a single particle of the mode size is molecules (Eq. S2). Therefore, molecules need to be collected onto the filters in order to form a monolayer of PM, which is equivalent to µg of total aerosol collected or an approximate 700 µg sm−3 aerosol concentration. As the mass concentration in ATom was typically ∼1 µg sm−3 (Hodzic et al., 2020) and total aerosol concentrations that high are rarely seen except for extreme events (such as the thickest fresh wildfire plumes), it is very unlikely that more particle layering would delay the diffusion of ammonia to acidic PM.
Various sensitivity analyses of the uptake of ammonia to sulfuric acid were conducted. First, there is a minimal impact of cabin temperature on the results. Though there was a 25 K range in cabin temperature (Fig. S2), the impact on the molecular speed of ammonia in the model (Eq. S1) leads to a ±2 % change in molecular speed, resulting in small changes in the time. Further, only large changes in the accommodation coefficient with temperature occur for sulfuric acid weight percentages <40 % (Swartz et al., 1999), which is smaller than the weight percentage expected for the filters in the cabin of the DC-8. For the temperature range of the cabin of the DC-8 (Fig. S2), the coefficient changes by less than 10 %, which leads to a total maximum change in Fig. 7 of ±12 %. The largest impact on the results in Fig. 7 is changing the accommodation coefficient. Reducing the accommodation coefficient by a factor of 10, though not representative of the DC-8 cabin conditions, would mean the acidic PM would need to be exposed to ammonia for ≥1 min (Fig. S11). It is expected that the lower accommodation coefficient will occur for conditions with higher RH (>80 %), suggesting that typical laboratory conditions (along with the lower ammonia mixing ratios) or ambient conditions may experience lower ammonia uptake to acidic PM. Finally, organic coatings may impact the accommodation coefficient of ammonia to sulfuric acid; however, the amount of reduction of the accommodation coefficient has varied among studies (e.g., Daumer et al., 1992; Liggio et al., 2011). Daumer et al. (1992) showed no impact, whereas Liggio et al. (2011) found a similar impact to reducing the accommodation coefficient by a factor of 10 (Fig. S11). Thus, the results in Fig. 7 are in line with Daumer et al. (1992), while the results in Fig. S11 are in line with Liggio et al. (2011).
3.4 Impacts of ammonia uptake on acidic filters
As discussed throughout this study, uptake of cabin ammonia during the handling of acidic filters can lead to bias in ammonium mass concentrations. However, other potential sources of biases include the material used for sampling and storing the filter (Hayes et al., 1980) and the preparation of the filter in the field to be sampled by ion chromatography. As the preparation of the filters occurs indoors, the filters will be exposed to similar ammonia mixing ratios as those shown in Fig. 6.
Further, filter collection of aerosols is a widely used technique outside of aircraft campaigns, including for regulatory purposes and long-term monitoring at various locations around the world. For many of these sites, ammonia denuders are used to minimize biases of ammonium on filters (e.g., Baltensperger et al., 2003). Data from remote high-altitude locations have indicated that the ammonium balance is less than 1 (Cozic et al., 2008; Sun et al., 2009; Freney et al., 2016; Zhou et al., 2019), similar to the observations from the AMS shown in Fig. 3. However, this is dependent on air mass origin and type (Cozic et al., 2008; Sun et al., 2009; Fröhlich et al., 2015). Thus, sampling of remote aerosols with filters does provide evidence of ammonium balances less than 1 due to a combination of procedures to minimize interaction of gas-phase ammonia with the acidic filters and the lower human presence (and potentially cooler temperatures at high, remote, mountaintop locations such as Jungfraujoch).
However, there are some long-term monitoring stations that do not use denuders or other practices to minimize the interaction of ammonia with acidic aerosols. For example, the Clean Air Status and Trends Network (CASTNET), which is located throughout the continental United States, measures ammonium, sulfate, and nitrate (Solomon et al., 2014). CASTNET uses an open-face system to collect aerosols on Teflon filters for approximately 1 week for each filter (Lavery et al., 2009). In comparison, the Chemical Speciation Monitoring Network (CSN), which also samples the continental United States and collects the aerosols on nylon or Teflon filters, a denuder is used to scrub gas-phase ammonia to minimize interaction of ammonia with acidic aerosols on filters (Solomon et al., 2000, 2014). The comparison between these two long-term monitoring sites shows very different trends of ammonium balance versus total inorganic mass concentration (Fig. S12). For CSN, the ammonium balance decreases with mass concentration, whereas CASTNET remains nearly constant. This is similar to the comparison between SAGA and AMS in Fig. 4. This difference between the two sampling techniques may be due to the lack of a denuder in CASTNET to remove gas-phase ammonia. The use of denuders has led to CSN and other monitoring networks that use denuders being more in line with in situ observations (Kim et al., 2015; Weber et al., 2016). Further, as shown in Fig. S10, exposure of an unprotected acidic filter for longer than 1 d will lead to ammonia reacting with the acid to form ammonium bisulfate or ammonium sulfate, even at low ammonia mixing ratios. Other aspects that could impact this comparison and are beyond the scope of this study (but has been discussed in other studies; Hering and Cass, 1999; Schauer et al., 2003; Chow et al., 2005, 2010; Dzepina et al., 2007; Watson et al., 2009; Nie et al., 2010; Liu et al., 2014, 2015; Cheng and He, 2015; Heim et al., 2020) include the loss of volatile ammonium from the evaporation of ammonium nitrate or differences in the handling, shipping, and/or storage of the filters or extracted samples. Thus, without denuders, or handling of filters with more than one person present, will lead to similar differences between in situ sampling versus filter collection of inorganic aerosols observed during various aircraft campaigns.
Further, the uptake of ammonia onto acidic aerosols will impact comparisons with chemical transport models (CTMs) and the understanding of various physical processes. For example, various CTMs predict different results for the mass concentration of ammonium in the upper troposphere (Wang et al., 2008a; Fisher et al., 2011; Ge et al., 2018), and selection of one measurement versus the other will lead to different degrees of agreement. For example, for filters that collect aerosols similar to those described here (no ammonia scrubber and/or exposed to human emissions of ammonia), values of ammonium <0.2 µg sm−3 should be used with caution or online measurements of ammonium should be used instead (specifically for SAGA measurements, but a similar analysis should be conducted for other filter-based measurements). This different agreement impacts our understanding of important processes, such as the direct radiative impact of inorganic aerosol (Wang et al., 2008b) and the deposition of inorganic gases and aerosols (Nenes et al., 2020a), as gas-phase species have a faster deposition rate than the aerosol phase. Finally, measurement biases can impact the suggested regulations to improve air quality (Nenes et al., 2020b) and the calculated aerosol pH, as pH is sensitive to the partitioning of ammonia between the aerosol and gas phase (e.g., Hennigan et al., 2015).
Collection of aerosols onto filters to the measure aerosol mass concentration and composition is valuable for improving our understanding of the emissions and chemistry of inorganic aerosol; long-standing, multi-decadal, filter-based records of atmospheric composition are invaluable to analyze atmospheric change. However, as has been discussed in earlier studies, acidic aerosols collected on filters are susceptible to uptake of gas-phase ammonia, which interacts with the acidic aerosol to form an ammonium salt (e.g., ammonium bisulfate or ammonium sulfate). This artifact in filter measurements can bias our understanding of the chemical composition of the aerosol, which impacts numerous atmospheric processes.
We show that across six different aircraft campaigns, aerosol collected on filters showed a substantially higher ammonium mass concentration and ammonium balance compared to AMS measurements. Further, another online measurement (PALMS) also shows lower ammonium-to-sulfate ratios than for the filters. These differences are not due to differences in the aerosol size ranges sampled by the PALMS and the filters. Instead, we show that the mixing ratio of gas-phase ammonia in the cabin of the DC-8 is high enough (mean ∼45 ppbv), and similar enough to other indoor environments, to interact with acidic aerosol collected on filters in ≤10 s and form ammonium salts. These results are consistent with prior studies investigating this interference. Thus, due to the interaction of ammonia in the cabin of research aircraft, we suggest that a more realistic limit of detection of ammonium for the SAGA filters is 200 ng sm−3 versus the 10 ng sm−3 typically cited based on ion chromatography measurements. Finally, even though methods to reduce this bias have been implemented in several ground-based long-term filter measurements of inorganic aerosols, there are still some networks that collect inorganic aerosol without denuders to remove gas-phase ammonia, leading to similar discrepancies between ground networks as observed between filters and AMS on various aircraft campaigns. Careful practice in both aerosol collection and filter handling is necessary to better understand the emissions, chemistry, and chemical and physical properties of inorganic aerosol.
ARCTAS-A and ARCTAS-B measurements are available at https://doi.org/10.5067/SUBORBITAL/ARCTAS2008/DATA001 (ARCTAS Science Team, 2020). SEAC4RS measurements are available at https://doi.org/10.5067/Aircraft/SEAC4RS/Aerosol-TraceGas-Cloud (SEAC4RS Science Team, 2020). WINTER measurements are available at https://data.eol.ucar.edu/master_lists/generated/winter/ (last access: 27 April 2020, WINTER Science Team, 2020). ATom-1 and ATom-2 measurements are available at https://doi.org/10.3334/ORNLDAAC/1581 (Wofsy et al., 2018), https://doi.org/10.3334/ORNLDAAC/1613 (Wofsy and ATom Science Team, 2018), https://doi.org/10.3334/ORNLDAAC/1748 (Dibb, 2019), and https://doi.org/10.3334/ORNLDAAC/1716 (Jimenez et al., 2019). Ammonia and carbon dioxide measurements from the cabin of the DC-8 are available as an attachment. CSN and CASTNET measurements are available at http://views.cira.colostate.edu/fed/QueryWizard/Default.aspx (last access: 27 April 2020, FED, 2020). Figures are available at http://cires1.colorado.edu/jimenez/group_pubs.html (last access: 10 November 2020, Jimenez, 2020).
The supplement related to this article is available online at: https://doi.org/10.5194/amt-13-6193-2020-supplement.
BAN, PCJ, DAD, and JLJ designed the experiment and wrote the paper. BAN, PCJ, DAD, HG, AVH, DP, JCS, MKS, MJC, JED, WH, and BBP collected and analyzed the data. DSJ and AH ran GEOS-Chem and provided the output. All authors reviewed the paper.
The author declares that there is no conflict of interest.
This study was supported by the National Aeronautics and Space Administration (NASA). We thank Glenn Diskin and the DACOM team for the use of the CO2 measurements from FIREX-AQ, Armin Wisthaler for the use of the NH3 measurements from FIREX-AQ, Paul Wennberg for the use of HCN measurements from FIREX-AQ, Bruce Anderson, Luke Ziemba, and the LARGE team for the use of the LAS volume distribution from SEAC4RS, Karl Froyd, Greggory Schill, and Daniel Murphy for the use of the PALMS observations from ATom-1 and ATom-2, and Charles Brock, Agnieszka Kupc, and Christina Williamson for the volume distribution measurements during ATom-1 and ATom-2. Also, we thank J. Andrew Neuman for the use of the Picarro G2103 during FIREX-AQ. We thank the crew of the DC-8 and C-130 aircraft for extensive support in the field deployments. We specifically thank Adam Webster and the crew of the NASA DC-8 for their assistance and persistence in allowing us to install the Picarro G2103 during FIREX-AQ in order to measure ammonia in the cabin.
This research has been supported by the National Aeronautics and Space Administration (grant nos. NNX15AH33A, NNX15AJ23G, 80NSSC18K0630, 80NSSC19K0124).
This paper was edited by Pierre Herckes and reviewed by two anonymous referees.
Abbatt, J. P. D., Benz, S., Cziczo, D. J., Kanji, Z., Lohmann, U., and Möhler, O.: Solid ammonium sulfate aerosols as ice nuclei: a pathway for cirrus cloud formation, Science, 313, 1770–1773, 2006.
Aknan, A.: NASA Airborne Science Data for Atmospheric Composition, TAbMEP2 POLARCAT Preliminary Assessment Reports, available at: https://www-air.larc.nasa.gov// (last access: 3 June 2020), 2015.
Ampollini, L., Katz, E. F., Bourne, S., Tian, Y., Novoselac, A., Goldstein, A. H., Lucic, G., Waring, M. S., and DeCarlo, P. F.: Observations and Contributions of Real-Time Indoor Ammonia Concentrations during HOMEChem, Environ. Sci. Technol., 53, 8591–8598, 2019.
ARCTAS Science Team: ARCTAS Data, NASA Langley Research Center, available at: https://doi.org/10.5067/SUBORBITAL/ARCTAS2008/DATA001, 2020.
Bahreini, R., Dunlea, E. J., Matthew, B. M., Simons, C., Docherty, K. S., DeCarlo, P. F., Jimenez, J. L., Brock, C. A., and Middlebrook, A. M.: Design and Operation of a Pressure-Controlled Inlet for Airborne Sampling with an Aerodynamic Aerosol Lens, Aerosol Sci. Technol., 42, 465–471, 2008.
Bahreini, R., Ervens, B., Middlebrook, A. M., Warneke, C., De Gouw, J. A., DeCarlo, P. F., Jimenez, J. L., Brock, C. A., Neuman, J. A., Ryerson, T. B., Stark, H., Atlas, E., Brioude, J., Fried, A., Holloway, J. S., Peischl, J., Richter, D., Walega, J., Weibring, P., Wollny, A. G., and Fehsenfeid, F. C.: Organic aerosol formation in urban and industrial plumes near Houston and Dallas, Texas, J. Geophys. Res.-Atmos., 114, 1–17, 2009.
Baltensperger, U., Barrie, L., Frohlich, C., Gras, J., Jager, H., Jennings, S. G., Li, S.-M., Ogren, J., Widensohler, A., Wehrli, C., and Wilson, J.: WMO/GAW Aerosol Measurement Procedures Guidelines and Recommendations, WMO GAW, available at: https://library.wmo.int/doc_num.php?explnum_id=9244, 2003.
Brock, C. A., Williamson, C., Kupc, A., Froyd, K. D., Erdesz, F., Wagner, N., Richardson, M., Schwarz, J. P., Gao, R.-S., Katich, J. M., Campuzano-Jost, P., Nault, B. A., Schroder, J. C., Jimenez, J. L., Weinzierl, B., Dollner, M., Bui, T., and Murphy, D. M.: Aerosol size distributions during the Atmospheric Tomography Mission (ATom): methods, uncertainties, and data products, Atmos. Meas. Tech., 12, 3081–3099, https://doi.org/10.5194/amt-12-3081-2019, 2019.
Brundrett, G.: Comfort and health in commercial aircraft: a literature review, J. R. Soc. Promot. Health, 121, 29–37, 2001.
Canagaratna, M. R., Jayne, J. T., Jimenez, J. L., Allan, J. D., Alfarra, M. R., Zhang, Q., Onasch, T. B., Drewnick, F., Coe, H., Middlebrook, A., Delia, A., Williams, L. R., Trimborn, A. M., Northway, M. J., DeCarlo, P. F., Kolb, C. E., Davidovits, P., and Worsnop, D. R.: Chemical and microphysical characterization of ambient aerosols with the aerodyne aerosol mass spectrometer, Mass Spectrom. Rev., 26, 185–222, 2007.
Cheng, Y. and He, K.-B.: Measurement of carbonaceous aerosol with different sampling configurations and frequencies, Atmos. Meas. Tech., 8, 2639–2648, https://doi.org/10.5194/amt-8-2639-2015, 2015.
Chow, J. C., Watson, J. G., Lowenthal, D. H., and Magliano, K. L.: Loss of PM2.5 Nitrate from Filter Samples in Central California, J. Air Waste Manage. Assoc., 55, 1158–1168, 2005.
Chow, J. C., Watson, J. G., Chen, L.-W. A., Rice, J., and Frank, N. H.: Quantification of PM2.5 organic carbon sampling artifacts in US networks, Atmos. Chem. Phys., 10, 5223–5239, https://doi.org/10.5194/acp-10-5223-2010, 2010.
Clark, K. W., Anderson, K. R., Linn, W. S., and Gong, H., Jr: Influence of breathing-zone ammonia on human exposures to acid aerosol pollution, J. Air Waste Manag. Assoc., 45, 923–925, 1995.
Cohen, A. J., Brauer, M., Burnett, R., Anderson, H. R., Frostad, J., Estep, K., Balakrishnan, K., Brunekreef, B., Dandona, L., Dandona, R., Feigin, V., Freedman, G., Hubbell, B., Jobling, A., Kan, H., Knibbs, L., Liu, Y., Martin, R., Morawska, L., Pope, C. A., Shin, H., Straif, K., Shaddick, G., Thomas, M., van Dingenen, R., van Donkelaar, A., Vos, T., Murray, C. J. L., and Forouzanfar, M. H.: Estimates and 25-year trends of the global burden of disease attributable to ambient air pollution: an analysis of data from the Global Burden of Diseases Study 2015, Lancet, 389, 1907–1918, 2017.
Colberg, C. A., Luo, B. P., Wernli, H., Koop, T., and Peter, Th.: A novel model to predict the physical state of atmospheric aerosol particles, Atmos. Chem. Phys., 3, 909–924, https://doi.org/10.5194/acp-3-909-2003, 2003.
Coury, C. and Dillner, A. M.: ATR-FTIR characterization of organic functional groups and inorganic ions in ambient aerosols at a rural site, Atmos. Environ., 43, 940–948, 2009.
Cozic, J., Verheggen, B., Weingartner, E., Crosier, J., Bower, K. N., Flynn, M., Coe, H., Henning, S., Steinbacher, M., Henne, S., Collaud Coen, M., Petzold, A., and Baltensperger, U.: Chemical composition of free tropospheric aerosol for PM1 and coarse mode at the high alpine site Jungfraujoch, Atmos. Chem. Phys., 8, 407–423, https://doi.org/10.5194/acp-8-407-2008, 2008.
Cubison, M. J., Ortega, A. M., Hayes, P. L., Farmer, D. K., Day, D., Lechner, M. J., Brune, W. H., Apel, E., Diskin, G. S., Fisher, J. A., Fuelberg, H. E., Hecobian, A., Knapp, D. J., Mikoviny, T., Riemer, D., Sachse, G. W., Sessions, W., Weber, R. J., Weinheimer, A. J., Wisthaler, A., and Jimenez, J. L.: Effects of aging on organic aerosol from open biomass burning smoke in aircraft and laboratory studies, Atmos. Chem. Phys., 11, 12049–12064, https://doi.org/10.5194/acp-11-12049-2011, 2011.
Daumer, B., Niessner, R., and Klockow, D.: Laboratory studies of the influence of thin organic films on the neutralization reaction of H2SO4 aerosol with ammonia, J. Aerosol Sci., 23, 315–325, 1992.
DeCarlo, P. F., Kimmel, J. R., Trimborn, A., Northway, M. J., Jayne, J. T., Aiken, A. C., Gonin, M., Fuhrer, K., Horvath, T., Docherty, K. S., Worsnop, D. R., and Jimenez, J. L.: Field-deployable, high-resolution, time-of-flight aerosol mass spectrometer, Anal. Chem., 78, 8281–8289, 2006.
DeCarlo, P. F., Dunlea, E. J., Kimmel, J. R., Aiken, A. C., Sueper, D., Crounse, J., Wennberg, P. O., Emmons, L., Shinozuka, Y., Clarke, A., Zhou, J., Tomlinson, J., Collins, D. R., Knapp, D., Weinheimer, A. J., Montzka, D. D., Campos, T., and Jimenez, J. L.: Fast airborne aerosol size and chemistry measurements above Mexico City and Central Mexico during the MILAGRO campaign, Atmos. Chem. Phys., 8, 4027–4048, https://doi.org/10.5194/acp-8-4027-2008, 2008.
Dentener, F. J. and Crutzen, P. J.: A three-dimensional model of the global ammonia cycle, J. Atmos. Chem., 19, 331–369, 1994.
Dibb, J. E.: ATom: Measurements of Soluble Acidic Gases and Aerosols (SAGA), ORNL DAAC, Oak Ridge, Tennessee, USA, https://doi.org/10.3334/ORNLDAAC/1748, 2019.
Dibb, J. E., Talbot, R. W., Scheuer, E. M., Blake, D. R., Blake, N. J., Gregory, G. L., Sachse, G. W., and Thornton, D. C.: Aerosol chemical composition and distribution during the Pacific Exploratory Mission (PEM) Tropics, J. Geophys. Res., 104, 5785–5800, 1999.
Dibb, J. E., Talbot, R. W., and Scheuer, E. M.: Composition and distribution of aerosols over the North Atlantic during the Subsonic Assessment Ozone and Nitrogen Oxide Experiment (SONEX), J. Geophys. Res.-Atmos., 105, 3709–3717, 2000.
Dibb, J. E., Talbot, R. W., Seid, G., Jordan, C., Scheuer, E., Atlas, E., Blake, N. J., and Blake, D. R.: Airborne sampling of aerosol particles: Comparison between surface sampling at Christmas Island and P-3 sampling during PEM-Tropics B, J. Geophys. Res., 108, 11335, https://doi.org/10.1029/2001JD000408, 2002.
Dibb, J. E., Talbot, R. W., Scheuer, E. M., Seid, G., Avery, M. A. and Singh, H. B.: Aerosol chemical composition in Asian continental outflow during the TRACE-P campaign: Comparison with PEM-West B, J. Geophys. Res., 108, 8815, https://doi.org/10.1029/2002JD003111, 2003.
Dibb, J. E.: ATom: Measurements of Soluble Acidic Gases and Aerosols (SAGA), ORNL DAAC, Oak Ridge, Tennessee, USA, https://doi.org/10.3334/ORNLDAAC/1748, 2020.
Dzepina, K., Arey, J., Marr, L. C., Worsnop, D. R., Salcedo, D., Zhang, Q., Onasch, T. B., Molina, L. T., Molina, M. J., and Jimenez, J. L.: Detection of particle-phase polycyclic aromatic hydrocarbons in Mexico City using an aerosol mass spectrometer, Int. J. Mass Spectrom., 263, 152–170, 2007.
Faloona, I.: Sulfur processing in the marine atmospheric boundary layer: A review and critical assessment of modeling uncertainties, Atmos. Environ., 43, 2841–2854, 2009.
FED (The Federal Land Management Environmental Database): CSN and CASTNET Data, available at: https://views.cira.colostate.edu/fed/, last access: 27 April 2020.
Filges, A., Gerbig, C., Rella, C. W., Hoffnagle, J., Smit, H., Krämer, M., Spelten, N., Rolf, C., Bozóki, Z., Buchholz, B., and Ebert, V.: Evaluation of the IAGOS-Core GHG package H2O measurements during the DENCHAR airborne inter-comparison campaign in 2011, Atmos. Meas. Tech., 11, 5279–5297, https://doi.org/10.5194/amt-11-5279-2018, 2018.
Finewax, Z., Pagonis, D., Claflin, M. S., Handschy, A. V., Brown, W. L., Ba, J. O. N., Lerner, B. M., Jimenez, J. L., Ziemann, P. J., and de Gouw, J. A.: Quantification and source characterization of volatile organic compounds from exercising and application of chlorine-based cleaning products in a university athletic center, Indoor Air, in review, 2020.
Fisher, J. A., Jacob, D. J., Wang, Q., Bahreini, R., Carouge, C. C., Cubison, M. J., Dibb, J. E., Diehl, T., Jimenez, J. L., Leibensperger, E. M., Lu, Z., Meinders, M. B. J., Pye, H. O. T., Quinn, P. K., Sharma, S., Streets, D. G., van Donkelaar, A., and Yantosca, R. M.: Sources, distribution, and acidity of sulfate–ammonium aerosol in the Arctic in winter–spring, Atmos. Environ., 45, 7301–7318, 2011.
Freney, E., Sellegri Karine, S. K., Eija, A., Clemence, R., Aurelien, C., Jean-Luc, B., Aurelie, C., Hervo Maxime, H. M., Nadege, M., Laeticia, B., and David, P.: Experimental Evidence of the Feeding of the Free Troposphere with Aerosol Particles from the Mixing Layer, Aerosol Air Qual. Res., 16, 702–716, 2016.
Fröhlich, R., Cubison, M. J., Slowik, J. G., Bukowiecki, N., Canonaco, F., Croteau, P. L., Gysel, M., Henne, S., Herrmann, E., Jayne, J. T., Steinbacher, M., Worsnop, D. R., Baltensperger, U., and Prévôt, A. S. H.: Fourteen months of on-line measurements of the non-refractory submicron aerosol at the Jungfraujoch (3580 m a.s.l.) – chemical composition, origins and organic aerosol sources, Atmos. Chem. Phys., 15, 11373–11398, https://doi.org/10.5194/acp-15-11373-2015, 2015.
Froyd, K. D., Murphy, D. M., Sanford, T. J., Thomson, D. S., Wilson, J. C., Pfister, L., and Lait, L.: Aerosol composition of the tropical upper troposphere, Atmos. Chem. Phys., 9, 4363–4385, https://doi.org/10.5194/acp-9-4363-2009, 2009.
Froyd, K. D., Murphy, D. M., Brock, C. A., Campuzano-Jost, P., Dibb, J. E., Jimenez, J.-L., Kupc, A., Middlebrook, A. M., Schill, G. P., Thornhill, K. L., Williamson, C. J., Wilson, J. C., and Ziemba, L. D.: A new method to quantify mineral dust and other aerosol species from aircraft platforms using single-particle mass spectrometry, Atmos. Meas. Tech., 12, 6209–6239, https://doi.org/10.5194/amt-12-6209-2019, 2019.
Fuchs, N. A. and Sutugin, A. G.: High-Dispersed Aerosols, in: Topics in Current Aerosol Research, edited by: Hidy, G. M. and Brock, J. R., Pergamon, Osford, 1971.
Ge, C., Zhu, C., Francisco, J. S., Zeng, X. C., and Wang, J.: A molecular perspective for global modeling of upper atmospheric NH3 from freezing clouds, P. Natl. Acad. Sci. USA, 115, 6147–6152, 2018.
Guo, H., Xu, L., Bougiatioti, A., Cerully, K. M., Capps, S. L., Hite Jr., J. R., Carlton, A. G., Lee, S.-H., Bergin, M. H., Ng, N. L., Nenes, A., and Weber, R. J.: Fine-particle water and pH in the southeastern United States, Atmos. Chem. Phys., 15, 5211–5228, https://doi.org/10.5194/acp-15-5211-2015, 2015.
Guo, H., Sullivan, A. P., Campuzano-Jost, P., Schroder, J. C., Lopez-Hilfiker, F. D., Dibb, J. E., Jimenez, J. L., Thornton, J. A., Brown, S. S., Nenes, A., and Weber, R. J.: Fine particle pH and the partitioning of nitric acid during winter in the northeastern United States, J. Geophys. Res.-Atmos., 121, 10355–10376, 2016.
Guo, H., Nenes, A., and Weber, R. J.: The underappreciated role of nonvolatile cations in aerosol ammonium-sulfate molar ratios, Atmos. Chem. Phys., 18, 17307–17323, https://doi.org/10.5194/acp-18-17307-2018, 2018.
Guo, H., Campuzano-Jost, P., Nault, B. A., Day, D. A., Schroder, J. C., Dibb, J. E., Dollner, M., Weinzierl, B., and Jimenez, J. L.: The Importance of Size Ranges in Aerosol Instrument Intercomparisons: A Case Study for the ATom Mission, Atmos. Meas. Tech. Discuss., https://doi.org/10.5194/amt-2020-224, in review, 2020.
Hanson, D. and Kosciuch, E.: The NH3 Mass Accommodation Coefficient for Uptake onto Sulfuric Acid Solutions, J. Phys. Chem. A, 107, 2199–2208, 2003.
Hanson, D. R. and Kosciuch, E.: Reply to “Comment on 'The NH3 Mass Accommodation Coefficient for Uptake onto Sulfuric Acid Solutions' ”, J. Phys. Chem. A, 108, 8549–8551, 2004.
Hayes, D., Snetsinger, K., Ferry, G., Oberbeck, V., and Farlow, N.: Reactivity of stratospheric aerosols to small amounts of ammonia in the laboratory environment, Geophys. Res. Lett., 7, 974–976, 1980.
Heald, C. L. and Kroll, J. H.: The fuel of atmospheric chemistry: Toward a complete description of reactive organic carbon, Science Advances, 6, eaay8967, https://doi.org/10.1126/sciadv.aay8967, 2020.
Heald, C. L., Collett Jr., J. L., Lee, T., Benedict, K. B., Schwandner, F. M., Li, Y., Clarisse, L., Hurtmans, D. R., Van Damme, M., Clerbaux, C., Coheur, P.-F., Philip, S., Martin, R. V., and Pye, H. O. T.: Atmospheric ammonia and particulate inorganic nitrogen over the United States, Atmos. Chem. Phys., 12, 10295–10312, https://doi.org/10.5194/acp-12-10295-2012, 2012.
Heim, E. W., Dibb, J., Scheuer, E., Jost, P. C., Nault, B. A., Jimenez, J. L., Peterson, D., Knote, C., Fenn, M., Hair, J., Beyersdorf, A. J., Corr, C., and Anderson, B. E.: Asian dust observed during KORUS-AQ facilitates the uptake and incorporation of soluble pollutants during transport to South Korea, Atmos. Environ., 224, 117305, https://doi.org/10.1016/j.atmosenv.2020.117305, 2020.
Hennigan, C. J., Sullivan, A. P., Fountoukis, C. I., Nenes, A., Hecobian, A., Vargas, O., Peltier, R. E., Case Hanks, A. T., Huey, L. G., Lefer, B. L., Russell, A. G., and Weber, R. J.: On the volatility and production mechanisms of newly formed nitrate and water soluble organic aerosol in Mexico City, Atmos. Chem. Phys., 8, 3761–3768, https://doi.org/10.5194/acp-8-3761-2008, 2008.
Hennigan, C. J., Izumi, J., Sullivan, A. P., Weber, R. J., and Nenes, A.: A critical evaluation of proxy methods used to estimate the acidity of atmospheric particles, Atmos. Chem. Phys., 15, 2775–2790, https://doi.org/10.5194/acp-15-2775-2015, 2015.
Henze, D. K., Seinfeld, J. H., and Shindell, D. T.: Inverse modeling and mapping US air quality influences of inorganic PM2.5 precursor emissions using the adjoint of GEOS-Chem, Atmos. Chem. Phys., 9, 5877–5903, https://doi.org/10.5194/acp-9-5877-2009, 2009.
Hering, S. and Cass, G.: The Magnitude of Bias in the Measurement of PM25 Arising from Volatilization of Particulate Nitrate from Teflon Filters, J. Air Waste Manag. Assoc., 49, 725–733, 1999.
Hocking, M. B.: Indoor air quality: recommendations relevant to aircraft passenger cabins, Am. Ind. Hyg. Assoc. J., 59, 446–454, 1998.
Hodzic, A. and Duvel, J. P.: Impact of Biomass Burning Aerosols on the Diurnal Cycle of Convective Clouds and Precipitation Over a Tropical Island: Fire aerosols effect on deep convection, J. Geophys. Res.-Atmos., 123, 1017–1036, 2018.
Hodzic, A., Campuzano-Jost, P., Bian, H., Chin, M., Colarco, P. R., Day, D. A., Froyd, K. D., Heinold, B., Jo, D. S., Katich, J. M., Kodros, J. K., Nault, B. A., Pierce, J. R., Ray, E., Schacht, J., Schill, G. P., Schroder, J. C., Schwarz, J. P., Sueper, D. T., Tegen, I., Tilmes, S., Tsigaridis, K., Yu, P., and Jimenez, J. L.: Characterization of organic aerosol across the global remote troposphere: a comparison of ATom measurements and global chemistry models, Atmos. Chem. Phys., 20, 4607–4635, https://doi.org/10.5194/acp-20-4607-2020, 2020.
Hu, W., Hu, M., Hu, W., Jimenez, J. L., Yuan, B., Chen, W., Wang, M., Wu, Y., Chen, C., Wang, Z., Peng, J., Zeng, L., and Shao, M.: Chemical composition, sources, and aging process of submicron aerosols in Beijing: Contrast between summer and winter, J. Geophys. Res.-Atmos., 121, 1955–1977, 2016.
Hu, W., Campuzano-Jost, P., Day, D. A., Croteau, P., Canagaratna, M. R., Jayne, J. T., Worsnop, D. R., and Jimenez, J. L.: Evaluation of the new capture vaporizer for aerosol mass spectrometers (AMS) through field studies of inorganic species, Aerosol Sci. Tech., 51, 735–754, 2017a.
Hu, W., Campuzano-Jost, P., Day, D. A., Croteau, P., Canagaratna, M. R., Jayne, J. T., Worsnop, D. R., and Jimenez, J. L.: Evaluation of the new capture vapourizer for aerosol mass spectrometers (AMS) through laboratory studies of inorganic species, Atmos. Meas. Tech., 10, 2897–2921, https://doi.org/10.5194/amt-10-2897-2017, 2017b.
Hu, W., Campuzano-Jost, P., Day, D. A., Nault, B. A., Park, T., Lee, T., Pajunoja, A., Virtanen, A., Croteau, P., Canagaratna, M. R., Jayne, J. T., Worsnop, D. R., and Jimenez, J. L.: Ambient Quantification and Size Distributions for Organic Aerosol in Aerosol Mass Spectrometers with the New Capture Vaporizer, ACS Earth Space Chem., 4, 676–689, https://doi.org/10.1021/acsearthspacechem.9b00310, 2020.
Hunt, E. W. and Space, D. R.: The Airplane Cabin Environment: Issues Pertaining to Flight Attendant, in: Comfort, International in-flight Service Management Organization Conference, Montreal, Canada, available at: http://citeseerx.ist.psu.edu/viewdoc/summary?doi=10.1.1.304.7321 (last access: 25 March 2020), 1994.
Huntzicker, J. J., Cary, R. A., and Ling, C.-S.: Neutralization of sulfuric acid aerosol by ammonia, Environ. Sci. Technol., 14, 819–824, 1980.
Jacob, D. J., Crawford, J. H., Maring, H., Clarke, A. D., Dibb, J. E., Emmons, L. K., Ferrare, R. A., Hostetler, C. A., Russell, P. B., Singh, H. B., Thompson, A. M., Shaw, G. E., McCauley, E., Pederson, J. R., and Fisher, J. A.: The Arctic Research of the Composition of the Troposphere from Aircraft and Satellites (ARCTAS) mission: design, execution, and first results, Atmos. Chem. Phys., 10, 5191–5212, https://doi.org/10.5194/acp-10-5191-2010, 2010.
Jimenez, J. L.: Jimenez Group Peer-Reviewed Journal Publications, University of Colorado, Boulder, available at: http://cires1.colorado.edu/jimenez/group_pubs.html, last access: 10 November 2020.
Jimenez, J. L., Canagaratna, M. R., Donahue, N. M., Prevot, A. S. H., Zhang, Q., Kroll, J. H., DeCarlo, P. F., Allan, J. D., Coe, H., Ng, N. L., Aiken, A. C., Docherty, K. S., Ulbrich, I. M., Grieshop, A. P., Robinson, A. L., Duplissy, J., Smith, J. D., Wilson, K. R., Lanz, V. A., Hueglin, C., Sun, Y. L., Tian, J., Laaksonen, A., Raatikainen, T., Rautiainen, J., Vaattovaara, P., Ehn, M., Kulmala, M., Tomlinson, J. M., Collins, D. R., Cubison, M. J., Dunlea, E. J., Huffman, J. A., Onasch, T. B., Alfarra, M. R., Williams, P. I., Bower, K., Kondo, Y., Schneider, J., Drewnick, F., Borrmann, S., Weimer, S., Demerjian, K., Salcedo, D., Cottrell, L., Griffin, R., Takami, A., Miyoshi, T., Hatakeyama, S., Shimono, A., Sun, J. Y., Zhang, Y. M., Dzepina, K., Kimmel, J. R., Sueper, D., Jayne, J. T., Herndon, S. C., Trimborn, A. M., Williams, L. R., Wood, E. C., Middlebrook, A. M., Kolb, C. E., Baltensperger, U., and Worsnop, D. R.: Evolution of organic aerosols in the atmosphere, Science, 326, 1525–1529, 2009.
Jimenez, J. L., Campuzano-Jost, P., Day, D. A., Nault, B. A., Price, D. J., and Schroder, J. C.: ATom: L2 Measurements from CU High-Resolution Aerosol Mass Spectrometer (HR-AMS), ORNL DAAC, Oak Ridge, Tennessee, USA, https://doi.org/10.3334/ORNLDAAC/1716, 2019.
Kamp, J. N., Chowdhury, A., Adamsen, A. P. S., and Feilberg, A.: Negligible influence of livestock contaminants and sampling system on ammonia measurements with cavity ring-down spectroscopy, Atmos. Meas. Tech., 12, 2837–2850, https://doi.org/10.5194/amt-12-2837-2019, 2019.
Kim, H., Zhang, Q., and Heo, J.: Influence of intense secondary aerosol formation and long-range transport on aerosol chemistry and properties in the Seoul Metropolitan Area during spring time: results from KORUS-AQ, Atmos. Chem. Phys., 18, 7149–7168, https://doi.org/10.5194/acp-18-7149-2018, 2018.
Kim, P. S., Jacob, D. J., Fisher, J. A., Travis, K., Yu, K., Zhu, L., Yantosca, R. M., Sulprizio, M. P., Jimenez, J. L., Campuzano-Jost, P., Froyd, K. D., Liao, J., Hair, J. W., Fenn, M. A., Butler, C. F., Wagner, N. L., Gordon, T. D., Welti, A., Wennberg, P. O., Crounse, J. D., St. Clair, J. M., Teng, A. P., Millet, D. B., Schwarz, J. P., Markovic, M. Z., and Perring, A. E.: Sources, seasonality, and trends of southeast US aerosol: an integrated analysis of surface, aircraft, and satellite observations with the GEOS-Chem chemical transport model, Atmos. Chem. Phys., 15, 10411–10433, https://doi.org/10.5194/acp-15-10411-2015, 2015.
Kline, J., Huebert, B., Howell, S., Blomquist, B., Zhuang, J., Bertram, T., and Carrillo, J.: Aerosol composition and size versus altitude measured from the C-130 during ACE-Asia, J. Geophys. Res., 109, D19S08, https://doi.org/10.1029/2004JD004540, 2004.
Klockow, D., Jablonski, B., and Nießer, R.: Possible artifacts in filter sampling of atmospheric sulphuric acid and acidic sulphates, Atmos. Environ., 13, 1665–1676, 1979.
Koutrakis, P., Wolfson, J. M., and Spengler, J. D.: An improved method for measuring aerosol strong acidity: Results from a nine-month study in St Louis, Missouri and Kingston, Tennessee, Atmos. Environ., 22, 157–162, 1988.
Kupc, A., Williamson, C., Wagner, N. L., Richardson, M., and Brock, C. A.: Modification, calibration, and performance of the Ultra-High Sensitivity Aerosol Spectrometer for particle size distribution and volatility measurements during the Atmospheric Tomography Mission (ATom) airborne campaign, Atmos. Meas. Tech., 11, 369–383, https://doi.org/10.5194/amt-11-369-2018, 2018.
Larson, T. V., Covert, D. S., Frank, R., and Charlson, R. J.: Ammonia in the human airways: neutralization of inspired acid sulfate aerosols, Science, 197, 161–163, 1977.
Lavery, T. F., Rogers, C. M., Baumgardner, R., and Mishoe, K. P.: Intercomparison of Clean Air Status and Trends Network Nitrate and Nitric Acid Measurements with Data from Other Monitoring Programs, J. Air Waste Manag. Assoc., 59, 214–226, 2009.
Liao, J., Froyd, K. D., Murphy, D. M., Keutsch, F. N., Yu, G., Wennberg, P. O., St Clair, J. M., Crounse, J. D., Wisthaler, A., Mikoviny, T., Jimenez, J. L., Campuzano-Jost, P., Day, D. A., Hu, W., Ryerson, T. B., Pollack, I. B., Peischl, J., Anderson, B. E., Ziemba, L. D., Blake, D. R., Meinardi, S., and Diskin, G.: Airborne measurements of organosulfates over the continental U.S, J. Geophys. Res.-Atmos., 120, 2990–3005, 2015.
Liggio, J., Li, S.-M., Vlasenko, A., Stroud, C., and Makar, P.: Depression of ammonia uptake to sulfuric acid aerosols by competing uptake of ambient organic gases, Environ. Sci. Technol., 45, 2790–2796, 2011.
Li, M., Weschler, C. J., Bekö, G., Wargocki, P., Lucic, G., and Williams, J.: Human Ammonia Emission Rates under Various Indoor Environmental Conditions, Environ. Sci. Technol., 54, 5419–5428, https://doi.org/10.1021/acs.est.0c00094, 2020.
Liu, C.-N., Lin, S.-F., Awasthi, A., Tsai, C.-J., Wu, Y.-C., and Chen, C.-F.: Sampling and conditioning artifacts of PM2.5 in filter-based samplers, Atmos. Environ., 85, 48–53, 2014.
Liu, C.-N., Lin, S.-F., Tsai, C.-J., Wu, Y.-C., and Chen, C.-F.: Theoretical model for the evaporation loss of PM2.5 during filter sampling, Atmos. Environ., 109, 79–86, 2015.
Liu, M., Huang, X., Song, Y., Tang, J., Cao, J., Zhang, X., Zhang, Q., Wang, S., Xu, T., Kang, L., Cai, X., Zhang, H., Yang, F., Wang, H., Yu, J. Z., Lau, A. K. H., He, L., Huang, X., Duan, L., Ding, A., Xue, L., Gao, J., Liu, B., and Zhu, T.: Ammonia emission control in China would mitigate haze pollution and nitrogen deposition, but worsen acid rain, P. Natl. Acad. Sci. USA, 116, 7760–7765, 2019.
Liu, T., Clegg, S. L., and Abbatt, J. P. D.: Fast oxidation of sulfur dioxide by hydrogen peroxide in deliquesced aerosol particles, P. Natl. Acad. Sci. USA, 117, 1354–1359, 2020.
Liu, X., Zhang, Y., Huey, L. G., Yokelson, R. J., Wang, Y., Jimenez, J. L., Campuzano-Jost, P., Beyersdorf, A. J., Blake, D. R., Choi, Y., St. Clair, J. M., Crounse, J. D., Day, D. A., Diskin, G. S., Fried, A., Hall, S. R., Hanisco, T. F., King, L. E., Meinardi, S., Mikoviny, T., Palm, B. B., Peischl, J., Perring, A. E., Pollack, I. B., Ryerson, T. B., Sachse, G., Schwarz, J. P., Simpson, I. J., Tanner, D. J., Thornhill, K. L., Ullmann, K., Weber, R. J., Wennberg, P. O., Wisthaler, A., Wolfe, G. M., and Ziemba, L. D.: Agricultural fires in the southeastern U.S. during SEAC4RS: Emissions of trace gases and particles and evolution of ozone, reactive nitrogen, and organic aerosol, J. Geophys. Res.-Atmos., 121, 7383–7414, 2016.
Liu, X., Huey, L. G., Yokelson, R. J., Selimovic, V., Simpson, I. J., Müller, M., Jimenez, J. L., Campuzano-Jost, P., Beyersdorf, A. J., Blake, D. R., Butterfield, Z., Choi, Y., Crounse, J. D., Day, D. A., Diskin, G. S., Dubey, M. K., Fortner, E., Hanisco, T. F., Hu, W., King, L. E., Kleinman, L., Meinardi, S., Mikoviny, T., Onasch, T. B., Palm, B. B., Peischl, J., Pollack, I. B., Ryerson, T. B., Sachse, G. W., Sedlacek, A. J., Shilling, J. E., Springston, S., St. Clair, J. M., Tanner, D. J., Teng, A. P., Wennberg, P. O., Wisthaler, A., and Wolfe, G. M.: Airborne measurements of western U.S. wildfire emissions: Comparison with prescribed burning and air quality implications, J. Geophys. Res.-Atmos., 122, 6108–6129, 2017.
Ma, S.-S., Yang, W., Zheng, C.-M., Pang, S.-F., and Zhang, Y.-H.: Subsecond measurements on aerosols: From hygroscopic growth factors to efflorescence kinetics, Atmos. Environ., 210, 177–185, 2019.
Malm, W. C., Sisler, J. F., Huffman, D., Eldred, R. A., and Cahill, T. A.: Spatial and seasonal trends in particle concentration and optical extinction in the United States, J. Geophys. Res., 99, 1347–1370, 1994.
Malm, W. C., Schichtel, B. A., Hand, J. L., and Collett Jr., J. L.: Concurrent Temporal and Spatial Trends in Sulfate and Organic Mass Concentrations Measured in the IMPROVE Monitoring Program, J. Geophys. Res.-Atmos., 122, 10462–10476, 2017.
Martin, N. A., Ferracci, V., Cassidy, N., and Hoffnagle, J. A.: The application of a cavity ring-down spectrometer to measurements of ambient ammonia using traceable primary standard gas mixtures, Appl. Phys. B, 122, 219, https://doi.org/10.1007/s00340-016-6486-9, 2016.
McNaughton, C. S., Clarke, A. D., Howell, S. G., Pinkerton, M., Anderson, B., Thornhill, L., Hudgins, C., Winstead, E., Dibb, J. E., Scheuer, E., and Maring, H.: Results from the DC-8 Inlet Characterization Experiment (DICE): Airborne versus surface sampling of mineral dust and sea salt aerosols, Aerosol Sci. Tech., 41, 136–159, 2007.
Meskhidze, N., Chameides, W. L., Nenes, A., and Chen, G.: Iron mobilization in mineral dust: Can anthropogenic SO2 emissions affect ocean productivity?, Geophys. Res. Lett., 30, 2085, https://doi.org/10.1029/2003GL018035, 2003.
Mezuman, K., Bauer, S. E., and Tsigaridis, K.: Evaluating secondary inorganic aerosols in three dimensions, Atmos. Chem. Phys., 16, 10651–10669, https://doi.org/10.5194/acp-16-10651-2016, 2016.
Middlebrook, A. M., Bahreini, R., Jimenez, J. L., and Canagaratna, M. R.: Evaluation of Composition-Dependent Collection Efficiencies for the Aerodyne Aerosol Mass Spectrometer using Field Data, Aerosol Sci. Tech., 46, 258–271, 2012.
Müller, M., Mikoviny, T., Feil, S., Haidacher, S., Hanel, G., Hartungen, E., Jordan, A., Märk, L., Mutschlechner, P., Schottkowsky, R., Sulzer, P., Crawford, J. H., and Wisthaler, A.: A compact PTR-ToF-MS instrument for airborne measurements of volatile organic compounds at high spatiotemporal resolution, Atmos. Meas. Tech., 7, 3763–3772, https://doi.org/10.5194/amt-7-3763-2014, 2014.
Murphy, D. M. and Thomson, D. S.: Laser Ionization Mass Spectroscopy of Single Aerosol Particles, Aerosol Sci. Tech., 22, 237–249, 1995.
Murphy, D. M., Froyd, K. D., Schwarz, J. P., and Wilson, J. C.: Observations of the chemical composition of stratospheric aerosol particles: The Composition of Stratospheric Particles, Q. J. Roy. Meteor. Soc., 140, 1269–1278, 2014.
Murray, B. J. and Bertram, A. K.: Inhibition of solute crystallisation in aqueous H+–NH–SO–H2O droplets, Phys. Chem. Chem. Phys., 10, 3287, https://doi.org/10.1039/B802216J, 2008.
Myhre, G., Shindell, D., Bréon, F.-M., Collins, W., Fuglestvedt, J., Huang, J., Koch, D., Lamarque, J.-F., Lee, D., Mendoza, B., Nakajima, T., Robock, A., Stephens, G., Takemura, T., and Zhang, H.: Anthropogenic and Natural Radiative Forcing, in: Climate Change 2013: The Physical Science Basis. Contribution of Working Group I to the Fifth Assessment Report of the Intergovernmental Panel on Climate Change, edited by: Stocker, T. F., Qin, D., Plattner, G.-K., Tignor, M., Allen, S. K., Boschung, J., Nauels, A., Xia, Y., Bex, V., and Midgley, P. M., Cambridge University Press, Cambridge, United Kingdom and New York, NY, USA, 659 pp., 2013.
National Research Council: The Airliner Cabin Environment and the Health of Passengers and Crew, The National Academies Press, Washington, DC, USA, 2002.
Nault, B. A., Campuzano-Jost, P., Day, D. A., Schroder, J. C., Anderson, B., Beyersdorf, A. J., Blake, D. R., Brune, W. H., Choi, Y., Corr, C. A., de Gouw, J. A., Dibb, J., DiGangi, J. P., Diskin, G. S., Fried, A., Huey, L. G., Kim, M. J., Knote, C. J., Lamb, K. D., Lee, T., Park, T., Pusede, S. E., Scheuer, E., Thornhill, K. L., Woo, J.-H., and Jimenez, J. L.: Secondary organic aerosol production from local emissions dominates the organic aerosol budget over Seoul, South Korea, during KORUS-AQ, Atmos. Chem. Phys., 18, 17769–17800, https://doi.org/10.5194/acp-18-17769-2018, 2018.
Nenes, A., Pandis, S. N., Kanakidou, M., Russell, A., Song, S., Vasilakos, P., and Weber, R. J.: Aerosol acidity and liquid water content regulate the dry deposition of inorganic reactive nitrogen, Atmos. Chem. Phys. Discuss., https://doi.org/10.5194/acp-2020-266, in review, 2020a.
Nenes, A., Pandis, S. N., Weber, R. J., and Russell, A.: Aerosol pH and liquid water content determine when particulate matter is sensitive to ammonia and nitrate availability, Atmos. Chem. Phys., 20, 3249–3258, https://doi.org/10.5194/acp-20-3249-2020, 2020b.
Nguyen, T. K. V., Zhang, Q., Jimenez, J. L., Pike, M., and Carlton, A. G.: Liquid water: Ubiquitous contributor to aerosol mass, Environ. Sci. Technol. Lett., 3, 257–263, 2016.
Nie, W., Wang, T., Gao, X., Pathak, R. K., Wang, X., Gao, R., Zhang, Q., Yang, L., and Wang, W.: Comparison among filter-based, impactor-based and continuous techniques for measuring atmospheric fine sulfate and nitrate, Atmos. Environ., 44, 4396–4403, 2010.
Pagonis, D., Price, D. J., Algrim, L. B., Day, D. A., Handschy, A. V., Stark, H., Miller, S. L., de Gouw, J., Jimenez, J. L., and Ziemann, P. J.: Time-Resolved Measurements of Indoor Chemical Emissions, Deposition, and Reactions in a University Art Museum, Environ. Sci. Technol., 53, 4794–4802, 2019.
Paulot, F., Jacob, D. J., Johnson, M. T., Bell, T. G., Baker, A. R., Keene, W. C., Lima, I. D., Doney, S. C., and Stock, C. A.: Global oceanic emission of ammonia: Constraints from seawater and atmospheric observations, Global Biogeochem. Cy., 29, 1165–1178, 2015.
Pratt, K. A. and Prather, K. A.: Aircraft measurements of vertical profiles of aerosol mixing states, J. Geophys. Res., 115, D11305, https://doi.org/10.1029/2009JD013150, 2010.
Price, H. C., Mattsson, J., Zhang, Y., Bertram, A. K., Davies, J. F., Grayson, J. W., Martin, S. T., O'Sullivan, D., Reid, J. P., Rickards, A. M. J., and Murray, B. J.: Water diffusion in atmospherically relevant α-pinene secondary organic material, Chem. Sci., 6, 4876–4883, 2015.
Pye, H. O. T., Nenes, A., Alexander, B., Ault, A. P., Barth, M. C., Clegg, S. L., Collett Jr., J. L., Fahey, K. M., Hennigan, C. J., Herrmann, H., Kanakidou, M., Kelly, J. T., Ku, I.-T., McNeill, V. F., Riemer, N., Schaefer, T., Shi, G., Tilgner, A., Walker, J. T., Wang, T., Weber, R., Xing, J., Zaveri, R. A., and Zuend, A.: The acidity of atmospheric particles and clouds, Atmos. Chem. Phys., 20, 4809–4888, https://doi.org/10.5194/acp-20-4809-2020, 2020.
Robbins, R. C. and Cadle, R. D.: Kinetics of the Reaction between Gaseous Ammonia and Sulfuric Acid Droplets in an Aerosol, J. Phys. Chem., 62, 469–471, 1958.
Rumble, J. R. (Ed.): CRC Handbook of Chemistry and Physics, 100th edn., 2019–2020, Taylor & Francis Group, Boca Raton, FL, 2019.
Schauer, C., Niessner, R., and Pöschl, U.: Polycyclic aromatic hydrocarbons in urban air particulate matter: decadal and seasonal trends, chemical degradation, and sampling artifacts, Environ. Sci. Technol., 37, 2861–2868, 2003.
Schroder, J. C., Campuzano-Jost, P., Day, D. A., Shah, V., Larson, K., Sommers, J. M., Sullivan, A. P., Campos, T., Reeves, J. M., Hills, A., Hornbrook, R. S., Blake, N. J., Scheuer, E., Guo, H., Fibiger, D. L., McDuffie, E. E., Hayes, P. L., Weber, R. J., Dibb, J. E., Apel, E. C., Jaeglé, L., Brown, S. S., Thronton, J. A., and Jimenez, J. L.: Sources and Secondary Production of Organic Aerosols in the Northeastern US during WINTER, J. Geophys. Res.-Atmos., 123, 7771–7796, https://doi.org/10.1029/2018JD028475, 2018.
SEAC4RS Science Team: SEAC4RS Data, NASA Langley Research Center, https://doi.org/10.5067/Aircraft/SEAC4RS/Aerosol-TraceGas-Cloud, 2020.
Seinfeld, J. H. and Pandis, S. N.: Atmospheric Chemistry and Physics: From Air Pollution to Climate Change, 2nd. edn., John Wiley & Sons, Inc., Hoboken, NJ, USA, 2006.
Shingler, T., Crosbie, E., Ortega, A., Shiraiwa, M., Zuend, A., Beyersdorf, A., Ziemba, L., Anderson, B., Thornhill, L., Perring, A. E., Schwarz, J. P., Campazano-Jost, P., Day, D. A., Jimenez, J. L., Hair, J. W., Mikoviny, T., Wisthaler, A., and Sorooshian, A.: Airborne characterization of subsaturated aerosol hygroscopicity and dry refractive index from the surface to 6.5 km during the SEAC4RS campaign, J. Geophys. Res.-Atmos., 121, 4188–4210, 2016.
Shiraiwa, M., Ammann, M., Koop, T., and Pöschl, U.: Gas uptake and chemical aging of semisolid organic aerosol particles, P. Natl. Acad. Sci. USA, 108, 11003–11008, 2011.
Slade, J. H., Ault, A. P., Bui, A. T., Ditto, J. C., Lei, Z., Bondy, A. L., Olson, N. E., Cook, R. D., Desrochers, S. J., Harvey, R. M., Erickson, M. H., Wallace, H. W., Alvarez, S. L., Flynn, J. H., Boor, B. E., Petrucci, G. A., Gentner, D. R., Griffin, R. J., and Shepson, P. B.: Bouncier Particles at Night: Biogenic Secondary Organic Aerosol Chemistry and Sulfate Drive Diel Variations in the Aerosol Phase in a Mixed Forest, Environ. Sci. Technol., 53, 4977–4987, 2019.
Solomon, P. A., Mitchell, W., Tolocka, M., Norris, G., Gemmill, D., Wiener, R., Vanderpool, R., Murdoch, R., Natarajan, S., and Hardison, E.: Evaluation of PM2.5 Chemical Speciation Samplers for Use in the EPA National PM2.5 Chemical Speciation Network, Volume I – Introduction, Results, and Conclusions Final Report, EPA, 456 pp., 2000.
Solomon, P. A., Crumpler, D., Flanagan, J. B., Jayanty, R. K. M., Rickman, E. E., and McDade, C. E.: U.S. national PM2.5 Chemical Speciation Monitoring Networks-CSN and IMPROVE: description of networks, J. Air Waste Manag. Assoc., 64, 1410–1438, 2014.
Song, S., Gao, M., Xu, W., Shao, J., Shi, G., Wang, S., Wang, Y., Sun, Y., and McElroy, M. B.: Fine-particle pH for Beijing winter haze as inferred from different thermodynamic equilibrium models, Atmos. Chem. Phys., 18, 7423–7438, https://doi.org/10.5194/acp-18-7423-2018, 2018.
Spiller, L. L.: Determination of Ammonia/Air Diffusion Coefficient Using Nafion Lined Tube, Anal. Lett., 22, 2561–2573, 1989.
Stith, J. L., Ramanathan, V., Cooper, W. A., Roberts, G. C., DeMott, P. J., Carmichael, G., Hatch, C. D., Adhikary, B., Twohy, C. H., Rogers, D. C., Baumgardner, D., Prenni, A. J., Campos, T., Gao, R., Anderson, J., and Feng, Y.: An overview of aircraft observations from the Pacific Dust Experiment campaign, J. Geophys. Res., 114, D05207, https://doi.org/10.1029/2008JD010924, 2009.
Sueper, D.: ToF_AMS Data Analysis Software Webpage, available at: http://cires1.colorado.edu/jimenez-group/wiki/index.php/ToF-AMS_Analysis_Software, last access: 31 October 2018.
Sun, K., Cady-Pereira, K., Miller, D. J., Tao, L., Zondlo, M. A., Nowak, J. B., Neuman, J. A., Mikoviny, T., Müller, M., Wisthaler, A., Scarino, A. J., and Hostetler, C. A.: Validation of TES ammonia observations at the single pixel scale in the San Joaquin Valley during DISCOVER-AQ, J. Geophys. Res.-Atmos., 120, 5140–5154, 2015.
Sun, Y., Zhang, Q., Macdonald, A. M., Hayden, K., Li, S. M., Liggio, J., Liu, P. S. K., Anlauf, K. G., Leaitch, W. R., Steffen, A., Cubison, M., Worsnop, D. R., van Donkelaar, A., and Martin, R. V.: Size-resolved aerosol chemistry on Whistler Mountain, Canada with a high-resolution aerosol mass spectrometer during INTEX-B, Atmos. Chem. Phys., 9, 3095–3111, https://doi.org/10.5194/acp-9-3095-2009, 2009.
Sutton, M. A., Dragosits, U., Tang, Y. S., and Fowler, D.: Ammonia emissions from non-agricultural sources in the UK, Atmos. Environ., 34, 855–869, 2000.
Sutton, M. A., Reis, S., Riddick, S. N., Dragosits, U., Nemitz, E., Theobald, M. R., Tang, Y. S., Braban, C. F., Vieno, M., Dore, A. J., Mitchell, R. F., Wanless, S., Daunt, F., Fowler, D., Blackall, T. D., Milford, C., Flechard, C. R., Loubet, B., Massad, R., Cellier, P., Personne, E., Coheur, P. F., Clarisse, L., Van Damme, M., Ngadi, Y., Clerbaux, C., Skjøth, C. A., Geels, C., Hertel, O., Wichink Kruit, R. J., Pinder, R. W., Bash, J. O., Walker, J. T., Simpson, D., Horváth, L., Misselbrook, T. H., Bleeker, A., Dentener, F., and de Vries, W.: Towards a climate-dependent paradigm of ammonia emission and deposition, Philos. T. Roy. Soc. B, 368, 20130166, https://doi.org/10.1098/rstb.2013.0166, 2013.
Swartz, E., Shi, Q., Davidovits, P., Jayne, J. T., Worsnop, D. R., and Kolb, C. E.: Uptake of Gas-Phase Ammonia. 2. Uptake by Sulfuric Acid Surfaces, J. Phys. Chem. A, 103, 8824–8833, 1999.
Talbot, R. W., Dibb, J. E., Lefer, B. L., Scheuer, E. M., Bradshaw, J. D., Sandholm, S. T., Smyth, S., Blake, D. R., Blake, N. J., Sachse, G. W., Collins, J. E., and Gregory, G. L.: Large-scale distributions of tropospheric nitric, formic, and acetic acids over the western Pacific basin during wintertime, J. Geophys. Res., 102, 28303–28313, 1997.
Tao, Y. and Murphy, J. G.: The sensitivity of PM2.5 acidity to meteorological parameters and chemical composition changes: 10-year records from six Canadian monitoring sites, Atmos. Chem. Phys., 19, 9309–9320, https://doi.org/10.5194/acp-19-9309-2019, 2019.
Thomson, D. S., Schein, M. E., and Murphy, D. M.: Particle Analysis by Laser Mass Spectrometry WB-57F Instrument Overview, Aerosol Sci. Technol., 33, 153–169, 2000.
Toon, O. B., Maring, H., Dibb, J., Ferrare, R., Jacob, D. J., Jensen, E. J., Luo, Z. J., Mace, G. G., Pan, L. L., Pfister, L., Rosenlof, K. H., Redemann, J., Reid, J. S., Singh, H. B., Thompson, A. M., Yokelson, R., Minnis, P., Chen, G., Jucks, K. W., and Pszenny, A.: Planning, implementation, and scientific goals of the Studies of Emissions and Atmospheric Composition, Clouds and Climate Coupling by Regional Surveys (SEAC4RS) field mission, J. Geophys. Res.-Atmos., 121, 4967–5009, 2016.
Vay, S. A., Woo, J.-H., Anderson, B. E., Thornhill, K. L., Blake, D. R., Westberg, D. J., Kiley, C. M., Avery, M. A., Sachse, G. W., Streets, D. G., Tsutsumi, Y., and Nolf, S. R.: Influence of regional-scale anthropogenic emissions on CO2 distributions over the western North Pacific, J. Geophys. Res., 108, 8801, https://doi.org/10.1029/2002JD003094, 2003.
Vay, S. A., Choi, Y., Vadrevu, K. P., Blake, D. R., Tyler, S. C., Wisthaler, A., Hecobian, A., Kondo, Y., Diskin, G. S., Sachse, G. W., Woo, J.-H., Weinheimer, A. J., Burkhart, J. F., Stohl, A., and Wennberg, P. O.: Patterns of CO2 and radiocarbon across high northern latitudes during International Polar Year 2008, J. Geophys. Res., 116, D14301, https://doi.org/10.1029/2011JD015643, 2011.
von Bobrutzki, K., Braban, C. F., Famulari, D., Jones, S. K., Blackall, T., Smith, T. E. L., Blom, M., Coe, H., Gallagher, M., Ghalaieny, M., McGillen, M. R., Percival, C. J., Whitehead, J. D., Ellis, R., Murphy, J., Mohacsi, A., Pogany, A., Junninen, H., Rantanen, S., Sutton, M. A., and Nemitz, E.: Field inter-comparison of eleven atmospheric ammonia measurement techniques, Atmos. Meas. Tech., 3, 91–112, https://doi.org/10.5194/amt-3-91-2010, 2010.
Walker, J. M., Philip, S., Martin, R. V., and Seinfeld, J. H.: Simulation of nitrate, sulfate, and ammonium aerosols over the United States, Atmos. Chem. Phys., 12, 11213–11227, https://doi.org/10.5194/acp-12-11213-2012, 2012.
Wang, J., Hoffmann, A. A., Park, R. J., Jacob, D. J., and Martin, S. T.: Global distribution of solid and aqueous sulfate aerosols: Effect of the hysteresis of particle phase transitions, J. Geophys. Res., 113, D11206, https://doi.org/10.1029/2007JD009367, 2008a.
Wang, J., Jacob, D. J., and Martin, S. T.: Sensitivity of sulfate direct climate forcing to the hysteresis of particle phase transitions, J. Geophys. Res., 113, D11207, https://doi.org/10.1029/2007JD009368, 2008b.
Warneke, C., Schwarz, J. P., Ryerson, T., Crawford, J., Dibb, J., Lefer, B., Roberts, J., Trainer, M., Murphy, D., Brown, S., Brewer, A., Gao, R.-S., and Fahey, D.: Fire Influence on Regional to Global Environments and Air Quality (FIREX-AQ): A NOAA/NASA Interagency Intensive Study of North American Fires, NOAA/NASA, available at: https://esrl.noaa.gov/csd/projects/firex-aq/whitepaper.pdf (last access: 1 June 2020), 2018.
Warner, J. X., Wei, Z., Strow, L. L., Dickerson, R. R., and Nowak, J. B.: The global tropospheric ammonia distribution as seen in the 13-year AIRS measurement record, Atmos. Chem. Phys., 16, 5467–5479, https://doi.org/10.5194/acp-16-5467-2016, 2016.
Warner, J. X., Dickerson, R. R., Wei, Z., Strow, L. L., Wang, Y., and Liang, Q.: Increased atmospheric ammonia over the world's major agricultural areas detected from space, Geophys. Res. Lett., 44, 2875–2884, 2017.
Watson, J. G., Chow, J. C., Chen, L. W. A., and Frank, N. H.: Methods to assess carbonaceous aerosol sampling artifacts for IMPROVE and other long-term networks, J. Air Waste Manag. Assoc., 59, 898–911, 2009.
Weber, R. J., Orsini, D., Daun, Y., Lee, Y.-N., Klotz, P. J., and Brechtel, F.: A Particle-into-Liquid Collector for Rapid Measurement of Aerosol Bulk Chemical Composition, Aerosol Sci. Technol., 35, 718–727, 2001.
Weber, R. J., Guo, H., Russell, A. G., and Nenes, A.: High aerosol acidity despite declining atmospheric sulfate concentrations over the past 15 years, Nat. Geosci., 9, 282–285, 2016.
Williamson, C., Kupc, A., Wilson, J., Gesler, D. W., Reeves, J. M., Erdesz, F., McLaughlin, R., and Brock, C. A.: Fast time response measurements of particle size distributions in the 3–60 nm size range with the nucleation mode aerosol size spectrometer, Atmos. Meas. Tech., 11, 3491–3509, https://doi.org/10.5194/amt-11-3491-2018, 2018.
Wilson, R. E.: Humidity Control by Means of Sulfuric Acid Solutions, with Critical Compilation of Vapor Pressure Data, J. Ind. Eng. Chem., 13, 326–331, 1921.
WINTER Science Team: WINTER Data, NCAR, available at: https://data.eol.ucar.edu/master_lists/generated/winter/, last access: 27 April 2020.
Wofsy, S. C. and ATom Science Team: ATom: Aircraft Flight Track and Navigational Data, ORNL DAAC, Oak Ridge, Tennessee, USA, https://doi.org/10.3334/ORNLDAAC/1613, 2018.
Wofsy, S. C., Afshar, S., Allen, H. M., Apel, E. C., Asher, E. C., Barletta, B., Bent, J., Bian, H., Biggs, B. C., Blake, D. R., Blake, N., Bourgeois, I., Brock, C. A., Brune, W. H., Budney, J. W., Bui, T. P., Butler, A., Campuzano-Jost, P., Chang, C. S., Chin, M., Commane, R., Correa, G., Crounse, J. D., Cullis, P. D., Daube, B. C., Day, D. A., Dean-Day, J. M., Dibb, J. E., DiGangi, J. P., Diskin, G. S., Dollner, M., Elkins, J. W., Erdesz, F., Fiore, A. M., Flynn, C. M., Froyd, K. D., Gesler, D. W., Hall, S. R., Hanisco, T. F., Hannun, R. A., Hills, A. J., Hintsa, E. J., Hoffman, A., Hornbrook, R. S., Huey, L. G., Hughes, S., Jimenez, J. L., Johnson, B. J., Katich, J. M., Keeling, R. F., Kim, M. J., Kupc, A., Lait, L. R., Lamarque, J.-F., Liu, J., McKain, K., Mclaughlin, R. J., Meinardi, S., Miller, D.O., Montzka, S. A., Moore, F. L., Morgan, E. J., Murphy, D. M., Murray, L.T., Nault, B. A., Neuman, J. A., Newman, P. A., Nicely, J. M., Pan, X., Paplawsky, W., Peischl, J., Prather, M. J., Price, D. J., Ray, E. A., Reeves, J. M., Richardson, M., Rollins, A. W., Rosenlof, K. H., Ryerson, T. B., Scheuer, E., Schill, G. P., Schroder, J. C., Schwarz, J. P., St.Clair, J. M., Steenrod, S. D., Stephens, B. B., Strode, S. A., Sweeney, C., Tanner, D., Teng, A. P., Thames, A. B., Thompson, C. R., Ullmann, K., Veres, P. R., Vieznor, N., Wagner, N. L., Watt, A., Weber, R., Weinzierl, B., Wennberg, P. O., Williamson, C. J., Wilson, J. C., Wolfe, G. M., Woods, C. T., and Zeng, L. H.: ATom: Merged Atmospheric Chemistry, Trace Gases,, Aerosols, ORNL DAAC, Oak Ridge, Tennessee, USA, https://doi.org/10.3334/ORNLDAAC/1581, 2018.
Worsnop, D. R., Williams, L. R., Kolb, C. E., Mozurkewich, M., Gershenzon, M., and Davidovits, P.: Comment on “The NH3 Mass Accommodation Coefficient for Uptake onto Sulfuric Acid Solution”, J. Phys. Chem. A, 108, 8546–8548, 2004.
Yao, X. H. and Zhang, L.: Supermicron modes of ammonium ions related to fog in rural atmosphere, Atmos. Chem. Phys., 12, 11165–11178, https://doi.org/10.5194/acp-12-11165-2012, 2012.
Zakoura, M., Kakavas, S., Nenes, A., and Pandis, S. N.: Size-resolved aerosol pH over Europe during summer, Atmos. Chem. Phys. Discuss., https://doi.org/10.5194/acp-2019-1146, in review, 2020.
Zhang, X., Smith, K. A., Worsnop, D. R., Jimenez, J., Jayne, J. T., and Kolb, C. E.: A Numerical Characterization of Particle Beam Collimation by an Aerodynamic Lens-Nozzle System: Part I. An Individual Lens or Nozzle, Aerosol Sci. Technol., 36, 617–631, 2002.
Zhang, X., Smith, K. A., Worsnop, D. R., Jimenez, J. L., Jayne, J. T., Kolb, C. E., Morris, J., and Davidovits, P.: Numerical Characterization of Particle Beam Collimation: Part II Integrated Aerodynamic-Lens–Nozzle System, Aerosol Sci. Technol., 38, 619–638, 2004.
Zhou, S., Collier, S., Jaffe, D. A., and Zhang, Q.: Free tropospheric aerosols at the Mt. Bachelor Observatory: more oxidized and higher sulfate content compared to boundary layer aerosols, Atmos. Chem. Phys., 19, 1571–1585, https://doi.org/10.5194/acp-19-1571-2019, 2019.