the Creative Commons Attribution 4.0 License.
the Creative Commons Attribution 4.0 License.
 | 20 Nov 2020
A thermal-dissociation–cavity ring-down spectrometer (TD-CRDS) for the detection of organic nitrates in gas and particle phases
Natalie I. Keehan
Bellamy Brownwood
Andrey Marsavin
Douglas A. Day
A thermal-dissociation–cavity ring-down spectrometer (TD-CRDS) was developed to measure NO2, peroxy nitrates (PNs), alkyl nitrates (ANs), and HNO3 in the gas and particle phase, built using a commercial Los Gatos Research NO2 analyzer. The detection limit of the TD-CRDS is 0.66 ppb for ANs, PNs, and HNO3 and 0.48 ppb for NO2. For all four classes of NOy, the time resolution for separate gas and particle measurements is 8 min, and for total gas + particle measurements it is 3 min. The accuracy of the TD-CRDS was tested by comparison of NO2 measurements with a chemiluminescent NOx monitor and aerosol-phase ANs with an aerosol mass spectrometer (AMS). N2O5 causes significant interference in the PN and AN channel under high oxidant concentration chamber conditions, and ozone pyrolysis causes a negative interference in the HNO3 channel. Both interferences can be quantified and corrected for but must be considered when using TD techniques for measurements of organic nitrates. This instrument has been successfully deployed for chamber measurements at widely varying concentrations, as well as ambient measurements of NOy.
- Article
(4799 KB) - Full-text XML
-
Supplement
(1831 KB) - BibTeX
- EndNote


Nitrogen-oxide-based functional groups are an area of significant interest in atmospheric oxidative chemistry. Organic nitrates are formed through reactions between volatile organic compounds (VOCs), of which the global majority are biogenic in origin (Seinfeld and Pankow, 2003; Perring et al., 2013) and NOx () or NO3 (Ng et al., 2017), which is predominantly anthropogenic in origin (Seinfeld and Pandis, 2006). The two major organic-nitrate products of these reactions are alkyl nitrates (ANs) of the form RONO2 and peroxy nitrates (PNs) of the form ROONO2. These organic nitrates play an important role in regulating ozone in the troposphere by serving as temporary reservoirs of NO2 (Buhr et al., 1990; Thornton et al., 2002). Equilibrium partitioning of high molecular-weight, low-volatility organic molecules occurs, causing some organics to condense onto existing particles (Jimenez et al., 2009). These secondary organic aerosols (SOAs) consist primarily of the highly oxidized products of VOC + oxidant reactions because of their increased molecular weight and higher polarity. Lower nighttime temperatures decrease volatility even further, leading to increased partitioning into the particle phase (Fry et al., 2013). Warmer temperatures, deposition, and chemistry within the particles change the equilibrium, resulting in the release of NO2. Because of long residence times of SOA, significant quantities of NO2 can be transported away from source regions by wind in reservoir form (Perring et al., 2013; Browne et al., 2013; Wolfe et al., 2007; Kim et al., 2014; Zare et al., 2018).
Different classes of organic nitrates dissociate in distinct temperature ranges, based upon the inherent stability of the molecules. At residence times of 30–90 ms in quartz tubes, peroxy nitrates (PNs, RO2NO2) dissociate at approximately 150 ∘C, alkyl nitrates (ANs, RONO2) at 350 ∘C, and nitric acid (HNO3) at 600 ∘C (Day et al., 2002). The dissociation temperatures are dependent on residence times, but there seems to be very little dependence on what constitutes the R group (Hao et al., 1994; Kirchner et al., 1999). This is useful for the detection of total peroxy and alkyl nitrates (ΣPNs and ΣANs, respectively) because they can be dissociated as a class, with identical detection efficiency regardless of the chemical nature of the R group. Reaction (R1) shows that the thermal dissociation of each class of organic nitrates results in one NO2 and a hydrocarbon-containing X group.
where X=RO2, RC(O)OO, RO, or OH.
PNs serve as a temporary reservoir of NO2 in the atmosphere because the equilibrium between formation and dissociation is rapid. For example,
has a Keq of cm3 molecules−1, resulting in a PN lifetime at 20 ppb NO2 of 0.56 s at 298 K and 1 bar (Atkinson et al., 2006; NASA/JPL Data Evaluation, 2015). In contrast, ANs and HNO3 predominantly serve as sinks of NO2, with spatial transport scales that depend on their meteorology-dependent deposition lifetimes (Horowitz et al., 2007).
Previous studies of organic nitrates have been done by measuring specific nitrates (Wolfe et al., 2007; Horowitz et al., 2007; Parrish and Fehsenfeld, 2000; Surratt et al., 2006; Lee et al., 2016) or by looking at the sum of nitrates using thermal-dissociation NO2 measurements (Zellweger et al., 1999; Day et al., 2002; Hargrove and Zhang, 2008; Paul et al., 2009; Rollins et al., 2010; Sobanski et al., 2016). The instrument described in this paper has drawn on aspects of three different thermal-dissociation nitrate measurement strategies in the literature. The general oven and flow plan was based on the thermal-dissociation–laser-induced fluorescence (TD-LIF) instrument built by the Cohen group at UC Berkeley (Day et al., 2002). Instead of LIF, the NO2 detection device in the instrument described here is a commercial cavity ring-down spectrometer (CRDS). Once interferences are characterized and absorption cross sections are known, the CRDS does not require in-line calibration by an authentic standard gas cylinder during sample measurement, as discussed in Paul et al. (2009). Gas–particle partitioning measurements using a switchable charcoal denuder were incorporated from Rollins et al. (2010).
The benefit of using a CRDS over chemiluminescence (CL) detection of NO2 is its selectivity. The (partial) thermal dissociation of multiple unstable nitrate compounds like ANs, PNs, and N2O5 into NO2 by the CL heating process and molybdenum catalyst has been well documented (Wooldridge et al., 2010). The CRDS can make direct measurements of NO2, unlike CL, which uses a metal catalyst to turn NO2 into NO and back-calculates NO2 concentration by subtraction. The CRDS does not require heating or a catalyst and is therefore more selective. LIF can be tuned to a specific spectroscopic transition like the CRDS and can be run at lower cell pressures that reduce recombination (see Sect. 3.7 below), but laser power becomes limiting for the measurement of low concentrations and requires delicately aligned multipass optical cells to achieve low limits of detection for NO2. The downsides of the CRDS come from the expense and delicateness of the instrument.
Since high molecular-weight oxidation products can condense into the particle phase, it is valuable to be able to make both gas and particle phase measurements. Denuders work by using diffusion to separate gases from liquid- or solid-phase particles. Higher diffusion rates for gases means that they are more readily absorbed into the walls of a charcoal denuder, leaving behind the particle phase. The fraction of gas removed depends on residence time in the denuder and the surface area available to diffusing gas molecules. The diffusion coefficient of NO2 is reported to be 0.154 cm2 s−1 (Williams et al., 2012) and 0.070 cm2 s−1 for n-propyl nitrate (Paul et al., 2009). According to previous studies using charcoal denuders, the denuder removed the majority of particles with diameters <0.1 µm (Glasius et al., 1999) as well as all semivolatile organic gases.
In order to measure concentrations of organic nitrates by thermal dissociation, a multi-channel, switchable, controllable heating inlet system was constructed. This heating unit was then attached to a cavity ring-down NO2 detector (CRDS, Los Gatos Research Inc. model no. 907-0009) to complete the instrument. An overall instrument schematic is shown in Fig. 1a.
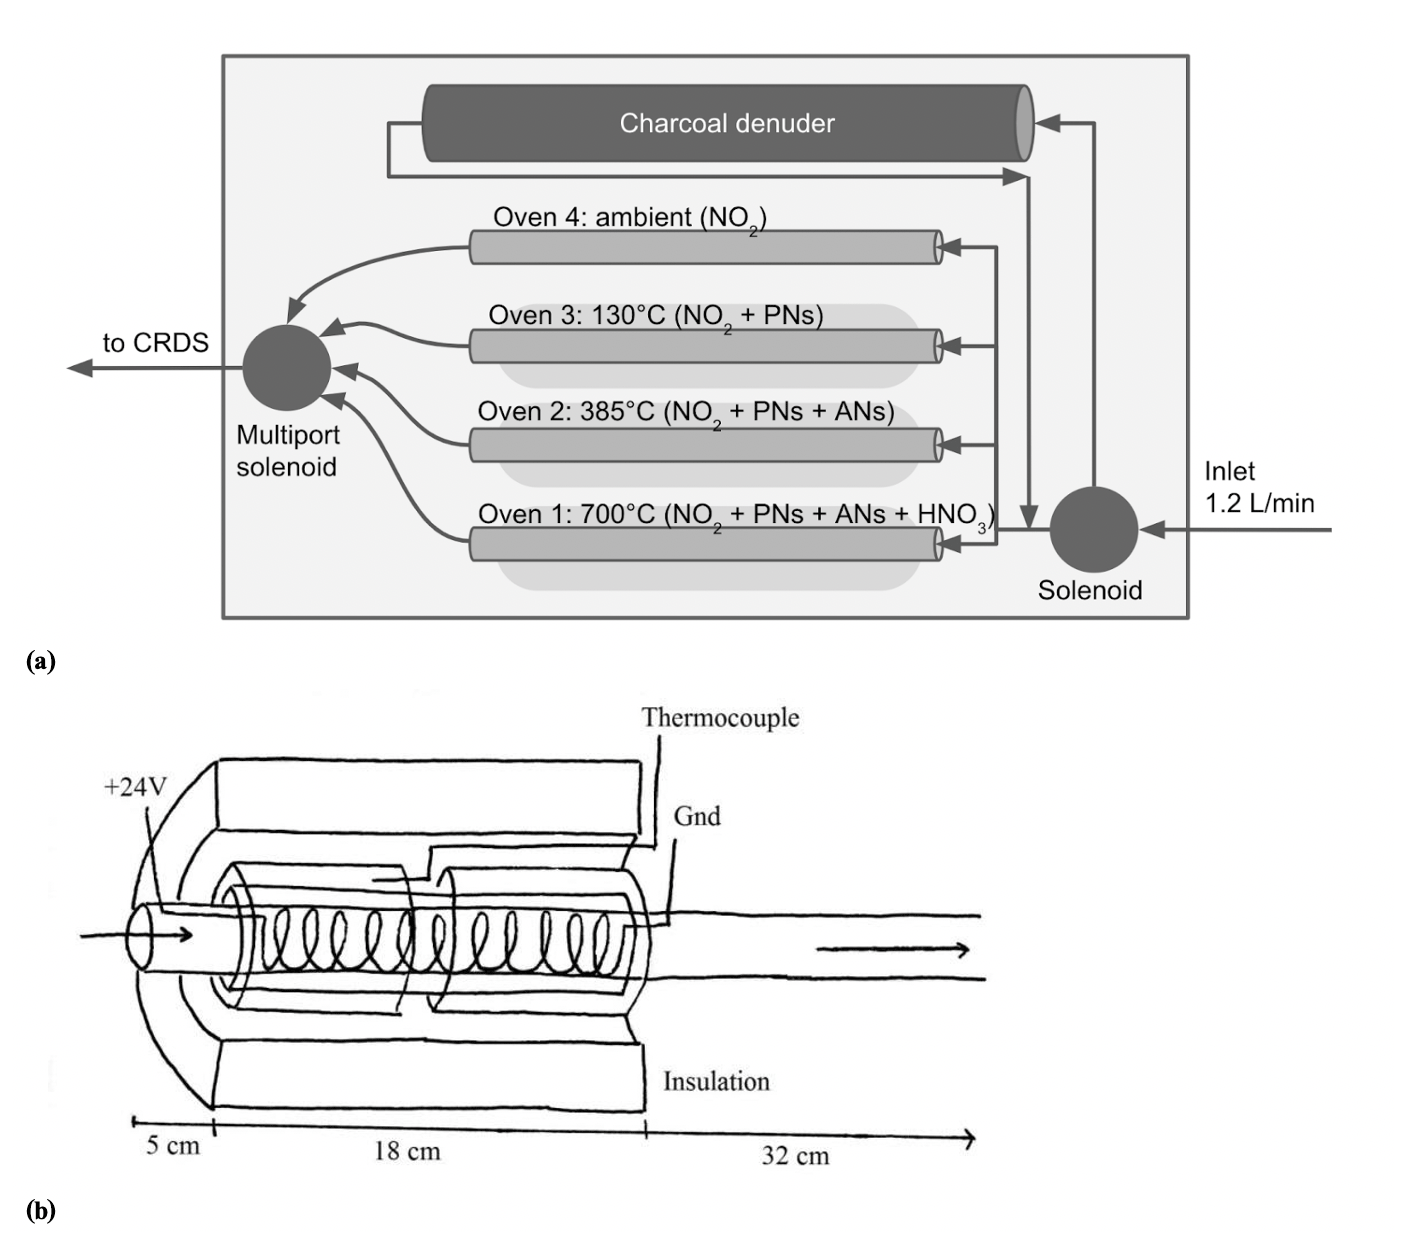
Figure 1(a) Diagram of thermal-dissociation inlet flow path. The downstream valve is a Teflon-wetted six-solenoid multiport valve. (b) Oven design. Arrows indicate direction of airflow. A photograph of the inlet box is shown in the Supplement, Fig. S1.
The three quartz tube ovens were constructed out of 55 cm long, 3.8 mm inner diameter (ID), 7.0 mm outer diameter (OD) quartz tube wrapped in 15 cm nichrome wire (2 mm wide ribbon with a resistivity of 11 Ω m−1) located 5 cm from one end. An 18 cm long, 8 mm ID, 10 mm OD quartz tube was slipped around the nichrome section to hold it in place. Over the 8 mm ID tubing, two 8 cm long, 10.5 mm ID, 13 mm OD quartz tubes were placed with a thermocouple in between to hold the end of the thermocouple in place. The whole heated section was wrapped in thick ceramic insulation (McMaster-Carr no. 9379K92) with foil coating, as shown in Fig. 1b. It is important to note that the heat capacity of the oven is determined by the effectiveness of the insulation. Insufficient insulation can result in unstable oven temperatures or increase the time required for the gas to reach the required dissociation temperature, leading to increased sampling times on each oven and a degradation of the time resolution of the instrument.
The thermocouple was placed so it was the same distance and glass thickness from the nichrome as the nichrome was from the gas flow, so it was hypothesized that the thermocouple temperature reading would be representative of the internal temperature of the oven. Experiments comparing this external thermocouple to a thermocouple placed at the same position inside the gas flow showed that the average internal oven temperature was between 25 and 30 ∘C hotter than the external thermocouple reading. Because of the oven design, the temperature inside the heated portion of the oven is not uniform but is hottest closest to the end of the nichrome section, nearer to the exhaust.
The unheated portion of the quartz tubing used in this instrument is significantly shorter in length than the length originally calculated in Day et al. (2002) due to additional testing reported in Paul et al. (2009). The shorter length was chosen to suppress the recombination reaction of NO2 radical with the organic sister product upon cooling. The shorter ovens were shown to effectively reduce residence time, and therefore recombination, but still allowed adequate time for gas cooling before entering the sampling chamber. A length of 55 cm was calculated from Eq. (1) using the Paul et al. (2009) CRDS flow rate (q=2.5 L m−1) and oven length (h=64 cm) in order to give our instrument equal residence times (τ, see Eq. 1). Since the flow rate of the Los Gatos Research (LGR) CRDS is significantly smaller (1.2 L m−1), the required tube length is shorter than that reported in Paul et al. (2009).
These ovens were attached to nominal 1∕4 inch (0.635 cm) Teflon tubing with Teflon Swagelok tees and unions. Teflon connectors were chosen over stainless steel to reduce destruction of NO2 by heated steel (Hargrove and Zhang, 2008). An oven-length piece of 1∕4 inch (0.635 cm) Teflon is used as the ambient temperature background NO2 channel, which has a typical temperature of 22–24 ∘C inside the inlet box. The three ovens and background channel connect to a six-port solenoid valve with Teflon wetted surfaces. The outlet of the solenoid valve runs to the inlet of the LGR CRDS.
The inlet of the instrument has two possible pre-oven pathways: denuded and undenuded. The denuder is a 45 cm long cylinder of activated charcoal with a 1∕4 inch (0.635 cm) channel through the center. A three-way, Teflon-wetted solenoid directs the inlet air either through the denuder or through an equivalent length of Teflon tubing before the air sample enters the ovens.
An Omega CN616TC1 temperature controller was used to regulate the temperature of the ovens. The inlet end of the oven nichrome wire was attached to the positive terminal of the Mouser 24VDC power supply and the exhaust end was wired to a Mouser DR06D12 solid-state relay. These relays received signals from the temperature controller, either allowing or prohibiting current flow through the nichrome wire by completing the circuit loop. The temperature controller was able to detect the temperature of the ovens using K-type thermocouples. The desired temperatures were set using the CN616 Software provided with the temperature controller. Experiments showed that a single 24 V power supply did not provide enough current to heat the Channel 1 oven to an appropriate temperature, so a second 24 V power supply was used to supply power to Channel 1. This succeeded in getting the oven as high as 820 ∘C; the typical temperature set point was 700 ∘C.
Valve switching was controlled by a Measurement Computing (MCC) USB-ERB08 relay module. Each solenoid was soldered to a diode to prevent damage from voltage spikes generated by switching. These leads were then connected to the normally closed (NC) ports of the MCC relay unit, which completed the circuit to open the specified valve.
One limitation of the TD-CRDS instrument is its reliance on a single detector. This necessitates sequential measurements of each relevant species, creating a minimum time resolution for the instrument. This minimum time resolution can be large compared to the rate of change of the measured species in the atmosphere or in a chamber experiment. Any concentration changes faster than the timescale of the channel cycle are accounted for by assuming a linear change in each channel between two consecutive samplings of that channel and using the interpolated values at the timescale of the measuring channel for subtractions. This simplifying assumption only holds if the time between channel samplings is relatively short and if there are no changes in background NO2 on the timescale of the oven cycling. In situations where rapid NO2 changes are likely, a parallel fast time resolution NO2 measurement could be used to enable corrections for changing NO2 background. The goal is to minimize the instrument time resolution by minimizing the sampling time of each oven without introducing error caused by mixing analyte in the tubing between the switching valve and the CRDS sample cell. Plausible channel switching rates between 30 and 90 s were tested to measure the stabilization time of each channel. This testing was conducted by flowing 10 sccm of zero air through a three-necked round bottom flask containing 0.2 mL of isobutyl nitrate (IBN) chilled to −21 ∘C. This 10 sccm flow was diluted with 7.25 L min−1 of zero air to achieve a concentration of ∼700 ppb.
Figure S2 in the Supplement shows the NO2 vs. time curve for the thermal-dissociation–cavity ring-down spectrometer (TD-CRDS) when gas was sampled with various lengths of time in each oven. The high-concentration peaks are when the IBN dilution is flowing through channels 1 and 2 (650 and 385 ∘C, respectively), and the troughs are IBN flowing through channels 3 and 4 (120 and ambient 23 ∘C, respectively). For this application, a 45 s channel time yielded the best trade-off between channel stabilization and time resolution. (We note that maintaining a constant flow through each of the channels at all times would help to reduce the stabilization time in the CRDS, leading to a reduced time resolution. Because the CRDS has its own internal pump to draw air into the CRDS cell, a secondary pump would be required to maintain constant air flow through the non-sampling channels. Such a modification could help make this instrument more viable for high time-resolution ambient measurements.)
Channel timing with the denuder was determined in a similar manner, and it was determined that 1 min per channel was necessary to achieve stabilization with the charcoal denuder. This leads to an 8 min complete cycle time, since there is 1 min denuded and 1 min undenuded on each of the four species channels. The last three measured points in each channel period are averaged to obtain the concentrations that are used for each channel. Since the CRDS-NO2 takes a measurement every 1 s, the last three measured points represent 3 s of sampling time. A full cycle in this gas–aerosol mode is shown in Fig. 2.
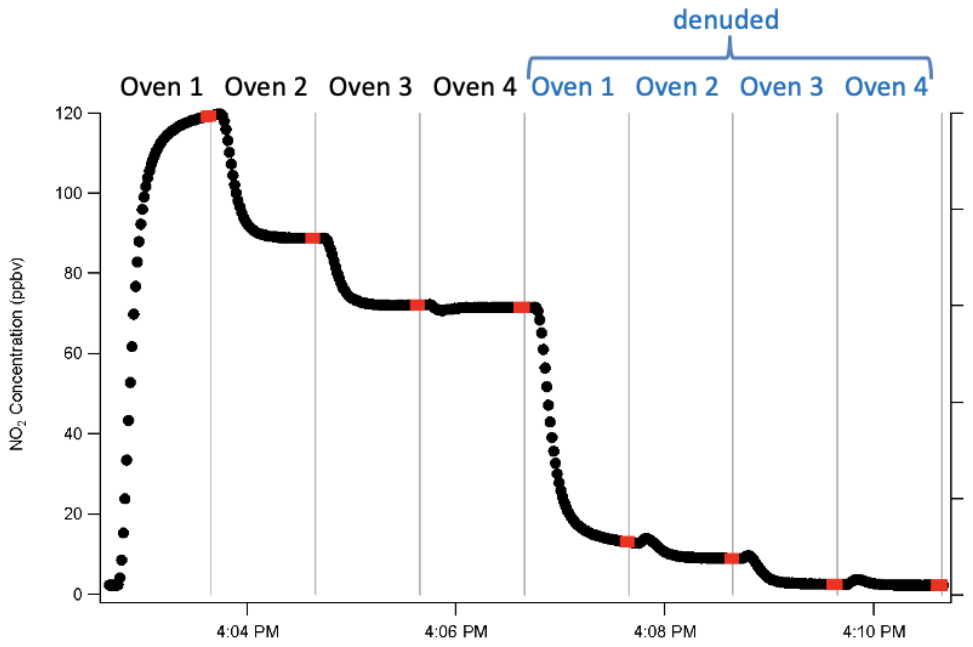
Figure 2One full cycle through total and then denuded channels. Points indicated in red are those averaged to obtain the concentrations that are subsequently subtracted. Vertical lines indicate times when the valve switched between channels.
For each full cycle of concentration measurements from the eight channels, the concentrations of the individual classes of NOy are determined subtractively as follows. Section 3.9 below discusses subsequent corrections that are applied to each channel.
The “Total” concentrations in Eq. (2) refer to gas + aerosol phase; to obtain gas-phase-only concentrations, the aerosol can be subtracted from the total for each channel. While there is not expected to be any signal in the NO2 aerosol channel, the channel has proven useful for diagnosing contamination problems, interferences not yet accounted for, and false values caused by rapid changes.
3.1 Determination of NO2 sensitivity
Two sets of tests were performed to verify the sensitivity of the LGR CRDS to NO2. Response at high concentrations was verified at concentrations of 250 to 1000 ppb using dilutions of NO2 in zero air. A 514.5 ppm calibrated mixture of NO2 in N2 (Airgas) was diluted with a zero-air source to generate the required mixing ratios. The response at low concentrations was compared to a thermo chemiluminescent NOx detector between 1.5 and 11.5 ppb. Low-concentration NO2 was obtained using ambient lab air diluted using zero air. The results of these experiments are shown in Fig. 3.

Figure 3(a) Low-concentration NO2 comparison of Los Gatos Research NO2 cavity ring-down spectrometer to a thermo chemiluminescent NOx box. The dashed line represents a 1:1 relationship. The slope of the fitted line is 1.04±0.01. (b) High-concentration NO2 comparison of LGR cavity ring-down spectrometer to concentrations calculated using flow rates. The dashed line is a 1:1 relationship. The slope of the fitted line is 1.09±0.03.
The fit line has a slope of close to 1 over both measured ranges, indicating good agreement under both high- and low-concentration conditions. Since this experiment was performed using dilutions of zero air, any interference from NOy species in the CL detector would also be expected to scale with dilution. The urban location of the lab would support the relatively low levels of NOy compared to NO2, explaining the very small 4 % difference in slope between the two detectors. These experiments suggest an upper limit error due to the NO2 detection of 10 %. The intercept offset of the low-concentration experiment is 0.64 ppb, which may be attributable to the interference of organic nitrates in the chemiluminescence measurement or a slight zero offset in the chemiluminescence detector. Thus, the CRDS is accurate under both atmospherically relevant and elevated laboratory experiment conditions, but regular calibration against a known source or comparison with another NO2 measurement is nevertheless recommended.
3.2 Production of alkyl nitrates and peroxy nitrates using the Reed Environmental Chamber for TD-CRDS instrument characterization
The 400 L Teflon bag Reed Environmental Chamber (REC; Draper et al., 2015) was used to generate VOC + NO3 reaction products that could be analyzed using the TD-CRDS. The REC chamber was operated with steady inlet flows to the top of the chamber of zero air (4.3 L min−1), O3 (200 sccm), NO2 (4.4 sccm of 515 ppm), and VOC (14.2 sccm zero air through chilled liquid source containing gas-phase VOC of ∼100 ppm), which mix and react (average residence time ∼90 min) and are sampled for analysis from the bottom of the chamber. Zero air was generated using a Sabio Model 1001 zero-air generator, which removes water, particulates, and reactive gases. Ozone was generated using a UV light source (Pen-Ray Hg lamp at 254 nm) inside the middle neck of a three-necked round bottom flask, and the concentration was altered by adjusting the depth of the light source in the flask. The constant NO2 source was a gas cylinder (Airgas, concentration analyzed 17 April 2013) with a concentration of 514.5 (±2 %) ppm NO2 in N2. Approximately 300 ppb VOCs (typical VOCs used are Δ-carene, limonene, α-pinene, or β-pinene) were generated by flowing zero air over a chilled liquid sample of VOC in a three-necked round bottom flask.
Ozone, zero-air, and NO2 flows were allowed to stabilize inside the chamber prior to introducing VOC flow to initiate the experiment. All flows were then continuous until the completion of the experiment. Particle number and size data were collected using a scanning electron mobility sizer (SEMS; Brechtel Manufacturing, Inc.), connected via conductive silicone tubing to minimize particle losses. Ozone concentration was measured using a Dasibi Model 1003-AH ozone monitor or Teledyne Model T400.
3.3 Determination of oven temperature set points
Temperature ramps were performed on different mixtures of known gases to determine the appropriate set point temperatures for each of the three ovens. Temperature ramp results were used to identify the correct set points for each oven to achieve complete dissociation for each species. Both HNO3 and AN measurements were performed by flowing zero air over a pure liquid analyte sample. The AN standard used was isobutyl nitrate (Aldrich 96 % purity). A pure liquid sample of PN could not be obtained, so a NO3+Δ-3-carene mixture containing PNs was synthesized in the chamber as described above. Because concentrations were very stable, ramps were performed at 5 ∘C min−1. Normalized measured NO2 concentrations are plotted against temperature in Fig. 4 because absolute concentrations were different for each class of nitrate.
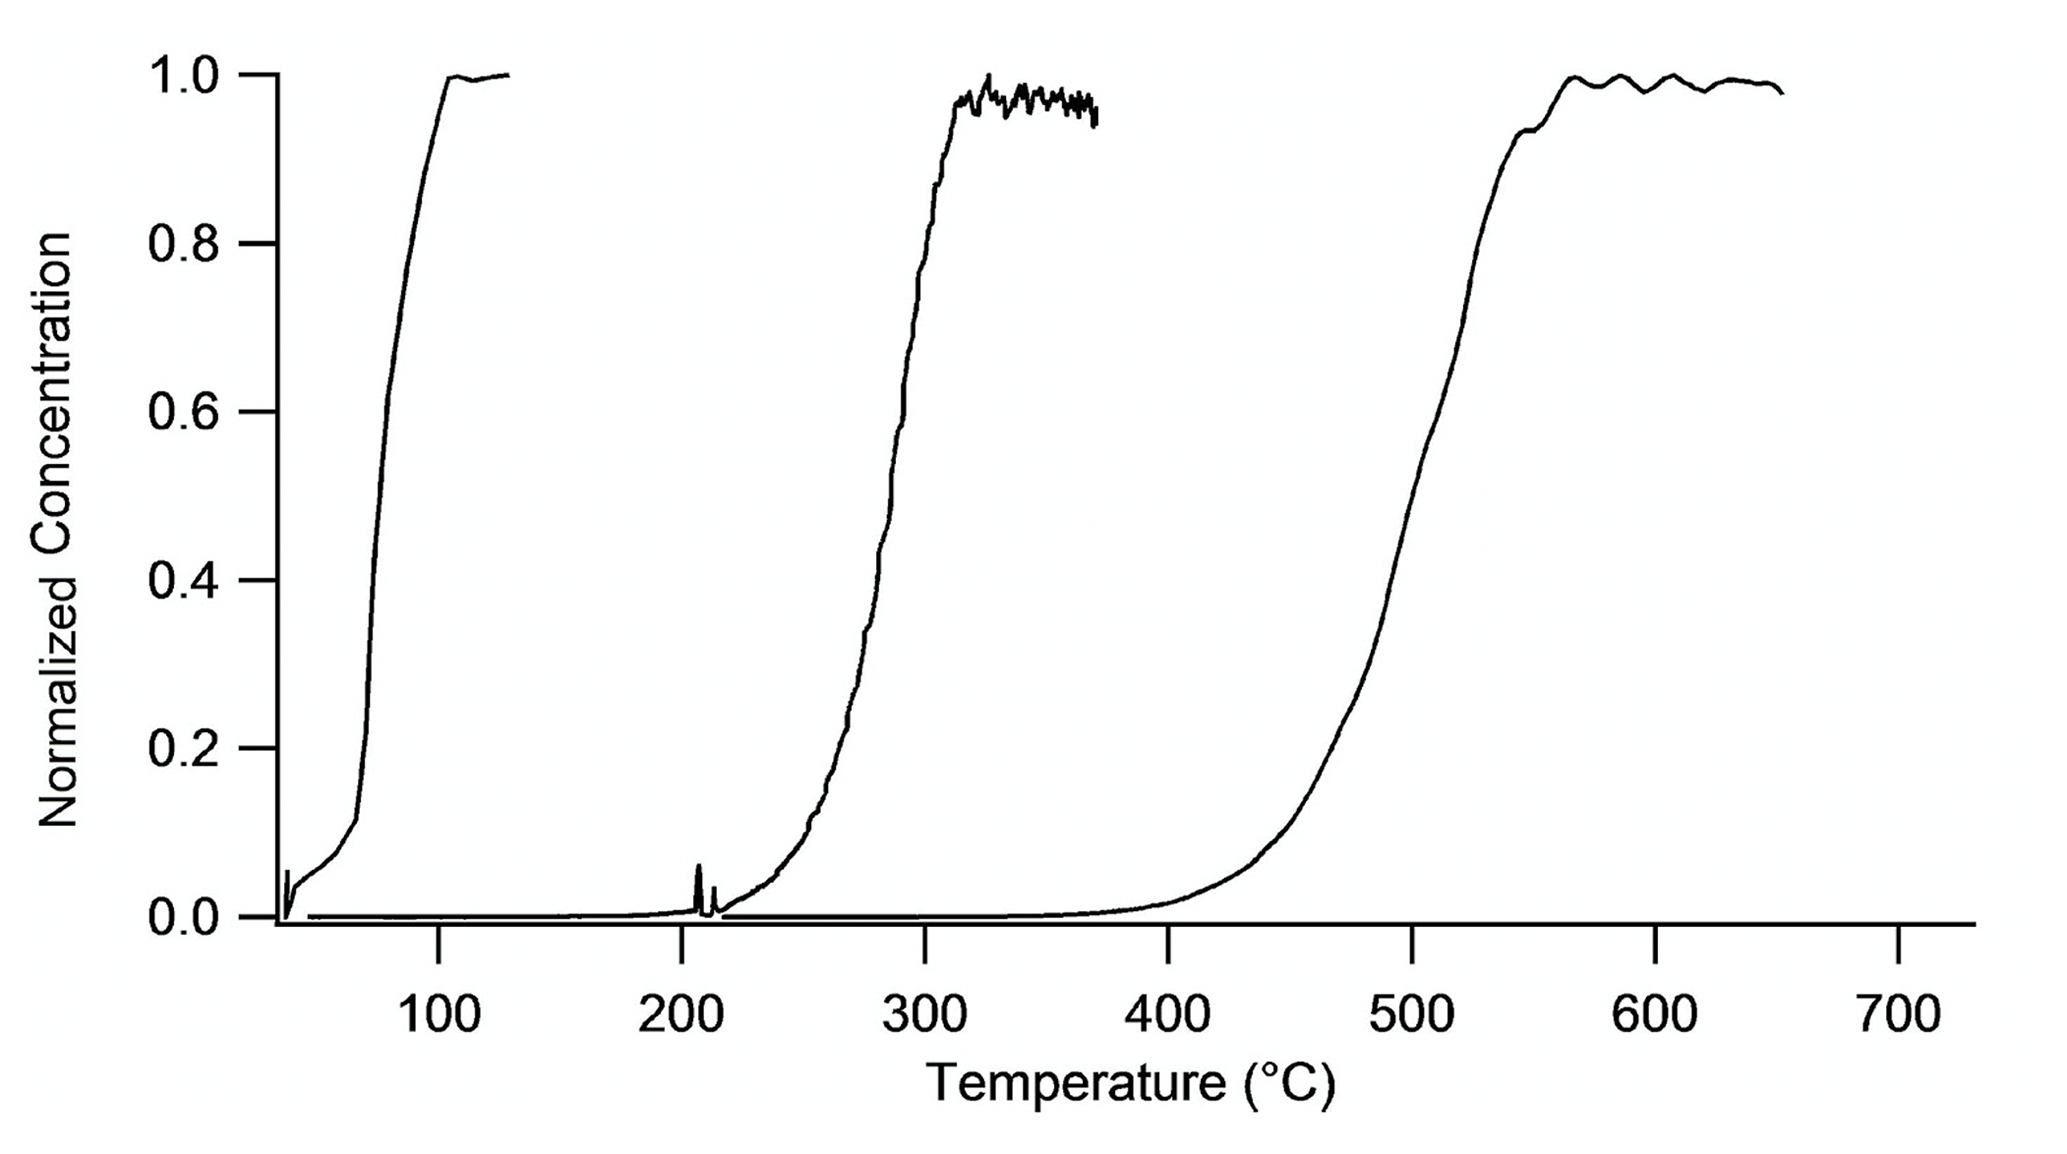
Figure 4Temperature ramps on all thermally dissociated species, in order from left to right: chamber-generated PNs, isobutyl nitrate, and HNO3 from pure samples diluted in zero air. The absolute concentrations of PNs, ANs, and HNO3 were 230, 200, and 3000 ppb, respectively.
Complete dissociation of PNs occurred at a thermocouple temperature reading of 130 ∘C, ANs at 385 ∘C, and HNO3 at 600 ∘C. The HNO3 oven set point was chosen to be 700 ∘C to allow the quantification of interference from NO3 dissociated from N2O5 in that channel. At 600 ∘C, HNO3 is completely dissociated, but there is only partial conversion of NO3 to NO2, creating an interference in the hot channel in the TD-CRDS. At 700 ∘C, HNO3 is completely dissociated and NO3 is completely converted to NO2. Note that the dissociation plateaus do not overlap with the beginning of the adjacent curve, confirming the ability to quantitatively separate nitrate species by temperature.
3.4 Quantification and treatment of N2O5 interference
High-concentration Δ-3-carene nitrate oxidation experiments in the REC chamber typically had 650 ppb O3 and 400 ppb NO2. When high concentrations of O3 and NO2 are present, they react in the chamber to form N2O5. This was verified by performing a temperature ramp from a chamber at low and high oxidant concentrations (Fig. 5). N2O5 dissociates to produce two NO2 products (see Reactions R3 and R4 below) across a broad temperature range, in contrast to the sharp dissociation curves for peroxy- or alkyl-nitrates, such that the presence of N2O5 removes the clear plateau between PNs dissociation and ANs and gives an interference in both PN and AN channels. A chamber with low-NOx conditions (335 ppb O3 and ∼3 ppb NO2) that was left to equilibrate for 56 min after the addition of Δ-carene gave a maximum N2O5 concentration of 1.6 ppb. The resulting temperature ramp gives the expected dissociation curve, showing both PN and AN plateaus (Fig. 5). In this case, there is good separation between PNs and ANs because N2O5 is lower in concentration. This N2O5 interference has been previously observed by Womack et al. (2017). Note that given the gradual dissociation of N2O5 across this full temperature range, the extent of the interference depends on the exact temperature set points, so any similar TD-based organonitrate instrument that may be operated in high-N2O5 conditions should characterize its individual N2O5 interference.
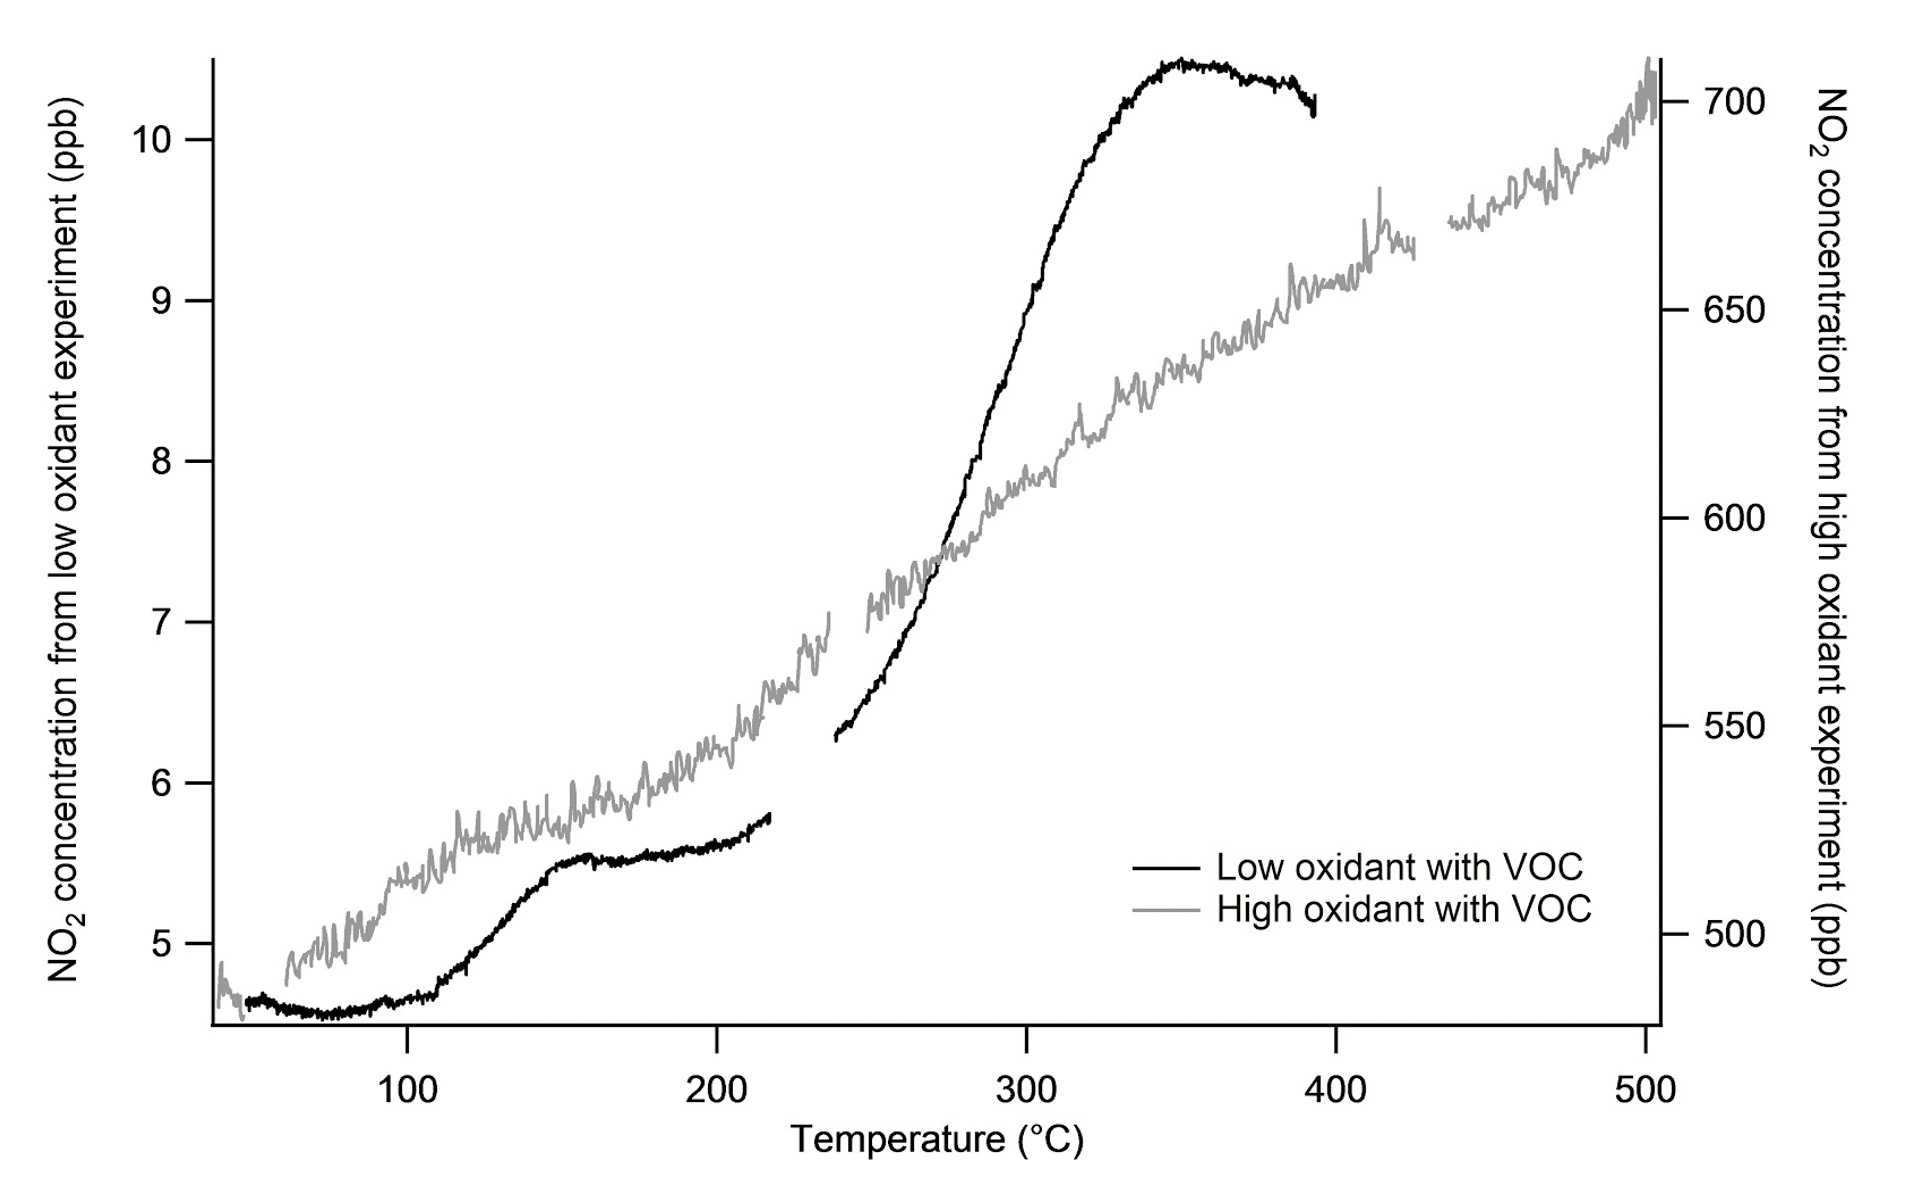
Figure 5Comparison of two experiments under different initial NO2 conditions to change the total N2O5 concentration. Both experiments contain 300 ppb Δ-carene. The “high-oxidant” experiment was performed with 650 ppb O3 and 400 ppb NO2, which yields substantial N2O5 formation. The “low-oxidant” experiment was performed with 335 ppb O3 and ∼3 ppb NO2 and reveals the clean separation of PNs and ANs by plateaus. There are no distinct plateaus for PNs and ANs in the high-oxidant experiment because they are washed out by the more gradually temperature-dependent dissociation of N2O5.
To measure the N2O5 interference such that it can be corrected for, we ran an experiment with only oxidants in the chamber (Fig. 6). The TD-CRDS detects one NO2 molecule from the first dissociation of NO2 from N2O5 (Reaction R3) either in Oven 3 (the PN channel) or in Oven 2 (the AN channel), and another NO2 is observed when the released NO3 fragment further dissociates in the HNO3 channel (Reaction R4). We note that due to its high reactivity and wall losses (especially the NO3 fragment), as well as the likelihood that some N2O5 remained incompletely dissociated even at the AN oven temperature, the total N2O5 detection is substantially less than 100 % of the N2O5 concentration present in the chamber. We also emphasize that these percentages are specific to the configuration used in this characterization experiment: from the chamber containing the modeled N2O5 concentration used to determine these interference percentages, a 2 m Teflon inlet line led to the TD-CRDS instrument. A kinetic model paired with measurements of NO2 and O3 in order to predict N2O5 can be used to quantify the interferences in each channel for a given setup.
The result of N2O5 is an elevated baseline in each of the PN, AN, and HNO3 channels before the VOC is added. If an accurate N2O5 measurement is available, the interference from N2O5 (and NO3) can be subtracted from each channel, and these pre-VOC injection signals can be used to assess the likely lower inlet transmission of N2O5 and NO3 vs. the more stable PNs, ANs, and HNO3. In the absence of a separate N2O5 measurement, kinetic modeling can be used to predict how much N2O5 will be formed in each experiment, which can then be subtracted. For example, in chamber experiments, comparing modeled N2O5 amounts to the amounts of signal in the AN, PN, and HNO3 channels before VOC is added can quantify what fraction of N2O5 appears in each channel. If Reaction (R3) happens across the PN and AN temperature range (130–385 ∘C) and Reaction (R4) between the AN and HNO3 range (385–700 ∘C), the sum of the signals from the AN and PN channels before the addition of VOC should be equivalent to the N2O5 signal from the HNO3 channel (from the NO3 fragment of the N2O5 dissociating to NO2). For the instrument application shown here, operating at UC Irvine in September 2019, 7 % of the modeled N2O5 produced based on a model constrained to measured NO2 and O3 is detected in the PN channel at 150 ∘C and 28 % in the AN channel at 385 ∘C.
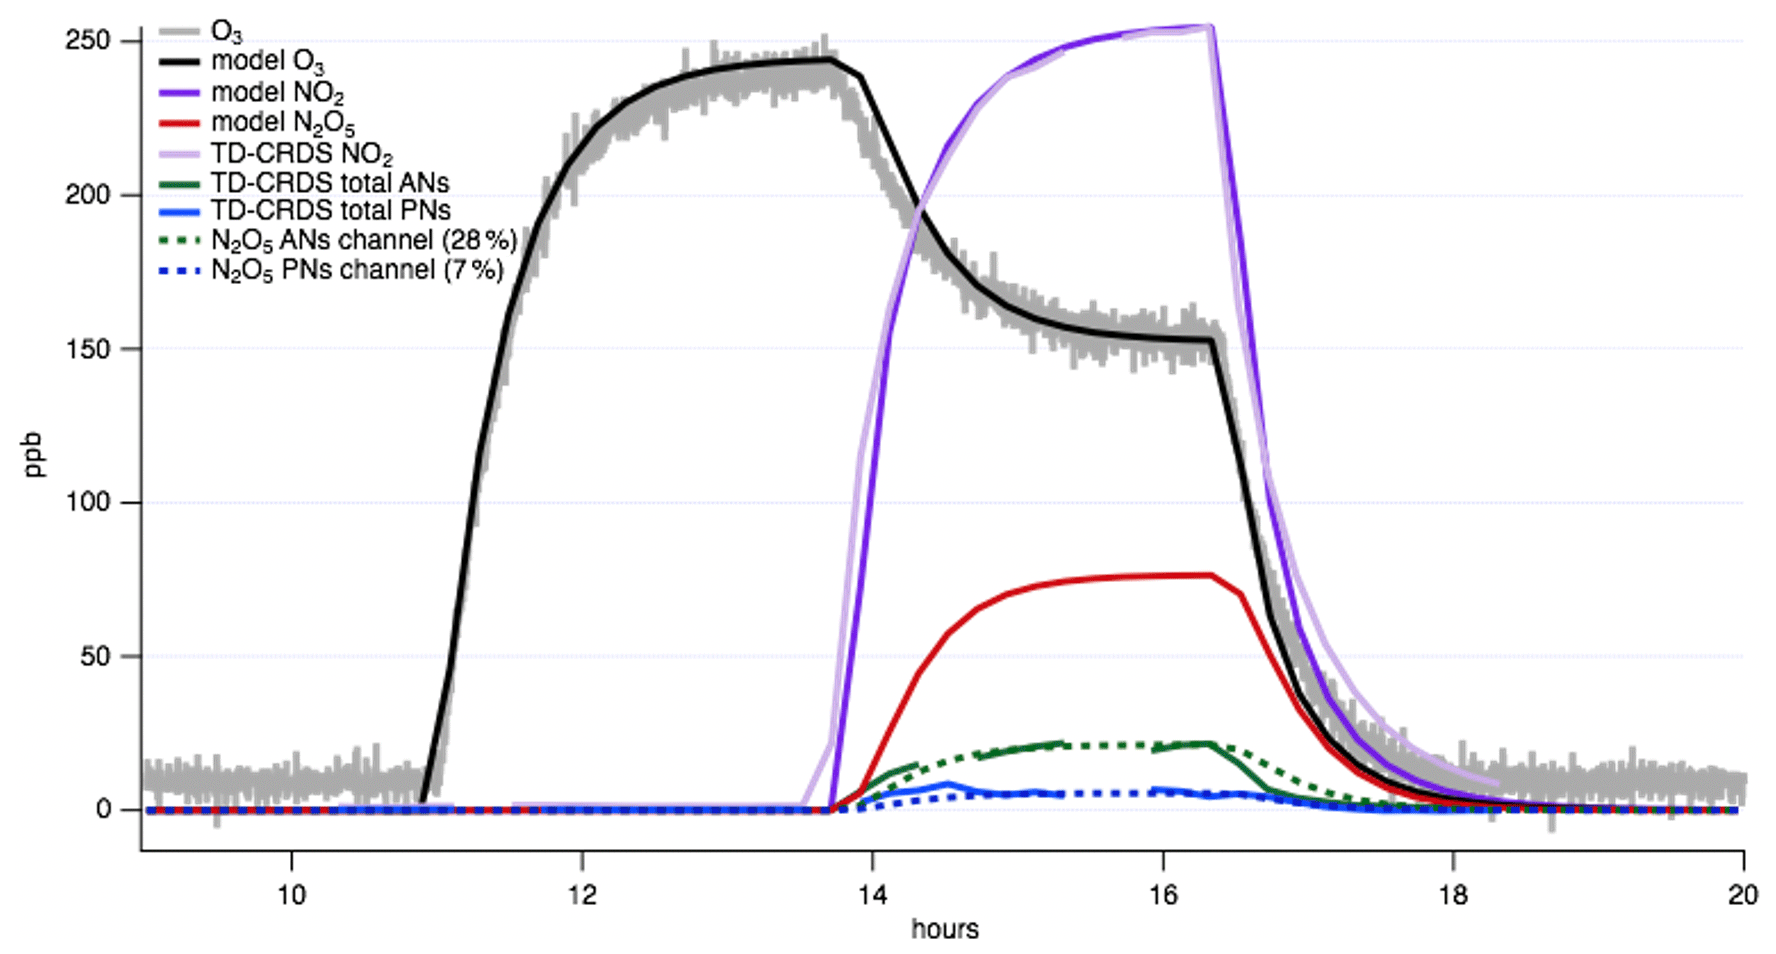
Figure 6N2O5 contribution to TD-CRDS channels assessed by an oxidant-only chamber experiment. Allowing (measured) NO2 and O3 to stabilize sequentially enables prediction of N2O5 concentration (red trace) using a kinetics box model, such as KinSim (Peng and Jimenez, 2019). Then, the signal in the PN and AN channel of the TD-CRDS can be examined during the N2O5 rise time, and percentages can be applied to assess the fraction of N2O5 that is detected in each channel. For our TD-CRDS, this analysis reveals these percentages are 7 % in the PN channel and 28 % in the AN channel.
3.5 Determination of denuder efficiency
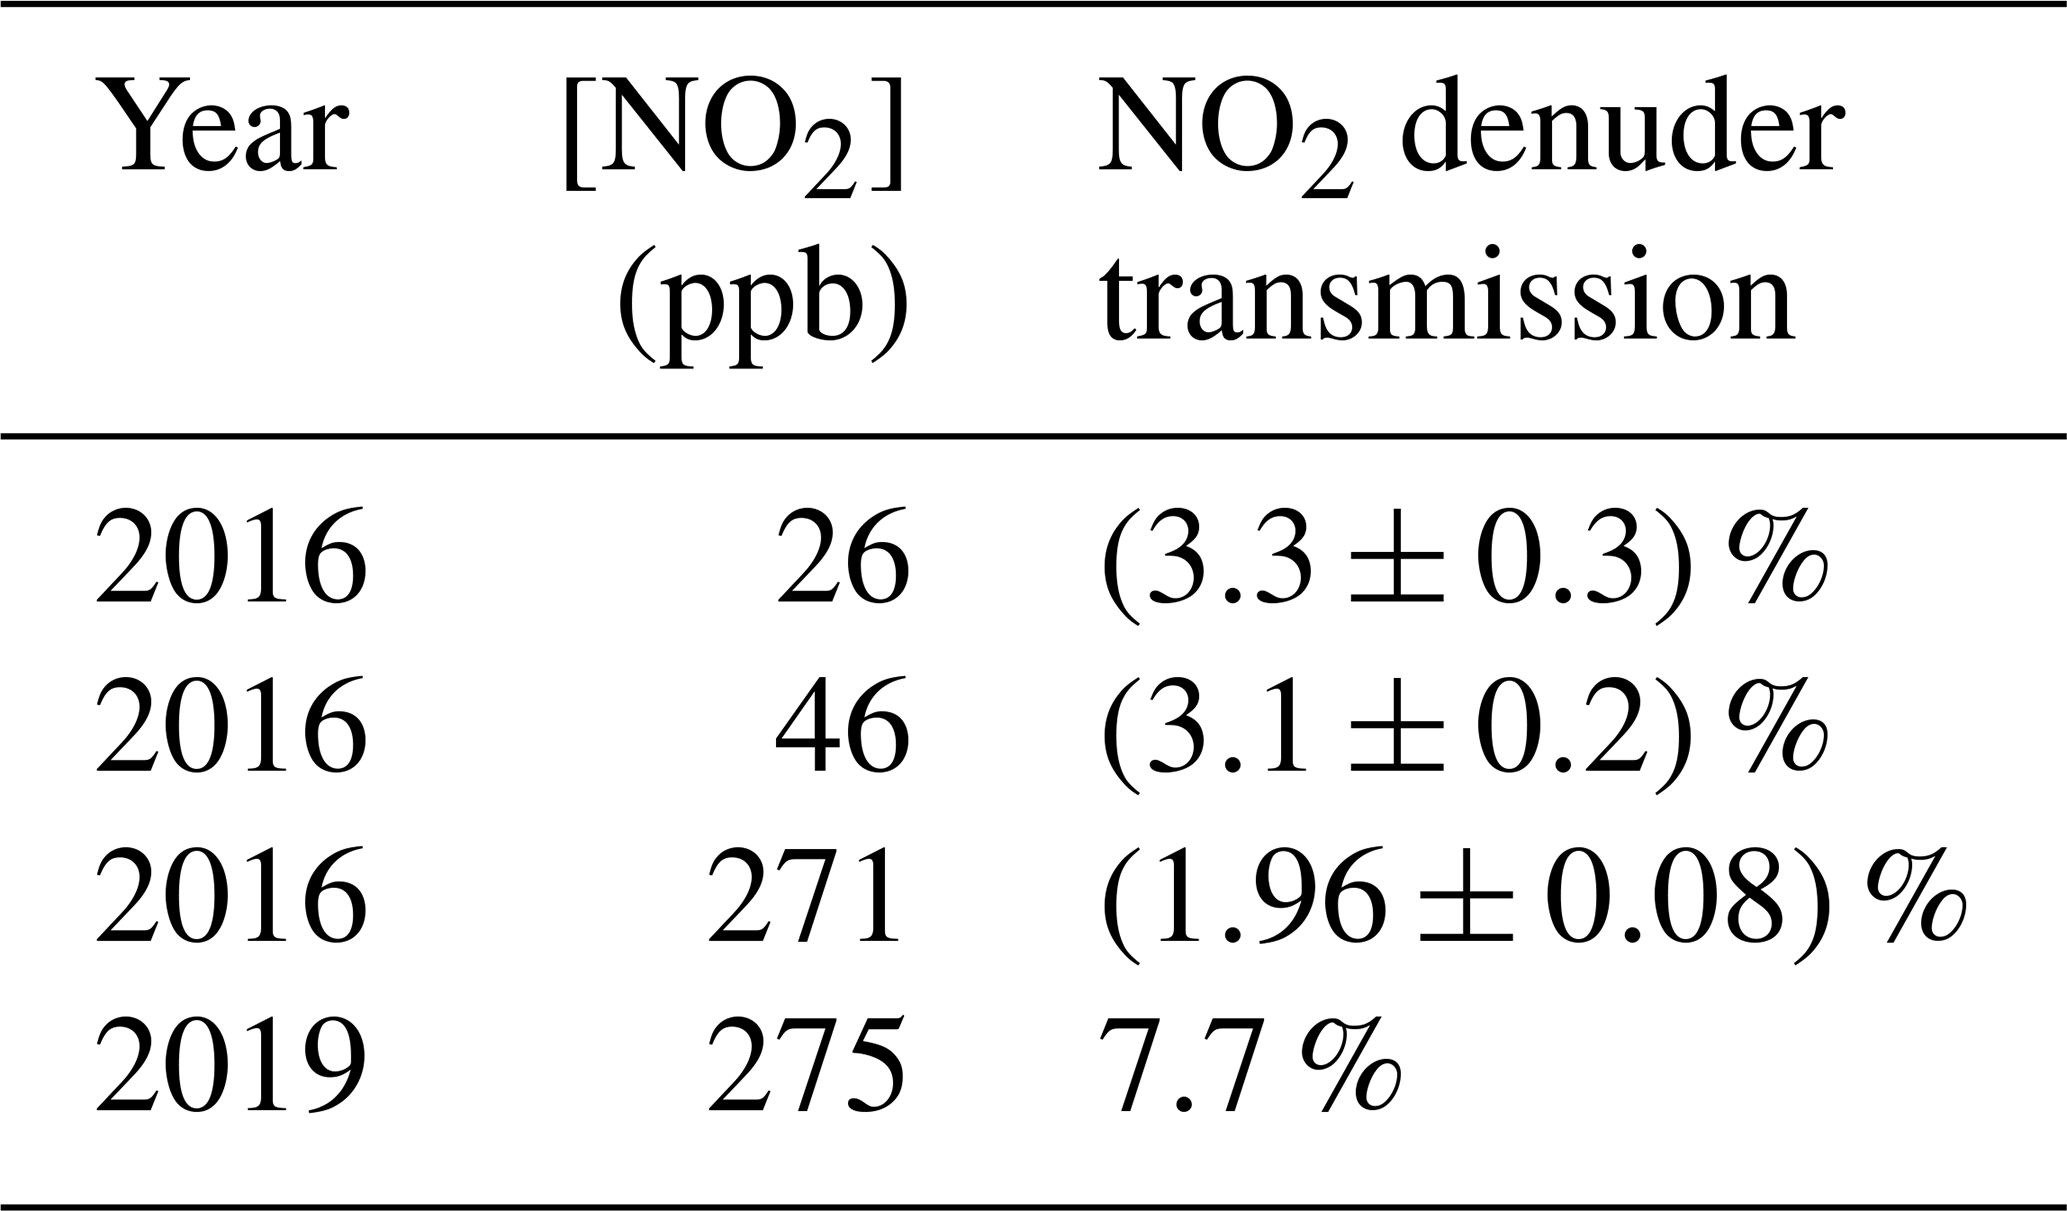
The activated carbon denuder was tested for efficient removal of gas-phase molecules by flowing gas mixtures of single molecules diluted in zero air through the denuder. Gas mixtures were tested at several concentrations to determine if efficiency was concentration-dependent. Transmission of the denuder is defined to be the percentage of gas-phase molecules that passed through the denuder and were detected downstream when all should have been removed.
NO2 transmission was tested in 2016 at two relatively low concentrations, to mimic atmospheric conditions, and one higher concentration to mimic chamber conditions. In all cases at this time, more than 96 % of the NO2 was absorbed (Table 1). NO2 concentrations ranged from 26 to 271 ppb. In 2019, NO2 transmission was again tested to assess changes in denuder performance over time, at 275 ppb. The larger observed NO2 transmission in 2018 suggests a drift in the gas-phase breakthrough over time. Because transmission appears to change over time, we recommend making periodic measurements and updating correction factors accordingly. Denuders can be cleaned by gentle heating and zero-air flow.
Table 1Effect of inserting a single channel-activated carbon denuder in between an NO2 source and the TD-CRDS. Errors were measured for the 2016 measurements and are reported as the standard deviation.
The same process was used to determine the transmission of isobutyl nitrate (an alkyl nitrate) in 2016 (Table 2). The outlet of the denuder was connected to both Channel 1 (temporarily at 520 ∘C) and Channel 2 (385 ∘C). The transmission of the denuder was not dependent on the concentration of gas in the original gas mixture or on which oven was used. This AN transmission was also retested in 2019, and in this case, no significant change in breakthrough was observed. These measured fractions of gas-phase breakthrough can be used to correct the aerosol measurements made in the denuded channels of the instrument cycle (see discussion of corrections below).
Table 2Transmission of denuder at three concentrations of isobutyl nitrate (IBN) and one concentration of chamber-generated AN. Transmission is defined as the percentage of gas-phase alkyl nitrate that was passed through the denuder. Errors for the 2016 measurements are the standard deviation.

A chamber experiment with Δ-carene was performed to generate organic aerosol particles in order to test the aerosol throughput of the denuder. Low-NOx chamber conditions (450 ppb O3, 3 ppb NO2) were used to minimize potential N2O5 interferences. First, the chamber was hooked directly to the SEMS in order to get a background measure for the number of particles in the bag. Then the chamber mixture was pulled through the TD-CRDS inlet tubing while bypassing the denuder in order to quantify particle losses to the tubing. Finally, the chamber mixture was sampled while flowing through the tubing and the denuder to get the total particle loss through the instrument. The time series of this experiment is shown in Fig. 7. In order to quantify the efficiency of the denuder and tubing inlet of the TD-CRDS, the particle volume was averaged over the sampling time under each condition. This assumes particle concentration in the chamber was constant over the course of the entire experiment. Since the chamber had been running for 24 h prior to measurements, it is reasonable to assume that all concentrations had reached equilibrium.

Figure 7SEMS-measured particle volume vs. time to test denuder efficiency. From 02:15 (local time) to 03:00 the SEMS was measuring directly from the chamber. From 03:00 to 04:00 the SEMS was measuring particles from the TD-CRDS tubing (only internal tubing to the inlet system) without the denuder. From 04:00 to 05:00 the SEMS measured through the TD-CRDS tubing and the denuder. The horizontal lines represent the average particle volume over the sampling period. The missing data were due to room air entering the lines while the SEMS was detached from the chamber and reattached to the TD-CRDS inlet.
A total of 28 % of the aerosol particles (assessed by volume) that flow into the instrument was lost to the tubing and the denuder before detection. There does not appear to be any bias toward removing smaller or larger particles. The denuder is responsible for only 10 % of total particle loss. This suggests that every deployment of this instrument should carefully consider and, if possible, quantify inlet line losses.
3.6 Determination of detection limits
The CRDS can be set to zero automatically at regular intervals, which is accomplished by diverting inlet air through an NO2 scrubber. The instrument is typically set to run its 3 min zero every 2 h. The re-zeroing procedure results in small changes to the baseline before and after zeroing events. On ambient measurements, these changes are typically less than 0.5 ppb (see Fig. S3), and on zero air, they are typically less than 0.2 ppb and are sometimes positive and sometimes negative. We determine the standard deviation of 4 h of zero measurements (0.16 ppb) to estimate our blank error, σzero.
From this observed blank error, the detection limit of the instrument (LOD=3σ) can be calculated for each channel. The error for the NO2 channel is based only on σzero alone, since no subtraction is required ( ppb). For all other channels, the error in the subtracted value A−B is calculated as
where ppb are the errors in the pre-subtraction NO2 concentration measurements. Thus, the estimated detection limit for the subtracted channels (ANs, PNs, and HNO3) ppb.
3.7 Kinetic modeling of thermal-dissociation ovens
Modeling of the ovens can be employed to simulate the dissociation and recombination of the detected species in any oven design. Pressure- and temperature-dependent rate constants for dissociation (Day et al., 2002) and recombination (NASA/JPL Data Evaluation, 2015) reactions of PNs, ANs, and HNO3 were used (see Table S1 in the Supplement), alongside an assumed (a) step function or (b) linear rate of cooling from the heated to the unheated portions of the oven (see Fig. S4). We also included the IUPAC rate constant for a representative RO+O2 ( e, IUPAC), and OH wall loss rate (calculated to be 46 s−1 for these conditions) from Knopf et al. (2015). Based on these rate constants and the assumption that recombination or wall losses are the only fates for dissociated radicals, we found that the PN measurement would be the most affected by recombination. We found an expected 10 % difference in the amount of PNs recombined by the end of the PN oven between assuming linear cooling and step function, so the more conservative step function assumption can be used to provide a lower-limit concentration.
All ovens were modeled at their set point temperature, which is maintained by the thermocouple relay. However, each oven surely has gradients in temperature along its length, resulting in this average oven temperature measured at its midpoint (see Fig. 1b). As an example, for HNO3 there was very little difference in dissociation based on small changes in oven temperature. HNO3 is 100 % dissociated at the end of the oven, so modeling at 30 ∘C hotter than the set point temperature just extends the cooling region slightly. This leads to approximately 0.3 % less recombination than the set point temperature model. The same concept applies to the PN oven, but the recombination difference is larger (1 %–2 % depending on model molecule) due to a 30 ∘C increase in temperature being a larger percentage of the total temperature.
The PN dissociation and recombination oven model results in Fig. S5 show a predicted 55.9 % dissociation in the step function model and 65.4 % dissociation in the linear function model with no background NO2 and 10 ppb initial PN concentration.
In the PN oven, the only important reactions modeled were the dissociation and recombination of PNs. The background concentration of NO2 was considered and was found to have a significant impact on the recombination rate, especially at high concentrations. Figure S6 shows the percent PNs that remain dissociated at the detector as a function of initial concentrations of PNs and NO2. Two separate types of PN were considered in the modeling, due to their slightly different rates of recombination. Methyl PN gave 58.1 % detection at 10 ppb initial concentration and no background NO2, while ethyl PN gave 55.9 % detection under the same conditions. Given the relatively small difference in recombination percentages, no effort was made to incorporate both species into the model. Ethyl PN was chosen as the representative species because it was assumed that most PNs being encountered would be two carbons or larger. Including reasonable atmospheric concentrations of OH (4×10⁶ molecules cm−3) in the model made no difference to the percent recombination of ethyl PNs and was therefore left out. We note that the PN measurement will be most affected by recombination but that this recombination can in principle be corrected for.
In addition to the potential reduction in PN signal due to recombination reactions, there is the potential for a spurious overestimation of PN signal due to reactions of thermally dissociated peroxy or peroxy acetyl radicals with ambient NO in the presence of O2, producing additional NO2 (Thieser et al., 2016). This effect will be minimal in chamber simulations of nighttime chemistry, where the mixing ratio of NO is zero but should be considered in any daytime field deployments.
In the AN oven, in addition to the major reactions of AN dissociation and recombination, the reaction RO+O2 is also important. The RO+O2 reaction is extremely fast at high temperatures (see Table S1) like those found in the heated portion of the AN oven, and we assume the reaction to be irreversible. Because O2 is abundant, the reaction negligibly affects O2 concentration. As a result, these assumptions give a model prediction of 100 % detection of alkyl nitrates at all initial AN and NO2 concentrations.
In the HNO3 oven, in addition to the dissociation and recombination of HNO3, the loss of OH radical to the walls is significant, competing with recombination. The model assumes that any OH that hits the walls after the heating part of the oven is lost due to reactions with the walls; as a result, recombination is generally less of an effect on the HNO3 measurement. Figure S7 shows example model outputs for the HNO3 oven, predicting the percent dissociation of HNO3 at the point of detection over a large range of initial concentrations for both HNO3 and NO2. As expected, recombination is most important at larger NO2 and HNO3 concentrations; below 50 ppb of each, for this instrument configuration the detection efficiency is above 80 %.
3.8 Ozone pyrolysis at high temperatures interferes with HNO3 measurement
One additional reaction that can affect the HNO3 measurement is the pyrolysis of O3. At high temperatures, some fraction of O3 dissociates, releasing atomic O which reacts with NO2 to form NO+O2, which results in NO2 being removed from the final measurement. Therefore, in background conditions of high O3 concentration, the NO2 concentrations measured after the HNO3 oven are biased low and can even cause the [HNO3] to appear negative upon subtraction. Day et al. (2002) noted that at or above 530 ∘C, all O3 will separate into O2 and O molecules, which will then react with NO2. This suggests that for this instrument, the pyrolysis of O3 will result in a lower signal only in Oven 1 (700 ∘C) due to the high temperatures.
In some experiments from the 2018 Simulation of Atmospheric Photochemistry in a Large Reaction Chamber (SAPHIR) NO3ISOP campaign, HNO3 measurements appeared negative due to lower signals from the hottest channel. Using other available instruments' measurements of O3 and HNO3, we determined that approximately 4 % of the O3 signal was converted to this apparent negative HNO3 signal during one experiment (on 8 August 2018). However, this fraction did not appear consistent across experiments, perhaps due to substantial HNO3 inlet losses, and we did not determine a robust and consistent correction factor for this effect. Given that this does not affect alkyl nitrate measurements and that there were other measurements of HNO3 available, we did not pursue this further. But in principle, this is a relatively modest effect that can be corrected for after experimentally determining the efficiency of ozone pyrolysis for a particular inlet oven build.
3.9 Data corrections
The above modeled 100 % efficiency in detecting ANs is fortunate, since the AN measurement has thus far been the output of greatest interest from this instrument. Should one wish to use such an instrument for accurate measurements of PNs and HNO3, this too is possible, but it requires the determination of correction factors to account for the recombination in those ovens.
Beyond the correction factors for radical recombination in the cooling region after each oven (1), additional corrections that can be applied are (2) an oven-specific denuder breakthrough, based on data such as that shown in Tables 1 and 2, (3) background corrections, to account for any background signal detected in each channel while sampling zero air (this could account for inlet and/or denuder off-gassing), (4) subtraction of N2O5 interference, as described in Sect. 3.4 above, and (5) correction of the HNO3 channel for O3 pyrolysis loss of NO2, as described in Sect. 3.8 above. The importance of each of these corrections will depend on the nature of the experiments conducted; some example applications are shown below to illustrate this.
We have implemented each of these corrections as optional to apply to any raw data collected in our Igor-based data workup routine, which also sorts the data from the various ovens, averages, and subtracts the relevant signals.
4.1 Aerosol mass spectrometer/TD-CRDS aerosol terpene nitrate comparison at CU Boulder chamber
The TD-CRDS was compared to the CU Boulder Jimenez group aerosol mass spectrometer (AMS) during collaborative chamber experiments in summer 2015, using the data from the denuded AN channel of the TD-CRDS and the high-resolution AMS organic-nitrate (pRONO2) measurement to assess the correlation of these two aerosol-phase organic-nitrate measurements. The experiments plotted here are those which showed substantial aerosol nitrate formation using Δ-carene or α-pinene as a VOC precursor and NO3 from an N2O5 trap, both spanning the nominal range of 10–100 ppb, at varying relative humidity. The comparison of individual measurements across 2 weeks of experiments shows significant scatter, but an orthogonal distance regression (ODR) fit to the scatterplot of TD-CRDS data vs. AMS data shows a slope of about 0.88–0.94 (depending on intercept treatment), and R2=0.73 (Fig. 8).
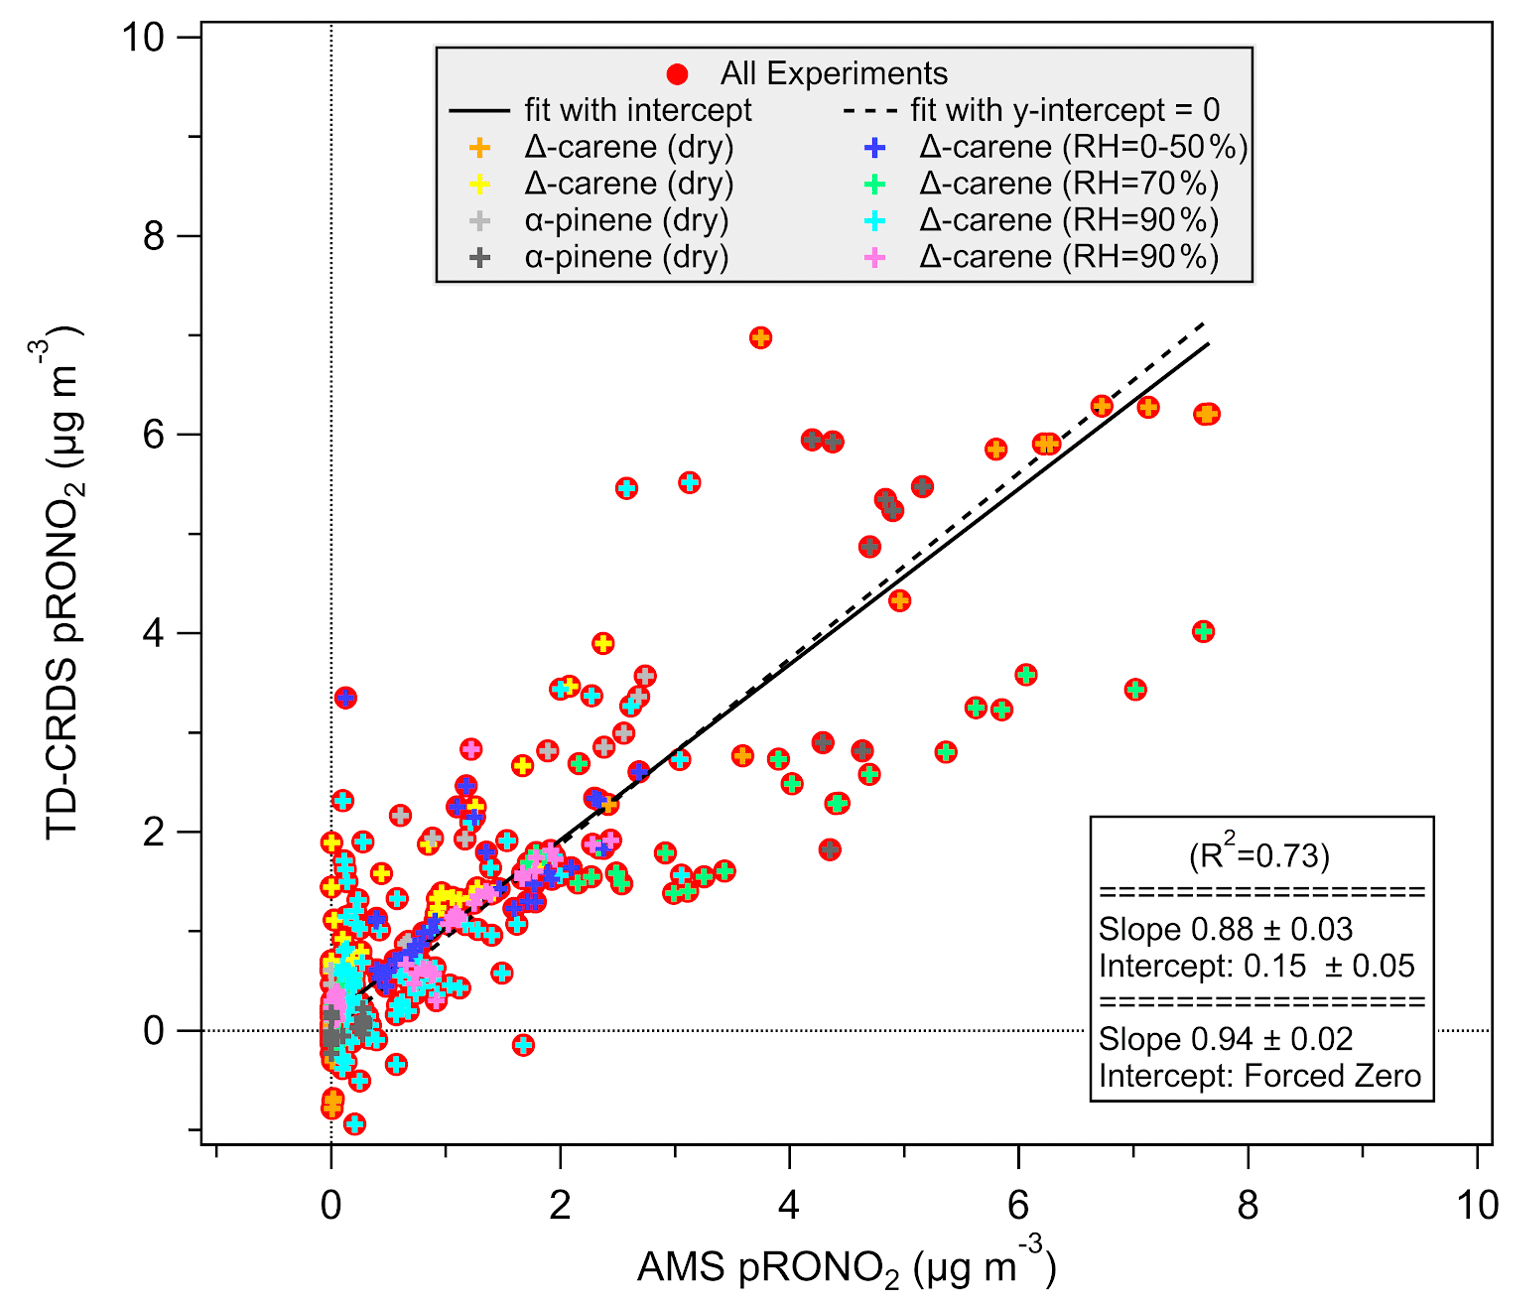
Figure 8Background and denuder-breakthrough-corrected aerosol-phase ANs measured by the TD-CRDS, compared to the high-resolution AMS organic-nitrate aerosol mass loading. Fits are orthogonal distance regression (ODR).
The AMS organic-nitrate concentrations in Fig. 9 were calculated by apportioning the total nitrate concentration using the ion ratio () method (Farmer et al., 2010), where the relative ratios of organic to inorganic ratios (“ratio of ratios”, Fry et al., 2013) were determined by the average of several dry, unseeded experiments and ammonium nitrate ratios from offline calibrations (3.12 for Δ-carene, 3.78 for α-pinene). The organic–inorganic separation was conducted in order to account for possible NH4NO3 or particle HNO3 formation as was suggested by substantial shifts in ratios observed during wet, seeded experiments, as has been reported previously (Takeuchi and Ng, 2019). Figure S8 shows a comparison of the Fig. 8 results to a plot of the TD-CRDS measurements against the AMS total nitrate (unapportioned), the latter resulting in slightly lower slopes and correlation coefficients.

Figure 9Representative measurements of NO2, PN, AN, and HNO3 concentrations from ambient air in November 2014 in Portland, OR. One week of data is shown to illustrate measurements of typical variability, alongside an average diurnal cycle from this period.
Previous comparisons between AMS and thermal-dissociation-based aerosol organic-nitrate instruments have found varying agreement for ambient measurements (Ng et al., 2017). Some of these differences could be due to the fact that the ambient atmosphere contains a mix of diverse products from the oxidation of monoterpenes and isoprene in the presence of other gases; the resulting differing mixes of alkyl nitrate structures could alter the sensitivity of one or both instruments.
4.2 Ambient measurements of organonitrates in Portland, OR
During 1 week in November 2014, the TD-CRDS inlet was situated outside the south end of the Reed College Chemistry building. Simultaneous measurements of NO2, PNs, ANs, and HNO3 were made, and 1 representative day is shown in Fig. 9, illustrating typical measurable ambient variability and diurnal cycle.
4.3 Chamber measurements of isoprene nitrates at the SAPHIR chamber (Jülich, Germany)
The TD-CRDS was also used in the month-long SAPHIR NO3+ isoprene campaign in the summer of 2018. SAPHIR is a 270 m3 double-walled Teflon chamber with movable shutters allowing for the simulation of both daytime and nighttime chemistry. The experiments were run in batch mode with periodic injections of oxidants and reactants. The reactant concentrations were comparable to real atmospheric concentrations of NO2, O3, and isoprene. Some experiments were run under humid conditions and some had seed aerosol added to facilitate condensations of gas products into the particle phase.
The low, near-ambient concentrations of reactants used, the small degree of partitioning of isoprene nitrates to the aerosol phase, and the relatively long inlet line required resulted in the aerosol organonitrate products being lower than the limit of detection of the TD-CRDS for the particle-phase AN monitoring. The gas-phase AN measurements from the TD-CRDS ranged from below parts per billion up to 16 ppb of organic nitrates, with an observed alkyl nitrate molar yield for NO3+ isoprene of ∼100 % under all explored reaction conditions. In order to determine gas–aerosol partitioning of nitrates, the gas-phase ANs measured by TD-CRDS were compared to AMS organic-nitrate aerosol measurement. These results are the subject of a forthcoming paper (Brownwood et al., 2020).
4.4 Chamber measurements of isoprene nitrates at REC (Portland, OR)
The TD-CRDS was also used for chamber experiments throughout the 2018–2019 academic year at the Reed Environmental Chamber (REC), running experiments similar to those from SAPHIR but at substantially higher concentrations. These experiments aimed to determine whether gas–particle partitioning coefficients (Kp) for the NO3-initiated oxidation of isoprene would be similar in a 0.4 m3 chamber at much higher concentrations to those measured in the 270 m3 SAPHIR chamber at much lower, near-ambient concentrations.
The gas–particle partitioning coefficients calculated in these experiments used the aerosol and total gas + aerosol measurements from the TD-CRDS and a total mass measurement from a Brechtel SEMS (BMI Model 2002). The partitioning coefficients derived from these experiments were and m3 µg−1 for background aerosol loadings of 230 and 20 µg m−3, respectively. One of these experiments is shown in Fig. 10. The aerosol (caer) and total AN concentrations and background aerosol loading (Mtot) were averaged over the shaded period; aerosol phase was subtracted from the total to obtain cgas, from which Kp was determined via Eq. (4):
The fact that the two experiments at different background aerosol mass loadings (Mt) did not give exactly the same Kp value could reflect the uncertainty of these measurements or that the aerosol partitioning is not perfectly described as absorptive partitioning or that wall losses change as aerosol loadings change. Most important, the range of Kp measured here falls exactly within the range of values observed over 1 month of NO3+ isoprene experiments conducted under much lower-concentration conditions at the SAPHIR chamber (– m3 µg−1, Brownwood et al., 2020)
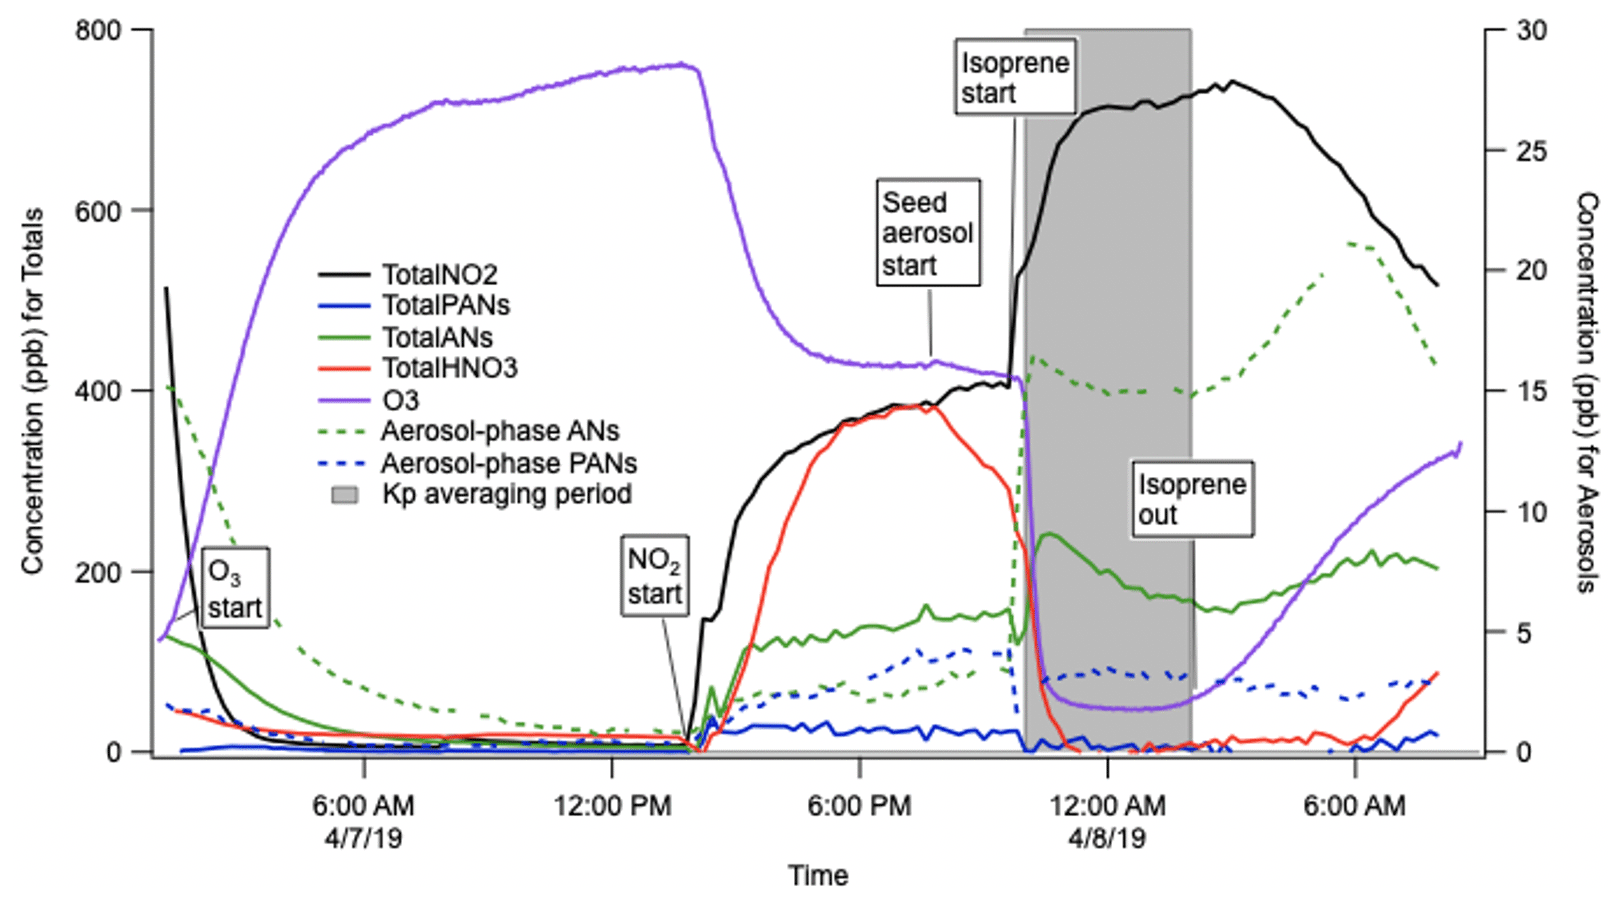
Figure 10Example experiment to determine the bulk organonitrate partitioning (Kp) from NO3+ isoprene products in the Reed Environmental Chamber, at 20 µg m−3 ammonium sulfate background aerosol. Note that these traces are not corrected for N2O5 interferences in the AN and PN channel, but N2O5 was fully consumed in the period of Kp determination.
These Kp values were compared to theoretical calculations of Kp predicted by the simplified prediction (SIMPOL.1) group contribution method (Pankow and Asher, 2008), and we find this average volatility consistent with a trifunctional isoprene nitrates, such as isoprene hydroperoxy nitrate, which has a SIMPOL.1 predicted Kp value of m3 µg−1. This shows a promising consistency of equilibrium gas–aerosol partitioning of isoprene nitrate products measured in two dramatically different chambers and suggests the robustness of the TD-CRDS over a wide range of concentrations.
Using three custom home-built oven channels, a charcoal denuder, and an automated valve control system, a thermal-dissociation–cavity ring-down spectrometer (TD-CRDS) was constructed for the speciated measurement of gas- and aerosol-phase organic nitrates, split into the classes NO2, PNs, ANs, and HNO3. This instrument has been successfully demonstrated for measurements on atmospheric simulation chambers operating at a wide range of concentrations and ambient measurements; because of the increased uncertainty in the presence of rapid background changes in NO2 mixing ratio, the TD-CRDS is best suited to chamber studies. Users or developers of similar such instruments are encouraged to consider the several data corrections described herein, which will be more or less important depending on the details of the instrument deployment.
Datasets are presented in figures and summarized in tables throughout the paper and the Supplement. Raw data from these resources are available from the corresponding author upon request.
The supplement related to this article is available online at: https://doi.org/10.5194/amt-13-6255-2020-supplement.
JLF and NIK conceived of the instrument design and NIK carried it out. BB, AM, and JLF conducted additional characterization experiments and made modifications to the instrument hardware and data workup software. DAD, NIK, and JLF carried out the intercomparison with the aerosol mass spectrometer. NIK and JLF prepared the paper with contributions from all co-authors.
The authors declare that they have no conflict of interest.
The authors acknowledge many fruitful conversations with a large number of collaborators, with whom we have enjoyed working as we built and refined this instrument. We thank colleagues at the University of Colorado at Boulder – Jose Jimenez, Hyungu Kang, Jason Schroder, and Pedro Campuzano-Jost – for sharing AMS data and stimulating discussions during our work together in 2014–2015. Natalie I. Keehan, Douglas A. Day, and Juliane L. Fry acknowledge support for this collaboration from NOAA's Climate Program Office's Atmospheric Chemistry, Carbon Cycle, and Climate program. We also thank colleagues at UC Irvine – Jim Smith, Danielle Draper, and Lia Dam – for stimulating discussions during our work together in 2019–2020. Andrey Marsavin, Bellamy Brownwood, and Juliane L. Fry acknowledge support from the U.S. National Science Foundation (NSF). We thank Reed College colleagues Ben Ayres and Jay Ewing, Paul Wooldridge and Ron Cohen (UC Berkeley) for valuable discussions and help with instrument construction, and John Crowley and his students (Max Planck Institute for Chemistry, Mainz, Germany) for many valuable discussions around our work together at Forschungszentrum Jülich in 2018.
This research has been supported by the NOAA Climate Program (grant no. NA13OAR4310070) and the NSF Atmospheric Chemistry Program (grant no. AGS-1762106).
This paper was edited by Mingjin Tang and reviewed by two anonymous referees.
Atkinson, R., Baulch, D. L., Cox, R. A., Crowley, J. N., Hampson, R. F., Hynes, R. G., Jenkin, M. E., Rossi, M. J., Troe, J., and IUPAC Subcommittee: Evaluated kinetic and photochemical data for atmospheric chemistry: Volume II – gas phase reactions of organic species, Atmos. Chem. Phys., 6, 3625–4055, https://doi.org/10.5194/acp-6-3625-2006, 2006.
Browne, E. C., Min, K.-E., Wooldridge, P. J., Apel, E., Blake, D. R., Brune, W. H., Cantrell, C. A., Cubison, M. J., Diskin, G. S., Jimenez, J. L., Weinheimer, A. J., Wennberg, P. O., Wisthaler, A., and Cohen, R. C.: Observations of total RONO2 over the boreal forest: NOx sinks and HNO3 sources, Atmos. Chem. Phys., 13, 4543–4562, https://doi.org/10.5194/acp-13-4543-2013, 2013.
Brownwood, B., Turdziladze, A., Hohaus, T., Andres, S., Carlsson, P., Fuchs, H., Novelli, A., Tsiligiannis, E., Hallquist, M., Wu, R., Mentel, T., Hantschke, L., Liebmann, J., Brown, S. S., Rohrer, F., Tillmann, R., Reimer, D., Winter, B., Kiendler-Scharr, A., and Fry, J. L.: Gas-particle partitioning and SOA yields of organonitrate products from NO3-initiated oxidation of isoprene under varied chemical regimes, ACS Earth & Space Chem., submitted, 2020.
Buhr, M. P., Parrish, D. D., Norton, R. B., Fehsenfeld, F. C., Sievers, R. E., and Roberts, J. M.: Contribution of organic nitrates to the total reactive nitrogen budget at a rural eastern U.S. site, J. Geophys. Res., 95, 9809–9816, https://doi.org/10.1029/JD095iD07p09809, 1990.
Day, D. A., Wooldridge, P. J. ,Dillon, P. J., Thornton, J. A., and Cohen, R. C.: A thermal dissociation laser‐induced fluorescence instrument for in situ detection of NO2, peroxy nitrates, alkyl nitrates, and HNO3, J. Geophys. Res., 107, ACH 4-1–ACH 4-14, https://doi.org/10.1029/2001JD000779, 2002.
Draper, D. C., Farmer, D. K., Desyaterik, Y., and Fry, J. L.: A qualitative comparison of secondary organic aerosol yields and composition from ozonolysis of monoterpenes at varying concentrations of NO2, Atmos. Chem. Phys., 15, 12267–12281, https://doi.org/10.5194/acp-15-12267-2015, 2015.
Farmer, D. K., Matsunaga, A., Docherty, K. S., Surratt, J. D., Seinfeld, J. H., Ziemann, P. J., and Jimenez, J. L.: Response of an Aerosol Mass Spectrometer to Organonitrates and Organosulfates and Implications for Atmospheric Chemistry, P. Natl. Acad. Sci. USA, 107, 6670–6675, https://doi.org/10.1073/pnas.0912340107, 2010.
Fry, J. L., Draper, D. C., Zarzana, K. J., Campuzano-Jost, P., Day, D. A., Jimenez, J. L., Brown, S. S., Cohen, R. C., Kaser, L., Hansel, A., Cappellin, L., Karl, T., Hodzic Roux, A., Turnipseed, A., Cantrell, C., Lefer, B. L., and Grossberg, N.: Observations of gas- and aerosol-phase organic nitrates at BEACHON-RoMBAS 2011, Atmos. Chem. Phys., 13, 8585–8605, https://doi.org/10.5194/acp-13-8585-2013, 2013.
Glasius, M., Carlsen, M. F., Hansen, T. B., and Lohse, C.: Measurements of Nitrogen Dioxide on Funen Using Diffusion Tubes, Atmos. Environ., 33, 1177–1185, https://doi.org/10.1016/S1352-2310(98)00285-4, 1999.
Hao, C., Shepson, P. B., Drummond, J. W., and Muthuramu, K.: Gas Chromatographic Detector for Selective and Sensitive Detection of Atmospheric Organic Nitrates, Anal. Chem., 66, 3737–3743, https://doi.org/10.1021/ac00093a032, 1994.
Hargrove, J. and Zhang, J.: Measurements of NOx, Acyl Peroxynitrates, and NOy with Automatic Interference Corrections Using a NO2 Analyzer and Gas Phase Titration, Rev. Sci. Instrum., 79, 046109, https://doi.org/10.1063/1.2908432, 2008.
Horowitz, L. W., Fiore, A. M., Milly, G. P., Cohen, R. C., Perring, A., Wooldridge, P. J., Hess, P. G., Emmons, L. K., and Lamarque, J.-F.: Observational Constraints on the Chemistry of Isoprene Nitrates over the Eastern United States, J. Geophys. Res., 112, D12S08, https://doi.org/10.1029/2006JD007747, 2007.
Jimenez, J. L., Canagaratna, M. R., Donahue, N. M., et al.: Evolution of Organic Aerosols in the Atmosphere, Science, 326, 1525–1529, https://doi.org/10.1126/science.1180353, 2009.
Kim, Y. J., Spak, S. N., Carmichael, G. R, Riemer, N., and Stanier, C. O.: Modeled aerosol nitrate formation pathways during wintertime in the Great Lakes region of North America, J. Geophys. Res.-Atmos., 119, 12420–12445, https://doi.org/10.1002/2014JD022320, 2014.
Kirchner, F., Mayer-Figge, A., Zabel, F., and Becker, K. H.: Thermal Stability of Peroxynitrates, Int. J. Chem. Kinet., 31, 127–144, https://doi.org/10.1002/(SICI)1097-4601(1999)31:2<127::AID-KIN6>3.0.CO;2-L, 1999.
Knopf, D. A., Pöschl, U., and Shiraiwa, M.: Radial Diffusion and Penetration of Gas Molecules and Aerosol Particles through Laminar Flow Reactors, Denuders, and Sampling Tubes, Anal. Chem., 87, 3746–3754, https://doi.org/10.1021/ac5042395, 2015.
Lee, B. H., Mohr, C., Lopez-Hilfiker, F.D., Lutz, A., Hallquist, M. Lee, L., Romer, P., Cohen, R. C., Iyer, S., Kurtén, T., Hu, W., Day, D. A., Campuzano-Jost, P., Jimenez, J. L., Xu, L., Ng, N. L., Guo, H., Weber, R. J., Wild, R. J., Brown, S. S., Koss, A., de Gouw, J., Olson, K., Goldstein, A. H., Seco, R., Kim, S., McAvey, K., Shepson, P. B., Starn, T., Baumann, K., Edgerton, E. S., Liu, J., Shilling, J. E., Miller, D. O., Brune, W., Schobesberger, S., D'Ambro, E. L., and Thornton J. A.: Highly Functionalized Organic Nitrates in the Southeast United States: Contribution to Secondary Organic Aerosol and Reactive Nitrogen Budgets, P. Natl. Acad. Sci. USA, 113, 1516–1521, https://doi.org/10.1073/pnas.1508108113, 2016.
NASA/JPL Data Evaluation: Chemical Kinetics and Photochemical Data for Use in Atmospheric Studies, JPL Publication No. 18, available at: https://jpldataeval.jpl.nasa.gov/ (last access: June 2020), 2015.
Ng, N. L., Brown, S. S., Archibald, A. T., Atlas, E., Cohen, R. C., Crowley, J. N., Day, D. A., Donahue, N. M., Fry, J. L., Fuchs, H., Griffin, R. J., Guzman, M. I., Herrmann, H., Hodzic, A., Iinuma, Y., Jimenez, J. L., Kiendler-Scharr, A., Lee, B. H., Luecken, D. J., Mao, J., McLaren, R., Mutzel, A., Osthoff, H. D., Ouyang, B., Picquet-Varrault, B., Platt, U., Pye, H. O. T., Rudich, Y., Schwantes, R. H., Shiraiwa, M., Stutz, J., Thornton, J. A., Tilgner, A., Williams, B. J., and Zaveri, R. A.: Nitrate radicals and biogenic volatile organic compounds: oxidation, mechanisms, and organic aerosol, Atmos. Chem. Phys., 17, 2103–2162, https://doi.org/10.5194/acp-17-2103-2017, 2017.
Pankow, J. F. and Asher, W. E.: SIMPOL.1: a simple group contribution method for predicting vapor pressures and enthalpies of vaporization of multifunctional organic compounds, Atmos. Chem. Phys., 8, 2773–2796, https://doi.org/10.5194/acp-8-2773-2008, 2008.
Parrish, D. D. and Fehsenfeld, F. C.: Methods for Gas-Phase Measurements of Ozone, Ozone Precursors and Aerosol Precursors, Atmos. Environ., 34, 1921–1957, https://doi.org/10.1016/S1352-2310(99)00454-9, 2000.
Paul, D., Furgeson, A., and Osthoff, H. D.: Measurements of Total Peroxy and Alkyl Nitrate Abundances in Laboratory-Generated Gas Samples by Thermal Dissociation Cavity Ring-down Spectroscopy, Rev. Sci. Instrum., 80, 114101, https://doi.org/10.1063/1.3258204, 2009.
Peng, Z. and Jimenez, J. L.: KinSim: A Research-Grade, User-Friendly, Visual Kinetics Simulator for Chemical-Kinetics and Environmental-Chemistry Teaching, Journal of Chemical Education, 96, 806–811, https://doi.org/10.1021/acs.jchemed.9b00033, 2019.
Perring, A. E., Pusede, S. E., and Cohen, R. C.: An Observational Perspective on the Atmospheric Impacts of Alkyl and Multifunctional Nitrates on Ozone and Secondary Organic Aerosol, Chemical Reviews, 113, 5848–5870, https://doi.org/10.1021/cr300520x, 2013.
Rollins, A. W., Smith, J. D., Wilson, K. R., and Cohen, R. C.: Real Time In Situ Detection of Organic Nitrates in Atmospheric Aerosols, Environ. Sci. Technol., 44, 5540–5545, https://doi.org/10.1021/Es100926x, 2010.
Seinfeld, J. H. and Pandis, S. N.: Atmospheric Chemistry and Physics: From Air Pollution to Climate Change, 2nd edn., John Wiley & Sons, Hoboken, NJ, 2006.
Seinfeld, J. H. and Pankow, J. F.: Organic Atmospheric Particulate Material, Annual Review of Physical Chemistry, 54, 121–140, https://doi.org/10.1146/annurev.physchem.54.011002.103756, 2003.
Sobanski, N., Schuladen, J., Schuster, G., Lelieveld, J., and Crowley, J. N.: A five-channel cavity ring-down spectrometer for the detection of NO2, NO3, N2O5, total peroxy nitrates and total alkyl nitrates, Atmos. Meas. Tech., 9, 5103–5118, https://doi.org/10.5194/amt-9-5103-2016, 2016.
Surratt, J. D., Murphy, S. M., Kroll, J. H., Ng, N. L., Hildebrandt, L., Sorooshian, A., Szmigielski, R., Vermeylen, R., Maenhaut, W., Claeys, M., Flagan, R. C., and Seinfeld, J. H.: Chemical Composition of Secondary Organic Aerosol Formed from the Photooxidation of Isoprene, J. Phys. Chem. A, 110, 9665–9690, https://doi.org/10.1021/jp061734m, 2006.
Takeuchi, M. and Ng, N. L.: Chemical composition and hydrolysis of organic nitrate aerosol formed from hydroxyl and nitrate radical oxidation of α-pinene and β-pinene, Atmos. Chem. Phys., 19, 12749–12766, https://doi.org/10.5194/acp-19-12749-2019, 2019.
Thornton, J. A., Wooldridge, P. J., Cohen, R. C., Martinez, M., Harder, H., Brune, W. H., Williams, E. J., Roberts J. M., Fehsenfeld, F. C., Hall, S. R., Shetter, R. E., Wert, B. P., and Fried, A.: Ozone Production Rates as a Function of NOx Abundances and HOx Production Rates in the Nashville Urban Plume, J. Geophys. Res., 107, ACH 7-1–ACH 7-17, https://doi.org/10.1029/2001JD000932, 2002.
Williams, E. J., Baumann, K. Roberts, J. M., Bertman, S. B., Norton, R. B., Fehsenfeld, F. C., Springston, S. R., L. J. Nunnermacker L. Newman K. Olszyna J. Meagher B. Hartsell E. Edgerton J. R. Pearson M. O. Rodgers: Intercomparison of Ground-Based NOy Measurement Techniques, J. Geophys. Res., 103, 22261–22280, https://doi.org/10.1029/98JD00074, 2012.
Wolfe, G. M., Thornton, J. A., McNeill, V. F., Jaffe, D. A., Reidmiller, D., Chand, D., Smith, J., Swartzendruber, P., Flocke, F., and Zheng, W.: Influence of trans-Pacific pollution transport on acyl peroxy nitrate abundances and speciation at Mount Bachelor Observatory during INTEX-B, Atmos. Chem. Phys., 7, 5309–5325, https://doi.org/10.5194/acp-7-5309-2007, 2007.
Womack, C. C., Neuman, J. A., Veres, P. R., Eilerman, S. J., Brock, C. A., Decker, Z. C. J., Zarzana, K. J., Dube, W. P., Wild, R. J., Wooldridge, P. J., Cohen, R. C., and Brown, S. S.: Evaluation of the accuracy of thermal dissociation CRDS and LIF techniques for atmospheric measurement of reactive nitrogen species, Atmos. Meas. Tech., 10, 1911–1926, https://doi.org/10.5194/amt-10-1911-2017, 2017.
Wooldridge, P. J., Perring, A. E., Bertram, T. H., Flocke, F. M., Roberts, J. M., Singh, H. B., Huey, L. G., Thornton, J. A., Wolfe, G. M., Murphy, J. G., Fry, J. L., Rollins, A. W., LaFranchi, B. W., and Cohen, R. C.: Total Peroxy Nitrates (ΣPNs) in the atmosphere: the Thermal Dissociation-Laser Induced Fluorescence (TD-LIF) technique and comparisons to speciated PAN measurements, Atmos. Meas. Tech., 3, 593–607, https://doi.org/10.5194/amt-3-593-2010, 2010.
Zare, A., Romer, P. S., Nguyen, T., Keutsch, F. N., Skog, K., and Cohen, R. C.: A comprehensive organic nitrate chemistry: insights into the lifetime of atmospheric organic nitrates, Atmos. Chem. Phys., 18, 15419–15436, https://doi.org/10.5194/acp-18-15419-2018, 2018.
Zellweger, C., Ammann, M., Hofer, P., and Baltensperger, U: NOy speciation with a combined wet effluent diffusion denuder – aerosol collector coupled to ion chromatography, Atmos. Environ., 33, 1131–1140, https://doi.org/10.1016/S1352-2310(98)00295-7, 1999.