the Creative Commons Attribution 4.0 License.
the Creative Commons Attribution 4.0 License.
 | 25 Nov 2020
Implementation of an incoherent broadband cavity-enhanced absorption spectroscopy technique in an atmospheric simulation chamber for in situ NO3 monitoring: characterization and validation for kinetic studies
Axel Fouqueau
Manuela Cirtog
Mathieu Cazaunau
Edouard Pangui
Pascal Zapf
Guillaume Siour
Xavier Landsheere
Guillaume Méjean
Daniele Romanini
Bénédicte Picquet-Varrault
An incoherent broadband cavity-enhanced absorption spectroscopy (IBBCEAS) technique has been developed for the in situ monitoring of NO3 radicals at the parts per trillion level in the CSA simulation chamber (at LISA). The technique couples an incoherent broadband light source centered at 662 nm with a high-finesse optical cavity made of two highly reflecting mirrors. The optical cavity which has an effective length of 82 cm allows for up to 3 km of effective absorption and a high sensitivity for NO3 detection (up to 6 ppt for an integration time of 10 s). This technique also allows for NO2 monitoring (up to 9 ppb for an integration time of 10 s). Here, we present the experimental setup as well as tests for its characterization and validation. The validation tests include an intercomparison with another independent technique (Fourier-transform infrared, FTIR) and the absolute rate determination for the reaction trans-2-butene + NO3, which is already well documented in the literature. The value of (4.13 ± 0.45) × 10−13 cm3 molecule−1 s−1 has been found, which is in good agreement with previous determinations. From these experiments, optimal operation conditions are proposed. The technique is now fully operational and can be used to determine rate constants for fast reactions involving complex volatile organic compounds (VOCs; with rate constants up to 10−10 cm3 molecule−1 s−1).
- Article
(2540 KB) - Full-text XML
- BibTeX
- EndNote


The nighttime chemistry in polluted urban or suburban areas has been proved to be governed by NO3 radicals since its discovery in the 1980s (Naudet et al., 1981; Noxon et al., 1978, 1980; Platt et al., 1980). In particular, the NO3 radical has been shown to be an efficient oxidant for some organic compounds, or in some cases even the dominant one, thus impacting the budget of these species and their degradation products. Unsaturated volatile organic compounds (VOCs), including biogenic VOCs (BVOCs), are particularly reactive towards NO3 radicals (Wayne et al., 1991). Providing kinetic data for these reactions is essential for a better understanding of the role of NO3 radicals in their degradation. Nevertheless, due to the high reactivity of some unsaturated VOCs with NO3 (with rate constants which can reach 10−11 to 10−10 cm3 molecule−1 s−1), an absolute rate determination for these reactions appears to be difficult as it requires the use of a highly sensitive method for NO3 monitoring. As a consequence, the number of absolute kinetic studies for the NO3-initiated oxidation of terpenes is very limited, and this leads to large uncertainties on this chemistry as has been pointed out in the literature (Atkinson, 2000; Brown and Stutz, 2012; Ng et al., 2017). Calvert et al. (2015) gave recommendations for NO3 oxidation rate constants for 91 alkenes (ranging between 10−16 and 10−10 cm3 molecule−1 s−1), and more than 98 % of the determinations on which these recommendations are based were conducted using the relative rate method. One of the reasons for this is still the challenging measurement of NO3 radicals at low mixing ratios (< 100 ppt) during such experiments. For these compounds, new absolute determinations are essential to better evaluate the role of NO3 radicals in their degradation.
Among the various experimental tools which are currently used to measure rate constants, atmospheric simulation chambers represent suitable tools for performing experiments under very realistic atmospheric conditions. This implies low concentrations of reactants in order to minimize possible secondary reactions. Another benefit of these facilities is the high analytical capabilities which allow for the in situ monitoring of reactants and products with a high sensitivity. Even though significant progress has been made in the last decades for NO3 radicals' measurement at low concentrations with the rise of cavity enhanced and cavity ring-down spectroscopy (CRDS) techniques (Ball et al., 2004; Bitter et al., 2005; Kennedy et al., 2011; Langridge et al., 2008) as well as laser-induced fluorescence techniques (Matsumoto et al., 2005b, c, a; Wood et al., 2003), it is observed that only few were coupled to simulation chambers (Dorn et al., 2013; Venables et al., 2006; Wu et al., 2014). In addition, to the best of our knowledge, none of these techniques has been used for kinetic applications involving NO3 radicals in simulation chambers.
For this purpose, the analytical capabilities of the CSA chamber available at LISA have been improved by developing a sensitive technique for measuring NO3 radicals at very low concentration. An incoherent broadband cavity enhanced absorption spectroscopy (IBBCEAS) technique has been coupled to the chamber with the objective of performing high-sensitivity in situ NO3 monitoring with an integration time of seconds.
In this paper, we describe the experimental setup and the characterization of the technique. Finally, the IBBCEAS technique has been validated thanks to an intercomparison of NO2 and NO3 measurement with the Fourier-transform infrared (FTIR) technique and an absolute rate determination for the well-known reaction trans-2-butene + NO3.
2.1 The CSA chamber
The CSA chamber is made of a large and evacuable Pyrex® reactor (6 m length, 45 cm diameter and 977 L volume) which has been previously presented in detail (Doussin et al., 1997). It is equipped with a homogenization system which is made of (i) an injection pipe (4 m long, 1 cm diameter and regularly drilled with 1 mm holes), which allows the reactants to be injected all along the chamber; (ii) two stainless steel fans, allowing for a homogenization of gas inside the chamber; and (iii) a closed-circuit Teflon pump connected at both ends, allowing for a recirculation of the gas mixing. This system allows a mixing time below 1 min. The chamber is also equipped with two in situ spectroscopic analytical devices coupled with White-type multiple reflection systems inside the reactor: (i) a FTIR spectrometer (Bruker Vertex 80), which allows spectra to be acquired in the range of 600–4000 cm−1 with a maximal spectral resolution of 0.07 cm−1 and an optical path length of 204 m; and (ii) an UV–Visible grating spectrometer, consisting of a high-pressure Xenon arc lamp (Osram XBO, 450 W Xe UV), an HR 320 monochromator (Jobin-Yvon) and a CCD camera (CCD 3000, 1024 × 58 pixel, Jobin-Yvon) as a detector. This spectrometer allows spectra to be acquired with a spectral resolution of 0.18 nm and an optical path length of 72 m.
This facility has intensively been used to investigate complex gas-phase chemistry involving organic compounds and to provide kinetic and mechanistic data. In particular, it has been used for absolute rate determination of reactions involving NO3 radicals with a series of VOCs like ethers, esters and aldehydes (Kerdouci et al., 2012; Picquet-Varrault et al., 2009; Scarfogliero et al., 2006). In these studies, NO3 was monitored at 662 nm with the in situ UV–Visible spectrometer. However, due to the poor detection limit (0.5 ppb for 1 min of acquisition), and taking into account the experimental conditions, the range of rate constants that can be investigated is limited (< 10−12 cm3 molecule−1 s−1), preventing very reactive chemical systems from being studied, such as BVOC + NO3 reactions.
2.2 The IBBCEAS setup
In order to improve the analytical capabilities of the CSA chamber, an IBBCEAS has been developed and coupled to the chamber for high-sensitivity in situ NO3 monitoring. A detailed description of the technique has been provided in previous works (Langridge et al., 2008; Romanini et al., 1997). IBBCEAS measurements are conducted by exciting, with an incoherent broad-band source, a high-finesse optical cavity formed by two mirrors with high reflectivity (R(λ) ∼ 99.98 %). Photons resonate between the two mirrors, increasing their lifetime in the cavity by a factor of . During this time, photons traverse an effective path length of kilometers inside the cavity, making observations of absorbing species at very low concentrations possible. The intensity transmitted by the optical cavity rapidly reaches a steady state. The optical intracavity absorption coefficient of the sample α(λ) can then be calculated with the following expression if an accurate measurement of the cavity reflectivity R(λ) and of the distance between the mirrors (d) is provided (Engel et al., 1998):
Here I(λ) and I0(λ) are the transmitted intensities measured in the presence and in the absence of the absorbing species respectively.
The concentrations of the absorbing molecules can then be calculated using a least-squares algorithm to simultaneously fit the molecules' absorption cross section using the formula:
where are the absorption cross sections, [X] are the species absorbing in the considered spectral region and p(λ) is a cubic polynomial to correct baseline deformations due to potential variations of the source intensity (Venables et al., 2006) or to absorption and/or scattering of particles in the chamber (Varma et al., 2013).
The optical cavity is made of two high-reflectivity mirrors (Layertec, planar/concave mirrors with a 1 m radius of curvature, nominal reflectivity of 99.98 ± 0.01 % between 630 and 690 nm). It has been transversally installed on the CSA chamber using two co-axial outputs of the reactor. A scheme of the IBBCEAS instrument interfaced to the chamber is shown in Fig. 1. The distance between the mirrors is 82 cm and includes 45 cm for the chamber diameter, 2 × 10.5 cm for the Pyrex outputs and 2 × 8 cm for the interface mounts between the chamber and the commercial CRD Optics mount support. In order to prevent the adsorption of semi-volatile species or deposition of particles on the mirrors, which would result in a significant decrease of the reflectivity, the mirrors can be protected thanks to a continuous nitrogen flush (flow rate: 300 mL min−1) using a 1∕16 in. (1.59 mm) input disposed close to the mirror surface. This flow rate has been optimized in order to efficiently protect the mirrors while limiting the dilution of the mixture in the measurement area. By comparing the absorption coefficients measured with and without the flush, for a known quantity of NO2 in the chamber, this effective length was estimated to be deff= 62 ± 3 cm (i.e., 24 % lower than the physical length of the cavity). A nitrogen flush was not used in this study but is available for further types of experiments. Thanks to the mixing system which ensures a fast homogenization of the mixture in the chamber, this effective length was observed to be constant during the whole duration of the experiment.
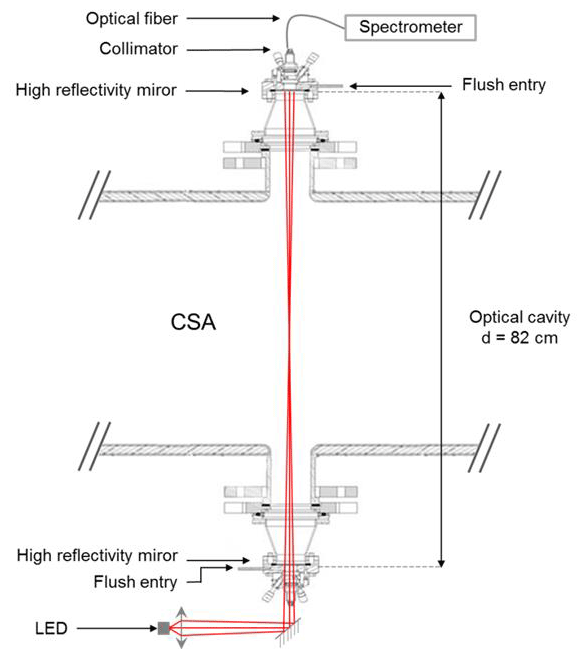
Figure 1Scheme (transverse section) of the IBBCEAS instrument interfaced to the CSA chamber. Collimating lenses and curved mirrors are not shown on the beam injection side.
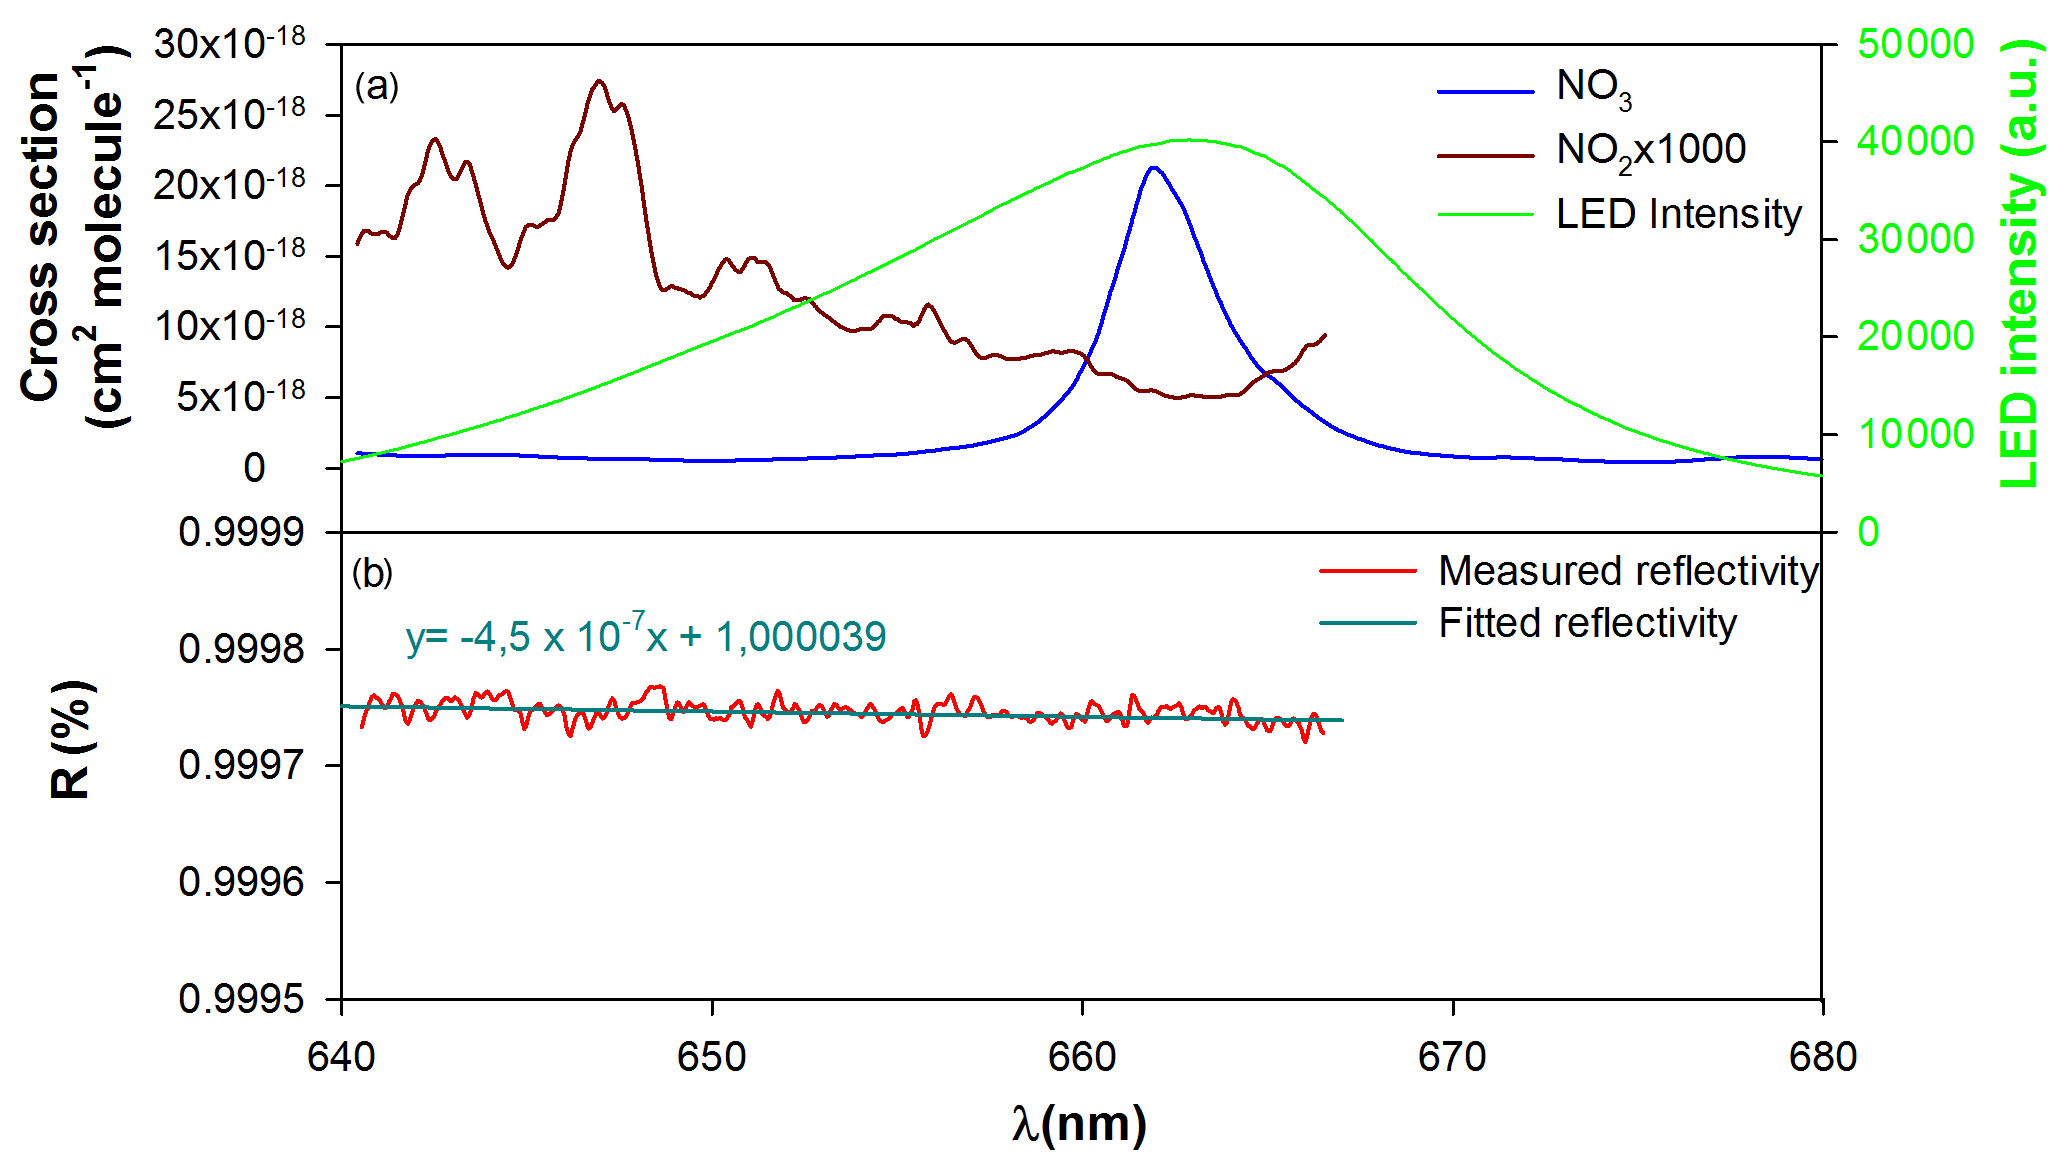
Figure 2(a) NO3 and NO2 absorption cross sections (Orphal et al., 2003; Vandaele et al., 1997) between 640 and 680 nm (convolved with apparatus function of the spectrometer) and LED emission spectrum and (b) mirror reflectivity.
A light emitting diode (LED; Mouser Electronics – Starboard, Luminus SST-10-DR-B130 Deep Red, K, max. 430 mW, D5) with an approximative Gaussian-shaped emission of 19 nm full width at half maximum (FWHM) and centered at 662 nm was used in order to monitor NO3 at its maximum absorption wavelength. The LED emission spectrum is compared to the cross section spectra of NO3 (Orphal et al., 2003) and NO2 (Vandaele et al., 1997) in Fig. 2. The spectral range of the LED is large enough to allow both NO2 and NO3 to be monitored.
The LED is mounted on a thermoelectric controller (TEC) device (ThermoElectric Cooling, Laser Mount Arroyo Instruments) to ensure a very precise temperature regulation (± 0.01 ∘C) and stabilize the spectral distribution of the LED. With this device, changes in the LED intensity have been observed to be below 0.3 %. A laser diode controller (Arroyo Instrument 6310) provides the electric power for both TEC and LED (LED current is fixed at 900 mA). Light emitted by the LED is spatially incoherent, and collimation is required for an effective coupling with the optical cavity. The light is hence focused with a convex lens (Thorlabs Aspheric Condenser Lens, 25.4 mm diameter, F = 16 mm, NA = 0.79) and injected into the optical cavity with two concave mirrors (Thorlabs, protected silver, diameter 50.8 mm, f = 50 mm and diameter 75 mm, f = 500 mm respectively) in order to focus the beam in the middle of the cavity. Light transmitted through the cavity is directed thanks to a collimator (Thorlabs SMA Fiber Collimation Pkg, 635 nm, f = 35.41 mm, NA = 0.25) and an optical fiber (Ocean Optics Vis–NIR, 200 µm slit, 5 m long) to a miniature Ocean Optics QE65000 spectrometer. The spectrometer measures the cavity output wavelength-dependent intensity and comprises a spectrograph interfaced to a charged coupled device (CCD) thermally stabilized at −15 ∘C to minimize the dark current. The spectral range covered by the spectrometer is 45 nm (640–685 nm) with a spectral resolution of 0.2 nm. In order to calculate the concentrations of absorbing species, a data treatment program has been developed in R (Ihaka and Gentleman, 1996) using a least-squares algorithm. A third-degree polynomial function is used in the fit to take into account baseline deformation due to small changes in the source intensity. The concentrations of the absorbing species and the polynomial function are fitted by minimizing the RMSE (root mean square error). In practice, the optimization was run following a bound optimization using the quadratic approximation (BOBYQA) method (Powell, 2009). The iterative process to minimize the RMSE (between absorption coefficients from Eqs. 1 and 2) stops when none of the parameters vary more than 0.2 % between two successive iterations. In the studied spectral range, absorbing species are H2O, NO2 and NO3. Absorption by water vapor may be very high under atmospheric conditions. Nevertheless, due to dry conditions used during the experiments (RH < 1 %), H2O absorption was negligible here. The absorption cross sections used are provided by the literature (Orphal et al., 2003; Vandaele et al., 1997) and have been convoluted with the apparatus function of the instrument. Because NO2 cross sections provided by Vandaele et al. (1997) are measured up to 666.5 nm, the treatment has systematically been conducted up to this value. The cross sections used for the data treatment are presented in Fig. 2.
Several experiments have been carried out to assess the stability, the accuracy and the detection limit of the technique. First experiments have been conducted to test the optical stability and the influence of pressure variations on the device. These tests have shown that the instrument is very stable (variations < 1 %). Two aspects have been shown to be particularly critical for measurement with IBBCEAS technique: I0 measurement and the determination of mirror reflectivity.
3.1 Determination of the cavity reflectivity
Having a precise knowledge of the wavelength-dependent mirror reflectivity, R(λ), is one of the most critical points of the IBBCEAS technique (Venables et al., 2006). Two different methods have been proposed for accurate determination of R(λ): (i) measurement of a known concentration of an absorbing species (Ventrillard-Courtillot et al., 2010) and (ii) measurement of the ring-down time in the empty cavity using a pulsed laser CRDS technique (Ball et al., 2004). The first method has been employed here. The absorbing species which has been chosen for the experiments is NO2 as it absorbs in the whole spectral region of the LED emission, and its absorption cross sections are known with high accuracy. NO2 concentrations in the simulation chamber were obtained from in situ FTIR measurements using IBI (1530–1680 cm−1) = (5.6 ± 0.2) × 10−17 cm molecule−1 (base e). To retrieve the mirror reflectivity R(λ) from NO2 concentration, the following equation is used:
where is the NO2 absorption cross section (Vandaele et al., 1997), and [NO2] is the concentration of NO2 determined by FTIR. In order to reduce the uncertainty on the reflectivity determination and to compensate the weak cross sections of NO2 in the 660–670 nm region, high concentrations (up to 800 ppb) were used. A plot showing the variation of the reflectivity in function of the wavelength is presented as an example in Fig. 2. Due to the NO2 reference spectrum, the reflectivity is measured up to 666.5 nm. During this experiment, the reflectivity was observed to vary between 99.975 at 640 nm and 99.974 % at 667 nm, and this is in agreement with the reflectivity provided by the supplier (99.98 ± 0.01 %). It was found to have a slight dependence on wavelengths (), which justifies that it is necessary to measure it in a wide wavelength range. At 662 nm, which corresponds to the maximum of NO3 absorption, the reflectivity was found to be 99.974 %. At this wavelength, the effective absorption path length estimated from Eq. (4) is found to be 3.15 km:
In addition, it has been observed that the reflectivity of the cavity can significantly vary with the mirror cleanliness. As an example, successive experiments showed that reflectivity can vary at 662 nm from 99.974 % to 99.971 % from one experiment to another, leading to variations of the effective absorption path length of almost 12 %. Therefore, it is crucial to precisely determine the reflectivity prior to each experiment.
3.2 I0(λ) measurement
Previous studies (Fuchs et al., 2010; Kennedy et al., 2011; Ventrillard-Courtillot et al., 2010) have pointed out that the I0(λ) has to be periodically recorded during an experiment to ensure accurate measurement with the IBBCEAS technique. Indeed, changes in the lamp emission spectrum or poor optical stability may induce changes in the absorption coefficient and therefore generate errors in the quantification of the species. This fact may be an issue for experiments in simulation chambers as the I0(λ) can only be recorded before injecting the reactants, and experiments can then last for several hours.
In order to evaluate the stability of the signal during a typical experiment and the uncertainty generated by the use of a unique I0(λ) on the quantification of the species, two types of experiments have been performed: first, the stability of the optical system was verified. For this purpose, long-term measurements of the signal were performed, leading to variations lower than 0.3 % and to very small baseline distortions. Then, to verify the impact of these variations on the quantification of absorbing species, experiments were conducted by injecting NO2, which was observed to be stable in the chamber, and by monitoring its concentration with the IBBCEAS technique for several hours: after the chamber was filled with a mixture of N2 ∕ O2 (80∕20) at atmospheric pressure, the I0(λ) was measured. Then, a concentration of NO2 was introduced into the chamber (mixing ratios ranging between 100 ppb and 1 ppm, depending of the experiment), and the signal I(λ) was measured. From these measurements, the absorption coefficient and the NO2 concentration were calculated and plotted as a function of time in Fig. 3, for a concentration of 1 ppm of NO2. An increase up to 3 % in NO2 concentration was observed 2 h after recording the I0(λ) due to the deviation of the baseline which is no longer well corrected by the polynomial function. These results suggest that the accuracy of the measurement is significantly reduced after 2 h. The length of the experiments should therefore not exceed this duration. Above this limit the uncertainty due to a unique measurement of the I0(λ) can be considered as being negligible.
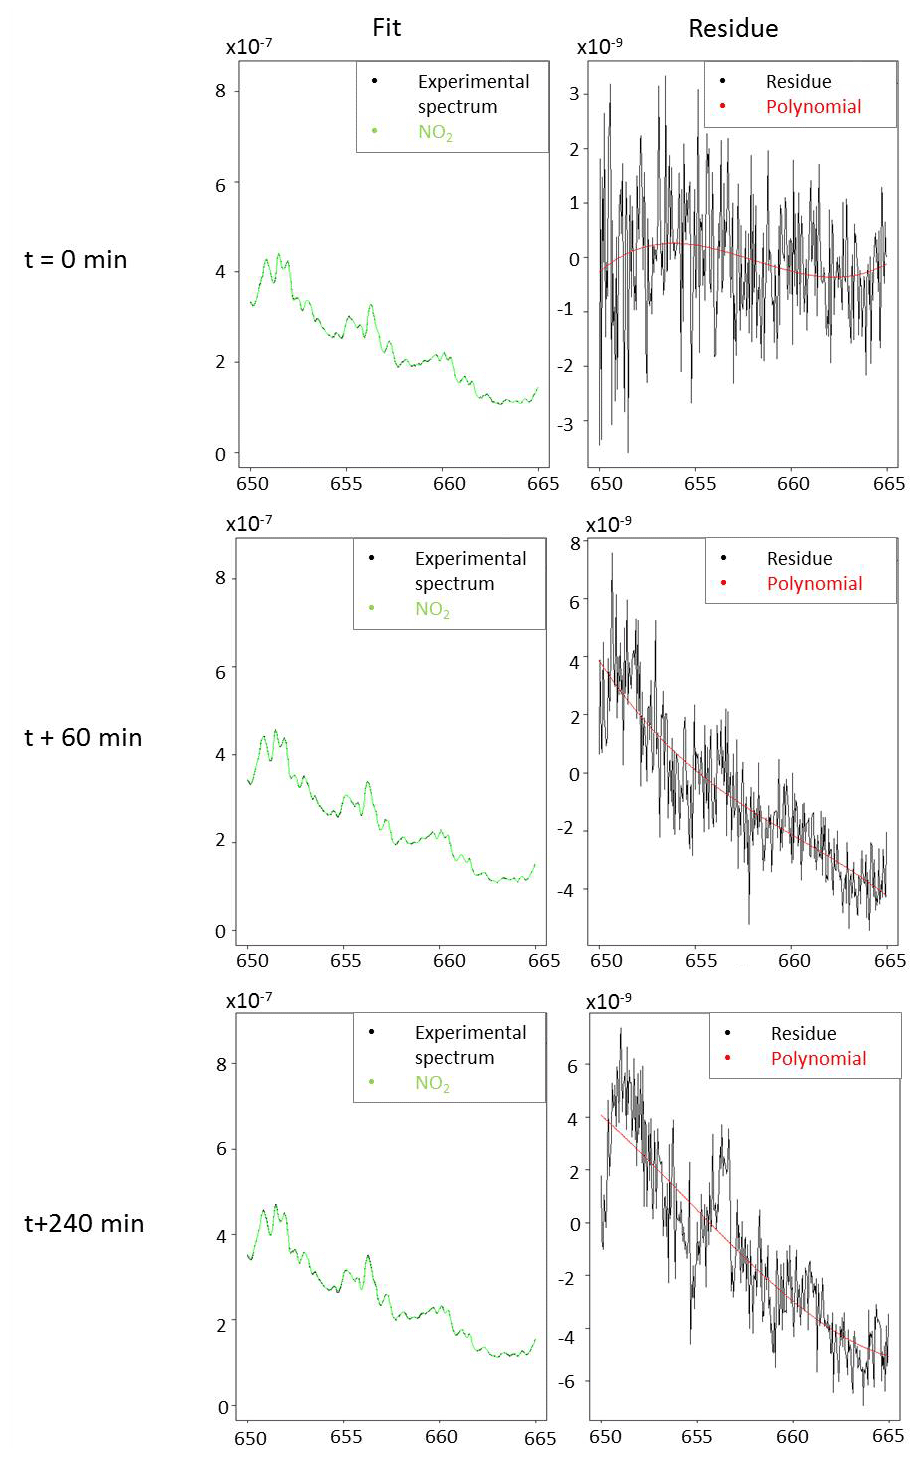
Figure 3Evolution of fit quality for 1 ppm of NO2 as a function of time since I0 was measured.
3.3 Detection limit and Allan variance
The detection limit for NO3 radical was estimated by considering 3 times the peak-to-peak noise on the absorption coefficient at 662 nm, which corresponds to the maximum absorption of NO3 radical. For 10 s of acquisition time (which corresponds to 25 acquisitions of 400 ms) and an unpurged system, it has been found to be 1.2 × 10⁻⁹ cm−1. Considering that NO3 radical cross section at this wavelength is 2.2 × 10⁻¹⁷ cm2 molecule−1, the detection limit for NO3 was estimated to be 6 ppt. The same approach was used to estimate the detection limit for NO2. Between 645 and 650 nm, which correspond to the two main absorption peaks of NO2, noise has been found to be 2 × 10⁻⁹ cm−1. Considering the difference of maximum and minimum absorption of 2.2 × 10⁻²⁰ cm2 molecule−1 in this range, the detection limit has been found to be 11 ppb for 10 s of integration time. A spectrum measured with an acquisition time of 10 s, for 6 ppt of NO3 and 630 ppb of NO2, is shown for illustration in Fig. 4. The fit range used was between 655 and 666.5 nm. Even at this low level of NO3 concentration, the absorption is clear and allows its quantification. The fit appears to be satisfying for both NO2 and NO3, and the residual spectrum appears to be essentially made of noise, showing a good efficiency of the polynomial fit and a satisfying subtraction of species contributions. This figure shows that this wavelength range is efficient for a precise detection and quantification of both species and validates the detection limit.
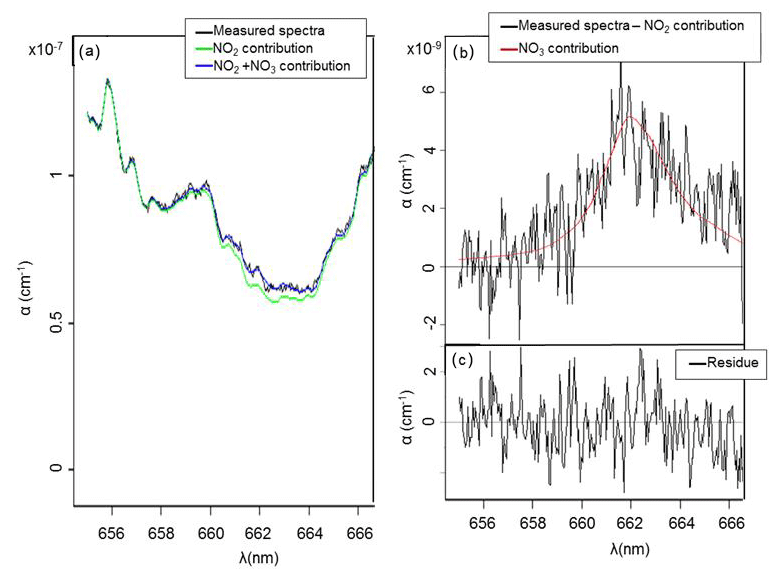
Figure 4(a) Measured absorption coefficient α(λ) (between 655 and 669 nm) with an integration time of 10 s (in black); complete fit of NO2 and NO3 (in blue) with [NO3] = 6 ppt; [NO2] = 630 ppb; NO2 fit only (in green); (b) measured absorption coefficient (in black) without NO2 contribution and fitted with [NO3] = 6 ppt (in red); (c) residue of measured and fitted absorption coefficient.
Table 1Comparison of characteristics and performances of various IBBCEAS devices coupled to simulation chambers for the detection of NO3 radicals.
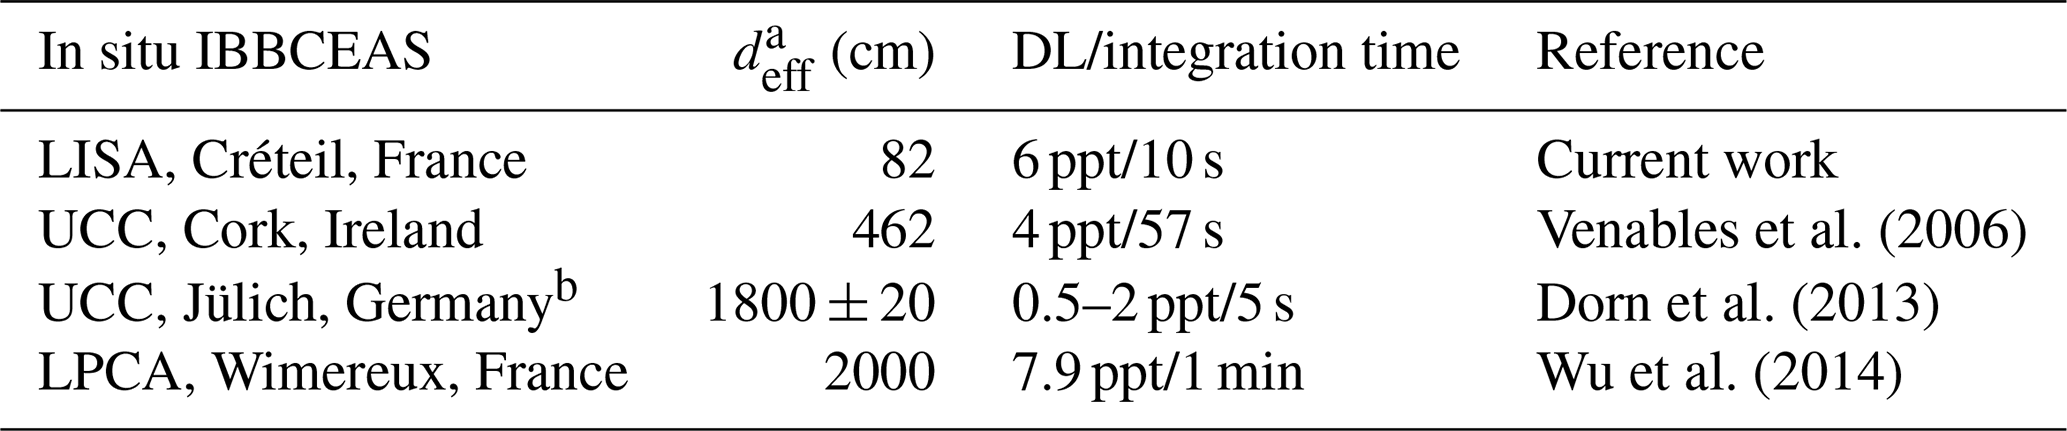
a deff is the effective length of the cavity, calculated by taking into account the dilution generated by the mirror protective flush. b UCC's IBBCEAS device was used in the SAPHIR chamber during an intercomparison campaign.
The potential of the IBBCEAS technique for measuring NO3 radicals during simulation chamber experiments has already been explored in previous works. It has been coupled to the simulation chamber at UCC (Cork, Ireland), to the SAPHIR chamber at FZJ (Jülich, Germany) and to the CHARME chamber at LPCA (Wimereux, France). The characteristics and performances of the various instruments are compared in Table 1. Our instrument exhibits very good performance, with the detection limit similar to that of the other instruments but for shorter integration time and/or for a smaller effective length. This reflects the very good stability of the optical system. These results also prove the potential of this technique for measuring NO3 radicals at low level of concentrations with a good time resolution (10 s) and thus its suitability for kinetic measurements.
In order to evaluate if our detection limit can be improved by increasing the integration time, the Allan variance has been calculated for various integration times during an experiment in which NO2 concentration was monitored. The NO2 mixing ratio was approximatively 1300 ppb. The Allan variance is given by the equation:
with M the number of measurements, tav the integration time and x the concentration of NO2 measured. In this experiment, 30 000 measurements of 2 s were performed, and the Allan variance was then calculated for various integration times ranging between 2 and 4096 s. The standard deviation of Allan, defined as the square root of the Allan variation, provides an indication of the instrument stability in time. It is plotted as a function of the integration time in Fig. 5. For a very short integration time (a few seconds) the Allan deviation is very high due to the white noise of the instrument. The Allan deviation decreases with increasing integration time up to 100 s. For longer integration times, the deviation increases with increasing integration time. Nevertheless, the deviation is low, showing that the instrument is very stable. Due to this stability, we expect that the detection limits calculated before can be improved by increasing the integration time. From this test, it can also be concluded that the optimal integration time is around 100 s.
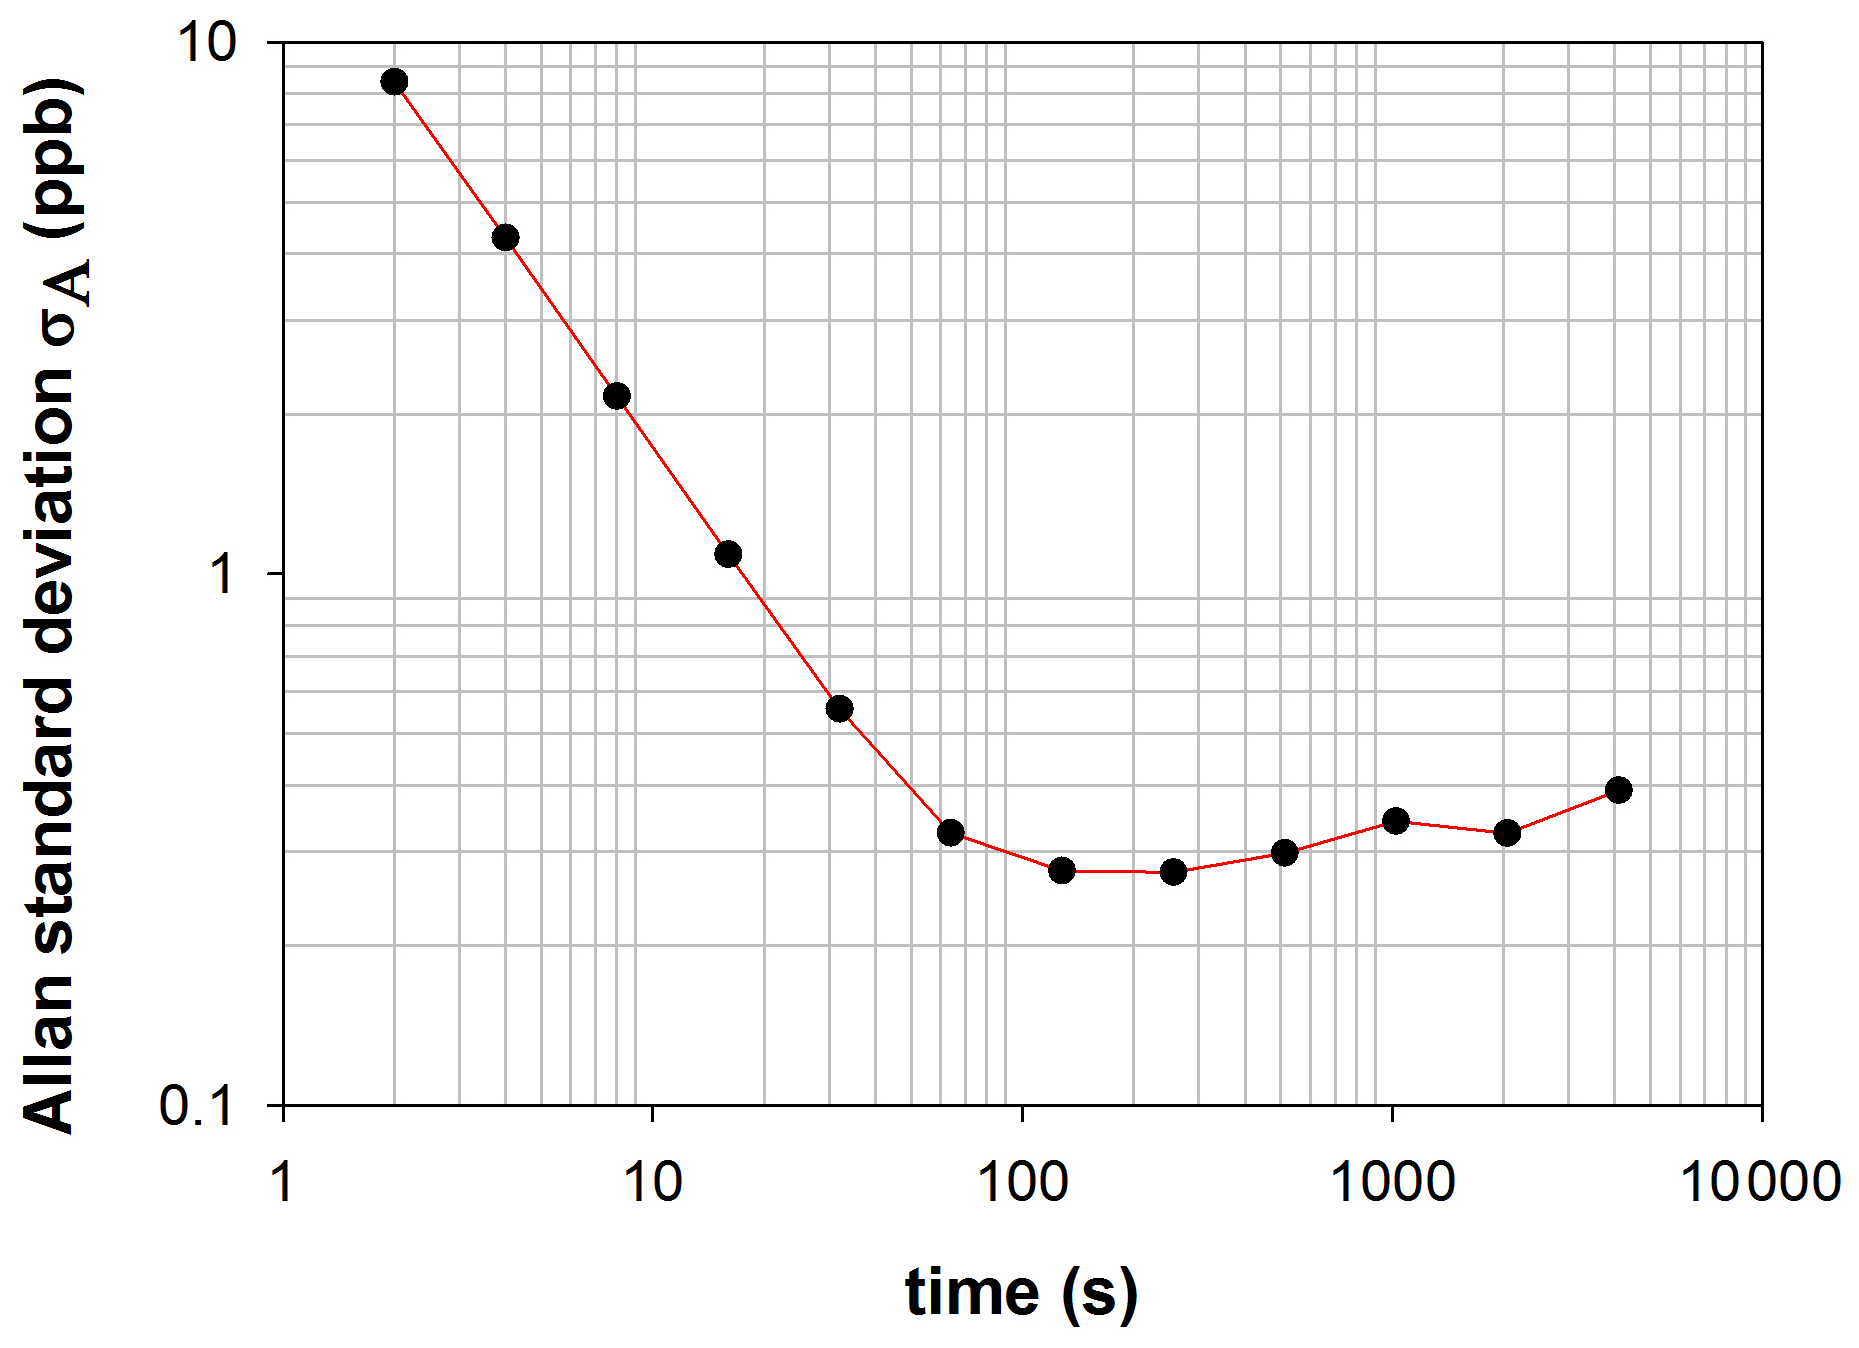
The high stability of the Allan deviation after 100 s also suggests that the stability of the optical device is optimal to perform measurements without recording a new I0(λ) for at least 4096 s, in agreement with the result of the test presented in Sect. 3.2. In conclusion, the good stability of the optical device complies with the constraint of experiments in the simulation chamber for which I0(λ) can only be recorded at the beginning of the experiment.
3.4 Determination of the uncertainty
Considering Eqs. (1) and (2), the overall relative error on NO3 concentration can be considered as the square root of the sum of the square relative errors, the reflectivity R(λ) and the NO3 absorption cross sections. In the case of the use of the nitrogen flush, the uncertainty on deff also has to be taken into account (8 %; see Sect. 2). Considering Eq. (3), the uncertainty on R(λ) should include the uncertainty on NO2 concentration measured by FTIR estimated to be 8 % as well as the uncertainty on NO2 absorption cross sections. The uncertainties on NO2 and NO3 cross sections are estimated to be 3 % in the spectral range of interest (Vandaele et al., 1997; Orphal et al., 2003). However, the uncertainty generated by the data treatment, Δfit, i.e., by the fit, which results mainly from the noise in the spectra, should also be taken into account. Because the nitrate radical is an unstable species, this uncertainty cannot be estimated by calculating the standard deviation of its concentrations measured for a long period of monitoring. It was therefore estimated by considering the noise of a NO3 concentration time profile and has been found to be ∼ 3 ppt for 10 s of integration time. The overall absolute error on NO3 concentration is then expressed by the following formula:
where , and are relative uncertainties on NO2 cross sections, NO2 concentration used for the reflectivity measurement and NO3 cross sections respectively, and is the concentration of NO3. For 10 s of integration time, the uncertainty is thus 9 % with an absolute part of 3 ppt.
After having defined the optimal operation conditions of the IBBCEAS, the technique has been validated thanks to an intercomparison with another instrument. During a dedicated experiment, NO3 and NO2 concentrations were measured using the IBBCEAS technique, while NO2 and N2O5 were monitored by in situ FTIR. The chamber was first filled with dry synthetic air (RH < 1 %) at atmospheric pressure, and I0(λ) spectra were recorded for both FTIR and IBBCEAS. Several hundreds of parts per billion of NO2 (Air Liquide N20, purity > 99 %, H2O < 3000 ppm) were then introduced into the chamber, and IBBCEAS spectra were recorded in order to determine the mirrors' reflectivity, R(λ) (see Sect. 3.2). NO3 radicals were then formed in situ, using thermal dissociation of N2O5 (Reaction R1), which was synthesized in a vacuum line following the reaction between O3 and NO2 (Reactions R2 and R3). This protocol was adapted from Atkinson et al. (1984) and Schott and Davidson (1958) and is detailed in Picquet-Varrault et al. (2009).
Then, by considering the following equilibrium,
and by assuming that this equilibrium is reached, NO3 concentration can be deduced from NO2 and N2O5 concentrations measured by FTIR. This hypothesis appears justified as no other reactive species has been introduced into the chamber and may thus disturb the equilibrium. The equilibrium constant () is well known and has been shown to highly depend on temperature and pressure (Atkinson et al., 2004). These two parameters were therefore precisely monitored during the experiment, allowing an equilibrium constant of 2.17 × 10⁻¹¹ cm3.molecule−1 at 298 K and at 1030 mbar to be calculated using IUPAC database parameters (Atkinson et al., 2004). IBBCEAS spectra were recorded every 30 s, while FTIR ones were recorded every 2 min. The integrated band intensities used to quantify NO2 and N2O5 with FTIR were IBI (1530–1680 cm−1) = (5.6 ± 0.2) × 10−17 cm molecule−1 and IBI (1200–1285 cm−1) = (4.05 ± 0.4) × 10−17 cm molecule−1 (base e). The correlation plots between FTIR and IBBCEAS for NO3 and NO2 measurements are shown in Fig. 6. NO2 concentrations measured by the two techniques are in very good agreement (the maximum difference between the two techniques is 6 %), with a slope of 1.0 ± 0.2. Here, the overall uncertainty was calculated as the sum of the statistical error on the slope (twice the standard deviation, 4 %) and systematic errors on FTIR (i.e., on IBI, 4 %) and IBBCEAS measurements (which includes uncertainties on NO2 cross sections and on the mirrors reflectivity, 9 %). The intercept of the linear regression (b = 15.0 ppb) is not significantly different from zero as it is lower than its uncertainty calculated as twice the standard deviation (Δb = 25.1 ppb). For NO3 radicals, the concentrations obtained by the two techniques are also in good agreement for the whole range of concentrations, from a few parts per trillion to several hundred parts per trillion. The slope of the NO3 correlation plot is 1.1 ± 0.3, suggesting a bias of 10 % between the two techniques. The error is calculated with the same method as for NO2. However, this difference is not significant in regards to the uncertainties which are represented by the dashed black lines. For FTIR measurement, the uncertainties are calculated as the error on NO2 and N2O5 measurement and on the equilibrium constant (21 %). The calculation for uncertainty on NO3 IBBCEAS measurement is presented in Sect. 3.4. The intercept appears to be very low (around 3 ppt).
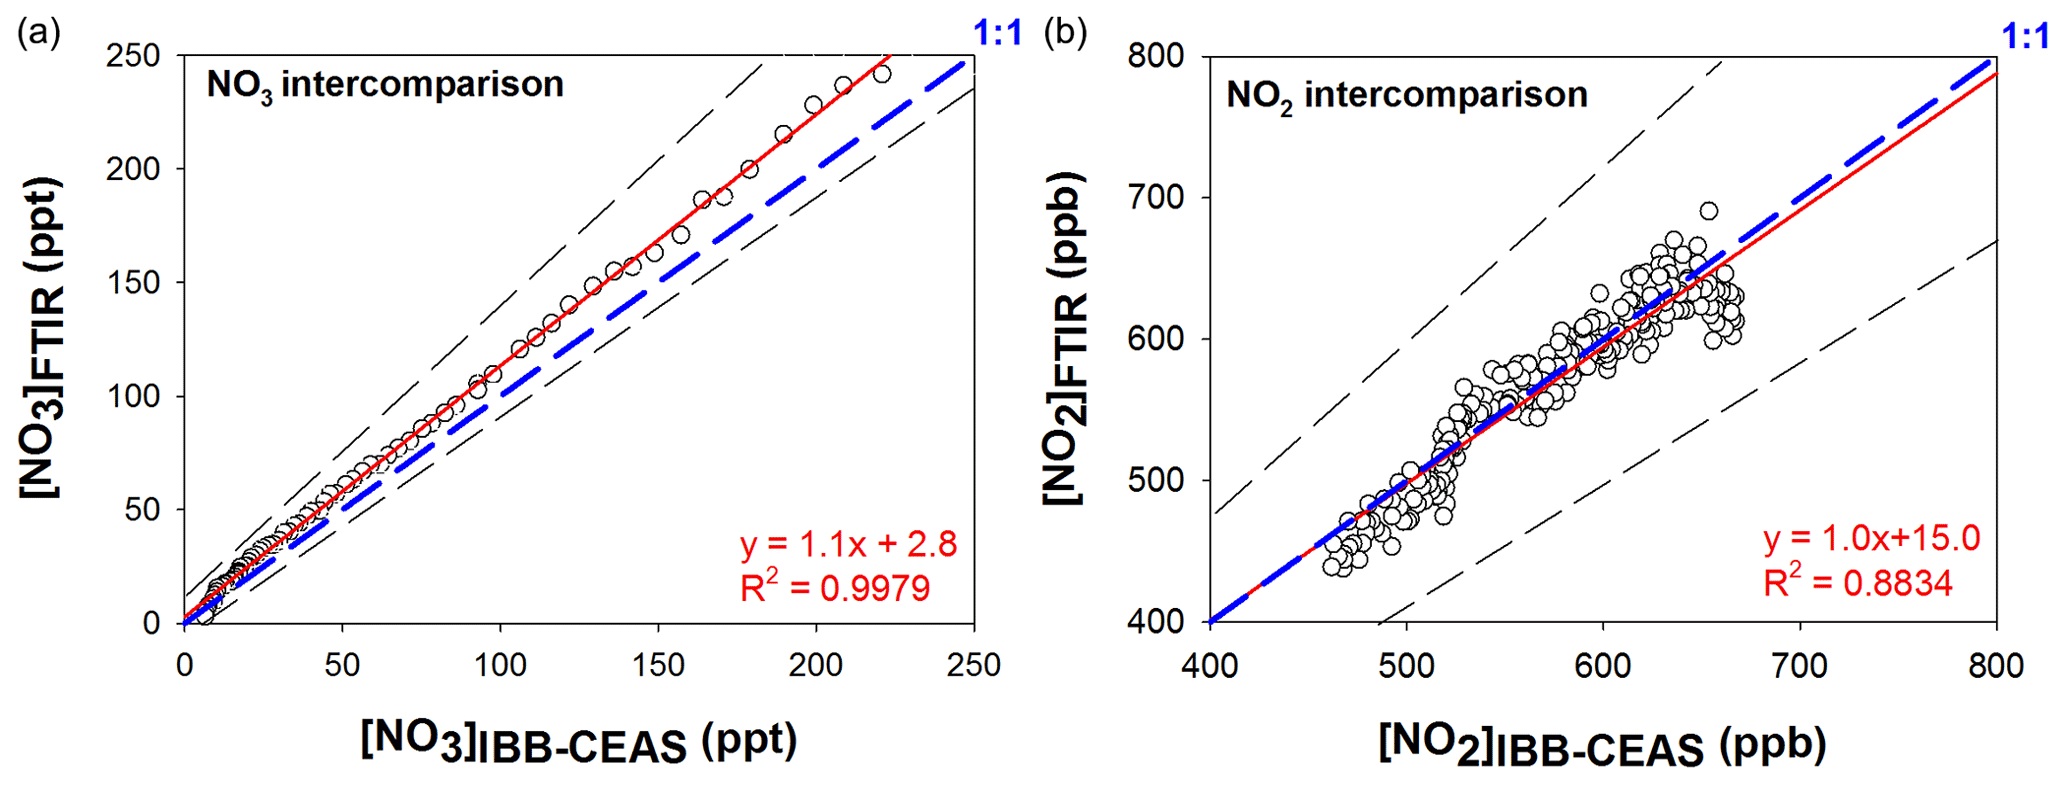
Figure 6Correlation between FTIR and IBBCEAS measurements for NO3 (a) and NO2 (b). Uncertainties are shown by dashed straight lines. Dashed blue lines show the 1 : 1 ratio.
In conclusion, the IBBCEAS exhibits very good agreement with the FTIR, for both NO3 and NO2 monitoring, with good sensitivity. This agreement is very satisfactory considering the fact that the IBBCEAS samples across the reactor width, while the FTIR provides an integrated measurement on the whole reactor length. Finally, the intercomparison experiment shows that an eventual loss due to photolysis of NO3 by the beam is not significant because it would have led to lower concentrations measured by the IBBCEAS than by the FTIR. In addition, for wavelengths longer than 640 nm, which is the case here, Johnston et al. (1996) have shown that the photolysis quantum yield is close to 0. It is thus expected that the photolysis of NO3 does not occur in the wavelength range used. Furthermore, even though NO3 was slightly subject to photolysis locally, the volume enlightened by the probe beam is very small in comparison to the overall volume of the chamber (< 0.04 %), and the homogenization system allowed a mixing with the rest of the volume.
The last step of the validation consisted in a kinetic experiment in order to assess the potential of the technique for kinetic studies: the IBBCEAS has been used to measure the rate constant of a well-known reaction: trans-2-butene + NO3. This reaction has been chosen as it has been intensively studied in the literature. Six absolute rate determinations (Benter et al., 1992; Berndt et al., 1998; Dlugokencky and Howard, 1989; Kasyutich et al., 2002; Ravishankara and Mauldin, 1985; Rudich et al., 1996) and two relative ones (Atkinson et al., 1984; Japar and Niki, 1975) have been published, leading to a recommendation by IUPAC (Atkinson et al., 2006). This reaction is also particularly interesting because it does not produce secondary organic aerosol (SOA). This will allow us to test the performances of the instrument for monitoring NO3 concentrations with a high time resolution and to validate our kinetic determination by comparison with previous ones.
The rate constant was determined using the absolute rate technique and by measuring the consumption of trans-2-butene due to its reaction with NO3. Because no other oxidant was present in the mixture, it was therefore assumed that trans-2-butene is consumed only by reaction with nitrate radical:
For this reaction, the kinetic equation can be established as
By making the hypothesis of small variations of time and [trans-2-butene], this relationship can be approximated to
where Δ[trans-2-butene] corresponds to the consumption of trans-2-butene during the time interval Δt, and [trans-2-butene] and [NO3] are averaged concentrations measured during this period. By plotting −Δ[trans-2-butene] vs. the product [trans-2-butene][NO3]Δt, a straight line with the slope corresponding to ktrans-2-butene is obtained. It is important to note that because this absolute kinetic method consists of measuring the decay of trans-2-butene for a known concentration of NO3, and not the decay of NO3 radicals for a known concentration of the VOC, it is not affected by NO3 additional loss processes (e.g., wall losses, reactions with NO2 or with peroxy radicals). Only additional losses of the VOC would lead to an overestimation of the rate constant. So, it was checked prior to the experiments (i.e., before the injection of N2O5) that no significant loss of the VOC was observed in the timescale of the experiment (see below).
Six kinetic experiments have been conducted in the dark, at room temperature (292–294 K) and atmospheric pressure in synthetic air. The initial conditions of reactants (trans-2-butene, N2O5, NO2) are listed in Table 2. The reflectivity was measured prior to each experiment by introducing NO2 into the chamber. When present, NO2 initial concentrations were used also to slow down the reaction by shifting the N2O5 equilibrium. Trans-2-butene (Air Liquide, purity > 99 %) was then introduced, and it was checked that no significant loss was observed in the timescale of the experiment. Nitrate radicals were generated into the simulation chamber from the thermal decomposition of dinitrogen pentoxide. N2O5 was injected stepwise in order to assure a consumption of trans-2-butene on a proper timescale to satisfactorily monitor the reactants. Time-resolved concentrations of trans-2-butene, NO2 and N2O5 were monitored from their infrared absorption spectra every 2 min. The integrated band intensity used to quantify the VOC is IBItrans-2-butene (870–1100 cm−1) = (2.8 ± 0.3) × 10−18 cm molecule−1 (base e, measured by previous internal work). NO3 was monitored with the IBBCEAS technique with an acquisition time of 30 s.
Table 2Injected mixing ratios for the kinetic study of the reaction trans-2-butene + NO3.
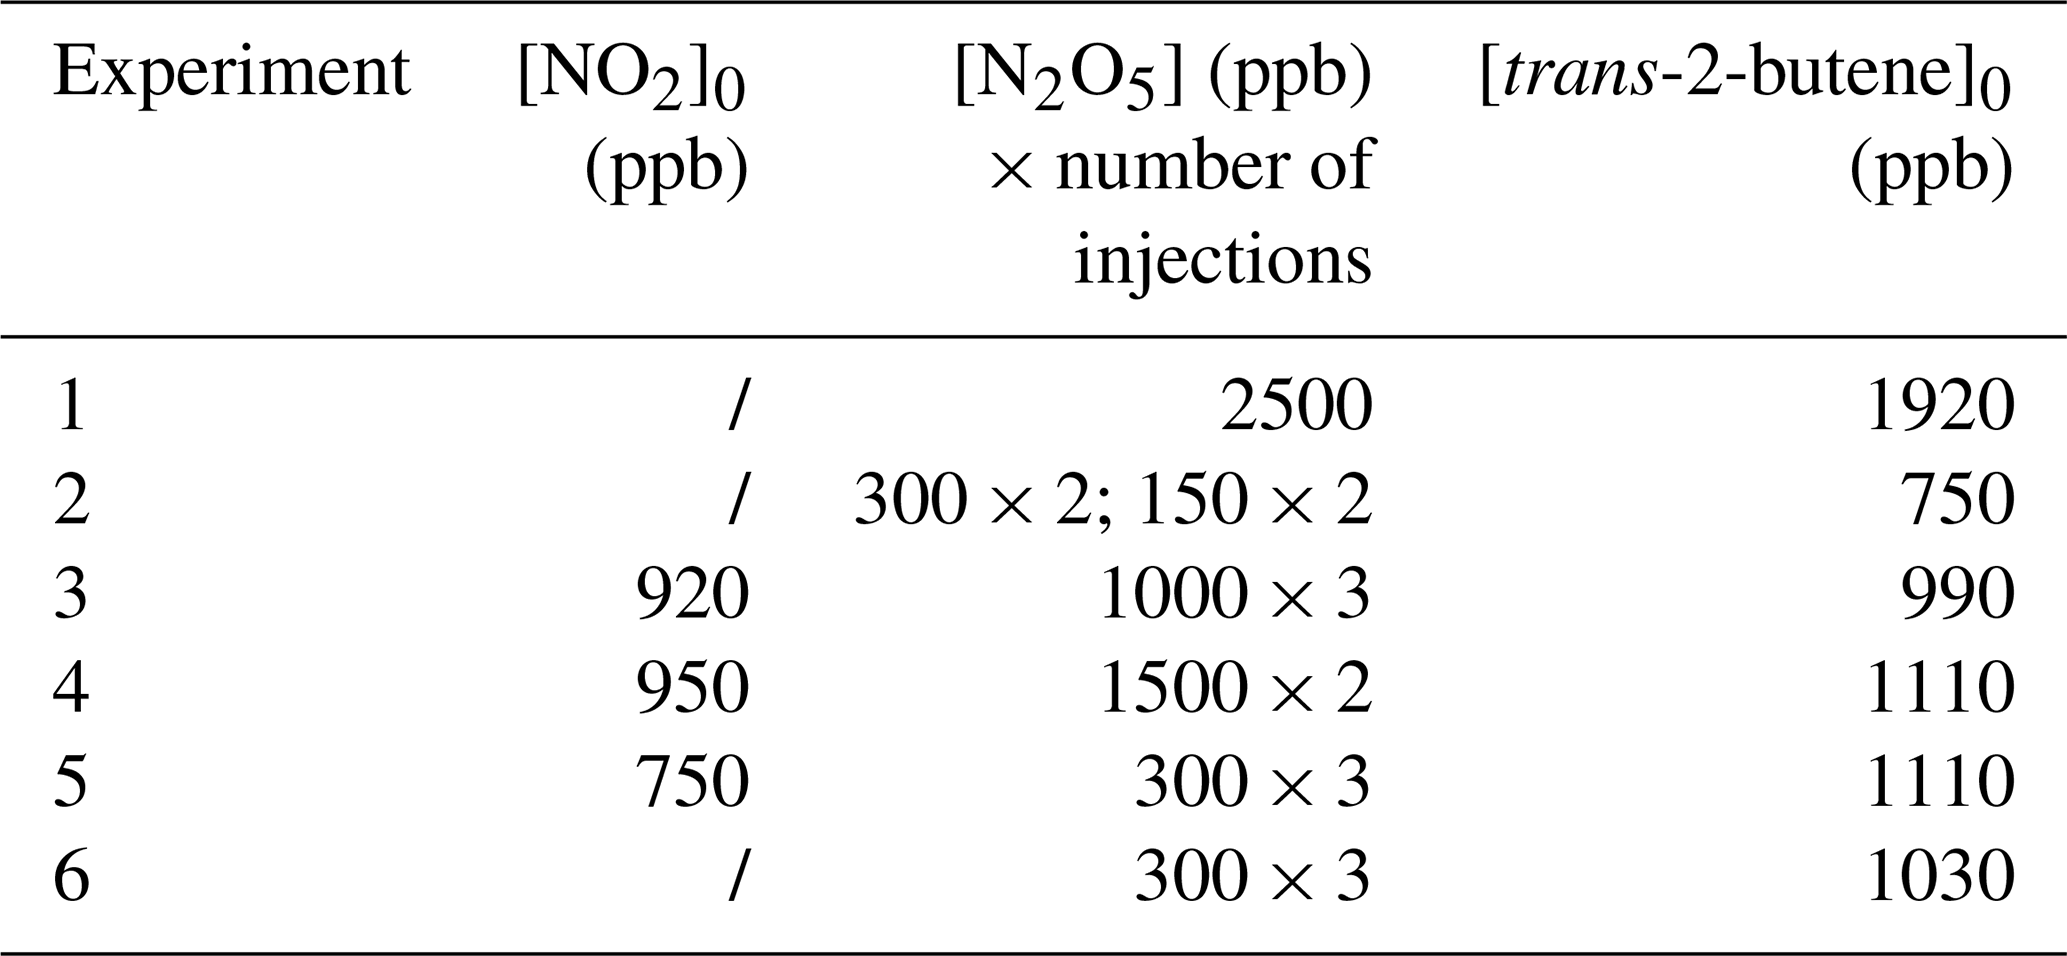
Figure 7 shows time profiles of reactants during a typical experiment. At the moment when N2O5 is injected, a rapid decrease of trans-2-butene and NO3 concentrations is observed, together with large production of NO2 due to N2O5 decomposition.
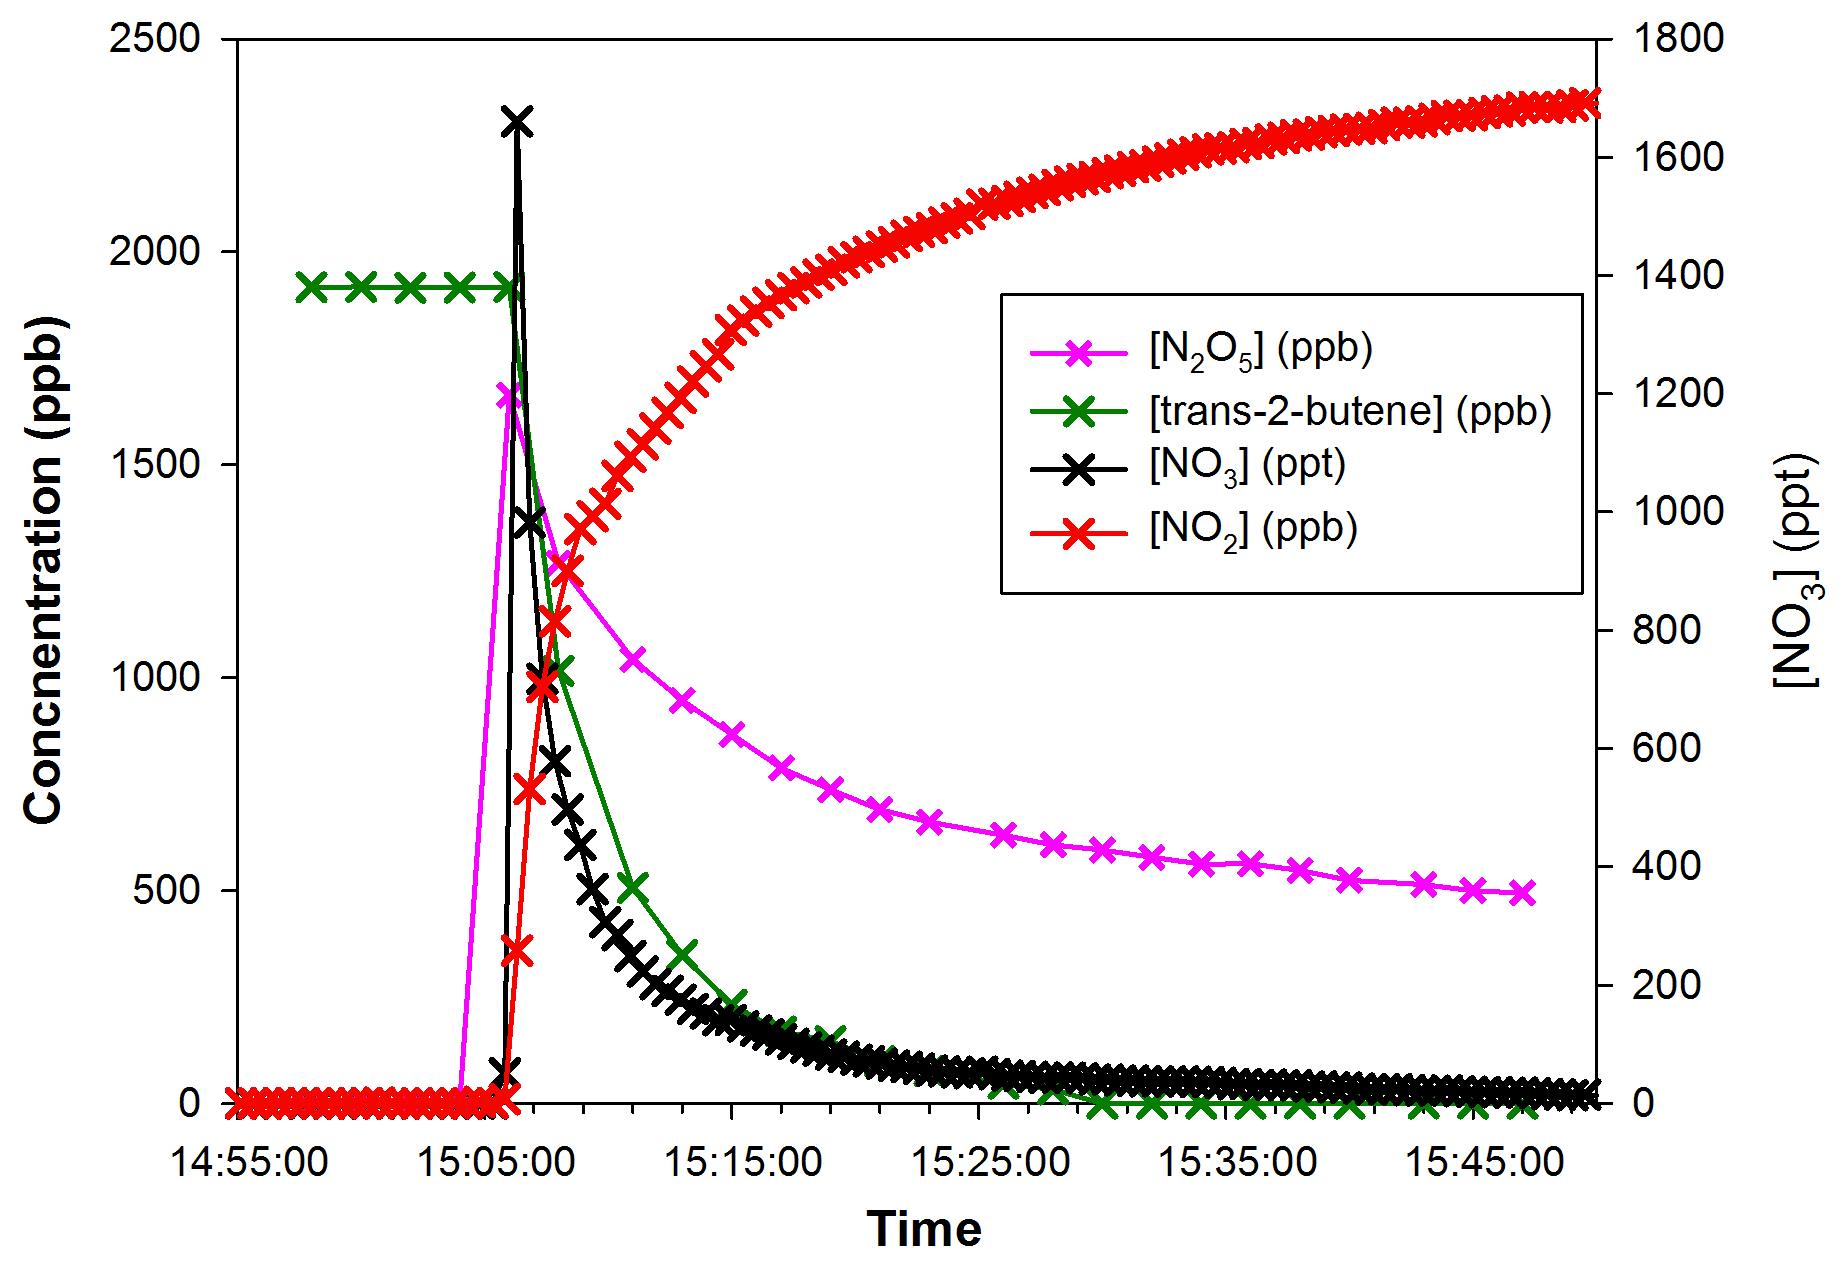
Figure 7Concentrations of trans-2-butene and NO2 measured by FTIR (left axis) and NO3 measured by IBBCEAS vs. time (right axis) during Experiment 1.
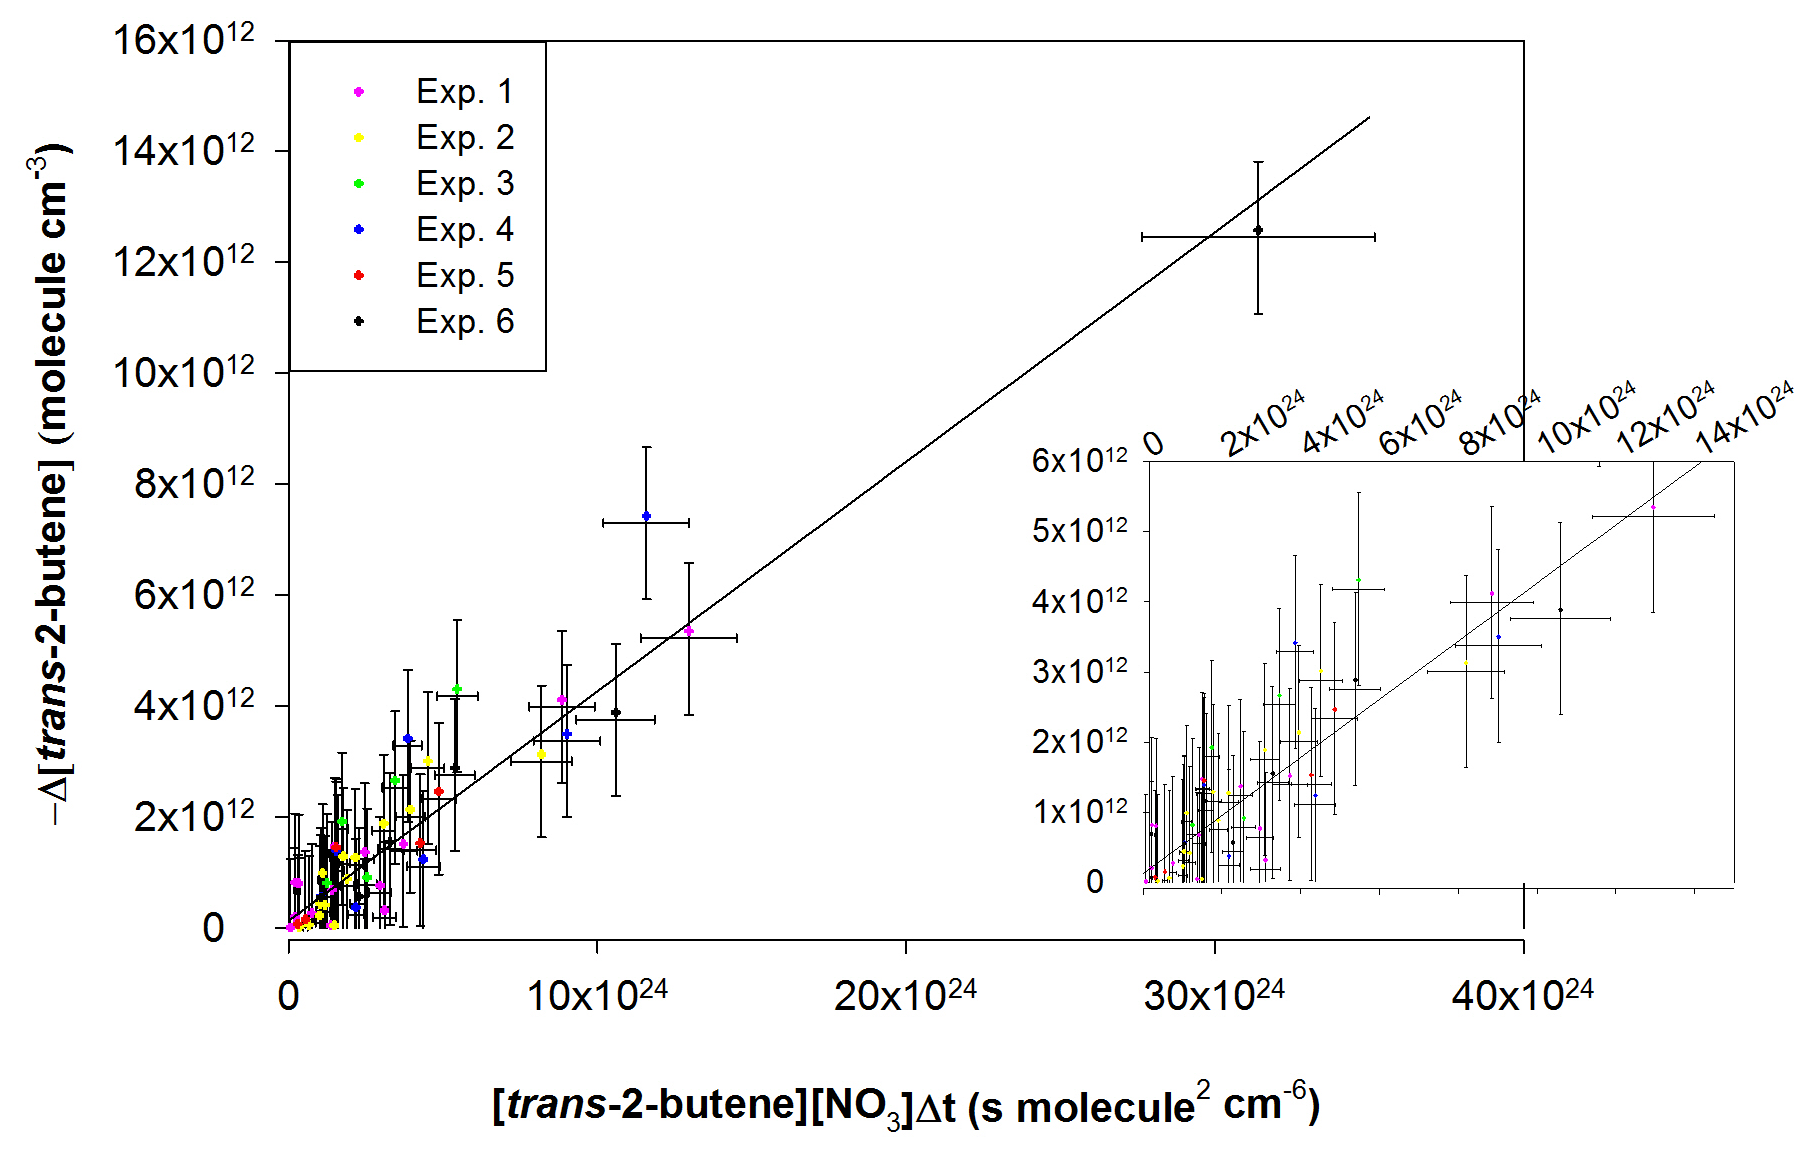
Figure 8Absolute kinetic plot for the reaction of trans-2-butene with NO3 radicals, showing the loss of trans-2-butene vs. [VOC] × [NO3] × Δt. The inset on the right shows a close-up of the points close to the origin.
Table 3Comparison of the rate constant obtained for the reaction of trans-2-butene with NO3 with previous determinations.
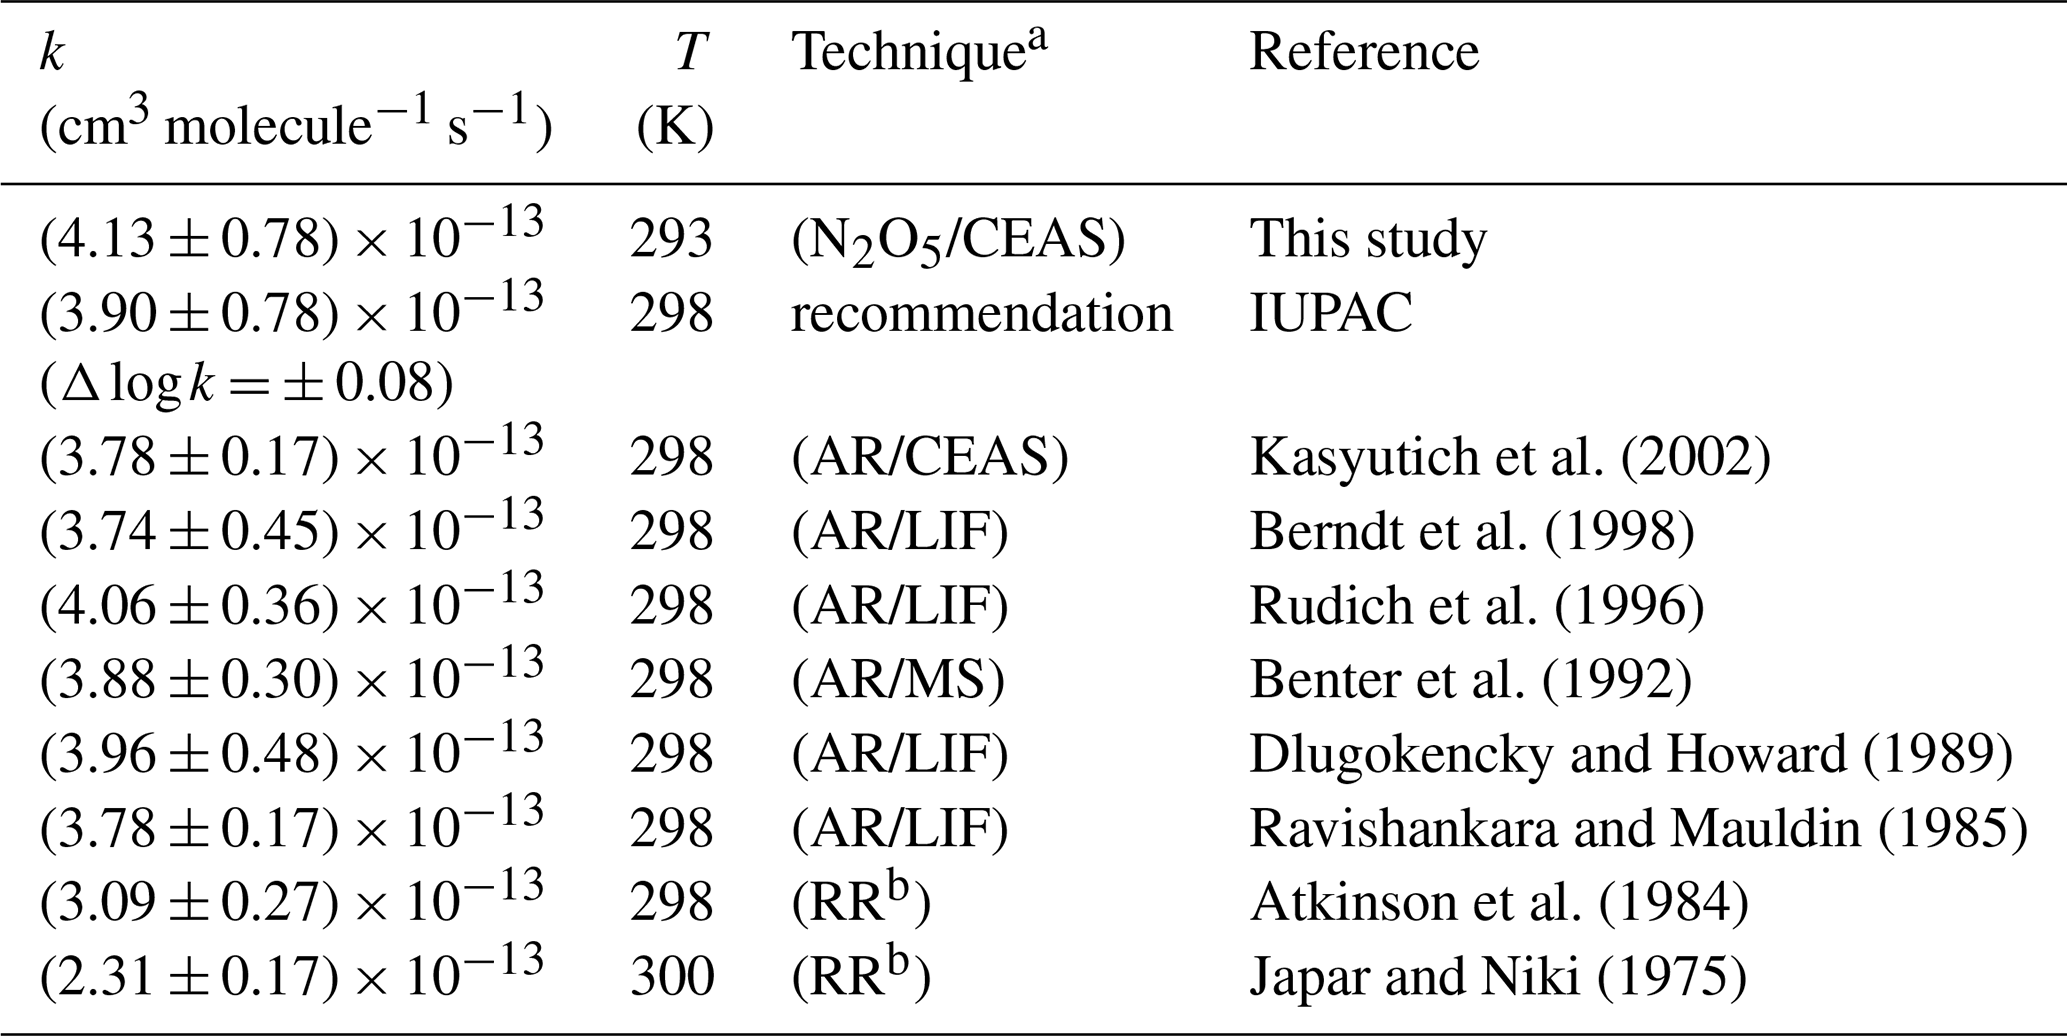
a Indicates kinetic method (AR = absolute rate, RR = relative rate) and NO3 measurement technique used: CEAS, LIF (laser-induced fluorescence) or MS (mass spectrometry). b Relative rate determinations are relative to the equilibrium constant K ().
The kinetic plot (−Δ[trans-2-butene] vs. the product [trans-2-butene] × [NO3] × Δt) gathering data from all experiments is presented in Fig. 8. The uncertainty on each experimental point was calculated as the sum of the relative uncertainties on [trans-2-butene] and [NO3] for the abscissa scale (the uncertainty on the time was considered to be negligible) and as twice the uncertainty on the [trans-2-butene] for the ordinate scale. From this figure, it can be observed that all experiments are in good agreement. In consequence, a linear regression was performed on all data points, leading to a rate constant of (4.13 ± 0.78) × 10−13 cm3 molecule−1 s−1. The uncertainty on the rate constant was estimated as the sum of the relative uncertainties on NO3 concentrations and twice the standard deviation on the linear regression. The obtained rate constant has been compared to the values from previous determinations and to the value recommended by IUPAC in Table 3.
This new determination appears to be in very good agreement with the IUPAC recommendation and with previous absolute determinations, within the uncertainty. However this work does not agree with the two relative determinations which are up to 45 % lower than our determination. Nevertheless, these two values are in disagreement with all of the previous absolute determinations. These relative rate determinations are relative to the equilibrium constant K (). A possible explanation for this disagreement would be that NO3 concentration is overestimated because it was considered that the equilibrium is reached. However, the reaction with trans-2-butene is fast enough to significantly disturb the equilibrium and prevent it from being established. An overestimation of NO3 concentrations would hence lead to an underestimation of the rate constant.
In conclusion, this agreement shows that the determination made with the IBBCEAS technique presented in this paper is correct, allowing reliable measurement of NO3 at low concentration with good sensitivity and time resolution. This technique is now operational for application to other absolute kinetic studies.
An IBBCEAS technique has been developed and coupled to the CSA simulation chamber for the in situ measurement of NO3 radicals at the parts per trillion level. This instrument also allows the monitoring of NO2 in the parts per billion range. Thanks to various tests, the instrument has been carefully characterized in order to identify potential bias and to define the optimal operation conditions. The performance of the instrument in terms of detection limit and uncertainties was also determined. The instrument exhibits very good detection limit for NO3 radicals (6 ppt) for 10 s of integration time. This detection limit fully complies with our needs for kinetic applications.
The instrument was also validated thanks to an intercomparison experiment with the in situ FTIR technique. With this technique, NO3 concentration was indirectly obtained by monitoring NO2 and N2O5 concentrations and by using the well-known equilibrium constant K (). The concentrations measured by the two techniques were shown to be in very good agreement (better than 10 %) for both NO3 and NO2, over a wide range of concentrations: from parts per trillion to parts per billion for NO3 radicals and from parts per billion to hundreds of parts per billion for NO2.
Finally, this technique was used for the absolute rate determination of a well-documented reaction, trans-2-butene + NO3. The value of (4.13 ± 0.45) × 10−13 cm3 molecule−1 s−1 found in this study is in very good agreement with the previous absolute determinations. Moreover, the good sensitivity and the good time resolution represent excellent performances, allowing the use of this technique for monitoring NO3 radicals when involved in fast reactions.
The IBBCEAS technique is now operational and will be used in further works, particularly to monitor NO3 concentrations for the absolute rate determinations of fast reactions of volatile organic compounds with NO3 radicals.
The rate constant for the NO3 oxidation of trans-2-butene is available in Table 3. It is also available through the Library of Advanced Data Products (LADP) of the EUROCHAMP Data Center (https://data.eurochamp.org/data-access/gas-phase-rate-constants/, Fouqueau et al., 2020a). Simulation chamber experiments which were used to retrieve these parameters and for the intercomparison are available through the Database of Atmospheric Simulation Chamber Studies (DASCS) of the EUROCHAMP Data Center (https://data.eurochamp.org/data-access/chamber-experiments/, Fouqueau et al., 2020b).
MCi, BPV and AF designed the IBBCEAS technique with the help of GM and DR. AF installed and did characterization experiments with the technical support of XL (optical development), MCa and EP (experiments) and PZ and GS (data treatment). MCi, BPV and AF wrote the article, and AF was responsible for the final version. All coauthors revised the content of the original manuscript and approved the final version of the paper.
The authors declare that they have no conflict of interest.
This article is part of the special issue “Simulation chambers as tools in atmospheric research (AMT/ACP/GMD inter-journal SI)”. It is not associated with a conference.
This research has been supported by the French national programme LEFE/INSU and by the European Commission's Seventh Framework Programme (EUROCHAMP-2; grant no. 228335) and H2020 Research Infrastructures (EUROCHAMP-2020; grant no. 730997).
This paper was edited by Hartmut Herrmann and reviewed by two anonymous referees.
Atkinson, R.: Atmospheric chemistry of VOCs and NOx, Atmos. Environ., 34, 2063–2101, 2000.
Atkinson, R., Plum, C. N., Carter, W. P. L., Winer, A. M., and Pitts, J. N.: Rate constants for the gas-phase reactions of nitrate radicals with a series of organics in air at 298 ± 1 K, J. Phys. Chem., 88, 1210–1215, https://doi.org/10.1021/j150650a039, 1984.
Atkinson, R., Baulch, D. L., Cox, R. A., Crowley, J. N., Hampson, R. F., Hynes, R. G., Jenkin, M. E., Rossi, M. J., and Troe, J.: Evaluated kinetic and photochemical data for atmospheric chemistry: Volume I – gas phase reactions of Ox, HOx, NOx and SOx species, Atmos. Chem. Phys., 4, 1461–1738, https://doi.org/10.5194/acp-4-1461-2004, 2004.
Atkinson, R., Baulch, D. L., Cox, R. A., Crowley, J. N., Hampson, R. F., Hynes, R. G., Jenkin, M. E., Rossi, M. J., Troe, J., and IUPAC Subcommittee: Evaluated kinetic and photochemical data for atmospheric chemistry: Volume II – gas phase reactions of organic species, Atmos. Chem. Phys., 6, 3625–4055, https://doi.org/10.5194/acp-6-3625-2006, 2006.
Ball, S. M., Langridge, J. M., and Jones, R. L.: Broadband Cavity Enhanced Absorption Spectroscopy using Light Emitting Diodes, Chem. Phys. Lett., 398, 68–74, https://doi.org/10.1016/j.cplett.2004.08.144, 2004.
Benter, Th., Becker, E., Wille, U., Rahman, M. M., and Schindler, R. N.: The Determination of Rate Constants for the Reactions of Some Alkenes with the NO3 Radical, Berich. Bunsen. Gesell., 96, 769–775, https://doi.org/10.1002/bbpc.19920960607, 1992.
Berndt, T., Kind, I., and Karbach, H.-J.: Kinetics of the Gas-Phase Reaction of NO3 Radicals with 1-Butene, trans-Butene, 2-Methyl-2-butene and 2,3-Dimethyl-2-butene Using LIF Detection, Berich. Bunsen. Gesell., 102, 1486–1491, https://doi.org/10.1002/bbpc.199800017, 1998.
Bitter, M., Ball, S. M., Povey, I. M., and Jones, R. L.: A broadband cavity ringdown spectrometer for in-situ measurements of atmospheric trace gases, Atmos. Chem. Phys., 5, 2547–2560, https://doi.org/10.5194/acp-5-2547-2005, 2005.
Brown, S. S. and Stutz, J.: Nighttime radical observations and chemistry, Chem. Soc. Rev., 41, 6405–6447, https://doi.org/10.1039/C2CS35181A, 2012.
Calvert, J. G., Orlando, J. J., Stockwell, W. R., and Wallington, T. J.: The Mechanisms of Reactions Influencing Atmospheric Ozone, Oxford University Press, New York, USA, 2015.
Dlugokencky, E. J. and Howard, C. J.: Studies of nitrate radical reactions with some atmospheric organic compounds at low pressures, J. Phys. Chem., 93, 1091–1096, 1989.
Dorn, H.-P., Apodaca, R. L., Ball, S. M., Brauers, T., Brown, S. S., Crowley, J. N., Dubé, W. P., Fuchs, H., Häseler, R., Heitmann, U., Jones, R. L., Kiendler-Scharr, A., Labazan, I., Langridge, J. M., Meinen, J., Mentel, T. F., Platt, U., Pöhler, D., Rohrer, F., Ruth, A. A., Schlosser, E., Schuster, G., Shillings, A. J. L., Simpson, W. R., Thieser, J., Tillmann, R., Varma, R., Venables, D. S., and Wahner, A.: Intercomparison of NO3 radical detection instruments in the atmosphere simulation chamber SAPHIR, Atmos. Meas. Tech., 6, 1111–1140, https://doi.org/10.5194/amt-6-1111-2013, 2013.
Doussin, J.-F., Durand-Jolibois, R., Ritz, D., Monod, A., and Carlier, P.: Design of an environmental chamber for the study of atmospheric chemistry: New developments in the analytical device, Analusis, 25, 236–242, 1997.
Engel, R., Berden, G., Peeters, R., and Meijer, G.: Cavity enhanced absorption and cavity enhanced magnetic rotation spectroscopy, Rev. Sci. Instrum., 69, 3763, https://doi.org/10.1063/1.1149176, 1998.
Fouqueau, A., Cirtog, A., Cazaunau, M., Pangui, E., Zapf, P., Siour, G., Landsheere, X., Méjean, G., Romanini, D., and Picquet-Varrault, B.: Library of Advanced Data Products: Gas Phase Rate constants, available at: https://data.eurochamp.org/data-access/gas-phase-rate-constants/, last access: 25 March 2020a.
Fouqueau, A., Cirtog, A., Cazaunau, M., Pangui, E., Zapf, P., Siour, G., Landsheere, X., Méjean, G., Romanini, D., and Picquet-Varrault, B.: Database of Atmospheric Simulation Chamber Studies, available at: https://data.eurochamp.org/data-access/chamber-experiments/, last access: 25 March 2020b.
Fuchs, H., Ball, S. M., Bohn, B., Brauers, T., Cohen, R. C., Dorn, H.-P., Dubé, W. P., Fry, J. L., Häseler, R., Heitmann, U., Jones, R. L., Kleffmann, J., Mentel, T. F., Müsgen, P., Rohrer, F., Rollins, A. W., Ruth, A. A., Kiendler-Scharr, A., Schlosser, E., Shillings, A. J. L., Tillmann, R., Varma, R. M., Venables, D. S., Villena Tapia, G., Wahner, A., Wegener, R., Wooldridge, P. J., and Brown, S. S.: Intercomparison of measurements of NO2 concentrations in the atmosphere simulation chamber SAPHIR during the NO3Comp campaign, Atmos. Meas. Tech., 3, 21–37, https://doi.org/10.5194/amt-3-21-2010, 2010.
Ihaka, R. and Gentleman, R.: R: A language for data analysis and graphics, J. Comput. Graph. Stat., 5, 299–314, 1996.
Japar, S. M. and Niki, H.: Gas-phase reactions of the nitrate radical with olefins, J. Phys. Chem., 79, 1629–1632, 1975.
Johnston, H. S., Davis, H. F., and Lee, Y. T.: NO3 Photolysis Product Channels: Quantum Yields from Observed Energy Thresholds, J. Phys. Chem., 100, 4713–4723, https://doi.org/10.1021/jp952692x, 1996.
Kasyutich, V. L., Canosa-Mas, C. E., Pfrang, C., Vaughan, S., and Wayne, R. P.: Off-axis continuous-wave cavity-enhanced absorption spectroscopy of narrow-band and broadband absorbers using red diode lasers, Appl. Phys. B, 75, 755–761, https://doi.org/10.1007/s00340-002-1032-3, 2002.
Kennedy, O. J., Ouyang, B., Langridge, J. M., Daniels, M. J. S., Bauguitte, S., Freshwater, R., McLeod, M. W., Ironmonger, C., Sendall, J., Norris, O., Nightingale, R., Ball, S. M., and Jones, R. L.: An aircraft based three channel broadband cavity enhanced absorption spectrometer for simultaneous measurements of NO3, N2O5 and NO2, Atmos. Meas. Tech., 4, 1759–1776, https://doi.org/10.5194/amt-4-1759-2011, 2011.
Kerdouci, J., Picquet-Varrault, B., Durand-Jolibois, R., Gaimoz, C., and Doussin, J.-F.: An experimental study of the gas-phase reactions of NO3 radicals with a series of unsaturated aldehydes: trans-2-hexenal, trans-2-heptenal and trans-2-octenal, J. Phys. Chem. A, 116, 10135–1014, 2012.
Langridge, J. M., Ball, S. M., Shillings, A. J. L., and Jones, R. L.: A broadband absorption spectrometer using light emitting diodes for ultrasensitive, in situ trace gas detection, Rev. Sci. Instrum., 79, 123110, https://doi.org/10.1063/1.3046282, 2008.
Matsumoto, J., Kosugi, N., Imai, H., and Kajii, Y.: Development of a measurement system for nitrate radical and dinitrogen pentoxide using a thermal conversion/laser-induced fluorescence technique, Rev. Sci. Instrum., 76, 064101, https://doi.org/10.1063/1.1927098, 2005a.
Matsumoto, J., Imai, H., Kosugi, N., and Kajii, Y.: In situ measurement of N2O5 in the urban atmosphere by thermal decomposition/laser-induced fluorescence technique, Atmos. Environ., 39, 6802–6811, https://doi.org/10.1016/j.atmosenv.2005.07.055, 2005b.
Matsumoto, J., Imai, H., Kosugi, N., and Kajii, Y.: Methods for preparing standard nitrate radical (NO3) gas to calibrate the LIF-based instrument for measurements in the atmosphere, Chem. Lett., 34, 1214–1215, https://doi.org/10.1246/cl.2005.1214, 2005c.
Naudet, J. P., Huguenin, D., Rigaud, P., and Cariolle, D.: Stratospheric observations of NO3 and its experimental and theoretical distribution between 20 and 40 km, Planet. Space Sci., 29, 707–712, https://doi.org/10.1016/0032-0633(81)90118-5, 1981.
Ng, N. L., Brown, S. S., Archibald, A. T., Atlas, E., Cohen, R. C., Crowley, J. N., Day, D. A., Donahue, N. M., Fry, J. L., Fuchs, H., Griffin, R. J., Guzman, M. I., Herrmann, H., Hodzic, A., Iinuma, Y., Jimenez, J. L., Kiendler-Scharr, A., Lee, B. H., Luecken, D. J., Mao, J., McLaren, R., Mutzel, A., Osthoff, H. D., Ouyang, B., Picquet-Varrault, B., Platt, U., Pye, H. O. T., Rudich, Y., Schwantes, R. H., Shiraiwa, M., Stutz, J., Thornton, J. A., Tilgner, A., Williams, B. J., and Zaveri, R. A.: Nitrate radicals and biogenic volatile organic compounds: oxidation, mechanisms, and organic aerosol, Atmos. Chem. Phys., 17, 2103–2162, https://doi.org/10.5194/acp-17-2103-2017, 2017.
Noxon, J. F., Norton, R. B., and Henderson, W. R.: Observation of atmospheric NO3, Geophys. Res. Lett., 5, 675–678, 1978.
Noxon, J. F., Norton, R. B., and Marovich, E.: NO3 in the troposphere, Geophys. Res. Lett., 7, 125–128, https://doi.org/10.1029/GL007i002p00125, 1980.
Orphal, J., Fellows, C. E., and Flaud, P.-M.: The visible absorption spectrum of NO3 measured by high-resolution Fourier transform spectroscopy, J. Geophys. Res., 108, 4077, https://doi.org/10.1029/2002JD002489, 2003.
Picquet-Varrault, B., Scarfogliero, M., Ait Helal, W., and Doussin, J.-F.: Reevaluation of the rate constant for the reaction propene + NO3 by absolute rate determination, Int. J. Chem. Kinet., 41, 73–81, 2009.
Platt, U., Perner, D., Harris, G. W., Winer, A. M., and Pitts, J. N.: Observations of nitrous acid in an urban atmosphere by differential optical absorption, Nature, 285, 312–314, https://doi.org/10.1038/285312a0, 1980.
Powell, M. J. D.: The BOBYQA algorithm for bound constrained optimization without derivatives, Technical Report, Department of Applied Mathematics and Theoretical Physics, University of Cambridge, Cambridge, UK, 2009.
Ravishankara, A. R. and Mauldin, R. L.: Absolute rate coefficient for the reaction of nitrogen trioxide (NO3) with trans-2-butene, J. Phys. Chem., 89, 3144–3147, 1985.
Romanini, D., Kachanov, A. A., Sadeghi, N., and Stoeckel, F.: CW cavity ring down spectroscopy, Chem. Phys. Lett., 264, 316–322, https://doi.org/10.1016/S0009-2614(96)01351-6, 1997.
Rudich, Y., Talukdar, R. K., Fox, R. W., and Ravishankara, A. R.: Rate Coefficients for Reactions of NO3 with a Few Olefins and Oxygenated Olefins, J. Phys. Chem., 100, 5374–5381, 1996.
Scarfogliero, M., Picquet-Varrault, B., Salce, J., Durand-Jolibois, R., and Doussin, J.-F.: Kinetic and Mechanistic Study of the Gas-Phase Reactions of a Series of Vinyl Ethers with the Nitrate Radical, J. Phys. Chem. A, 110, 11074–11081, 2006.
Schott, G. and Davidson, N.: Shock waves in chemical kinetics. The decomposition of N2O5 at high temperatures, J. Am. Chem. Soc., 80, 1841–1853, 1958.
Vandaele, A. C., Hermans, C., Simon, P. C., Carleer, M., Colin, R., Fally, S., Mérienne, M. F., Jenouvrier, A., and Coquart, B.: Measurements of the NO2 absorption cross-section from 42 000 cm−1 to 10 000−1 (238–1000 nm) at 220 K and 294 K, J. Quant. Spectrosc. Ra., 59, 171–184, 1997.
Varma, R. M., Ball, S. M., Brauers, T., Dorn, H.-P., Heitmann, U., Jones, R. L., Platt, U., Pöhler, D., Ruth, A. A., Shillings, A. J. L., Thieser, J., Wahner, A., and Venables, D. S.: Light extinction by secondary organic aerosol: an intercomparison of three broadband cavity spectrometers, Atmos. Meas. Tech., 6, 3115–3130, https://doi.org/10.5194/amt-6-3115-2013, 2013.
Venables, D. S., Gherman, T., Orphal, J., Wenger, J. C., and Ruth, A. A.: High sensitivity in situ monitoring of NO3 in an atmospheric simulation chamber using incoherent broadband cavity-enhanced absorption spectroscopy, Environ. Sci. Technol., 40, 6758–6763, 2006.
Ventrillard-Courtillot, I., Sciamma O'Brien, E., Kassi, S., Méjean, G., and Romanini, D.: Incoherent Broad Band Cavity Enhanced Absorption Spectroscopy for simultaneous trace measurements of NO2 and NO3 with a LED source, Appl. Phys. B, 101, 661–669, 2010.
Wayne, R. P., Barnes, I., Biggs, P., Burrows, J. P., Canosa-Mas, C. E., Hjorth, J., Le Bras, G., Moortgat, G. K., Perner, D., Poulet, G., Restelli, G., and Sidebottom, H.: The nitrate radical: Physics, chemistry, and the atmosphere, Atmos. Environ. A, 25, 1–203, 1991.
Wood, E. C., Wooldridge, P. J., Freese, J. H., Albrecht, T., and Cohen, R. C.: Prototype for In Situ Detection of Atmospheric NO3 and N2O5 via Laser-Induced Fluorescence, Environ. Sci. Technol., 37, 5732–5738, 2003.
Wu, T., Coeur-Tourneur, C., Dhont, G., Cassez, A., Fertein, E., He, X., and Chen, W.: Simultaneous monitoring of temporal profiles of NO3, NO2 and O3 by incoherent broadband cavity enhanced absorption spectroscopy for atmospheric applications, J. Quant. Spectrosc. Ra., 133, 199–205, https://doi.org/10.1016/j.jqsrt.2013.08.002, 2014.