the Creative Commons Attribution 4.0 License.
the Creative Commons Attribution 4.0 License.
 | 03 Dec 2020
Best practices for precipitation sample storage for offline studies of ice nucleation in marine and coastal environments
Charlotte M. Beall
Dolan Lucero
Thomas C. Hill
Paul J. DeMott
M. Dale Stokes
Ice-nucleating particles (INPs) are efficiently removed from clouds through precipitation, a convenience of nature for the study of these very rare particles that influence multiple climate-relevant cloud properties including ice crystal concentrations, size distributions and phase-partitioning processes. INPs suspended in precipitation can be used to estimate in-cloud INP concentrations and to infer their original composition. Offline droplet assays are commonly used to measure INP concentrations in precipitation samples. Heat and filtration treatments are also used to probe INP composition and size ranges. Many previous studies report storing samples prior to INP analyses, but little is known about the effects of storage on INP concentration or their sensitivity to treatments. Here, through a study of 15 precipitation samples collected at a coastal location in La Jolla, CA, USA, we found INP concentration changes up to > 1 order of magnitude caused by storage to concentrations of INPs with warm to moderate freezing temperatures (−7 to −19 ∘C). We compared four conditions: (1) storage at room temperature (+21–23 ∘C), (2) storage at +4 ∘C, (3) storage at −20 ∘C and (4) flash-freezing samples with liquid nitrogen prior to storage at −20 ∘C. Results demonstrate that storage can lead to both enhancements and losses of greater than 1 order of magnitude, with non-heat-labile INPs being generally less sensitive to storage regime, but significant losses of INPs smaller than 0.45 µm in all tested storage protocols. Correlations between total storage time (1–166 d) and changes in INP concentrations were weak across sampling protocols, with the exception of INPs with freezing temperatures ≥ −9 ∘C in samples stored at room temperature. We provide the following recommendations for preservation of precipitation samples from coastal or marine environments intended for INP analysis: that samples be stored at −20 ∘C to minimize storage artifacts, that changes due to storage are likely an additional uncertainty in INP concentrations, and that filtration treatments be applied only to fresh samples. At the freezing temperature −11 ∘C, average INP concentration losses of 51 %, 74 %, 16 % and 41 % were observed for untreated samples stored using the room temperature, +4, −20 ∘C, and flash-frozen protocols, respectively. Finally, the estimated uncertainties associated with the four storage protocols are provided for untreated, heat-treated and filtered samples for INPs between −9 and −17 ∘C.
- Article
(2841 KB) - Full-text XML
-
Supplement
(1524 KB) - BibTeX
- EndNote


In-cloud ice crystals and their formation processes are critical features of Earth's radiative and hydrological balance, affecting multiple climate-relevant cloud properties including cloud lifetime, reflectivity and precipitation efficiency (DeMott et al., 2010; Lohmann, 2002; Lohmann and Feichter, 2005; Tan et al., 2016; Creamean et al., 2013). Ice-nucleating particles (INPs) impact ice crystal concentrations and size distributions in clouds by triggering the freezing of droplets at temperatures above the homogeneous freezing point of water (−38 ∘C).
INPs have been sampled in clouds and precipitation for decades (e.g., Rogers et al., 1998; Vali, 1971, 1966) to measure abundances, probe their compositions and investigate the extent to which they impact the properties of clouds. There are several caveats to consider when inferring in-cloud INP concentrations or properties from precipitation samples (Petters and Wright, 2015), including sweep-out of additional INPs as the hydrometeor traverses the atmosphere below the cloud (Vali, 1974) and heterogeneous chemistry due to adsorption or absorption of gases (Hegg and Hobbs, 1982; Kulmala et al., 1997; Lim et al., 2010). However, assessing the composition of INPs in precipitation samples is more straightforward than cloud particles. Thus, the number of publications reporting measurements of INP concentrations in precipitation has increased over the past decade. Numerable insights have been obtained in previous precipitation-based INP studies, including the efficient depletion of INPs relative to other aerosols of similar size in precipitating clouds (Stopelli et al., 2015); constraints on minimum enhancement factors for secondary ice formation processes (Petters and Wright, 2015); and the identification, characteristics and distribution of various INP populations (e.g., Christner et al., 2008; Hader et al., 2014; Stopelli et al., 2017). INP concentrations in precipitation have been used to estimate in-cloud concentrations, based on assumptions that the majority of particles (86 %) in precipitation originate from the cloud rather than the atmospheric column through which the hydrometeor descended (Wright et al., 2014). Along the same line of reasoning, INPs in precipitation have also been used to infer sources and composition of in-cloud INP populations (e.g., Martin et al., 2019; Michaud et al., 2014, respectively).
A number of online (real-time) and offline (processed postcollection) techniques exist for measurement of INPs for each ice nucleation mechanism, including condensation, deposition, immersion and contact freezing. However, as some simulations have shown that immersion mode freezing is the dominant mode of primary freezing in the atmosphere between 1000 and 200 hPa (Hoose et al., 2010), most techniques target immersion freezing. Despite the lack of time resolution, offline techniques enable measurement of INPs at modest supercooling (e.g., up to −5 ∘C) and temperature regimes where concentrations typically fall below detection limits of online instruments (DeMott et al., 2017). Offline instruments capable of immersion mode INP measurement include a number of droplet assays, in which sample suspensions are distributed among an array of droplets that are then cooled and frozen (e.g., Budke and Koop, 2015; Harrison et al., 2018; Hill et al., 2014; Whale et al., 2015) as well as other systems in which water is condensed onto particles collected on substrates prior to cooling and freezing (e.g., Mason et al., 2015). As they are designed for analysis of liquid suspensions, droplet freezing assay techniques are commonly used for measurement of INPs suspended in precipitation (e.g., Creamean et al., 2019; Rangel-Alvarado et al., 2015; Michaud et al., 2014; Stopelli et al., 2014; Wright et al., 2014).
Many studies report results from samples stored prior to processing. Storage protocols vary widely, including total storage time; time between collection and storage; and temperature fluctuations between collection, shipment and storage (if these details are provided at all; see summary Table S1 in the Supplement). Storage temperatures range from −80 ∘C (Vali et al., 1971) to +4 ∘C (e.g., Petters and Wright, 2015; Failor et al., 2017; Joyce et al., 2019), yet generally samples are stored between +4 and −20 ∘C. Reported storage intervals range between hours (Schnell et al., 1977; Christner et al., 2008) to 48 years (Vasebi et al., 2019).
The understanding of storage effects on INPs suspended in precipitation is limited (Petters and Wright, 2015), and the understanding of storage effects on INPs collected on filters is similarly lacking (Wex et al., 2019). Stopelli et al. (2014) studied INP concentrations in a snow sample stored at +4 ∘C and observed a decrease in the concentration of INPs active at −10 ∘C over 30 d by a factor of ∼ 2. Schnell (1977) reported significant losses in fog and seawater samples after storage at room temperature for short periods (6–11 h). Several studies have reported on the lability of commercially available dust and biological IN entities in storage above 0 ∘C or under freezing conditions, including Arizona test dust and Snomax® (Perkins et al., 2020; Polen et al., 2016; Wex et al., 2015), and similar labilities could affect the INPs of similar composition in precipitation samples (Creamean et al., 2013; Martin et al., 2019). Considering the abundance of precipitation-based INP studies, the lack of bounds on potential impacts of storage on INP concentration measurements represents a critical uncertainty in conclusions derived from data on stored samples. Furthermore, to determine INP activation mechanisms and composition, previous studies have applied treatments to precipitation samples, including heat, filtration, enzymes and peroxide (e.g., Hill et al., 2016), but it is unknown to what extent storage affects the results of such experiments.
Here we investigate the effects of four storage protocols on INPs using 15 precipitation samples collected between 22 September 2016 and 22 November 2019 at two coastal sites at Scripps Institution of Oceanography, La Jolla, CA, USA: (1) storage at room temperature (+21–23 ∘C), (2) storage at +4 ∘C (“refrigerated”), (3) storage at −20 ∘C (“frozen”) and (4) flash-freezing samples with liquid nitrogen prior to storage at −20 ∘C (“flash frozen”). The abundance of previous studies that report storage between +4 and −20 ∘C motivated the choice of techniques 2 and 3 (see Table S1). Room temperature storage was chosen to provide context as a worst-case scenario, and the flash-freezing technique was chosen to investigate whether any changes of INP concentrations could be mitigated by instantaneous freezing prior to storage. The 15 precipitation samples in this study were divided into several replicates so that the concentration of INPs could be measured in untreated, heated and filtered samples when fresh and again after storage using the four techniques described above. Sample replicates were additionally processed at two different points in time to investigate the effects of total storage time on INP concentration measurements. Enhancements and losses of INPs according to storage protocol and treatment are reported, as well as recommendations for storage protocols that best preserve INPs in untreated, heated and filtered precipitation samples from marine or coastal environments.
2.1 Precipitation sample collection
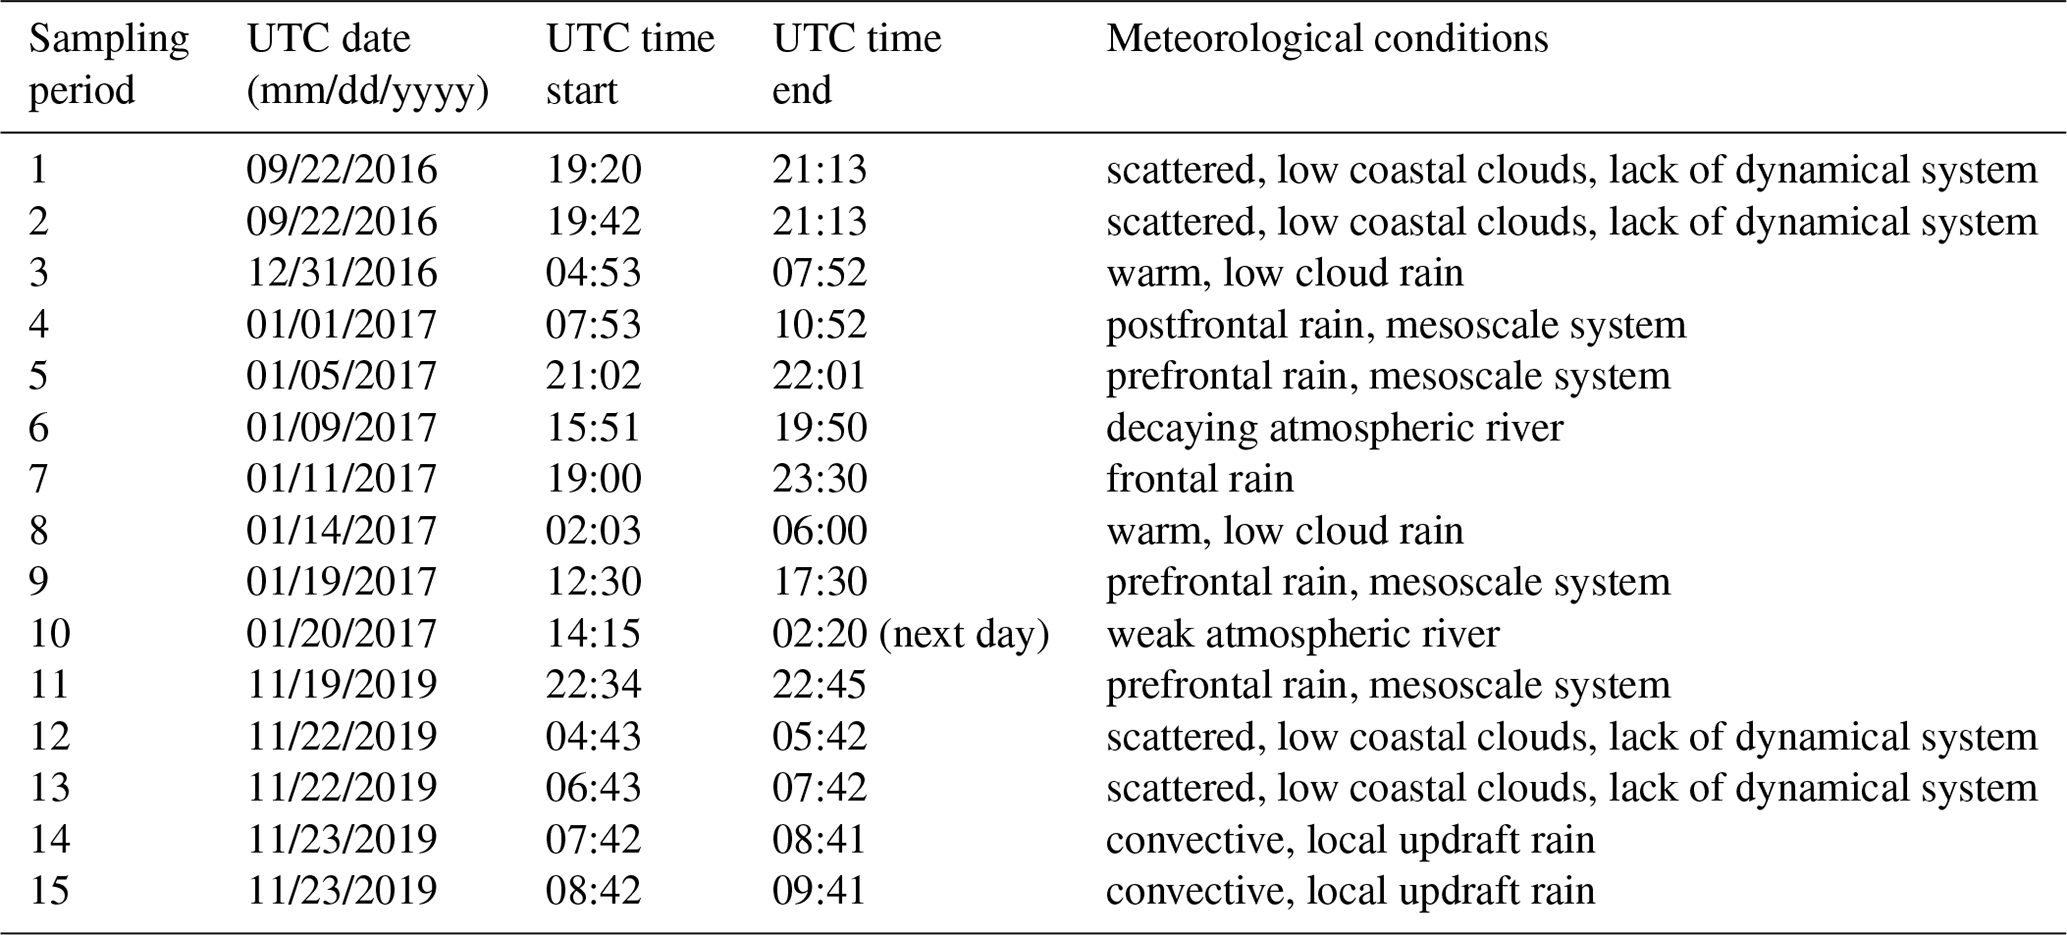
Precipitation samples were collected at two coastal locations at Scripps Institution of Oceanography (32.87∘ N 177.25∘ W): the rooftop of the Ellen Browning Scripps Memorial Pier laboratory (32.8662∘ N, 117.2544∘ W) (10 m above sea level) and the rooftop of a storage container next to Isaacs Hall (32.8698∘ N, 117.2522∘ W, 58 m above sea level, 500 m inland). Collection technique varied based on location. At the SIO pier, the Teledyne ISCO model 6712 commercial water sampler (Teledyne ISCO, Inc., US) was used. A plastic funnel, 27 cm in diameter, and Tygon tubing, connected the sampler inlet to the water sampler's distributor arm. The samples were distributed via the distributor arm into one of twenty-four 1 L polypropylene bottles on an hourly time interval. Bottles corresponding to consecutive 1 h time intervals were combined when the hourly precipitation volume was insufficient for sample separation and analysis (< 50 mL per bottle). At the Isaacs Hall location, an ISO 6706 plastic graduated cylinder and plastic funnel, 27 cm in diameter, were used for precipitation collection. At both sites, ring stands supported the collection funnels approximately 60 cm above the rooftop. All funnels, tubing, cylinders and bottles were cleaned with 10 % hydrogen peroxide for 10 min and rinsed with Milli-Q purified water three times immediately before each sampling event. Satellite composites from the National Weather Service Weather Prediction Center's North American Surface Analysis Products were used for synoptic weather analysis to generally characterize each rain event (see Table 1). Atmospheric river (AR) events were identified using the global AR dataset that was developed by Guan and Waliser (2015) and further refined in Guan et al. (2018).
2.2 Storage protocols
The following sample storage protocols were used: frozen at −20 ∘C, refrigerated at 4 ∘C, room temperature (21–23 ∘C), and flash freezing, or flashing with liquid nitrogen (−196 ∘C) before frozen at −20 ∘C. All techniques except storage at room temperature are commonly used for offline INP analysis (see Table S1). Excluding the samples that were flash frozen, all samples were stored in 50 mL sterile plastic Falcon® tubes (Corning Life Sciences, Corning, NY, USA). Flash-frozen samples were stored in polypropylene 5 mL cryovials. Prior to storage, 25–50 mL bulk sample aliquots were distributed from collection bottles into Falcon® tubes, shaking bottles ∼ 10 s between each distribution. Not all samples were stored using all four of the storage protocols due to limited volume for some samples. See Tables 2–4 for a summary of the number of samples studied for each storage protocol. Precipitation samples were stored for varying intervals between 1 and 166 d to investigate effects of storage time on INP concentrations. INP measurements were made in two or three time steps: within 2 h of collection, and once or twice after storing using one of four storage protocols described above, depending on volume. Stored and fresh samples were analyzed in three treatment conditions: (1) raw untreated precipitation, (2) heated over a 95 ∘C water bath for 20 min and (3) filtered through a 0.45 µm surfactant-free cellulose acetate syringe filter (Thermo Scientific™ Nalgene™, Waltham, MA, USA). Heat treatments and filters were applied to samples just prior to processing (i.e., treatments were not applied to samples prior to storage).
Table 2Summary of unique and replicate untreated precipitation samples used for INP concentration measurements featured in Fig. 2.
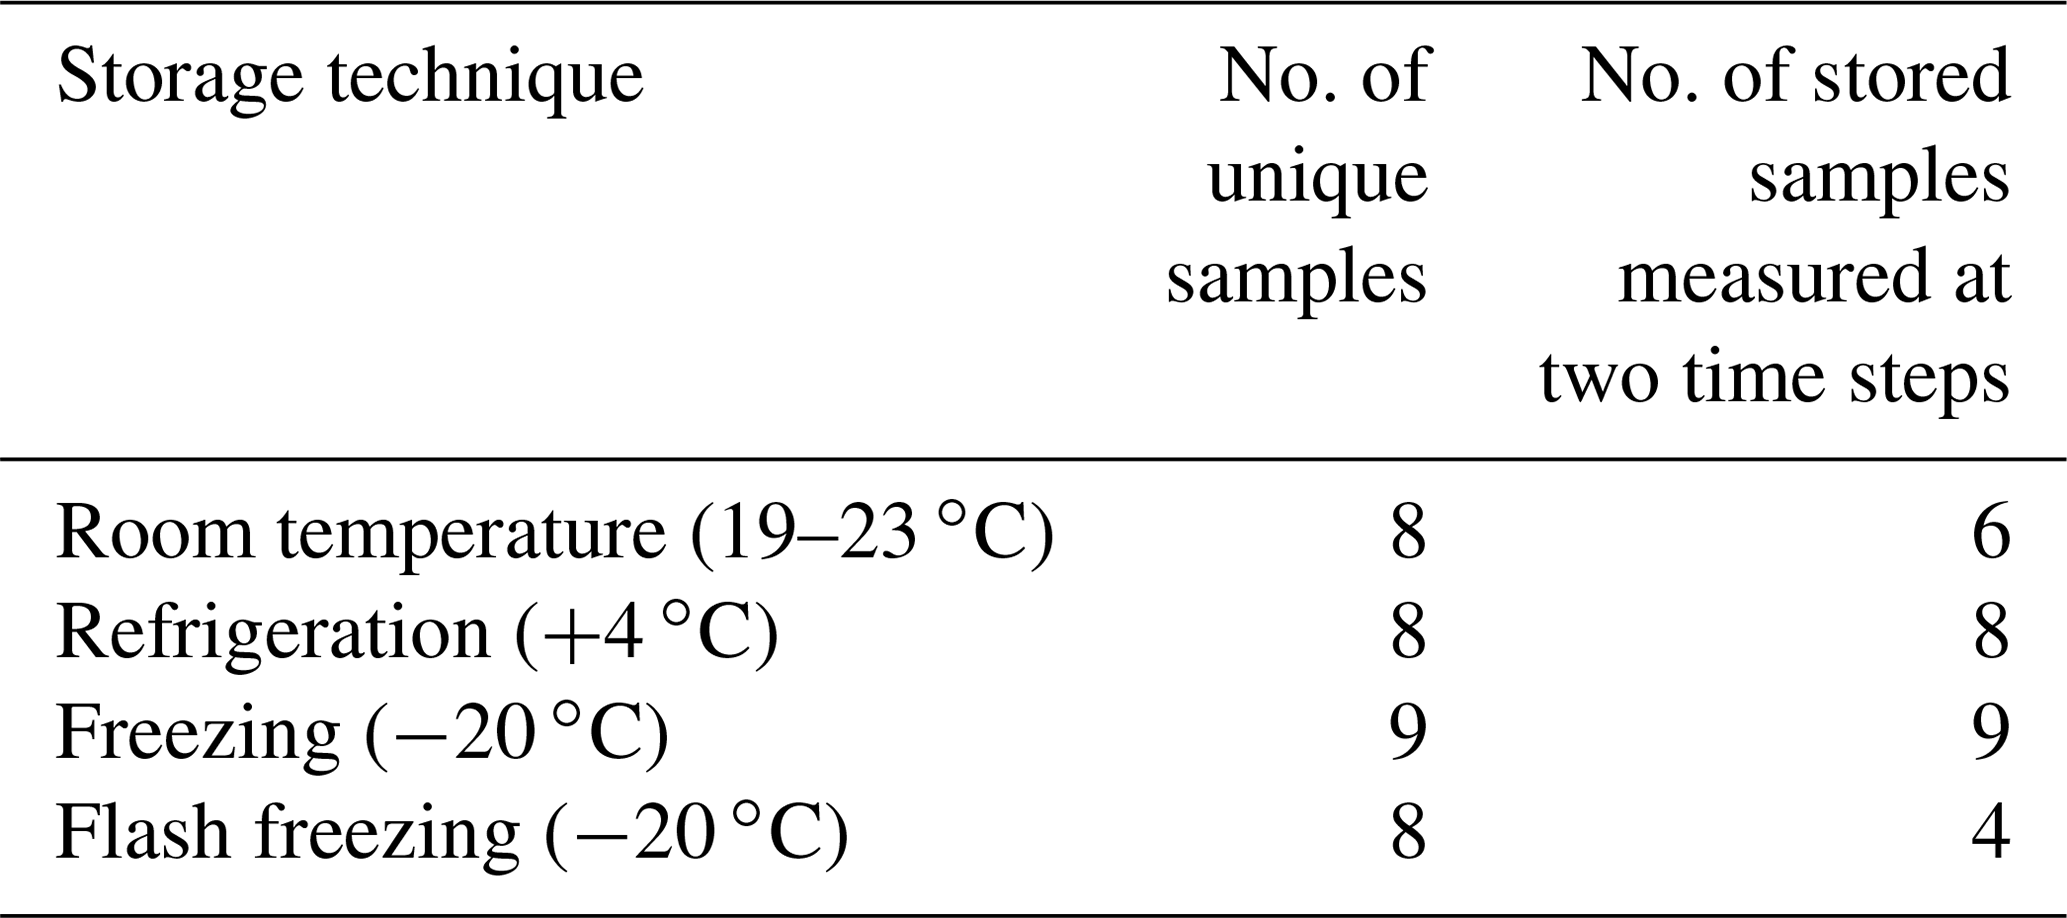
Table 3Summary of unique and replicate heat-treated precipitation samples used for INP concentration measurements featured in Fig. 3.
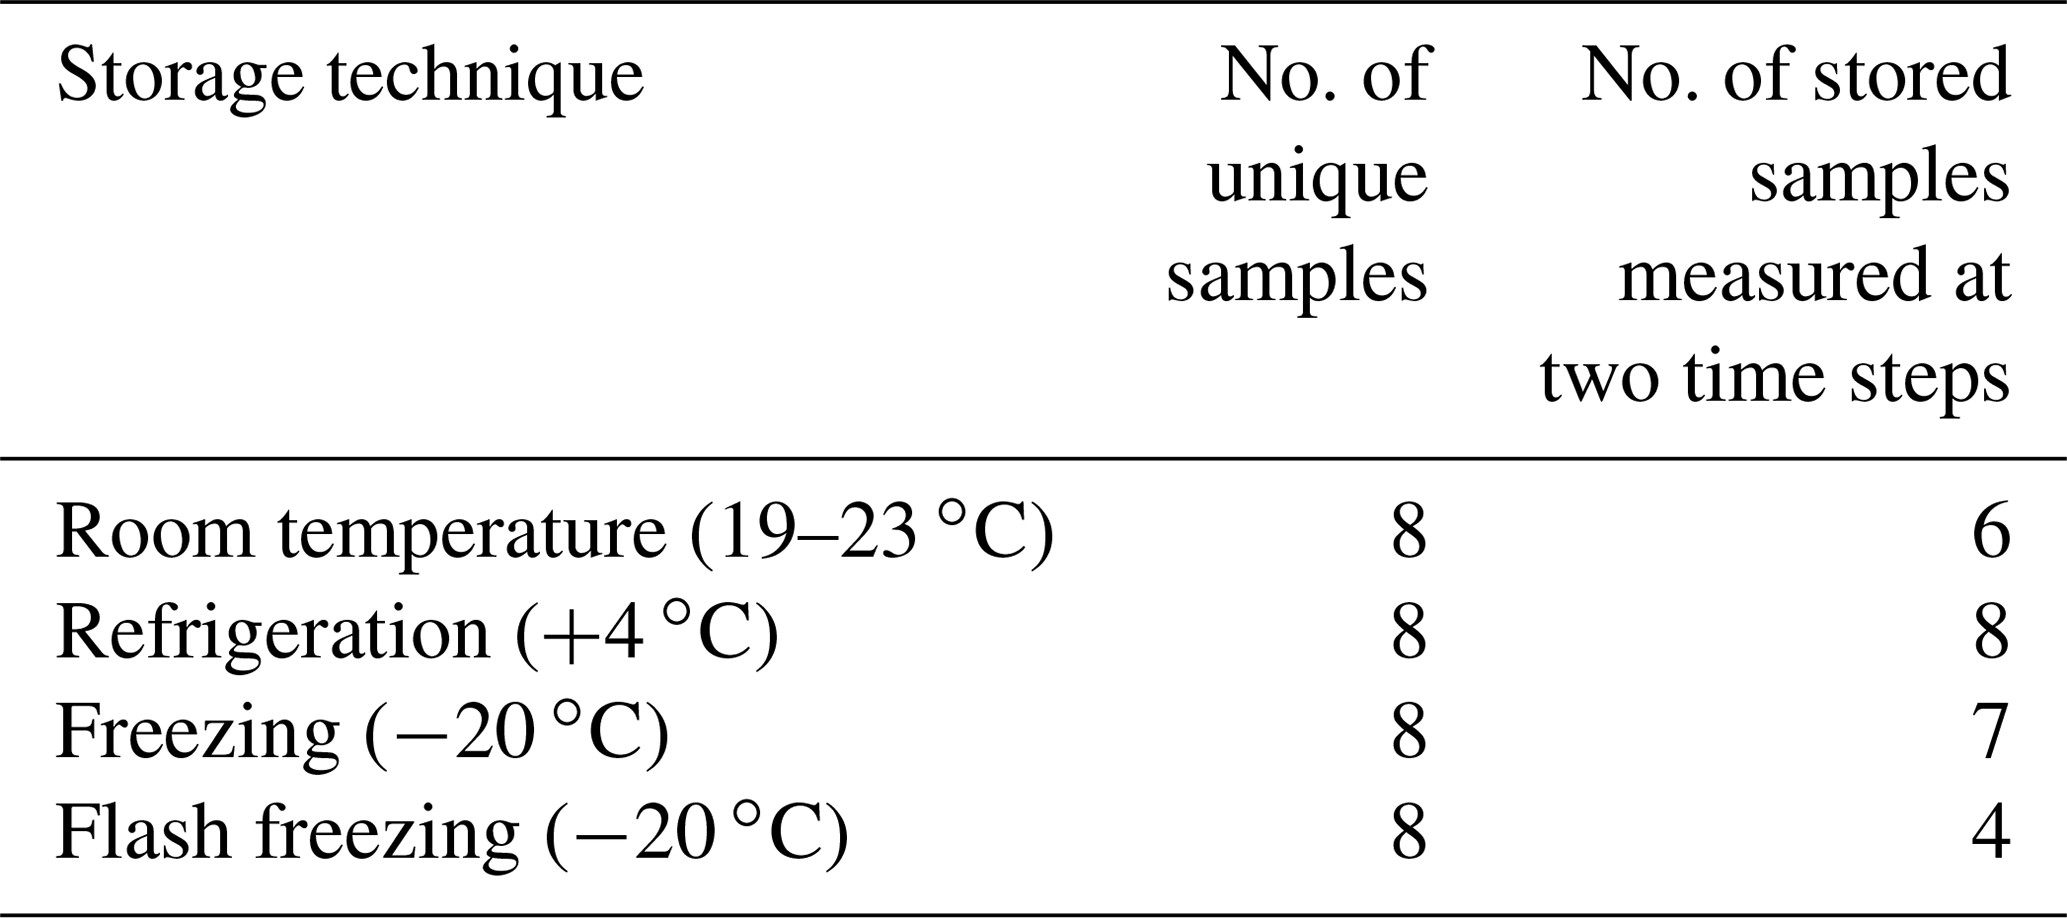
Table 4Summary of unique and replicate filtered (0.45 µm) precipitation samples used for INP concentration measurements featured in Fig. 4.

2.3 INP analysis
The automated ice spectrometer (AIS) is an offline immersion-mode freezing assay which is described elsewhere (Beall et al., 2017). Briefly, 50 µL aliquots of sample are pipetted into two sterile 96-well polypropylene PCR plates. The plates are inserted into an aluminum block, machined to hold PCR plates, that sits in the coolant bath of a Fisher Scientific Isotemp® Circulator. A thermistor placed atop the left side of the aluminum block, below the PCR plate, recorded temperature. An acrylic plate separated the PCR plates from the ambient lab air. In the headspace between the acrylic plate and the PCR plates, nitrogen gas flowed at a flow rate of 14 L min−1 to reduce temperature stratification in the samples (Beall et al., 2017). The nitrogen gas was cooled before emission by passing through the chiller via copper tubing. A 0.5 MP monochrome camera (Point Grey Blackfly 0.5 MP Mono GigE POE) performed the image capture. Custom LabVIEW software controlled the camera settings, controlled the rate at which the chiller cooled and displayed the temperature of the thermistor.
A control Milli-Q water sample is used, typically in the first 30 wells of each sample run, to detect contamination and for subsequent INP concentration calculations. Thirty wells were used per sample to achieve a limit of detection of 0.678 IN mL−1. For each run, the chiller was cooled to −35 ∘C. As the chiller cools the sample plates (1 ∘C min−1), the custom LabVIEW virtual instrument records the location and temperature of the freezing event as they occur. Freezing events are detected by the change in pixel intensity of the sample as it changes from liquid to solid.
2.4 Particle size distributions
Size distributions of insoluble particles suspended in the fresh and stored precipitation samples were measured using the Multi-sizing Advanced Nanoparticle Tracking Analysis (MANTA) ViewSizer 3000 (Manta Instruments Inc.). The Manta ViewSizer 3000 applies multispectral particle tracking analysis (m-PTA) to obtain size distributions of particles of sizes between 10 and 2000 nm with three solid-state lasers with wavelengths of 450, 520 and 650 nm. m-PTA has been shown to outperform traditional dynamic light scattering (DLS) techniques when measuring polydisperse particles in suspension (McElfresh et al., 2018). For analysis, 300 videos of the illuminated particles in suspension are recorded, each 10 s in length. The software tracks each particle individually, obtaining particle size and number concentration from their Brownian motion and the imaged sample volume.
3.1 INP concentrations in fresh precipitation samples
Figure 1 shows INP concentrations of 15 coastal rain samples, collected in a variety of meteorological conditions including scattered, low coastal rain clouds, frontal rain and atmospheric river events (see Table 1). Observations generally fall within bounds of previously reported INP concentrations from precipitation and cloud water samples (grey shaded region, adapted from Petters and Wright, 2015). Observed freezing temperatures ranged from −4.0 to −18.4 ∘C, with concentrations up to the limit of testing at 105 INP L−1 precipitation. AIS measurement uncertainties are represented with 95 % binomial sampling intervals (Agresti and Coull, 1998).
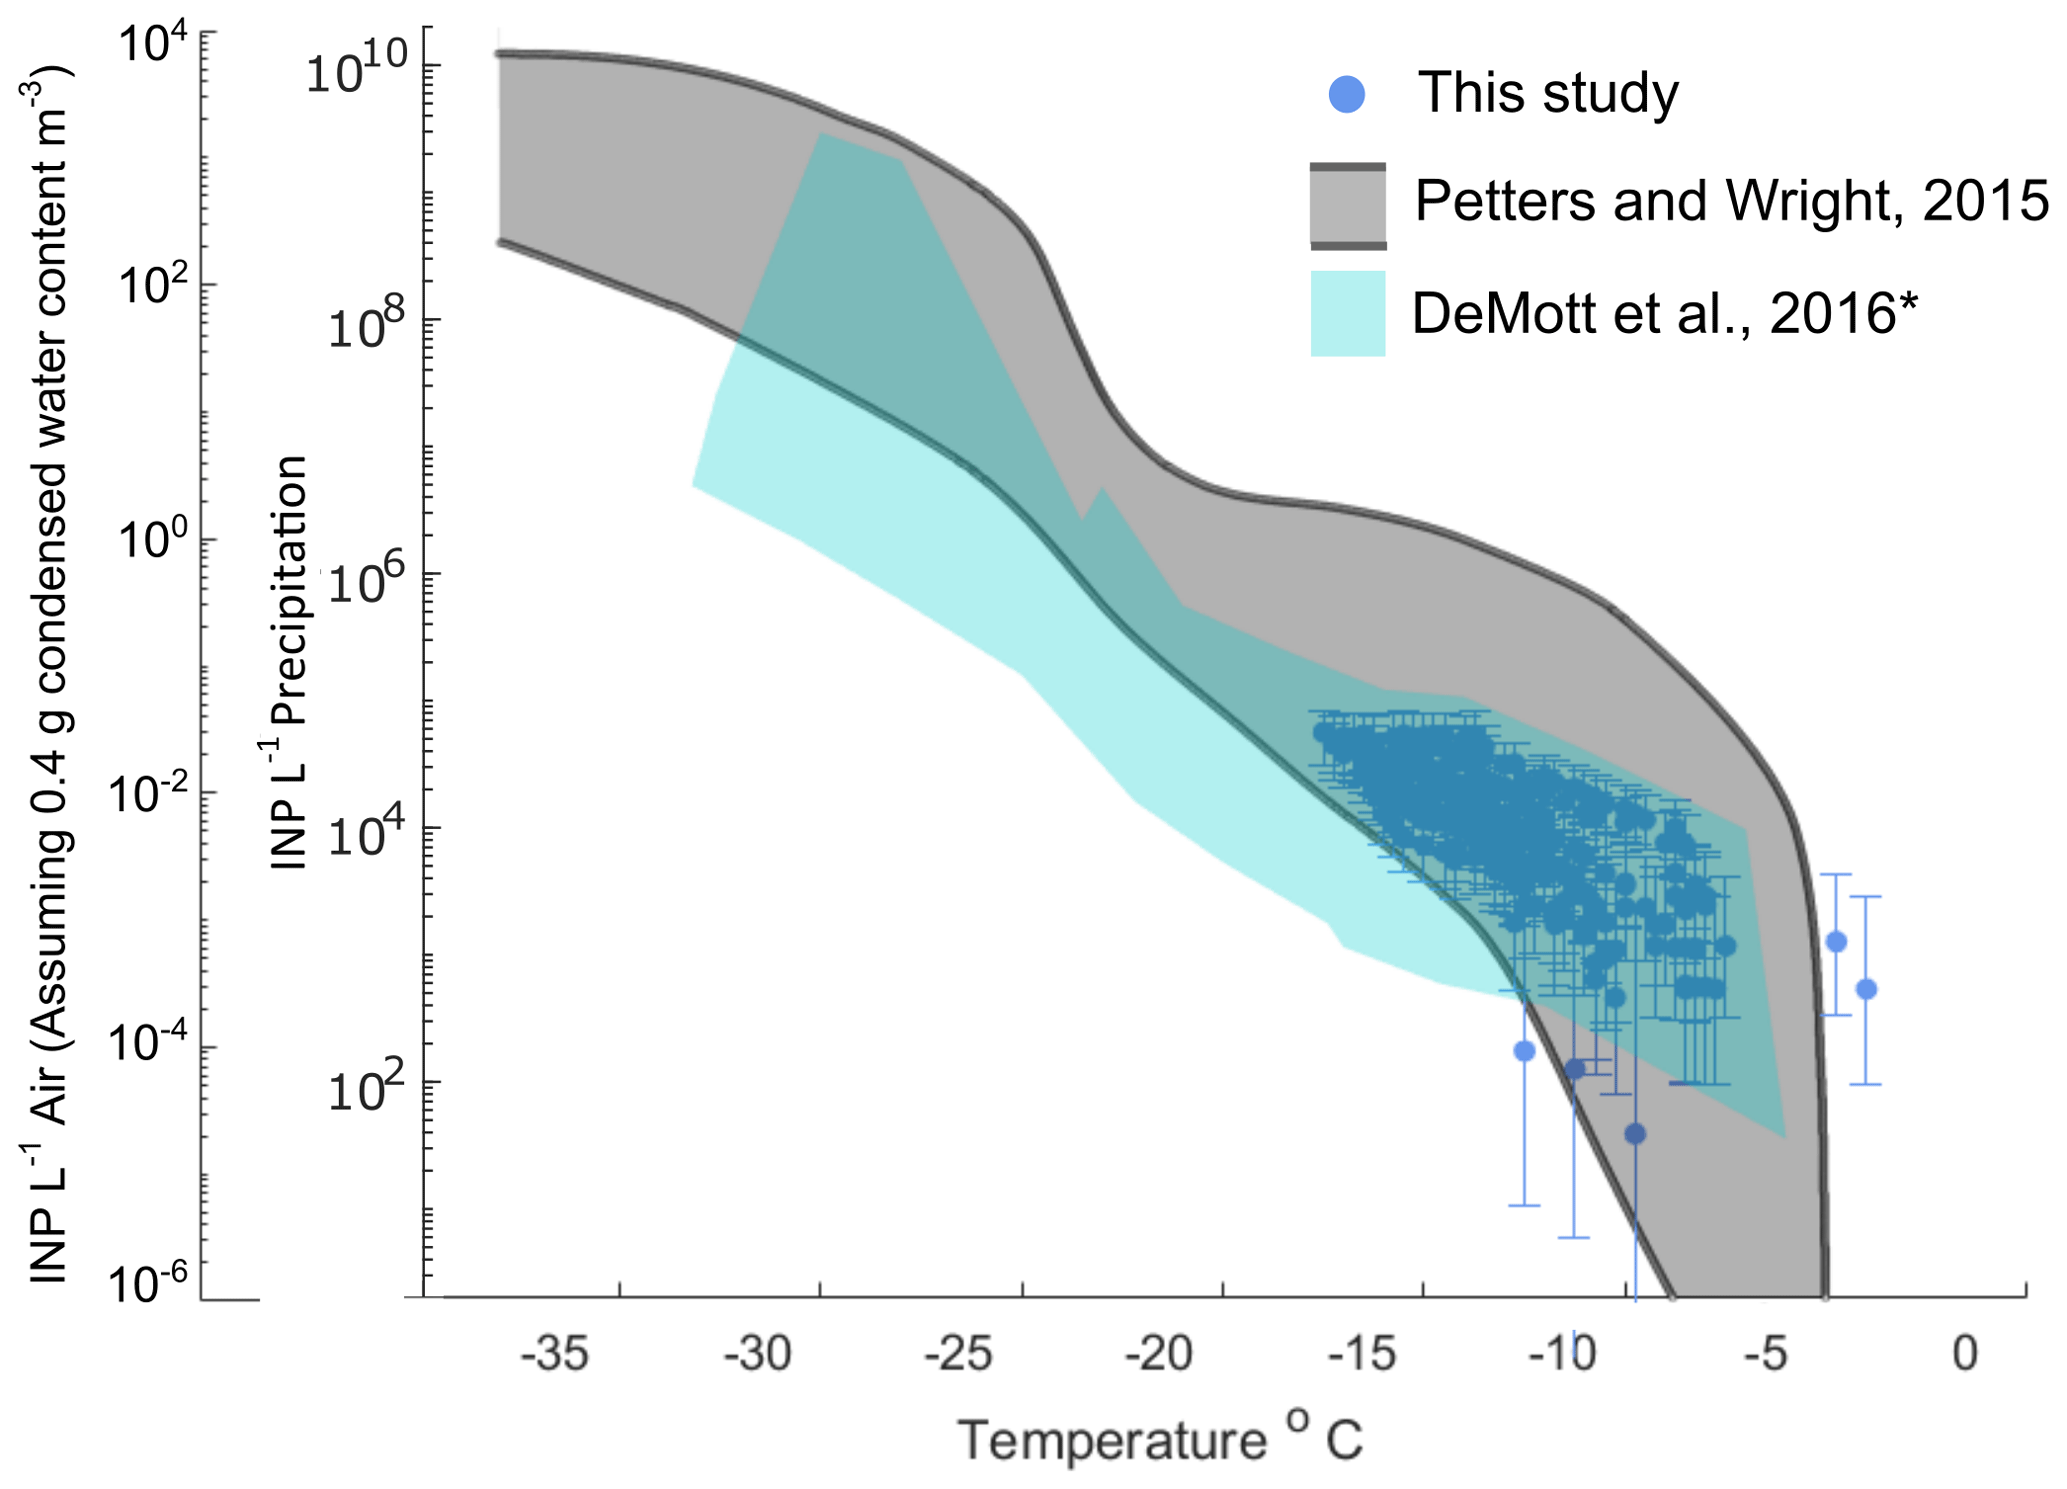
Figure 1INP concentrations per liter of precipitation and estimated in-cloud INP concentrations per volume of air in 15 precipitation samples collected at two coastal sites at Scripps Institution of Oceanography (La Jolla, California, USA) between 22 September 2016 and 22 November 2019. Grey shaded region indicates the spectrum of INP concentrations reported in nine previous studies of precipitation and cloud water samples collected from various seasons and locations worldwide, adapted from Fig. 1 in Petters and Wright (2015). The blue shaded region denotes the composite spectrum of INP concentrations observed in a range of marine and coastal environments including the Caribbean, east Pacific, and Bering Sea as well as laboratory-generated nascent sea spray (DeMott et al., 2016). ∗ DeMott et al. (2016) data have been updated with a completed dataset for the ICE-T study, as shown in Yang et al. (2020).
Following the assumptions in Wright and Petters (2015) to estimate in-cloud INP concentrations from precipitation samples (i.e., condensed water content of 0.4 g m−3 air), observations of INP concentrations in fresh precipitation samples are additionally compared to studies of field measurements conducted in marine and coastal environments. Figure 1 shows that atmospheric INP concentration estimates compare with INP concentrations observed in a range of marine and coastal environments, including the Caribbean, east Pacific, and Bering Sea, as well as laboratory-generated nascent sea spray aerosol (DeMott et al., 2016). However, two of the warmest-freezing INP observations in Fig. 1 (at −4.0 and −4.75 ∘C) exceed temperatures commonly observed in marine-influenced atmospheres, precipitation and cloud water samples.
In 5 of the 15 heat-treated samples, INP concentrations were increased by 1.9–13 times between −9 and −11 ∘C (see Discussion). Excluding these five samples, the fraction of heat-resilient INPs varied between samples and generally increased with decreasing temperature. Geometric means and standard deviations of heat-treated : untreated INP ratios were 0.40 1.9, 0.51 2.0 and 0.62 2.1 at −11, −13 and −15 ∘C respectively.
Fractions of INPs < 0.45 µm also varied between samples, with geometric means and standard deviations of 0.48 1.73, 0.30 3.4 and 0.37 1.9 at −11, −13, and −15 ∘C respectively. Mean values of heat-resilient INP fractions and INPs < 0.45 µm were calculated using the geometric mean, which is more appropriate than the arithmetic mean for describing a distribution of ratios (Fleming and Wallace, 1986).
3.2 Effects of sample storage on INP concentration measurements
INP concentrations of stored replicate samples are compared with original fresh precipitation samples in Figs. 2–4, calculated in successive 2 ∘C increments between −7 and −19 ∘C. This temperature range was chosen for the analysis because most fresh precipitation samples exhibited freezing activity between −7 and −19 ∘C. Numbers of datapoints in Figs. 2–4 differ across the temperature intervals due to limits of detection (i.e., ratios were not calculated at temperatures where zero or all wells were frozen in the fresh and/or stored sample).
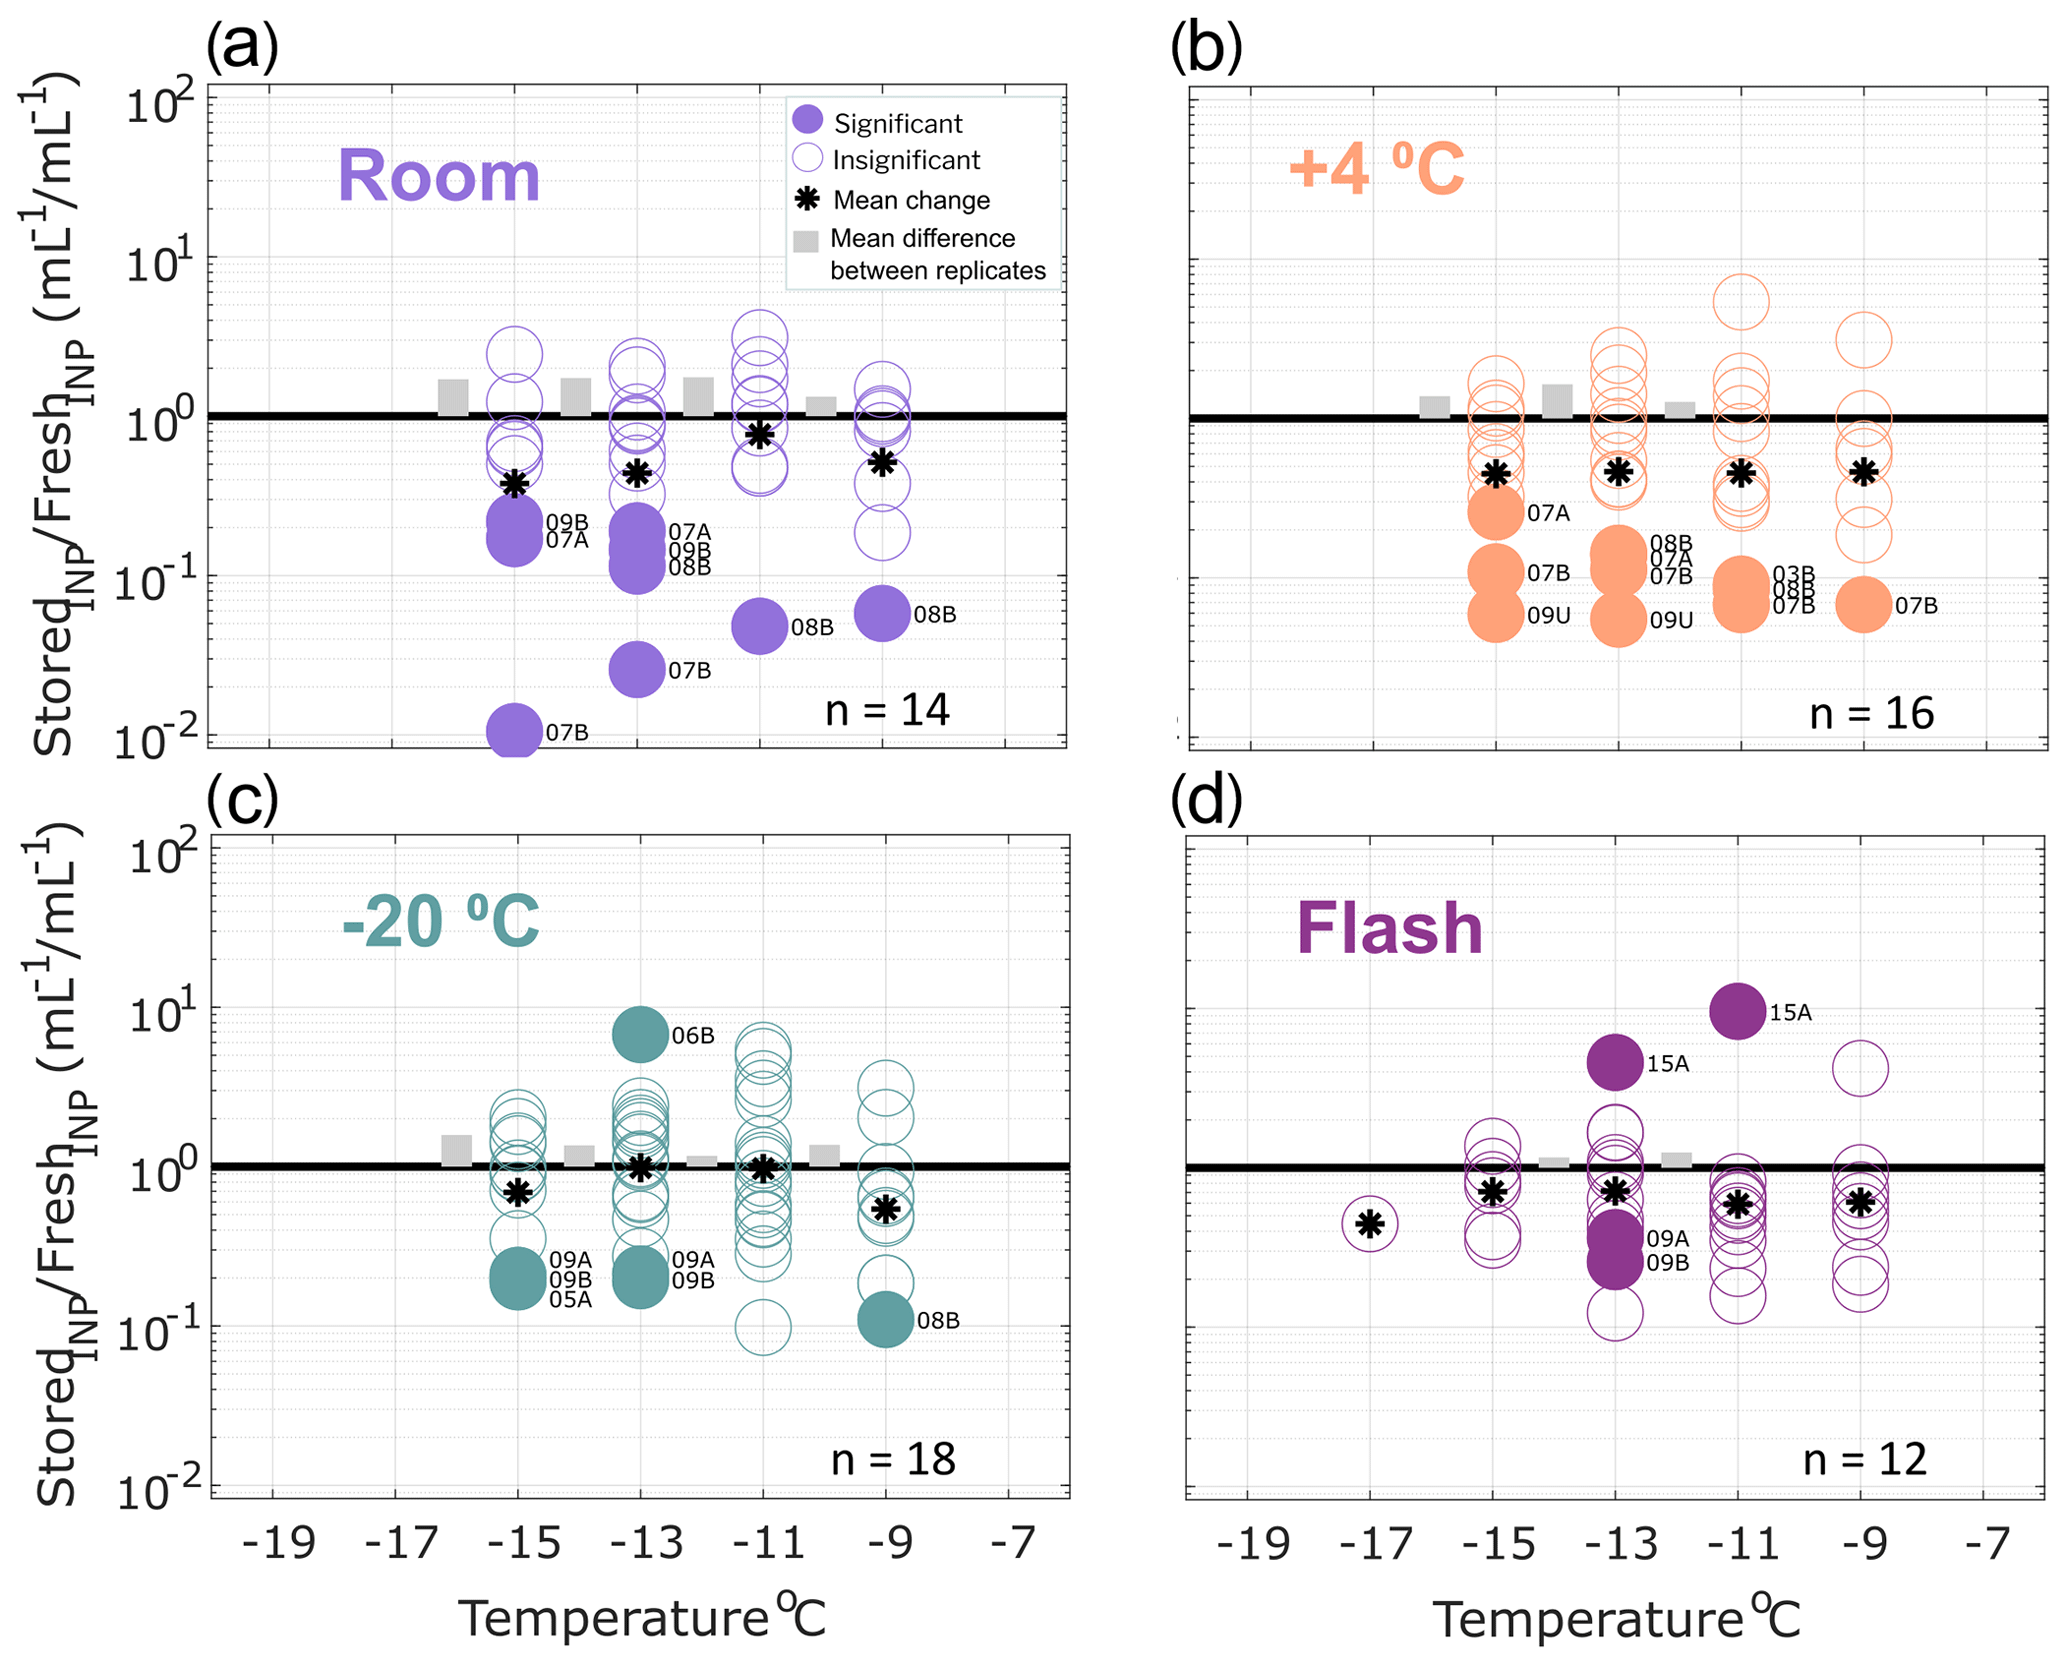
Figure 2Ratio of INP concentrations measured in untreated precipitation samples (stored : fresh), calculated in successive 2 ∘C increments between −19 and −7 ∘C. Four storage protocols were applied: (a) room temperature (21–23 ∘C), (b) refrigerated (+4 ∘C), (c) frozen (−20 ∘C) and (d) flash frozen in liquid nitrogen before storing frozen (−20 ∘C). All samples were processed at one or two time intervals between 1 and 166 d postcollection (see Figs. S1–S4). For samples processed at two intervals, both replicate samples are represented in the figure for a total of 14, 16, 18 and 12 samples in panels (a), (b), (c) and (d), respectively (see Table 2 for summary of sample and replicate numbers). Markers above the black 1 : 1 line indicate enhancement of INP concentrations in stored samples, and markers below indicate losses. In temperature intervals containing stored : fresh ratios from at least two sets of replicate samples, grey bars represent the average difference between replicates. Stored sample frozen well fractions that passed Fisher's exact test (p < 0.01) for significant differences from original fresh sample frozen well fractions at each of the five temperatures are indicated with filled markers, and the mean change in each temperature interval is marked with a star. Significant data are also labeled to indicate the sample number (01–15; see Table 1) and replicate (“A” or “B”, and “U” indicates there were no replicates for the sample). Results show that, on average, INP concentrations decrease in stored samples and that both room temperature storage and refrigeration result in significant INP losses. Frozen and flash-frozen storage show comparable results, with fewer (3–4) of the observations exhibiting significant losses and enhancements in INP concentrations.
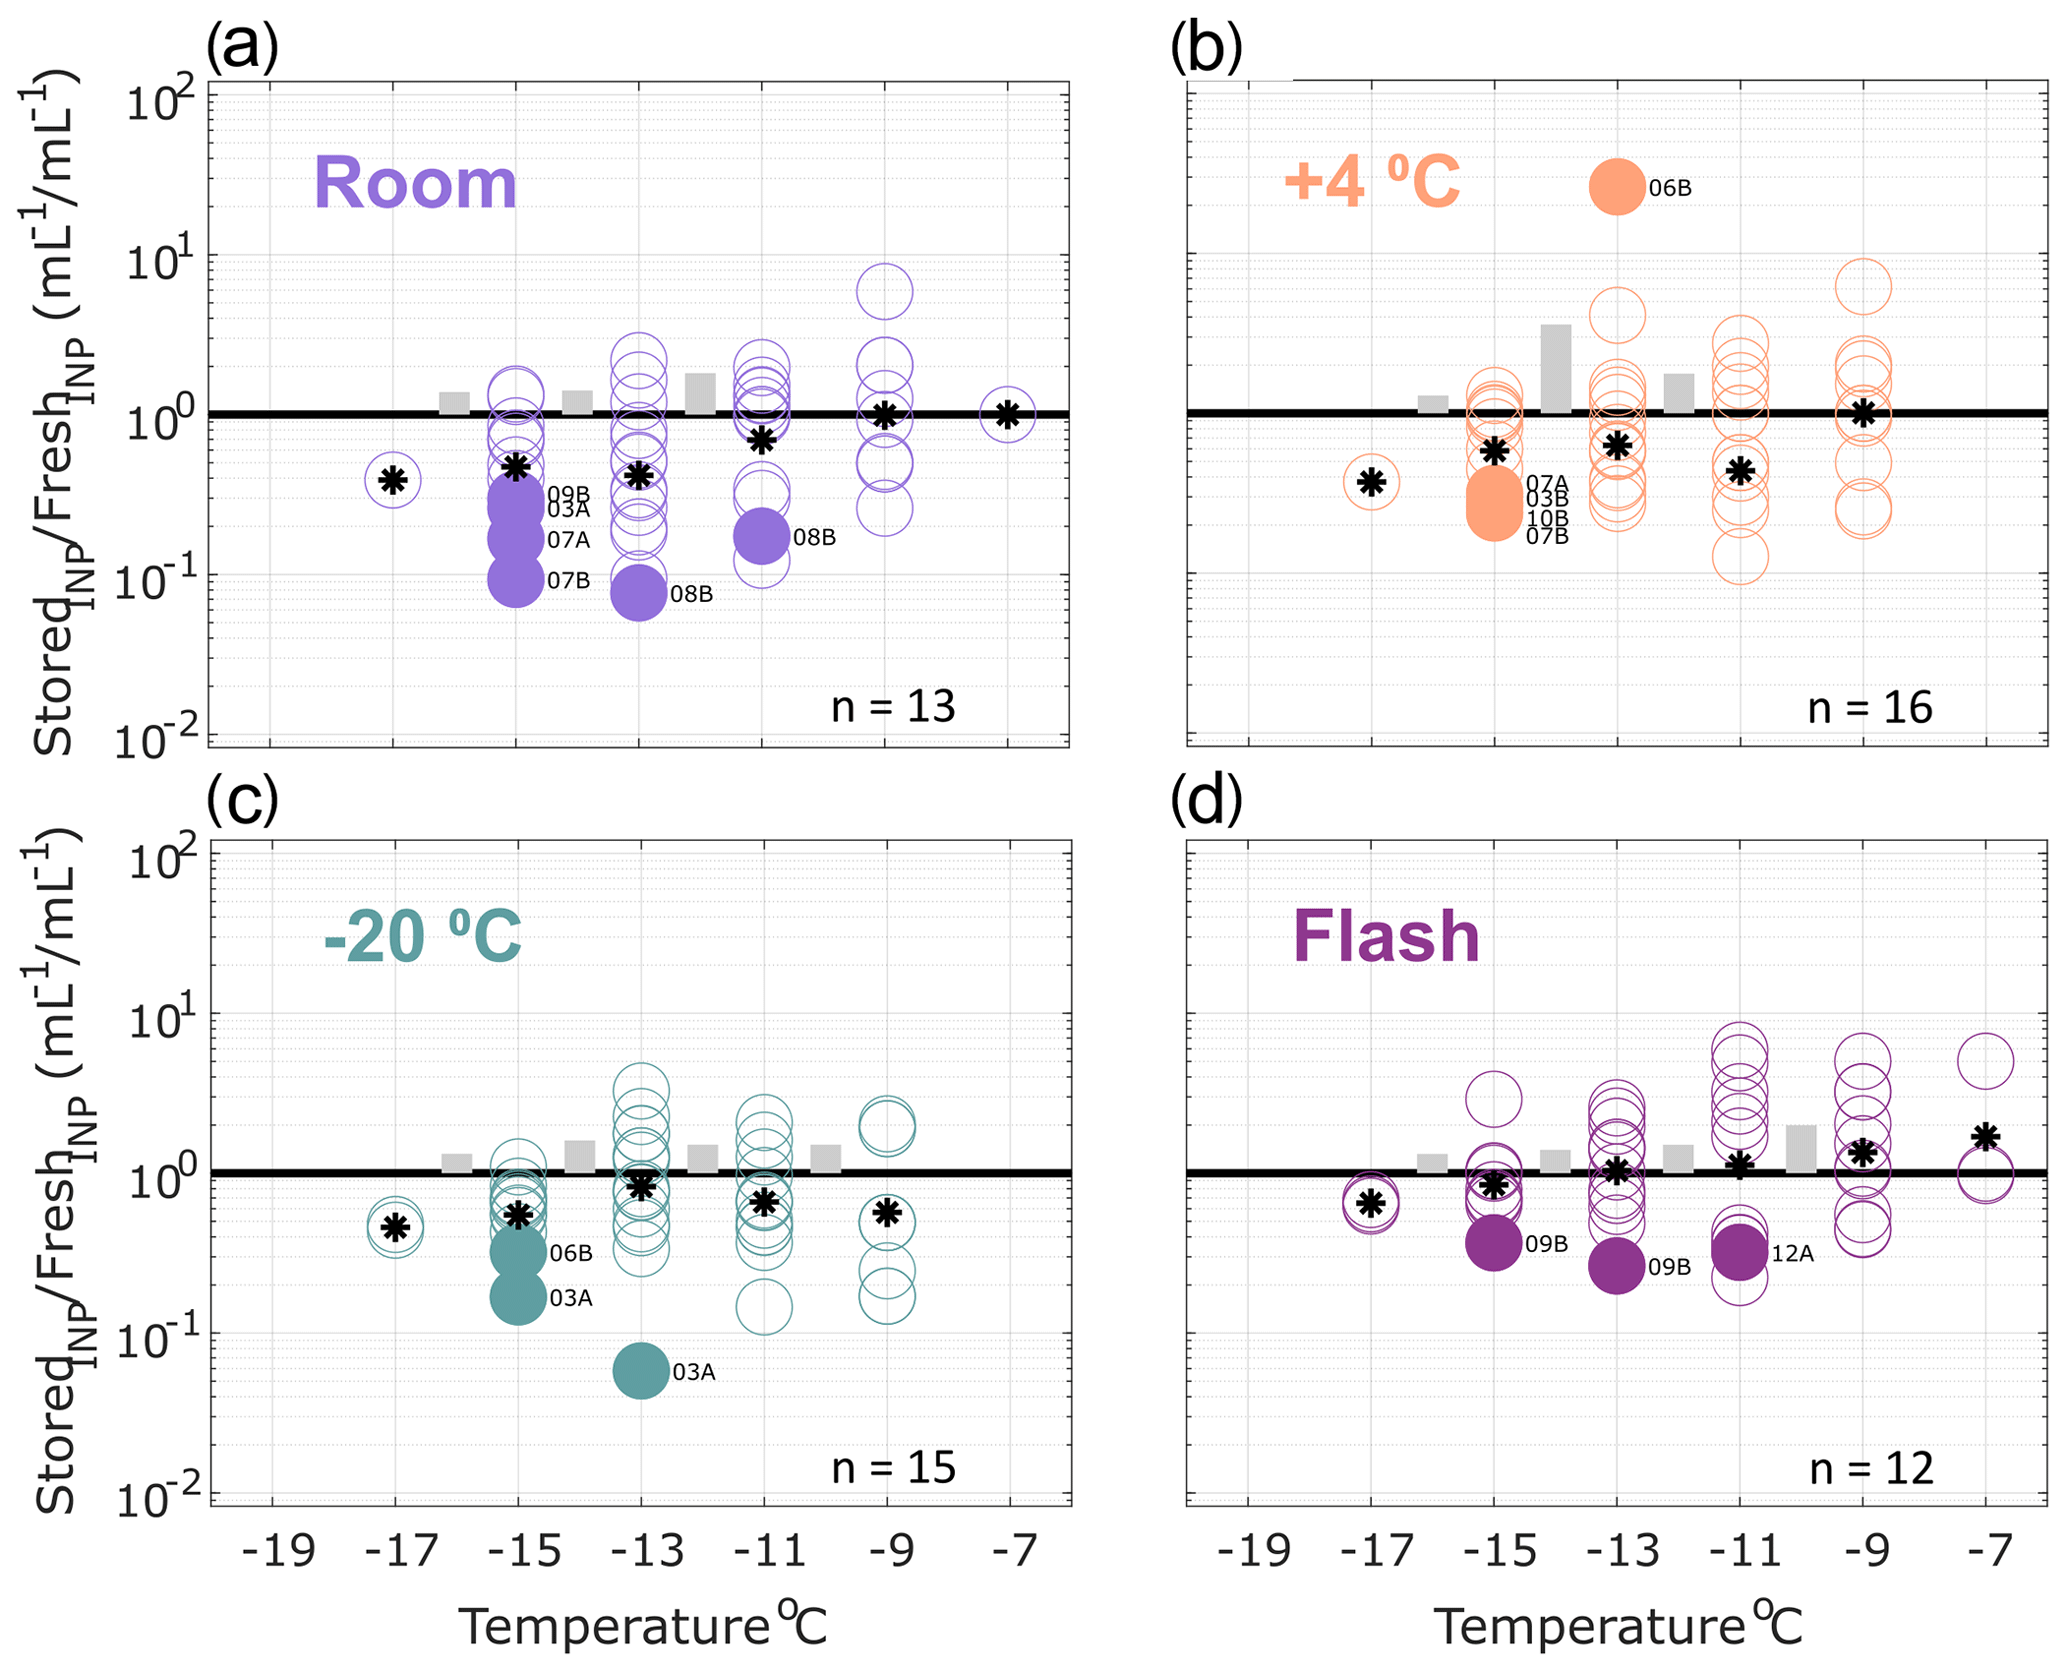
Figure 3Ratio of INP concentrations measured in heated precipitation samples (stored : fresh), calculated in successive 2 ∘C increments between −19 and −7 ∘C. Same samples as shown in Fig. 2 but heated to 95 ∘C for 20 min prior to measurement to eliminate heat-labile INPs (see Methods Sect. 2.2 for details). All samples were processed at one or two time intervals between 1 and 166 d postcollection. For samples processed at two intervals, both replicate samples are represented in the figure for a total of 13, 16, 15 and 12 samples in panels (a), (b), (c) and (d), respectively (see Table 3 for summary of sample and replicate numbers). In temperature intervals containing stored : fresh ratios from at least two sets of replicate samples, grey bars represent the average difference between replicates. Results show significant losses of INPs in heat-treated samples stored at room temperature. Refrigerated, frozen and flash-frozen samples show comparable results with a few (1–3) samples exhibiting significant losses and enhancements. Non-heat-labile INPs are generally less sensitive to storage protocol than the total INP population in precipitation samples (Fig. 2), with the exception of storage at room temperature.
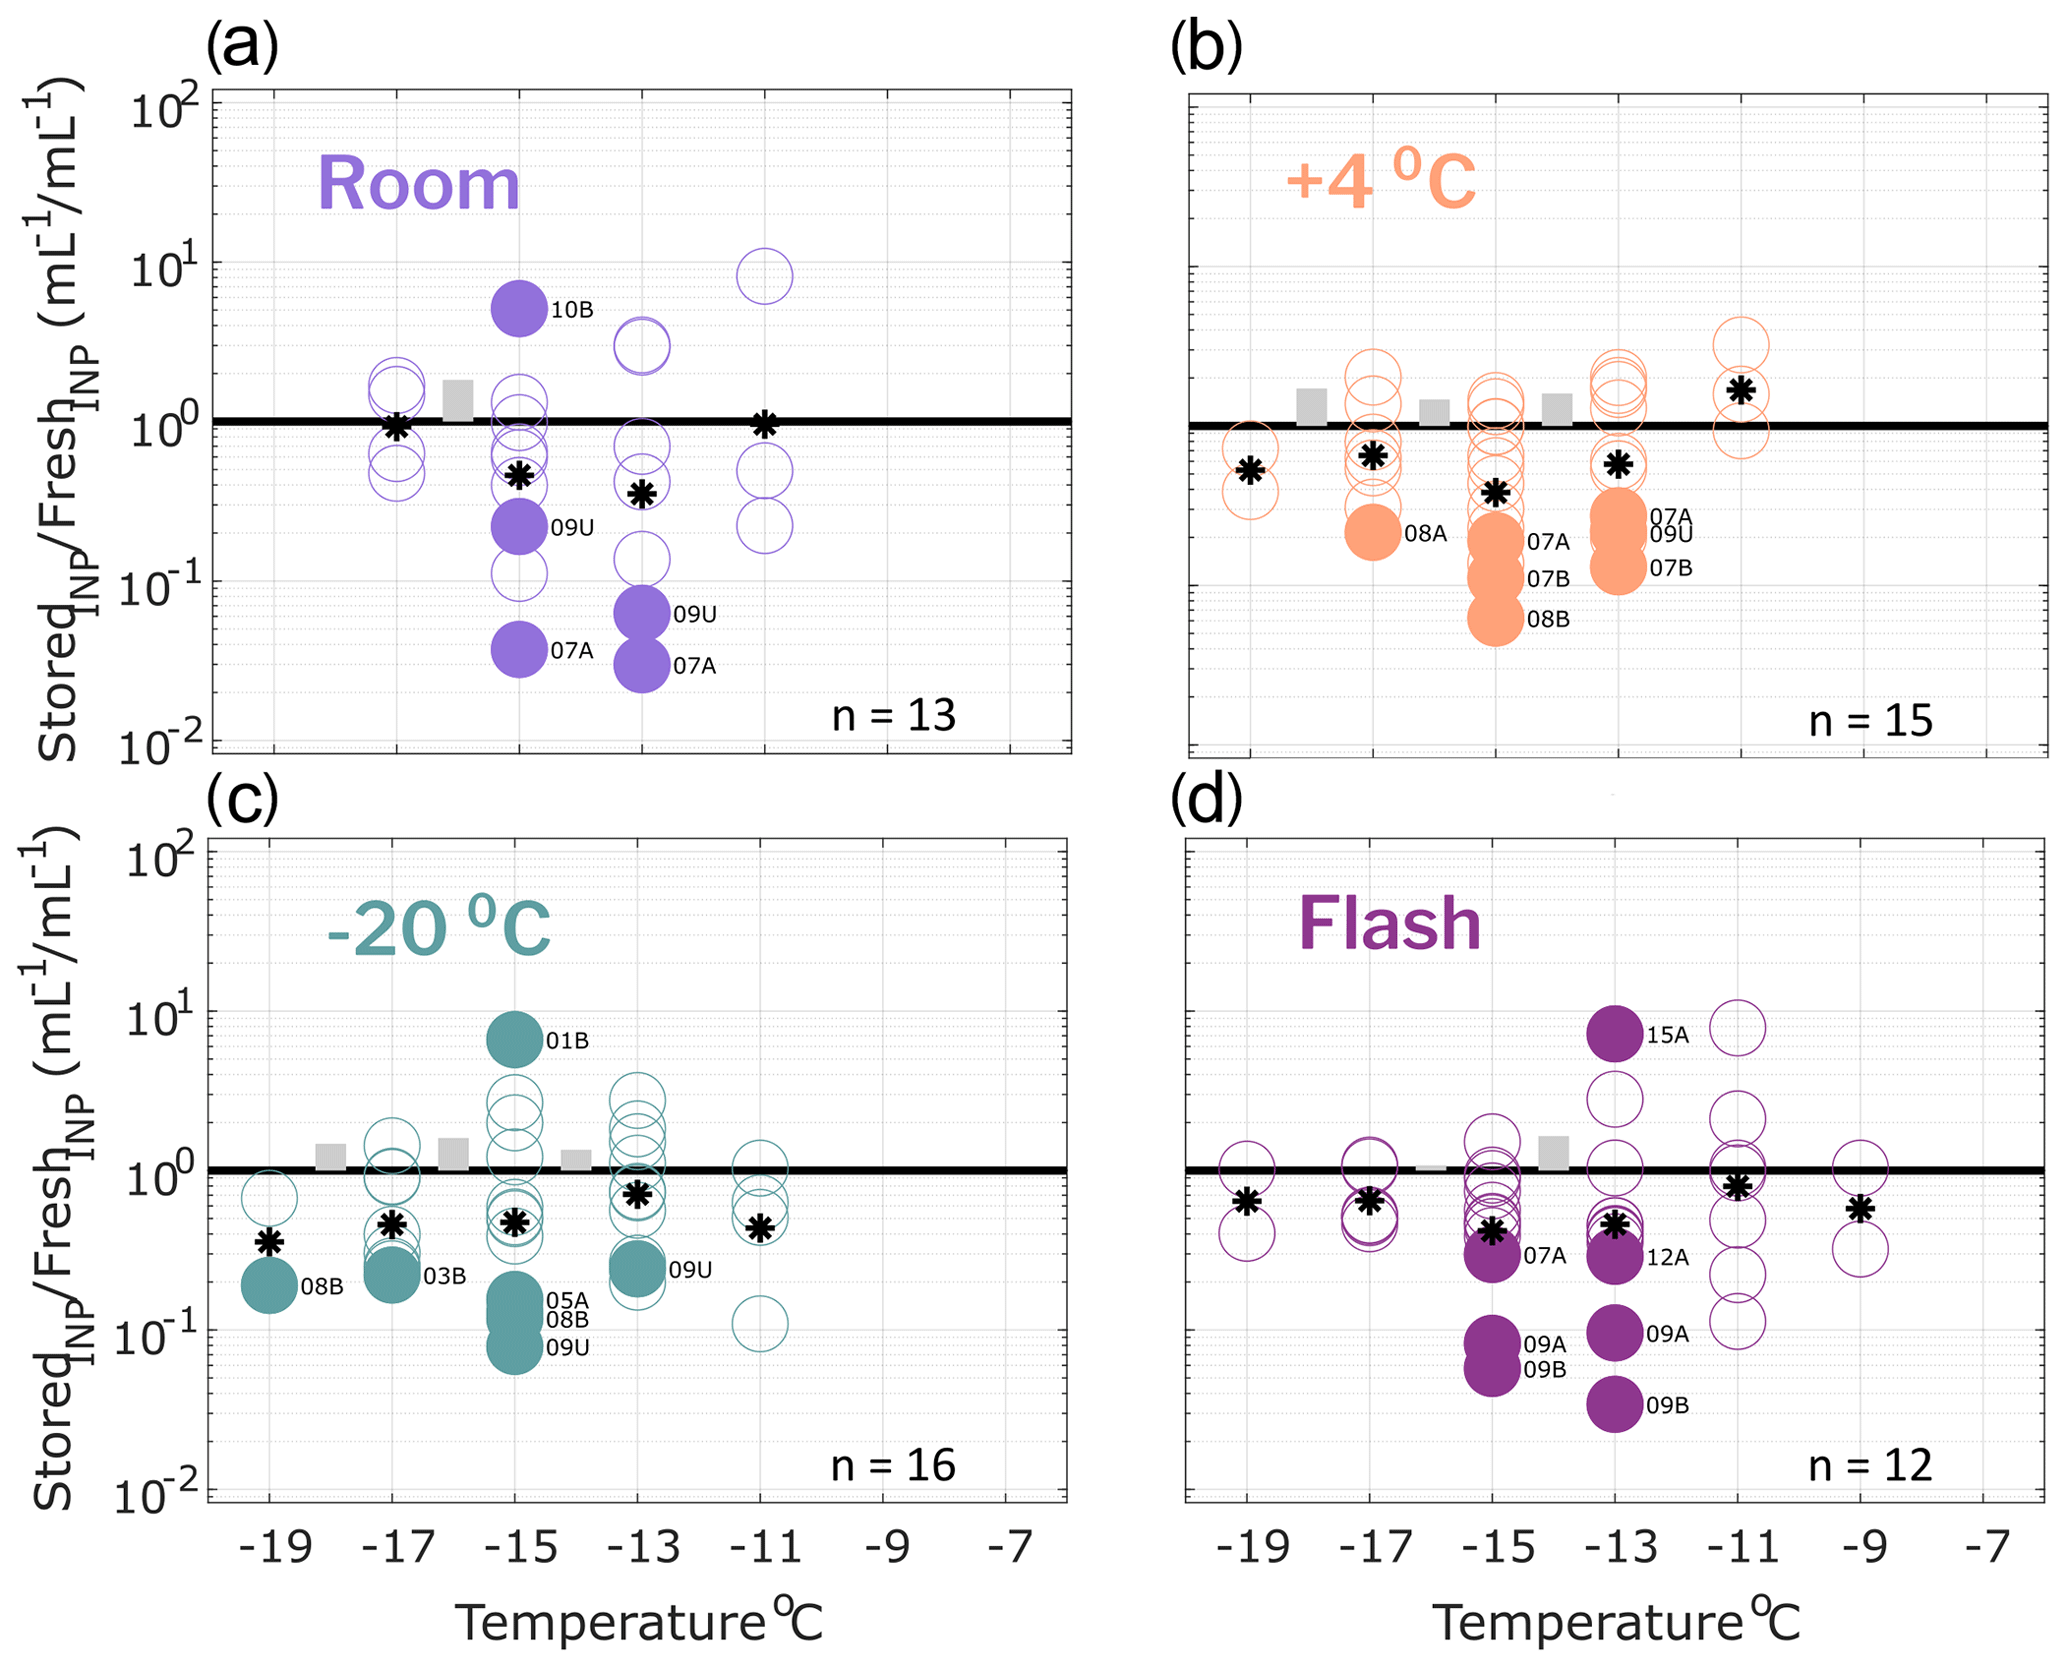
Figure 4Ratio of INP concentrations measured in filtered (0.45 µm) precipitation samples (stored : fresh), calculated in successive 2 ∘C increments between −19 and −7 ∘C. Same samples as in Fig. 2 but filtered with a 0.45 µm syringe filter prior to measurement (see Methods Sect. 2.2 for details). All samples were processed at one or two time intervals between 1 and 166 d postcollection. For samples processed at two intervals, both replicate samples are represented in the figure for a total of 13, 15, 16 and 12 samples in panels (a), (b), (c) and (d), respectively (see Table 4 for summary of sample and replicate numbers). In temperature intervals containing stored : fresh ratios from at least two sets of replicate samples, grey bars represent the average difference between replicates. Results show significant losses of INPs in several filtered samples, regardless of storage protocol.
All stored : fresh ratios were calculated from cumulative INP distributions in 2 ∘C intervals, meaning that the INP concentration in each interval is inclusive of the concentration in all of the preceding (warmer) temperature intervals. The choice of the cumulative distribution was motivated by the fact that it is standard in INP studies to report INP concentrations in terms of the cumulative distribution, and it is important to consider impacts of storage on cumulative INP distributions and any conclusions derived from them. Thus, in this study, deviations observed in a stored sample are not necessarily independent; i.e., the sensitivity of INPs to storage in one temperature interval could impact the observed changes in all of the following (colder) temperature intervals. For example, in fresh untreated precipitation samples (see Fig. 1), 32 % of the INP concentration calculated at −11 ∘C activated in one of the preceding (warmer) 2 ∘C temperature intervals. At −17 ∘C, this fraction is increased to 46 %.
To investigate correlations between sample storage time and INP enhancements or losses, duplicate samples were archived (when sufficient volume was available) so that each sample could be processed at two distinct points postcollection (see example Fig. S1). For INPs with freezing temperatures ≥ −9 ∘C in samples stored at room temperature, time is moderately correlated with changes in INP concentrations (R2 = 0.58). Figure S5 shows how losses of warm-freezing INPs in samples stored at +4 ∘C and room temperature impact the cumulative INP spectra for a select sample. Beyond these exceptions, little to no correlation between storage time and INP enhancements or losses was found for untreated, heated and filtered samples (see Figs. S1–S4). This indicates that most of the changes in INPs observed may occur on shorter timescales than those studied here, i.e., < 24 h.
Figure 2 shows the ratio of stored sample to fresh sample INP concentrations for untreated precipitation samples stored under four conditions: (a) room temperature (21–23 ∘C), (b) refrigerated (+4 ∘C), (c) frozen (−20 ∘C) and (d) flash frozen with liquid nitrogen before storing at −20 ∘C. Markers above the 1 : 1 line indicate enhancements in INP concentration from the fresh sample, while markers below indicate losses. For each temperature interval containing data from at least two sets of replicate samples, the average differences in stored : fresh concentration ratios between replicates are represented with grey bars to indicate measurement variability. Replicate samples were processed for each storage protocol so that impacts of sample handling can be distinguished from storage impacts. For example, if settling occurs in bulk rain samples that are then divided into smaller volumes prior to storage, INP concentrations may differ between replicates of the bulk sample. Thus, it is assumed that INP concentration changes that are greater than differences between replicates (grey bars in Figs. 2–4) can be attributed to storage impacts. We also assume that stored : fresh INP concentration ratios of 1 : 1 indicate insensitivity to storage, although it is possible that enhancements and losses of equal magnitude could also result in a 1 : 1 concentration ratio.
Finally, Fisher's exact test was applied to frozen and unfrozen well fractions between each stored sample and its corresponding fresh sample at each of the 2 ∘C temperature intervals. Stored sample frozen well fractions that were significantly different (p < 0.01) from fresh sample frozen well fractions are indicated with filled markers. The term “significant” henceforth is intended to describe INP losses or enhancements that correspond to frozen well fractions that are determined to be significantly different from corresponding fresh sample frozen well fractions, according to Fisher's exact test (i.e., filled markers in Figs. 2–4). Results in Fig. 2 show that significant enhancements or losses of INPs occurred in all storage protocols between −9 and −17 ∘C and that, on average, stored samples exhibit INP losses (as indicated by the mean change in each temperature interval). In frozen and flash-frozen samples, all enhancements and losses fall within ± 1 order of magnitude, whereas several significant INP losses beyond 1 order of magnitude are shown in room and refrigerated samples. INP concentration changes ≥ 1 order of magnitude are greater than changes in the ratios of the total insoluble particle population of 10–2000 nm during storage (see Fig. S6). This indicates that the INPs in these samples are more sensitive to storage than the total insoluble particle population. Fig. S5 illustrates the impacts of the four storage protocols on the full IN spectra of a select untreated precipitation sample at two time intervals, 27 and 64 d after collection.
Figure 3 shows the effects of storage on INP observations in heat-treated precipitation samples. Non-heat-labile INPs represented the majority (62 % on average at −15 ∘C; see Sect. 3.1) of the total INPs observed in the fresh samples (i.e., 38 % of the INPs in fresh samples were heat-labile). Fewer significant losses of non-heat-labile INPs are observed for heat-treated samples stored at room temperature and at 4 ∘C compared with untreated samples. Again, slightly fewer (2–3) of the total frozen and flash-frozen samples exhibit significant losses and enhancements. All observations other than the one significantly enhanced sample in (b) fall within ranges of stored : fresh ratios observed in the total insoluble particle population (see Fig. S7, within an order of magnitude). This demonstrates that non-heat-labile INPs are generally less sensitive to storage than the total INP population (Fig. 2).
Effects of storage protocol on INP concentrations of filtered precipitation samples are shown in Fig. 4 (0.45 µm syringe filter; see Sect. 2.2 for details). INPs > 0.45 µm represented the majority (52 and 63 % on average at −11 and −15 ∘C, respectively; see Sect. 3.1) of total INPs measured in the fresh precipitation samples. A higher number of filter-treated samples exhibit significant losses across all four storage types when compared with the untreated samples. Furthermore, significant losses > 1 order of magnitude are observed across all storage types indicating that INPs < 0.45 µm are generally more sensitive to storage than the total INP population present in precipitation samples.
As the stored : fresh ratios follow a lognormal distribution (one-sample Kolmogorov–Smirnov test), the uncertainties associated with storage and 95 % confidence intervals were calculated in using the geometric mean and standard deviation of ratios of unique samples only between −9 and −17 ∘C (i.e., omitting any replicates; see Tables 5–7).
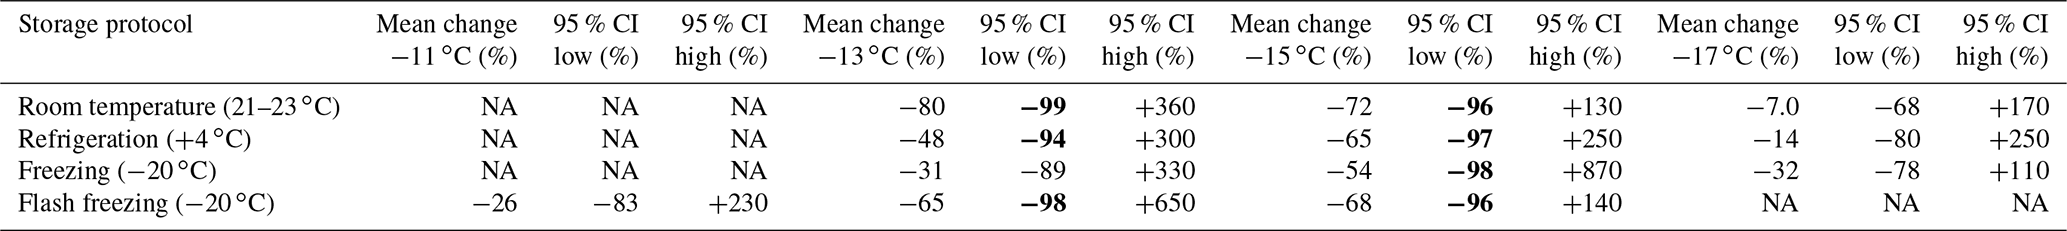
Table 5Estimate of uncertainty associated with storage impacts for INPs with activation temperatures between −9 and −17 ∘C measured in stored, untreated precipitation samples. Confidence intervals were derived from the lognormal distribution of changes observed in INP concentrations due to storage (see Fig. 2 and details in Sect. 3.2). Temperature intervals where datapoints were too few to derive confidence intervals are indicated with “NA”. Changes in INP concentration corresponding to enhancements or losses greater than 1 order of magnitude (losses ≤ −90 % or enhancements ≥ +900 %) in bold.

∗ For INPs with freezing temperatures ≥ −9 ∘C,
changes in INP concentrations are moderately correlated with time in samples
stored at room temperature or at +4 ∘C (see Sect. 3.2). Change
factors for room temperature and
refrigerated storage protocols are derived
from samples stored in ranges of 27–76 and 8–46 d, respectively.
Table 6Estimate of uncertainty associated with storage impacts for INPs with activation temperatures between −9 and −17 ∘C measured in stored, heat-treated precipitation samples. Confidence intervals were derived from the lognormal distribution of changes observed in INP concentrations due to storage (see Fig. 3 and details in Sect. 3.2). Changes in INP concentration corresponding to enhancements or losses greater than 1 order of magnitude (losses ≤ −90 % or enhancements ≥ +900 %) in bold.
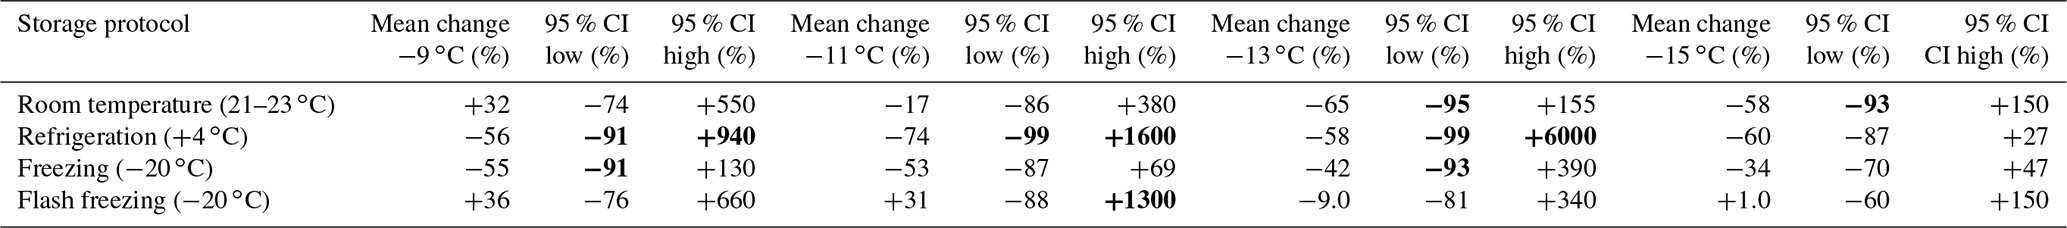
Table 7Estimate of uncertainty associated with storage impacts for INPs with activation temperatures between −11 and −19 ∘C measured in stored, filtered precipitation samples. Confidence intervals were derived from the lognormal distribution of changes observed in INP concentrations due to storage (see Fig. 2 and details in Sect. 3.2). Temperature intervals where datapoints were too few to derive confidence intervals are indicated with “NA”. Changes in INP concentration corresponding to enhancements or losses greater than 1 order of magnitude (losses ≤ −90 % or enhancements ≥ +900 %) in bold.
The challenge in selecting a storage protocol for atmospheric samples (e.g., precipitation, cloud water, ambient atmosphere) is that the INP population composition is unknown and diverse, and the impact of any given technique on the different species may vary. Many types of aerosols can serve as INPs, including dusts, metals and metal oxides, organic and glassy aerosols, bioaerosols, organic and mineral soil dust, and combustion products (Kanji et al., 2017). The aim of this study was to identify a storage protocol that best preserves the concentrations and characteristics of the general INP population observed in precipitation samples collected in a coastal environment. To this end, the impacts of four storage protocols on 15 untreated, heated and filtered precipitation samples collected between 22 September 2015 and 22 November 2019 in La Jolla, CA, were investigated by comparing measured INP concentrations between fresh and stored replicates. The fractions of INPs > 0.45 µm observed in this study varied between 52 % and 63 % at −11 and −15 ∘C, respectively. Excluding the five heat-treated samples in which INP concentrations were enhanced (e.g., 1.9–13 times between −9 and −11 ∘C), the average fraction of non-heat-labile INPs varied between 40 % and 62 % at −11 and −15 ∘C, respectively. INP enhancements in heat-treated samples are unexpected, as heat treatments are typically applied assuming that heat destroys proteinaceous (e.g., biological) INPs. The causes of INP enhancements in heat-treated samples are unknown and have only been reported in coastal precipitation samples (Martin et al., 2019) and nascent sea spray aerosol (McCluskey et al., 2018). Possible sources include the redistribution of dissolved IN-active molecules onto particles (McCluskey et al., 2018) and the release of IN-active content from cells (McCluskey et al., 2018; Wilson et al., 2015). These findings demonstrate that in samples influenced by marine sources, a superposition of both positive and negative ΔINP in samples could result in the observed changes in INP concentrations post heat treatment.
Additionally, the INP freezing temperatures and concentrations observed in this study compare with INPs observed in studies of marine and coastal environments (Fig. 1). As spectra in this regime (−5 to −20 ∘C and 10−5 to ∼ 10−1 L−1 air, respectively) cluster distinctly by source type (see Figs. 1–10 in Kanji et al., 2017), Fig. 1 indicates that the dominant sources to air masses sampled in this study were marine. Considering that data in this study compare well with marine and coastal INPs from a variety of marine-influenced air masses (DeMott et al., 2016; Yang et al., 2020), the findings herein are likely relevant to samples from other marine and coastal environments.
While mean INP changes are within a factor of ∼ 2 or less of fresh sample INP concentrations for all protocols except “Room temperature” (Table 5), none of the four storage protocols prevented significant losses or enhancements of INP concentrations in all samples (Fig. 2), indicating that INP concentration measurements on fresh precipitation are superior to measurements on stored samples. The 95 % confidence intervals in Table 5 span losses > 1 order of magnitude in all protocols across multiple temperature intervals. These uncertainties equal or exceed INP measurement uncertainties (1–2 orders of magnitude) at temperatures > −20 ∘C due to discrepancies between instruments (DeMott et al., 2017). If correspondence within 1 order of magnitude (or 2–3 ∘C) is desired, uncertainties associated with storage should also be considered in studies using samples from coastal or marine environments. Thus, uncertainty distributions provided in Tables 5–7 can be used to evaluate observed INP concentrations and responses to treatments in the context of potential changes due to storage. However, the degree to which INP sensitivity to storage varies by INP source (e.g., with soil-derived INP populations) remains to be tested.
Samples stored under freezing and flash-freezing conditions exhibited fewer changes overall compared to refrigerated samples. For example, at the INP activation temperature of −13 ∘C, in the rain sample that exhibited the highest sensitivity to storage, over 20 % of the original concentration was preserved in the frozen sample, whereas only 5 % of the original concentration was preserved in the refrigerated sample. These losses are more extreme than those of Stopelli et al. (2014), which demonstrated that INP concentrations of a snow sample refrigerated over 30 d decreased only two-fold from 0.027 to 0.013 L−1 at −10 ∘C.
Despite the range of enhancements and losses of heat-sensitive INPs observed in fresh samples, non-heat-labile INPs were generally less sensitive to storage than the total INP population, and with the exception of samples stored at room temperature, all techniques yielded similar results with fewer enhancements or losses. Interestingly, INPs < 0.45 µm exhibited more sensitivity to all storage conditions tested than the total INP population, with significant losses (Fisher's exact test, p < 0.01) observed in several samples leaving between 25 % and 3 % of the value observed in the original fresh sample. Losses of INPs < 0.45 µm in samples stored at room temperature and +4 ∘C were comparable to the losses of total INPs in untreated samples and are likely a result of chemical aging in solution. However, losses of INPs < 0.45 µm in samples stored at −20 ∘C (both frozen and flash frozen) exceeded losses observed in the corresponding untreated samples. This is surprising given that a large fraction of INPs in this study were resilient to heat treatments of +95 ∘C. Lacking the identities of INPs observed in this study, a clear mechanism for their losses remains elusive. However, we offer the following points for consideration. It is well known that as a solution freezes, some solute is incorporated into the crystal and some is rejected, leading to enrichment of the solution phase and aggregation of dissolved or colloidal organic matter (Butler, 2002). Thus, as precipitation samples are freezing, small organic INPs may be lost simply due to aggregation in channels of enriched solute. In coastal precipitation samples for example, INPs may be so “lost” as the increased salinity in solution-phase channels destabilizes small suspended particles, allowing them to coagulate and settle (Jackson and Burd, 1998). Another possibility is that as the solution phase is enriched during freezing, smaller INPs may be adsorbing onto the surface of larger particles. The size distributions of total insoluble particles in the frozen samples show that most samples exhibit losses between 0 and 500 nm after storage and enhancements in sizes > 500 nm (see Fig. S6). This effect is not observed for samples stored at room temperature or at +4 ∘C.
Changes in the total insoluble particle size distribution (± 1 order of magnitude between 10 and 2000 nm; see Figs. S6 and S7) may also have contributed to the observed INP concentration enhancements. Potential mechanisms for INP enhancements include increases in the number concentration of small particles due to breakup of loosely clumped masses of smaller particles, the redistribution of dissolved IN-active molecules onto particles (McCluskey et al., 2018), and the release of IN-active content from cells (McCluskey et al., 2018; Wilson et al., 2015) during cell death and lysis post freezing (Mazur et al., 1984).
Previous studies on precipitation collected along the California coast have demonstrated the contribution of dust, marine and terrestrial bioparticles to INPs in precipitation (Levin et al., 2019; Martin et al., 2019). Considering that well-characterized IN-active dust and biological standards (Arizona test dust and Snomax®, respectively) are sensitive to storage conditions, it is possible that dust or biological INPs contributed to the observed INP changes. Perkins et al. (2020) found that the IN ability of Arizona test dust is degraded in most conditions, including aging in deionized water for 1 d, and results from Polen et al. (2016) show that the most efficient (i.e., warmest freezing) components of biological ice nucleators are also the most labile and sensitive to storage.
The observed distributions of INP concentration changes in stored precipitation samples have implications for the interpretation of heat and filtration treatment experiments. As heat denatures proteins, heat treatments are commonly used to infer contributions of proteinaceous or cellular contributions to INP populations, and filters are commonly applied to identify observed INP size ranges (e.g., McCluskey et al., 2018). For example, a typical analysis involves a comparison of the INP spectrum of an untreated sample to that of the heat-treated or filtered sample, and information about the sizes and biological composition of INPs is derived from this comparison. Our results demonstrate that these treatments may yield different results if treatments are applied to stored samples. Any losses of INPs due to filtering or heat application could be confounded by significant enhancements or losses caused by storage (up to > 1 order of magnitude), resulting in inaccurate conclusions about INP characteristics. In this study, a large fraction (30 % to 48 %, on average) of INPs observed in fresh precipitation samples were < 0.45 µm. Considering this and that INPs < 0.45 µm exhibit significant losses across all storage types, there is a risk that filter treatments on stored samples in this study would lead to the underestimation of INPs < 0.45 µm. Losses of heat-labile INPs in storage could also impact treatment outcomes on stored samples. Assuming negligible effects of storage on the heat-treated sample but losses due to storage in the untreated sample (e.g., as was shown to be most likely for untreated samples stored at +4 ∘C), INP spectra of heat-treated samples could appear to indicate the entire INP population was heat-insensitive. This effect was observed in several samples across storage types (see Fig. S8).
Based on all observations in this study, we provide the following recommendations for precipitation samples collected in coastal and marine environments for offline INP analyses:
-
Of the four storage protocols tested, none prevented changes in INP concentrations across all samples between −7 and −19 ∘C. However, whenever processing fresh samples is not possible, our results demonstrate that storage at −20 ∘C causes the least changes in INP concentrations.
-
Estimates of uncertainty attributed to storage impacts and 95 % confidence intervals for INP measurements obtained from stored samples are provided (see Tables 5–7).
-
Flash freezing with liquid nitrogen before storing at −20 ∘C did not improve conservation of INPs.
-
With the exception of warm-freezing INPs (freezing temperatures ≥ −9 ∘C) in samples stored at room temperature, we found little to no correlation between changes in INP concentrations and storage intervals on timescales between 1 and 166 d, indicating that most enhancements or losses are likely happening during freezing or on timescales < 24 h.
-
INPs that are insensitive to heat treatments are also less sensitive to storage. However, potential enhancements or losses due to storage (e.g., an average loss of 50 % for INPs with freezing temperatures ≥ −15 ∘C in samples stored at −20 ∘C) should be treated as additional uncertainty in measurements of INP concentration when comparing heat-treated with untreated INP spectra.
-
Due to the significant losses of INPs < 0.45 µm in storage, regardless of protocol, we recommend applying filtration treatments to fresh samples exclusively.
As measurements of INPs suspended in precipitation samples are used to infer in-cloud INP composition and concentration estimates, they represent important contributions to studies of links between aerosols, cloud processes and precipitation outcomes. This study derives bounds and correction factors for the impacts of storage on INPs and treatment outcomes from changes in INPs observed in coastal precipitation samples. However, it remains to be seen how INP sensitivity to storage varies by environment or INP composition. Further studies are needed to bracket storage effects on INP populations with various distributions of terrestrial and marine sources, as well as on heat-labile (biological) INPs, and INPs with colder activation temperatures. These studies could additionally benefit from analysis on how storage impacts differential INP spectra, which could reveal how sensitivity to storage varies by specific freezing temperature ranges. Bounds on the impact of storage will enable more meaningful intercomparisons of datasets and illuminate best practices for preserving INPs for offline analysis.
The dataset supporting this paper is hosted by the UCSD Library Digital Collections (https://doi.org/10.6075/J0M32T8B, Beall et al., 2020). The AR data were provided by Bin Guan via https://ucla.box.com/ARcatalog (last access: 27 July 2020).
The supplement related to this article is available online at: https://doi.org/10.5194/amt-13-6473-2020-supplement.
CMB wrote the manuscript, prepared figures, and led the field campaign and laboratory analysis. DL contributed to the preparation of figures, precipitation sample collection and laboratory analysis. MDS, TCH, PJD and KAP provided feedback on the analyses and manuscript. KAP and PJD are principal investigators on awards CHE-1801971 and AGS-1451347.
The authors declare that they have no conflict of interest.
This work was supported by the NSF through the NSF Center for Aerosol Impacts on Chemistry of the Environment (CAICE) CHE-1801971 and AGS-1451347. The National Weather Service Weather Prediction Center provided the surface analysis satellite composite products used in this study. Development of the AR detection algorithm and databases was supported by NASA.
This research has been supported by the National Science Foundation, Division of Chemistry (grant no. CHE-1801971), and the National Science Foundation, Division of Atmospheric and Geospace Sciences (grant no. AGS-1451347).
This paper was edited by Pierre Herckes and reviewed by Gabor Vali and three anonymous referees.
Agresti, A. and Coull, B. A.: Approximate Is Better than “Exact” for Interval Estimation of Binomial Proportions, Am. Stat., 52, 119–126, https://doi.org/10.2307/2685469, 1998.
Beall, C. M., Stokes, M. D., Hill, T. C., DeMott, P. J., DeWald, J. T., and Prather, K. A.: Automation and heat transfer characterization of immersion mode spectroscopy for analysis of ice nucleating particles, Atmos. Meas. Tech., 10, 2613–2626, https://doi.org/10.5194/amt-10-2613-2017, 2017.
Beall, C. M., Lucero, D., Hill, T. C., DeMott, P. J., Stokes, M. D., and Prather, K. A.: Data from: Best practices for precipitation sample storage for offline studies of ice nucleation in marine and coastal environments, UC San Diego Library Digital Collections, https://doi.org/10.6075/J0M32T8B, 2020.
Budke, C. and Koop, T.: BINARY: an optical freezing array for assessing temperature and time dependence of heterogeneous ice nucleation, Atmos. Meas. Tech., 8, 689–703, https://doi.org/10.5194/amt-8-689-2015, 2015.
Butler, M. F.: Freeze Concentration of Solutes at the Ice/Solution Interface Studied by Optical Interferometry, Cryst. Growth Des., 2, 541–548, https://doi.org/10.1021/cg025591e, 2002.
Christner, B. C., Cai, R., Morris, C. E., McCarter, K. S., Foreman, C. M., Skidmore, M. L., Montross, S. N., and Sands, D. C.: Geographic, seasonal, and precipitation chemistry influence on the abundance and activity of biological ice nucleators in rain and snow, P. Natl. Acad. Sci. USA, 105, 18854–18859, https://doi.org/10.1073/pnas.0809816105, 2008.
Creamean, J. M., Suski, K. J., Rosenfeld, D., Cazorla, A., DeMott, P. J., Sullivan, R. C., White, A. B., Ralph, F. M., Minnis, P., Comstock, J. M., Tomlinson, J. M., and Prather, K. A.: Dust and biological aerosols from the Sahara and Asia influence precipitation in the Western U.S., Science, 340, 1572–1578, https://doi.org/10.1126/science.1227279, 2013.
Creamean, J. M., Mignani, C., Bukowiecki, N., and Conen, F.: Using freezing spectra characteristics to identify ice-nucleating particle populations during the winter in the Alps, Atmos. Chem. Phys., 19, 8123–8140, https://doi.org/10.5194/acp-19-8123-2019, 2019.
DeMott, P. J., Prenni, a J., Liu, X., Kreidenweis, S. M., Petters, M. D., Twohy, C. H., Richardson, M. S., Eidhammer, T., and Rogers, D. C.: Predicting global atmospheric ice nuclei distributions and their impacts on climate, P. Natl. Acad. Sci. USA, 107, 11217–11222, https://doi.org/10.1073/pnas.0910818107, 2010.
DeMott, P. J., Hill, T. C. J., McCluskey, C. S., Prather, K. A., Collins, D. B., Sullivan, R. C., Ruppel, M. J., Mason, R. H., Irish, V. E., Lee, T., Hwang, C. Y., Rhee, T. S., Snider, J. R., McMeeking, G. R., Dhaniyala, S., Lewis, E. R., Wentzell, J. J. B., Abbatt, J., Lee, C., Sultana, C. M., Ault, A. P., Axson, J. L., Diaz Martinez, M., Venero, I., Santos-Figueroa, G., Stokes, M. D., Deane, G. B., Mayol-Bracero, O. L., Grassian, V. H., Bertram, T. H., Bertram, A. K., Moffett, B. F., and Franc, G. D.: Sea spray aerosol as a unique source of ice nucleating particles, P. Natl. Acad. Sci. USA, 113, 5797–5803, https://doi.org/10.1073/pnas.1514034112, 2016.
DeMott, P. J., Hill, T. C. J., Petters, M. D., Bertram, A. K., Tobo, Y., Mason, R. H., Suski, K. J., McCluskey, C. S., Levin, E. J. T., Schill, G. P., Boose, Y., Rauker, A. M., Miller, A. J., Zaragoza, J., Rocci, K., Rothfuss, N. E., Taylor, H. P., Hader, J. D., Chou, C., Huffman, J. A., Pöschl, U., Prenni, A. J., and Kreidenweis, S. M.: Comparative measurements of ambient atmospheric concentrations of ice nucleating particles using multiple immersion freezing methods and a continuous flow diffusion chamber, Atmos. Chem. Phys., 17, 11227–11245, https://doi.org/10.5194/acp-17-11227-2017, 2017.
Failor, K. C., Iii, D. G. S., Vinatzer, B. A., and Monteil, C. L.: Ice nucleation active bacteria in precipitation are genetically diverse and nucleate ice by employing different mechanisms, ISME J., 11, 2740–2753, https://doi.org/10.1038/ismej.2017.124, 2017.
Fleming, P. J. and Wallace, J. J.: How Not to Lie with Statistics: The Correct Way to Summarize Benchmark Results, Commun. ACM, 29, 218–221, https://doi.org/10.1145/5666.5673, 1986.
Guan, B. and Waliser, D. E.: Detection of atmospheric rivers: Evaluation and application of an algorithm for global studies, J. Geophys. Res.-Atmos., 120, 12514–12535, https://doi.org/10.1002/2015JD024257, 2015.
Guan, B., Waliser, D. E., and Ralph, F. M.: An Intercomparison between Reanalysis and Dropsonde Observations of the Total Water Vapor Transport in Individual Atmospheric Rivers, J. Hydrometeorol., 19, 321–337, https://doi.org/10.1175/JHM-D-17-0114.1, 2018.
Hader, J. D., Wright, T. P., and Petters, M. D.: Contribution of pollen to atmospheric ice nuclei concentrations, Atmos. Chem. Phys., 14, 5433–5449, https://doi.org/10.5194/acp-14-5433-2014, 2014.
Harrison, A. D., Whale, T. F., Rutledge, R., Lamb, S., Tarn, M. D., Porter, G. C. E., Adams, M. P., McQuaid, J. B., Morris, G. J., and Murray, B. J.: An instrument for quantifying heterogeneous ice nucleation in multiwell plates using infrared emissions to detect freezing, Atmos. Meas. Tech., 11, 5629–5641, https://doi.org/10.5194/amt-11-5629-2018, 2018.
Hegg, D. A. and Hobbs, P. V: Measurements of sulfate production in natural clouds, Atmos. Environ., 16, 2663–2668, https://doi.org/10.1016/0004-6981(82)90348-1, 1982.
Hill, T. C. J., Moffett, B. F., DeMott, P. J., Georgakopoulos, D. G., Stump, W. L., and Franc, G. D.: Measurement of ice nucleation-active bacteria on plants and in precipitation by quantitative PCR, Appl. Environ. Microbiol., 80, 1256–1267, https://doi.org/10.1128/AEM.02967-13, 2014.
Hill, T. C. J., DeMott, P. J., Tobo, Y., Fröhlich-Nowoisky, J., Moffett, B. F., Franc, G. D., and Kreidenweis, S. M.: Sources of organic ice nucleating particles in soils, Atmos. Chem. Phys., 16, 7195–7211, https://doi.org/10.5194/acp-16-7195-2016, 2016.
Hoose, C., Kristjánsson, J. E., Chen, J.-P., and Hazra, A.: A Classical-Theory-Based Parameterization of Heterogeneous Ice Nucleation by Mineral Dust, Soot, and Biological Particles in a Global Climate Model, J. Atmos. Sci., 67, 2483–2503, https://doi.org/10.1175/2010JAS3425.1, 2010.
Jackson, G. A. and Burd, A. B.: Aggregation in the Marine Environment, Environ. Sci. Technol., 32, 2805–2814, https://doi.org/10.1021/es980251w, 1998.
Joyce, R. E., Lavender, H., Farrar, J., Werth, J. T., Weber, C. F., D'Andrilli, J., Vaitilingom, M., and Christner, B. C.: Biological Ice-Nucleating Particles Deposited Year-Round in Subtropical Precipitation, Appl. Environ. Microbiol., 85, e01567-19, https://doi.org/10.1128/AEM.01567-19, 2019.
Kanji, Z. A., Ladino, L. A., Wex, H., Boose, Y., Burkert-Kohn, M., Cziczo, D. J., and Krämer, M.: Overview of Ice Nucleating Particles, Meteorol. Monogr., 58, 1.1–1.33, https://doi.org/10.1175/AMSMONOGRAPHS-D-16-0006.1, 2017.
Kulmala, M., Laaksonen, A., J.Charlson, R., and Korhonen, P.: Clouds without supersaturation, Nature, 388, 336–337, https://doi.org/10.1038/41000, 1997.
Levin, E. J. T., DeMott, P. J., Suski, K. J., Boose, Y., Hill, T. C. J., McCluskey, C. S., Schill, G. P., Rocci, K., Al-Mashat, H., Kristensen, L. J., Cornwell, G., Prather, K., Tomlinson, J., Mei, F., Hubbe, J., Pekour, M., Sullivan, R., Leung, L. R., and Kreidenweis, S. M.: Characteristics of Ice Nucleating Particles in and Around California Winter Storms, J. Geophys. Res.-Atmos., 124, 11530–11551, https://doi.org/10.1029/2019JD030831, 2019.
Lim, Y. B., Tan, Y., Perri, M. J., Seitzinger, S. P., and Turpin, B. J.: Aqueous chemistry and its role in secondary organic aerosol (SOA) formation, Atmos. Chem. Phys., 10, 10521–10539, https://doi.org/10.5194/acp-10-10521-2010, 2010.
Lohmann, U.: A glaciation indirect aerosol effect caused by soot aerosols, Geophys. Res. Lett., 29, 11–14, https://doi.org/10.1029/2001GL014357, 2002.
Lohmann, U. and Feichter, J.: Global indirect aerosol effects: a review, Atmos. Chem. Phys., 5, 715–737, https://doi.org/10.5194/acp-5-715-2005, 2005.
Martin, A. C., Cornwell, G., Beall, C. M., Cannon, F., Reilly, S., Schaap, B., Lucero, D., Creamean, J., Ralph, F. M., Mix, H. T., and Prather, K.: Contrasting local and long-range-transported warm ice-nucleating particles during an atmospheric river in coastal California, USA, Atmos. Chem. Phys., 19, 4193–4210, https://doi.org/10.5194/acp-19-4193-2019, 2019.
Mason, R. H., Chou, C., McCluskey, C. S., Levin, E. J. T., Schiller, C. L., Hill, T. C. J., Huffman, J. A., DeMott, P. J., and Bertram, A. K.: The micro-orifice uniform deposit impactor–droplet freezing technique (MOUDI-DFT) for measuring concentrations of ice nucleating particles as a function of size: improvements and initial validation, Atmos. Meas. Tech., 8, 2449–2462, https://doi.org/10.5194/amt-8-2449-2015, 2015.
Mazur, P.: Freezing of living cells: mechanisms and implications, Am. J. Physiol. Physiol., 247, C125–C142, https://doi.org/10.1152/ajpcell.1984.247.3.C125, 1984.
McCluskey, C. S., Hill, T. C. J., Sultana, C. M., Laskina, O., Trueblood, J., Santander, M. V, Beall, C. M., Michaud, J. M., Kreidenweis, S. M., Prather, K. A., Grassian, V., and DeMott, P. J.: A Mesocosm Double Feature: Insights into the Chemical Makeup of Marine Ice Nucleating Particles, J. Atmos. Sci., 75, 2405–2423, https://doi.org/10.1175/JAS-D-17-0155.1, 2018.
McElfresh, C., Harrington, T., and Vecchio, K. S.: Application of a novel new multispectral nanoparticle tracking technique, Meas. Sci. Technol., 29, 65002, https://doi.org/10.1088/1361-6501/aab940, 2018.
Michaud, A. B., Dore, J. E., Leslie, D., Lyons, W. B., Sands, D. C., and Priscu, J. C.: Biological ice nucleation initiates hailstone formation, J. Geophys. Res.-Atmos., 119, 12186–12197, https://doi.org/10.1002/2014JD022004, 2014.
Perkins, R. J., Gillette, S. M., Hill, T. C. J., and DeMott, P. J.: The Labile Nature of Ice Nucleation by Arizona Test Dust, ACS Earth Sp. Chem., 4, 133–141, https://doi.org/10.1021/acsearthspacechem.9b00304, 2020.
Petters, M. D. and Wright, T. P.: Revisiting ice nucleation from precipitation samples, Geophys. Res. Lett., 42, 8758–8766, https://doi.org/10.1002/2015GL065733, 2015.
Polen, M., Lawlis, E., and Sullivan, R. C.: The unstable ice nucleation properties of Snomax® bacterial particles, J. Geophys. Res.-Atmos., 121, 11666–11678, https://doi.org/10.1002/2016JD025251, 2016.
Rangel-Alvarado, R. B., Nazarenko, Y., and Ariya, P. A.: Snow-borne nanosized particles: Abundance, distribution, composition, and significance in ice nucleation processes, J. Geophys. Res.-Atmos., 120, 11760–11774, https://doi.org/10.1002/2015JD023773, 2015.
Rogers, D. C., DeMott, P. J., Kreidenweis, S. M., and Chen, Y.: Measurements of ice nucleating aerosols during SUCCESS, Geophys. Res. Lett., 25, 1383, https://doi.org/10.1029/97GL03478, 1998.
Schnell, R. C.: Ice Nuclei in Seawater, Fog Water and Marine Air off the Coast of Nova Scotia: Summer 1975, J. Atmos. Sci., 34, 1299–1305, https://doi.org/10.1175/1520-0469(1977)034<1299:INISFW>2.0.CO;2, 1977.
Stopelli, E., Conen, F., Zimmermann, L., Alewell, C., and Morris, C. E.: Freezing nucleation apparatus puts new slant on study of biological ice nucleators in precipitation, Atmos. Meas. Tech., 7, 129–134, https://doi.org/10.5194/amt-7-129-2014, 2014.
Stopelli, E., Conen, F., Morris, C. E., Herrmann, E., Bukowiecki, N., and Alewell, C.: Ice nucleation active particles are efficiently removed by precipitating clouds, Sci. Rep., 5, 16433, https://doi.org/10.1038/srep16433, 2015.
Stopelli, E., Conen, F., Guilbaud, C., Zopfi, J., Alewell, C., and Morris, C. E.: Ice nucleators, bacterial cells and Pseudomonas syringae in precipitation at Jungfraujoch, Biogeosciences, 14, 1189–1196, https://doi.org/10.5194/bg-14-1189-2017, 2017.
Tan, I., Storelvmo, T., and Zelinka, M. D.: Observational constraints on mixed-phase clouds imply higher climate sensitivity, Science, 352, 224–227, https://doi.org/10.1126/science.aad5300, 2016.
Vali, G.: Sizes of Atmospheric Ice Nuclei, Nature, 212, 384–385, https://doi.org/10.1038/212384a0, 1966.
Vali, G.: Freezing Nucleus Content of Hail and Rain in Alberta, J. Appl. Meteorol., 10, 73–78, 1971.
Vali, G.: Comments on “Freezing Nuclei Derived from Soil Particles,” J. Atmos. Sci., 31, 1457–1459, https://doi.org/10.1175/1520-0469(1974)031<1457:CONDFS>2.0.CO;2, 1974.
Vasebi, Y., Mechan Llontop, M. E., Hanlon, R., Schmale III, D. G., Schnell, R., and Vinatzer, B. A.: Comprehensive characterization of an aspen (Populus tremuloides) leaf litter sample that maintained ice nucleation activity for 48 years, Biogeosciences, 16, 1675–1683, https://doi.org/10.5194/bg-16-1675-2019, 2019.
Wex, H., Augustin-Bauditz, S., Boose, Y., Budke, C., Curtius, J., Diehl, K., Dreyer, A., Frank, F., Hartmann, S., Hiranuma, N., Jantsch, E., Kanji, Z. A., Kiselev, A., Koop, T., Möhler, O., Niedermeier, D., Nillius, B., Rösch, M., Rose, D., Schmidt, C., Steinke, I., and Stratmann, F.: Intercomparing different devices for the investigation of ice nucleating particles using Snomax® as test substance, Atmos. Chem. Phys., 15, 1463–1485, https://doi.org/10.5194/acp-15-1463-2015, 2015.
Wex, H., Huang, L., Zhang, W., Hung, H., Traversi, R., Becagli, S., Sheesley, R. J., Moffett, C. E., Barrett, T. E., Bossi, R., Skov, H., Hünerbein, A., Lubitz, J., Löffler, M., Linke, O., Hartmann, M., Herenz, P., and Stratmann, F.: Annual variability of ice-nucleating particle concentrations at different Arctic locations, Atmos. Chem. Phys., 19, 5293–5311, https://doi.org/10.5194/acp-19-5293-2019, 2019.
Whale, T. F., Murray, B. J., O'Sullivan, D., Wilson, T. W., Umo, N. S., Baustian, K. J., Atkinson, J. D., Workneh, D. A., and Morris, G. J.: A technique for quantifying heterogeneous ice nucleation in microlitre supercooled water droplets, Atmos. Meas. Tech., 8, 2437–2447, https://doi.org/10.5194/amt-8-2437-2015, 2015.
Wilson, T. W., Ladino, L. A., Alpert, P. A., Breckels, M. N., Brooks, I. M., Browse, J., Burrows, S. M., Carslaw, K. S., Huffman, J. A., Judd, C., Kilthau, W. P., Mason, R. H., McFiggans, G., Miller, L. a., Nájera, J. J., Polishchuk, E., Rae, S., Schiller, C. L., Si, M., Temprado, J. V., Whale, T. F., Wong, J. P. S., Wurl, O., Yakobi-Hancock, J. D., Abbatt, J. P. D., Aller, J. Y., Bertram, A. K., Knopf, D. A., and Murray, B. J.: A marine biogenic source of atmospheric ice-nucleating particles, Nature, 525, 234–238, https://doi.org/10.1038/nature14986, 2015.
Wright, T. P., Hader, J. D., McMeeking, G. R., and Petters, M. D.: High relative humidity as a trigger for widespread release of ice nuclei, Aerosol Sci. Tech., 48, i–v, https://doi.org/10.1080/02786826.2014.968244, 2014.
Yang, J., Wang, Z., Heymsfield, A. J., DeMott, P. J., Twohy, C. H., Suski, K. J., and Toohey, D. W.: High ice concentration observed in tropical maritime stratiform mixed-phase clouds with top temperatures warmer than −8 ∘C, Atmos. Res., 233, 104719, https://doi.org/10.1016/j.atmosres.2019.104719, 2020.