the Creative Commons Attribution 4.0 License.
the Creative Commons Attribution 4.0 License.
 | 03 Dec 2020
Simultaneous detection of atmospheric HONO and NO2 utilising an IBBCEAS system based on an iterative algorithm
Ke Tang
Min Qin
Wu Fang
Fanhao Meng
Kaidi Ye
Helu Zhang
Pinhua Xie
Yabai He
Wenbin Xu
Jianguo Liu
Wenqing Liu
We present an improved incoherent broadband cavity-enhanced absorption spectroscopy (IBBCEAS) system based on an iterative retrieval algorithm for the simultaneous detection of atmospheric nitrous acid (HONO) and nitrogen dioxide (NO2). The conventional IBBCEAS retrieval algorithm depends on the absolute change in the light intensity, which requires high light source stability and the stable transmission of the light intensity of all optical components. The new algorithm has an iterative module to obtain the effective absorption optical path length, and the concentrations of HONO and NO2 are then determined by differential optical absorption spectroscopy (DOAS) retrieval; thus, the method is insensitive to the fluctuation in the absolute light intensity. The robustness of the system is verified by simulating the influence of the relative change in the light intensity on the spectral retrieval results. The effect of nitrogen purging in front of the cavity mirrors on shortening the actual cavity length was measured and corrected using NO2 gas samples. Allan deviation analysis was conducted to determine the system stability, and it indicated that the detection limits (2σ) of HONO and NO2 are 0.08 and 0.14 ppbv at an integration time of 60 s respectively. Furthermore, Kalman filtering was used to improve the measurement precision of the system. The measurement precision at an integration time of 3 s can be improved 4.5-fold by applying Kalman filtering, which is equivalent to the measurement precision at an integration time of 60 s without applying Kalman filtering. The atmospheric HONO and NO2 concentrations were observed by the IBBCEAS system based on an iterative algorithm and were compared with values measured by conventional IBBCEAS.
- Article
(5202 KB) - Full-text XML
- BibTeX
- EndNote


As nitrous acid (HONO) can absorb solar radiation between 300 and 400 nm to form the hydroxyl radical (OH) and nitric oxide (NO), it has been demonstrated that HONO contributes significantly to the OH budget during the daytime (Harrison et al., 1996). Recent studies have shown that the contribution of HONO to OH production plays an important role not only in the morning but also throughout the day (Spataro et al., 2013; Alicke, 2002). It has been reported that the contribution of HONO photolysis to OH production can reach 60 % during the day (Michoud et al., 2012; Lu et al., 2013). However, the exact mechanisms leading to HONO formation are still under discussion. Existing gas-phase sources cannot explain the high concentration of HONO observed during the daytime (Zhou et al., 2002), which indicates unknown sources of strong HONO during the day (Acker et al., 2006; Kleffmann, 2005). Therefore, fast and accurate measurement of the HONO concentration is the premise of studying the atmospheric chemical behaviour of HONO and its contribution to regional oxidation. However, the lifetime of HONO may be only a few minutes with a low concentration during the day, even a few hundred parts per trillion by volume (10−12, pptv) (Laufs et al., 2017; Hou et al., 2016). Therefore, the rapid and accurate detection of HONO has become a challenge.
HONO detection methods are mainly classified into two categories: one is based on wet chemical techniques, and the other is based on spectroscopic methods. The wet chemical methods mainly include denuder absorption–ion chromatography (Denuder-IC; Neftel et al., 1996), gas and aerosol collector (GAC) systems (Dong et al., 2012), stripping coil–ion chromatography (SC-IC; Xue et al., 2019; Cheng et al., 2013), and long-path absorption photometry (LOPAP; Chen et al., 2014; Heland et al., 2001; Kleffmann et al., 2006). These kinds of methods have a lower detection limit and can reach several parts per trillion by volume. However, these methods need to be calibrated to obtain accurate HONO concentrations. Furthermore, maintenance is cumbersome and requires the frequent replacement of the chemical solution. Spectroscopic methods are based on the Beer–Lambert law and quantify the concentration of HONO by measuring its absorption spectrum in a specific wavelength region, which is not easily affected by chemical interference. Spectroscopic methods can be divided into conventional absorption methods and cavity-enhanced methods (Fiedler et al., 2003).
Conventional absorption methods mainly include differential optical absorption spectroscopy (DOAS; Tsai et al., 2018; Qin et al., 2009), Fourier transform infrared spectroscopy (FTIR; Stockwell et al., 2014), and infrared quantum cascade laser (QCL) absorption spectroscopy (Cui et al., 2019). In these methods, the absorption spectrum of gas is obtained by passing the beam through multi-pass cells or a long open path, and the optical path length is the key factor that affects the sensitivity of the system.
The cavity-enhanced methods are based on high-finesse optical cavity-enhanced absorption spectroscopy, mainly including cavity ring-down spectroscopy (CRDS; Wang and Zhang, 2000) and incoherent broadband cavity-enhanced absorption spectroscopy (IBBCEAS; Jordan et al., 2019; Duan et al., 2018; Gherman et al., 2008; Nakashima and Sadanaga, 2017; Donaldson et al., 2014; Scharko et al., 2014; Wu et al., 2014). IBBCEAS methods have a higher spatial resolution and are easier to deploy on different platforms. Compared with CRDS techniques based on a single wavelength, IBBCEAS can achieve simultaneous measurements of multiple gases using a broadband light source.
IBBCEAS technology is such that the light beam is reflected back and forth in a high-finesse optical cavity formed by two high-reflectivity mirrors. An optical cavity of several tens of centimetres can make the effective absorption path length reach several kilometres, thereby improving the detection limit of the system. In recent years, IBBCEAS technology has been demonstrated to apply to HONO field measurements in remote (Duan et al., 2018; Tang et al., 2019) and urban regions (Crilley et al., 2019; Wu et al., 2014; Min et al., 2016; Nakashima and Sadanaga, 2017). Although a large number of HONO intercomparisons between different instruments have been carried out in previous studies (Crilley et al., 2019; Duan et al., 2018; Xue et al., 2019; Kleffmann et al., 2006; Stutz et al., 2010), deviations in HONO measurements between different methods still exist. In a recent field observation, the correlation between different instruments was found to be high (r2>0.97); unfortunately, the absolute concentration difference was observed to reach 39 % (Crilley et al., 2019). Therefore, the factors that affect the accuracy of measurement need to be discussed further.
Conventional IBBCEAS technology retrieves the HONO concentration by measuring the absolute change in the light intensity. It depends heavily on the stability of the instrument and is sensitive to environmental factors, such as temperature and vibration. Recently, some researchers have equated the optical cavity of IBBCEAS to a multi-pass cell and have then determined the gas concentration according to the DOAS retrieval algorithm (Herman et al., 2009; Hoch et al., 2014; Horbanski et al., 2019; Meinen et al., 2010; Platt et al., 2009; Thalman and Volkamer, 2010). Because DOAS retrieval uses the narrowband differential absorption characteristics of a trace gas to quantify the gas concentration, the IBBCEAS system based on the DOAS retrieval is insensitive to the broadband change in light intensity. The key point of this technology is to determine the effective absorption path length so as to determine the gas concentration using the DOAS retrieval. The most common method to correct the effective absorption path length uses the measured optical density (Hoch et al., 2014). However, in this way, as with conventional IBBCEAS, the retrieved gas concentration will be affected by fluctuations in the intensity of the light source. There have also been attempts to calculate the effective absorption optical path using the known absorption of O4 gas, but the measurement accuracy has been limited (Thalman and Volkamer, 2010; Herman et al., 2009). Recently, Horbanski et al. (2019) used an iterative method to calculate the effective absorption optical path and developed a nitrogen dioxide (NO2) instrument, indicating the effectiveness of the method (Horbanski et al., 2019). Compared with NO2, the HONO concentration ranges from parts per trillion by volume to several parts per billion by volume, and the spatial and temporal distributions are highly variable, which brings challenges to the accurate measurement of atmospheric HONO. Therefore, the measurement of HONO requires the IBBCEAS instrument to be highly stabile, and the application of an iterative algorithm is helpful to improve the accuracy of the HONO measurement.
This paper describes the improvement of the IBBCEAS system for the simultaneous detection of atmospheric HONO and NO2. The concentrations of HONO and NO2 are determined by multiple iterations combined with the DOAS retrieval algorithm. The instrument can eliminate the influence of the broadband change in light intensity by using an iterative algorithm and also helps prevent effects from light source instability and mechanical vibration. Moreover, Kalman filtering technology is an effective post-processing technology for gas concentration measurements (Wu et al., 2010; Leleux et al., 2002). Kalman filtering was first applied to the real-time laser absorption spectroscopy measurement of CO2 and NH3 at the part per million by volume level (Leleux et al., 2002). In this work, we applied the Kalman filtering technique to realise trace gas concentration measurements, thereby improving the measurement precision of the system. To our knowledge, this is the first use of the Kalman filtering technique for HONO and NO2 measurements. The capability of our instrument to make fast high-sensitivity measurements of HONO and NO2 is of great significance with respect to understanding the source of HONO and studying its role in atmospheric chemistry.
2.1 Theory of IBBCEAS
The basic idea of the IBBCEAS system based on an iterative algorithm is to use a high-finesse optical cavity to increase the effective absorption light path, thereby improving the detection sensitivity of the instrument, and to use the DOAS retrieval algorithm to determine the gas concentration (Hoch et al., 2014; Herman et al., 2009; Meinen et al., 2010; Platt et al., 2009; Thalman et al., 2015; Thalman and Volkamer, 2010). For this system, the cavity-enhance optical density DCE(λ) is defined as follows (Horbanski et al., 2019):
where ci is the concentration of the gas species i, σi(λ) is the absorption cross section of the gas at wavelength λ, εb(λ) is the broadband extinction caused by Rayleigh scattering and Mie scattering, and is an effective path length.
The DOAS evaluation determines the gas concentrations based on
Here, I0(λ) is the intensity of light passing through the cavity without gas absorption, I(λ) is the intensity of light passing through the cavity with gas absorption, is the differential part of the absorption cross section of the gas, and the polynomial term in Eq. (2) represents the broadband spectral structure in the measurement spectrum other than the differential absorption part. In traditional DOAS, the optical path length is a constant as determined by the physical distance, whereas it is not a constant and has a dependence on the optical density in IBBCEAS (Platt et al., 2009).
The gas concentrations of IBBCEAS measurements can be obtained using the DOAS evaluation. Here, the wavelength-dependent effective absorption optical path is calculated by an iterative algorithm. The implementation of the algorithm is described in Sect. 3.3.
2.2 Optical layout
The IBBCEAS system in this study was based on the research of Duan et al. (2018). The optical layout of the IBBCEAS system is shown in Fig. 1. The light source of the instrument uses a near-ultraviolet light-emitting diode (LED; LED Engin) with a centre wavelength of 368 nm. In order to ensure the stability of the LED light intensity, the LED is mounted to a Peltier device with a heat sink, and the temperature of the LED is stabilised at 20 ± 0.1 ∘C via a thermistor temperature sensor and a PID (proportional integral derivative) controller. The light from the LED is coupled to a long 68 cm optical cavity through the achromatic lens (Edmund Optics). The optical cavity is composed of two high-reflectivity mirrors and a perfluoroalkoxy alkane (PFA) tube with an inner diameter of 22 mm. The high-reflectivity mirror (LAYERTEC) is installed in the adjustment frame at both ends of the optical cavity. The light transmitted through the optical cavity is filtered by a bandpass filter (BG3, Newport), focused by an off-axis parabolic mirror (Edmund Optics), and finally coupled to one end of an optical fibre (600 µm, Ocean Optics). The other end of the optical fibre is connected to a spectrometer (QE65000 Pro, Ocean Optics), and the spectrometer is used to collect the corresponding spectral signal.
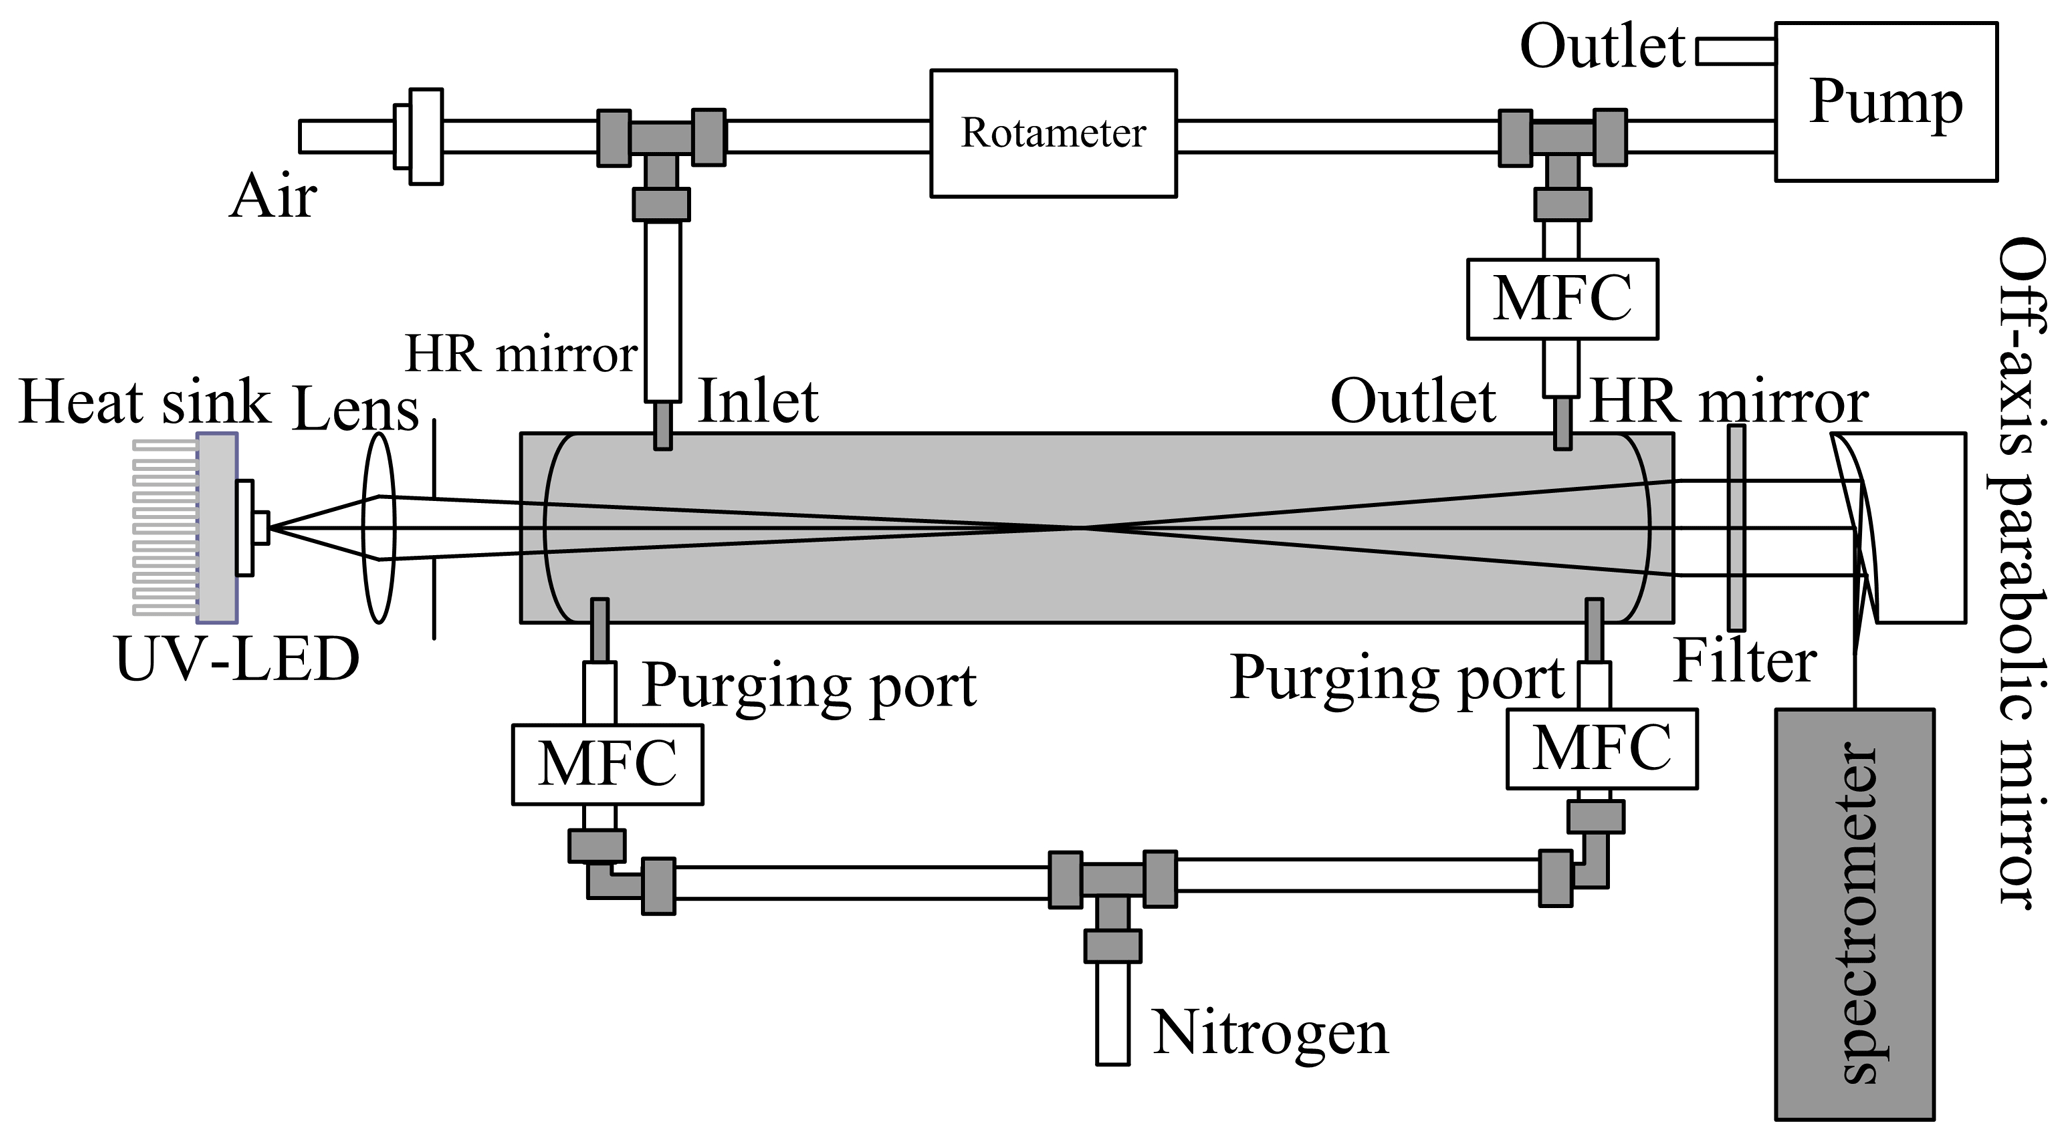
Figure 1The optical layout of the IBBCEAS system. MFC represents the mass flow controller, and HR mirror represents the high-reflectivity mirror.
In order to prevent reflectivity degradation during the measurement due to the adsorption of aerosol or organic species onto the mirror surfaces, the surfaces of the two high-reflectivity mirrors are purged with high-purity nitrogen (99.999 %). The flow rates of the purge are controlled by two mass flow controllers at 0.1 L min−1. The sampling tube of the instrument consists of a PFA tube with an outer diameter of 6 mm. A 0.2 µm polytetrafluorethylene (PTFE) filter membrane is connected to the inlet of the sampling port to prevent particles from entering the optical cavity. A diaphragm pump draws the ambient air into the instrument through the sampling tube at a flow rate of 6 L min−1. The ambient air enters the system and is divided into two paths via a three-way PFA joint: one airflow is discharged from the air outlet, and the other airflow enters the cavity at a flow rate of 1.2 L min−1 using a mass flow controller. The use of this sampling gas path ensures that the residence time of the atmospheric air in the sampling tube can be shortened. It does so by increasing the total sampling flow rate while maintaining a fractional constant flow rate of the cavity, thereby reducing the secondary generation and loss of HONO in the sampling tube. The software control interface is programmed using LabVIEW to ensure the orderly operation of the mass flow controller and spectrometer in the process of instrument operation.
3.1 Determination of mirror reflectivity
As the absorption optical path of the gas in the optical cavity is related to the reflectivity of the mirrors, it is necessary to determine the reflectivity of the high-reflectivity mirrors before the gas concentration is retrieved. According to the method mentioned by Washenfelder et al. (2008), the Rayleigh scattering difference between nitrogen and helium is used to determine the wavelength-dependent reflectivity of the cavity mirrors (R(λ)):
Here, d0 is the cavity length, εRay is the extinction caused by Rayleigh scattering, and and IHe are the light intensity when the cavity is filled with nitrogen and helium respectively.
The accuracy in determining the mirror reflectivity will affect the accuracy of subsequent gas concentration measurements. Therefore, in order to achieve high measurement accuracy, it is necessary to stabilise the gas temperature inside the optical cavity. The high-purity nitrogen (99.999 %) and high-purity helium (99.999 %) are then introduced into the optical cavity in turn, and the corresponding spectra are recorded once the spectra become stable after gas filling. The wavelength-dependent mirror reflectivity is calculated by substituting the ratio of the recorded nitrogen spectrum intensity and helium spectrum intensity into Eq. (3). The resulting dependence of the mirror reflectivity on wavelength is shown in Fig. 2. The red line is the spectrum measured when the cavity is flushed with nitrogen, and the black line is obtained when the cavity is filled with helium. It can be seen that the reflectivity of the mirrors is ∼0.99980 at a wavelength of 368.2 nm.

Figure 2Dependences of the transmission intensity when the cavity is filled with N2 and He gas respectively, and the calculated cavity mirror reflectivity.
3.2 Calibration of the effective cavity length
Considering the effect of mixing between the actual atmospheric gas in the cavity and the nitrogen purge gas within a narrow space in front of the cavity mirrors during measurements, the effective cavity length becomes shorter than its physical length. Calibration experiments are needed to determine the effective cavity length (deff). We determine the value of deff by measuring the effective concentration of an NO2 gas mixture with and without mirror purge gas to the cavity mirrors. The NO2 gas sample is made by mixing a cylinder gas with a nominal 10 ppm NO2 and zero air in a Teflon (FEP) gas bag, which has low adsorption properties. The NO2 gas mixture in the FEP gas bag is then injected into the IBBCEAS system and measured by an iterative algorithm. The inlet flow rate of NO2 was 1 standard litre per minute, and the purging flow rate at both ends of the optical cavity was 0.1 L min−1. The purge gas is opened and closed intermittently during operation of the instrument, and the spectrum at the corresponding time is recorded. The NO2 concentration is retrieved according to the spectra measured during this period. Figure 3 shows the change in the NO2 concentration during purge on and off. The effective concentration of NO2 becomes higher after purge off, and the concentration of NO2 is returned to the previous value again after purge on. This indicates that the mirror reflectivity and the NO2 gas mixture before and after purge off remain unchanged, and the concentration of NO2 is relatively stable during purge on and off. The average concentration of NO2 measured at purge on is 62.64±0.32 ppb, and the average concentration of NO2 measured after purge off is 70.92±0.19 ppb. For a cavity with a physical length (d0) of 68 cm, deff can be calculated according to Eq. (4). The calculated deff is 60.06 cm.
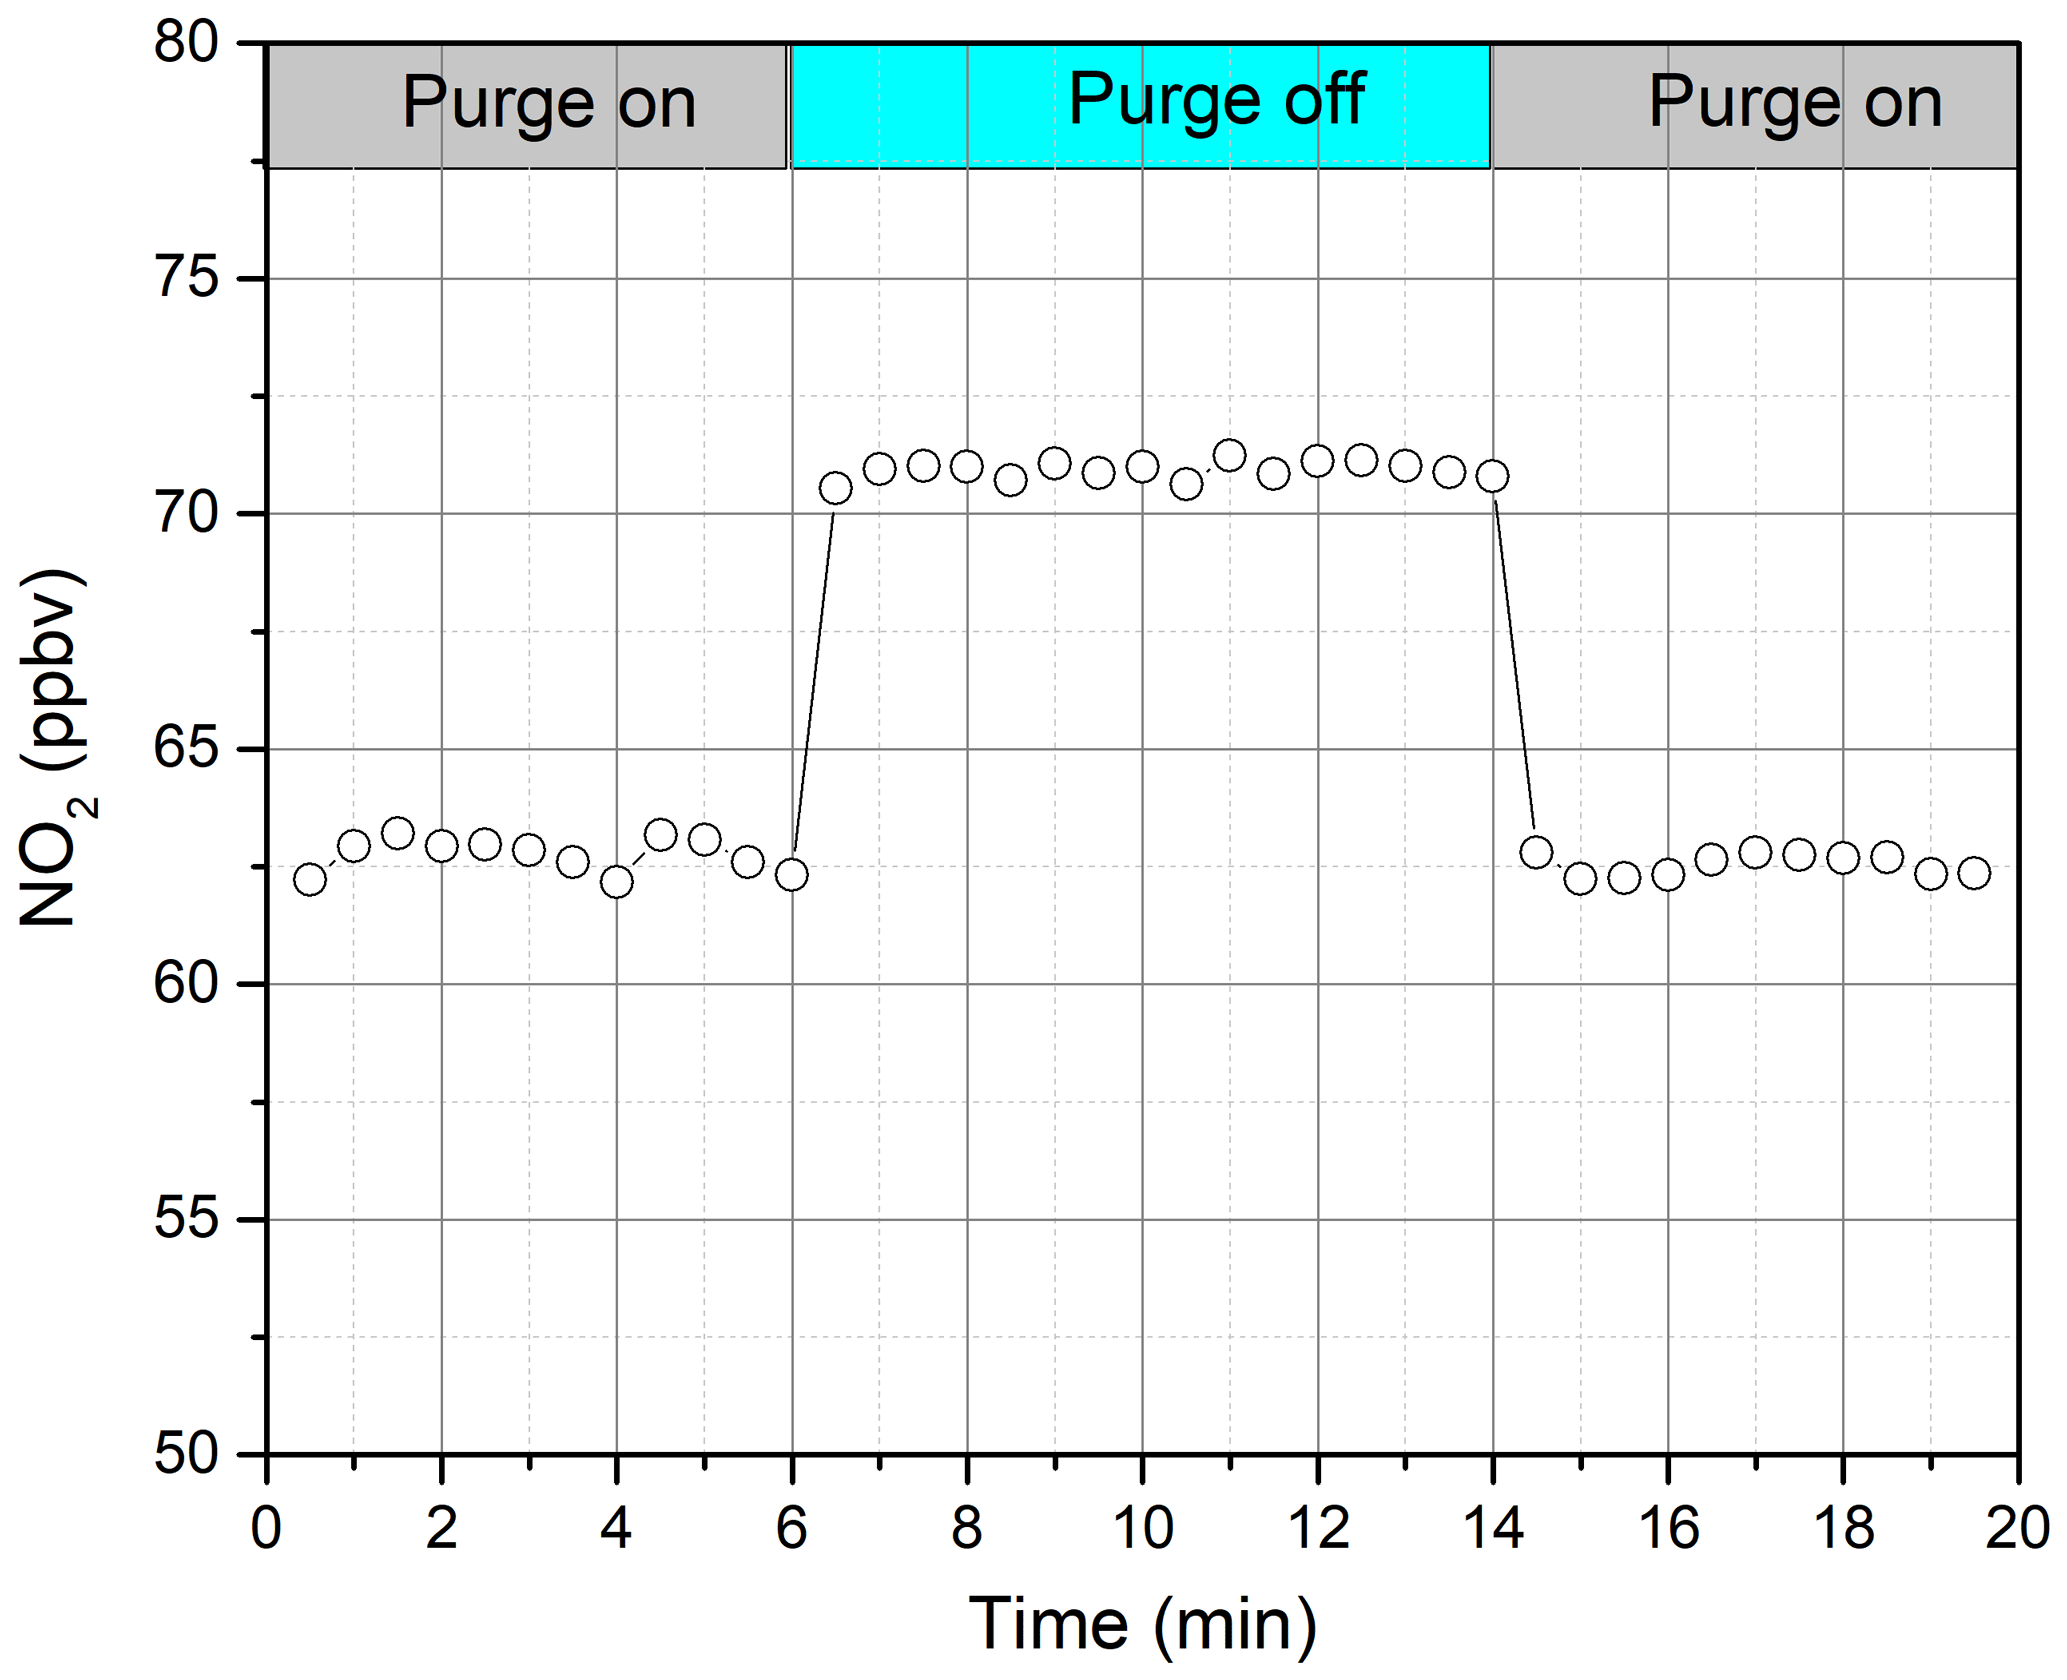
Figure 3The change in the effective NO2 concentrations during purge on and off. The effective cavity length is calculated according to the retrieved concentrations when purging is on and off.
3.3 Determination of the effective absorption optical path and concentration retrieval
For traditional DOAS fitting, the retrieval result is not affected as long as there is no change in the narrowband structure, as the DOAS system is insensitive to the variation of absolute light intensity. The optical absorption path length of a conventional DOAS system is constant. However, in the IBBCEAS system, the effective optical absorption path length is strongly dependent on the wavelength, which is related to the wavelength-dependency of the mirror reflectivity and the intra-cavity absorption. For conventional IBBCEAS, the wavelength-dependence problem is solved by converting the optical density to the extinction absorption, but this method seriously depends on the absolute stability of the light intensity. For the IBBCEAS system based on an iterative algorithm, the absorption optical path is not equal to the average optical path (); thus, needs to be corrected. Previous studies have tried to calculate the effective absorption optical path by using the concentration of known gases, such as O4. However, the measurement accuracy is limited when the relative variation in the wavelength dependence of the path length is corrected with a single wavelength: when the peak wavelength of O4 in the retrieval band is at 380 nm, and the absorption cross section of O4 at 380 nm is 3 times weaker than that at 477 nm, error may occur in the retrieval of the slant column density of O4. According to the description of Horbanski et al. (2019), the scalar correction factor is not suitable for strong differential absorbers, because their absorption band distortion can only be corrected by wavelength-resolved correction factor. Recently, Horbanski et al. (2019) proposed an iterative method to calculate the wavelength-dependent effective absorption optical path length. Through multiple iterative retrieval, the effective absorption optical path can be finally determined. Because the filter membrane is added to the front end of the sampling port of the system in this work, the influence of gas absorption and Rayleigh scattering is only considered in the retrieval of concentration. According to Platt et al. (2009), the cavity-enhanced DCE(λ) of the system can be defined as follows:
where Itot and Itot0 are the light intensity detected with and without gas absorption in the optical cavity respectively, n indicates the nth intra-cavity reflection, and the total transmission can be considered as a sum of the transmissions of all of the individual intra-cavity sub-beams of consecutive mirror reflections. Using the Beer–Lambert law, Eq. (5) can be changed to
According to the description of Platt et al. (2009), the relationship between the effective optical path length () and the optical density (DCE(λ)) is as follows:
By substituting Eq. (6) into Eq. (7), the can be calculated:
Therefore, if we know the optical density, we can correct the effective absorption optical path, and we can continuously approach the real effective absorption optical path using multiple iterative retrieval methods. Horbanski et al. (2019) carried out a detailed derivation; here, a brief introduction of the steps used is given:
-
Assuming that the concentrations of HONO and NO2 are known, the optical density can be calculated according to Eq. (6).
-
Combined with the optical density and lens reflectivity calculated in Eq. (1), the effective absorption optical path is calculated according to Eq. (8).
-
Using the DOAS method to fit DCE, meas(λ) and , new HONO and NO2 concentration values are obtained.
-
The HONO and NO2 concentrations obtained in Step 3 are substituted into Step 1 to recalculate the optical density; thus, Step 1, Step 2, and Step 3 are repeated until the changes in the HONO and NO2 concentrations with respect to their values in the previous iteration become less than an allowable tolerance range. A stop condition for the iteration is that the concentration difference between two retrievals is less than the fit error. The final retrieval results of the HONO and NO2 concentrations are obtained. The retrieval steps are shown in Fig. 4.
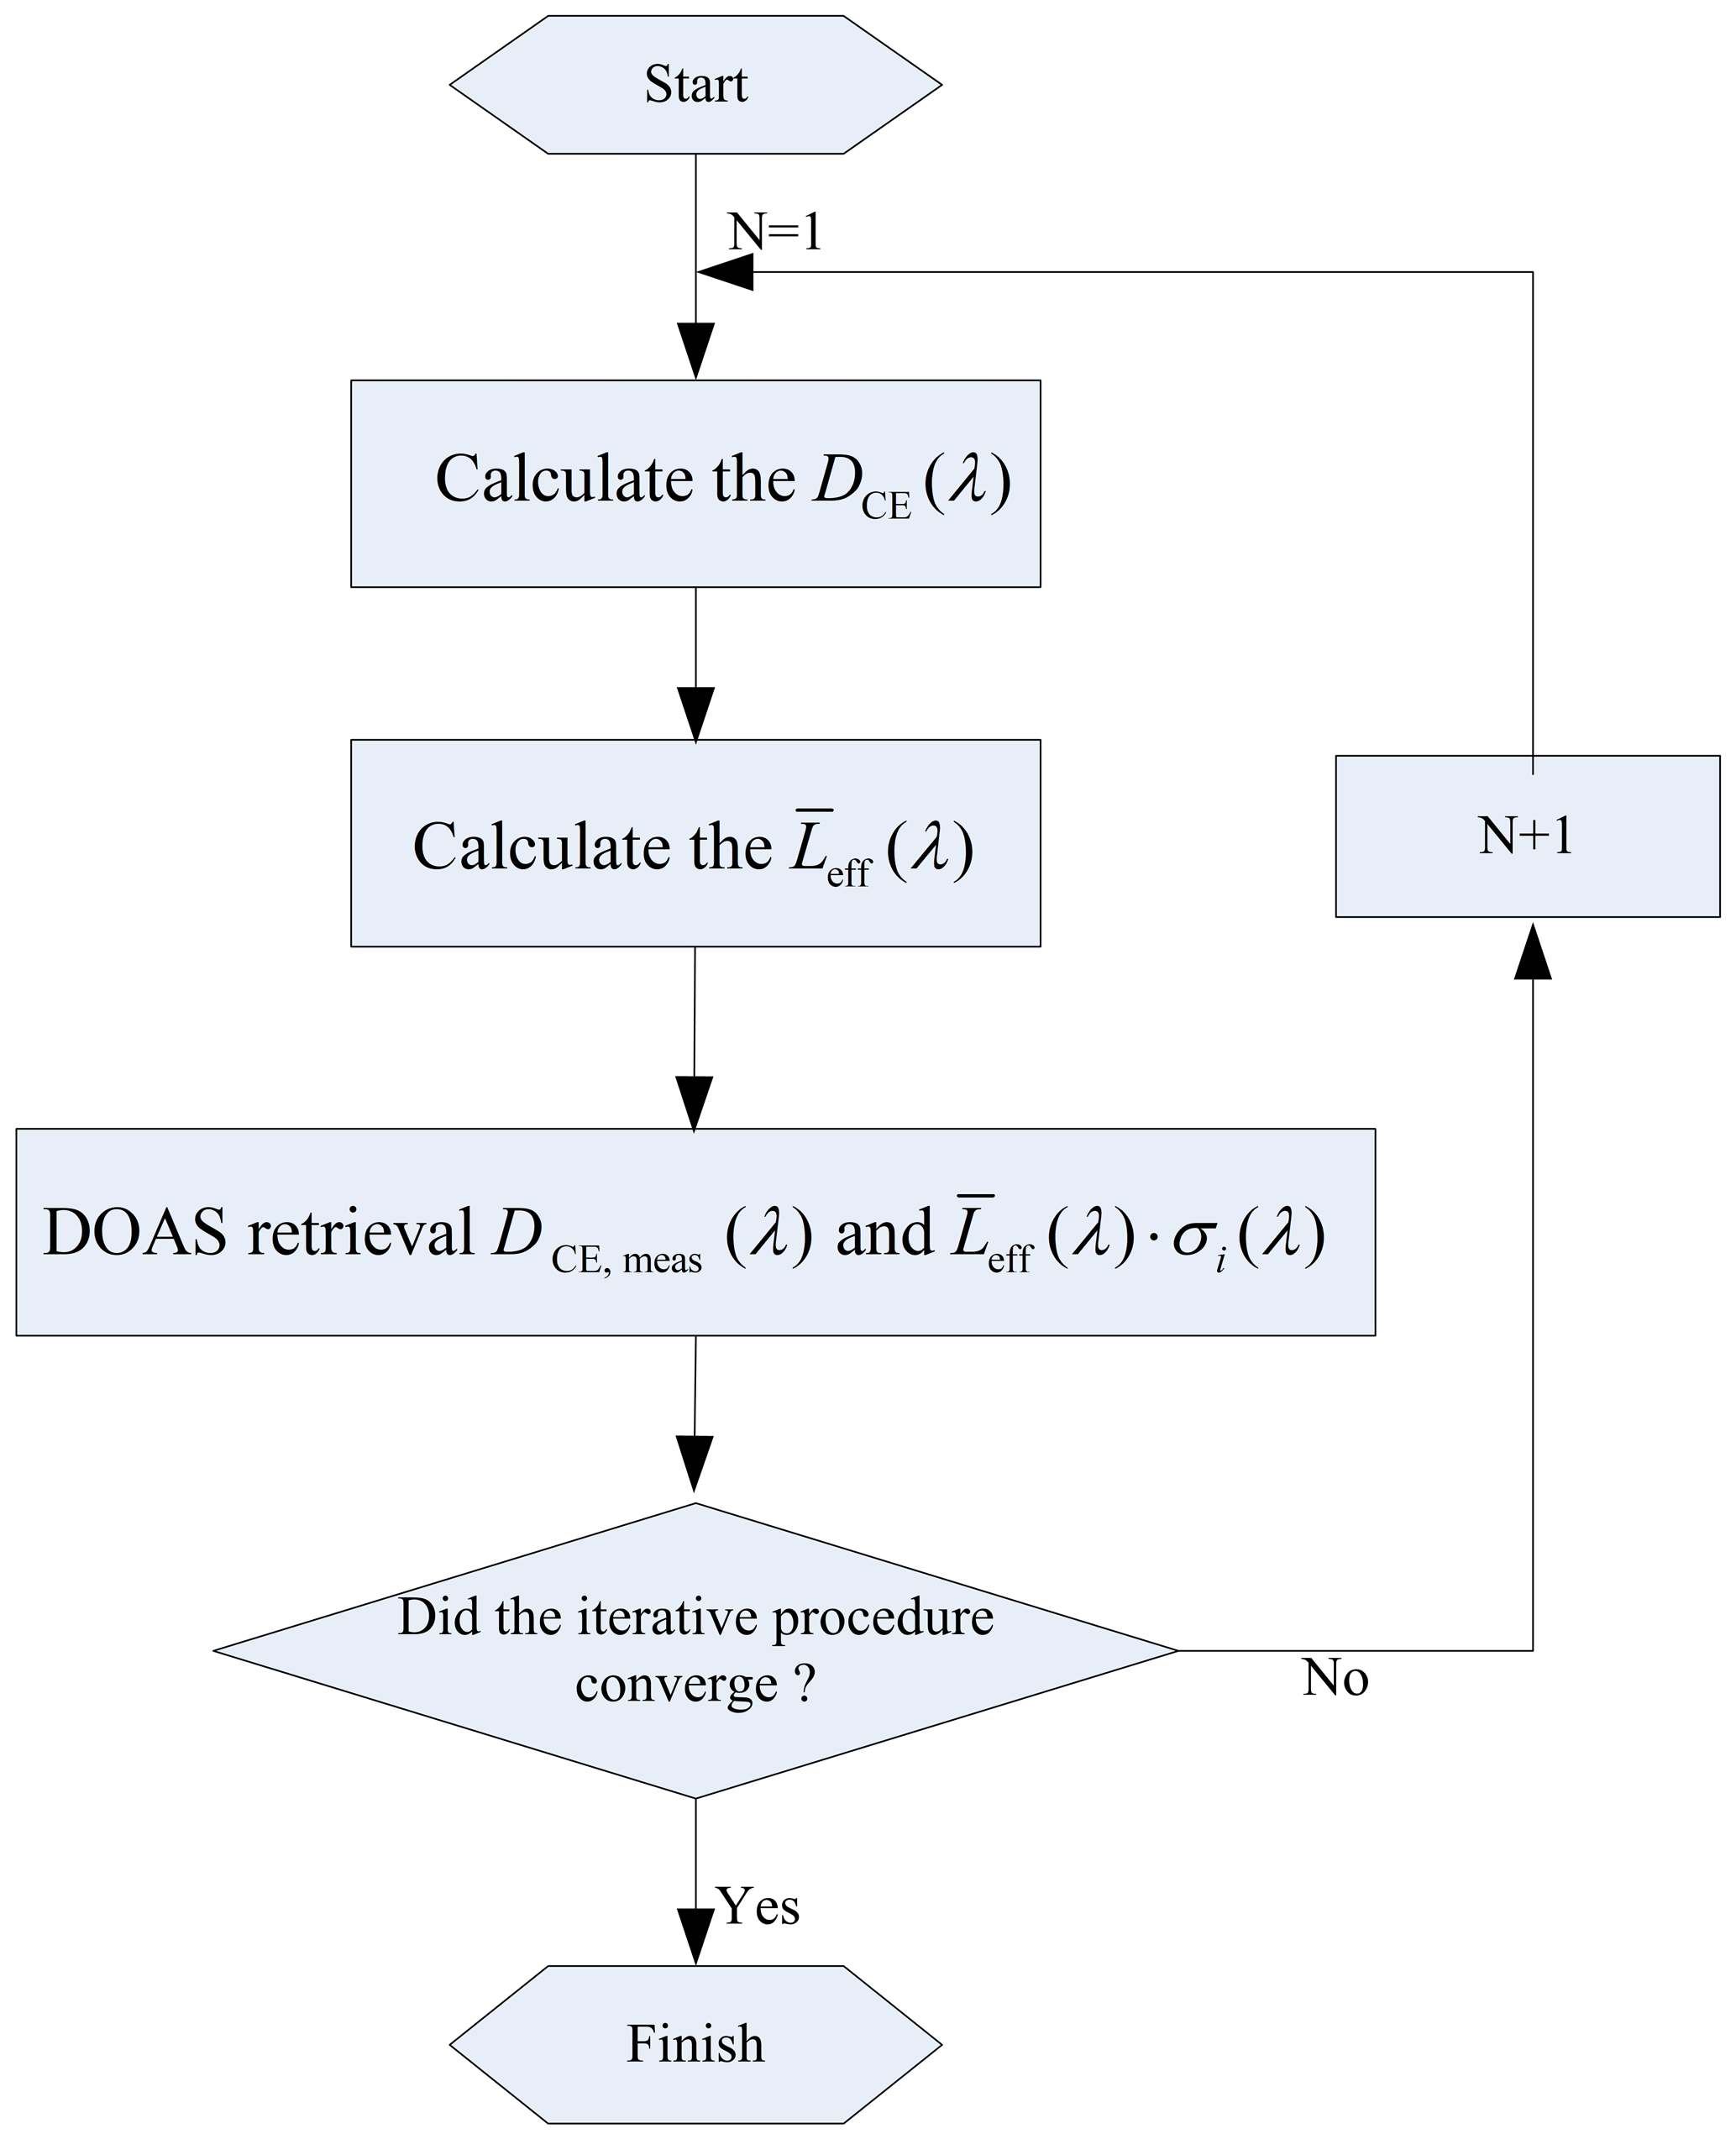
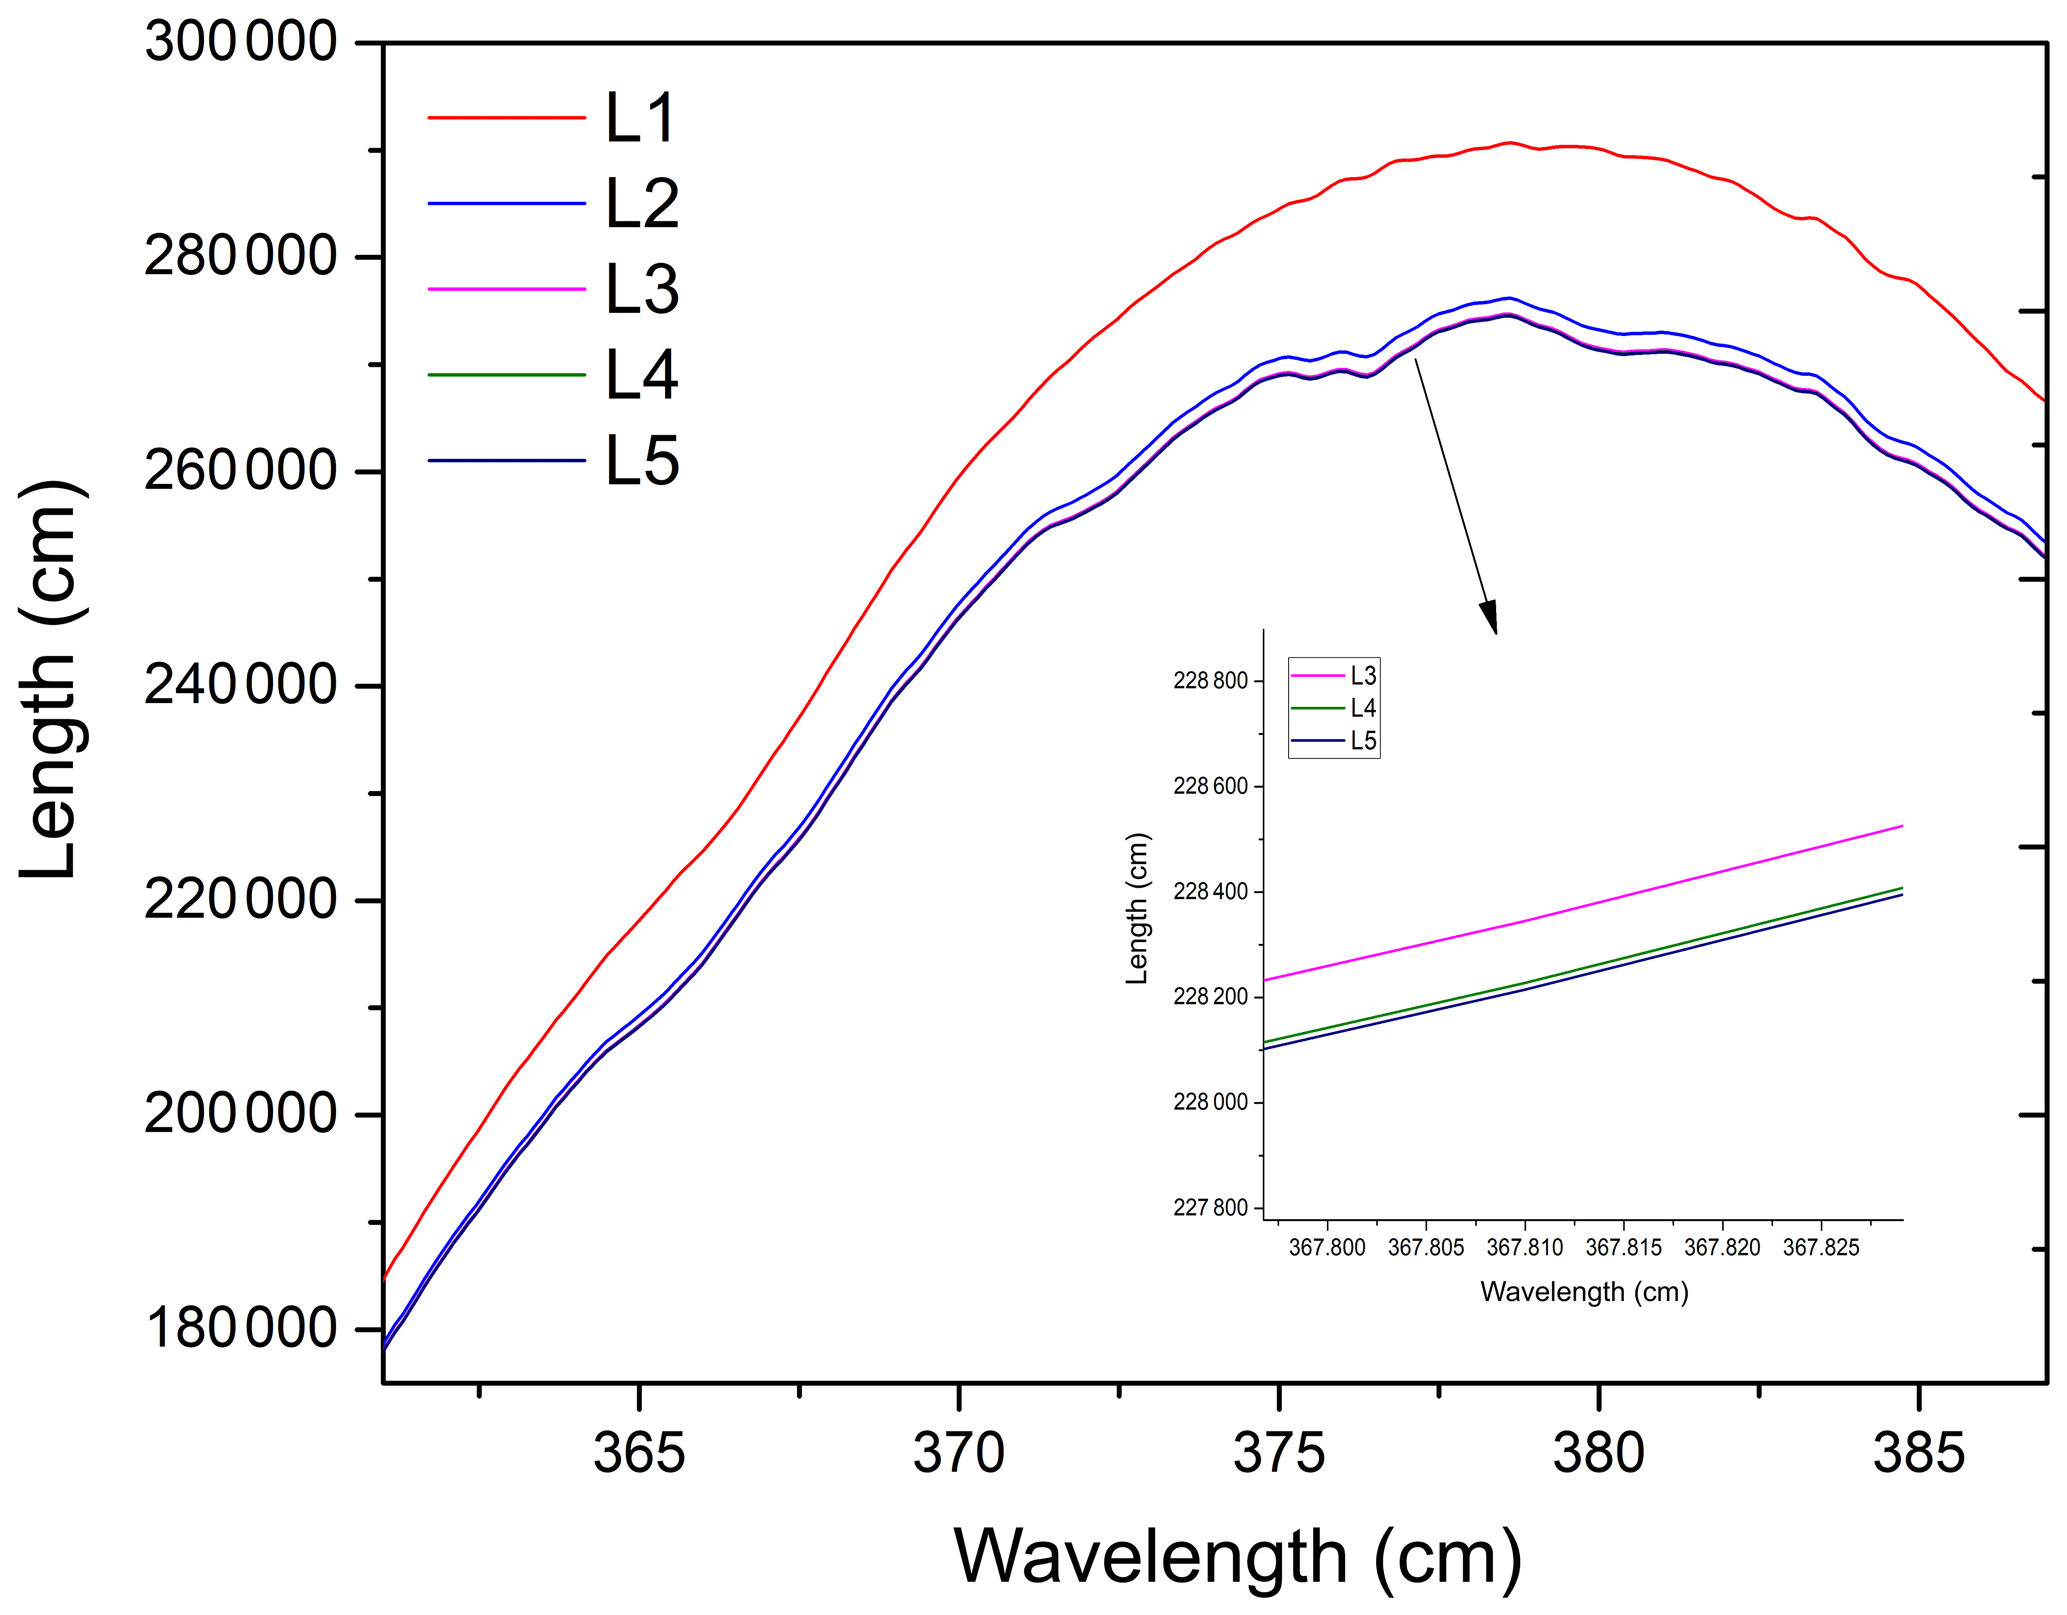
Figure 5Example of the effective absorption optical path lengths calculated during the consecutive iterations (L1, L2, L3, L4, and L5) of an iterative retrieval algorithm. As the number of iterations increases, the effective absorption optical path gradually converges.
All of the data processing is based on DOASIS software (Kraus, 2006). The algorithm takes the high-resolution cross sections of HONO (Stutz et al., 2000), NO2 (Voigt et al., 2002), and O4 (Greenblatt et al., 1990) as the input, and it then convolutes these high-resolution cross sections with the instrument functions of 0.49 nm FWHM (full width at half maximum). The fitting range of the spectrum is from 363 to 388 nm. Figure 5 shows the change in the effective optical path length in an iterative algorithm retrieval, where L1, L2, L3, L4, and L5 are the corresponding absorption optical paths from the zero iteration to the fourth iteration respectively. The effective absorption optical path length is finally converged as the number of iterations increases. Based on the effective absorption optical path length at the final iteration, the real concentration can be obtained according to the DOAS fitting. Figure 6 shows the final HONO and NO2 concentrations obtained using the iterative algorithm mentioned above in the actual large spectrum retrieval. The HONO and NO2 concentrations obtained by the final fitting are 0.78 and 29.18 ppbv respectively.

Figure 6Examples of the spectral retrieval of O4, NO2, and HONO in the measured atmosphere: (a) the blue line shows the absorption spectrum of O4, and the red line shows the fitting spectrum; (b) the blue line shows the absorption spectrum of NO2, the red line shows the fitting spectrum, and the retrieved NO2 concentration is 29.18 ppbv; (c) the blue line shows the absorption spectrum of HONO, the red line shows the fitting spectrum of HONO, and the retrieved HONO concentration is 0.78 ppbv; (d) the blue line shows the differential optical density line, and the red line shows the fitting differential optical density; (e) the blue line shows the fitting residuals.
3.4 Detection limit and uncertainty of the system
The Allan deviation is often used to calculate the sensitivity and stability of the system. Ideally, the detection sensitivity of the system can be improved by averaging successive measurements or by integrating the signal over a longer time period. However, actual measurement processes are affected by instrument drifts and other noise contributions. The system can only achieve an optimal detection sensitivity before slow-varying factors become dominant. Therefore, Allan deviation can be used to describe the overall performance and stability of the system. Zero air was introduced into the optical cavity at a flow rate of 0.1 L min−1, and 10 000 spectra were continuously recorded. The integration time of each spectrum was 3 s, and each spectrum was fitted using the DOAS algorithm to obtain the HONO and NO2 concentrations. Then the Allan deviation was then calculated according to Eq. (9):
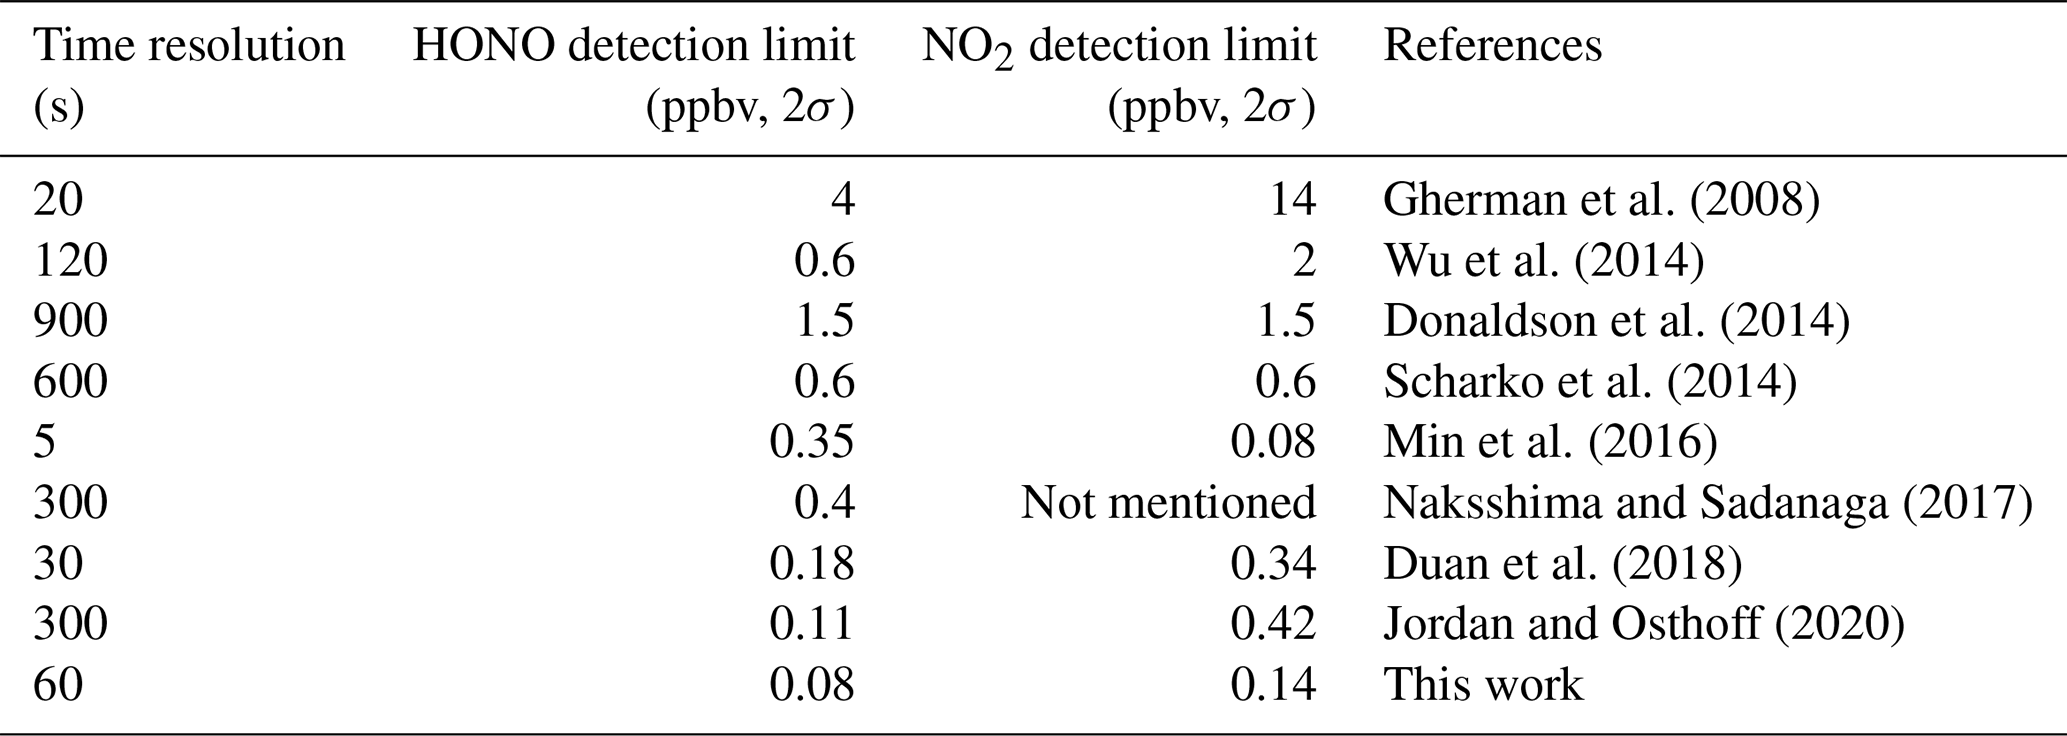
where m is the number of time series, and yk(τ) is the average concentration during a time interval of τ. Figure 7 shows the variation in the Allan deviation in the system with integration time. Under an integration time of 60 s, the detection limits (2σ) of HONO and NO2 are 0.08 and 0.14 ppbv respectively. Table 1 shows the detection limits for HONO and NO2 measured by different IBBCEAS instruments reported in the literature. Our system has higher detection sensitivity than most other instruments. The Allan deviation continuously decreases over the average time for several hours. This shows that the instrument's performance is very stable.
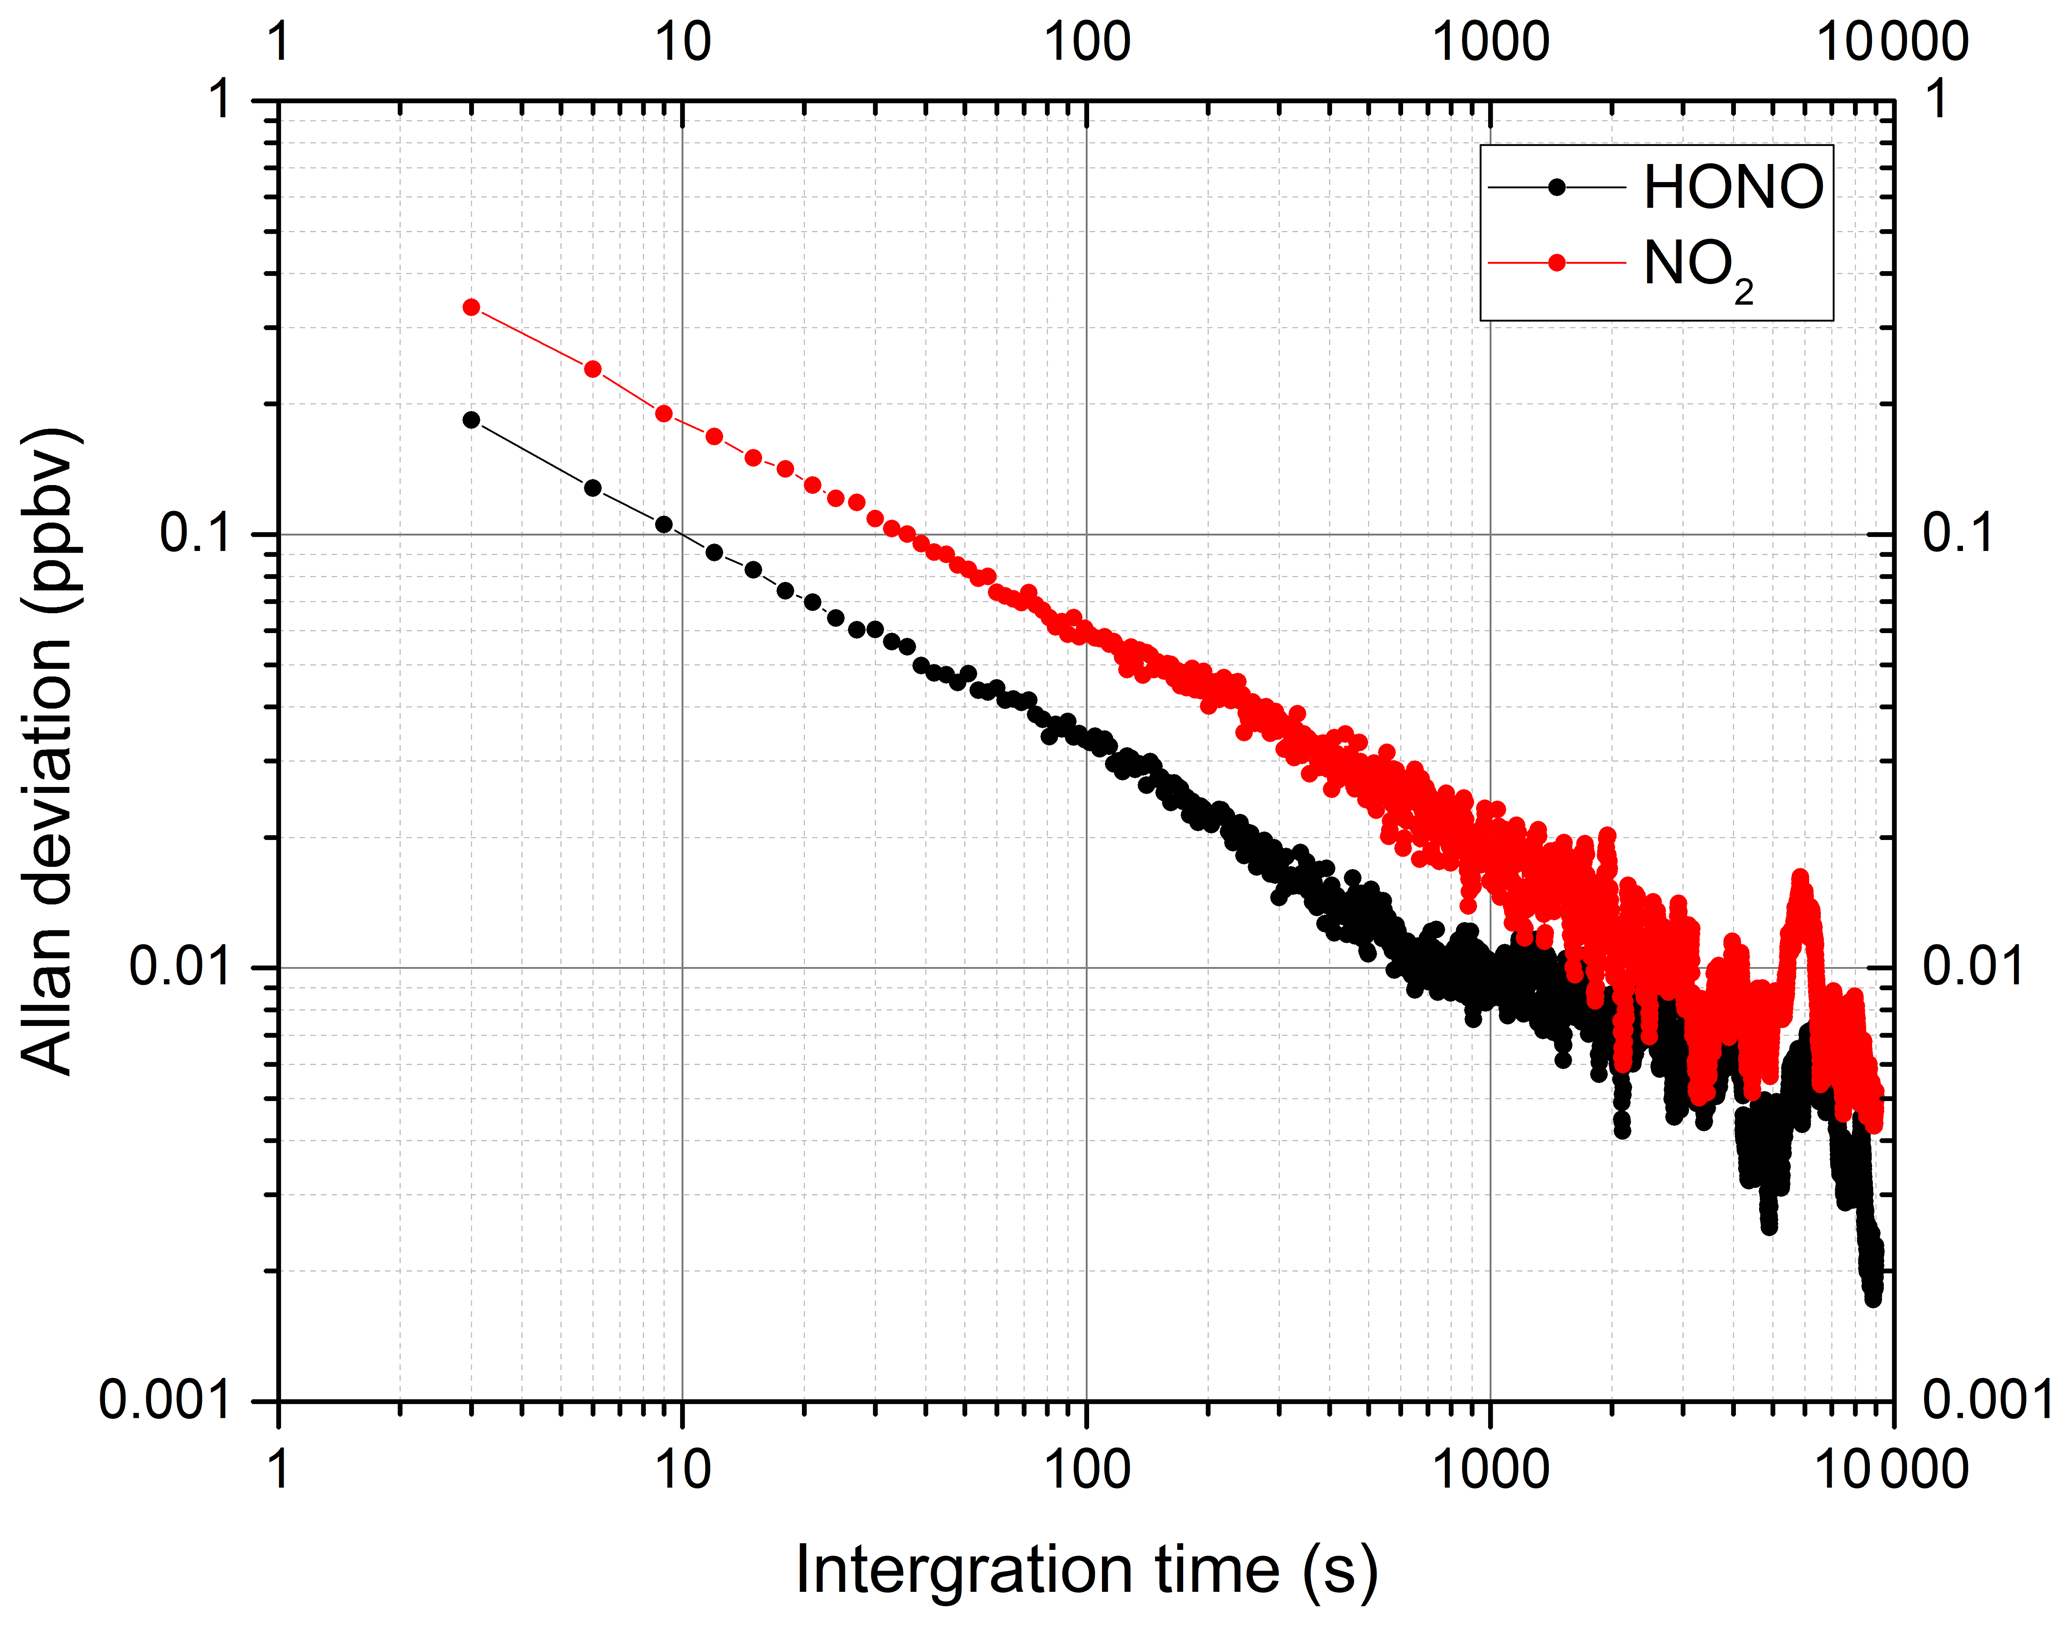
Figure 7Allan deviation plots for the measurements of HONO and NO2. The Allan deviations of HONO and NO2 are 0.08 and 0.14 ppbv at an integration time of 60 s respectively.
Table 1The detection limits of HONO and NO2 measured by various IBBCEAS instruments.
The uncertainty of the system may be determined by a Gaussian error propagation. The uncertainty is mainly composed of contributions from the uncertainties in absorption cross sections of the spectral features, the mirrors' reflectivity, the effective cavity length, and the temperature and pressure in the cavity: the uncertainty of the mirrors' reflectivity is 5 %; the uncertainty of the effective cavity length is 3 %; the uncertainty of the temperature and pressure in the cavity is 1 %; and the uncertainty of the fit retrieval is 4 %. According to the literature, the uncertainty of the NO2 and HONO absorption cross sections is 4 % (Voigt et al., 2002) and 5 % (Stutz et al., 2000) respectively. Therefore, the total uncertainty of the instrument is about 8.1 % for NO2 measurements and about 8.7 % for HONO measurements.
3.5 Effect of light intensity fluctuation
In order to verify the insensitivity of IBBCEAS based on an iterative algorithm to the broadband change in the light intensity, we carried out a light intensity fluctuation experiment. By adjusting the angle of the off-axis parabolic mirror to change the intensity of the spectrum, the original lamp spectrum is attenuated by 95 %, 90 %, 85 %, 80 %, and 75 % respectively. After adjusting the light intensity of the lamp spectrum every time, the actual atmospheric HONO concentration is measured. Finally, three methods are used to retrieve the measured atmospheric spectrum: the original lamp spectrum combined with an iterative algorithm is used for the concentration retrieval in method 1, the original lamp spectrum combined with conventional IBBCEAS retrieval algorithm is used for the concentration retrieval in method 2, and the lamp spectrum after each change combined with the conventional IBBCEAS retrieval algorithm is used for the concentration retrieval in method 3. In order to ensure that the light intensity is not affected by external environmental factors during the measurement process and to avoid the influence of the light intensity fluctuation caused by external environmental factors on the measurement results, the measurement time of each cycle should be as short as possible. Figure 8 shows the retrieval results for the three methods under different relative light source intensities. The results show that the retrieval results of method 2 are greatly influenced by the fluctuation in the light intensity, whereas the difference between the retrieval results of methods 1 and 3 is relatively small. Figure 9 shows the fitting results of method 2 and method 3 after light intensity changes. When the light intensity changes, the root mean square (RMS) of the fitting residual increases 2-fold. Although the HONO concentration can also be fitted well after the light intensity changes in method 2, the attenuation signal of the lamp spectrum is considered to be caused by HONO absorption, which leads to the high measurement result. Method 3 uses the lamp spectrum after the change in the light intensity to participate in the retrieval, which ensures the absolute stability of the light intensity. However, the lamp spectrum after the light intensity change cannot be obtained in time in the actual measurement. Method 1 always uses the original lamp spectrum to participate in the retrieval, which shows that it is independent of the fluctuations in the light intensity of the light source.
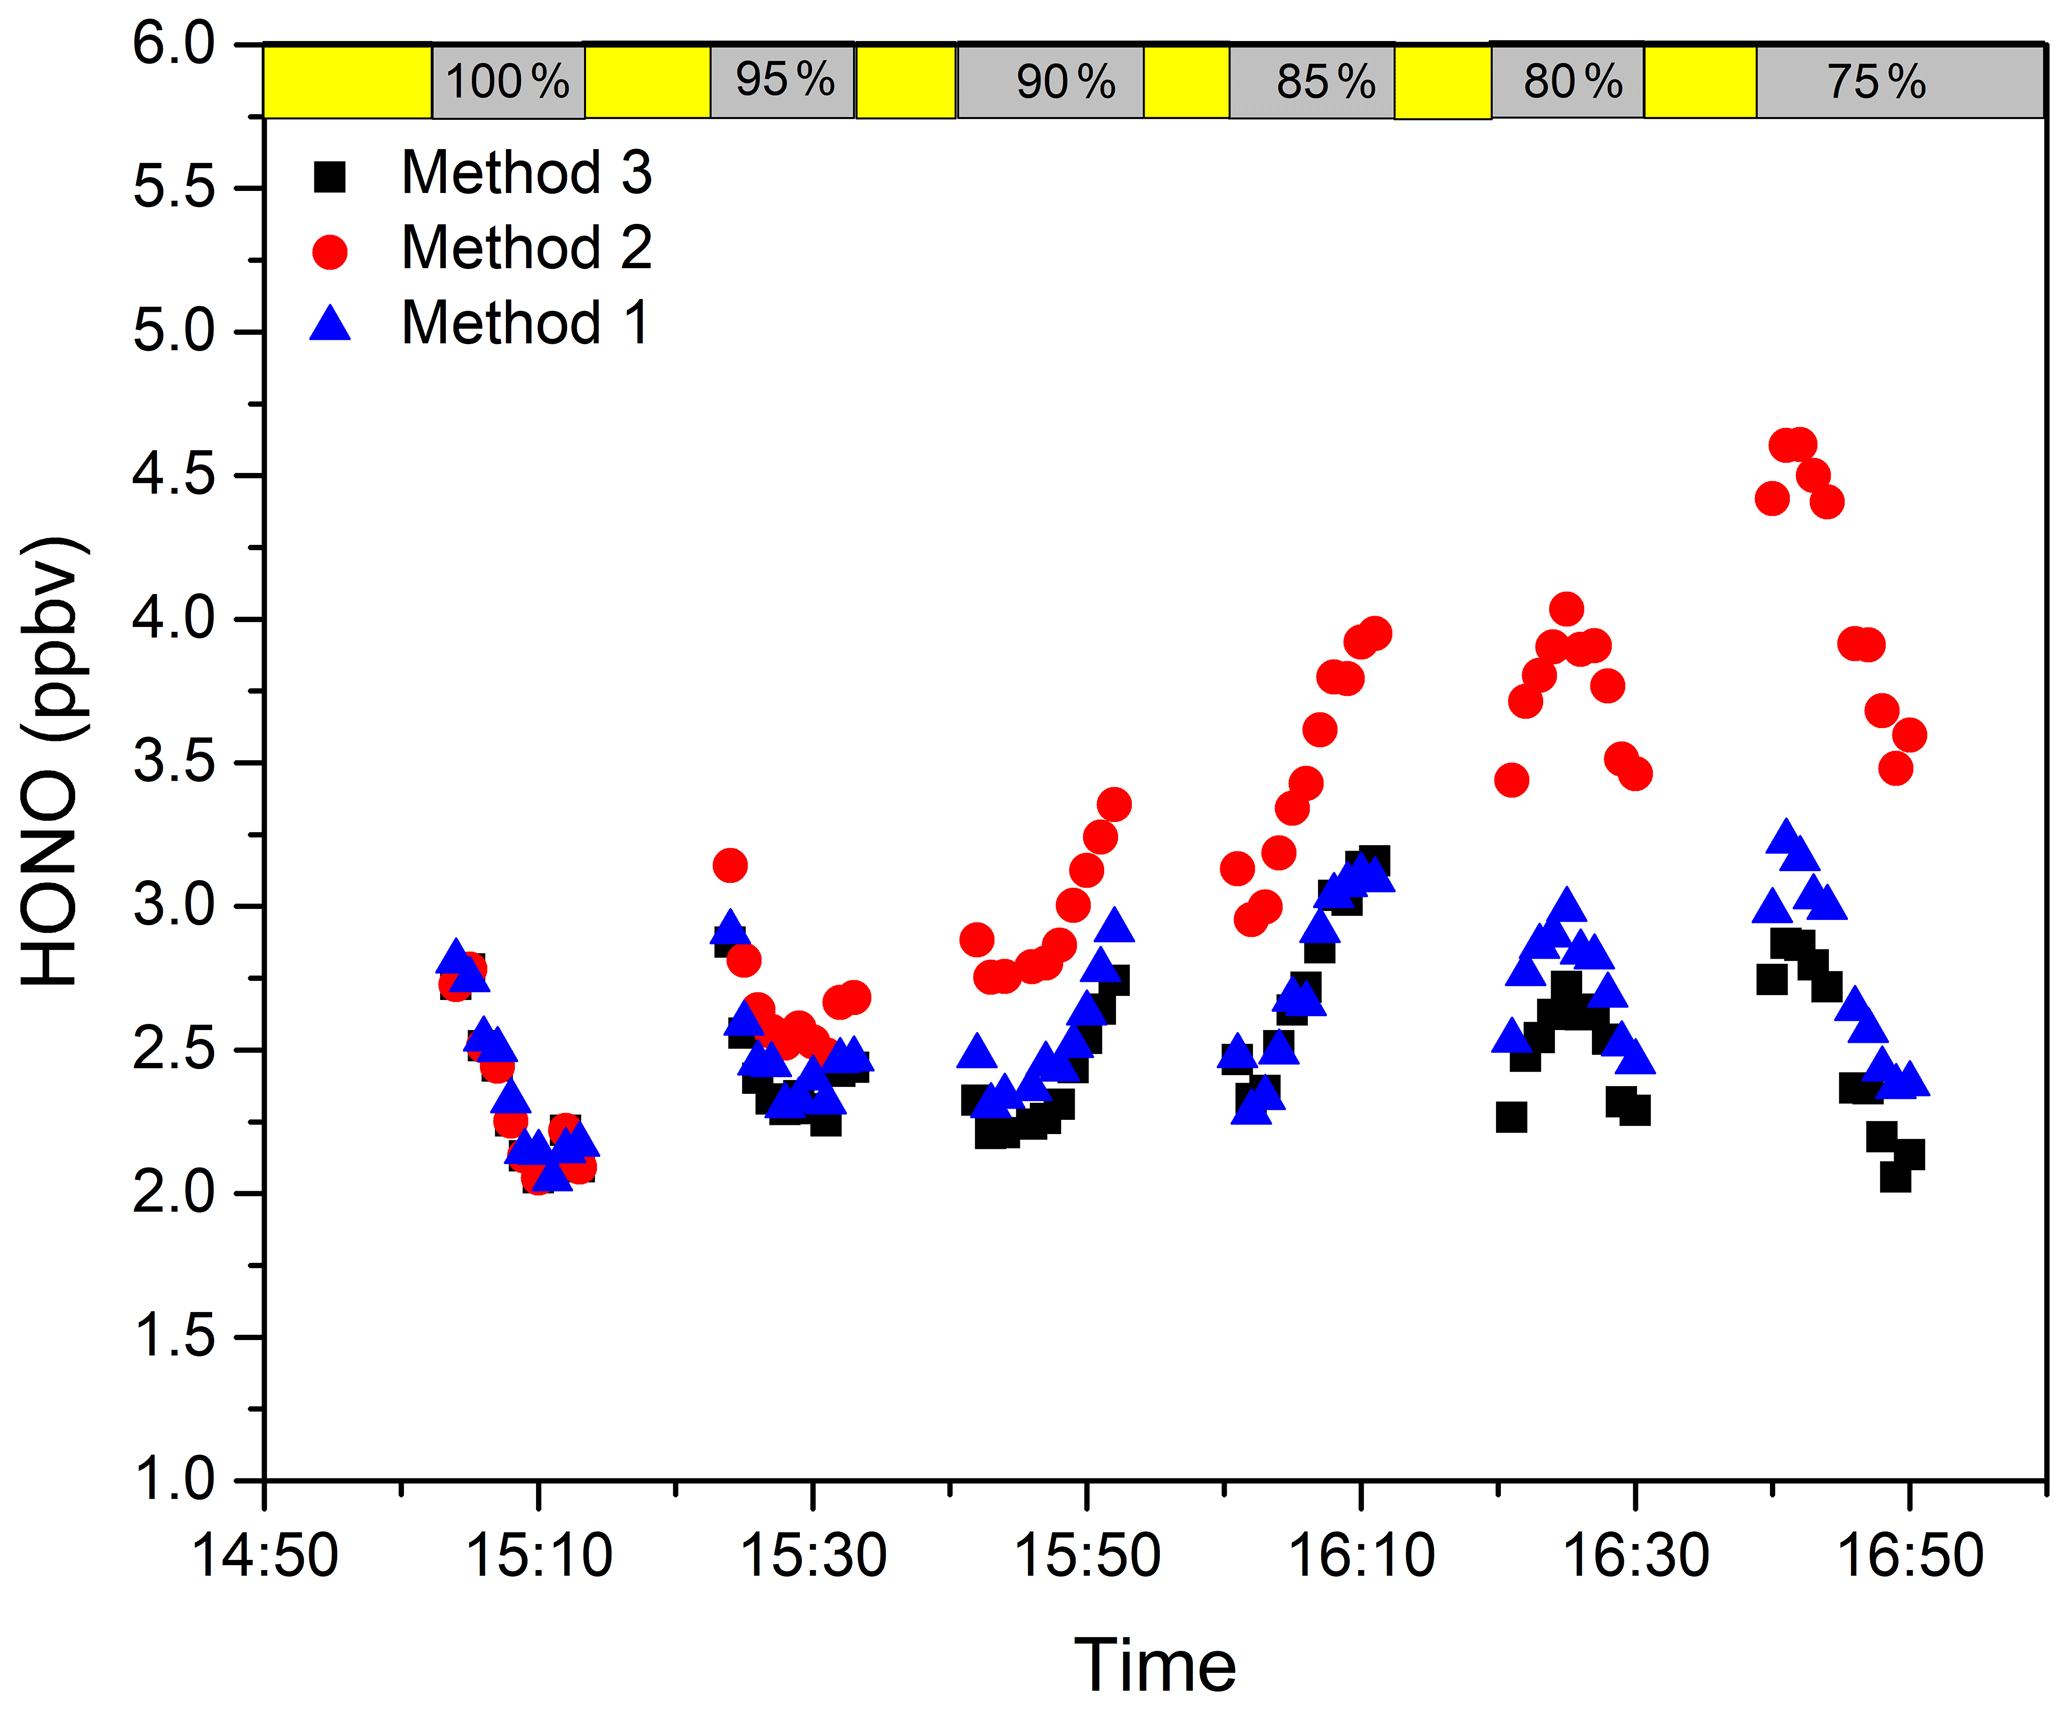
Figure 8Retrieval results of three methods under different relative light source intensities. The yellow area represents the measuring time of the lamp spectrum, and the grey area represents the atmospheric measurement after changing the relative light intensity of the light source.
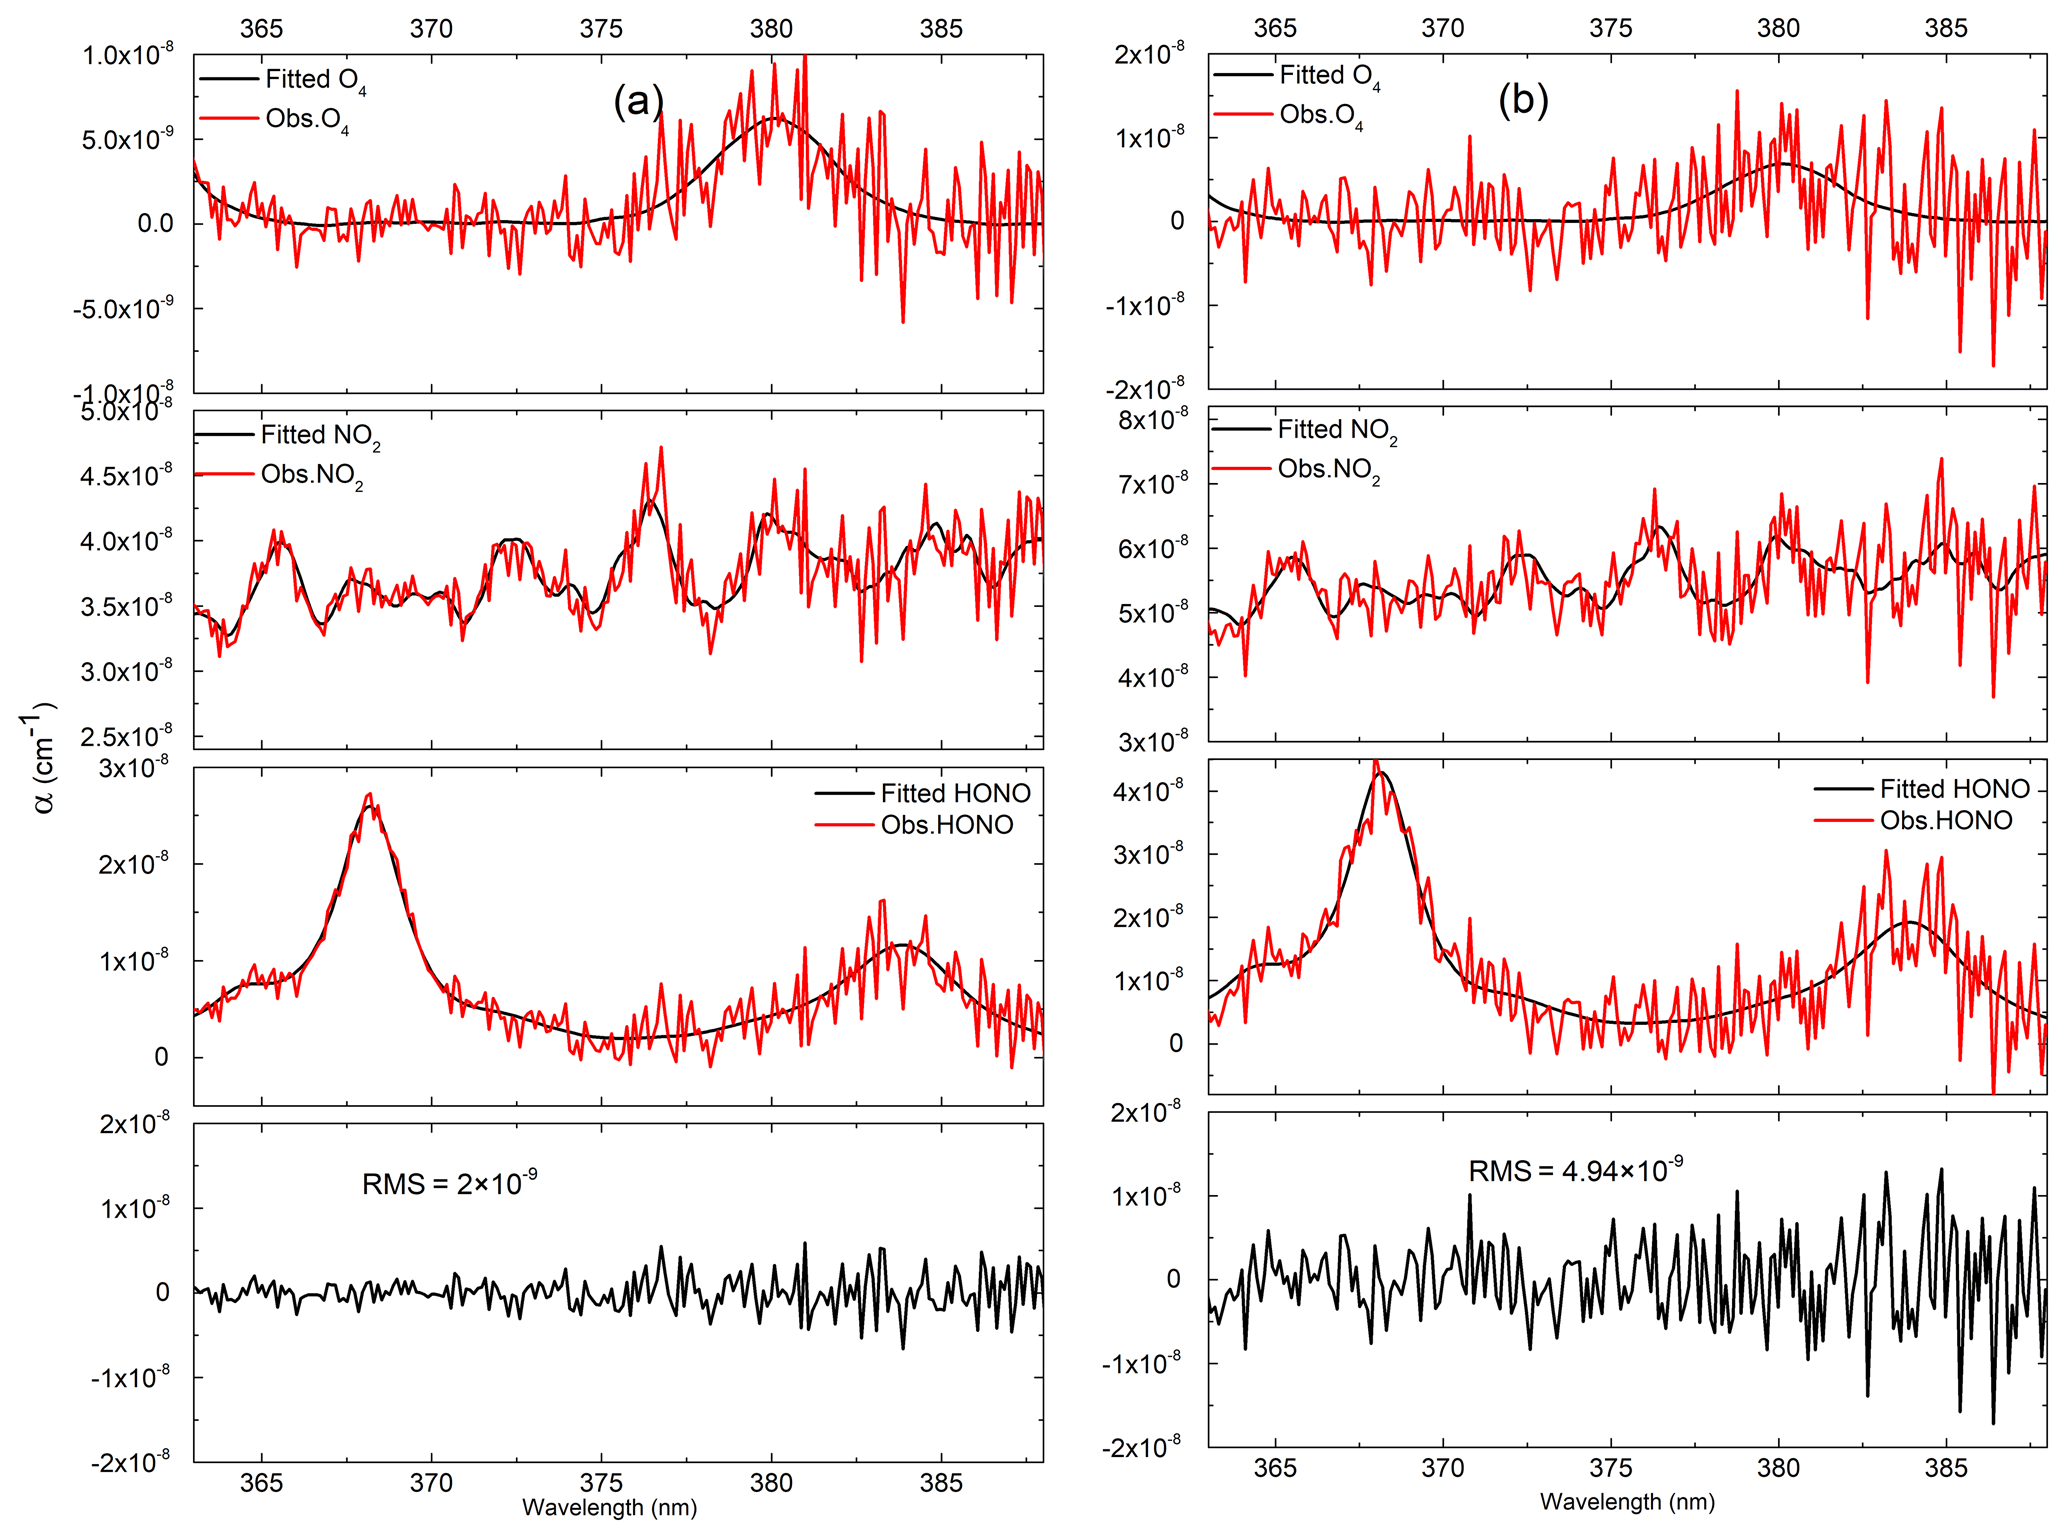
Figure 9Spectral fitting results of (a) method 3 and (b) method 2 after light intensity change. The RMS of fit residuals in method 2 is ; the RMS of fit residuals in method 3 is .
3.6 Ambient measurement and comparison with conventional IBBCEAS
Atmospheric HONO and NO2 observations were carried out in the suburbs of Hefei City in Anhui Province (31.89∘ N, 117.17∘ E) from the 29 September to the 1 October 2019. The IBBCEAS system based on an iterative algorithm was placed in a room with an approximately constant temperature controlled by an air conditioner, and the sampling port was outside of the room. A conventional IBBCEAS (Duan et al., 2018) and the IBBCEAS system based on an iterative algorithm were used to measure the concentrations of HONO and NO2. The conventional IBBCEAS instrument was developed and reported by our research group previously. The length of the air sampling tubes for both instruments is about 2 m. The time series of the HONO and NO2 concentrations measured by the two instruments are shown in Fig. 10. The integration time was 1 min. The highest HONO concentration of 3.12 ppbv appeared on the evening of 29 September, and the average value of HONO during the measurement period was 0.96 ppbv. The average concentration of NO2 was 15.45 ppbv, and the maximum value was 49.55 ppbv. Figure 11 shows the correlation between the measurement results from the conventional IBBCEAS and the new IBBCEAS system based on an iterative algorithm. The correlation coefficients (R2) of the HONO and NO2 results obtained by the two instruments are 0.94 and 0.99 respectively. The differences between two IBBCEAS systems are 1 % and 7 % for the HONO and NO2 measurements respectively, which is within the measurement uncertainties of instruments discussed in Sect. 3.4. Although there are many intercomparisons regarding HONO measurements, the differences between different instruments have always existed. Crilley et al. (2019) reported that the IBBCEAS instrument and wet chemical methods have good consistency in field observations, but the absolute concentration difference is 12 %–39 % (Crilley et al., 2019). The cause of the difference was not clearly identified; therefore, more experiments on HONO comparison are needed in the future.
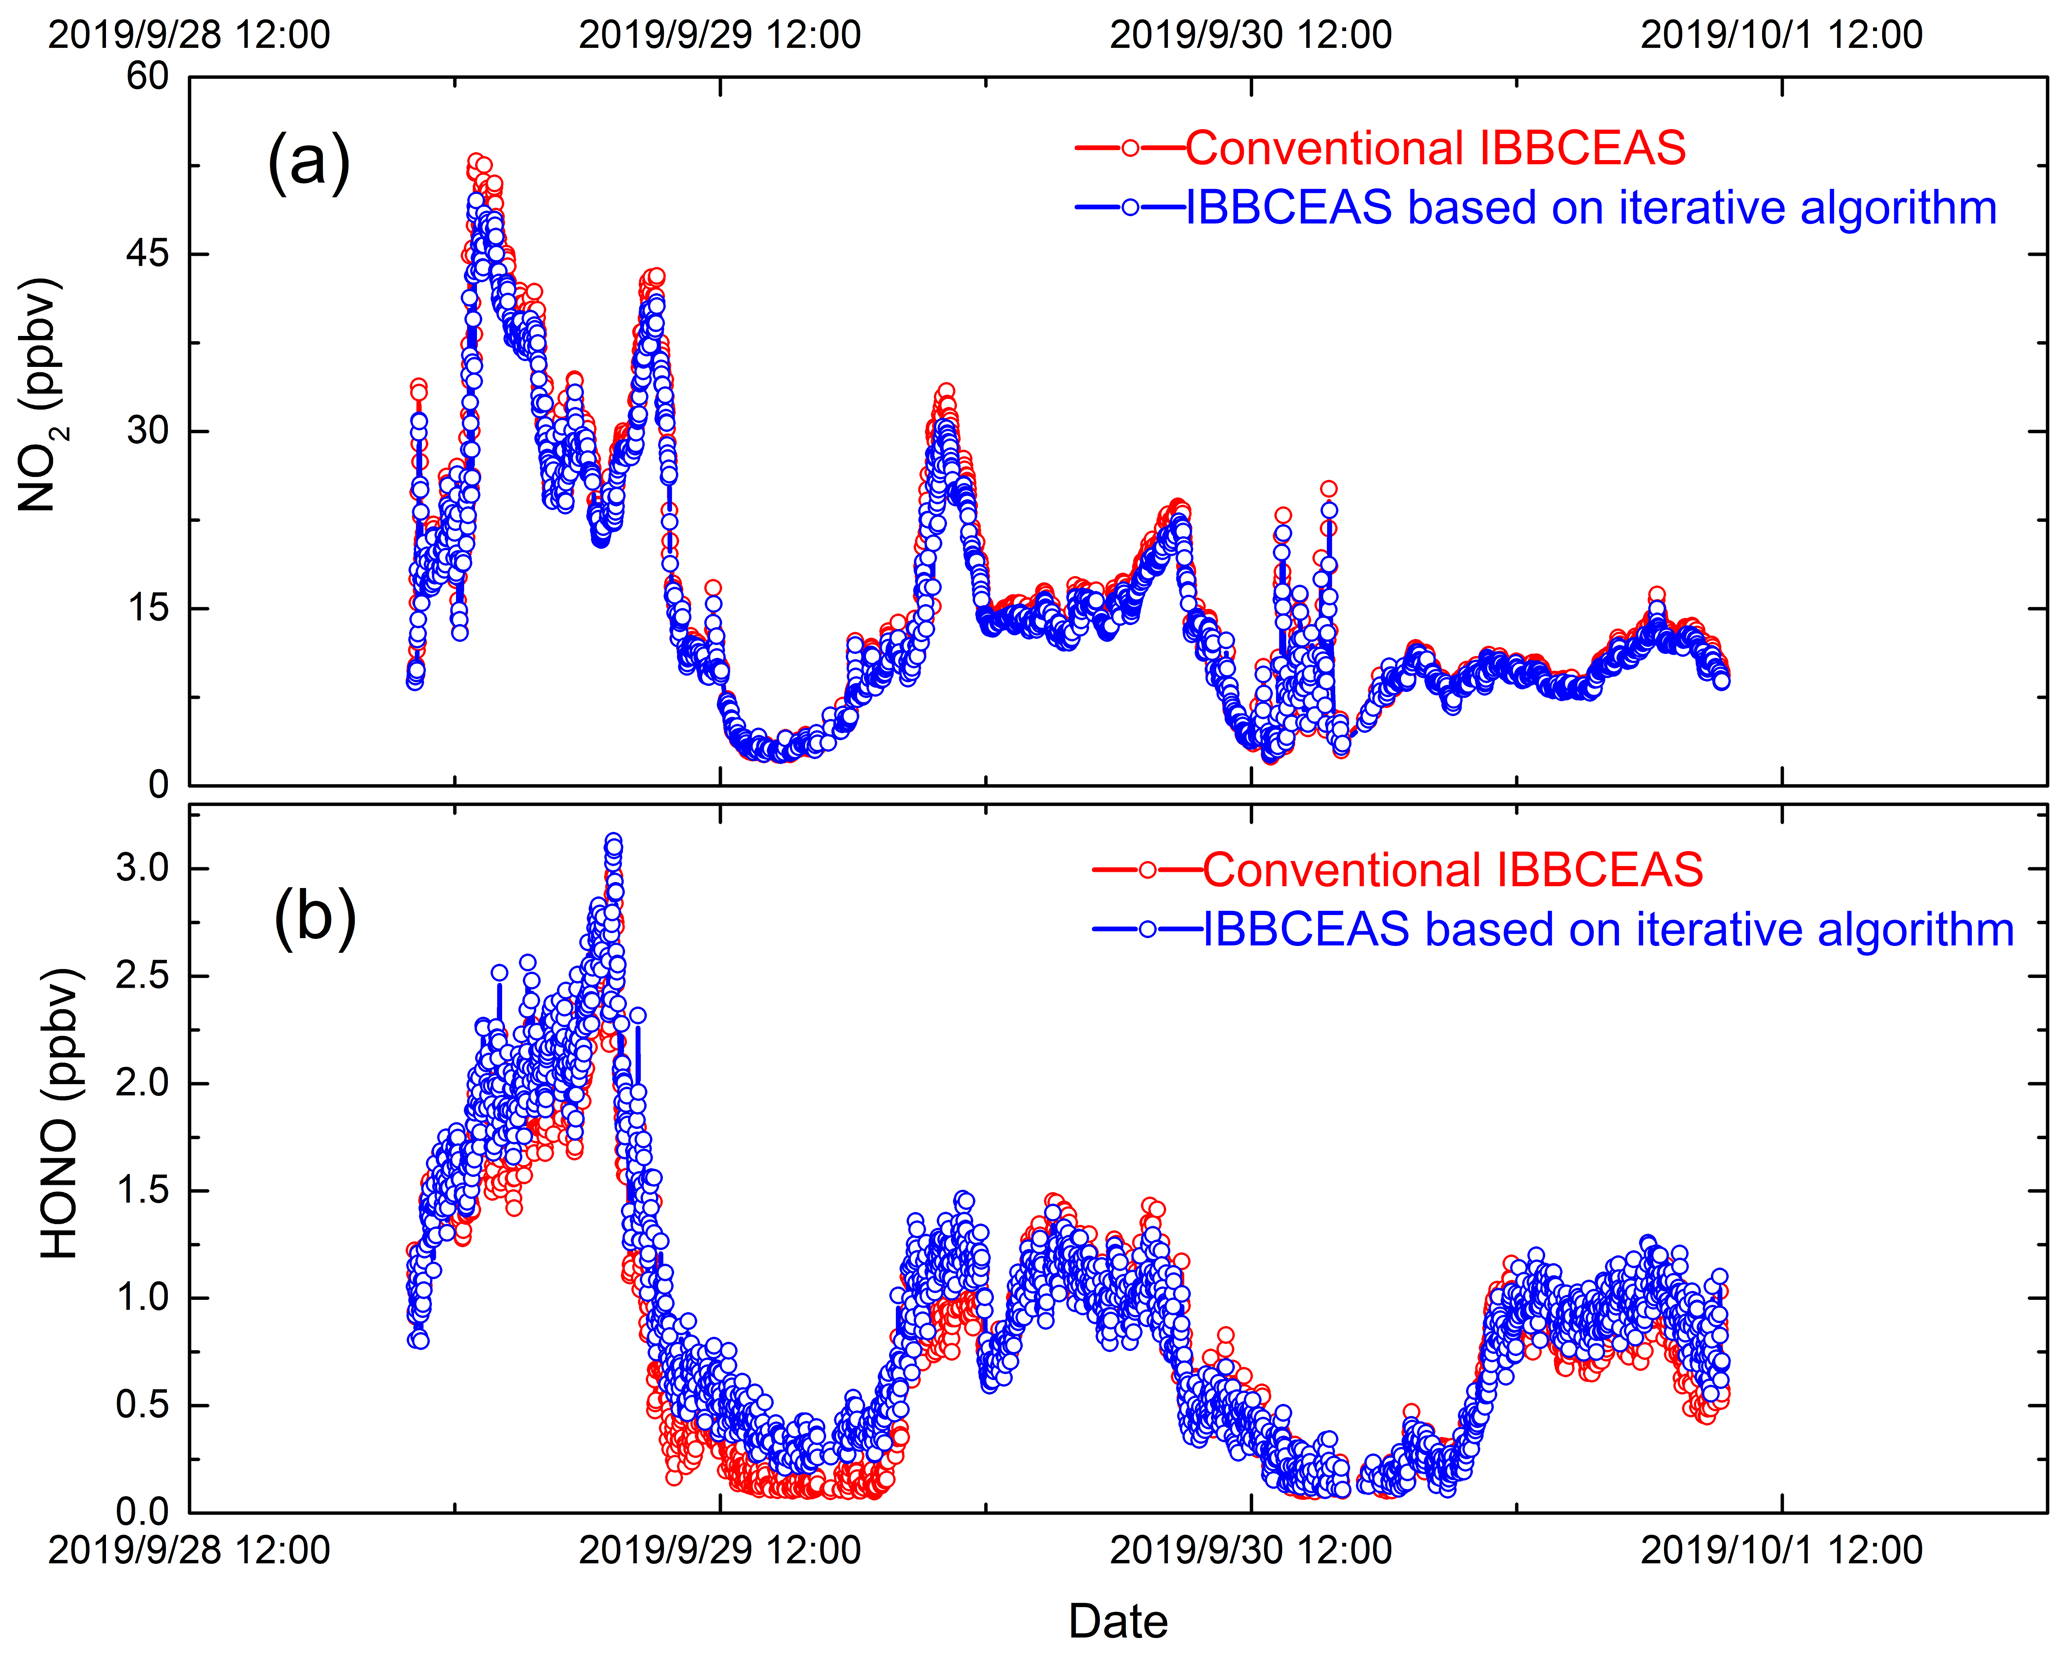
Figure 10The time series of the (a) NO2 and (b) HONO concentrations measured by the two instruments. All data are 1 min averages. The red data point is the result of retrieval using an iterative algorithm, and the blue data point is the result of retrieval using a conventional IBBCEAS algorithm.
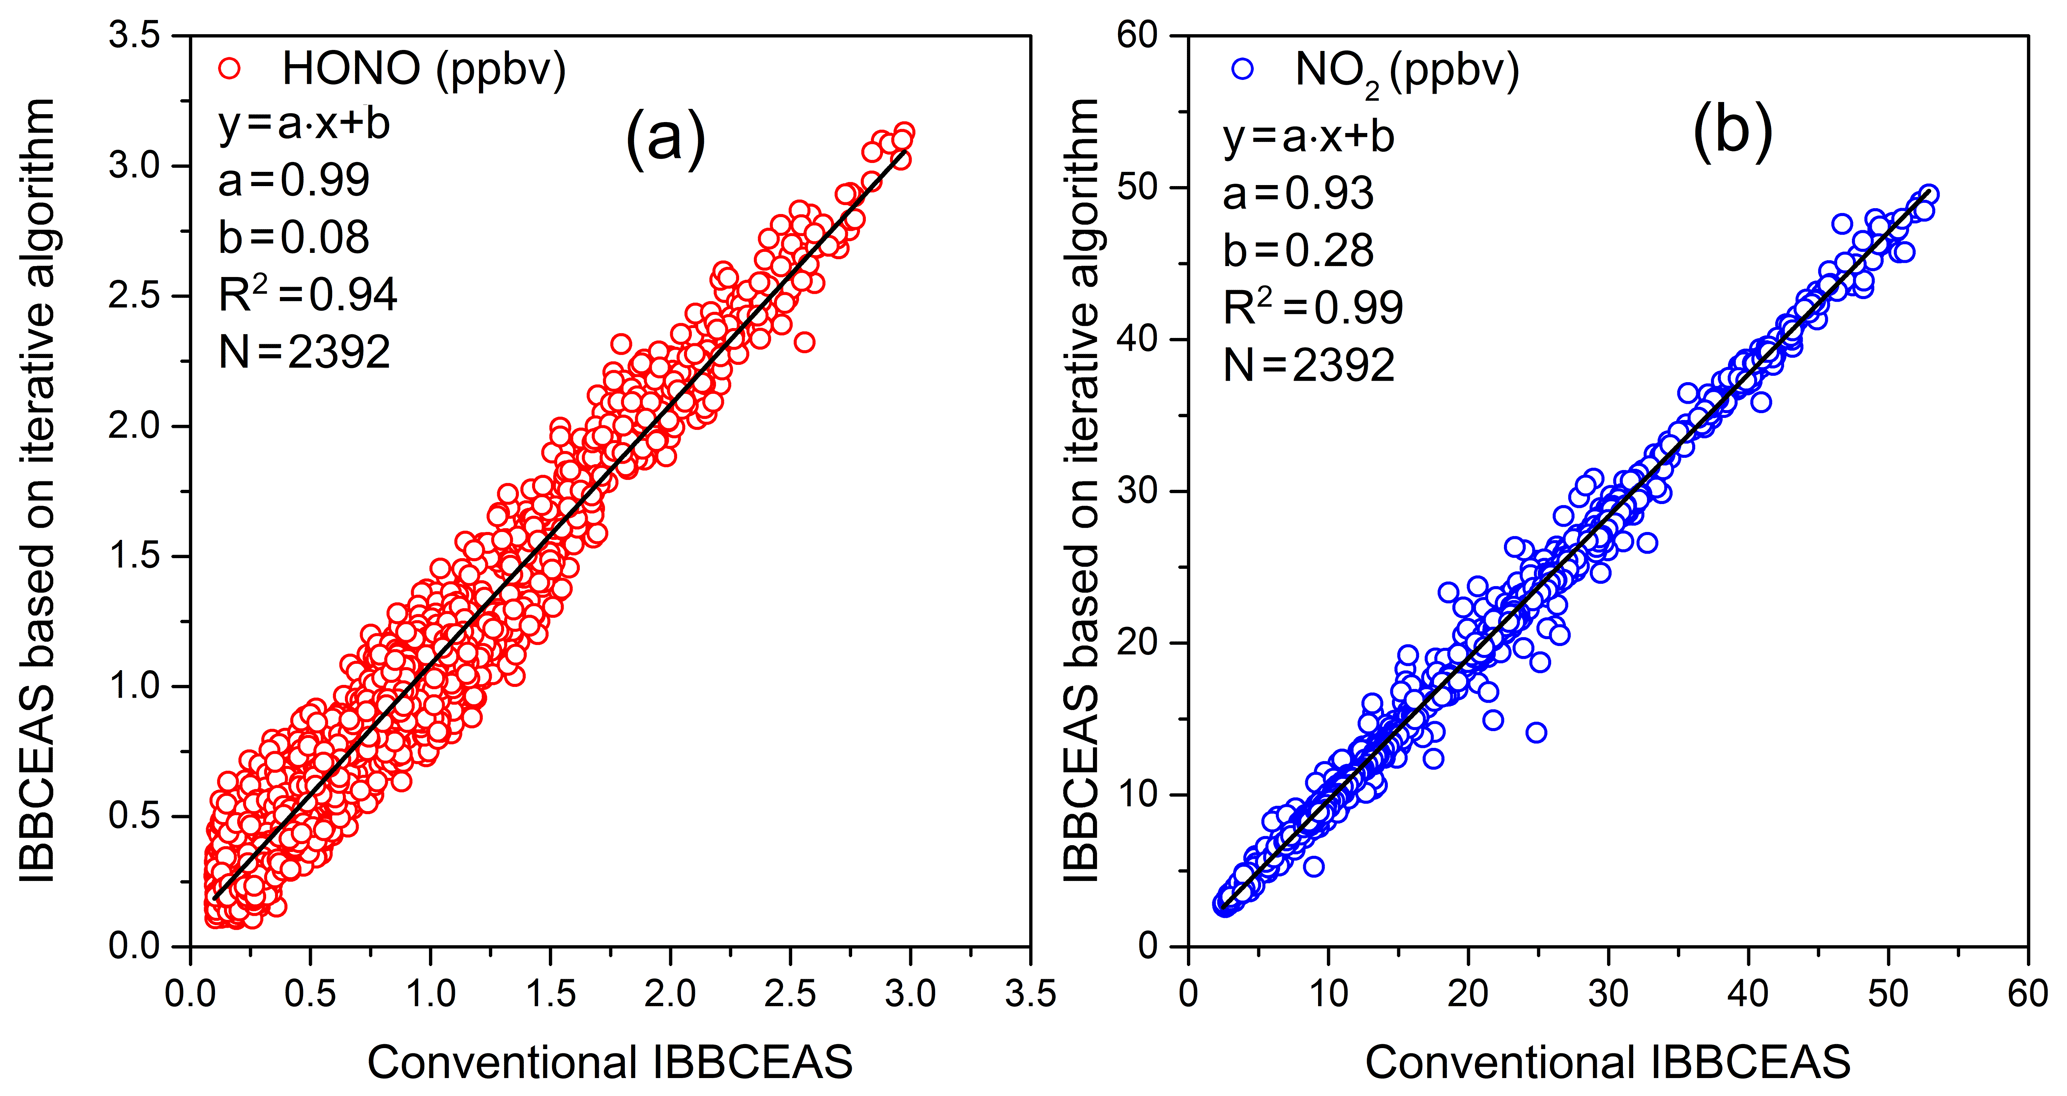
Figure 11The correlation between the measurement results of the two IBBCEAS systems: (a) correlation between the HONO concentrations determined by two IBBCEAS systems; (b) correlation between the NO2 concentrations determined by two IBBCEAS systems.
3.7 The application of Kalman filtering to measurement results
Allan deviation describes the relationship between the integration time of the system and the stability of the system. According to the results of the Allan deviation, the optimum integration time of the system can be obtained so that the system achieves the best detection sensitivity. Kalman filtering technology can further improve the measurement precision of the system (Leleux et al., 2002; Fang et al., 2017; Wu et al., 2010). Compared with a simple moving average, Kalman filtering can deal with the “lag” effect and abnormal peak values (Leleux et al., 2002). The basic idea of Kalman filtering is to obtain the predicted state of the present time based on the state of the previous time, and the predicted state of the present time is fused with the observed state measured by the sensor to obtain the estimation of the current state (Wu et al., 2010; Leleux et al., 2002). This can be expressed as follows:
Here, is the predicted value of time sequence k, is the predicted value of time sequence k−1, Kk is the Kalman gain, and zk is the measurement value of time sequence k. In this work, the variance of the previous 10 values of the concentration measurements are used in the Kalman filtering. Figure 12 shows the measurements of the HONO and NO2 concentrations under zero-air conditions as well as the application of the Kalman filtering. The measurement fluctuation in the 3 s integration time was 0.33 and 0.18 ppbv for NO2 and HONO respectively. After applying Kalman filtering, the effect of the fluctuation is reduced, and the measurement precision in the 3 s integration time was 0.04 and 0.07 ppbv for NO2 and HONO respectively. The results show that the measurement precision improved by a factor of 4.5. This result is comparable to the measurement precision at an integration time of 60 s. Therefore, using Kalman filtering technology can enhance the measurement precision and reduce measurement noise. Figure 13 shows the measurement of HONO and NO2 concentrations with and without Kalman filtering under ambient conditions. In order to capture the sharp change in the NO2 concentration, the filter's gain parameter is set to 40. The filtering results follow the change in the measured concentration, effectively reducing the influence of noise on the concentration results, and improve the measurement precision of the system.

Figure 12The measurement results for (a) HONO and (b) NO2 with and without Kalman filtering under zero-air conditions. The red line is the concentration result after processing with Kalman filtering technology, and the grey line is the result for the original concentration data.
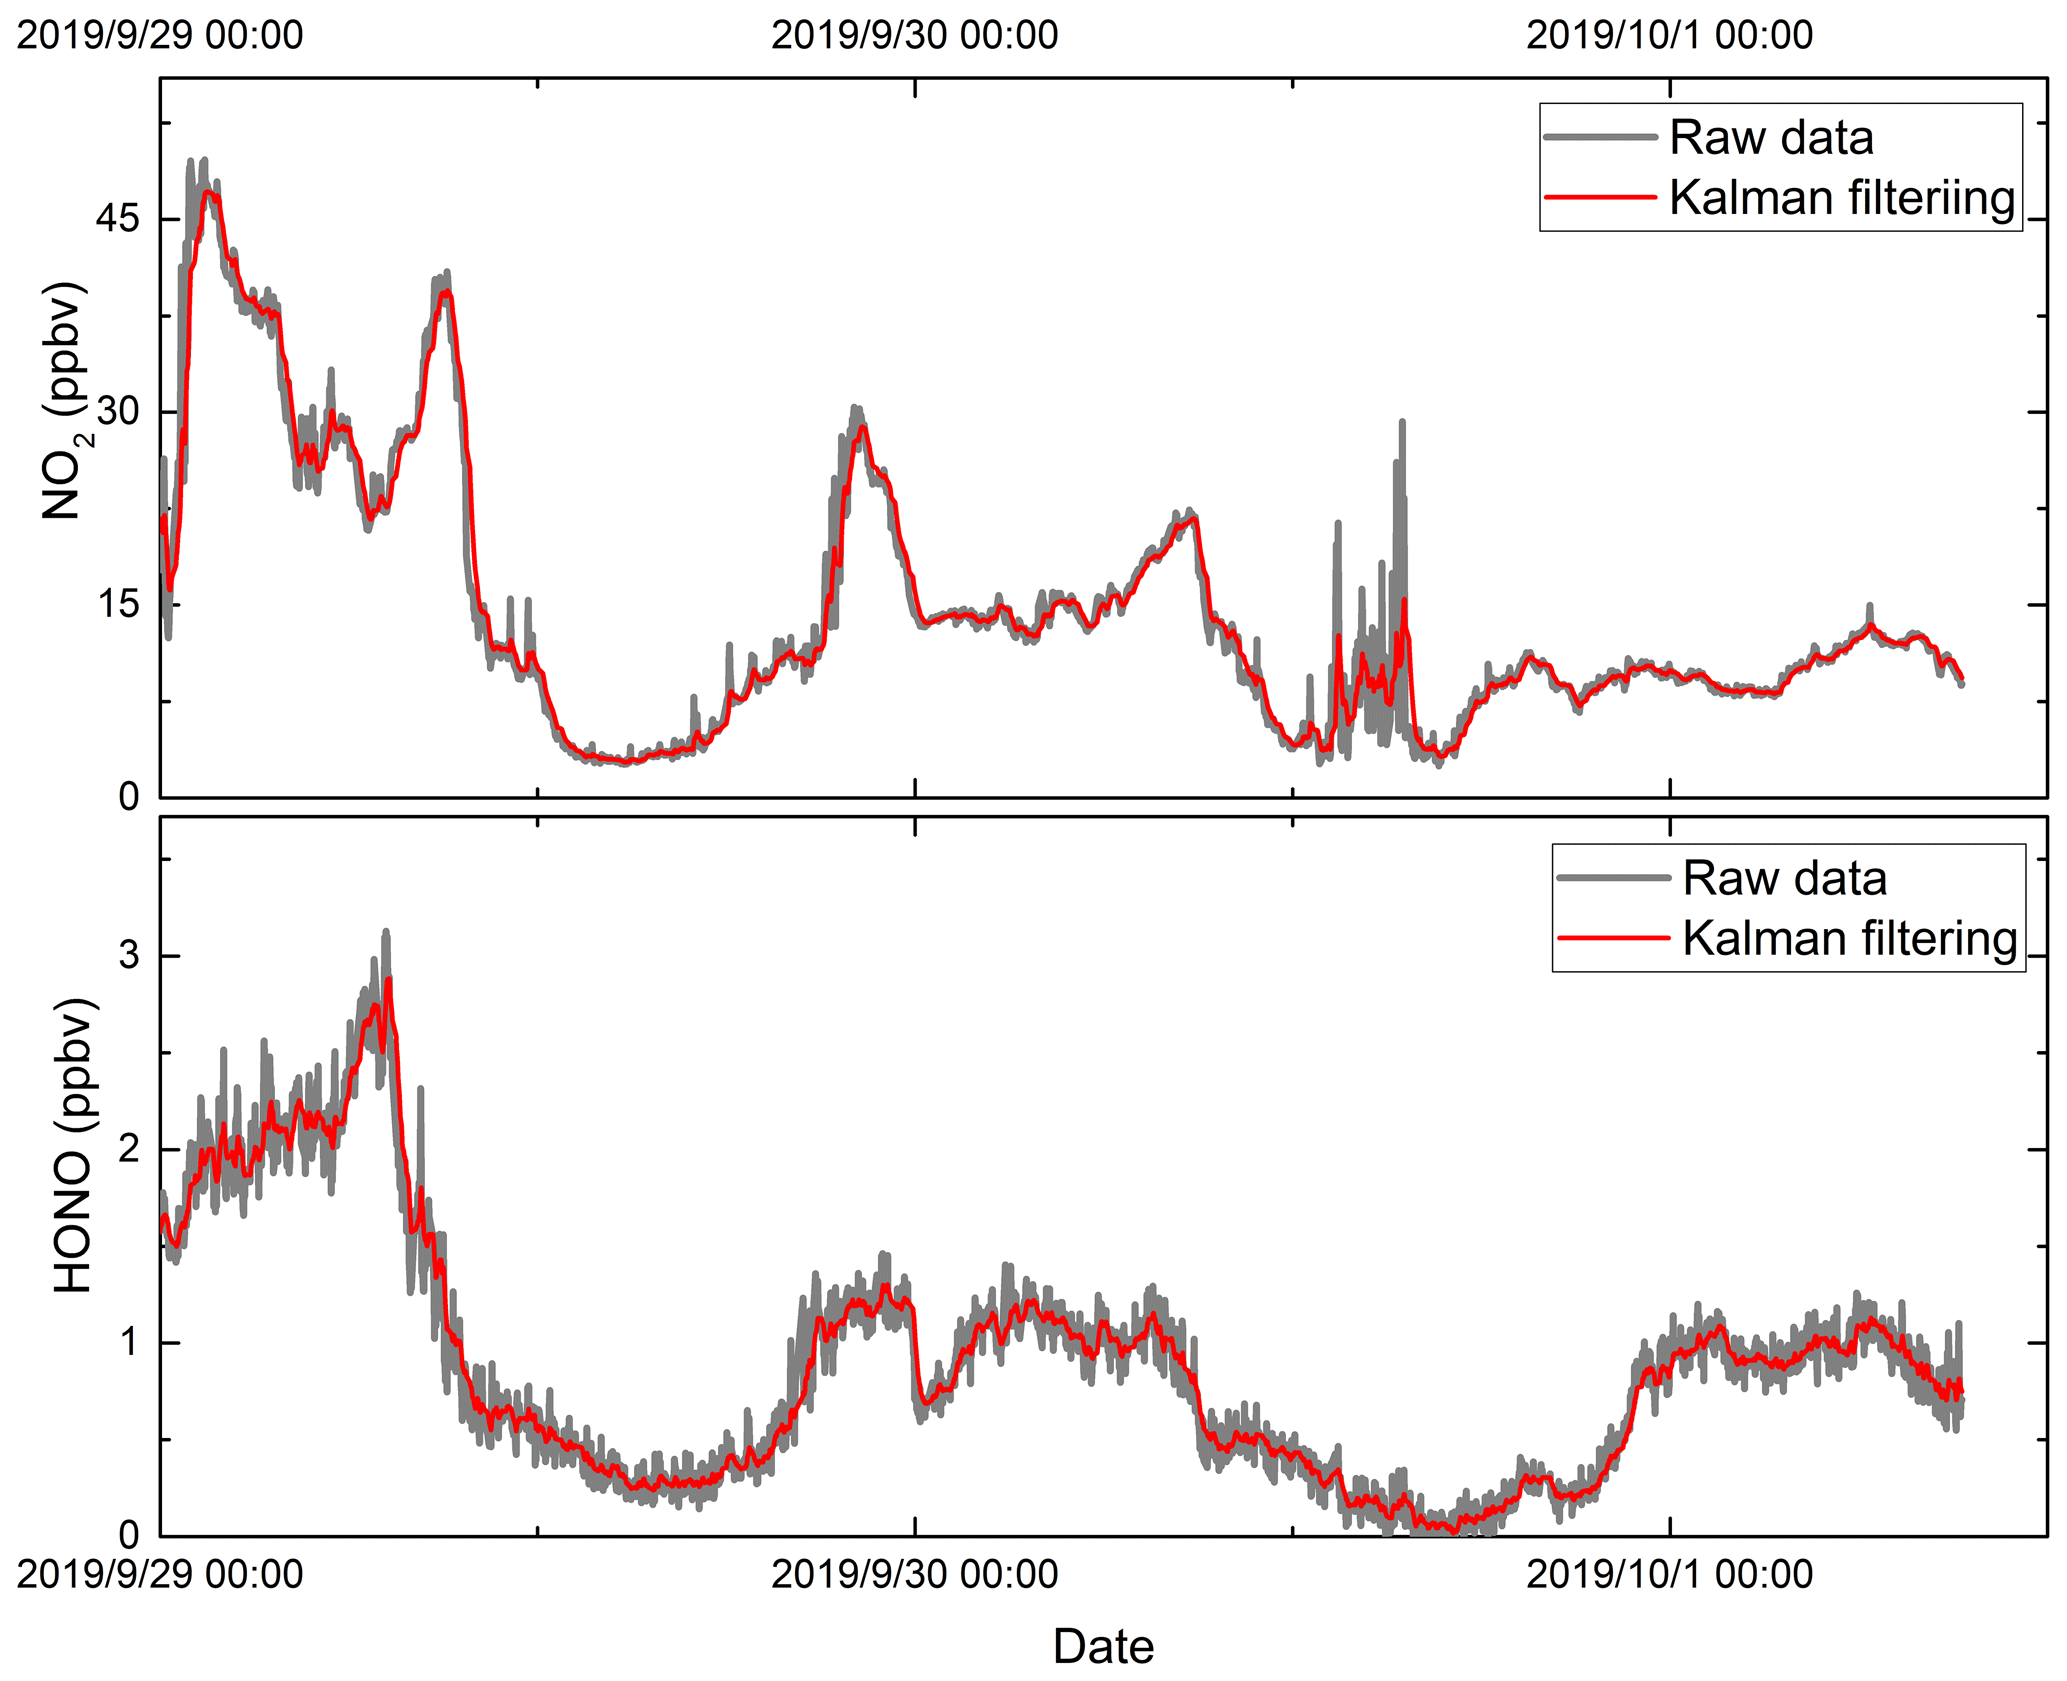
Figure 13The measurement results for HONO and NO2 with and without Kalman filtering under ambient conditions. The red line is the concentration result after processing with Kalman filtering technology, and the grey line is the result for original concentration data.
Here, we have developed an IBBCEAS system based on an iterative algorithm for the simultaneous measurement of atmospheric HONO and NO2. The effective absorption optical path length is obtained by the iterative algorithm. The concentrations of HONO and NO2 are then determined by DOAS retrieval. The iterative algorithm is insensitive to the broadband change in the light intensity and has good robustness. The reflectivity of the high-reflectivity mirror is characterised by the difference in the observed Rayleigh scattering between nitrogen and helium. The reflectivity of the mirror is measured to be 0.99980 at a wavelength of 368.2 nm. The effect of the cavity-mirror-protecting nitrogen purge on the effective cavity length is calibrated using a stable NO2 concentration. The detection sensitivity of the system is analysed by Allen deviation analysis. The detection limit of the system is 0.08 ppbv (2σ value) and 0.14 ppbv (2σ value) for HONO and NO2 at an integration time of 60 s respectively. The IBBCEAS based on an iterative algorithm is in good agreement with the conventional IBBCEAS system when applied to a “proof-of-concept” atmospheric measurement for more than 2 days. The total uncertainty of the system is about 8.1 % for NO2 measurements and about 8.7 % for HONO measurements.
We also utilised a Kalman filtering technique to improve the measurement precision of the IBBCEAS system. This helps to realise high-precision measurements of atmospheric HONO and NO2. After applying Kalman filtering technology, the measurement precision at an integration time of 3 s can reach the corresponding precision under an integration time of 60 s without Kalman filtering. The system has a good application prospect for follow-up research on atmospheric HONO on several different platforms, such as vehicle, balloon, and airborne platforms.
The data used in this study are available from the corresponding author upon request (mqin@aiofm.ac.cn).
MQ, PX, JL, WL, and WX contributed to the conception of the study. KT, JD, and WF built the IBBCEAS instrument. KT, JD, FM, HZ, and KY performed the experiments. KT performed the data analyses and wrote the paper. MQ and YH edited and developed the paper.
The authors declare that they have no conflict of interest.
This work was supported by the National Natural Science Foundation of China (grant nos. 41875154 and 91544104) and the National Key R&D Program of China (grant nos. 2017YFC0209400, 2016YFC0201000, and 2017YFC0209900).
This research has been supported by the National Natural Science Foundation of China (grant nos. 41875154 and 91544104) and the National Key R&D Program of China (grant nos. 2017YFC0209400, 2016YFC0201000, and 2017YFC0209900).
This paper was edited by Keding Lu and reviewed by three anonymous referees.
Acker, K., Möller, D., Wieprecht, W., Meixner, F. X., Bohn, B., Gilge, S., Plass-Dülmer, C., and Berresheim, H.: Strong daytime production of OH from HNO2 at a rural mountain site, Geophys. Res. Lett., 33, L02809, https://doi.org/10.1029/2005gl024643, 2006.
Alicke, B.: Impact of nitrous acid photolysis on the total hydroxyl radical budget during the Limitation of Oxidant Production/Pianura Padana Produzione di Ozono study in Milan, J. Geophys. Res., 107, 8196, https://doi.org/10.1029/2000jd000075, 2002.
Chen, L., Hou, S., Wang, W., Tong, S., Pei, K., and Ge, M.: Development of a Home-Made Long Path Absorption Photometer for the Sensitive Detection of Nitrous Acid, Acta Phys.-Chim. Sin., 30, 1408–1415, https://doi.org/10.3866/pku.whxb201406032, 2014.
Cheng, P., Cheng, Y., Lu, K., Su, H., Yang, Q., Zou, Y., Zhao, Y., Dong, H., Zeng, L., and Zhang, Y.: An online monitoring system for atmospheric nitrous acid (HONO) based on stripping coil and ion chromatography, J. Environ. Sci., 25, 895–907, https://doi.org/10.1016/s1001-0742(12)60251-4, 2013.
Crilley, L. R., Kramer, L. J., Ouyang, B., Duan, J., Zhang, W., Tong, S., Ge, M., Tang, K., Qin, M., Xie, P., Shaw, M. D., Lewis, A. C., Mehra, A., Bannan, T. J., Worrall, S. D., Priestley, M., Bacak, A., Coe, H., Allan, J., Percival, C. J., Popoola, O. A. M., Jones, R. L., and Bloss, W. J.: Intercomparison of nitrous acid (HONO) measurement techniques in a megacity (Beijing), Atmos. Meas. Tech., 12, 6449–6463, https://doi.org/10.5194/amt-12-6449-2019, 2019.
Cui, X., Yu, R., Chen, W., Zhang, Z., Pang, T., Sun, P., Xia, H., Wu, B., and Dong, F.: Development of a Quantum Cascade Laser-Based Sensor for Environmental HONO Monitoring in the Mid-Infrared at 8 µm, J. Lightwave Technol., 37, 2784–2791, https://doi.org/10.1109/jlt.2018.2876672, 2019.
Donaldson, M. A., Berke, A. E., and Raff, J. D.: Uptake of Gas Phase Nitrous Acid onto Boundary Layer Soil Surfaces, Environ. Sci. Technol., 48, 375–383, https://doi.org/10.1021/es404156a, 2014.
Dong, H.-B., Zeng, L.-M., Hu, M., Wu, Y.-S., Zhang, Y.-H., Slanina, J., Zheng, M., Wang, Z.-F., and Jansen, R.: Technical Note: The application of an improved gas and aerosol collector for ambient air pollutants in China, Atmos. Chem. Phys., 12, 10519–10533, https://doi.org/10.5194/acp-12-10519-2012, 2012.
Duan, J., Qin, M., Ouyang, B., Fang, W., Li, X., Lu, K., Tang, K., Liang, S., Meng, F., Hu, Z., Xie, P., Liu, W., and Häsler, R.: Development of an incoherent broadband cavity-enhanced absorption spectrometer for in situ measurements of HONO and NO2, Atmos. Meas. Tech., 11, 4531–4543, https://doi.org/10.5194/amt-11-4531-2018, 2018.
Fang, B., Zhao, W., Xu, X., Zhou, J., Ma, X., Wang, S., Zhang, W., Venables, D. S., and Chen, W.: Portable broadband cavity-enhanced spectrometer utilizing Kalman filtering: application to real-time, in situ monitoring of glyoxal and nitrogen dioxide, Opt. Express, 25, 26910–26922, https://doi.org/10.1364/OE.25.026910, 2017.
Fiedler, S. E., Hese, A., and Ruth, A. A.: Incoherent broad-band cavity-enhanced absorption spectroscopy, Chem. Phys. Lett., 371, 284–294, https://doi.org/10.1016/s0009-2614(03)00263-x, 2003.
Gherman, T., Venables, D. S., Vaughan, S., Orphal, J., and Ruth, A. A.: Incoherent broadband cavity-enhanced absorption spectroscopy in the near-ultraviolet: Application to HONO and NO2, Environ. Sci. Technol., 42, 890–895, https://doi.org/10.1021/es0716913, 2008.
Greenblatt, G. D., Orlando, J. J., Burkholder, J. B., and Ravishankara, A. R.: Absorption measurements of oxgen between 330 and 1140 nm, J. Geophys. Res.-Atmos., 95, 18577–18582, https://doi.org/10.1029/JD095iD11p18577, 1990.
Harrison, R. M., Peak, J. D., and Collins, G. M.: Tropospheric cycle of nitrous acid, J. Geophys. Res.-Atmos., 101, 14429–14439, https://doi.org/10.1029/96jd00341, 1996.
Heland, J., Kleffmann, J., Kurtenbach, R., and Wiesen, P.: A new instrument to measure gaseous nitrous acid (HONO) in the atmosphere, Environ. Sci. Technol., 35, 3207–3212, https://doi.org/10.1021/es000303t, 2001.
Herman, J. R., Thalman, R. M., Gao, W., and Volkamer, R. M.: Light emitting diode cavity enhanced differential optical absorption spectroscopy (LED-CE-DOAS): a novel technique for monitoring atmospheric trace gases, P. SPIE, 7462, 74620H, https://doi.org/10.1117/12.826737, 2009.
Hoch, D. J., Buxmann, J., Sihler, H., Pöhler, D., Zetzsch, C., and Platt, U.: An instrument for measurements of BrO with LED-based Cavity-Enhanced Differential Optical Absorption Spectroscopy, Atmos. Meas. Tech., 7, 199–214, https://doi.org/10.5194/amt-7-199-2014, 2014.
Horbanski, M., Pöhler, D., Lampel, J., and Platt, U.: The ICAD (iterative cavity-enhanced DOAS) method, Atmos. Meas. Tech., 12, 3365–3381, https://doi.org/10.5194/amt-12-3365-2019, 2019.
Hou, S., Tong, S., Ge, M., and An, J.: Comparison of atmospheric nitrous acid during severe haze and clean periods in Beijing, China, Atmos. Environ., 124, 199–206, https://doi.org/10.1016/j.atmosenv.2015.06.023, 2016.
Jordan, N. and Osthoff, H. D.: Quantification of nitrous acid (HONO) and nitrogen dioxide (NO2) in ambient air by broadband cavity-enhanced absorption spectroscopy (IBBCEAS) between 361 and 388 nm, Atmos. Meas. Tech., 13, 273–285, https://doi.org/10.5194/amt-13-273-2020, 2020.
Jordan, N., Ye, C. Z., Ghosh, S., Washenfelder, R. A., Brown, S. S., and Osthoff, H. D.: A broadband cavity-enhanced spectrometer for atmospheric trace gas measurements and Rayleigh scattering cross sections in the cyan region (470–540 nm), Atmos. Meas. Tech., 12, 1277–1293, https://doi.org/10.5194/amt-12-1277-2019, 2019.
Kleffmann, J.: Daytime formation of nitrous acid: A major source of OH radicals in a forest, Geophys. Res. Lett., 32, 347–354, https://doi.org/10.1029/2005gl022524, 2005.
Kleffmann, J., Loerzer, J. C., Wiesen, P., Kern, C., Trick, S., Volkamer, R., Rodenas, M., and Wirtz, K.: Intercomparison of the DOAS and LOPAP techniques for the detection of nitrous acid (HONO), Atmos. Environ., 40, 3640–3652, https://doi.org/10.1016/j.atmosenv.2006.03.027, 2006.
Kraus, S. G.: DOASIS: A Framework Design for DOAS, Dissertation, University of Mannheim, Mannheim, Germany, 2006.
Laufs, S., Cazaunau, M., Stella, P., Kurtenbach, R., Cellier, P., Mellouki, A., Loubet, B., and Kleffmann, J.: Diurnal fluxes of HONO above a crop rotation, Atmos. Chem. Phys., 17, 6907–6923, https://doi.org/10.5194/acp-17-6907-2017, 2017.
Leleux, D. P., Claps, R., Chen, W., Tittel, F. K., and Harman, T. L.: Applications of Kalman filtering to real-time trace gas concentration measurements, Appl. Phys. B-Lasers Opt., 74, 85–93, https://doi.org/10.1007/s003400100751, 2002.
Lu, K. D., Hofzumahaus, A., Holland, F., Bohn, B., Brauers, T., Fuchs, H., Hu, M., Häseler, R., Kita, K., Kondo, Y., Li, X., Lou, S. R., Oebel, A., Shao, M., Zeng, L. M., Wahner, A., Zhu, T., Zhang, Y. H., and Rohrer, F.: Missing OH source in a suburban environment near Beijing: observed and modelled OH and HO2 concentrations in summer 2006, Atmos. Chem. Phys., 13, 1057–1080, https://doi.org/10.5194/acp-13-1057-2013, 2013.
Meinen, J., Thieser, J., Platt, U., and Leisner, T.: Technical Note: Using a high finesse optical resonator to provide a long light path for differential optical absorption spectroscopy: CE-DOAS, Atmos. Chem. Phys., 10, 3901–3914, https://doi.org/10.5194/acp-10-3901-2010, 2010.
Michoud, V., Kukui, A., Camredon, M., Colomb, A., Borbon, A., Miet, K., Aumont, B., Beekmann, M., Durand-Jolibois, R., Perrier, S., Zapf, P., Siour, G., Ait-Helal, W., Locoge, N., Sauvage, S., Afif, C., Gros, V., Furger, M., Ancellet, G., and Doussin, J. F.: Radical budget analysis in a suburban European site during the MEGAPOLI summer field campaign, Atmos. Chem. Phys., 12, 11951–11974, https://doi.org/10.5194/acp-12-11951-2012, 2012.
Min, K.-E., Washenfelder, R. A., Dubé, W. P., Langford, A. O., Edwards, P. M., Zarzana, K. J., Stutz, J., Lu, K., Rohrer, F., Zhang, Y., and Brown, S. S.: A broadband cavity enhanced absorption spectrometer for aircraft measurements of glyoxal, methylglyoxal, nitrous acid, nitrogen dioxide, and water vapor, Atmos. Meas. Tech., 9, 423–440, https://doi.org/10.5194/amt-9-423-2016, 2016.
Nakashima, Y. and Sadanaga, Y.: Validation of in situ Measurements of Atmospheric Nitrous Acid Using Incoherent Broadband Cavity-enhanced Absorption Spectroscopy, Anal. Sci., 33, 519–524, https://doi.org/10.2116/analsci.33.519, 2017.
Neftel, A., Blatter, A., Hesterberg, R., and Staffelbach, T.: Measurements of concentration gradients of HNO2 and HNO3 over a semi-natural ecosystem, Atmos. Environ., 30, 3017–3025, https://doi.org/10.1016/1352-2310(96)00011-8, 1996.
Platt, U., Meinen, J., Pöhler, D., and Leisner, T.: Broadband Cavity Enhanced Differential Optical Absorption Spectroscopy (CE-DOAS) – applicability and corrections, Atmos. Meas. Tech., 2, 713–723, https://doi.org/10.5194/amt-2-713-2009, 2009.
Qin, M., Xie, P., Su, H., Gu, J., Peng, F., Li, S., Zeng, L., Liu, J., Liu, W., and Zhang, Y.: An observational study of the HONO-NO2 coupling at an urban site in Guangzhou City, South China, Atmos. Environ., 43, 5731–5742, https://doi.org/10.1016/j.atmosenv.2009.08.017, 2009.
Scharko, N. K., Berke, A. E., and Raff, J. D.: Release of nitrous acid and nitrogen dioxide from nitrate photolysis in acidic aqueous solutions, Environ. Sci. Technol., 48, 11991–12001, https://doi.org/10.1021/es503088x, 2014.
Spataro, F., Ianniello, A., Esposito, G., Allegrini, I., Zhu, T., and Hu, M.: Occurrence of atmospheric nitrous acid in the urban area of Beijing (China), Sci. Total Environ., 447, 210–224, https://doi.org/10.1016/j.scitotenv.2012.12.065, 2013.
Stockwell, C. E., Yokelson, R. J., Kreidenweis, S. M., Robinson, A. L., DeMott, P. J., Sullivan, R. C., Reardon, J., Ryan, K. C., Griffith, D. W. T., and Stevens, L.: Trace gas emissions from combustion of peat, crop residue, domestic biofuels, grasses, and other fuels: configuration and Fourier transform infrared (FTIR) component of the fourth Fire Lab at Missoula Experiment (FLAME-4), Atmos. Chem. Phys., 14, 9727–9754, https://doi.org/10.5194/acp-14-9727-2014, 2014.
Stutz, J., Kim, E. S., Platt, U., Bruno, P., Perrino, C., and Febo, A.: UV-visible absorption cross sections of nitrous acid, J. Geophys. Res.-Atmos., 105, 14585–14592, https://doi.org/10.1029/2000jd900003, 2000.
Stutz, J., Oh, H.-J., Whitlow, S. I., Anderson, C., Dibb, J. E., Flynn, J. H., Rappenglück, B., and Lefer, B.: Simultaneous DOAS and mist-chamber IC measurements of HONO in Houston, TX, Atmos. Environ., 44, 4090–4098, https://doi.org/10.1016/j.atmosenv.2009.02.003, 2010.
Tang, K., Qin, M., Duan, J., Fang, W., Meng, F., Liang, S., Xie, P., Liu, J., Liu, W., Xue, C., and Mu, Y.: A dual dynamic chamber system based on IBBCEAS for measuring fluxes of nitrous acid in agricultural fields in the North China Plain, Atmos. Environ., 196, 10–19, https://doi.org/10.1016/j.atmosenv.2018.09.059, 2019.
Thalman, R. and Volkamer, R.: Inherent calibration of a blue LED-CE-DOAS instrument to measure iodine oxide, glyoxal, methyl glyoxal, nitrogen dioxide, water vapour and aerosol extinction in open cavity mode, Atmos. Meas. Tech., 3, 1797–1814, https://doi.org/10.5194/amt-3-1797-2010, 2010.
Thalman, R., Baeza-Romero, M. T., Ball, S. M., Borrás, E., Daniels, M. J. S., Goodall, I. C. A., Henry, S. B., Karl, T., Keutsch, F. N., Kim, S., Mak, J., Monks, P. S., Muñoz, A., Orlando, J., Peppe, S., Rickard, A. R., Ródenas, M., Sánchez, P., Seco, R., Su, L., Tyndall, G., Vázquez, M., Vera, T., Waxman, E., and Volkamer, R.: Instrument intercomparison of glyoxal, methyl glyoxal and NO2 under simulated atmospheric conditions, Atmos. Meas. Tech., 8, 1835–1862, https://doi.org/10.5194/amt-8-1835-2015, 2015.
Tsai, C., Spolaor, M., Colosimo, S. F., Pikelnaya, O., Cheung, R., Williams, E., Gilman, J. B., Lerner, B. M., Zamora, R. J., Warneke, C., Roberts, J. M., Ahmadov, R., de Gouw, J., Bates, T., Quinn, P. K., and Stutz, J.: Nitrous acid formation in a snow-free wintertime polluted rural area, Atmos. Chem. Phys., 18, 1977–1996, https://doi.org/10.5194/acp-18-1977-2018, 2018.
Voigt, S., Orphal, J., and Burrows, J. P.: The temperature and pressure dependence of the absorption cross-sections of NO2 in the 250–800 nm region measured by Fourier-transform spectroscopy, J. Photoch. Photobio. A, 149, 1–7, https://doi.org/10.1016/s1010-6030(01)00650-5, 2002.
Wang, L. M. and Zhang, J. S.: Detection of nitrous acid by cavity ring down spectroscopy, Environ. Sci. Technol., 34, 4221–4227, https://doi.org/10.1021/es0011055, 2000.
Washenfelder, R. A., Langford, A. O., Fuchs, H., and Brown, S. S.: Measurement of glyoxal using an incoherent broadband cavity enhanced absorption spectrometer, Atmos. Chem. Phys., 8, 7779–7793, https://doi.org/10.5194/acp-8-7779-2008, 2008.
Wu, T., Chen, W., Kerstel, E., Fertein, E., and Brückner, D.: Kalman Filtering Real-Time Measurements of H2O Isotopologue Ratios by Laser Absorption Spectroscopy at 2.73 µm, Opt. Lett., 35, 634–636, https://doi.org/10.1364/OL.35.000634, 2010.
Wu, T., Zha, Q., Chen, W., Xu, Z., Wang, T., and He, X.: Development and deployment of a cavity enhanced UV-LED spectrometer for measurements of atmospheric HONO and NO2 in Hong Kong, Atmos. Environ., 95, 544–551, https://doi.org/10.1016/j.atmosenv.2014.07.016, 2014.
Xue, C., Ye, C., Ma, Z., Liu, P., Zhang, Y., Zhang, C., Tang, K., Zhang, W., Zhao, X., Wang, Y., Song, M., Liu, J., Duan, J., Qin, M., Tong, S., Ge, M., and Mu, Y.: Development of stripping coil-ion chromatograph method and intercomparison with CEAS and LOPAP to measure atmospheric HONO, Sci. Total Environ., 646, 187–195, https://doi.org/10.1016/j.scitotenv.2018.07.244, 2019.
Zhou, X., Civerolo, K., Dai, H., Huang, G., Schwab, J., and Demerjian, K.: Summertime nitrous acid chemistry in the atmospheric boundary layer at a rural site in New York State, J. Geophys. Res.-Atmos., 107, ACH 13-11–ACH 13-11, https://doi.org/10.1029/2001jd001539, 2002.