the Creative Commons Attribution 4.0 License.
the Creative Commons Attribution 4.0 License.
 | 15 Dec 2020
Quantifying the impact of aerosol scattering on the retrieval of methane from airborne remote sensing measurements
Yunxia Huang
Zhao-Cheng Zeng
Pushkar Kopparla
Yuk L. Yung
As a greenhouse gas with strong global warming potential, atmospheric methane (CH4) emissions have attracted a great deal of attention. Although remote sensing measurements can provide information about CH4 sources and emissions, accurate retrieval is challenging due to the influence of atmospheric aerosol scattering. In this study, imaging spectroscopic measurements from the Airborne Visible/Infrared Imaging Spectrometer – Next Generation (AVIRIS-NG) in the shortwave infrared are used to compare two retrieval techniques – the traditional matched filter (MF) method and the optimal estimation (OE) method, which is a popular approach for trace gas retrievals. Using a numerically efficient radiative transfer model with an exact single-scattering component and a two-stream multiple-scattering component, we also simulate AVIRIS-NG measurements for different scenarios and quantify the impact of aerosol scattering in the two retrieval schemes by including aerosols in the simulations but not in the retrievals. The presence of aerosols causes an underestimation of CH4 in both the MF and OE retrievals; the biases increase with increasing surface albedo and aerosol optical depth (AOD). Aerosol types with high single-scattering albedo and low asymmetry parameter (such as water-soluble aerosols) induce large biases in the retrieval. When scattering effects are neglected, the MF method exhibits lower fractional retrieval bias compared to the OE method at high CH4 concentrations (2–5 times typical background values) and is suitable for detecting strong CH4 emissions. For an AOD value of 0.3, the fractional biases of the MF retrievals are between 1.3 % and 4.5 %, while the corresponding values for OE retrievals are in the 2.8 %–5.6 % range. On the other hand, the OE method is an optimal technique for diffuse sources (<1.5 times typical background values), showing up to 5 times smaller fractional retrieval bias (8.6 %) than the MF method (42.6 %) for the same AOD scenario. However, when aerosol scattering is significant, the OE method is superior since it provides a means to reduce biases by simultaneously retrieving AOD, surface albedo, and CH4. The results indicate that, while the MF method is good for plume detection, the OE method should be employed to quantify CH4 concentrations, especially in the presence of aerosol scattering.
- Article
(2093 KB) - Full-text XML
- BibTeX
- EndNote


Atmospheric methane (CH4) is about 85 times more potent per unit mass at warming the Earth than carbon dioxide (CO2) on a 20-year timescale (Myhre et al., 2013), implying that reduction in CH4 emissions could be very efficient to slow down global warming in the near term. Global mean CH4 concentrations have increased from ∼700 ppb in the preindustrial era to more than 1860 ppb as of 2019 (NOAA, 2019). The most effective sink of atmospheric CH4 is the hydroxyl radical (OH) in the troposphere. CH4 reacts with OH to reduce the oxidizing capacity of the atmosphere and generate tropospheric ozone. Increasing emissions of CH4 reduce the concentration of OH in the atmosphere. With less OH to react with, the lifespan of CH4 could also increase, resulting in greater CH4 concentrations (Holmes et al., 2013). Soils also act as a major sink for atmospheric methane through the methanotrophic bacteria that reside within them.
Significant natural CH4 sources include wetlands (Bubier and Moore, 1994; Macdonald et al., 1998; Gedney et al., 2004), geological seeps (Kvenvolden and Rogers, 2005; Etiope et al., 2009), ruminant animals, and termites. In addition, increased surface and ocean temperatures associated with global warming may increase CH4 emissions from melting permafrost (Woodwell et al., 1998; Walter et al., 2006; Schaefer et al., 2014; Schuur et al., 2015) and methane hydrate destabilization (Kvenvolden, 1988; Archer, 2007). Human activity also contributes significantly to the total CH4 emissions. Rice agriculture is one of the most important anthropogenic sources of CH4 (Herrero et al., 2016; Schaefer et al., 2016). Other sources include landfills (Themelis and Ulloa, 2007), wastewater treatment, biomass burning, and methane slip from gas engines. Global fugitive CH4 emissions from coal mining (Kort et al., 2014), natural gas and oil systems (Alvarez et al., 2018), hydraulic fracturing (“fracking”) of shale gas wells (Howarth et al., 2011; Howarth, 2015, 2019), and residential and commercial natural gas distribution sectors (He et al., 2019) are also of increasing concern. Although the sources and sinks of methane are reasonably well known, there are large uncertainties in their relative amounts and in the partitioning between natural and anthropogenic contributions (Nisbet et al., 2014, 2016). This uncertainty is exemplified by the CH4 “hiatus”, which refers to the observed stabilization of atmospheric CH4 concentrations from 1999–2006, and the renewed rise thereafter (Kirschke et al., 2013).
Satellite monitoring of CH4 can be broadly divided into three categories: solar backscatter, thermal emission, and lidar (Jacob et al., 2016). The first solar backscattering mission was SCIAMACHY (Frankenberg et al., 2006), which was operational from 2003–2012 and observed the entire planet once every 7 d. It was followed by GOSAT in 2009 (Kuze et al., 2016) and subsequently the next-generation GOSAT-2 in 2018 (Glumb et al., 2014). In between, the TROPOMI mission was also launched in 2017, which observes the planet once daily with a high spatial resolution of 7×7 km2 (Butz et al., 2012; Veefkind et al., 2012). CarbonSat (Buchwitz et al., 2013) is another proposed mission to measure CH4 globally from solar backscatter with a very fine spatial resolution (2×2 km2) and high precision (0.4 %). GHGSat-D (McKeever et al., 2017; Varon et al., 2019; Jervis et al., 2020) measures between 1630–1675 nm, with an effective pixel resolution of 50×50 m2 over targeted 12×12 km2 scenes, and is intended to detect CH4 emissions from individual industrial sites. In contrast, MethaneSAT (Wofsy and Hamburg, 2019) has a pixel size of 1–2 km2 and a wide field of view (200 km2) and can quantify diffuse CH4 emission sources over large areas. Thermal infrared observations of CH4 are available from the IMG (Clerbaux et al., 2003), AIRS (Xiong et al., 2008), TES (Worden et al., 2012), IASI (Xiong et al., 2013), and CrIS (Gambacorta et al., 2016) instruments. These instruments provide day and night measurements at spatial resolutions ranging from 5×8 km2 (TES) to 45×45 km2 (AIRS). GEO-CAPE (Fishman et al., 2012), GeoFTS (Xi et al., 2015), G3E (Butz et al., 2015), and GeoCarb (Polonsky et al., 2014) are proposed geostationary instruments (GeoCarb was selected by NASA under the Earth Venture – Mission program), which when operational will have resolutions of 2–5 km over regional scales. The MERLIN lidar instrument (Kiemle et al., 2014) scheduled for launch in 2021 will measure CH4 by employing a differential absorption lidar.
By combining a large number of footprints and high spatial resolution, airborne imaging spectrometers are also well suited for mapping local CH4 plumes. The Airborne Visible/Infrared Imaging Spectrometer – Next Generation (AVIRIS-NG) measures reflected solar radiance across more than 400 channels between 380 and 2500 nm (Green et al., 1998; Thompson et al., 2015). Strong CH4 absorption features present between 2100 and 2500 nm can be observed at a spectral resolution of 5 nm full width at half maximum (FWHM). A number of approaches have been developed to retrieve CH4 from such hyperspectral data. Roberts et al. (2010) used a spectral residual approach between 2000 and 2500 nm and Bradley et al. (2011) employed a band ratio technique using the 2298 nm CH4 absorption band and 2058 nm CO2 absorption band. However, these techniques are not suited for terrestrial locations that have lower albedos and have spectral structure in the shortwave infrared (SWIR). A cluster-tuned matched filter technique was demonstrated to be capable of mapping CH4 plumes from marine and terrestrial sources (Thorpe et al., 2013) as well as CO2 from power plants (Dennison et al., 2013); however, this method does not directly quantify gas concentrations. Frankenberg et al. (2005) developed an iterative maximum a posteriori differential optical absorption spectroscopy (IMAP-DOAS) algorithm that allows for uncertainty estimation. Thorpe et al. (2014) adapted the IMAP-DOAS algorithm for gas detection in AVIRIS imagery. In addition, they developed a hybrid approach using singular value decomposition and IMAP-DOAS as a complementary method of quantifying gas concentrations within complex AVIRIS scenes.
Accurate assessment of CH4 emissions is particularly challenging in the presence of aerosols because the latter introduce uncertainties in the light path if not accounted for. In fact, CH4 emissions are frequently correlated with pollution due to concurrent aerosol emissions. For large aerosols (such as dust), the low Ångström exponent values result in high aerosol optical depth (AOD) values even in the wavelength range from 2000 to 2500 nm (Seinfeld and Pandis, 2006; Zhang et al., 2015). Therefore, it is important to obtain a clear understanding of aerosol impacts on CH4 retrievals. In this study, SWIR AVIRIS-NG measurements are used to analyze the impact of aerosol scattering on CH4 retrievals. Further, using an accurate but numerically efficient radiative transfer (RT) model (Spurr and Natraj, 2011), we simulate AVIRIS-NG measurements with varying aerosol amounts and quantify the impact of aerosol scattering using two retrieval techniques, the traditional matched filter (MF) method and the optimal estimation (OE) method that is widely used in trace gas remote sensing. This article is organized as follows. The MF and OE retrieval methods are described in Sect. 2. Section 3 focuses on analysis of a sample CH4 plume detected by AVIRIS-NG measurements and compares retrievals using the MF and OE methods. Section 4 presents a detailed evaluation of aerosol impacts on the two retrieval methods through simulations of AVIRIS-NG spectra for different geophysical parameters. Section 5 provides a summary of the work and discusses future research.
2.1 MF method
Real-time remote detection using AVIRIS-NG measurements is traditionally based on the MF method (Frankenberg et al., 2016). In this method, the background spectra are assumed to be distributed as a multivariate Gaussian 𝓝 with covariance matrix Σ and background mean radiance μ. If H0 is a scenario without CH4 enhancement and H1 is one with CH4 enhancement, the MF approach is equivalent to a hypothesis test between the two scenarios:
where Lm is the measurement radiance; t is the target signature, which is defined in Eq. (4); and α is the enhancement value, denoting a scaling factor for the target signature that perturbs the background μ. If x is a vector of measurement spectra with one element per wavelength, α(x) can be written, based on maximum likelihood estimates (Manolakis et al., 2014), as follows:
We utilize the same definitions as in Frankenberg et al. (2016). Specifically, the enhancement value α(x) denotes the thickness and concentration within a volume of equivalent absorption and has units of parts per million × meter (ppm × m). The target signature t refers to the derivative of the change in measured radiance with respect to a change in absorption path length due to an optically thin absorbing layer of CH4. Note that this definition has the disadvantage that the accuracy of the result degrades when the absorption is strong and further attenuation becomes nonlinear. At a particular wavelength λ, t can be expressed as
where κ is the absorption coefficient for a near-surface plume with units of ppm−1 m−1. This is different from the units of m2 mol−1 traditionally used for the absorption coefficient κtrad in trace gas remote sensing. Using the ideal gas law to express the volume V (in liters) occupied by 1 mol of CH4 at the temperature and pressure corresponding to the plume altitude (V=22.4 at standard temperature and pressure), and the relations 1 L m3 and 1 ppm , we obtain the following expression for unit conversion (units in parentheses):
Figure 1 shows the target signature, which is calculated based on HITRAN absorption cross sections (Rothman et al., 2009). The background mean radiance μ used in Eq. (4) is based on the AVIRIS-NG measurement shown in Fig. 2; this is described in more detail in Sect. 3.
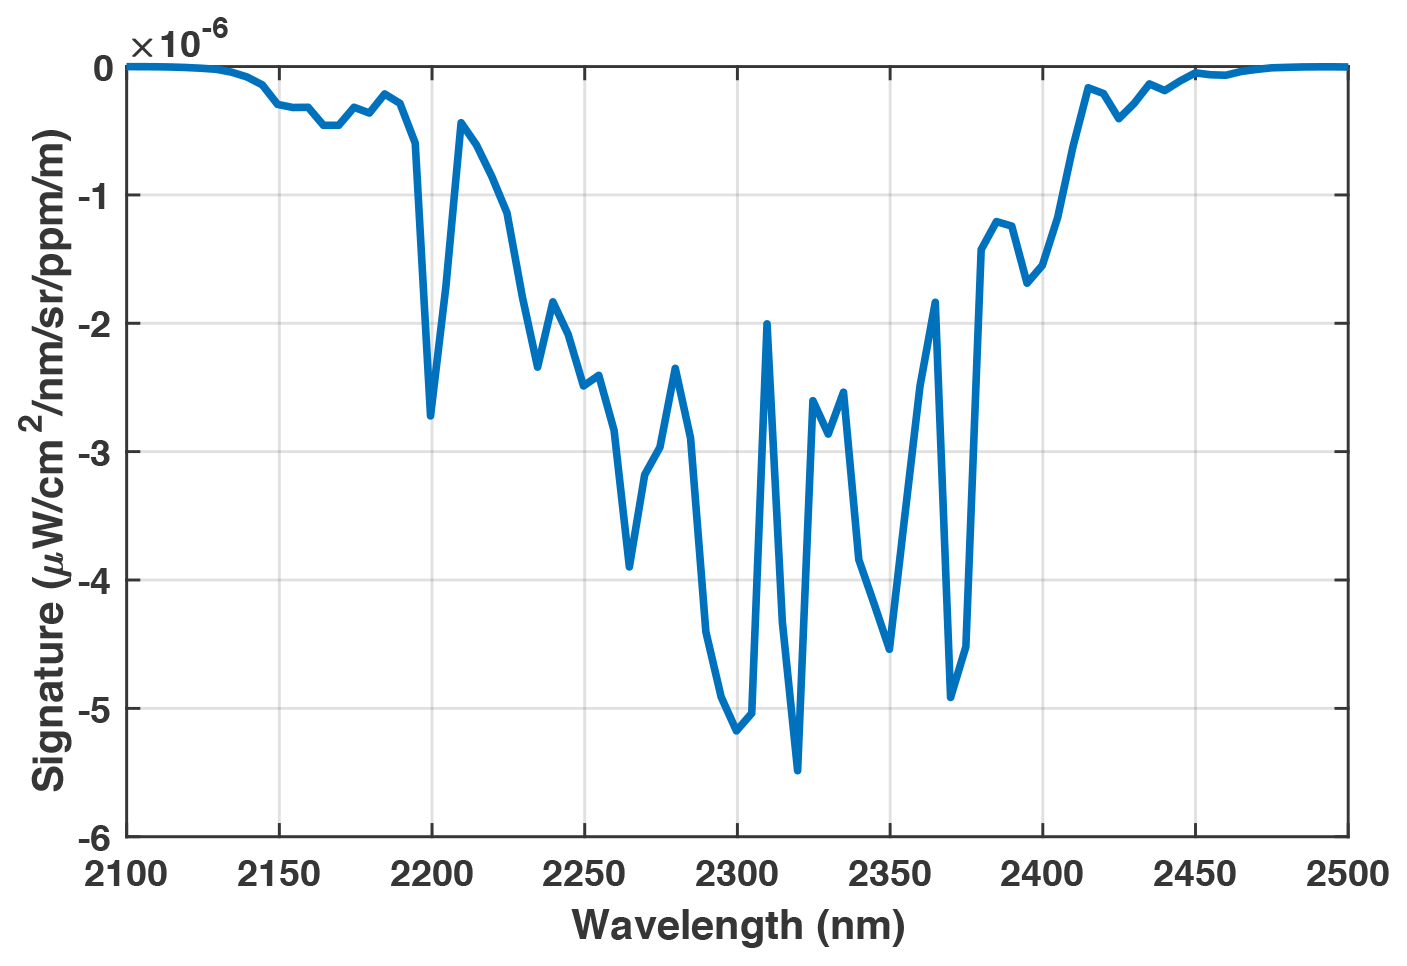
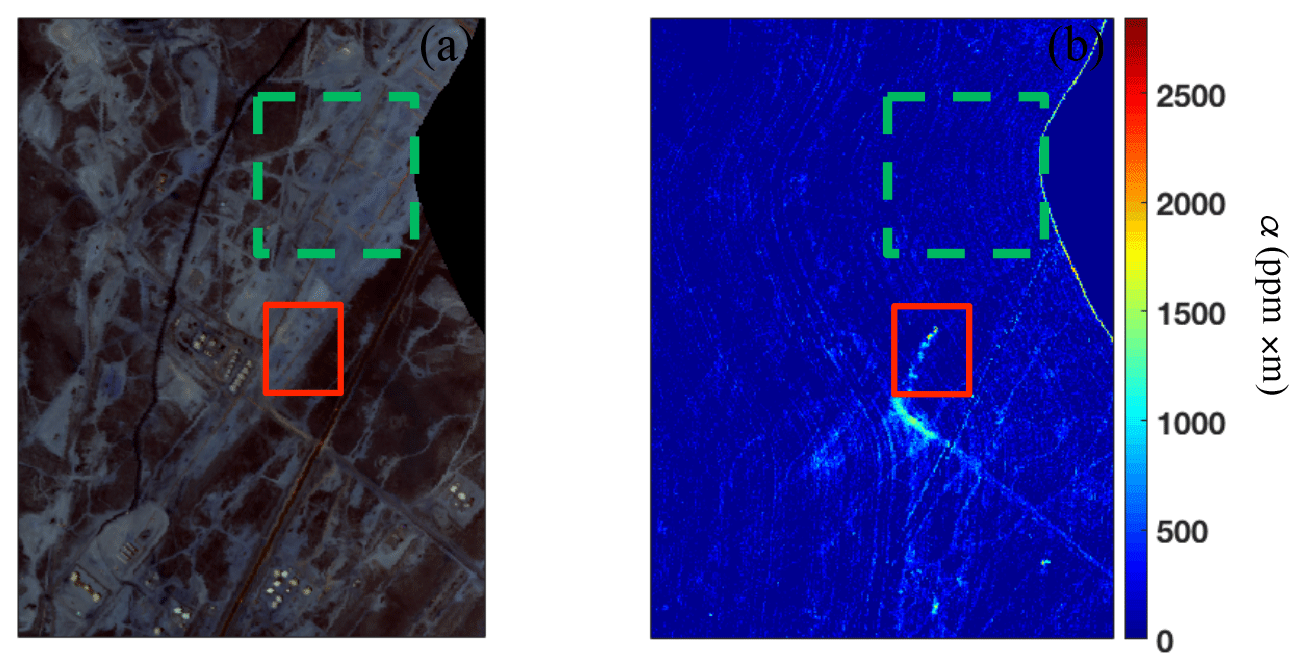
Figure 2(a) RGB image of flight data from 4 September 2014 (ang20140904t204546). Adapted from Thompson et al. (2015). (b) CH4 enhancement value α (ppm × m) obtained by the MF method. An emission source is shown in the solid red box and the background region near the target for the MF calculation is indicated by the dashed green box.
2.2 OE method
The OE method is widely used for the remote sensing retrieval of satellite measurements, such as from the Orbiting Carbon Observatory-2 (OCO-2; O'Dell et al., 2018), the Spinning Enhanced Visible and InfraRed Imager (SEVIRI; Merchant et al., 2013), and the Greenhouse Gases Observing Satellite (GOSAT; Yoshida et al., 2013). It combines an explicit (typically nonlinear) forward model of the atmospheric state, a (typically Gaussian) prior probability distribution for the variabilities and a (typically Gaussian) distribution for the spectral measurement errors. In addition, the Bayesian framework used by the OE approach allows new information (from measurements) to be combined with existing information (e.g., from models). In many applications, the forward model is nonlinear, and obtaining the optimal solution requires iterative techniques such as the Levenberg–Marquardt method (Rodgers, 2000), which has been routinely applied to study the impacts of measurement parameters on the retrieval process (see, e.g., Zhang et al., 2015). The iteration in this algorithm follows the procedure below.
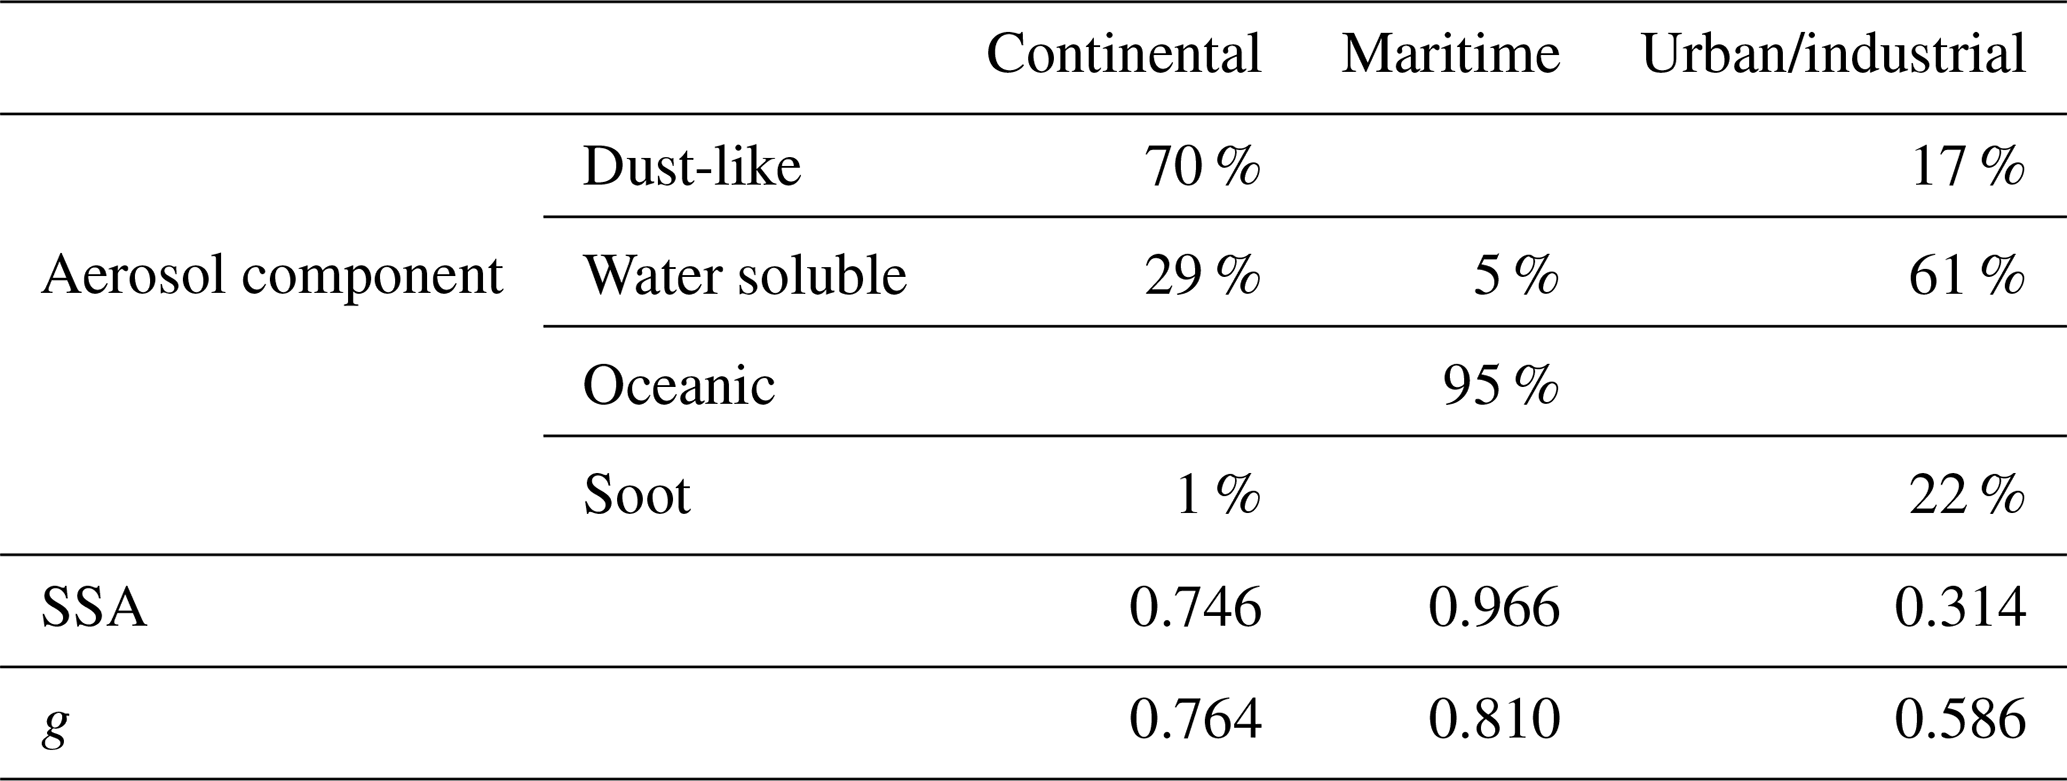
where x is a state vector of surface and atmospheric properties, Sa is the a priori covariance matrix, Sϵ is the spectral radiance noise covariance matrix, K is the Jacobian matrix, xa is the a priori state vector, and γ is a parameter determining the size of each iteration step. The measured spectral radiance is denoted as y; F(x) is the simulated radiance obtained from the forward model. For the retrieval of CH4 from AVIRIS-NG measurements, the state vector includes the total column amounts of CH4 and H2O, while for the retrievals from synthetic spectra, the H2O concentration is fixed and the state vector only includes the CH4 total column. The a priori values are within 10 % of the true values; a priori errors are assumed to be 20 % for all state vector elements. The retrieved results are shown as the column-averaged mixing ratio (XCH4, ppm). Aerosols are not included in the state vector for both the real and synthetic retrievals. They are, however, considered in the forward model for the synthetic simulations. Table 1 (WCRP, 1986) lists optical properties for four basic aerosol types (dust, water soluble, oceanic, and soot). Table 2 (WCRP, 1986) shows the corresponding properties for three aerosol models that are defined as mixtures of the basic components from Table 1. We employ the Henyey–Greenstein phase function (Henyey and Greenstein, 1941), where aerosol composition is determined by two parameters: single-scattering albedo (SSA) and asymmetry parameter (g). The surface albedo is also not retrieved; for both real and synthetic retrievals, it is held fixed and assumed to be independent of wavelength.
Table 1Optical properties of basic aerosol types (WCRP, 1986).
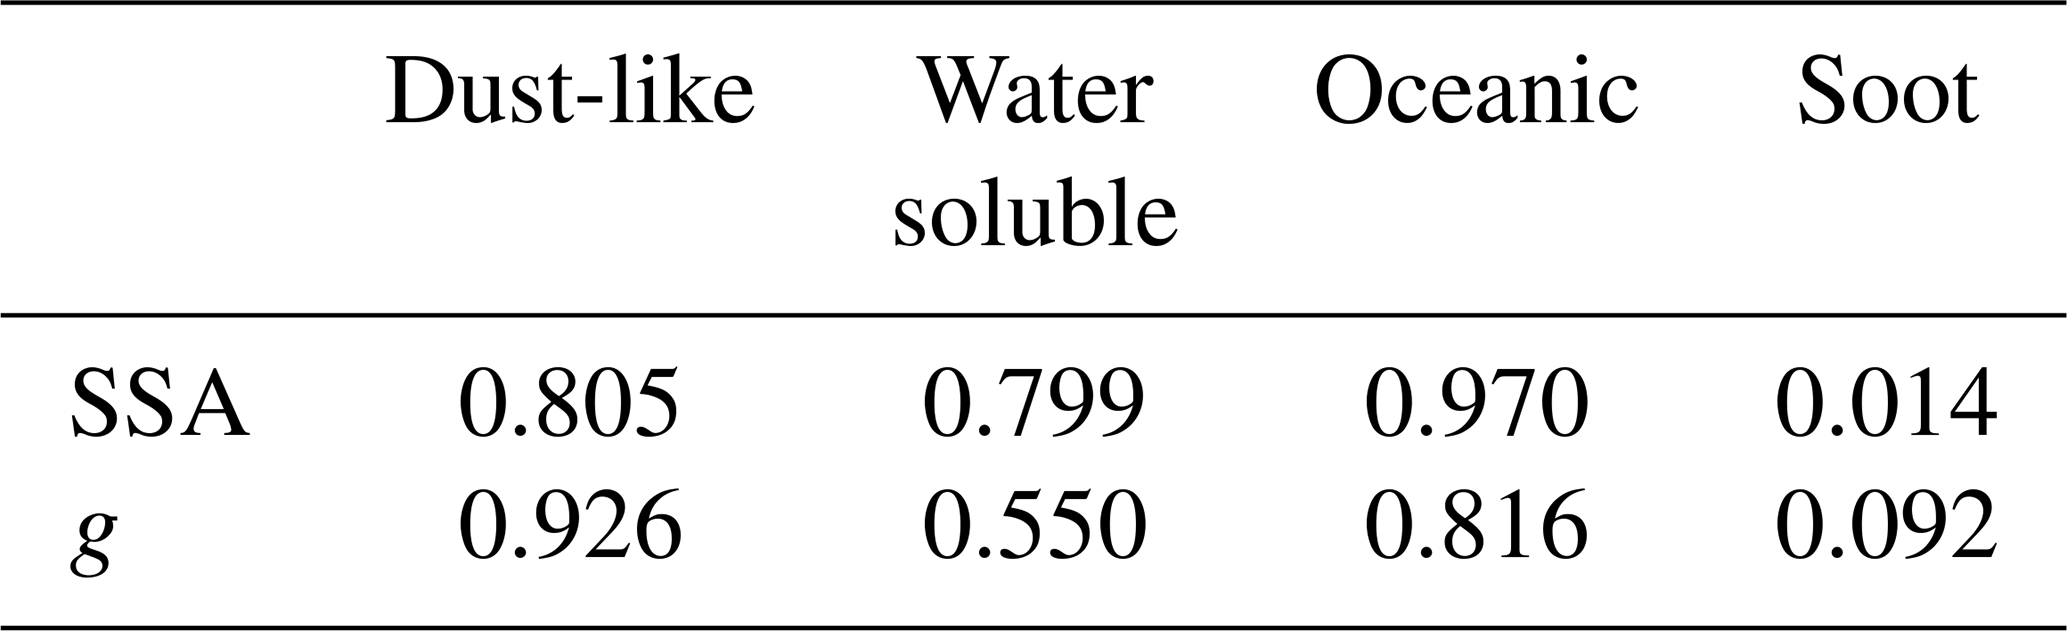
Table 2Optical properties of three aerosol mixture models (WCRP, 1986).
To illustrate the OE retrieval and its difference from the MF method, we perform retrievals for an AVIRIS-NG measurement made on 4 September 2014 (ang20140904t204546) in Bakersfield, CA, as shown in Fig. 2. The location is to the west of the Kern Front oil field. This detection is a case study from the NASA–ESA CO2 and MEthane eXperiment (COMEX) campaign in California during June and August–September 2014, which includes airborne in situ, airborne non-imaging remote sensing, and ground-based in situ instruments to provide a real-time remote detection and measurement for CH4 plumes released from anthropogenic sources. An RGB image of flight data is displayed in Fig. 2a; the emission source is a pump jack, as described in Thompson et al. (2015). Figure 2b presents results from the MF method, which shows that the CH4 plume disperses downwind and has a maximum enhancement value of about 2800 ppm × m. Some artifacts caused by surfaces with strong absorption in the 2100–2500 nm wavelength range, such as oil-based paints or roofs with calcite as a component (Thorpe et al., 2013), also produce large α values in the MF method; these can be removed by an optimization method such as the columnwise MF technique (Thompson et al., 2015).
Figure 3 displays the measured radiance (a) before normalization and (b) after normalization, corresponding to two detector elements (in plume and out of plume). Every element is a cross-track spatial location. The normalization is done by calculating the ratio of the radiance to the maximum value across the spectral range, such that the values fall between 0 and 1. This is a first-order correction for the effects of surface albedo. Comparing the measured spectrum in plume to that out of plume, there is obvious enhancement of CH4 that is particularly evident in the normalized radiance. CH4 is the main absorber in the 2100–2500 nm wavelength range, and H2O is the major interfering gas. Figure 3b indicates the absorption peaks due to H2O and CH4.
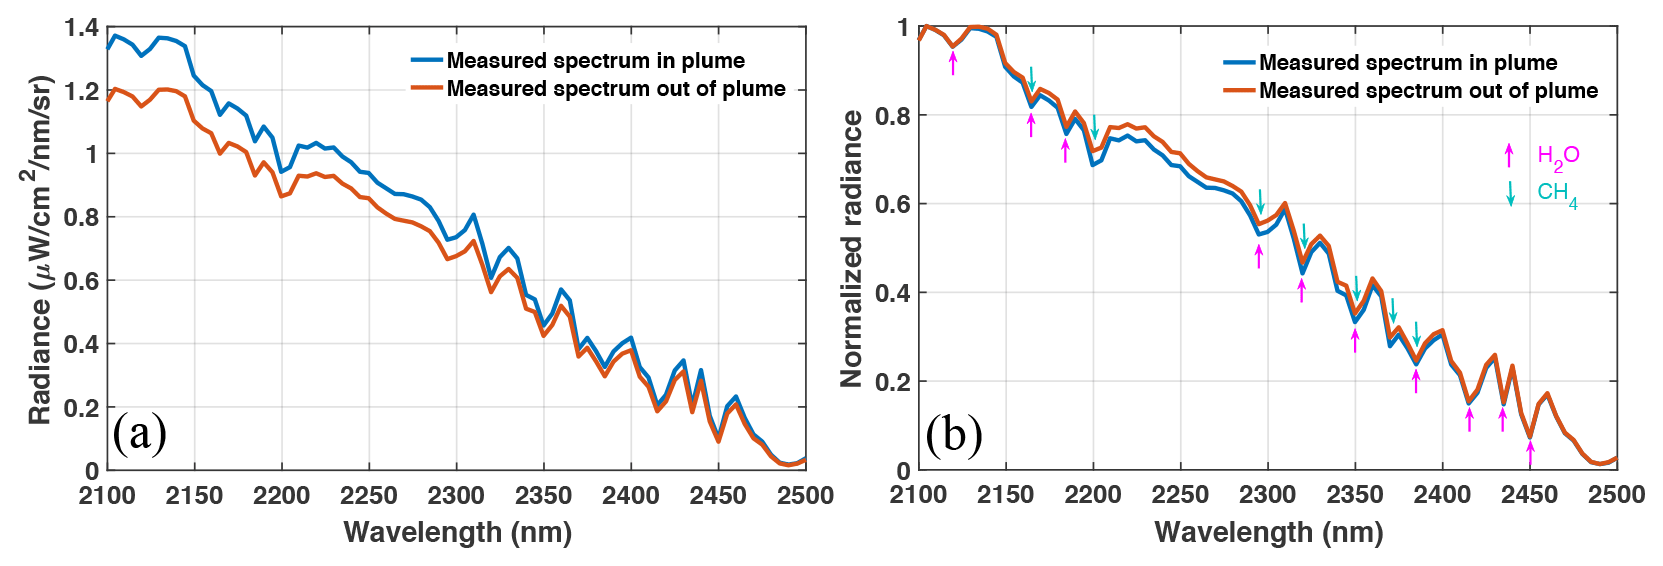
Figure 3(a) Real radiance and (b) normalized radiance at cross-track detector elements (in and out of plume) from the sample AVIRIS-NG measurement. The colored arrows in (b) show the main absorption features due to H2O (purple) and CH4 (green).
We choose the plume center with 500 elements to illustrate results obtained using the MF and OE methods. The former evaluates the CH4 α value compared to the background CH4 concentration, while the latter retrieves XCH4. In the MF method, the background covariance matrix Σ and mean radiance μ are drawn from a reference region close to the CH4 emission source. These are shown in Fig. 2, where the dashed green box denotes the reference region and the source is located within the solid red box. In the OE method, results are shown as a multiplicative scaling factor compared to a typical XCH4 background of 1.822 ppm. This value is the globally averaged marine surface annual mean for 2014 (Ed Dlugokencky, NOAA/GML, 2020, https://www.esrl.noaa.gov/gmd/ccgg/trends_ch4/, last access: 27 November 2020), the year corresponding to the AVIRIS-NG measurement being studied. We use the accurate and numerically efficient two-stream-exact-single-scattering (2S-ESS) RT model (Spurr and Natraj, 2011). This forward model is different from a typical two-stream model in that the two-stream approximation is used only to calculate the contribution of multiple scattering to the radiation field. Single scattering is treated in a numerically exact manner using all moments of the phase function. This model has been used for remote sensing of greenhouse gases and aerosols (Xi et al., 2015; Zhang et al., 2015, 2016; Zeng et al., 2017, 2018). Aerosols are neither included in the forward model nor retrieved in this analysis. The surface albedo is set to a wavelength-independent value of 0.5.
Results from the two retrieval methods reveal a similar CH4 plume shape (Fig. 4), especially for elements with high CH4 enhancement. However, larger differences in CH4 concentrations are evident in the OE retrievals (Fig. 4b). Since radiance normalization reduces the impact of surface albedo and aerosols are not included in either retrieval, this might be due to the fact that, in the OE method, H2O and CH4 are simultaneously retrieved; the CH4 retrieval has added uncertainty due to overlapping absorption features between these two gases. The large maximum value of about 3000 in the MF method also contributes to a reduction in relative contrast. While these results provide heuristic information about the relative performance of the two retrieval techniques, it is difficult to compare the CH4 enhancement directly between the two methods since the background CH4 concentration used in the MF method cannot be quantified exactly. Further, evaluating retrieval biases due to ignoring aerosol scattering is not trivial when real measurements are used. Therefore, we simulate synthetic spectra (see Sect. 4) using the 2S-ESS RT model to study the impacts of aerosol scattering as a function of different geophysical parameters by varying them in a systematic manner.
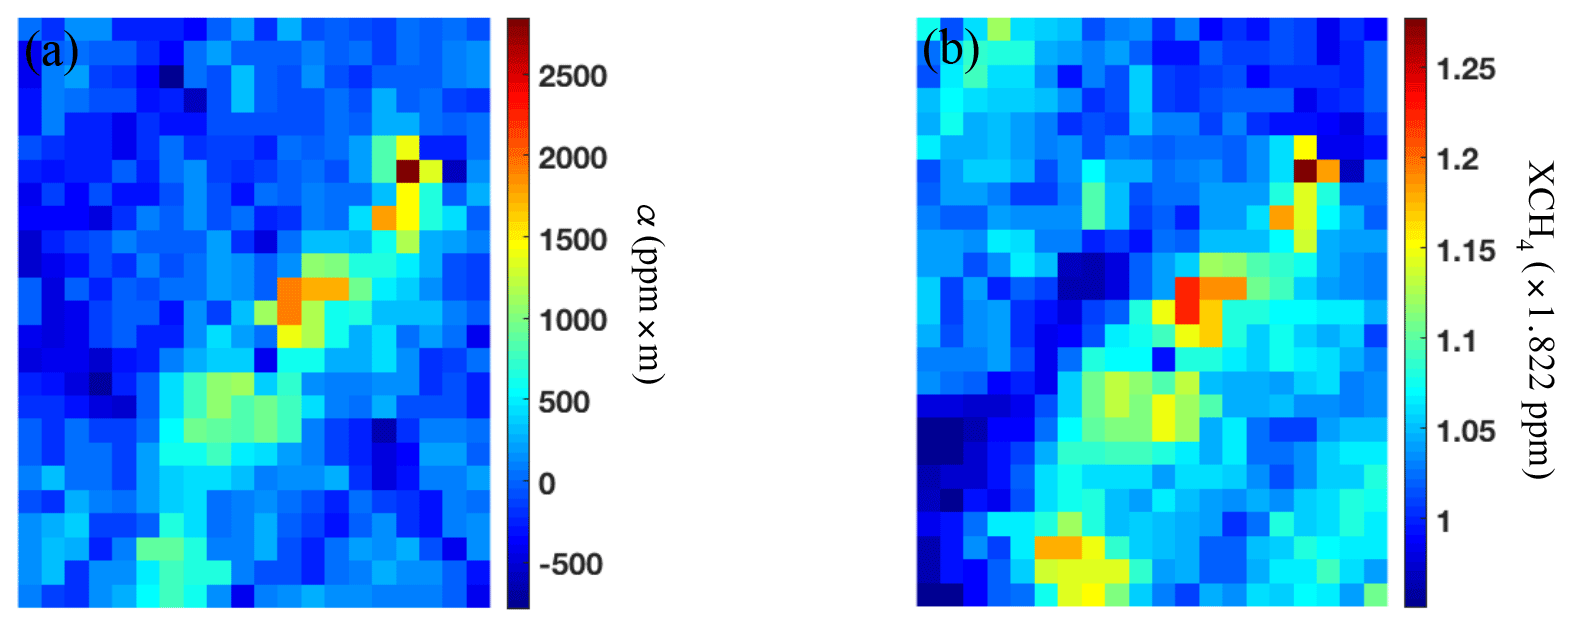
Figure 4Retrieval image for the plume center (500 elements) based on the (a) MF method and (b) OE method.
4.1 Synthetic spectra
In a real AVIRIS-NG observation, the exact column concentration of CH4 cannot be controlled. However, synthetic simulations allow us to manipulate parameters such as CH4 concentration, surface albedo, AOD, g, and SSA and thereby test aerosol impacts on CH4 retrievals. The 2S-ESS RT model is used to simulate the AVIRIS-NG spectral radiance. In this model, a prior atmospheric profile with 70 layers from the surface up to 70 km is derived from National Center for Environmental Prediction reanalysis data (Kalnay et al., 1996); absorption coefficients for all relevant gases are obtained from the HITRAN database (Rothman et al., 2009). Monochromatic RT calculations are performed at a spectral resolution of 0.5 cm−1; the radiance spectrum is then convolved using a Gaussian instrument line shape function with a wavelength-dependent full width at half maximum (FWHM) from a calibrated AVIRIS-NG data file. The signal-to-noise ratio (SNR) is set to be 300, with Gaussian white noise added. This procedure results in a wavelength grid with a resolution of about 5 nm. The spectral wavelength range used to retrieve CH4 is from 2100 to 2500 nm.
The additional atmospheric and geometric variables included in the model are listed in Table 3, which are held constant unless otherwise mentioned. The observation geometry parameters are taken from a real AVIRIS-NG measurement. Recent AVIRIS-NG flight campaigns have sensor heights ranging from 0.43 to 3.8 km; we choose a value of 1 km, the same as the highest level where aerosol is present in our simulations. The influence of AOD on CH4 retrieval as a function of SSA and g is analyzed in Sect. 4.3; in all other cases, SSA and g are held constant at 0.95 and 0.75, respectively, which is representative of aerosols in the Los Angeles region (Zhang et al., 2015).

4.2 Aerosol impact in the MF method
We simulate synthetic spectra at different AOD, surface albedo, and CH4 concentration values; use the MF method to obtain the CH4 enhancement; and compare differences in α between scenarios without and with aerosol. The covariance matrix and background mean radiance are calculated from a simulated zero AOD background with surface albedos from 0.1 to 0.5 and XCH4 set at the typical background value of 1.822 ppm used in Sect. 3. Figure 5a shows the enhancement value as a function of XCH4. As the CH4 concentration increases, the enhancement value obtained by the MF method at first increases approximately linearly. However, the absorption changes in a nonlinear fashion with concentration, whereas the MF method applies a linear formalism to the change. Therefore, the enhancement value (which is correlated with the absorption signature) also shows a deviation from linear behavior at larger XCH4. Two aerosol scenarios (AOD =0, 0.3) are compared in Fig. 5a, which reveals that the effect of aerosol loading is similar to an underestimation of CH4 in the retrieval. The underestimation, which is due to the shielding of CH4 absorption below the aerosol layer and the fact that multiple-scattering (MS) effects between the aerosol and the surface are ignored, is clearly shown in Fig. 5b, where the enhancement value for fixed CH4 concentration (same concentration as the background) decreases from 0 ppm × m to −1532 ppm × m with increasing AOD. To clarify the impact of AOD at different surface albedo values, zoomed-in versions of α as a function of XCH4 are presented in Fig. 5c–f. For the AOD =0 scenario, the results are independent of surface albedo. This is because there are no MS effects between the surface and the atmosphere (Rayleigh scattering is negligible in the retrieval wavelength range) when there is no aerosol loading. For the scenarios with aerosol loading, the dispersion in the zero-enhancement XCH4 value between different surface albedos indicates that results from the MF method are biased more at large AOD and surface albedo values (Fig. 5d–f). This is a consequence of increased multiple scattering between the aerosol layer and the surface that is not accounted for by the retrieval algorithm. The maximum bias value is close to −700 ppm × m (equivalent to ppm relative to the background concentration of 1.0×1.822 ppm) for an AOD of 0.3 and surface albedo of 0.5 (Fig. 5f). The implication of these results is that accurate knowledge of the surface albedo is important for MF retrievals, especially when the aerosol loading is large.
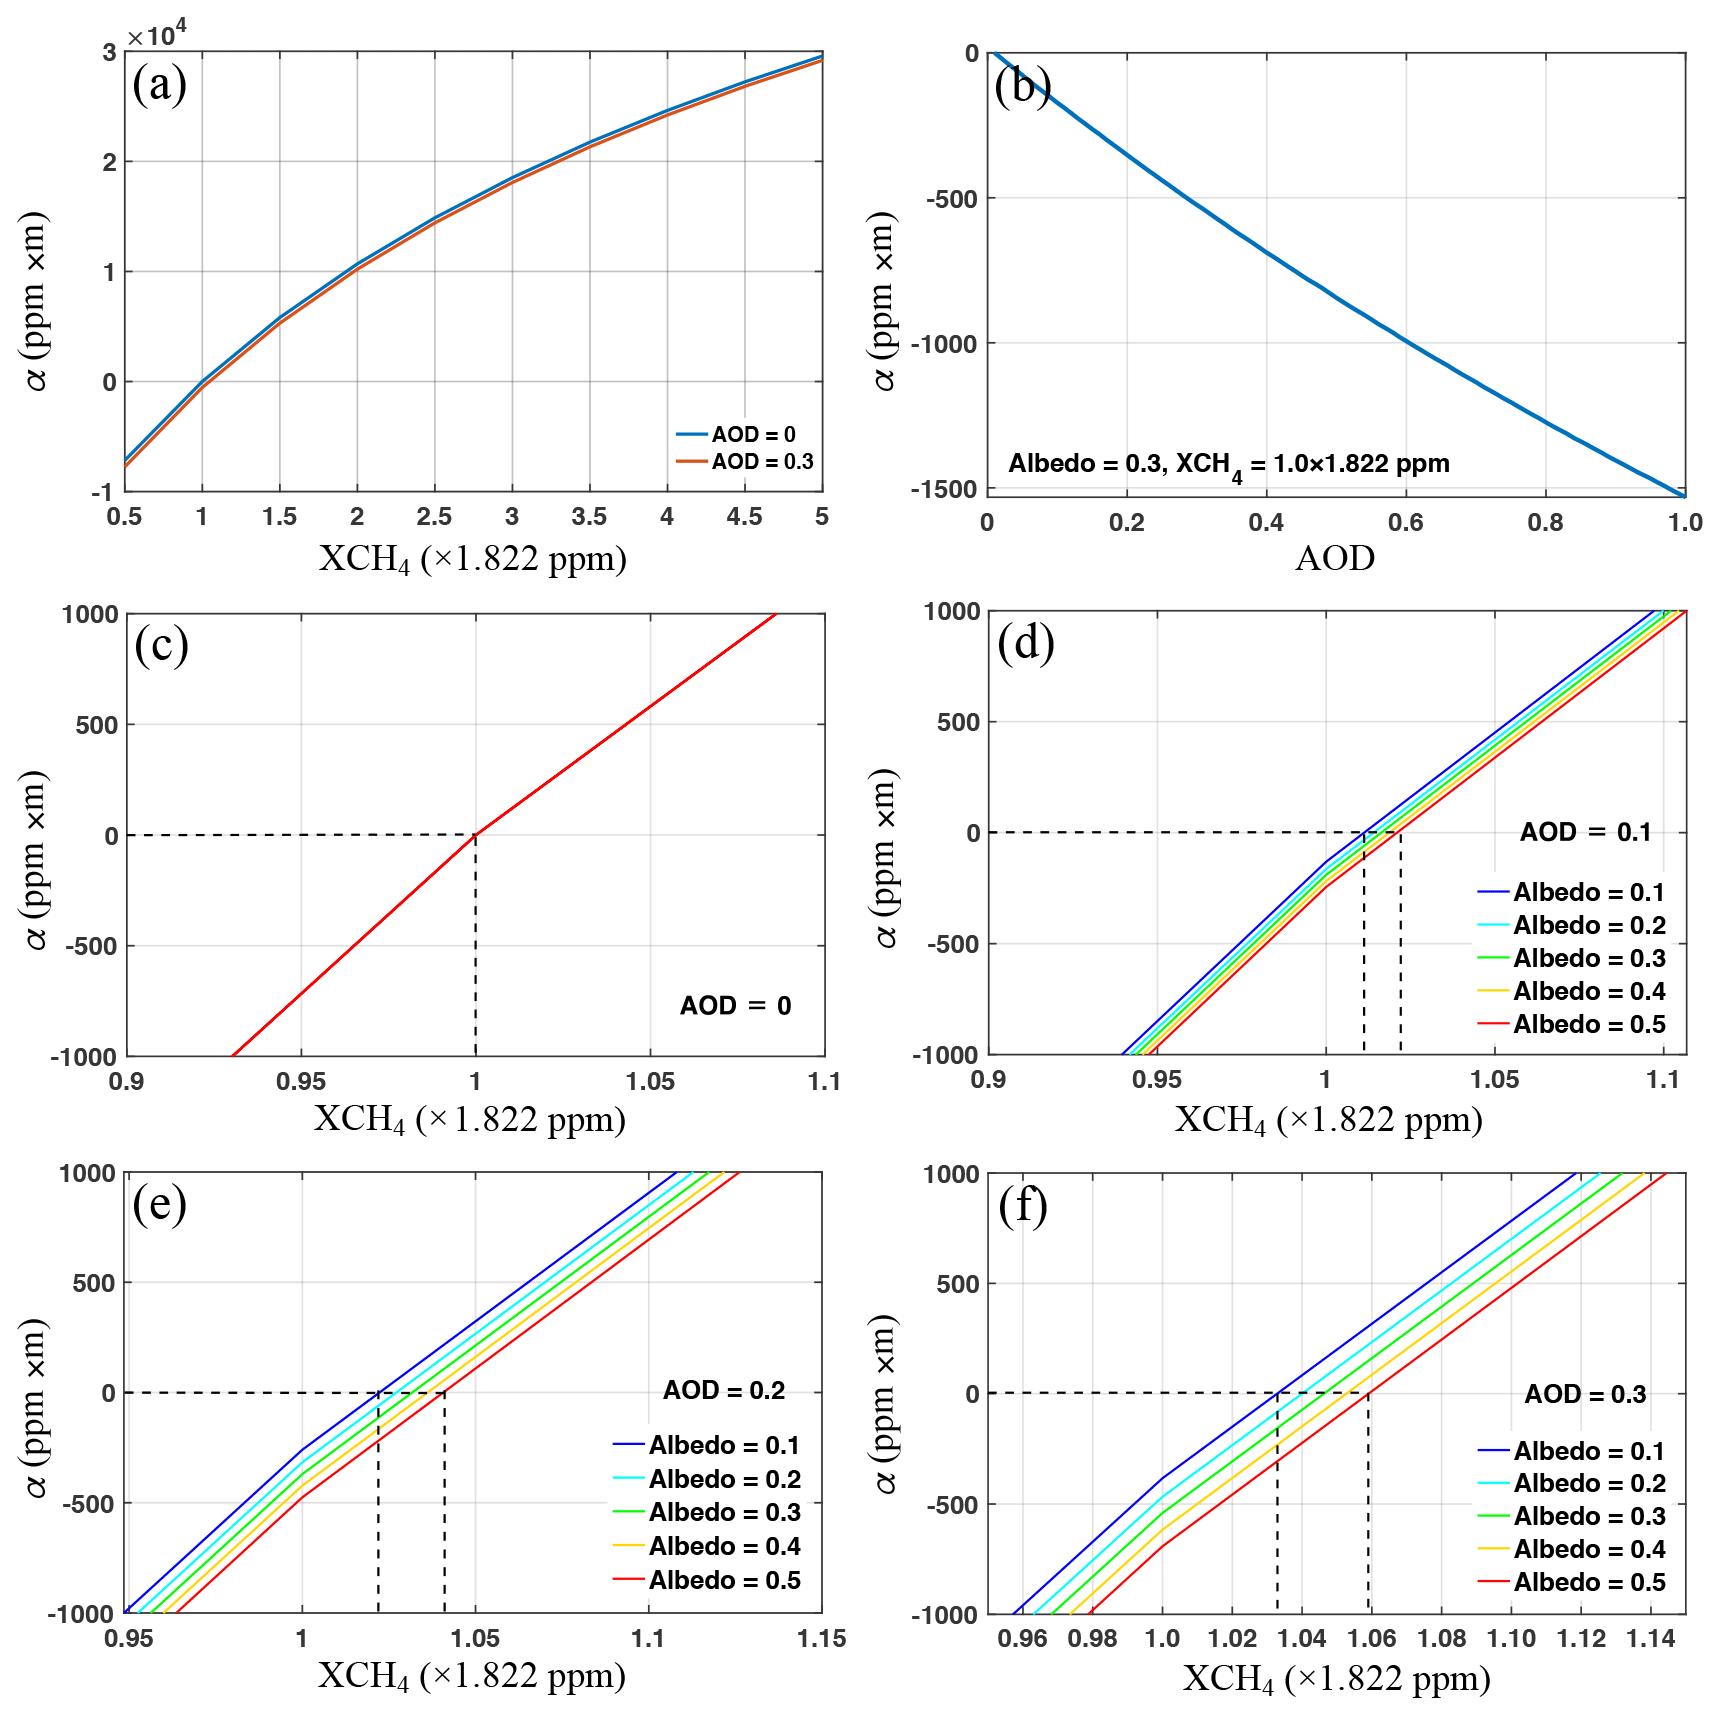
Figure 5(a) α as a function of XCH4 for AOD =0 and AOD =0.3 (surface albedo =0.3). (b) α as a function of AOD (XCH4 ppm, surface albedo =0.3). Zoomed-in versions of α as a function of XCH4 for different surface albedos (0.1–0.5), where (c) AOD =0, (d) AOD =0.1, (e) AOD =0.2, and (f) AOD =0.3.
A quantitative analysis of underestimation of CH4 concentration due to aerosol scattering is presented in Fig. 6. The color bar shows the α bias – which is defined as the difference between the enhancement value without aerosol (true α value) and that with aerosol – for different CH4 concentrations, surface albedos, and AODs. A positive bias means that CH4 is underestimated. The α bias increases with increasing surface albedo and AOD, reaching a maximum value of about 700 ppm × m for the simulated cases. However, it is interesting that the bias decreases with increasing CH4 concentration, which is different from the results obtained by the OE method (discussed in Sect. 4.3). This surprising behavior is a direct consequence of the physical basis of the MF method. The rate of increase in enhancement becomes smaller as XCH4 becomes larger (Fig. 5a). Therefore, at higher XCH4 values, the addition of aerosols (which has a similar effect as a reduction in XCH4) results in a lower reduction in enhancement compared to that at lower XCH4 values, resulting in a net decrease in the enhancement bias.
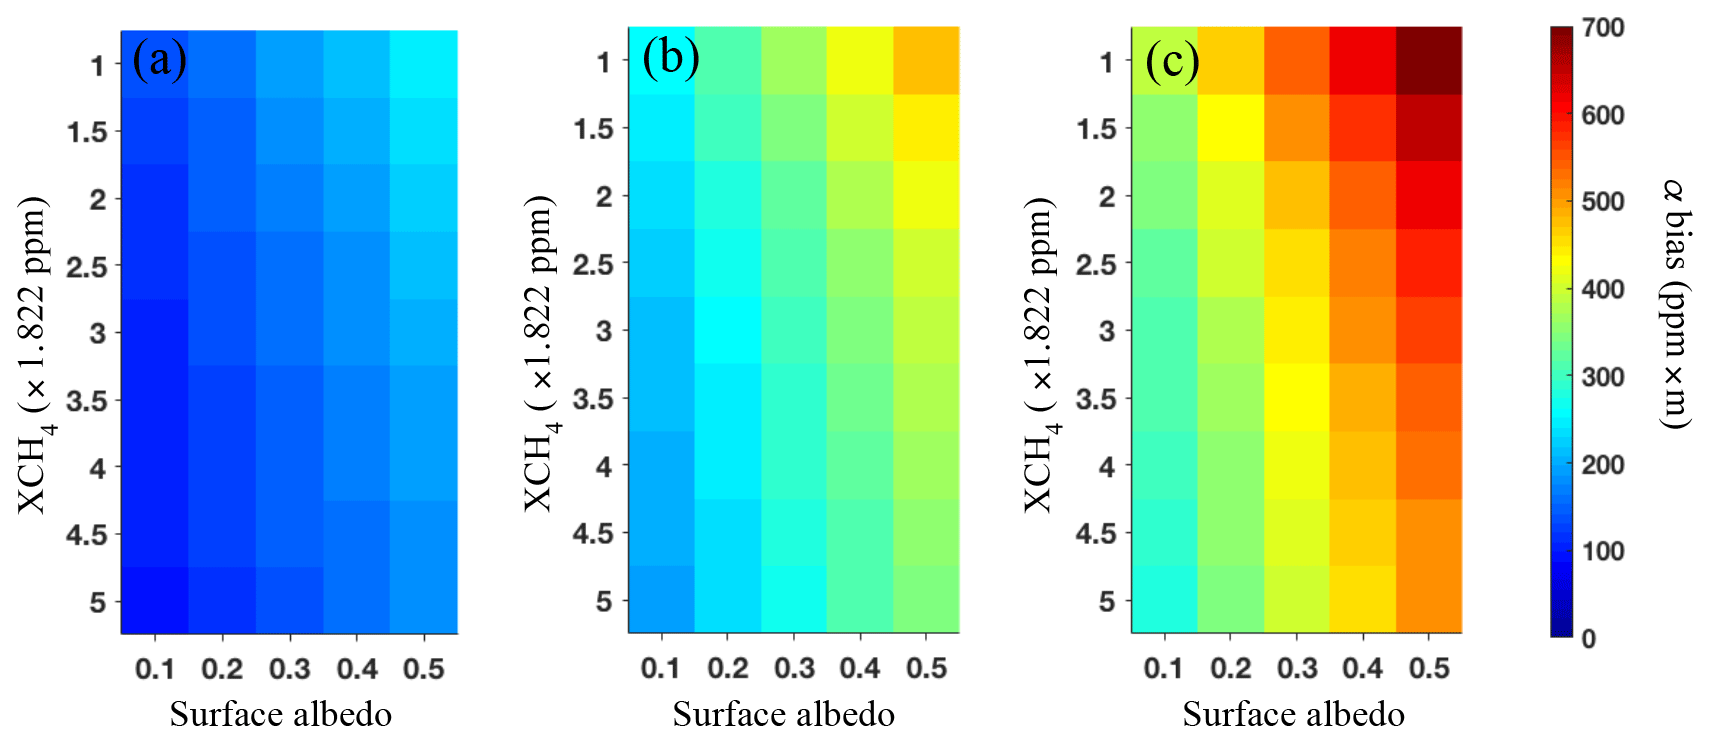
Figure 6Bias in α as a function of XCH4 and surface albedo for (a) AOD =0.1, (b) AOD =0.2, and (c) AOD =0.3.
4.3 Aerosol impact in the OE method
For the simulation of the synthetic spectra, we assume nonzero aerosol loading below 1 km elevation. The OE method is then used to perform retrievals using the same configuration (including, in particular, the same surface albedo) except that AOD is set to zero. This approach is similar to neglecting aerosol scattering in the CH4 retrieval; the retrieval bias is defined as the difference between the true XCH4 in the simulation and the retrieved value (positive values refer to underestimation). First, we study the retrieval bias caused by different aerosol types and mixtures. Figure 7a shows CH4 retrieval biases as a function of SSA and g; surface albedo and AOD are kept constant at 0.3 and XCH4 is assumed to be 1.0×1.822 ppm. The retrieval bias increases with SSA and decreases with g, with a maximum bias ratio (ratio of retrieval bias to the true value) of about 20 %. This behavior can be explained as follows. At higher SSA values, there are more MS effects (that are ignored in the retrieval). On the other hand, larger values of g imply greater anisotropy of scattering (preference for forward scattering), leading to a reduction in MS effects. Since the retrieval bias is large for high SSA and low g, the water-soluble aerosol type (Table 1) and the maritime aerosol model (Table 2) can be expected to induce greater biases in the retrieval. In order to compare the impacts of SSA and g in further detail, retrieval results due to a ±5 % change in SSA and g for the three aerosol models from Table 2 are shown in Fig. 7b and c. Note that for the maritime aerosol model, the SSA is set to 0.999 for the +5 % scenario to ensure physicality. It is clear that (1) the maritime aerosol model induces larger retrieval biases than the other aerosol types, and (2) the retrieval results are more sensitive to changes in g than those in SSA.
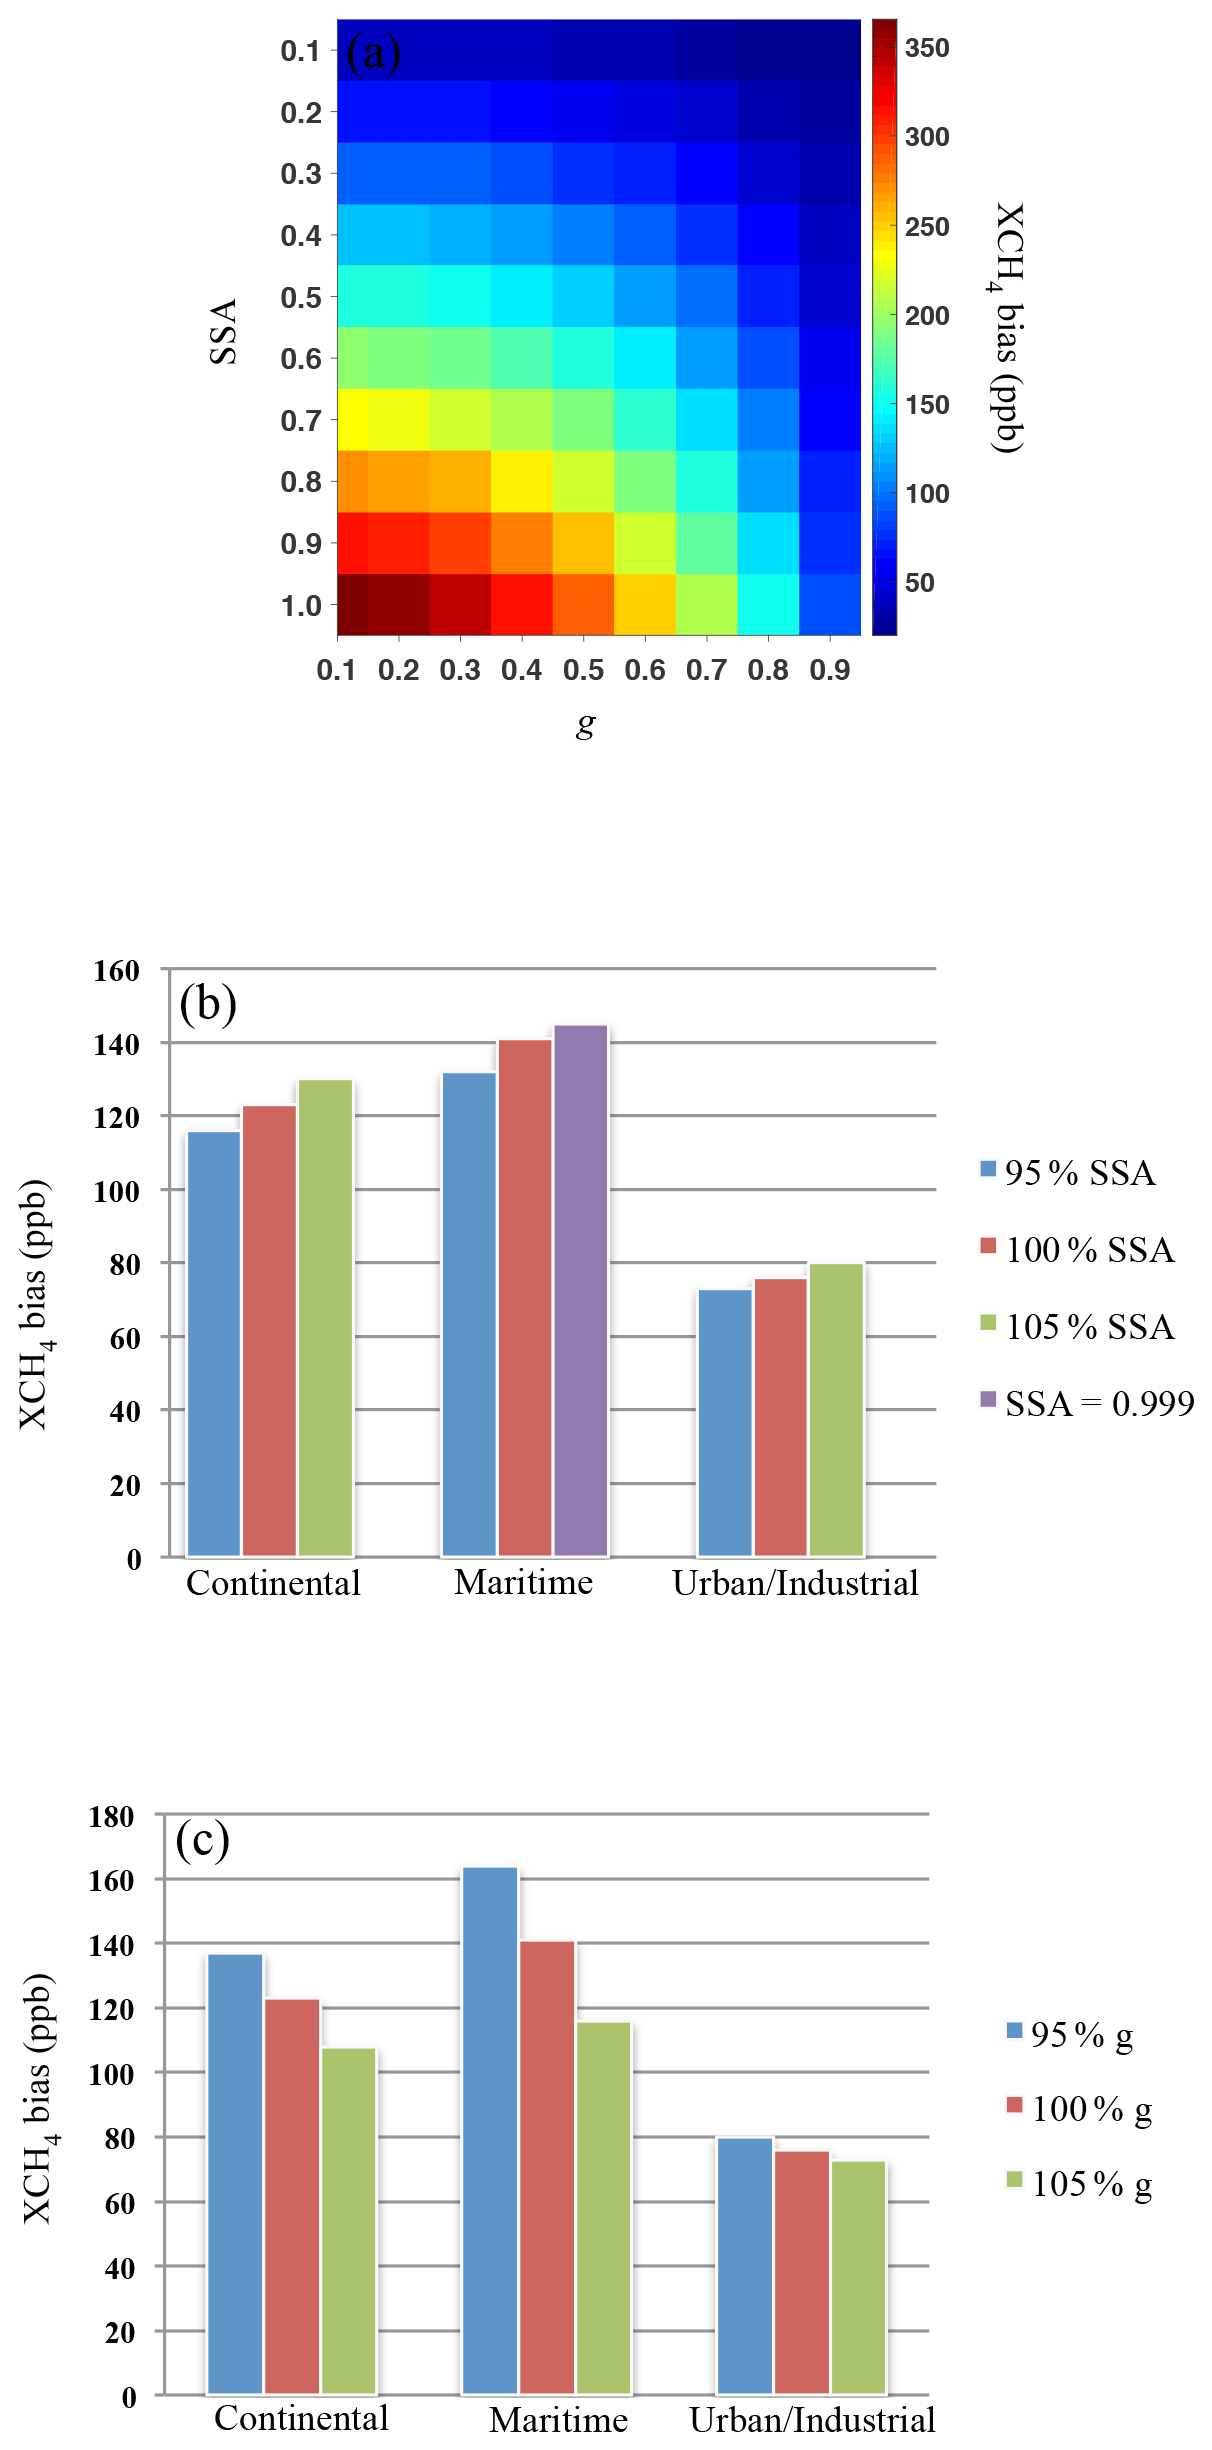
Figure 7(a) CH4 retrieval biases for different values of g and SSA. Surface albedo, AOD =0.3, XCH4 ppm. (b) CH4 retrieval biases for a ±5 % change in SSA for the three aerosol mixture models. (c) Same as (b), but for a ±5 % change in g.
We then simulate synthetic spectra for different values of CH4 concentration, surface albedo, and AOD. The impacts of aerosol scattering on the retrievals for these scenarios are demonstrated in Fig. 8. Figure 8a shows a 5×5 panel of boxes. Within each box, XCH4 is constant, while surface albedo increases from top to bottom and AOD increases from left to right. The variation in XCH4 across the boxes is shown in Fig. 8b. We also show a zoomed-in plot of the bottom right box (XCH4 ppm) in Fig. 8c, which illustrates the AOD and surface albedo changes within a box. These changes are identical for all boxes. Figure 8a indicates that OE retrievals produce larger CH4 biases at higher XCH4 values, in contrast with MF results. In addition, it is evident that the retrieved CH4 bias increases with increasing AOD. The CH4 bias induced by differences in the surface albedo is not as large as that due to AOD variations, but surface albedo effects are noticeable at large AOD. Figure 8d shows the sensitivity of retrieval biases to changes in AOD and surface albedo, again demonstrating the greater impact of AOD than surface albedo in the retrieval.

Figure 8(a) CH4 retrieval biases for different values of XCH4, AOD, and surface albedo. g=0.75; SSA =0.95. (b) XCH4 for each box in (a). (c) Zoomed-in plot of bottom right box (XCH4 ppm). The x and y axes show the variation in AOD and surface albedo, respectively. These changes are identical for every box in (a). (d) CH4 retrieval biases for a ±5 % change in AOD and surface albedo from a base value of 0.3 (g=0.75, SSA =0.95, XCH4 ppm).
The effects of changing the a priori, a priori error, and RT simulation spectral resolution on the retrieved XCH4 are shown in Fig. 9. For these calculations, the other parameters are set as follows: SSA =0.95, g=0.75, AOD =1.0, surface albedo =0.5, and true XCH4 ppm. The parameters were chosen to correspond to the scenario with the largest retrieval bias in Fig. 8c (bottom right box in Fig. 8c). Figure 9a shows that the retrieved XCH4 changes by about 9 ppb as the a priori changes from half to twice the true XCH4 value. Similarly, the XCH4 difference is less than 4 ppb when the a priori error changes from 0.05 to 0.5 (Fig. 9b). Compared to the bias of about 923 ppb induced by neglecting aerosol scattering for this scenario, it is clear that the impacts of the a priori and a priori error are very small. The effect of spectral resolution is larger, but XCH4 still changes by only about 100 ppb when the spectral resolution is changed from 0.5 to 0.1 cm−1 (Fig. 9c).
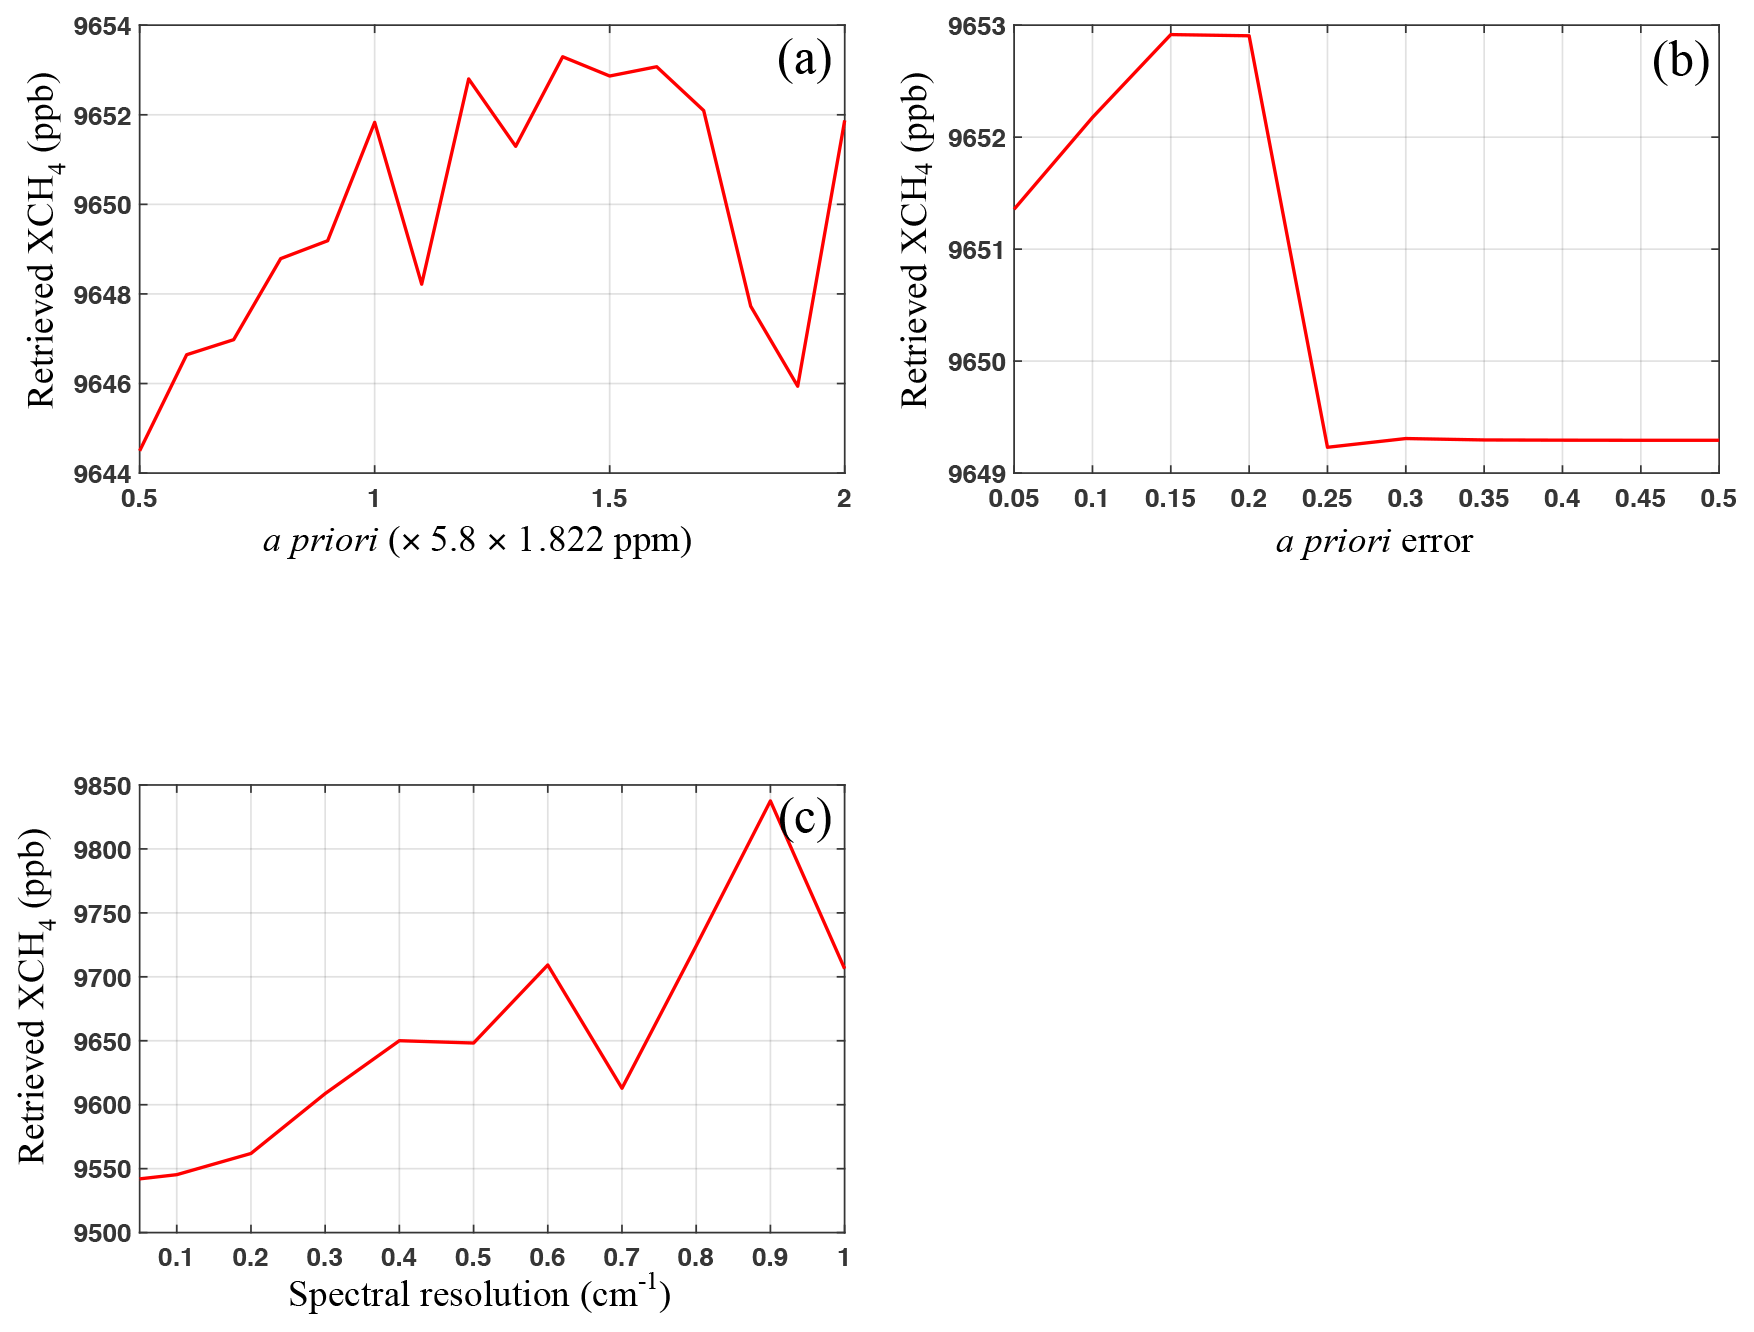
Figure 9Retrieved XCH4 for different values of (a) a priori (a priori error =0.2), (b) a priori error (a priori ppm), and (c) spectral resolution. g=0.75, SSA =0.95, AOD =1.0, surface albedo =0.5, XCH4 ppm.

Figure 10(a) Bias ratio as a function of CH4 concentration for the two retrieval techniques, where the XCH4 ranges from 1.5 to 5 (×1.822 ppm). (b) Same as (a), but for XCH4 ranging from 1.1 to 2 (×1.822 ppm). Surface albedo is set to 0.3 for all cases; results for the MF and OE methods are shown by solid and dashed lines, respectively.
4.4 Comparison of the two retrieval techniques
Figure 10 presents the bias ratios for the two retrieval techniques at different AODs (surface albedo =0.3). In the MF method, the bias ratio is defined as the ratio of the bias to the true value of α. On the other hand, in the OE method, it is the ratio of the bias to the true XCH4. From Fig. 10 it is clear that the bias ratio decreases with increasing CH4 concentration and has higher values at larger AODs. The bias ratio for the MF method (1.3 %–4.5 %) is up to 53.6 % less than that for the OE method (2.8 %–5.6 %) for AOD =0.3 when the CH4 concentration is high (2–5 times typical background values). On the other hand, the OE method performs better when enhancements are small and XCH4 is close to the background value. For example, the bias ratio for the MF method has a high value of about 42.6 % at AOD =0.3 for a 10 % enhancement (XCH4 ppm); the OE value for the same scenario is 8.6 %. For scenarios where scattering is ignored, the two retrieval techniques seem to be complementary, with differing utilities for different enhancements. On the other hand, when RT models that account for scattering effects are employed, the MF technique is suboptimal. Further, MF retrievals rely on accurate characterization of the surface albedo, especially when the aerosol loading is large. Finally, the MF method does not retrieve concentrations, which are necessary to infer fluxes. Therefore, the OE technique is in general superior due to its ability to support simultaneous retrieval of aerosols, surface albedo, and CH4 concentration.
Remote sensing measurements from airborne and satellite instruments are widely used to detect CH4 emissions. In our study, the traditional MF and the OE methods are used to quantify the effects of aerosol scattering on CH4 retrievals based on simulations of AVIRIS-NG measurements. The results show that the retrieval biases increase with increasing AOD and surface albedo for both techniques. In the OE method the biases increase with increasing CH4 concentration and SSA, but decrease with increasing aerosol asymmetry parameter. The CH4 retrieval bias increases with increasing XCH4 in the OE method but decreases for the same scenario in the MF method. The surprising MF trend is attributed to the inability of the MF method to treat nonlinear absorption effects at high XCH4 values. We also present bias ratios for the two techniques. The MF method shows smaller bias ratios at large CH4 concentrations than the OE method; it is, therefore, the optimal method to detect strong CH4 emission sources when scattering effects can be ignored in the retrieval. For the same retrieval scenario, the OE method seems to be more suitable for detecting diffuse sources. Further, the MF method relies on a comparison with the background CH4 concentration. It is difficult to get an accurate estimate of the background XCH4 value in polluted atmospheric environments. In contrast, the OE method provides retrievals based solely on the atmospheric scenario of interest; CH4, aerosols, and surface albedo can be simultaneously inferred. Therefore, when scattering effects need to be considered, the OE method is the appropriate choice. Indeed, the MF method was intended for plume detection. OE enables accurate quantification of XCH4 in the presence of aerosol scattering.
This study focused on a comparison of retrieval techniques. It is also important to accurately represent the physics of atmospheric RT, especially for scenarios with significant aerosol scattering. RT models traditionally used in retrievals of imaging spectroscopic data use simplified radiation schemes and predefined aerosol models, which may introduce inaccuracy in the representation of atmospheric physics. The 2S-ESS model provides the capability to quantify aerosol impacts on CH4 retrieval for different aerosol types, optical depths, and layer heights. In future work, we will compare retrievals using the 2S-ESS model against those from other commonly used models such as MODTRAN. We will also evaluate the impact of varying instrument spectral resolution and signal-to-noise ratio for simultaneous retrieval of CH4, surface albedo and AOD. This will be relevant for the design of imaging spectrometers for planned future missions such as the NASA Surface Biology and Geology (SBG) mission.
The code and data are available from the authors upon request.
VN conceived the work, provided the radiative transfer and aerosol models, supervised YH, and assisted with manuscript preparation. YH designed and performed the retrievals, analyzed the results, and prepared the original manuscript. ZCZ contributed to retrieval setup and assisted with analysis of the results. PK provided valuable inputs into the science of CH4 remote sensing. YLY supervised YH and participated in the evaluation of the retrieval results and intercomparison. All listed authors contributed to the review and editing of this paper.
The authors declare that there is no conflict of interest.
A portion of this research was carried out at the Jet Propulsion Laboratory, California Institute of Technology, under a contract with the National Aeronautics and Space Administration (80NM0018D0004). The authors gratefully acknowledge the insightful and constructive comments from the two anonymous reviewers, which improved the clarity and quality of the manuscript and elevated the significance of the work beyond the original expectation.
This research has been supported by the NASA “Utilization of Airborne Visible/Infrared Imaging Spectrometer Next Generation Data from an Airborne Campaign in India” program (grant no. NNH16ZDA001N-AVRSNG) and the Jet Propulsion Laboratory Research and Technology Development program. PK was funded by the Japan Society for the Promotion of Science International Research Fellow Program.
This paper was edited by Jun Wang and reviewed by two anonymous referees.
Alvarez, R. A., Zavala-Araiza, D., Lyon, D. R., Allen, D. T., Barkley, Z. R., Brandt, A. R., Davis, K. J., Herndon, S. C., Jacob, D. J., Karion, A., Kort, E. A., Lamb, B. K., Lauvaux, T., Maasakkers, J. D., Marchese, A. J., Omara, M., Pacala, S. W., Peischl, J., Robinson, A. L., Shepson, P. B., Sweeney, C., Townsend-Small, A., Wofsy, S. C., and Hamburg, S. P.: Assessment of methane emissions from the U.S. oil and gas supply chain, Science, 361, 186–188, https://doi.org/10.1126/science.aar7204, 2018.
Archer, D.: Methane hydrate stability and anthropogenic climate change, Biogeosciences, 4, 521–544, https://doi.org/10.5194/bg-4-521-2007, 2007.
Bradley, E. S., Leifer, I., Roberts, D. A., Dennison, P. E., and Washburn, L.: Detection of marine methane emissions with AVIRIS band ratios, Geophys. Res. Lett., 38, L10702, https://doi.org/10.1029/2011GL046729, 2011.
Bubier, J. L. and Moore, T. R.: An ecological perspective on methane emissions from northern wetlands, Trends Ecol. Evol., 9, 460–464, https://doi.org/10.1016/0169-5347(94)90309-3, 1994.
Buchwitz, M., Reuter, M., Bovensmann, H., Pillai, D., Heymann, J., Schneising, O., Rozanov, V., Krings, T., Burrows, J. P., Boesch, H., Gerbig, C., Meijer, Y., and Löscher, A.: Carbon Monitoring Satellite (CarbonSat): assessment of atmospheric CO2 and CH4 retrieval errors by error parameterization, Atmos. Meas. Tech., 6, 3477–3500, https://doi.org/10.5194/amt-6-3477-2013, 2013.
Butz, A., Galli, A., Hasekamp, O., Landgraf, J., Tol, P., and Aben, I.: TROPOMI aboard Sentinel-5 Precursor: Prospective performance of CH4 retrievals for aerosol and cirrus loaded atmospheres, Remote Sens. Environ., 120, 267–276, https://doi.org/10.1016/j.rse.2011.05.030, 2012.
Butz, A., Orphal, J., Checa-Garcia, R., Friedl-Vallon, F., von Clarmann, T., Bovensmann, H., Hasekamp, O., Landgraf, J., Knigge, T., Weise, D., Sqalli-Houssini, O., and Kemper, D.: Geostationary Emission Explorer for Europe (G3E): mission concept and initial performance assessment, Atmos. Meas. Tech., 8, 4719–4734, https://doi.org/10.5194/amt-8-4719-2015, 2015.
Clerbaux, C., Hadji-Lazaro, J., Turquety, S., Mégie, G., and Coheur, P.-F.: Trace gas measurements from infrared satellite for chemistry and climate applications, Atmos. Chem. Phys., 3, 1495–1508, https://doi.org/10.5194/acp-3-1495-2003, 2003.
Dennison, P. E., Thorpe, A. K., Pardyjak, E. R., Roberts, D. A., Qi, Y., Green, R. O., Bradley, E. S., and Funk, C. C.: High spatial resolution mapping of elevated atmospheric carbon dioxide using airborne imaging spectroscopy: Radiative transfer modeling and power plant plume detection, Remote Sens. Environ., 139, 116–129, https://doi.org/10.1016/j.rse.2013.08.001, 2013.
Etiope, G., Feyzullayev, A., and Baciu, C. L.: Terrestrial methane seeps and mud volcanoes: A global perspective of gas origin, Mar. Petrol. Geol., 26, 333–344, https://doi.org/10.1016/j.marpetgeo.2008.03.001, 2009.
Fishman, J. L., Iraci, L. T., Al-Saadi, J., Chance, K., Chavez, F., Chin, M., Coble, P., Davis, C., DiGiacomo, P. M., Edwards, D., Eldering, A., Goes, J., Herman, J., Hu, C., Jacob, D. J., Jordan, C., Kawa, S. R., Key, R., Liu, X., Lohrenz, S., Mannino, A., Natraj, V., Neil, D., Neu, J., Newchurch, M., Pickering, K., Salisbury, J., Sosik, H., Subramaniam, A., Tzortziou, M., Wang, J., and Wang, M.: The United States' next generation of atmospheric composition and coastal ecosystem measurements: NASA's Geostationary Coastal and Air Pollution Events (GEO-CAPE) Mission, B. Am. Meteorol. Soc., 93, 1547–1566, https://doi.org/10.1175/BAMS-D-11-00201.1, 2012.
Frankenberg, C., Platt, U., and Wagner, T.: Iterative maximum a posteriori (IMAP)-DOAS for retrieval of strongly absorbing trace gases: Model studies for CH4 and CO2 retrieval from near infrared spectra of SCIAMACHY onboard ENVISAT, Atmos. Chem. Phys., 5, 9–22, https://doi.org/10.5194/acp-5-9-2005, 2005.
Frankenberg, C., Meirink, J. F., Bergamaschi, P., Goede, A., P. H., Heimann, M., Körner, S., Platt, U., van Weele, M., and Wagner, T.: Satellite chartography of atmospheric methane from SCIAMACHY on board ENVISAT: Analysis of the years 2003 and 2004, J. Geophys. Res., 111, D07303, https://doi.org/10.1029/2005JD006235, 2006.
Frankenberg, C., Thorpe, A. K., Thompson, D. R., Hulley, G., Kort, E. A., Vance, N., Borchardt, J., Krings, T., Gerilowski, K., Sweeney, C., Conley, S., Bue, B. D., Aubrey, A. D., Hook, S., and Green, R. O.: Airborne methane remote measurements reveal heavy-tail flux distribution in Four Corners region, P. Natl. Acad. Sci. USA, 113, 9734–9739, https://doi.org/10.1073/pnas.1605617113, 2016.
Gambacorta, A., Barnet, C. D., Smith, N., Pierce, R. B., Smith, J. W., Spackman, J. R., and Goldberg, M.: The NPP and J1 NOAA Unique Combined Atmospheric Processing System (NUCAPS) for atmospheric thermal sounding: Recent algorithm enhancements tailored to near real time users applications, 2016 Fall Meeting, AGU, San Francisco, CA, 12–16 December 2016, Abstract IN33D-07, 2016.
Gedney, N., Cox, P. M., and Huntingford, C.: Climate feedback from wetland methane emissions, Geophys. Res. Lett., 31, L20503. https://doi.org/10.1029/2004GL020919, 2004.
Glumb, R., Davis, G., and Lietzke, C.: The TANSO-FTS-2 instrument for the GOSAT-2 greenhouse gas monitoring mission, in: 2014 IEEE Geoscience and Remote Sensing Symposium, Quebec City, QC, Canada, 13–18 July 2014, IEEE, 1238–1240, https://doi.org/10.1109/IGARSS.2014.6946656, 2014.
Green, R. O., Eastwood, M. L., Sarture, C. M., Chrien, T. G., Aronsson, M., Chippendale, B. J., Faust, J. A., Pavri, B. E., Chovit, C. J., Solis, M., Olah, M. R., and Williams, O.: Imaging spectroscopy and the Airborne Visible/Infrared Imaging Spectrometer (AVIRIS), Remote Sens. Environ., 65, 227–248, https://doi.org/10.1016/S0034-4257(98)00064-9, 1998.
He, L., Zeng, Z.-C., Pongetti, T. J., Wong, C., Liang, J., Gurney, K. R., Newman, S., Yadav, V., Verhulst, K., Miller, C. E., and Duren, R.: Atmospheric methane emissions correlate with natural gas consumption from residential and commercial sectors in Los Angeles, Geophys. Res. Lett., 46, 8563–8571, https://doi.org/10.1029/2019GL083400, 2019.
Henyey, L. G. and Greenstein, J. L.: Diffuse radiation in the galaxy, Astrophys. J., 93, 70–83, https://doi.org/10.1086/144246, 1941.
Herrero, M., Henderson, B., Havlík, P., Thornton, P. K., Conant, R. T., Smith, P., Wirsenius, S., Hristov, A. N., Gerber, P., Gill, M., Butterbach-Bahl, K., Valin, H., Garnett, T., and Shehfest, E.: Greenhouse gas mitigation potentials in the livestock sector, Nat. Clim. Change, 6, 452–461, https://doi.org/10.1038/nclimate2925, 2016.
Holmes, C. D., Prather, M. J., Søvde, O. A., and Myhre, G.: Future methane, hydroxyl, and their uncertainties: key climate and emission parameters for future predictions, Atmos. Chem. Phys., 13, 285–302, https://doi.org/10.5194/acp-13-285-2013, 2013.
Howarth, R. W.: Methane emissions and climatic warming risk from hydraulic fracturing and shale gas development: implications for policy, Energy and Emission Control Technologies, 3, 45–54, https://doi.org/10.2147/EECT.S61539, 2015.
Howarth, R. W.: Ideas and perspectives: is shale gas a major driver of recent increase in global atmospheric methane?, Biogeosciences, 16, 3033–3046, https://doi.org/10.5194/bg-16-3033-2019, 2019.
Howarth, R. W., Santoro, R., and Ingraffea, A.: Methane and the greenhouse gas footprint of natural gas from shale formations, Clim. Change, 106, 679, https://doi.org/10.1007/s10584-011-0061-5, 2011.
Jacob, D. J., Turner, A. J., Maasakkers, J. D., Sheng, J., Sun, K., Liu, X., Chance, K., Aben, I., McKeever, J., and Frankenberg, C.: Satellite observations of atmospheric methane and their value for quantifying methane emissions, Atmos. Chem. Phys., 16, 14371–14396, https://doi.org/10.5194/acp-16-14371-2016, 2016.
Jervis, D., McKeever, J., Durak, B. O. A., Sloan, J. J., Gains, D., Varon, D. J., Ramier, A., Strupler, M., and Tarrant, E.: The GHGSat-D imaging spectrometer, Atmos. Meas. Tech. Discuss., https://doi.org/10.5194/amt-2020-301, in review, 2020.
Kalnay, E., Kanamitsu, M., Kistler, R., Collins, W., Deaven, D., Gandin, L., Iredell, M., Saha, S., White, G., Woollen, J., Zhu, Y., Chelliah, M., Ebisuzaki, W., Higgins, W., Janowiak, J., Mo, K. C., Ropelewski, C., Wang, J., Leetmaa, A., Reynolds, R., Jenne, R., and Joseph, D.: The NCEP/NCAR 40-year reanalysis project, B. Am. Meteorol. Soc., 77, 437–471, https://doi.org/10.1175/1520-0477(1996)077<0437:TNYRP>2.0.CO;2, 1996.
Kiemle, C., Kawa, S. R., Quatrevalet, M., and Browell, E. V.: Performance simulations for a spaceborne methane lidar mission, J. Geophys. Res., 119, 4365–4379, https://doi.org/10.1002/2013JD021253, 2014.
Kirschke, S., Bousquet, P., Ciais, P., Saunois, M., Canadell, Josep G., Dlugokencky. E. J., Bergamaschi, P., Bergmann, D., Blake, D. R., Bruhwiler, L., Cameron-Smith, P., Castaldi, S., Chevallier, F., Feng, L., Fraser, A., Heimann, M, Hodson, E. L., Houweling, S., Josse, B., Fraser, P. J., Krummel, P. B., Lamarque, J.-F., Langenfelds, R. L., Le Quere, C., Naik, V., O'Doherty, S., Palmer, P. I., Pison, I., Plummer, D., Poulter, B., Prinn, R. G., Rigby, M., Ringeval, B., Santini, M. Schmidt, M., Shindell, D. T., Simpson, I. J., Spahni, R., Steele, L. P., Strode, S. A., Sudo, K., Szopa, S., van der Werf, G. R., Voulgarakis, A., van Weele, M., Weiss, R. F., Williams, J. E., and Zeng, G.: Three decades of global methane sources and sinks, Nat. Geosci., 6, 813–823, https://doi.org/10.1038/ngeo1955, 2013.
Kort, E. A., Frankenberg, C., Costigan, K. R., Lindenmaier, R., Dubey, M. K., and Wunch, D.: Four corners: the largest US methane anomaly viewed from space, Geophys. Res. Lett., 41, 6898–6903, https://doi.org/10.1002/2014GL061503, 2014.
Kuze, A., Suto, H., Shiomi, K., Kawakami, S., Tanaka, M., Ueda, Y., Deguchi, A., Yoshida, J., Yamamoto, Y., Kataoka, F., Taylor, T. E., and Buijs, H. L.: Update on GOSAT TANSO-FTS performance, operations, and data products after more than 6 years in space, Atmos. Meas. Tech., 9, 2445–2461, https://doi.org/10.5194/amt-9-2445-2016, 2016.
Kvenvolden, K. A.: Methane hydrate – A major reservoir of carbon in the shallow geosphere?, Chem. Geol., 71, 41–51, https://doi.org/10.1016/0009-2541(88)90104-0, 1988.
Kvenvolden, K. A. and Rogers, B. W.: Gaia's breath – global methane exhalations, Mar. Petrol. Geol., 22, 579–590, https://doi.org/10.1016/j.marpetgeo.2004.08.004, 2005.
Macdonald, J. A., Fowler, D., Hargreaves, K. J., Skiba, U., Leith, I. D., and Murray, M. B.: Methane emission rates from a northern wetland; response to temperature, water table and transport, Atmos. Environ., 32, 3219–3227, https://doi.org/10.1016/S1352-2310(97)00464-0, 1998.
Manolakis, D., Truslow, E., Pieper, M., Cooley, T., and Brueggeman, M.: Detection algorithms in hyperspectral imaging systems: An overview of practical algorithms, IEEE Signal Proc. Mag., 31, 24–33, https://doi.org/10.1109/MSP.2013.2278915, 2014.
McKeever, J., Durak, B. O. A., Gains, D., Varon, D. J., Germain, S., and Sloan, J. J.: GHGSat-D: Greenhouse gas plume imaging and quantification from space using a Fabry-Perot imaging spectrometer, 2017 Fall Meeting, AGU, New Orleans, LA, 11–15 December 2017, Abstract A33G-1360, 2017.
Merchant, C. J., Le Borgne, P., Roquet, H., and Legendre, G.: Extended optimal estimation techniques for sea surface temperature from the Spinning Enhanced Visible and Infra-Red Imager (SEVIRI), Remote Sens. Environ., 131, 287–297, https://doi.org/10.1016/j.rse.2012.12.019, 2013.
Myhre, G., Shindell, D., Bréon, F.-M., Collins, W., Fuglestvedt, J., Huang, J., Koch, D., Lamarque, J.-F., Lee, D., Mendoza, B., Nakajima, T., Robock, A., Stephens, G., Takemura, T., and Zhang, H.: Anthropogenic and Natural Radiative Forc-ing, in: Climate Change 2013: The Physical Science Basis. Contribution of Working Group I to the Fifth Assessment Report of the Intergovernmental Panel on Climate Change, edited by: Stocker, T. F., Qin, D., Plattner, G.-K., Tignor, M., Allen, S. K., Boschung, J., Nauels, A., Xia, Y., Bex, V., and Midgley, P. M., Cambridge University Press, Cambridge, United Kingdom and New York, NY, USA, 2013.
Nisbet, E. G., Dlugokencky, E. J., and Bousquet, P.: Methane on the rise–Again, Science, 343, 493–495, https://doi.org/10.1126/science.1247828, 2014.
Nisbet, E. G., Dlugokencky, E. J., Manning, M. R., Lowry, D., Fisher, R. E., France, J. L., Michel, S. E., Miller, J. B., White, J. W. C., Vaughn, B., Bousquet, P., Pyle, J. A., Warwick, N. J., Cain, M., Brownlow, R., Zazzeri, G., Lanoisellé, M., Manning, A. C., Gloor, E., Worthy, D. E. J., Brunke, E.-G., Labuschagne, C., Wolff, E. W., and Ganesan, A. L.: Rising atmospheric methane: 2007–2014 growth and isotopic shift, Global Biogeochem. Cy., 30, 1356–1370, https://doi.org/10.1002/2016GB005406, 2016.
NOAA/GML (NOAA Earth System Research Laboratory Global Monitoring Laboratory): Trends in Atmospheric Methane: Global CH4 Monthly Means, available at: https://esrl.noaa.gov/gmd/ccgg/trends_ch4/, last access: 27 November 2020.
O'Dell, C. W., Eldering, A., Wennberg, P. O., Crisp, D., Gunson, M. R., Fisher, B., Frankenberg, C., Kiel, M., Lindqvist, H., Mandrake, L., Merrelli, A., Natraj, V., Nelson, R. R., Osterman, G. B., Payne, V. H., Taylor, T. E., Wunch, D., Drouin, B. J., Oyafuso, F., Chang, A., McDuffie, J., Smyth, M., Baker, D. F., Basu, S., Chevallier, F., Crowell, S. M. R., Feng, L., Palmer, P. I., Dubey, M., García, O. E., Griffith, D. W. T., Hase, F., Iraci, L. T., Kivi, R., Morino, I., Notholt, J., Ohyama, H., Petri, C., Roehl, C. M., Sha, M. K., Strong, K., Sussmann, R., Te, Y., Uchino, O., and Velazco, V. A.: Improved retrievals of carbon dioxide from Orbiting Carbon Observatory-2 with the version 8 ACOS algorithm, Atmos. Meas. Tech., 11, 6539–6576, https://doi.org/10.5194/amt-11-6539-2018, 2018.
Polonsky, I. N., O'Brien, D. M., Kumer, J. B., O'Dell, C. W., and the geoCARB Team: Performance of a geostationary mission, geoCARB, to measure CO2, CH4 and CO column-averaged concentrations, Atmos. Meas. Tech., 7, 959–981, https://doi.org/10.5194/amt-7-959-2014, 2014.
Roberts, D. A., Bradley, E. S., Cheung, R., Leifer, I., Dennison, P. E., and Margolis, J. S.: Mapping methane emissions from a marine geological seep source using imaging spectrometry, Remote Sens. Environ., 114, 592–606, https://doi.org/10.1016/j.rse.2009.10.015, 2010.
Rodgers, C. D.: Inverse Methods for Atmospheric Sounding: Theory and Practice, World Scientific, Singapore, 2000.
Rothman, L. S., Gordon, I. E., Barbe, A., Benner, D. C., Bernath, P. E., Birk, M., Boudon, V., Brown, L. R., Campargue, A., Champion, J. P., Chance, K., Coudert, L. H., Dana, V., Devi, V. M., Fally, S., Flaud, J. M., Gamache, R. R., Goldman, A., Jacquemart, D., Kleiner, I., Lacome, N., Lafferty, W. J., Mandin, J. Y., Massie, S. T., Mikhailenko, S. N., Miller, C. E., Moazzen-Ahmadi, N., Naumenko, O. V., Nikitin, A. V., Orphal, J., Perevalov, V. I., Perrin, A., Predoi-Cross, A., Rinsland, C. P., Rotger, M., Šimečková, M., Smith, M. A. H., Sung, K., Tashkun, S. A., Tennyson, J., Toth, R. A., Vandaele, A. C., and Vander Auwera, J.: The HITRAN 2008 molecular spectroscopic database, J. Quant. Spectrosc. Ra., 110, 533–572, https://doi.org/10.1016/j.jqsrt.2009.02.013, 2009.
Schaefer, H., Fletcher, S. E. M., Veidt, C., Lassey, K. R., Brailsford, G. W., Bromley, T. M., Dlugokencky, E. J., Michel, S. E., Miller, J. M., Levin, I., Lowe, D. C., Martin, R. J., Vaughn, B. H., and White, J. W. C.: A 21st-century shift from fossil-fuel to biogenic methane emissions indicated by 13CH4, Science, 352, 80–84, https://doi.org/10.1126/science.aad2705, 2016.
Schaefer, K., Lantuit, H., Romanovsky, V. E., Schuur, E. A. G., and Witt, R.: The impact of the permafrost carbon feedback on global climate, Environ. Res. Lett., 9, 085003, https://doi.org/10.1088/1748-9326/9/8/085003, 2014.
Schuur, E. A. G., McGuire, A. D., Schädel, C., Grosse, G., Harden, J. W., Hayes, D. J., Hugelius, G., Koven, C. D., Kuhry, P., Lawrence, D. M., Natali, S. M., Olefeldt, D., Romanovsky, V. E., Schaefer, K., Turetsky, M. R., Treat, C. C., and Vonk, J. E.: Climate change and the permafrost carbon feedback, Nature, 520, 171–179, https://doi.org/10.1038/nature14338, 2015.
Seinfeld, J. H. and Pandis, S. N.: Atmospheric Chemistry and Physics: From Air Pollution to Climate Change, Wiley, New Jersey, USA, 2006.
Spurr, R. and Natraj, V.: A linearized two-stream radiative transfer code for fast approximation of multiple-scatter fields, J. Quant. Spectrosc. Ra., 112, 2630–2637, https://doi.org/10.1016/j.jqsrt.2011.06.014, 2011.
Themelis, N. J. and Ulloa, P. A.: Methane generation in landfills, Renewable Energy, 32, 1243–1257, https://doi.org/10.1016/j.renene.2006.04.020, 2007.
Thompson, D. R., Leifer, I., Bovensmann, H., Eastwood, M., Fladeland, M., Frankenberg, C., Gerilowski, K., Green, R. O., Kratwurst, S., Krings, T., Luna, B., and Thorpe, A. K.: Real-time remote detection and measurement for airborne imaging spectroscopy: a case study with methane, Atmos. Meas. Tech., 8, 4383–4397, https://doi.org/10.5194/amt-8-4383-2015, 2015.
Thorpe, A. K., Roberts, D. A., Bradley, E. S., Funk, C. C., Dennison, P. E., and Leifer, I.: High resolution mapping of methane emissions from marine and terrestrial sources using a Cluster-Tuned Matched Filter technique and imaging spectrometry, Remote Sens. Environ., 134, 305–318, https://doi.org/10.1016/j.rse.2013.03.018, 2013.
Thorpe, A. K., Frankenberg, C., and Roberts, D. A.: Retrieval techniques for airborne imaging of methane concentrations using high spatial and moderate spectral resolution: application to AVIRIS, Atmos. Meas. Tech., 7, 491–506, https://doi.org/10.5194/amt-7-491-201, 2014.
Varon, D. J., McKeever, J., Jervis, D., Maasakkers, J. D., Pandey, S., Houweling, S., Aben, I., Scarpelli, T., and Jacob, D. J.: Satellite discovery of anomalously large methane point sources from oil/gas production, Geophys. Res. Lett., 46, 13507–13516, https://doi.org/10.1029/2019GL083798, 2019.
Veefkind, J. P., Aben, I., McMullan, K., Forster, H., de Vries, J.,Otter, G., Claas, J., Eskes, H. J., de Haan, J. F., Kleipool, Q., van Weele, M., Hasekamp, O., Hoogeveen, R., Landgraf, J., Snel, R., Tol, P., Ingmann, P., Voors, R., Kruizinga, B., Vink, R., Visser, H., and Levelt, P. F.: TROPOMI on the ESA Sentinel-5 Precursor: A GMES mission for global observations of the atmospheric composition for climate, air quality and ozone layer applications, Remote Sens. Environ., 120, 70–83, https://doi.org/10.1016/j.rse.2011.09.027, 2012.
Walter, K. M., Zimov, S. A., Chanton, J. P., Verbyla, D., and Chapin III, F. S.: Methane bubbling from Siberian thaw lakes as a positive feedback to climate warming, Nature, 443, 71–75, https://doi.org/10.1038/nature05040, 2006.
WCRP (World Climate Research Program): A preliminary cloudless standard atmosphere for radiation computation, International Association for Meteorology and Atmospheric Physics, Radiation Commission, Boulder, CO, USA, WMO/TD-No. 24; WCP-No. 112, March 1986.
Wofsy, S. C. and Hamburg, S: MethaneSAT – A new observing platform for high resolution measurements of methane and carbon dioxide, 2019 Fall Meeting, AGU, San Francisco, CA, 9–13 December 2019, Abstract A53F-02, 2019.
Woodwell, G. M., Mackenzie, F. T., Houghton, R. A., Apps, M., Gorham, E., and Davidson, E.: Biotic feedbacks in the warming of the earth, Climatic Change, 40, 495–518, https://doi.org/10.1023/A:1005345429236, 1998.
Worden, J., Kulawik, S., Frankenberg, C., Payne, V., Bowman, K., Cady-Peirara, K., Wecht, K., Lee, J.-E., and Noone, D.: Profiles of CH4, HDO, H2O, and N2O with improved lower tropospheric vertical resolution from Aura TES radiances, Atmos. Meas. Tech., 5, 397–411, https://doi.org/10.5194/amt-5-397-2012, 2012.
Xi, X., Natraj, V., Shia, R. L., Luo, M., Zhang, Q., Newman, S., Sander, S. P., and Yung, Y. L.: Simulated retrievals for the remote sensing of CO2, CH4, CO, and H2O from geostationary orbit, Atmos. Meas. Tech., 8, 4817–4830, https://doi.org/10.5194/amt-8-4817-2015, 2015.
Xiong, X., Barnet, C., Maddy, E., Sweeney, C., Liu, X., Zhou, L., and Goldberg, M.: Characterization and validation of methane products from the Atmospheric Infrared Sounder (AIRS), J. Geophys. Res., 113, G00A01, https://doi.org/10.1029/2007JG000500, 2008.
Xiong, X., Barnet, C., Maddy, E. S., Gambacorta, A., King, T. S., and Wofsy, S. C.: Mid-upper tropospheric methane retrieval from IASI and its validation, Atmos. Meas. Tech., 6, 2255–2265, https://doi.org/10.5194/amt-6-2255-2013, 2013.
Yoshida, Y., Kikuchi, N., Morino, I., Uchino, O., Oshchepkov, S., Bril, A., Saeki, T., Schutgens, N., Toon, G. C., Wunch, D., Roehl, C. M., Wennberg, P. O., Griffith, D. W. T., Deutscher, N. M., Warneke, T., Notholt, J., Robinson, J., Sherlock, V., Connor, B., Rettinger, M., Sussmann, R., Ahonen, P., Heikkinen, P., Kyrö, E., Mendonca, J., Strong, K., Hase, F., Dohe, S., and Yokota, T.: Improvement of the retrieval algorithm for GOSAT SWIR XCO2 and XCH4 and their validation using TCCON data, Atmos. Meas. Tech., 6, 1533–1547, https://doi.org/10.5194/amt-6-1533-2013, 2013.
Zeng, Z.-C., Zhang, Q., Natraj, V., Margolis, J. S., Shia, R.-L., Newman, S., Fu, D., Pongetti, T. J., Wong, K. W., Sander, S. P., Wennberg, P. O., and Yung, Y. L.: Aerosol scattering effects on water vapor retrievals over the Los Angeles Basin, Atmos. Chem. Phys., 17, 2495–2508, https://doi.org/10.5194/acp-17-2495-2017, 2017.
Zeng, Z.-C., Natraj, V., Xu, F., Pongetti, T. J., Shia, R.-L., Kort, E. A., Toon, G. C., Sander, S. P., and Yung, Y. L.: Constraining aerosol vertical profile in the boundary layer using hyperspectral measurements of oxygen absorption, Geophys. Res. Lett., 45, 10772–10780, https://doi.org/10.1029/2018GL079286, 2018.
Zhang, Q., Natraj, V., Li, K.-F., Shia, R.-L., Fu, D., Pongetti, T. J., Sander S. P., Roehl, C. M., and Yung, Y. L.: Accounting for aerosol scattering in the CLARS retrieval of column averaged CO2 mixing ratios, J. Geophys. Res.-Atmos., 120, 7205–7218, https://doi.org/10.1002/2015JD023499, 2015.
Zhang, Q., Shia, R. -L., Sander, S. P., and Yung, Y. L.: XCO2 retrieval error over deserts near critical surface albedo, Earth Space Sci., 2, 1–10, https://doi.org/10.1002/2015EA000143, 2016.