the Creative Commons Attribution 4.0 License.
the Creative Commons Attribution 4.0 License.
 | 15 Dec 2020
Dissecting effects of orbital drift of polar-orbiting satellites on accuracy and trends of climate data records of cloud fractional cover
Jędrzej S. Bojanowski
Jan P. Musiał
Radiometers such as the AVHRR (Advanced Very High Resolution Radiometer) mounted aboard a series of NOAA and MetOp (Meteorological Operational) polar-orbiting satellites provide 4-decade-long global climate data records (CDRs) of cloud fractional cover. Generation of such long datasets requires combining data from consecutive satellite platforms. A varying number of satellites operating simultaneously in the morning and afternoon orbits, together with satellite orbital drift, cause the uneven sampling of the cloudiness diurnal cycle along a course of a CDR. This in turn leads to significant biases, spurious trends, and inhomogeneities in the data records of climate variables featuring the distinct diurnal cycle (such as clouds). To quantify the uncertainty and magnitude of spurious trends in the AVHRR-based cloudiness CDRs, we sampled the 30 min reference CM SAF (European Organisation for the Exploitation of Meteorological Satellites – EUMETSAT – Satellite Application Facility on Climate Monitoring) Cloud Fractional Cover dataset derived from Meteosat First and Second Generation (COMET) at times of the NOAA and MetOp satellite overpasses. The sampled cloud fractional cover (CFC) time series were aggregated to monthly means and compared with the reference COMET dataset covering the Meteosat disc (up to 60∘ N, S, W, and E). For individual NOAA and MetOp satellites the errors in mean monthly CFC reach ±10 % (bias) and ±7 % per decade (spurious trends). For the combined data record consisting of several NOAA and MetOp satellites, the CFC bias is 3 %, and the spurious trends are 1 % per decade. This study proves that before 2002 the AVHRR-derived CFC CDRs do not comply with the GCOS (Global Climate Observing System) temporal stability requirement of 1 % CFC per decade just due to the satellite orbital-drift effect. After this date the requirement is fulfilled due to the numerous NOAA and MetOp satellites operating simultaneously. Yet, the time series starting in 2003 is shorter than 30 years, which makes it difficult to draw reliable conclusions about long-term changes in CFC. We expect that the error estimates provided in this study will allow for a correct interpretation of the AVHRR-based CFC CDRs and ultimately will contribute to the development of a novel satellite orbital-drift correction methodology widely accepted by the AVHRR-based CDR providers.
- Article
(21069 KB) - Full-text XML
- BibTeX
- EndNote


Cloud feedback to global warming remains one of the biggest uncertainties in climate projections. To improve comprehension of this complex physical phenomenon, a long reliable time series of cloud fraction measurements is required at a global scale. In this respect, multi-decadal ground-based visual cloud observations that have been recently supported or replaced by the ceilometers or total sky cameras are still widely used in climatological studies. However, they are often inhomogeneous and located in densely populated regions leaving the vast oceanic areas, polar regions, high mountains, deserts, and tropical and Taiga forests undersampled. Despite aforementioned issues, the surface synoptic observations (SYNOP) have been widely exploited for evaluation of satellite-based cloud climate data records (CDRs) (Meerkötter et al., 2004; Dybbroe et al., 2005; Kotarba, 2009; Eastman and Warren, 2010; Fontana et al., 2013; Musial et al., 2014; Bojanowski and Musiał, 2018; Bojanowski et al., 2018). In the last decade, novel referential cloud property datasets derived from the active sensors such as the radar on board the CloudSat satellite (Stephens et al., 2002) and the lidar on board the CALIPSO (Cloud-Aerosol Lidar and Infrared Pathfinder Satellite Observation) satellite (Winker et al., 2009) allow for analyses of the global cloud vertical structure with great sensitivity (Karlsson and Johansson, 2013; Karlsson and Håkansson, 2018; Stengel et al., 2015). Nevertheless, they are too short for the climate change studies. Another source of long-term datasets on global cloudiness originates from the climate reanalysis models (e.g. ERA-5) that assimilate both the ground measurements and satellite products. Yet, due to great complexity of cloud climatic feedback together with coarse spatial and horizontal resolutions of model grids, the cloud formation and dissipation processes are not accurately represented in the climate models (Free et al., 2016; Ceppi et al., 2017).
In the context of global cloud cover studies, only the passive satellite radiometers recorded over 30 years of data, which is the minimal period to draw meaningful conclusions on global climate change (Rossow and Schiffer, 1999; Foster and Heidinger, 2013; Karlsson and Johansson, 2013). Nevertheless, these long time series (exceeding 30 years) can only be generated by merging observations acquired by several instruments such as the Advanced Very High Resolution Radiometer (AVHRR) mounted on board a series of NOAA and MetOp (Meteorological Operational) satellites. Amongst CDRs derived from the AVHRR time series there are the International Satellite Cloud Climatology Project (ISCCP; Rossow and Schiffer, 1999; Young et al., 2018), which also combines geostationary sensors; AVHRR Pathfinder Atmospheres Extended (PATMOS-x; Heidinger et al., 2014); Cloud, Albedo and Radiation dataset (CLARA-A2; Karlsson et al., 2017a) of the European Organisation for the Exploitation of Meteorological Satellites (EUMETSAT) Satellite Application Facility on Climate Monitoring (CM SAF); Community Cloud Retrieval for Climate dataset of the Cloud_cci dataset (CC4CL-AVHRR; Stengel et al., 2017, 2020) generated in the framework of the European Space Agency Climate Change Initiative (ESA CCI); and AVHRR Local Area Coverage satellite cloud climatology over central Europe derived by means of the Vectorized Earth Observation Retrieval (VEOR) method (Musiał and Bojanowski, 2017).
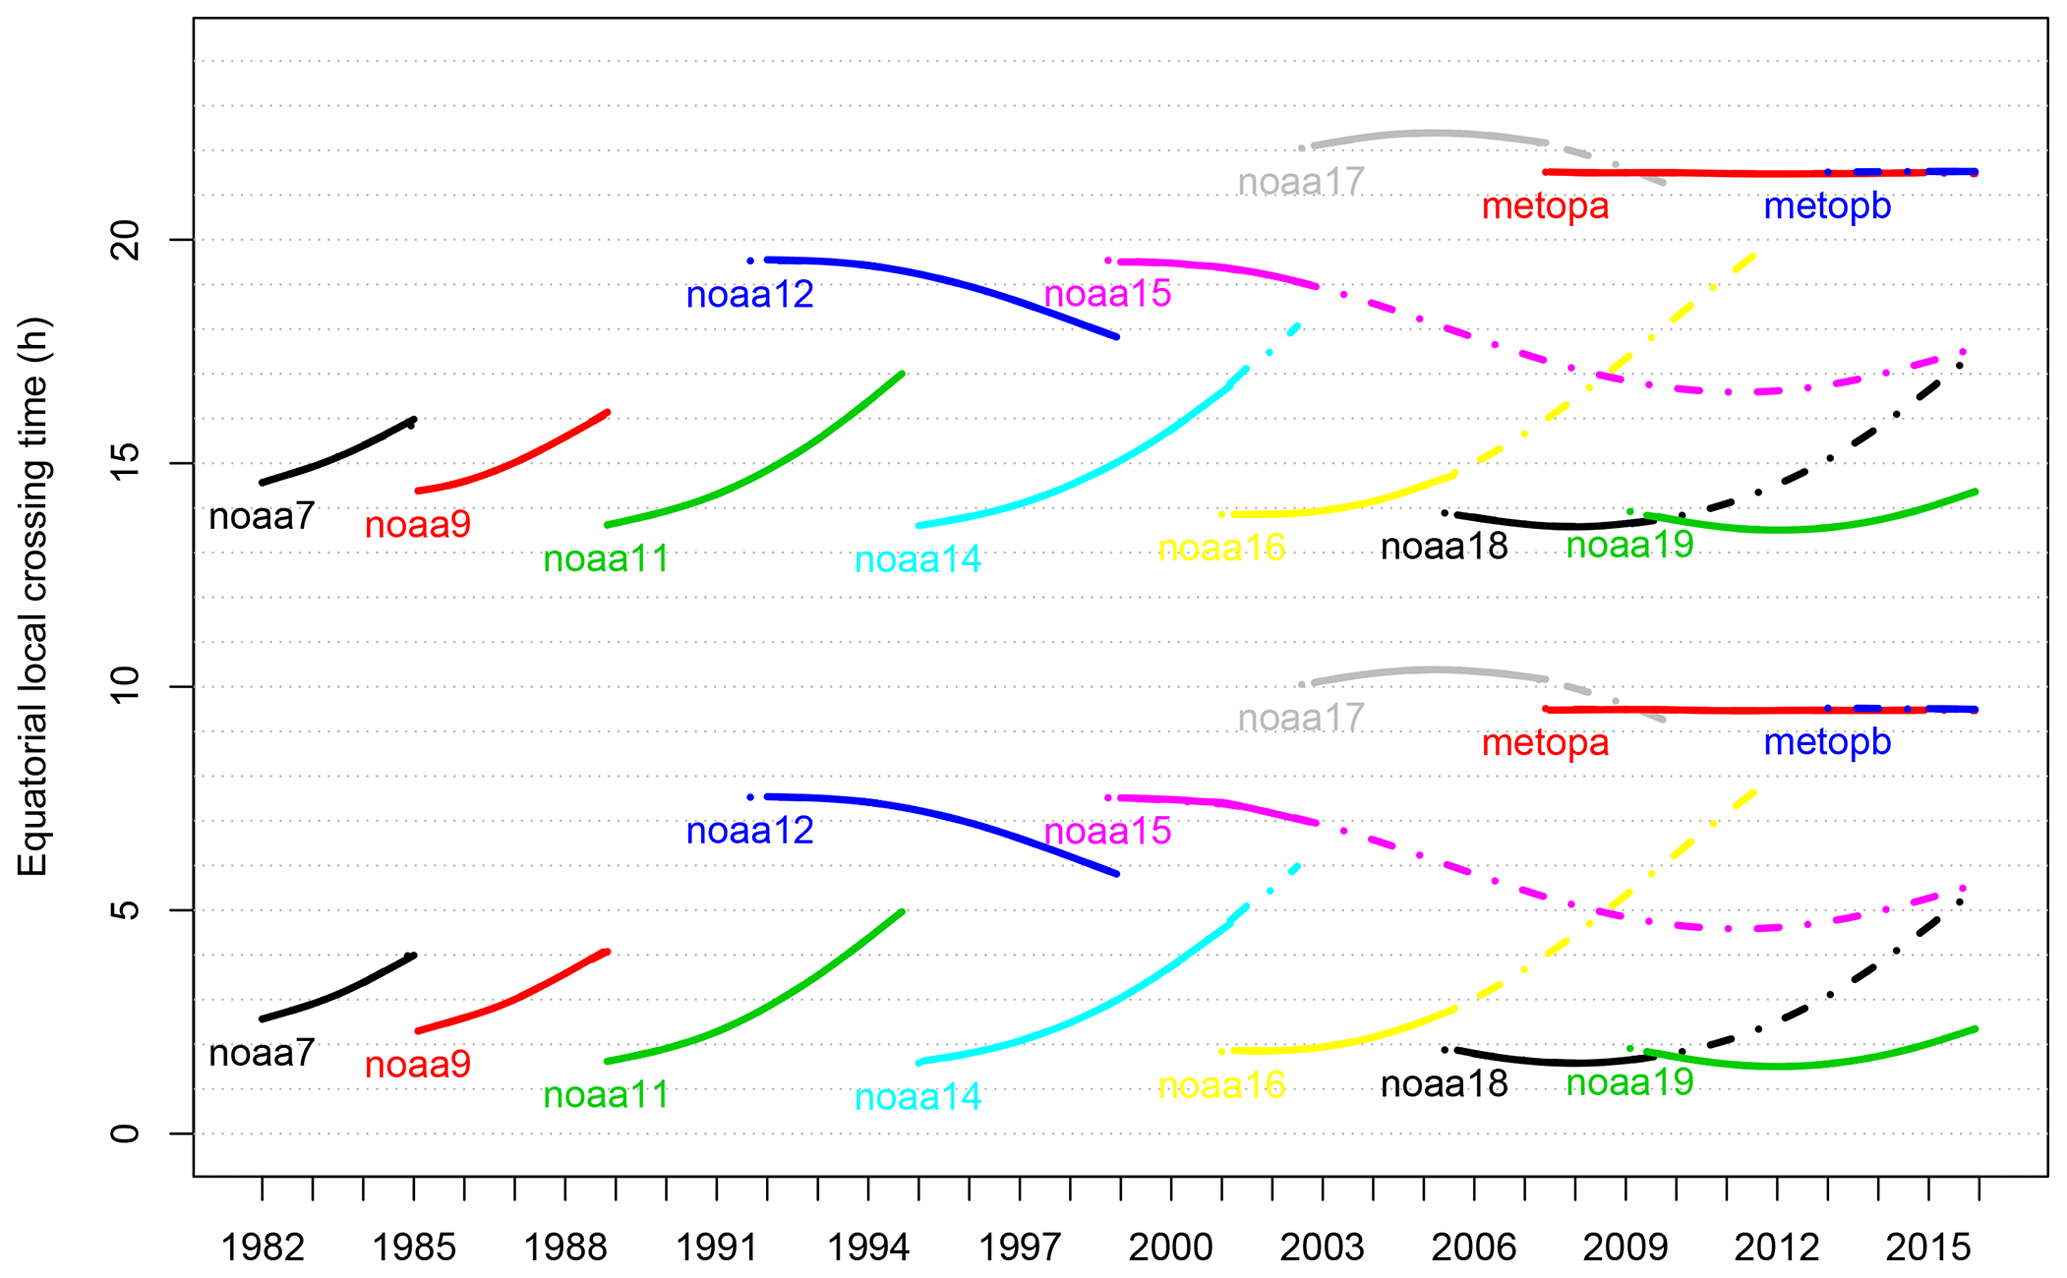
Figure 1Time series of equatorial crossing time of the NOAA and MetOp satellites. Two observations per time per satellite are related to two satellite nodes (ascending and descending). The dot-dashed lines indicate data which are included in the CLARA-A2 dataset but excluded in other CFC CDR (e.g. the Cloud_cci dataset) due to an overlap with other satellites. This exemplifies one source of spurious trends in satellite CDRs caused by different data aggregation strategy.
A data fusion from several instruments can cause spurious temporal trends in CDRs originating from instrument malfunction or degradation, satellite altitude instability, biases in ancillary data (e.g. modelled surface temperature), and the retrieval algorithm shortcomings. Besides these problems, the remaining data sampling issue is related to the variable local time and number of satellite acquisitions during a day (Fig. 1). The former is related to the changing number of NOAA and MetOp satellites operating concurrently in orbit. The latter is caused by satellite orbital drift that gradually lowers the satellite orbit due to Earth's gravity. Both effects can lead to significant biases in aggregated products (e.g. Level-3 monthly means) derived from polar-orbiting satellite measurements (Salby and Callaghan, 1997). These effects influence various variables featuring a distinct diurnal cycle such as outgoing longwave radiation (Salby, 1982a, b; Fowler et al., 2000), stratospheric-gas concentration (Salby, 1987), brightness temperature (Leroy, 2001; Kirk-Davidoff et al., 2005), and cloud cover (Bergman and Salby, 1996; Wylie et al., 2005; Devasthale et al., 2012; Foster and Heidinger, 2013). Many aforementioned studies elaborated on the correction of these effects, but none of them focused on a detailed quantification of errors and spurious trends that are introduced in the CFC CDRs.
Devasthale et al. (2012) proposed to remove the signal related to orbital drift delineated by the rotated empirical orthogonal function (REOF) analysis. Although the method gave promising results, it is sensitive to a decision wherein REOF loadings are related to the drift. Therefore, the risk of removing the real climatic signal cannot be neglected. Foster and Heidinger (2013) derived the CFC mean diurnal cycles by fitting sinusoidal function to all observations in the AVHRR record. Further, these functions were used to model the hourly CFC from instantaneous AVHRR observations, which were in turn aggregated to monthly means. This method was applied to the PATMOS-x CDR and resulted in the diurnally corrected CFC monthly means featuring coarse spatial resolution. Yet, none of the described methods was recommended and applied for a CFC CDR generation within the major European frameworks providing the satellite-derived geophysical datasets suitable for climate monitoring (i.e. ESA CCI or CM SAF). Moreover, an assessment of the impact of orbital drift on CFC CDRs was listed in the mission statements of the International Cloud Working Group (ICWG) within the Coordinated Group for Meteorological Satellites (Wu et al., 2017). In this context, the unprecedented quantification presented in this study gives a comprehensive yet missing perspective on the magnitudes of errors and spurious trends in the AVHRR CFC CDRs introduced by satellite orbital drift and variable sampling of a cloudiness diurnal cycle.
The sparse sampling of a diurnal cycle combined with satellite orbital drift can lead to unreliable mean estimates and an introduction of spurious temporal trends in the Level-3 CDRs. The quantification of these effects on a CDR is complex, as they depend on (1) geographic location, (2) amplitude and phase of the diurnal cycle of a measured variable, (3) local time when the diurnal cycle is sampled by satellite observations, (4) magnitude of satellite orbital drift, (5) number of available satellite observations per day, and (6) measurement selection and aggregation methodologies applied to derive the Level-3 product. In this respect, the aim of the presented study is to quantify the impact of the AVHRR satellite orbital drift combined with variable sampling of a cloudiness diurnal cycle on the accuracy of the cloudiness CDRs and to quantify the magnitude of spurious temporal trends. To reach this aim, the approach applied builds on a referential CDR with a fully resolved cloudiness diurnal cycle with 30 min sampling derived from the geostationary satellite measurements covering the Meteosat disc.
The analyses were based on two CDRs of cloud fractional cover derived from polar-orbiting (CLARA-A2) and geostationary satellites (CM SAF Cloud Fractional Cover dataset derived from Meteosat First and Second Generation; COMET) featuring coarse and dense temporal sampling of the cloudiness diurnal cycle, respectively. This allowed generating the artificial time series using the geostationary-derived time series sampled, as it would be acquired by a constellation of polar-orbiting satellites. Further, the artificial CDR was compared to the reference (geostationary-based) dataset to reveal spurious temporal trends in cloud cover introduced by a satellite orbital drift and varying number of satellite observations.
2.1 CLARA-A2 CDR derived from NOAA and MetOp polar-orbiting satellites
The Level-2b global daily composite product from the second edition of the CM SAF Cloud, Albedo and Radiation dataset (CLARA-A2; Karlsson et al., 2017a) was used to derive the AVHRR acquisition times. The CLARA-A2 is derived from the AVHRR global area coverage (GAC) data and consists of observations from the morning satellites – NOAA-12, NOAA-15, NOAA-17, MetOp-A, and MetOp-B – and the afternoon satellites – NOAA-7, NOAA-9, NOAA-11, NOAA-14, NOAA-16, NOAA-18, and NOAA-19. The morning satellites cross the Equator on the lit side in the morning as opposed to the afternoon satellites that do so in the afternoon. To derive the Level-2b products, the aggregation methodology proposed by Heidinger et al. (2014) is employed, which for each satellite selects only two instantaneous AVHRR observations per day (separately for ascending and descending satellite nodes) with the lowest sensor viewing angles. In the ascending node, the satellite orbits around Earth northwards, and in the descending node it orbits southwards on the lit side (Ignatov et al., 2004). The Level-2b composites are aggregated from the Level-2a instantaneous retrievals that correspond to a single satellite acquisition. Due to the orbit convergence, the number of acquisitions per satellite per day may vary from 2 at the Equator to 14 near the poles.
In spite of some adjustments to the raw AVHRR GAC Level-1b imagery applied during a derivation of the CLARA-A2 Level-2b (e.g. a removal of duplicated and overlapping orbits) (Karlsson et al., 2017a), it can be assumed that the selected AVHRR acquisitions times are representative for other CDRs such as Cloud_cci or PATMOS-x. Thus, the results of this study are valid for other AVHRR-based cloud climatologies. Ultimately, the Level-2b CLARA-A2 dataset was used to generate the Level-3 monthly mean cloud fraction composites with and without a distinction between the satellite nodes.
In addition to the AVHRR acquisition times, we used CFC trends observed in the CLARA-A2 CDR for the sake of comparison with the spurious trends estimated in our study.
2.2 COMET CDR derived from Meteosat geostationary satellites
The CM SAF Cloud Fractional Cover dataset from Meteosat First and Second Generation (COMET; Stöckli et al., 2017a; Stöckli et al., 2019) was derived from the MVIRI (Meteosat Visible and Infrared Imager) and SEVIRI (Spinning Enhanced Visible and Infrared Imager) imagers aboard a series of Meteosat geostationary satellites. The COMET cloud fraction climatology covers the period 1991–2015 and features high-temporal (30 min) and low-spatial () resolutions. It is derived by means of the novel naïve Bayesian classifier (Stöckli et al., 2017b) that features a high accuracy with the overall mean bias below 1 % between the COMET CFC and referential SYNOP measurements (Bojanowski et al., 2018). The CFC trends revealed by COMET are consistent with the trends observed in satellite products for top-of-atmosphere reflected radiation and surface solar radiation (Pfeifroth et al., 2018).
Within the study, the cloud fraction diurnal cycles were extracted from the COMET Monthly Mean Diurnal Cycle (MMDC) product. The COMET MMDC has been already validated against the SYNOP cloud observations, and it was proven to be suitable for the analysis of climatic trends and variability in the cloudiness diurnal cycle (Bojanowski and Musiał, 2018). Such an accurate dataset was used for the generation of the AVHRR-like synthetic dataset (i.e. out of the COMET dataset), which was further used to quantify the magnitude of the spurious temporal trends.
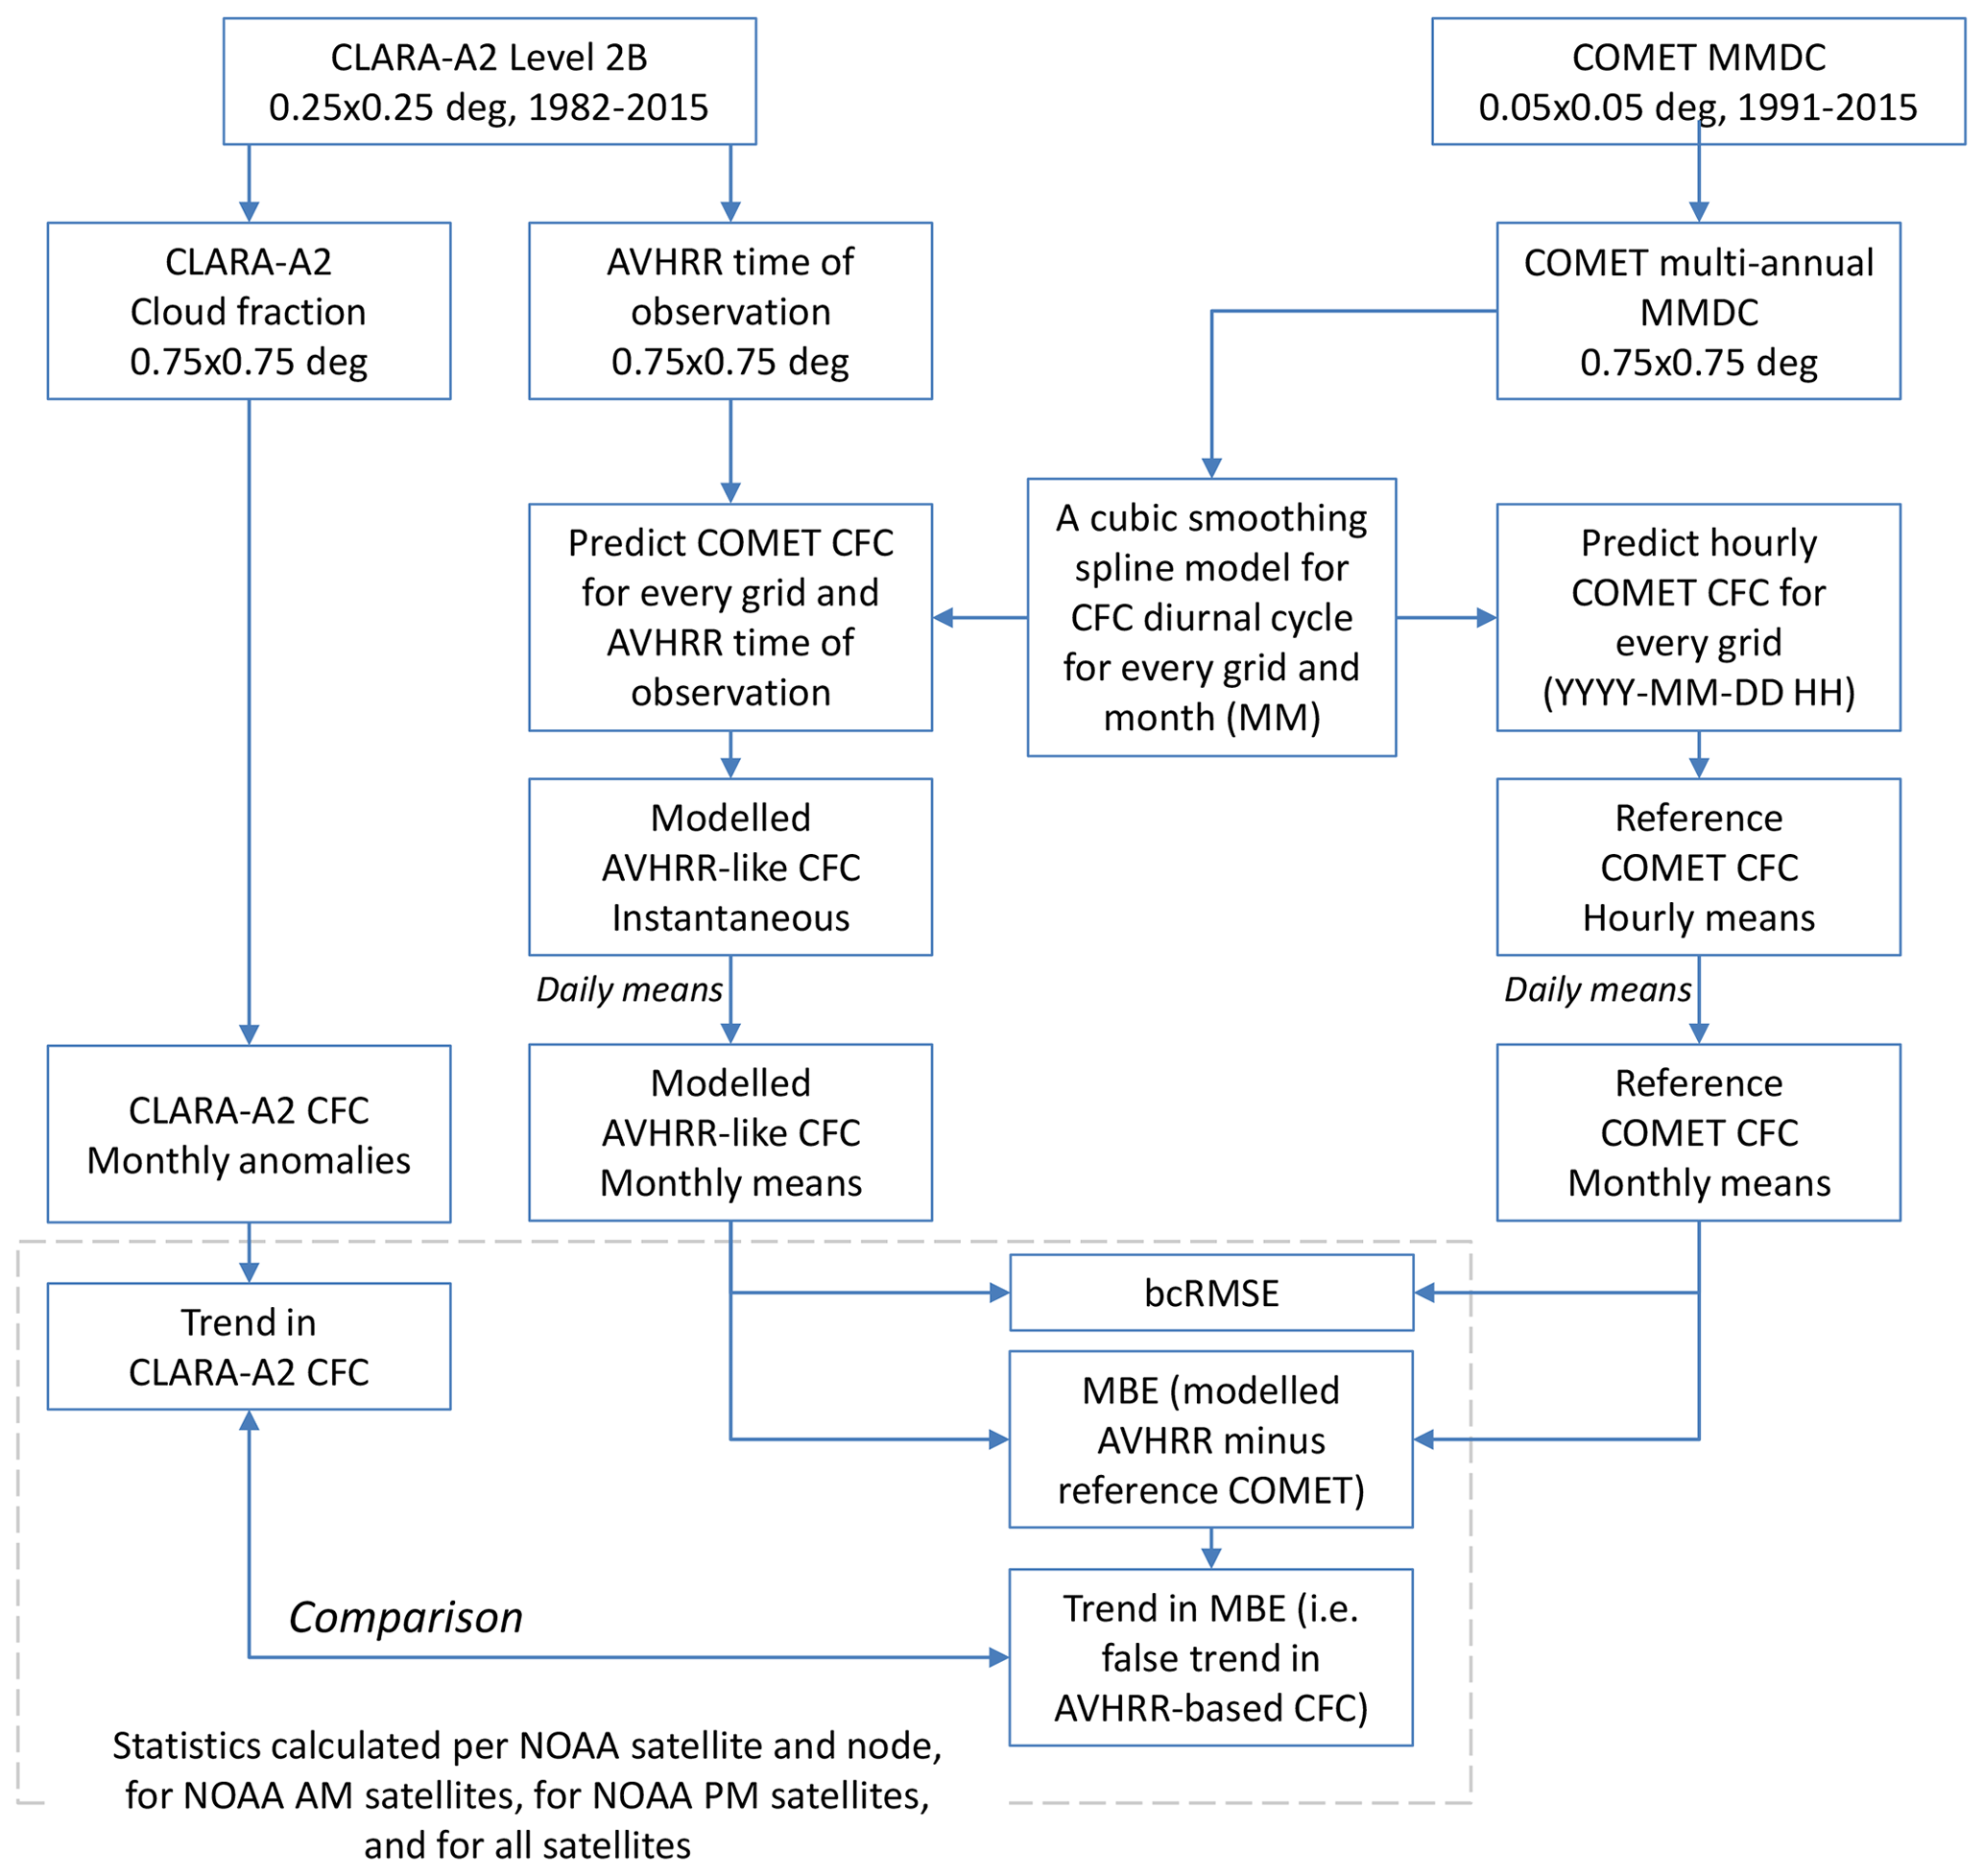
Figure 2Flowchart of the applied methodology consisting of predicting COMET CFC for AVHRR observation times, deriving a COMET-based CFC reference, and calculating errors and the magnitude of spurious trends in AVHRR-based CFC caused by satellite orbital drift.
3.1 Deriving reference and artificial AVHRR-like CFC time series from the COMET MMDC dataset
To estimate errors and spurious trends in the AVHRR-based CFC CDR induced by satellite orbital drift and variable number of AVHRR observations a day, the artificial time series was derived from the geostationary COMET CFC dataset sampled at the AVHRR observation times (i.e. COMET CFC “as seen” by the AVHRR sensors). Further, the artificial AVHRR-like CFC was compared with the COMET CFC to estimate errors and spurious trends in the AVHRR-based dataset. The conceptual scheme of the applied methodology is presented in Fig. 2.
To generate AVHRR-like CFC time series, first the COMET CFC MMDC was aggregated to a grid by means of first-order conservative remapping (Jones, 1999; Schulzweida, 2019). Then for every grid and month we computed a mean multi-annual CFC diurnal cycle to which we fitted the cubic smoothing spline model (Chambers and Hastie, 1992). The model was further used to predict CFC for the AVHRR overpass times derived from the CLARA-A2 dataset. The retrieved estimates were then averaged to generate the artificial AVHRR-like CFC monthly means. In this step, we created three separate products for morning satellites (AVHRR.AM), afternoon satellites (AVHRR.PM), and all satellites (AVHRR.AM+PM). Further, the spline model was used to predict CFC at full hours, and these were averaged to generate referential COMET CFC monthly means. The artificial AVHRR-like dataset covering the period 1982–2015 and the reference multi-annual CFC datasets were further compared to quantify the errors and spurious trends in the AVHRR-like dataset.
The decision to generate the referential multi-annual CFC by means of the grid-specific spline models instead of using the original COMET CFC MMDC had two premises. Firstly, the COMET time series does not cover the years 1982–1990 included in the CLARA-A2 time series, and thus there would be a need to substitute these years with the mean climatological diurnal cycles. This in turn could introduce an inhomogeneity in the referential dataset in 1990. Secondly, the objective of the study is to analyse spurious trends in the AVHRR CFC CDRs caused by orbital drift and sampling issues and not to analyse climatic trends in the CFC diurnal cycles revealed by the COMET dataset. For this please refer to Bojanowski and Musiał (2018).
3.2 Assessing errors and spurious trends of the artificial AVHRR-like CFC dataset
To assess the reliability of the artificial AVHRR-like monthly mean CFC dataset, the mean bias error (MBE) as well as the bias-corrected root mean square error (bcRMSE) were computed (see Appendix A for details) between this dataset and the referential mean monthly COMET CFC. The errors were estimated for each grid, separately for each NOAA and MetOp satellite, with and without the distinction between satellite nodes (ascending and descending). It has to be noted that the estimated error for a single satellite has two components. The first error component is related to how accurately one (for a single node) or two (for both nodes) discrete AVHRR-based CFC estimates per day represent a daily CFC mean value. Without the orbital drift and climatic change of the CFC diurnal cycle, this error should be stable over the course of a satellite operating time. The second error component is related to the change of the AVHRR acquisition time induced by orbital drift, and its magnitude varies with increasing satellite drift. The magnitude of the error depends on the phase and amplitude of the CFC diurnal cycle. If the amplitude is large, the small shift in time of satellite observation will cause an error. Yet, if the amplitude is very small, for instance in a region that is constantly overcast, even a large change in the observation time does not introduce any error.
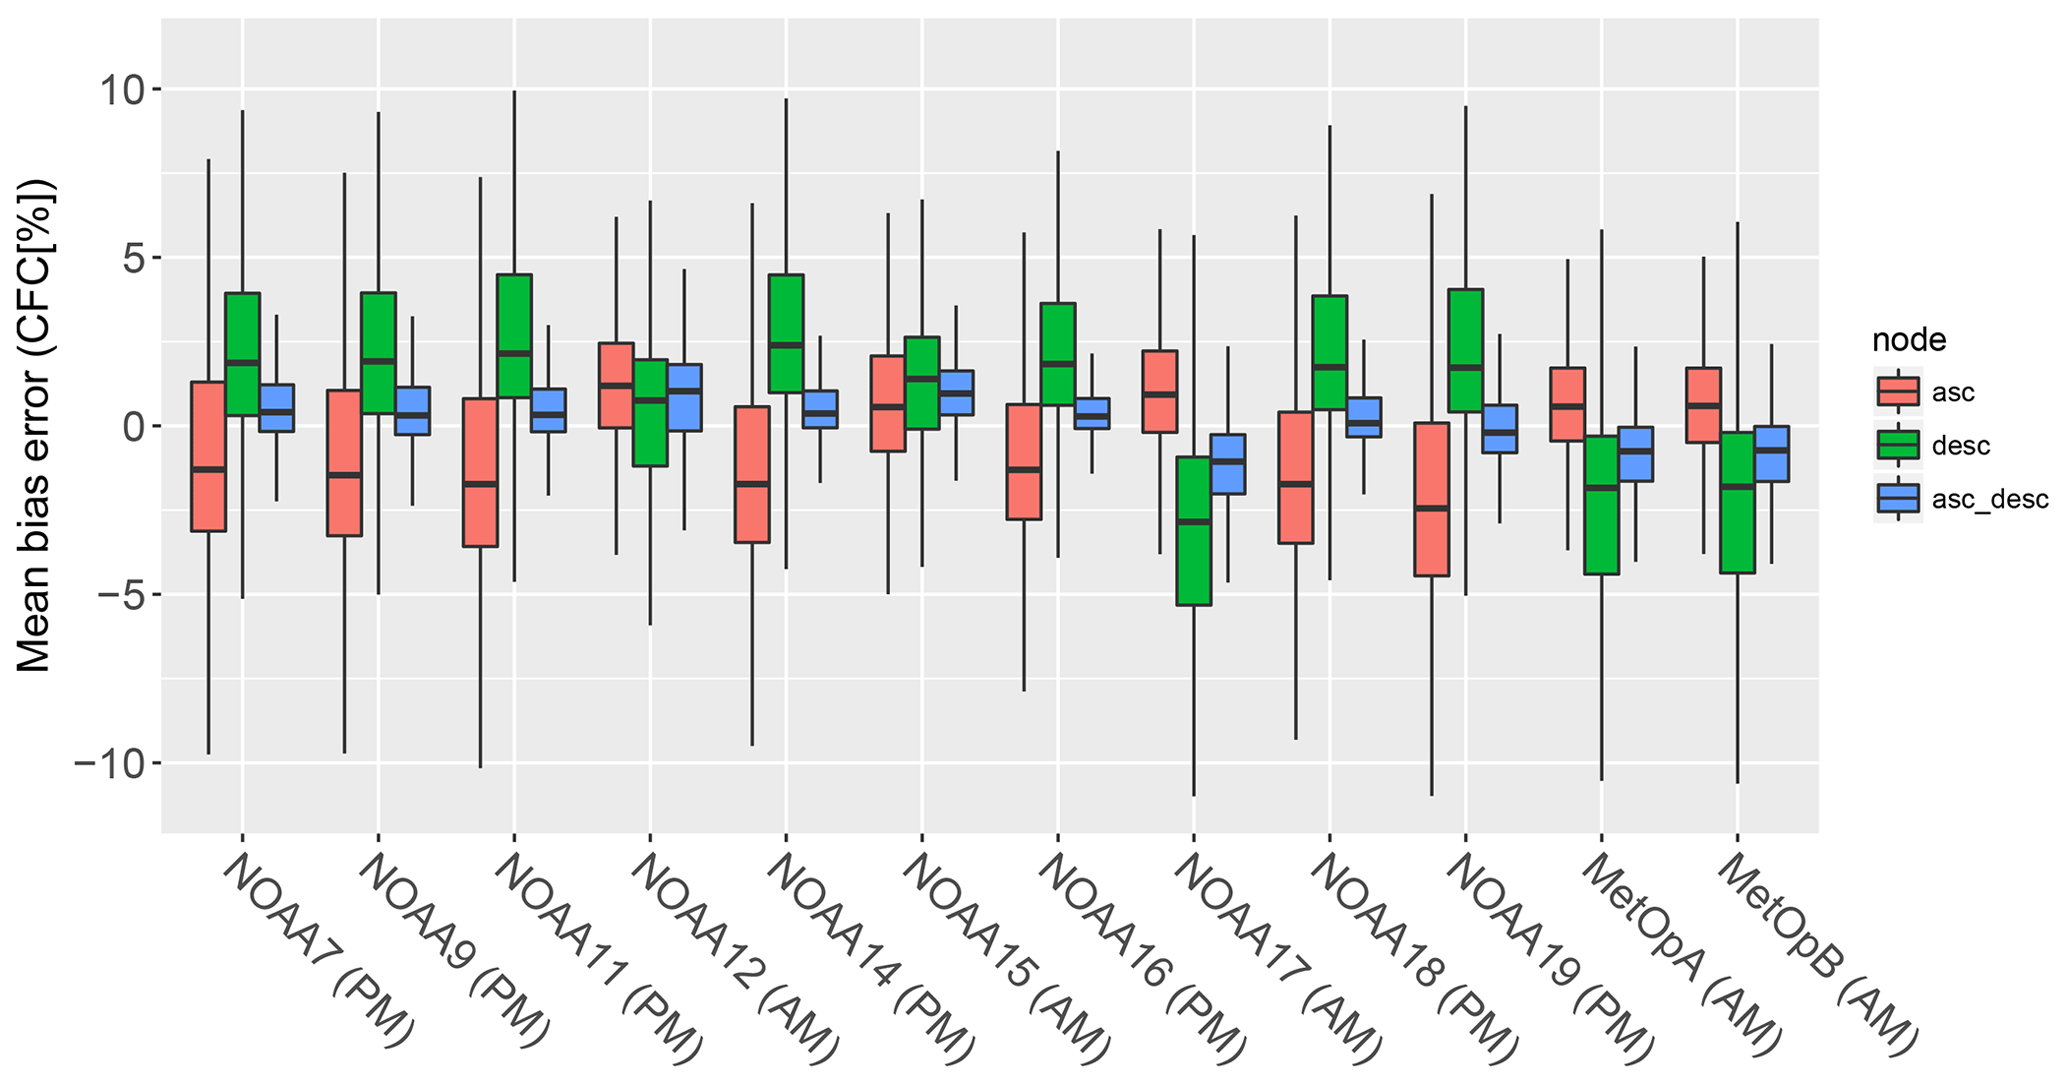
Figure 3Distribution of the mean CFC bias error caused by the discrete sampling of the CFC diurnal cycle presented for each NOAA satellite (AM – morning – and PM – afternoon) and each node (asc – ascending, desc – descending, and asc_desc – ascending and descending combined). The lower and upper hinges correspond to the 25th and 75th percentiles, while whiskers extend from the hinge to the largest and lowest values within 1.5 times the interquartile range.
To assess the magnitude of spurious temporal trends in the Level-3 AVHRR CFC monthly means, the trend in MBE was calculated between the reference and artificial AVHRR-like datasets. For this analysis, we used monotonic trends derived using the Theil–Sen estimates (Theil, 1950), and their significance was estimated with the Mann–Kendall test (Kendall, 1938; Mann, 1945). For multiple comparisons of the statistical significance of each grid, we applied the adjustment of the p value using the method of Benjamini and Hochberg (1995). As for the performance assessment, the trends were calculated for individual satellites and nodes, as well as for the three aforementioned synthetic CDRs (AVHRR.AM, AVHRR.PM, and AVHRR.AM+PM). We have excluded from the analysis the MetOp platforms, as they do not feature orbital drift (Fig. 1). Finally, we juxtaposed the theoretical spurious trends in the AVHRR-like Level-3 datasets with the temporal trends derived from the CLARA-A2 CDR.
4.1 Impact of discrete diurnal cycle sampling on the CFC time series
The impact of undersampling of the cloudiness diurnal cycle on the CFC CDRs is related to representativeness of one (for a single node) or two (for both nodes) observations with respect to the mean daily CFC. The largest positive bias up to 10 % is revealed for the nighttime (02:00) observations of the afternoon satellites' descending node, whereas the negative bias for afternoon satellites' ascending node (14:00) and morning satellites' descending node (07:00) (Fig. 3). The magnitude of bias is similar for all afternoon satellites because their initial (before-drifting) time of acquisition was similar. Among the morning satellites, the bias for NOAA-12 and NOAA-15 differs, as their initial observation time was 2–3 h earlier than for the rest of the morning satellites. For the ascending and descending nodes combined, the bias is lower than for the single nodes, which shows that two observations (approx. 12 h apart) can substantially better represent the daily CFC than a single observation. Yet, this is partly due to cancelling out the larger negative and positive biases of the individual nodes.
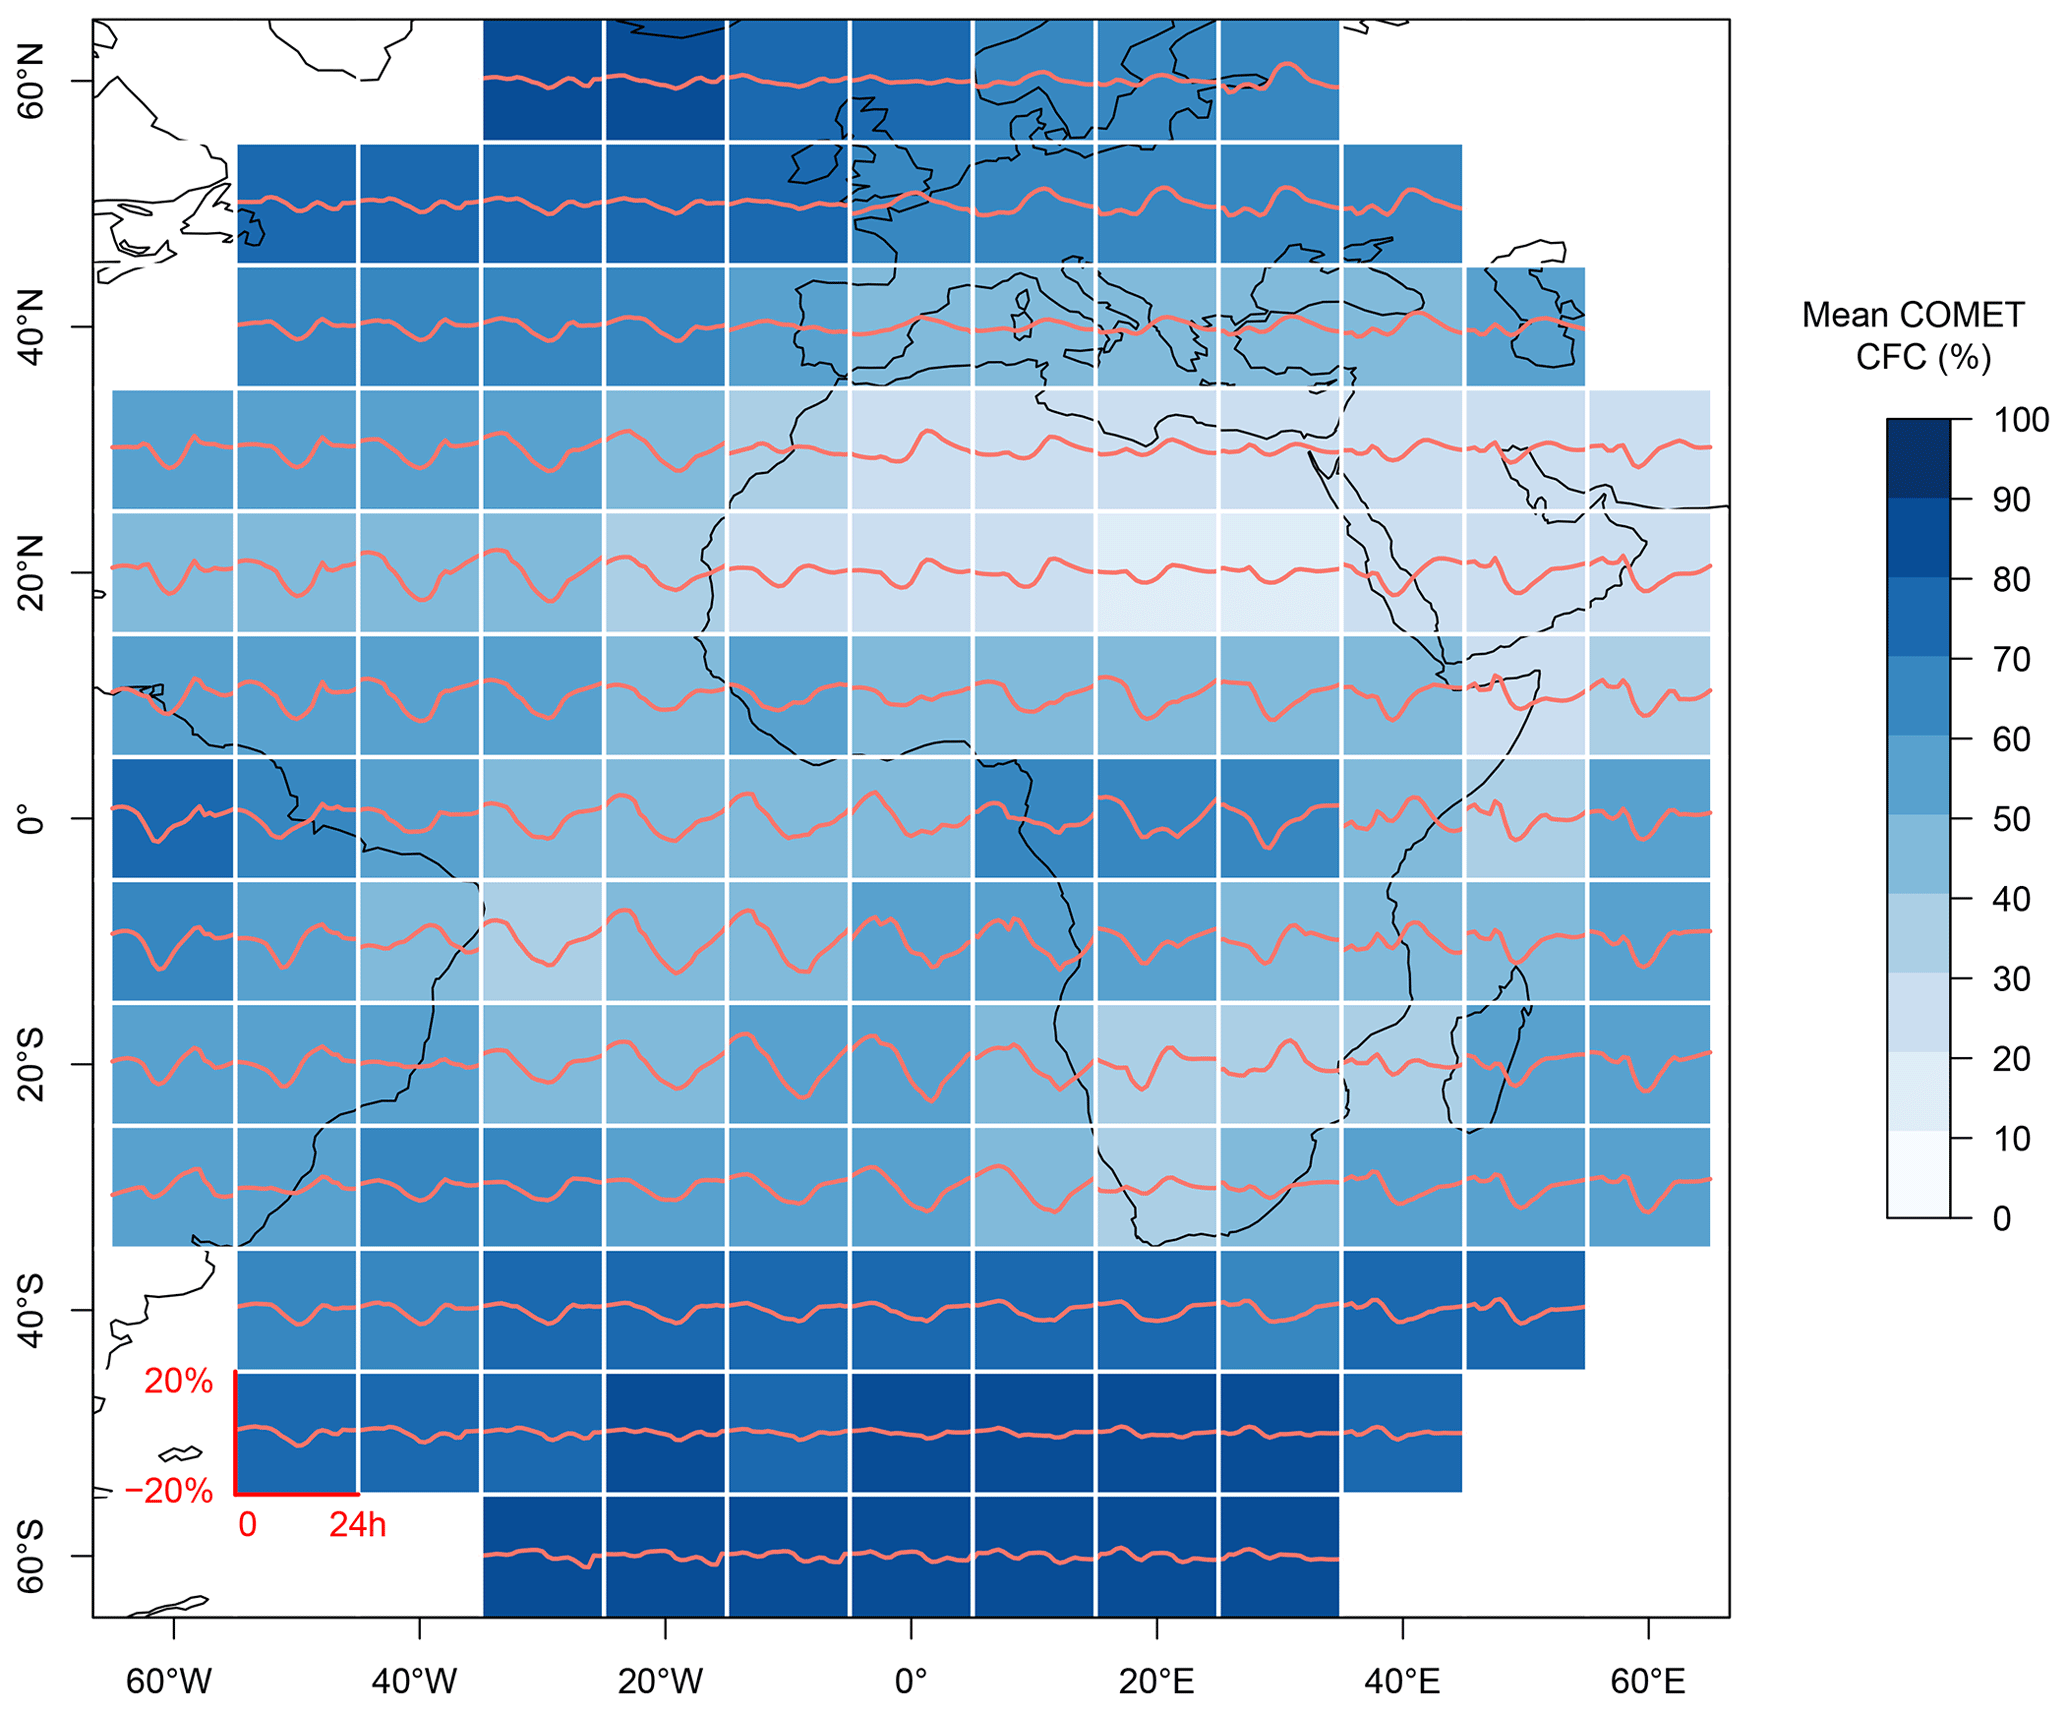
Figure 4CFC diurnal cycle from COMET aggregated in grids. Axes used for each grid box are shown in the bottom left corner of the figure: the y axis represents 3-hourly CFC ( %) divided by daily mean, and the x axis represents local solar time (h). In the blue colour scale the mean COMET CFC is shown.
The spatial distribution of the error is similar for all afternoon and morning satellites and related to CFC diurnal cycle regimes (Fig. 4). The ascending node of afternoon satellites related to daytime conditions generally reveals a negative bias over the ocean and a positive one over land (Fig. 5). For the descending node, the spatial pattern is reversed. In both cases, the largest bias (up to ±10 %) can be observed over the southeastern and northeastern Atlantic. However, in the tropics the bias has the same sign as over the ocean, which is related to a similar phase of the CFC diurnal cycle. For the combined nodes, the bias is largely reduced (up to ±2 %) and follows the land–ocean pattern of the afternoon satellites.
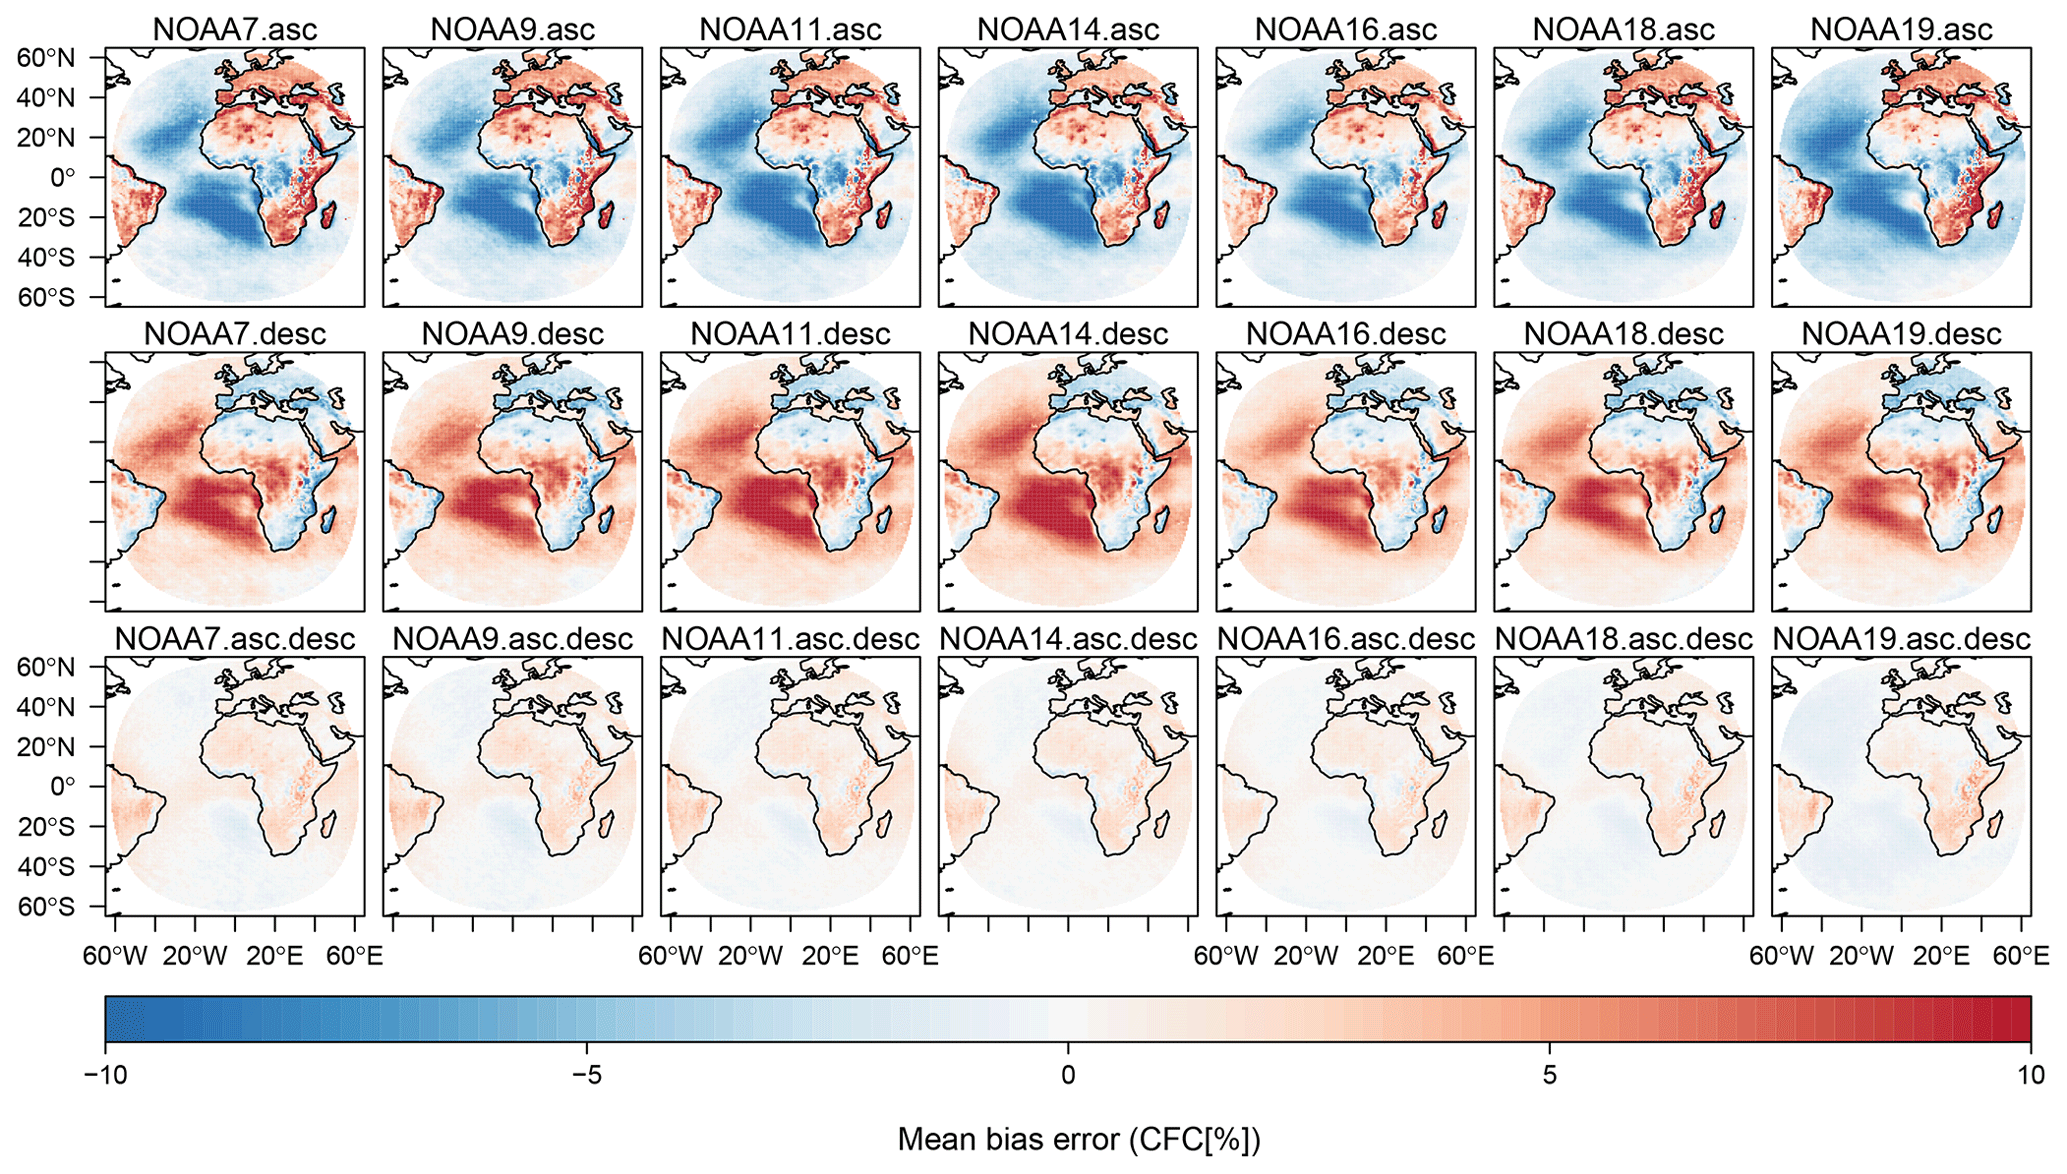
Figure 5Mean bias error of CFC caused by discrete sampling of CFC diurnal cycle presented for each afternoon (PM) NOAA satellite and each node (asc – ascending, desc – descending, and asc.desc – ascending and descending combined).
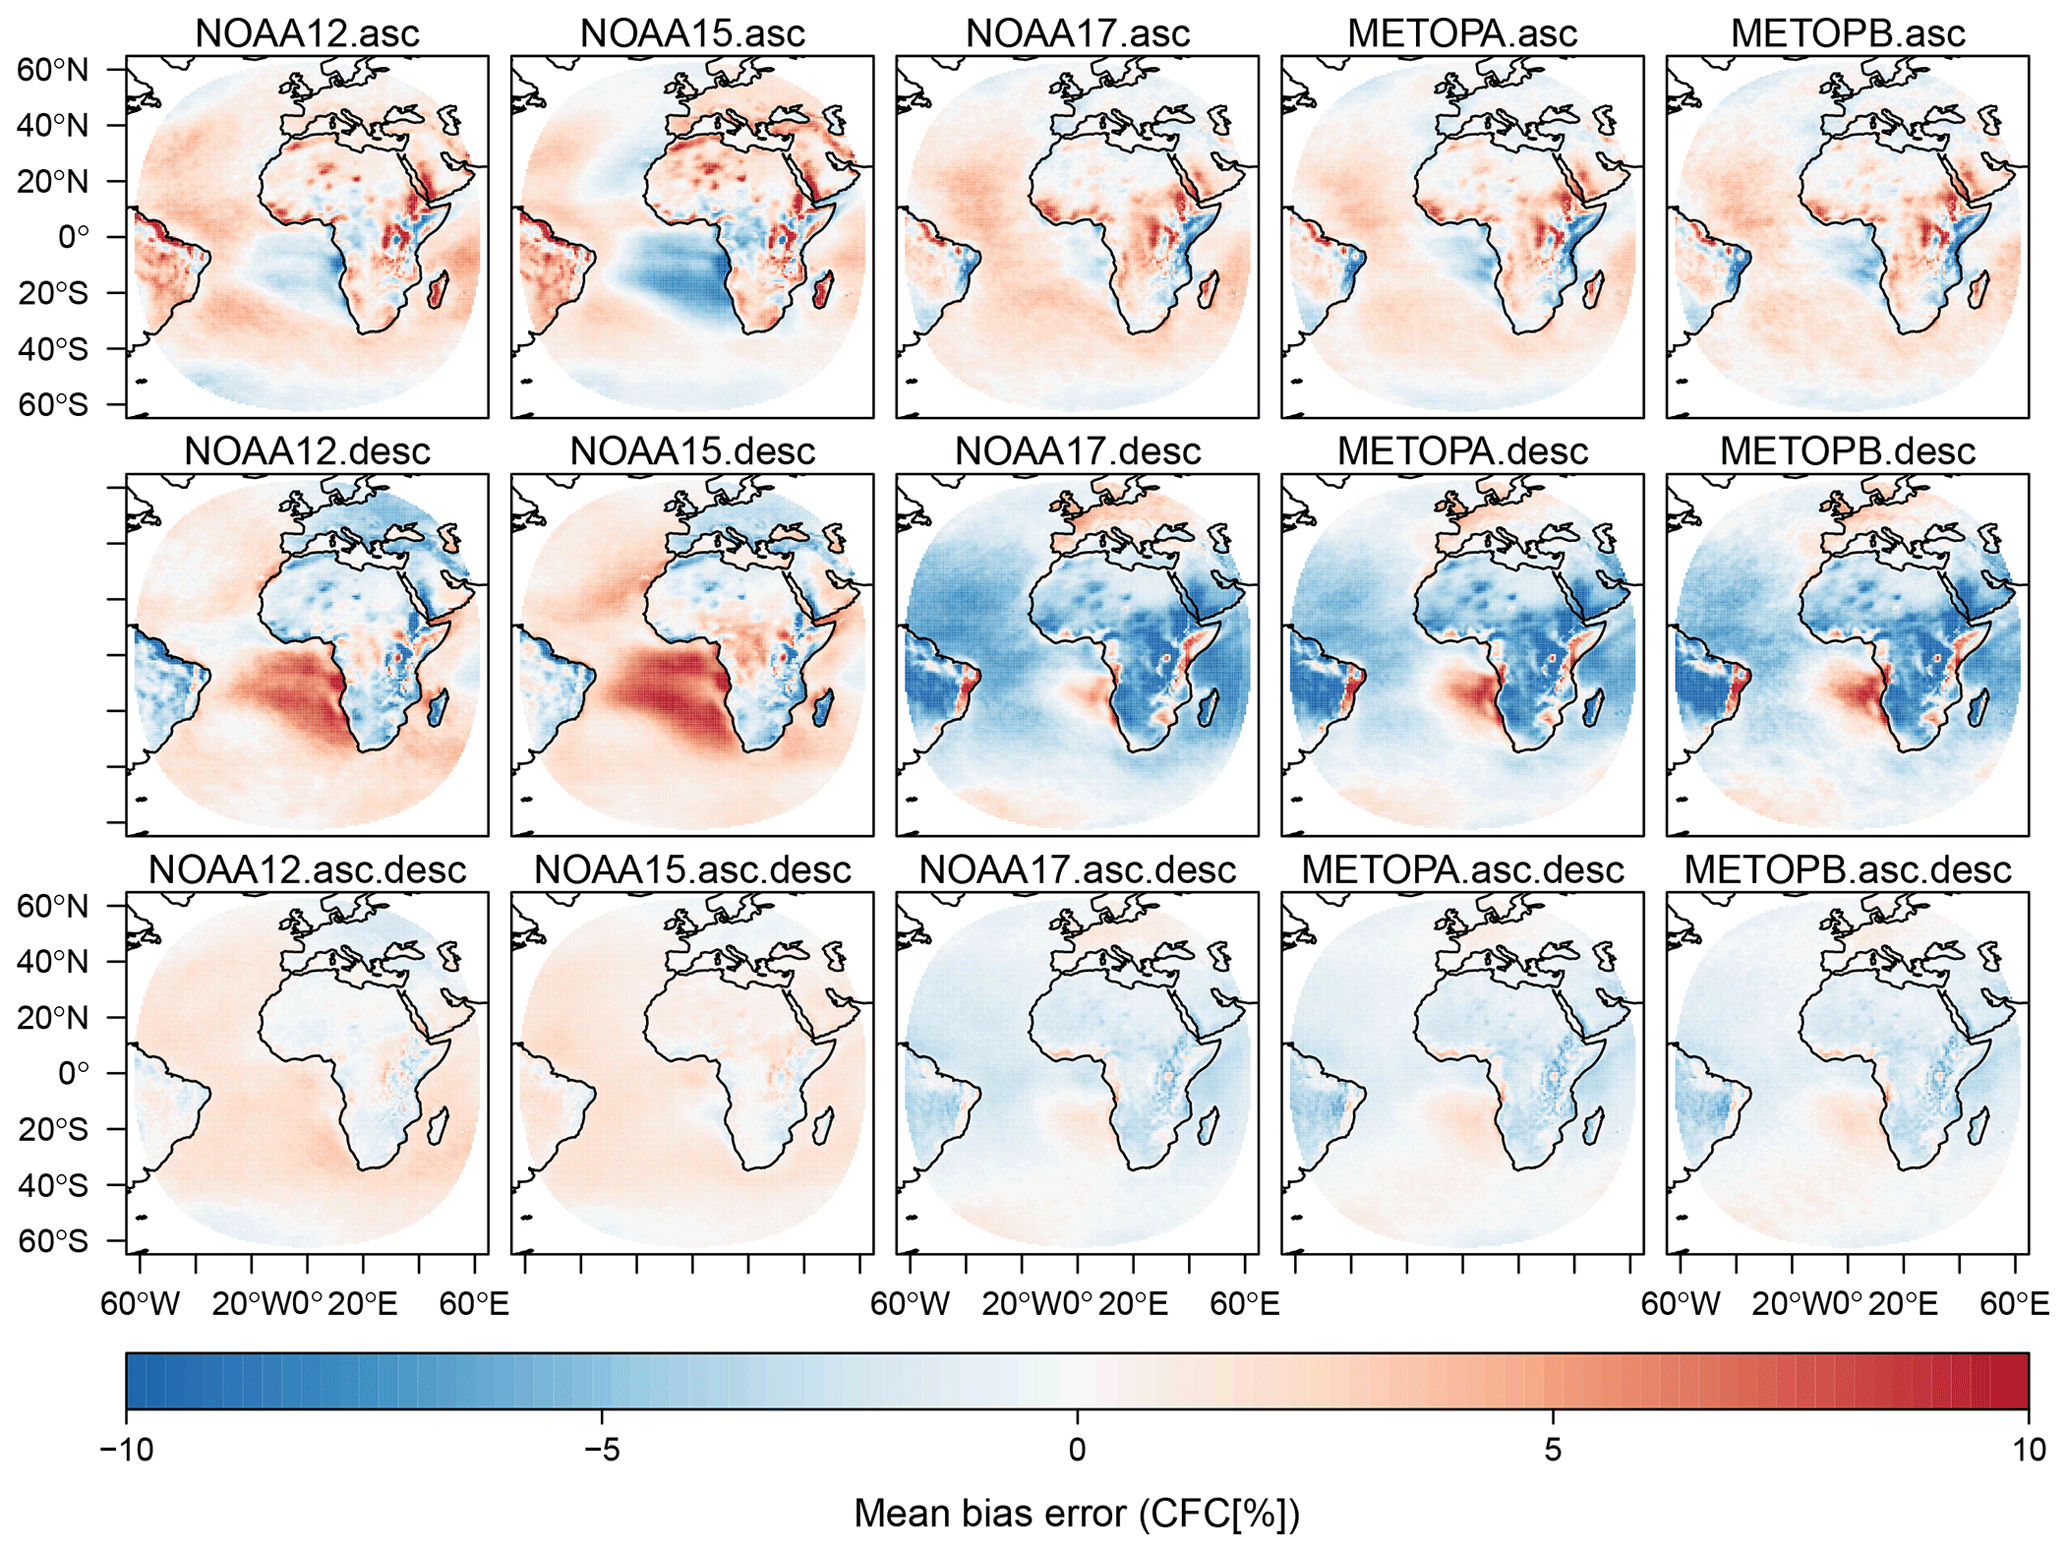
Figure 6Mean bias error of CFC caused by discrete sampling of CFC diurnal cycle presented for each morning (AM) NOAA satellite and each node (asc – ascending, desc – descending, and asc.desc – scending and descending combined).
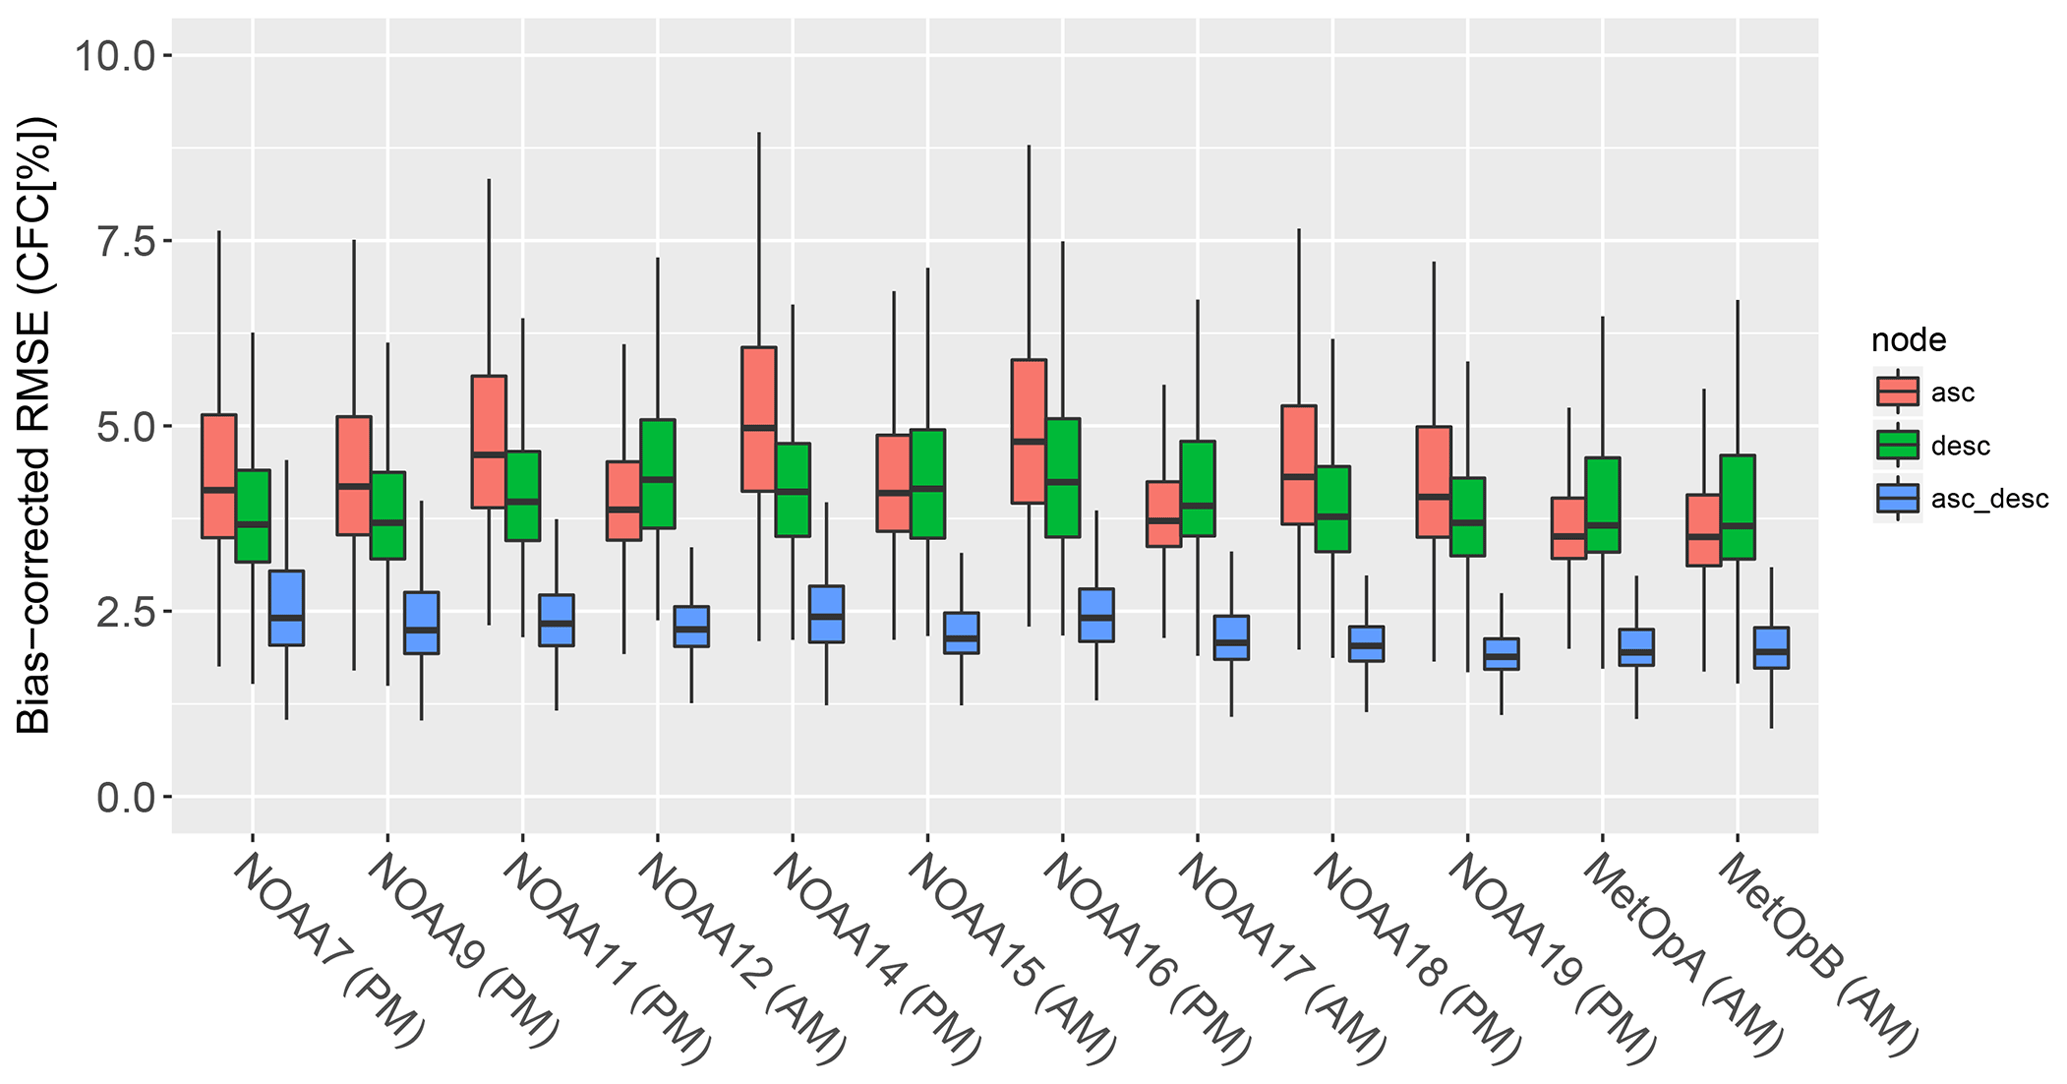
Figure 7Distribution of the CFC bias-corrected root mean square error caused by the discrete sampling of the CFC diurnal cycle presented for each NOAA satellite and each node (asc – ascending, desc – descending, and asc_desc – ascending and descending combined). The lower and upper hinges correspond to the 25th and 75th percentiles, while whiskers extend from the hinge to the largest and lowest values within 1.5 times the interquartile range.
The 2 h difference in the image acquisition time between NOAA-12 and NOAA-15 and the other morning satellites leads to a noticeably different spatial distribution of the error (Fig. 6). NOAA-12 and NOAA-15 follow the spatial pattern of the afternoon satellites but with the lower bias values. The NOAA-17 and MetOp platforms show different biases over land (e.g. between Europe and Africa). Moreover, for these satellites a generally greater negative bias for the descending node leads to larger biases for combined ascending and descending nodes.
The bias-corrected root mean square error computed between the AVHRR-like CFC and referential COMET CFC can reach up to 9 % due to the undersampling of the CFC diurnal cycle. The differences between the morning and afternoon satellites are not as evident as for the bias (Fig. 7). For the combined nodes, the average bcRMSE does not exceed 2.5 % with the maximum below 4 %.
The time of satellite observation does not significantly influence the bcRMSE variability between the sensors. The error for both morning and afternoon satellites and the single satellite node reveals similar spatial distribution with the highest bcRMSE over the Atlantic and over Africa (Figs. 8 and 9), where the CFC diurnal cycle has the largest diurnal amplitude (Fig. 4). Nevertheless, these spatial patterns are almost not apparent for the combined satellite nodes (two available observations per day), and the overall bcRMSE is lower. This proves that the CFC CDRs without the distinction between ascending and descending satellite nodes provide significantly more accurate mean monthly estimates.
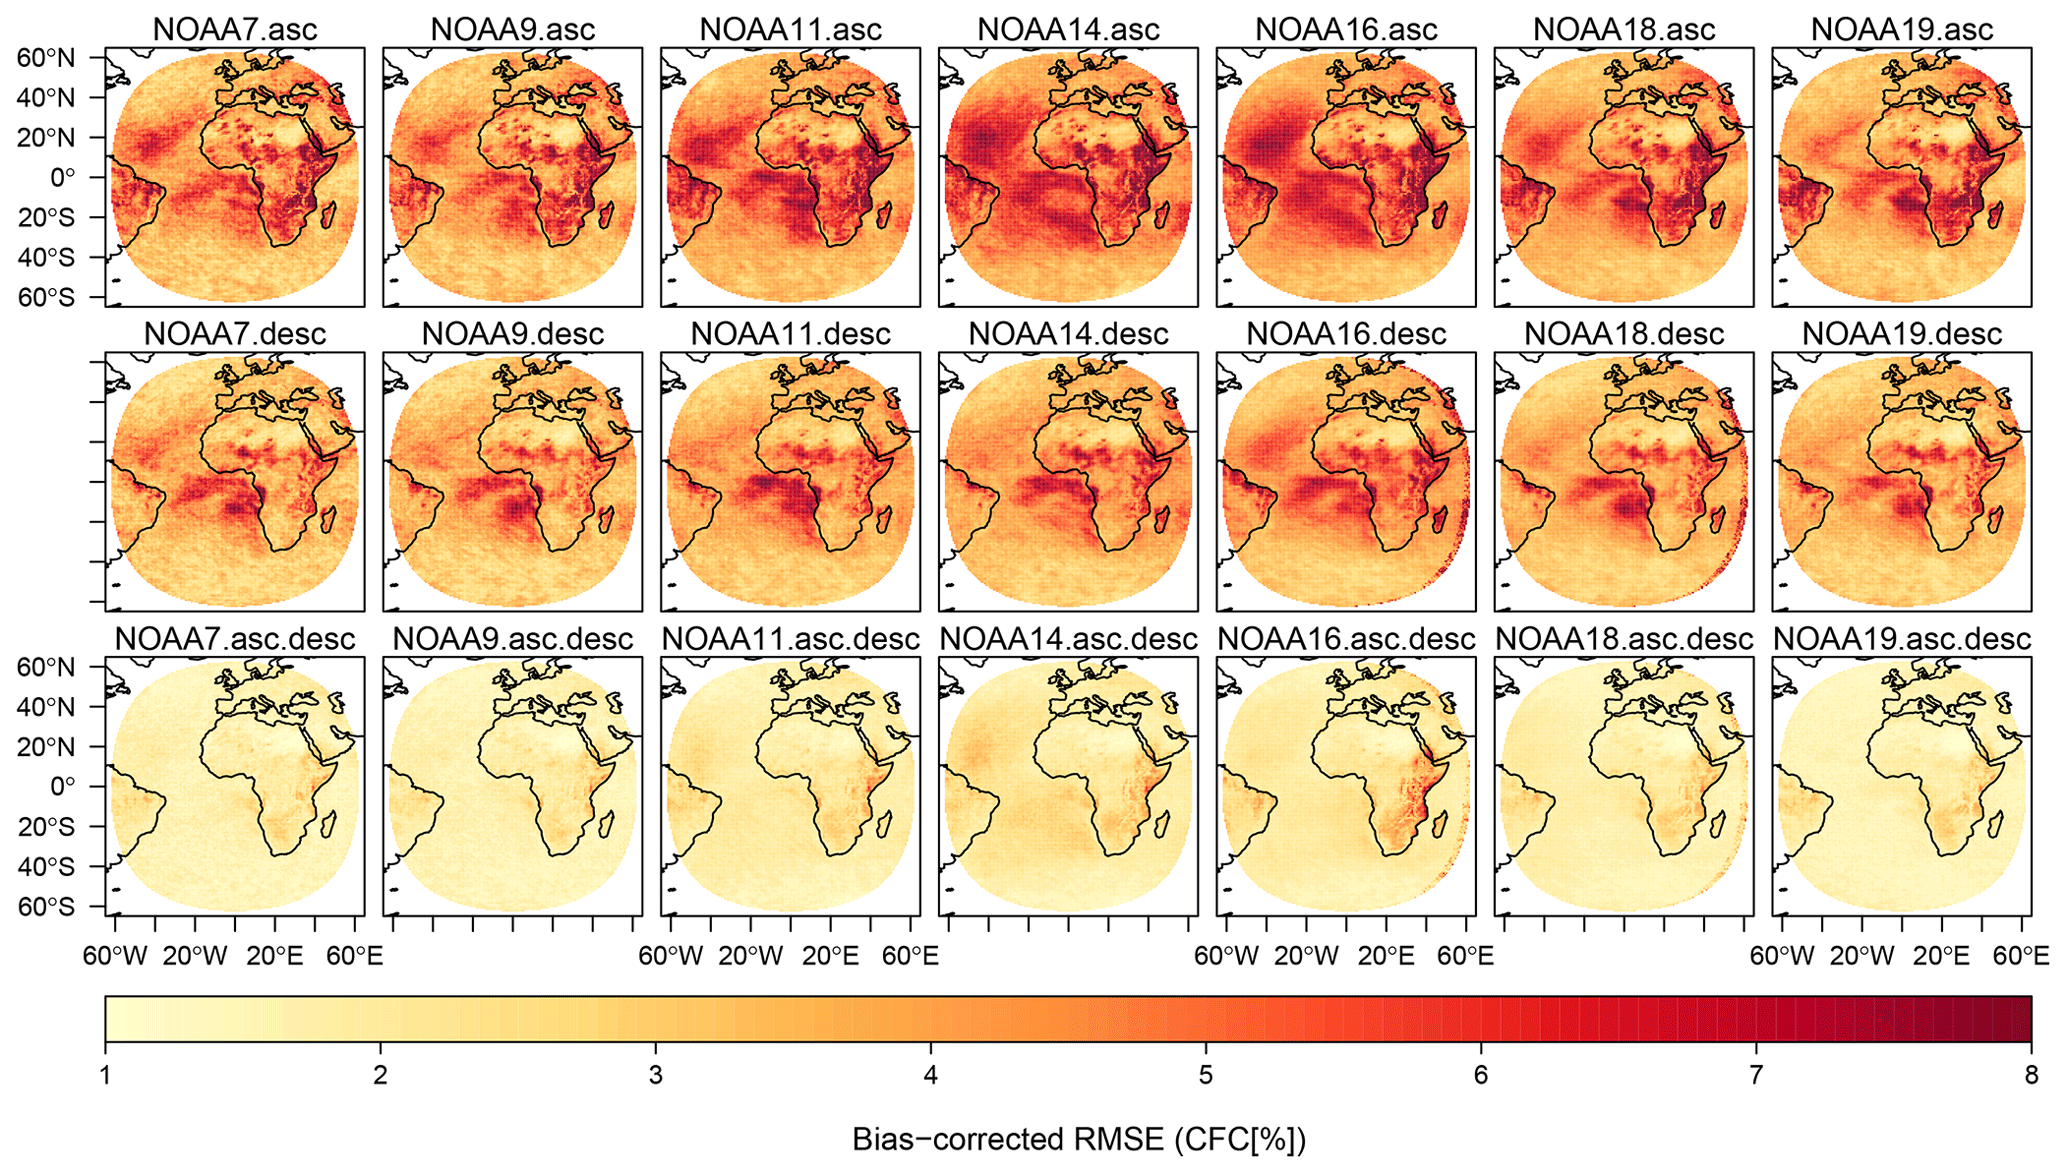
Figure 8Bias-corrected root mean square error of CFC caused by the discrete sampling of the CFC diurnal cycle, presented for each afternoon (PM) NOAA satellite and each node (asc – ascending, desc – descending, and asc.desc – ascending and descending combined).
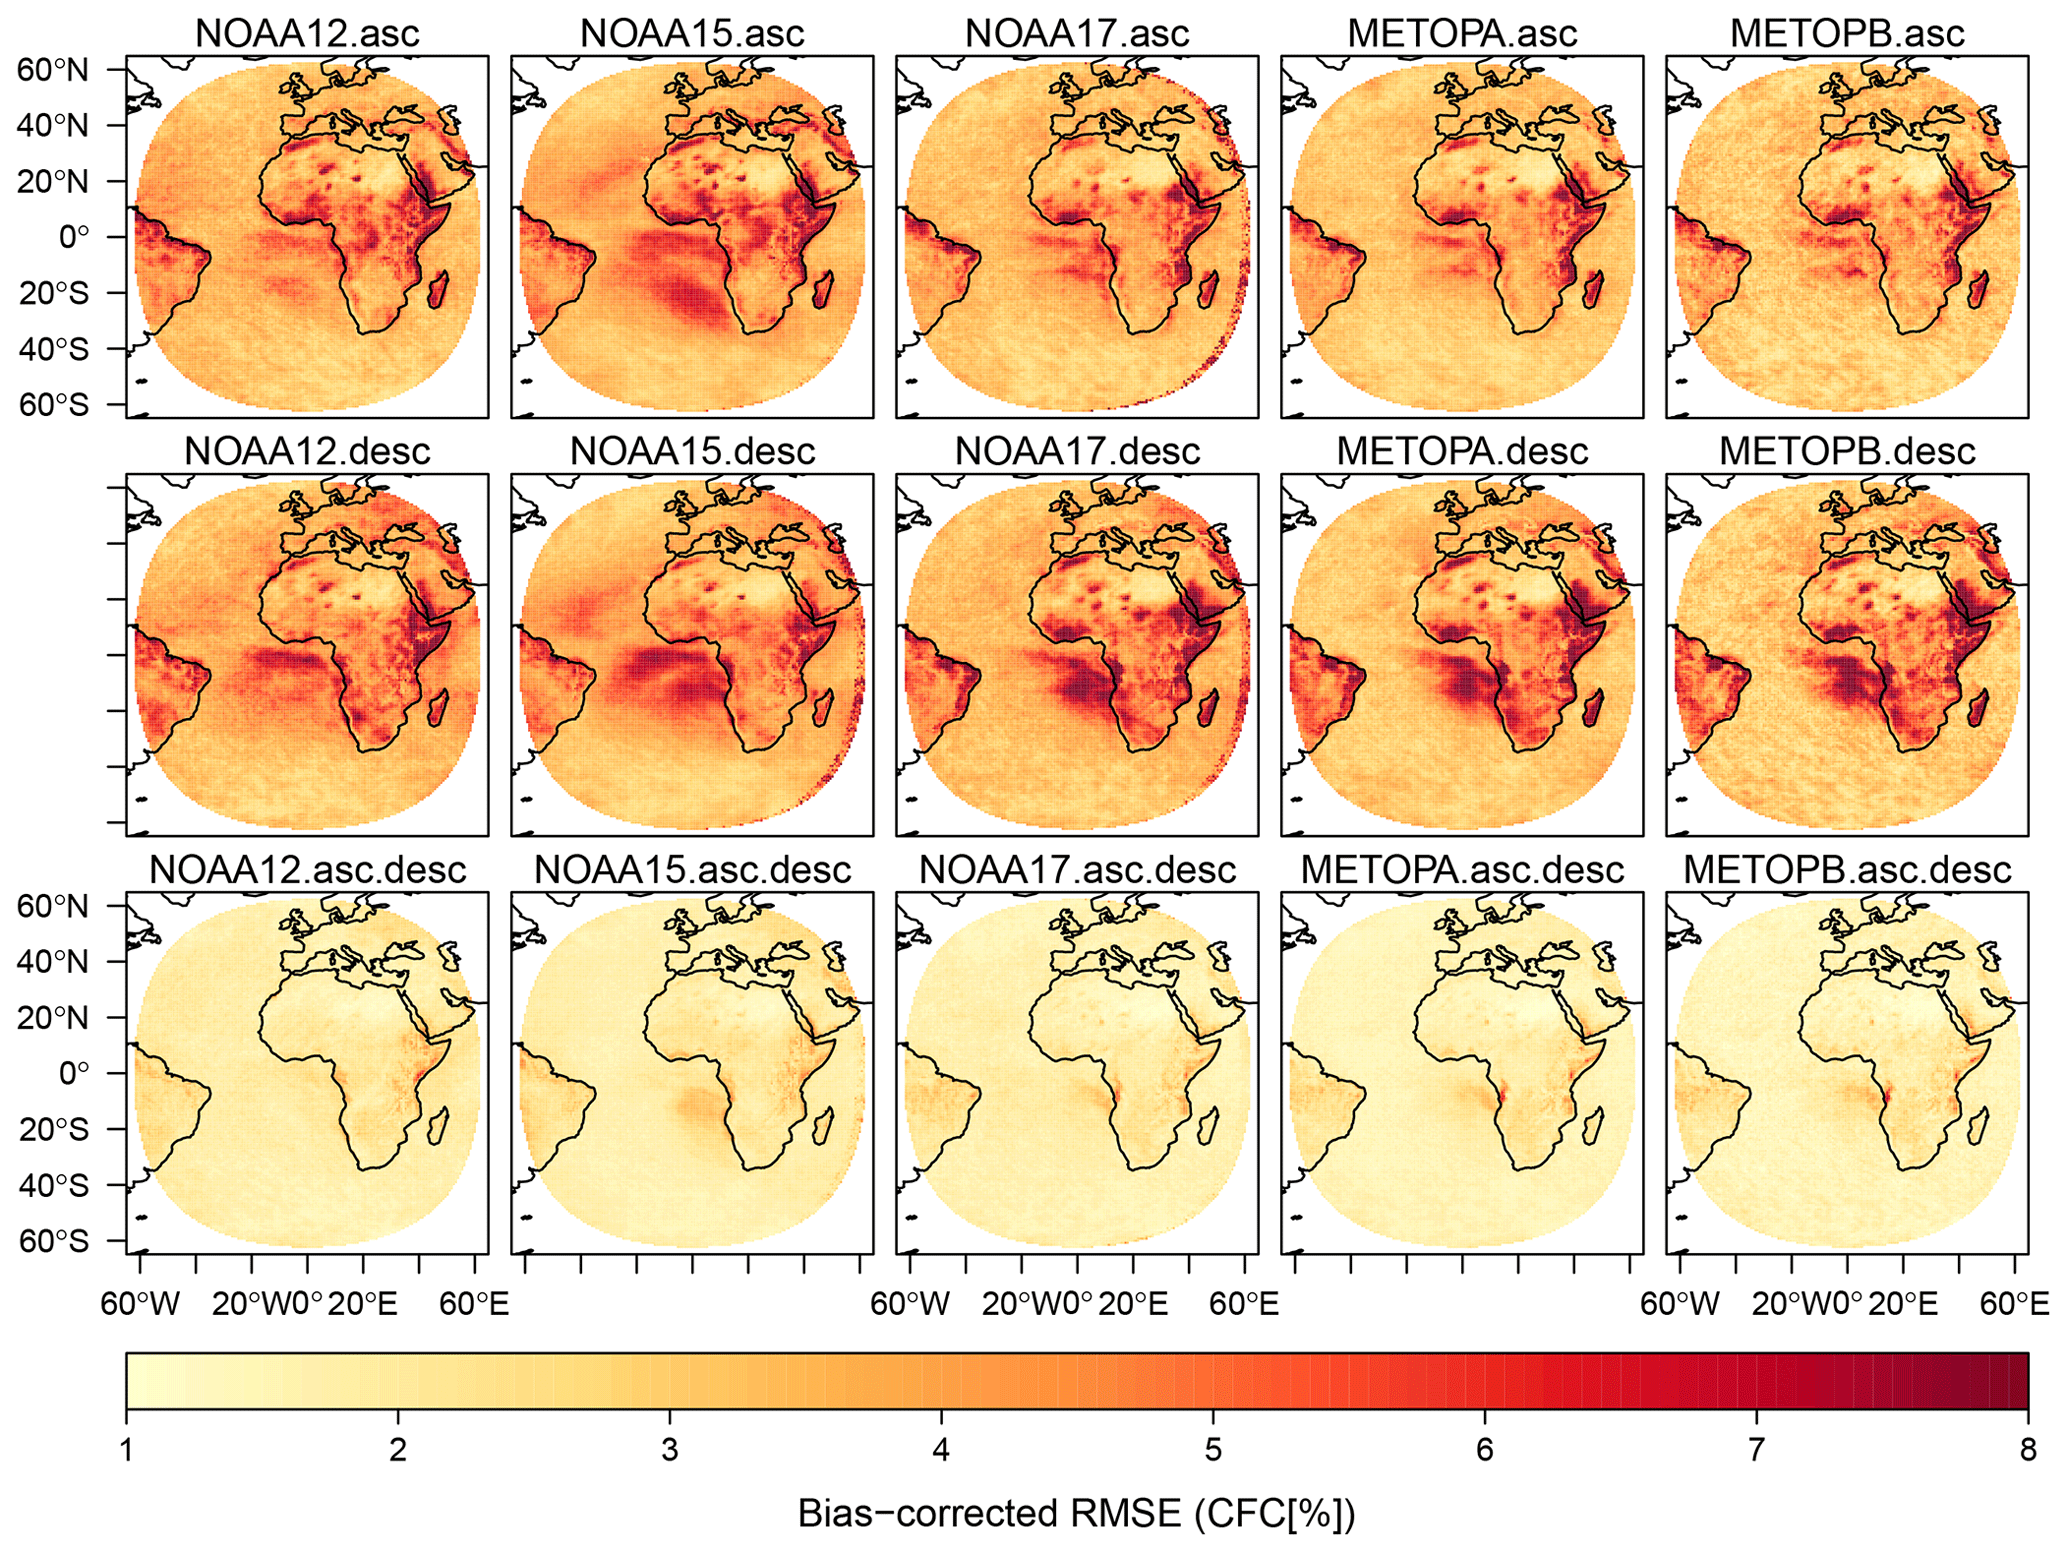
Figure 9Bias-corrected root mean square error of CFC caused by the discrete sampling of the CFC diurnal cycle, presented for each morning (AM) NOAA satellite and each node (asc – ascending, desc – descending, and asc.desc – ascending and descending combined).
4.2 Impact of satellite orbital drift on spurious CFC temporal trends for individual platforms
Satellite orbital drift induces spurious temporal trends reaching up to ±7 % CFC per decade in the AVHRR-like CDRs (Fig. 10). On average, the spurious trends are of 1 % per decade both for a single node and the combined nodes. For the afternoon satellites, greater spurious trends are encountered for the ascending than for the descending nodes. The largest magnitude of these trends is observed for the NOAA-7 and NOAA-9 satellites due to their quickest orbital drift. Reversely, CFC time series derived from satellites with the limited orbital drift (e.g. NOAA-19) feature low values of spurious CFC trends. The MetOp platforms were excluded from the analysis, as they do not feature satellite drift.
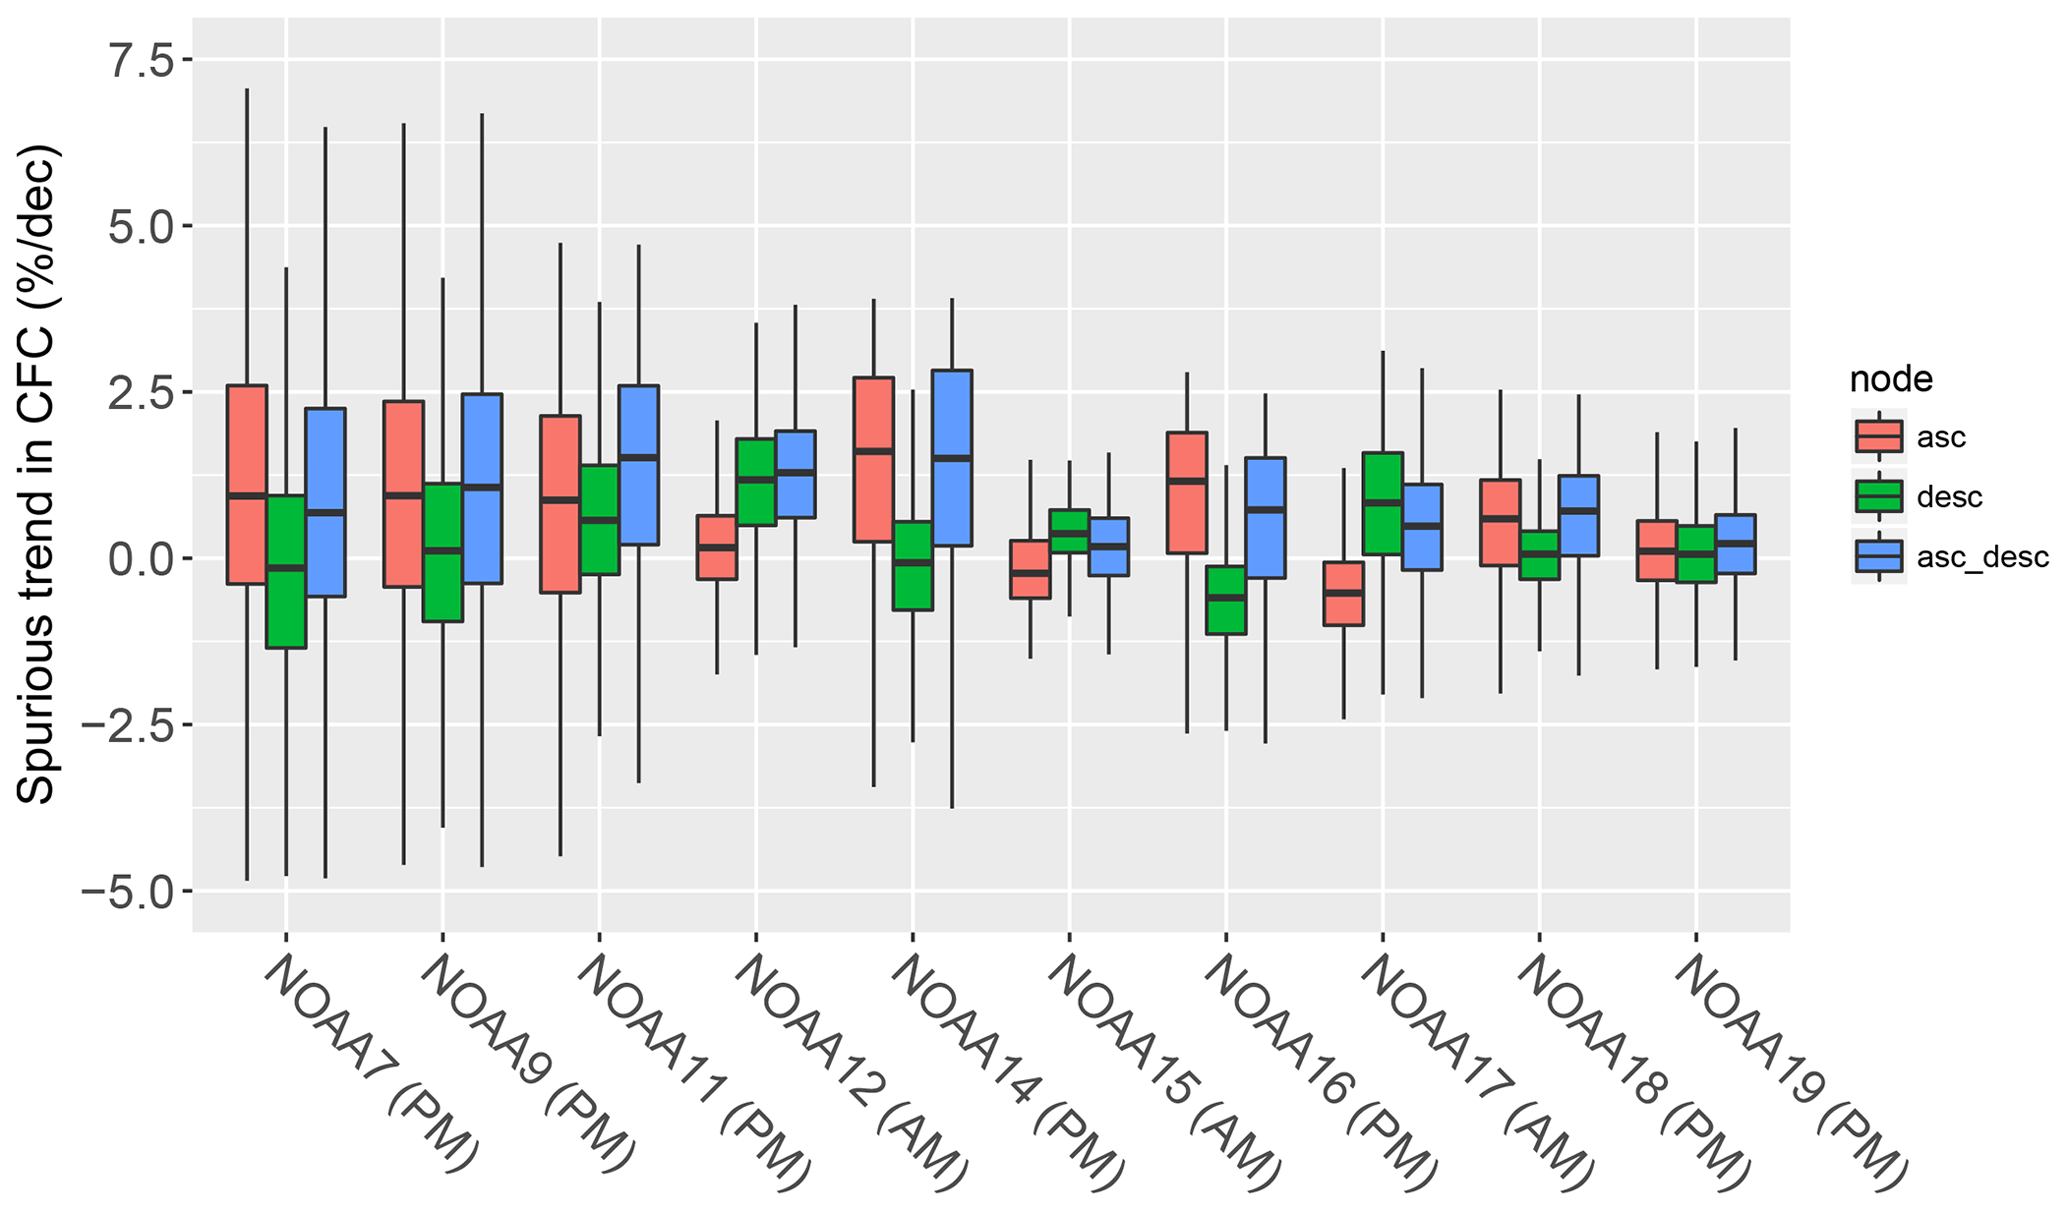
Figure 10Distribution of spurious trends in CFC caused by the discrete sampling of the CFC diurnal cycle presented for each NOAA satellite and each node (asc – ascending, desc – descending, and asc_desc – ascending and descending combined). Trends for MetOp platforms are not presented due to lack of orbital drift. The lower and upper hinges correspond to the 25th and 75th percentiles, while whiskers extend from the hinge to the largest and lowest values within 1.5 times the interquartile range.
Figure 11 shows the spatial distribution of the statistically significant spurious temporal trends for the afternoon satellites. It has to be noted that statistical significance of these trends is also affected by the length of the time series of each satellite. For the ascending node the spurious trends are positive over the ocean and negative over land. However, for the southeastern Atlantic the trend is negative, which is related to a different CFC diurnal regime in this area (Fig. 4). The spurious trends for NOAA-14 and NOAA-16 do not reveal this pattern over the ocean. These two satellites drifted more than other afternoon satellites, and their shift in a local time of observation passed a local extreme in the diurnal CFC cycle, which in turn has flattened the temporal trend. The spurious trends for the ascending node dominate the trends observed for the combined nodes, which reveal statistically significant trends with a clear spatial pattern: positive values over the ocean (<6 %) and negative values over land ( %).
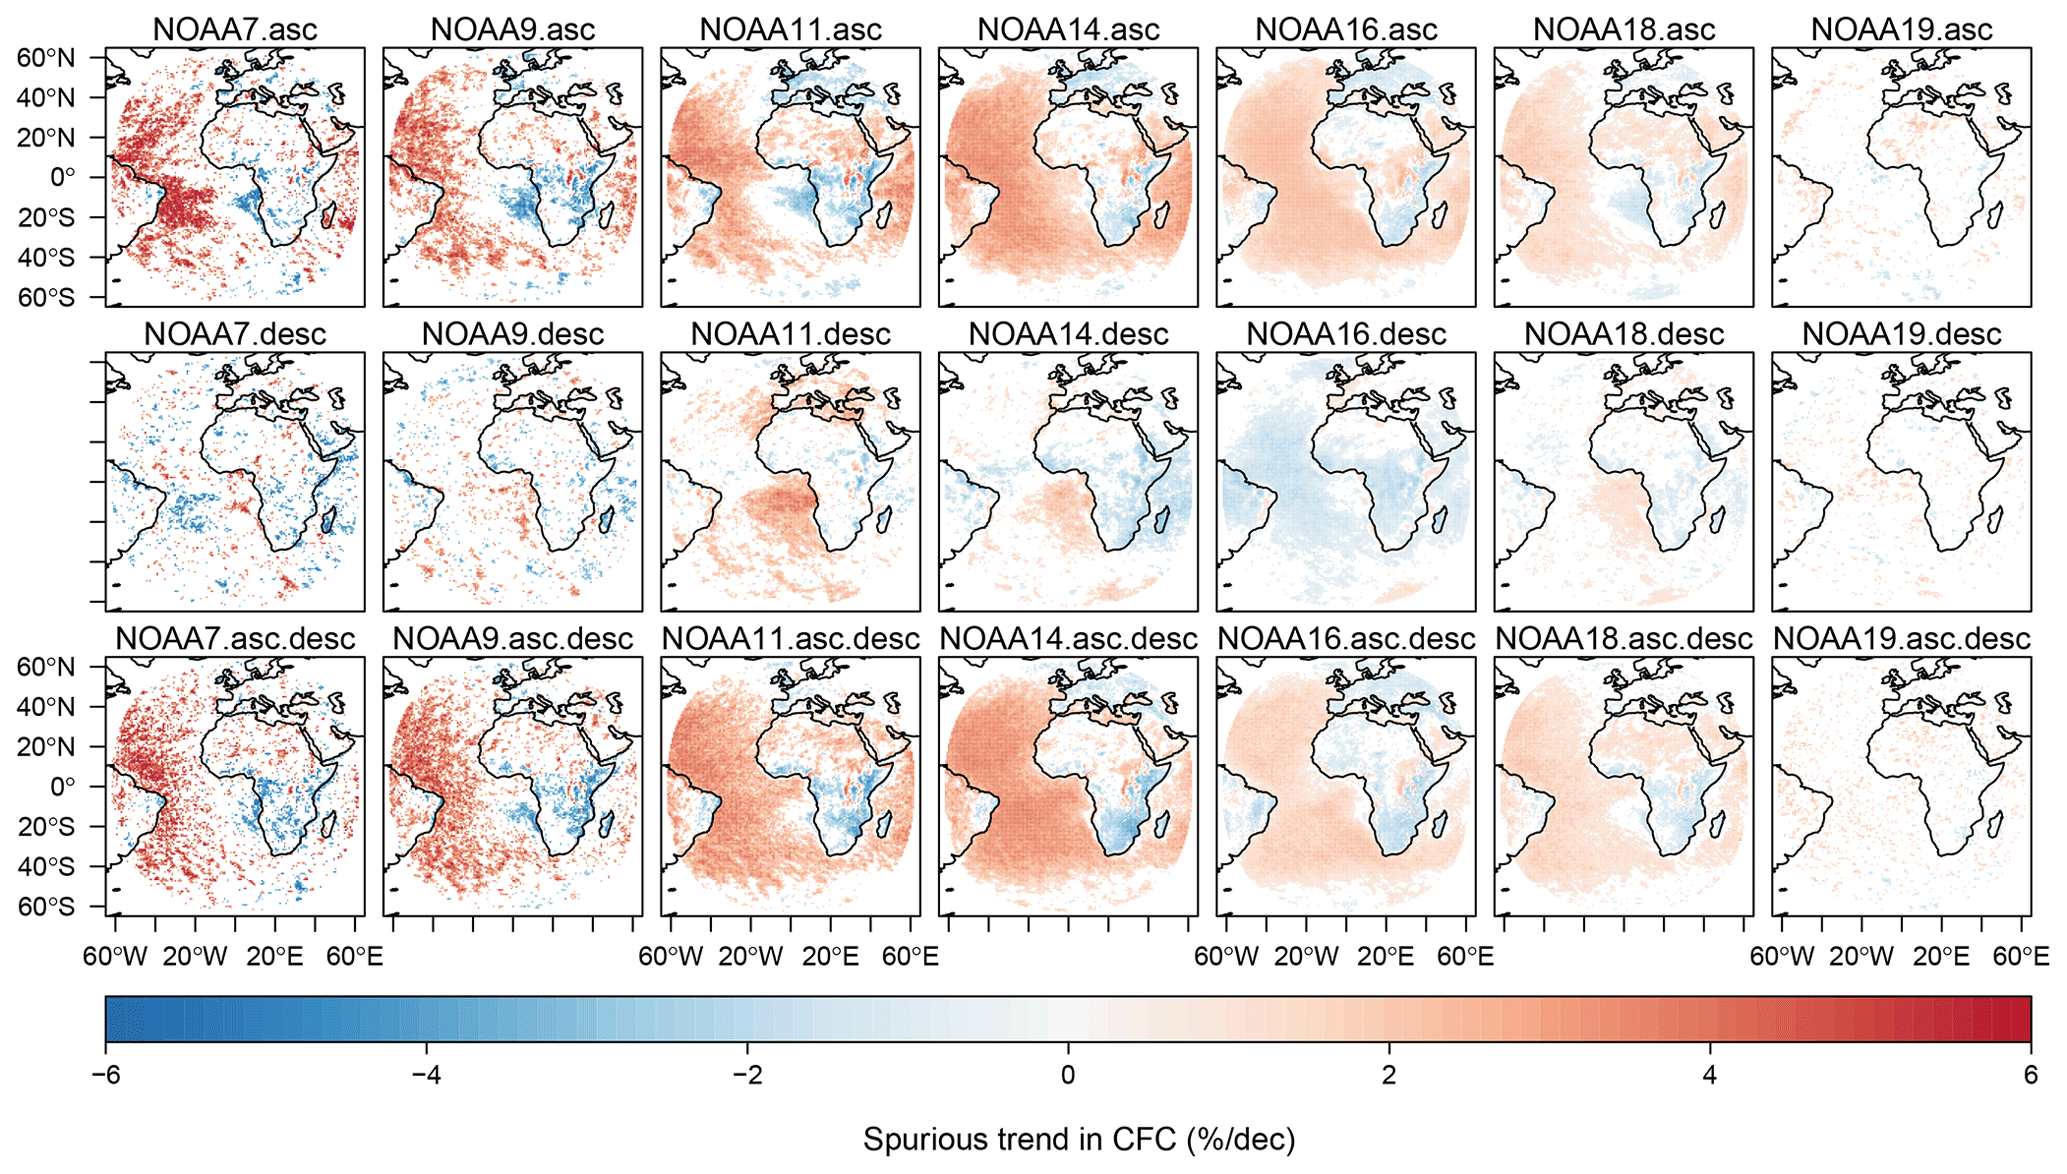
Figure 11Spurious trends in CFC caused by orbital drift presented for each afternoon (PM) NOAA satellite and each node (asc – ascending, desc – descending, and asc.desc – ascending and descending combined). Only statistically significant trends are shown.
For the morning satellites (Fig. 12) the separation of spurious trends between land and ocean is less evident, and absolute values are lower as compared to the afternoon platforms. The positive trends of the descending node dominate the trend observed for the combined nodes. The NOAA-15 satellite due to its long operational period (almost 20 years) reached the maximal drift, after which it started to return to the initial equatorial local crossing time (Fig. 1). This in turn lowers the overall value of the spurious trend to ±1 %.
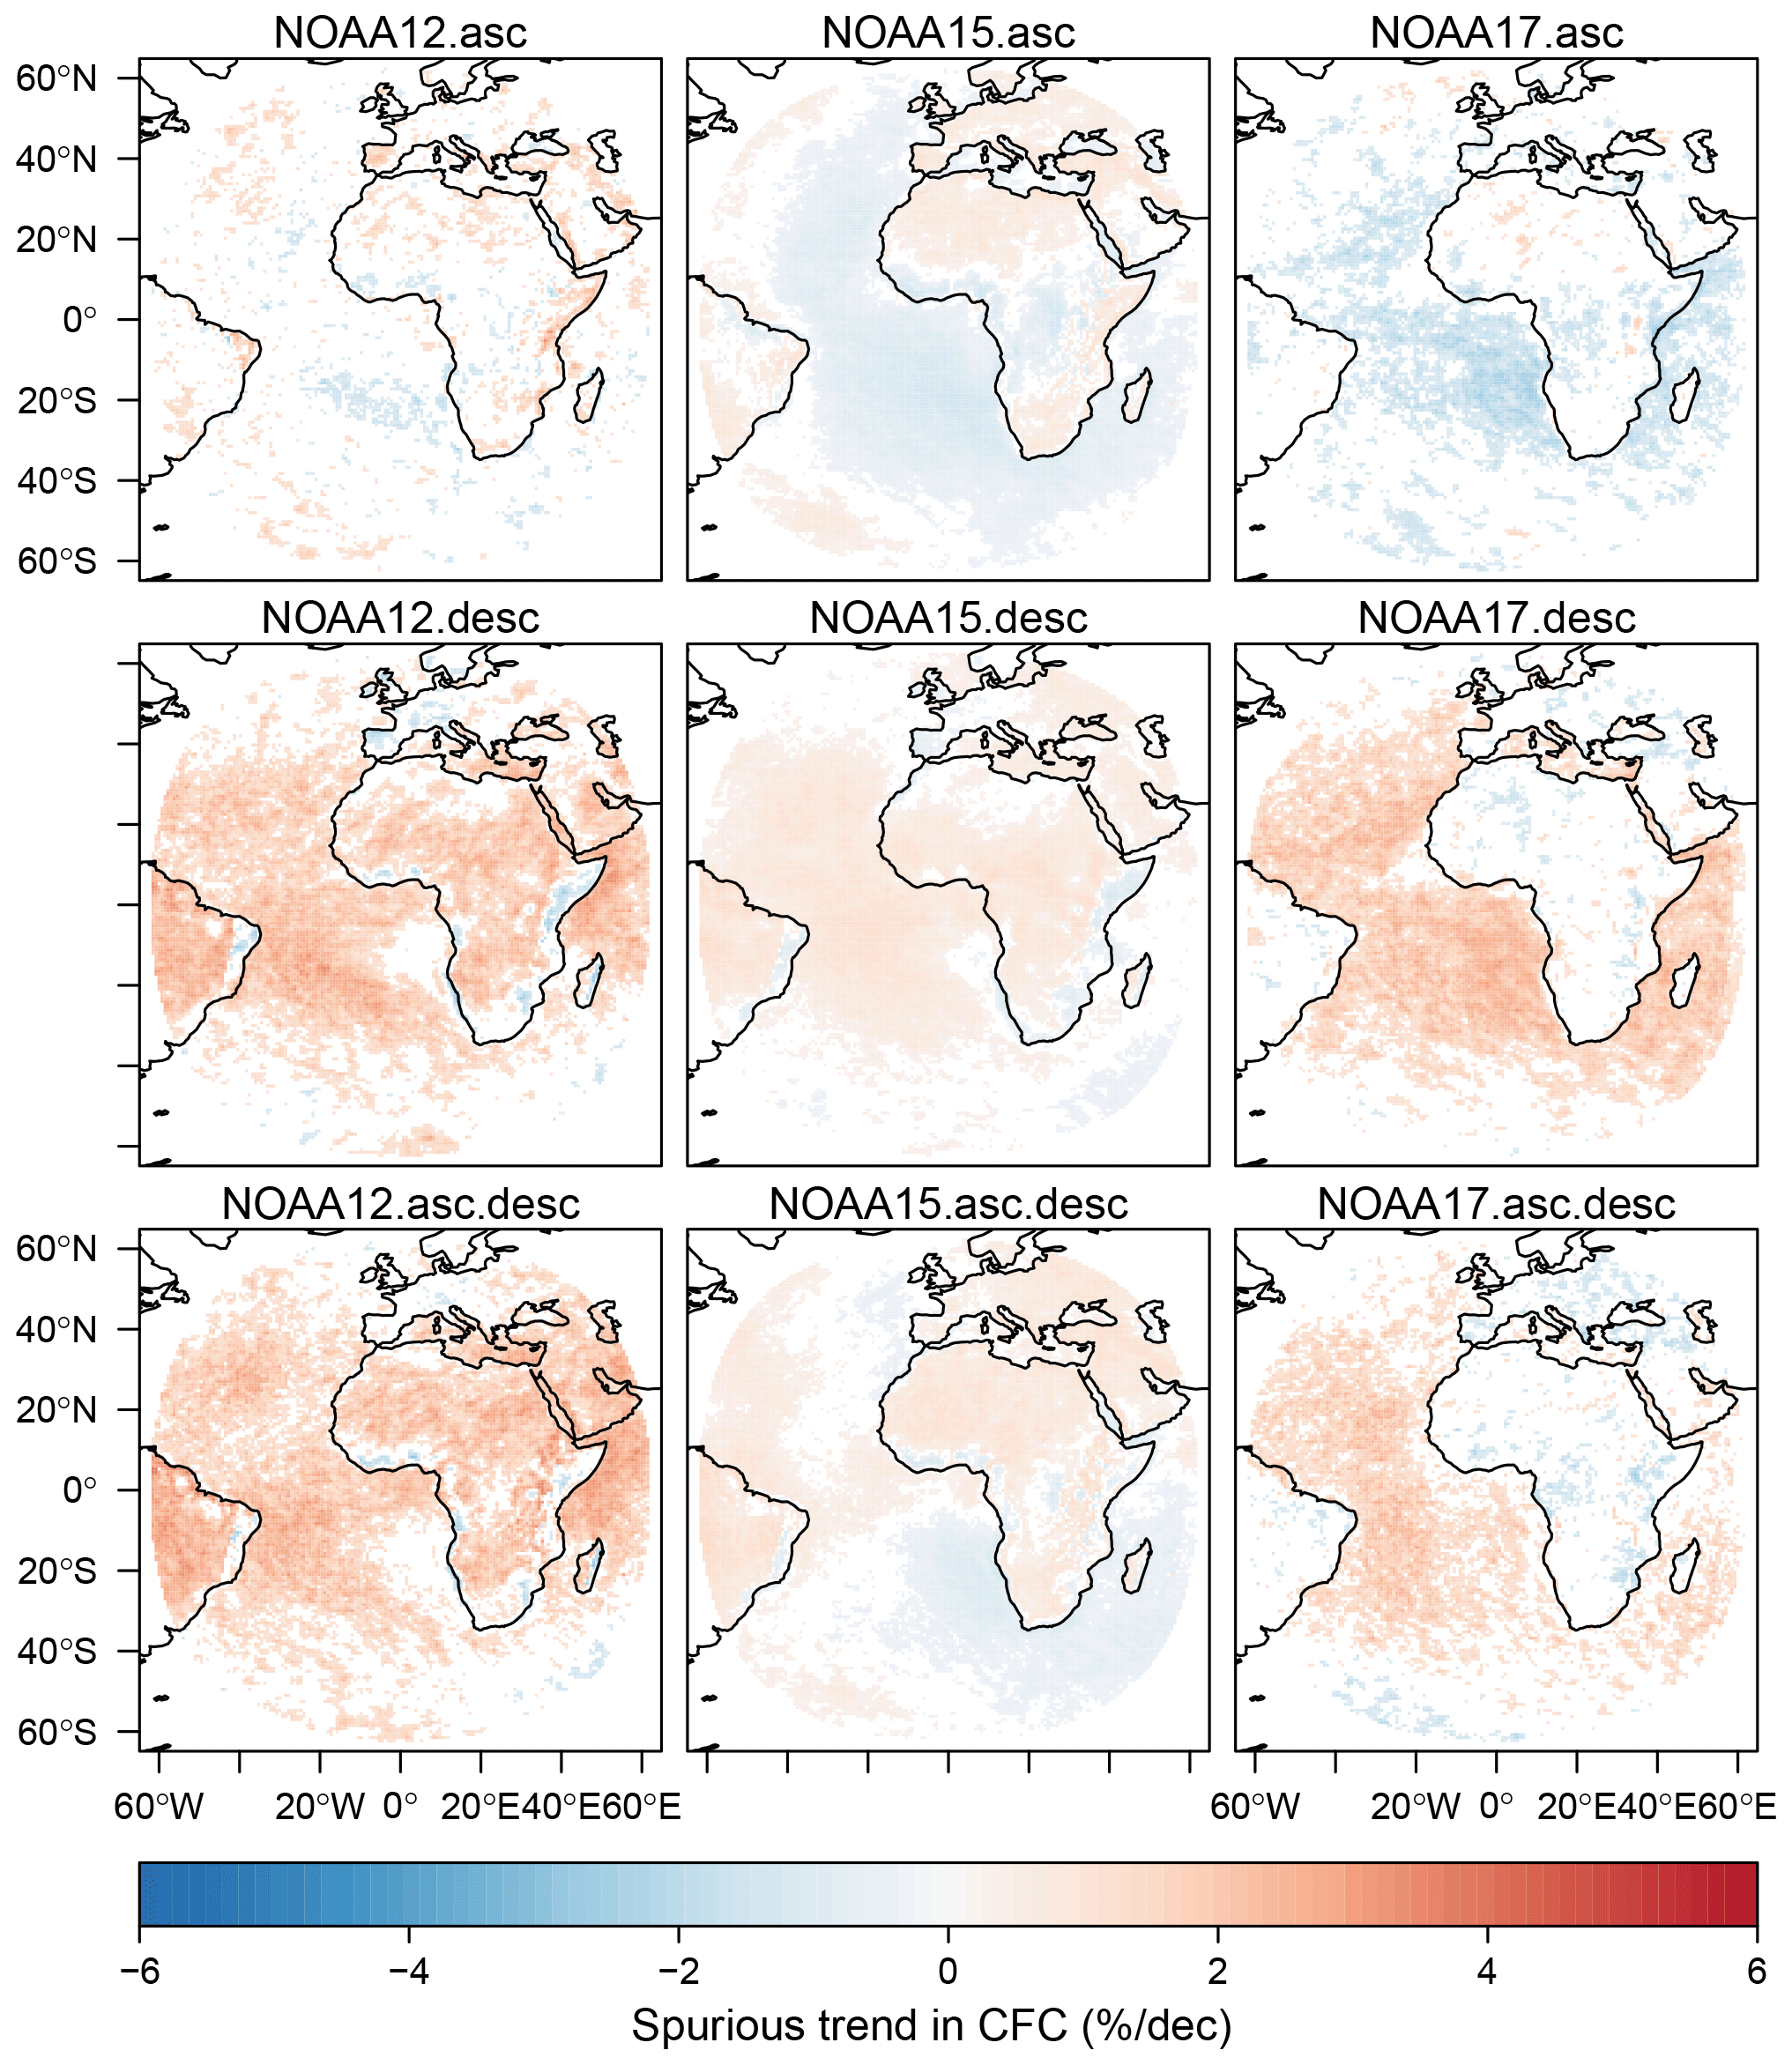
Figure 12Statistically significant spurious trends in CFC caused by orbital drift presented for each morning (AM) NOAA satellite and each node (asc – ascending, desc – descending, and asc.desc – ascending and descending combined). Trends for the MetOp platforms are not presented due to lack of orbital drift.
4.3 Impact of satellite orbital drift and variable temporal sampling on CFC CDRs derived from combined AVHRR and MetOp satellite imagery
Cloud cover climate data records derived from a combination of NOAA and MetOp satellites feature spurious trends of ±1 % CFC per decade, up to ±3 % MBE, and up to 4 % bcRMSE, just due to the undersampling of the CFC diurnal cycle and orbital drift. These errors are further combined with the cloud retrieval errors. For the CDRs derived from the morning NOAA satellites, the bias reveals a distinct spatial pattern with positive values over the ocean and negative values over land (Fig. 13). The opposite spatial pattern is apparent for the afternoon satellites. The CDR derived from the combined morning and afternoon satellites reveals lower MBE and bcRMSE values than the CDR derived from the morning and afternoon satellites separately.
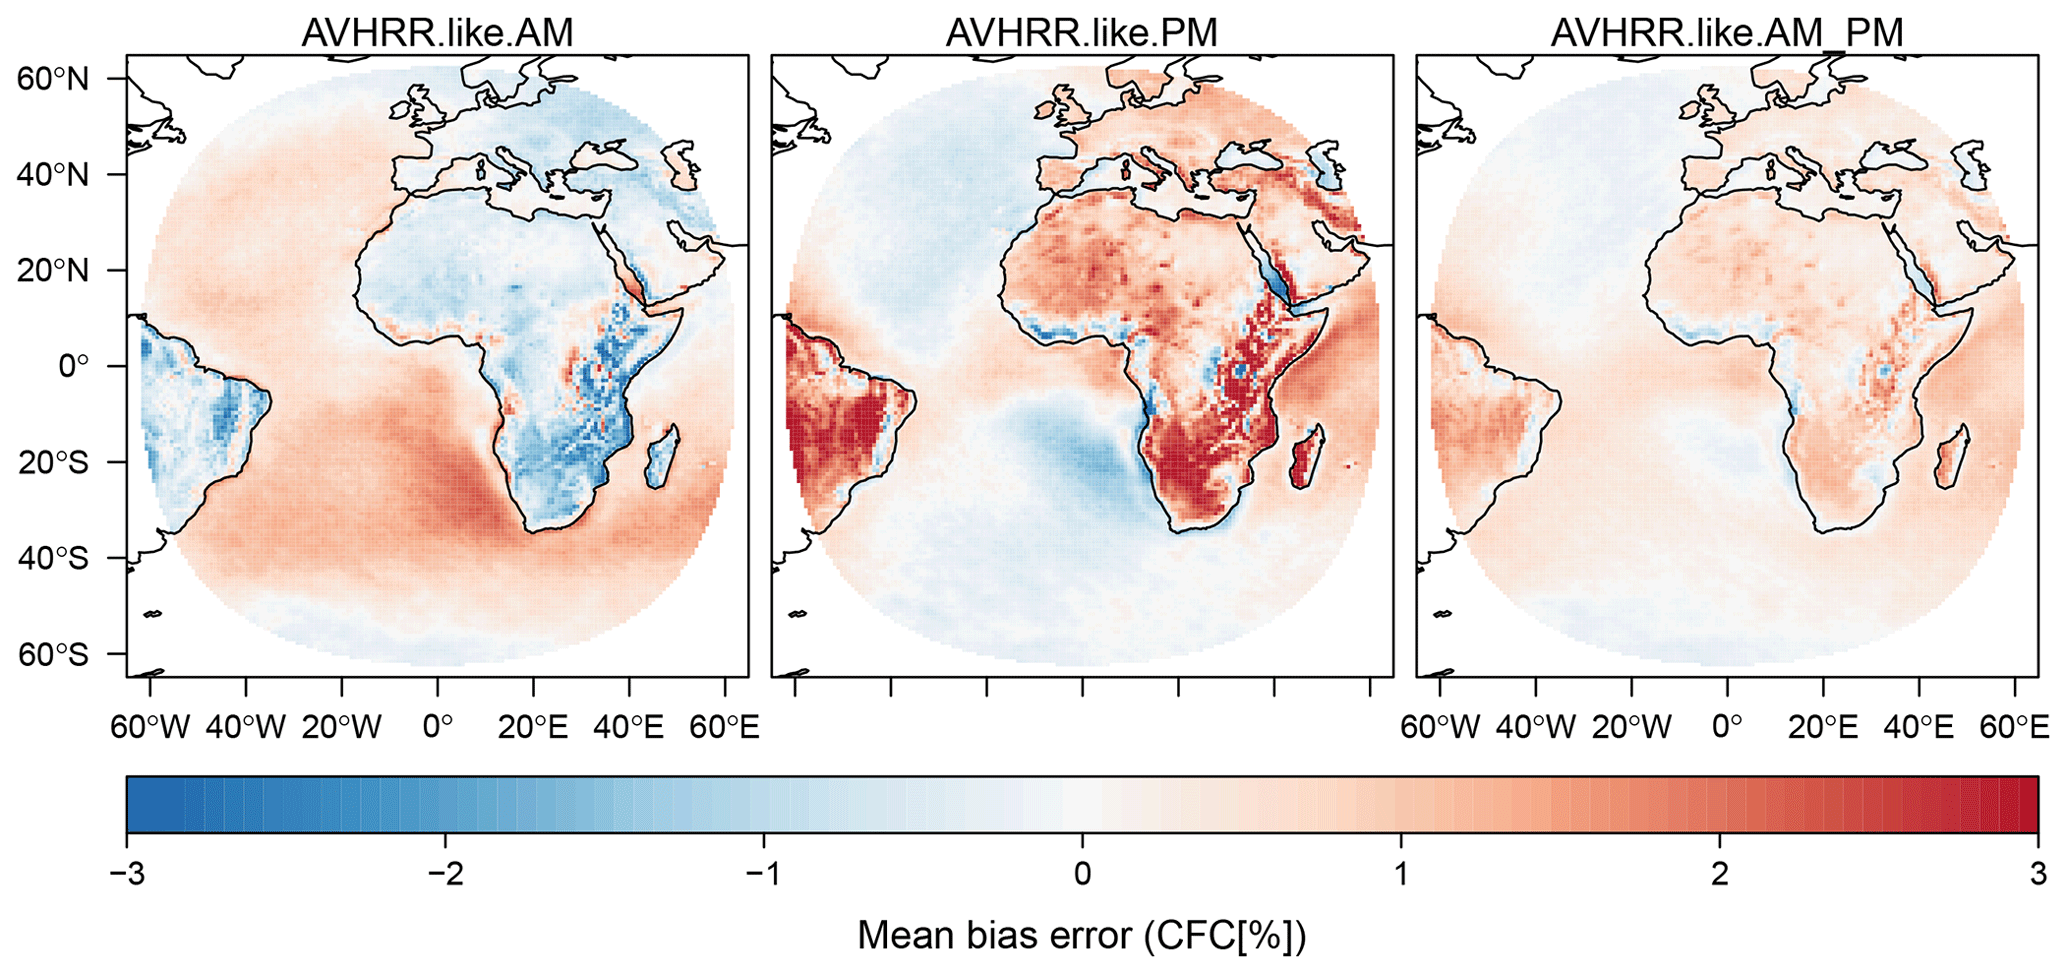
Figure 13The mean bias error caused by orbital drift and discrete sampling of CFC diurnal cycle presented for AVHRR-like CDRs derived from morning (AM), afternoon (PM), and combined (AM_PM) satellites.
The datasets show similar bcRMSE spatial patterns for the morning and afternoon satellites, however with larger errors in the latter (Fig. 14). The bcRMSE does not exceed 2 % in most areas apart from eastern and southern Africa. As for the MBE, the dataset from combined morning and afternoon satellites reveals the highest performance.
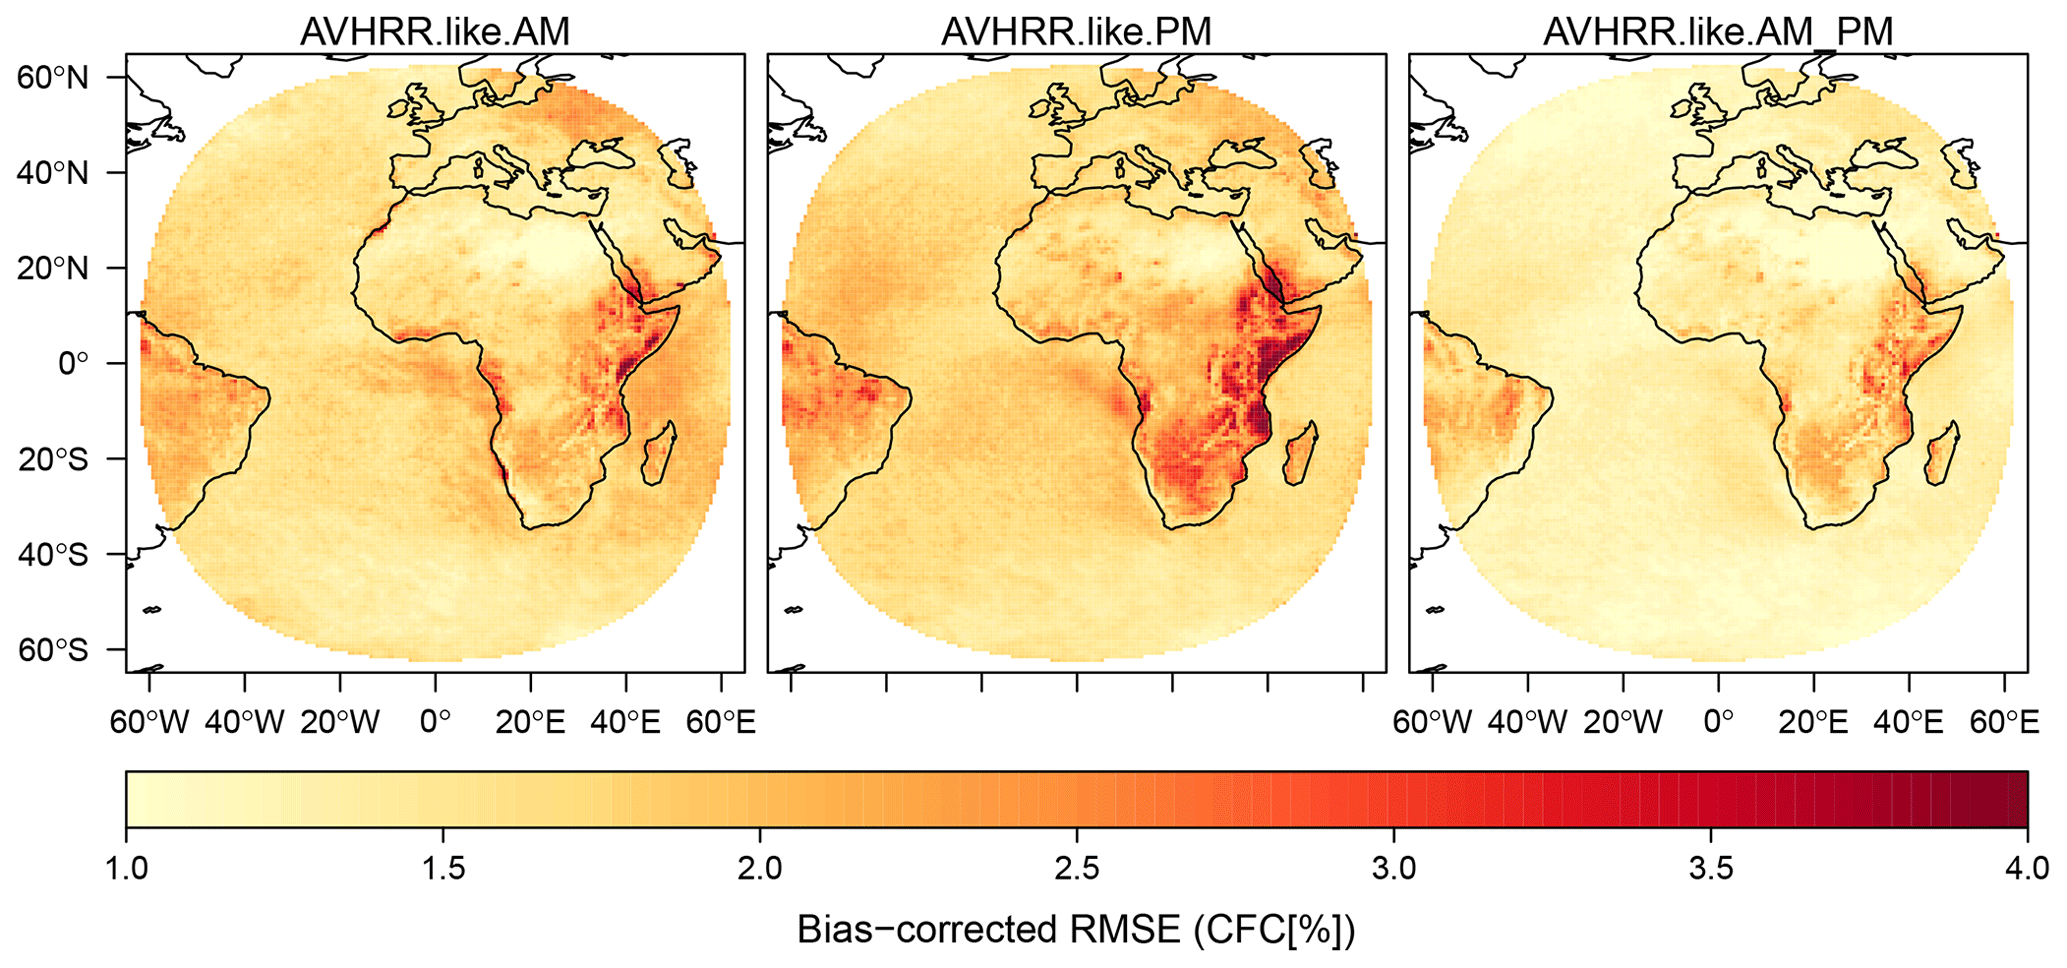
Figure 14Bias-corrected root mean square error caused by orbital drift and discrete sampling of the CFC diurnal cycle presented for AVHRR-like CDRs derived from morning (AM), afternoon (PM), and combined (AM_PM) satellites.
Significant spurious trends of up to 1 % per decade are observed for the AVHRR-like CDR derived from all morning satellites (Fig. 14) with positive values over Europe, the southern Middle East, and the northwestern Atlantic and negative values over the rest of Atlantic Ocean, western South America, and central Africa. This is caused not only by orbital drift but by a change in the observation time between NOAA-12, NOAA-15, NOAA-17, and the MetOp satellites. The AVHRR-like CFC CDR from the afternoon satellites, featuring longer time series than the morning satellites, shows notably lower statistically significant spurious trends below 0.4 % per decade. Thus, the CDR derived from combined morning and afternoon satellites is mostly affected by the spurious trends that originated from the morning satellites.
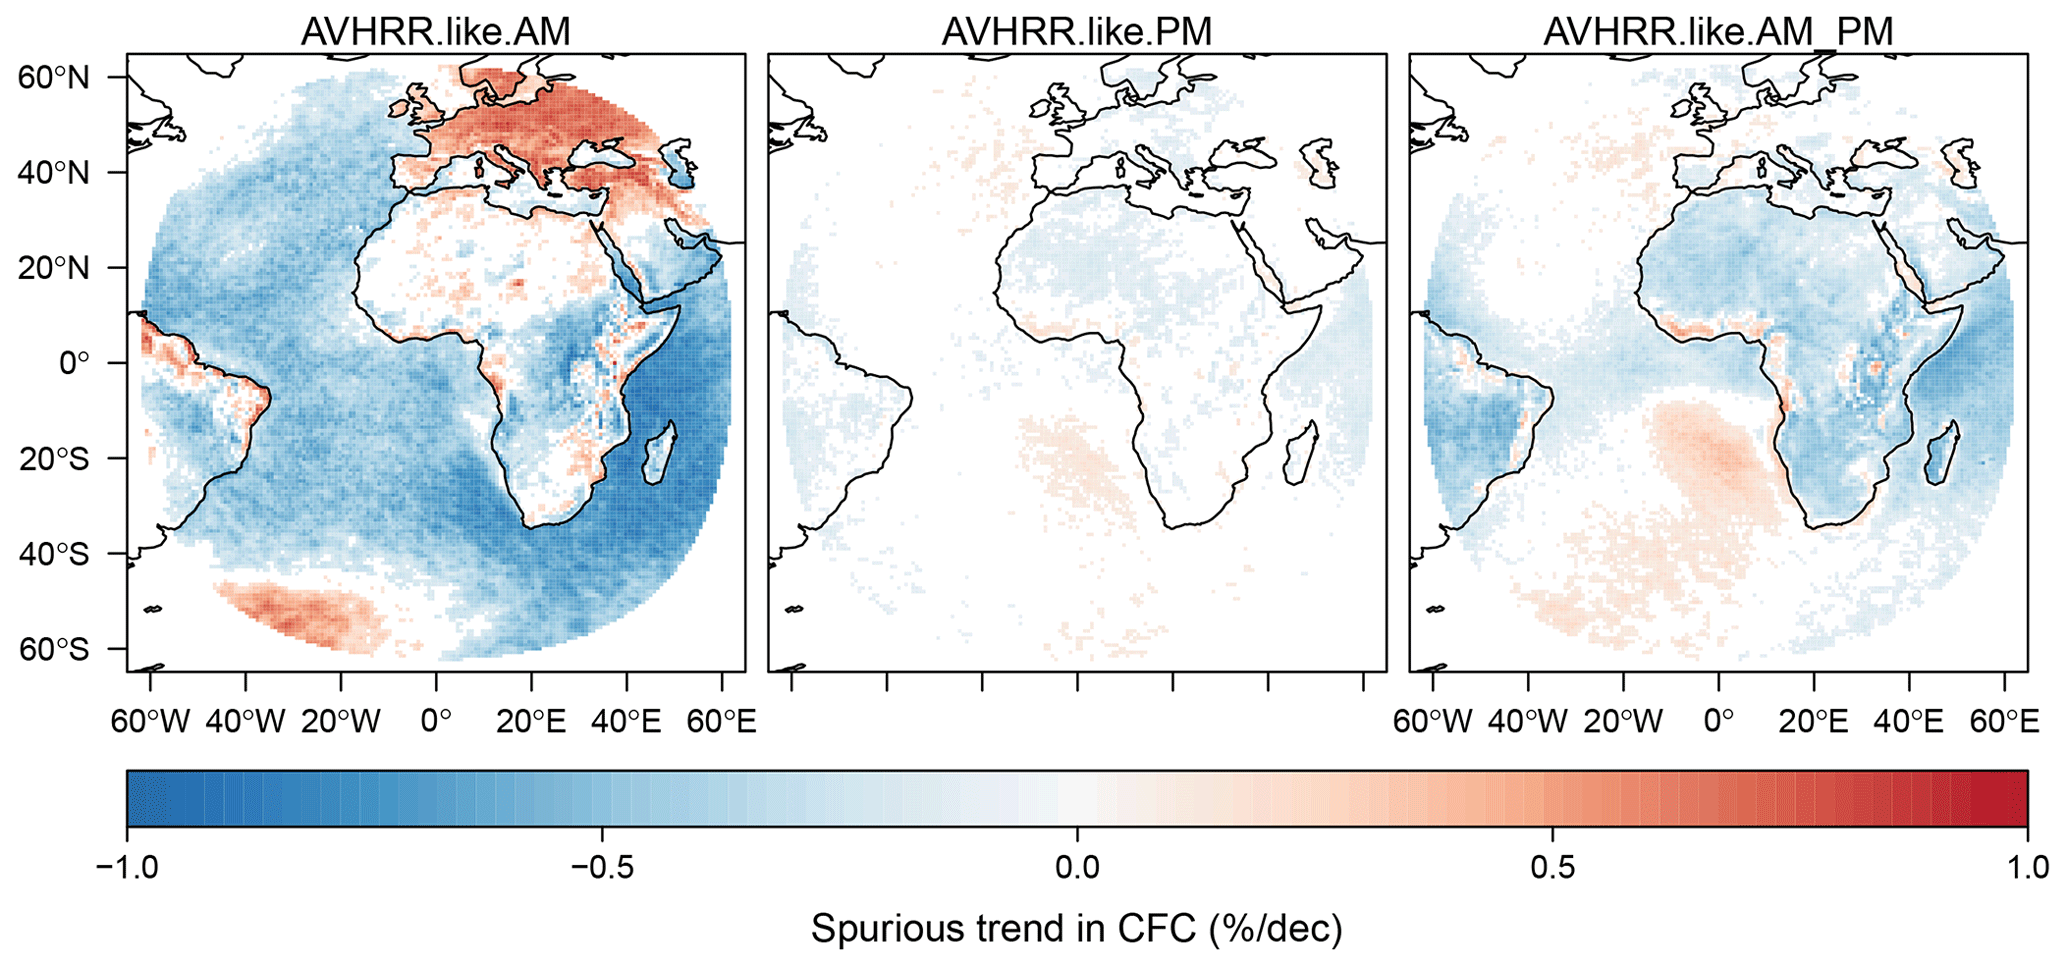
Figure 15Spurious trends caused by orbital drift and discrete sampling of the CFC diurnal cycle presented for AVHRR-like CDRs derived from morning (AM), afternoon (PM), and combined (AM_PM) satellites. Only statistically significant trends are shown.
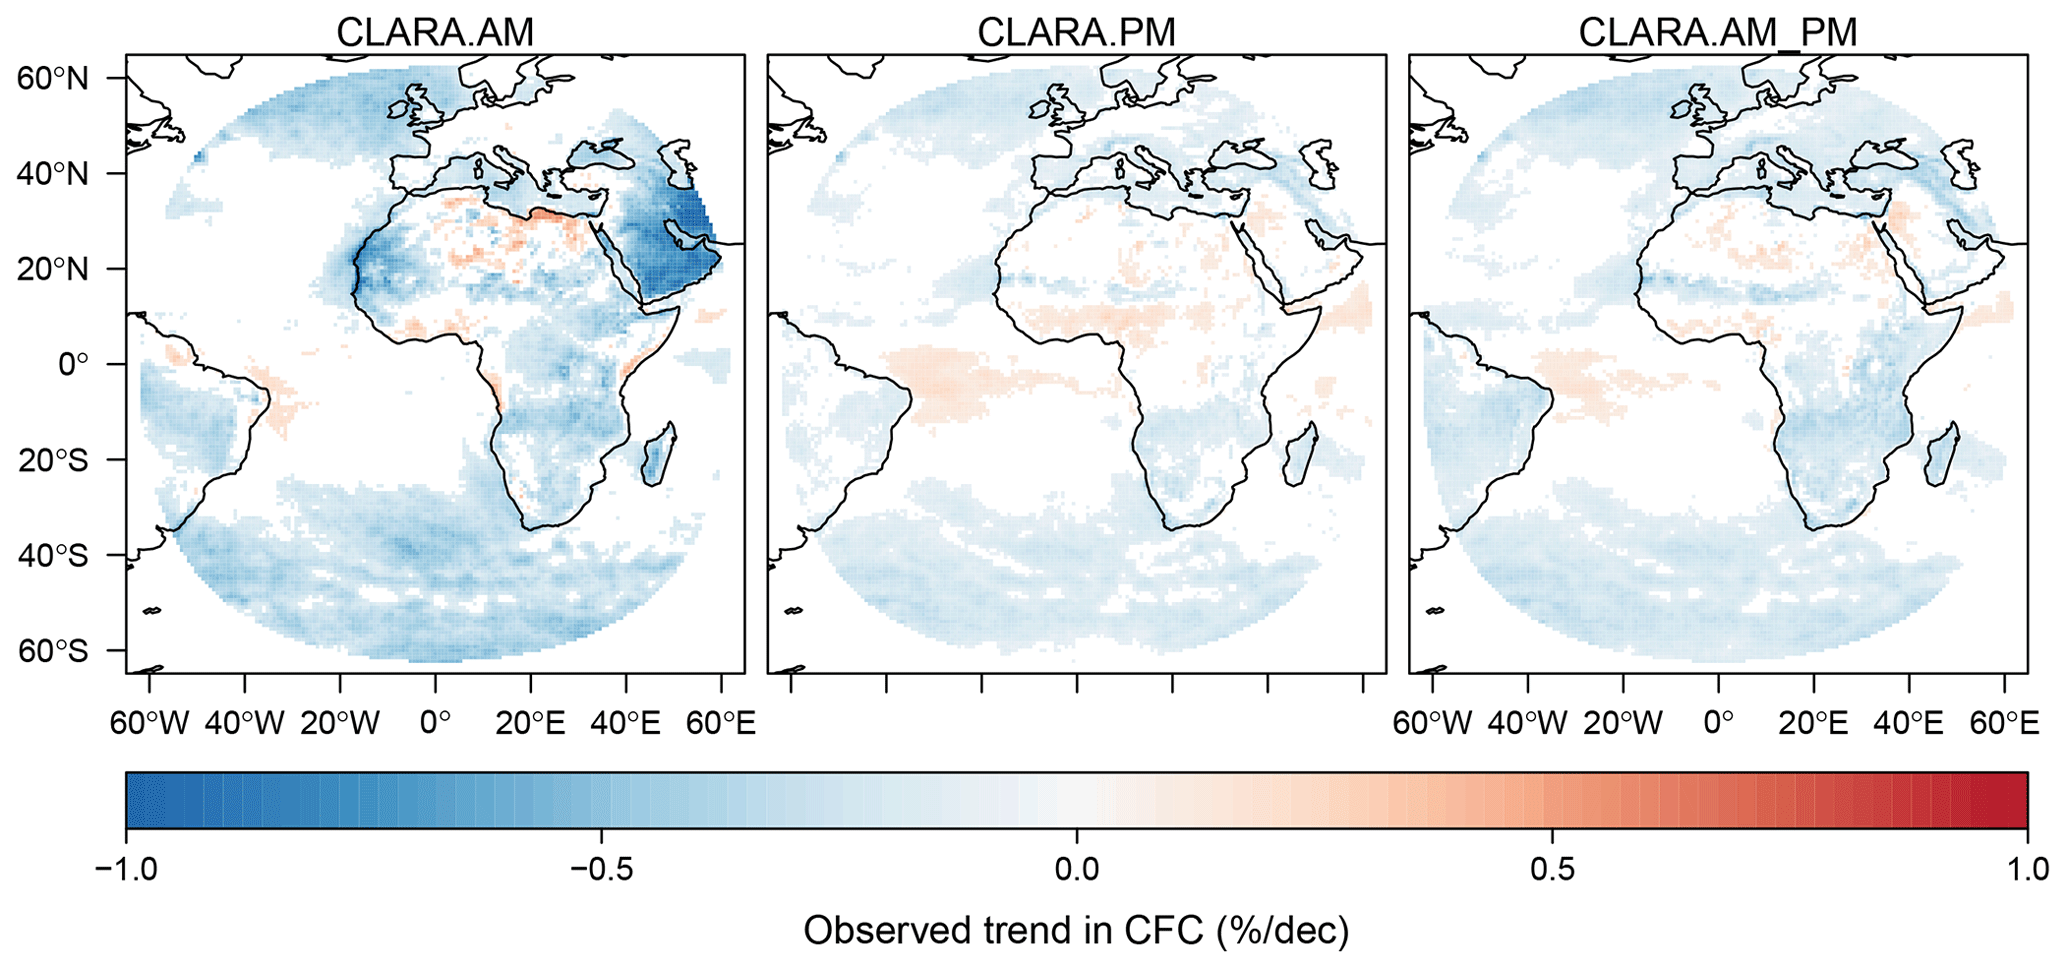
Figure 16Observed trends in the CLARA-A2 CFC CDR derived from morning (AM), afternoon (PM), and combined (AM_PM) satellites. Only statistically significant trends are shown.
Figure 17 depicts the time series of MBE and bcRMSE of AVHRR-like CFC (from all NOAA and MetOp platforms) averaged over the entire Meteosat disc. The overall trend in MBE (i.e. a spurious trend in AVHRR-like CFC) is −0.34 % per decade. It is apparent that this trend is mostly caused by the large inhomogeneity in the MBE time series around 2002. The inhomogeneity renders the CFC derived from AVHRR (starting in 1982) questionable for climate analyses. Yet, as shown in Fig. 14, this is less relevant for some locations. Moreover, after 2002 at least three NOAA satellites have been simultaneously operating. Having two satellite acquisitions per day from each satellite (i.e. from ascending and descending orbits) provides at least six observations every day that allow for a more correct reconstruction of the cloudiness diurnal cycle.
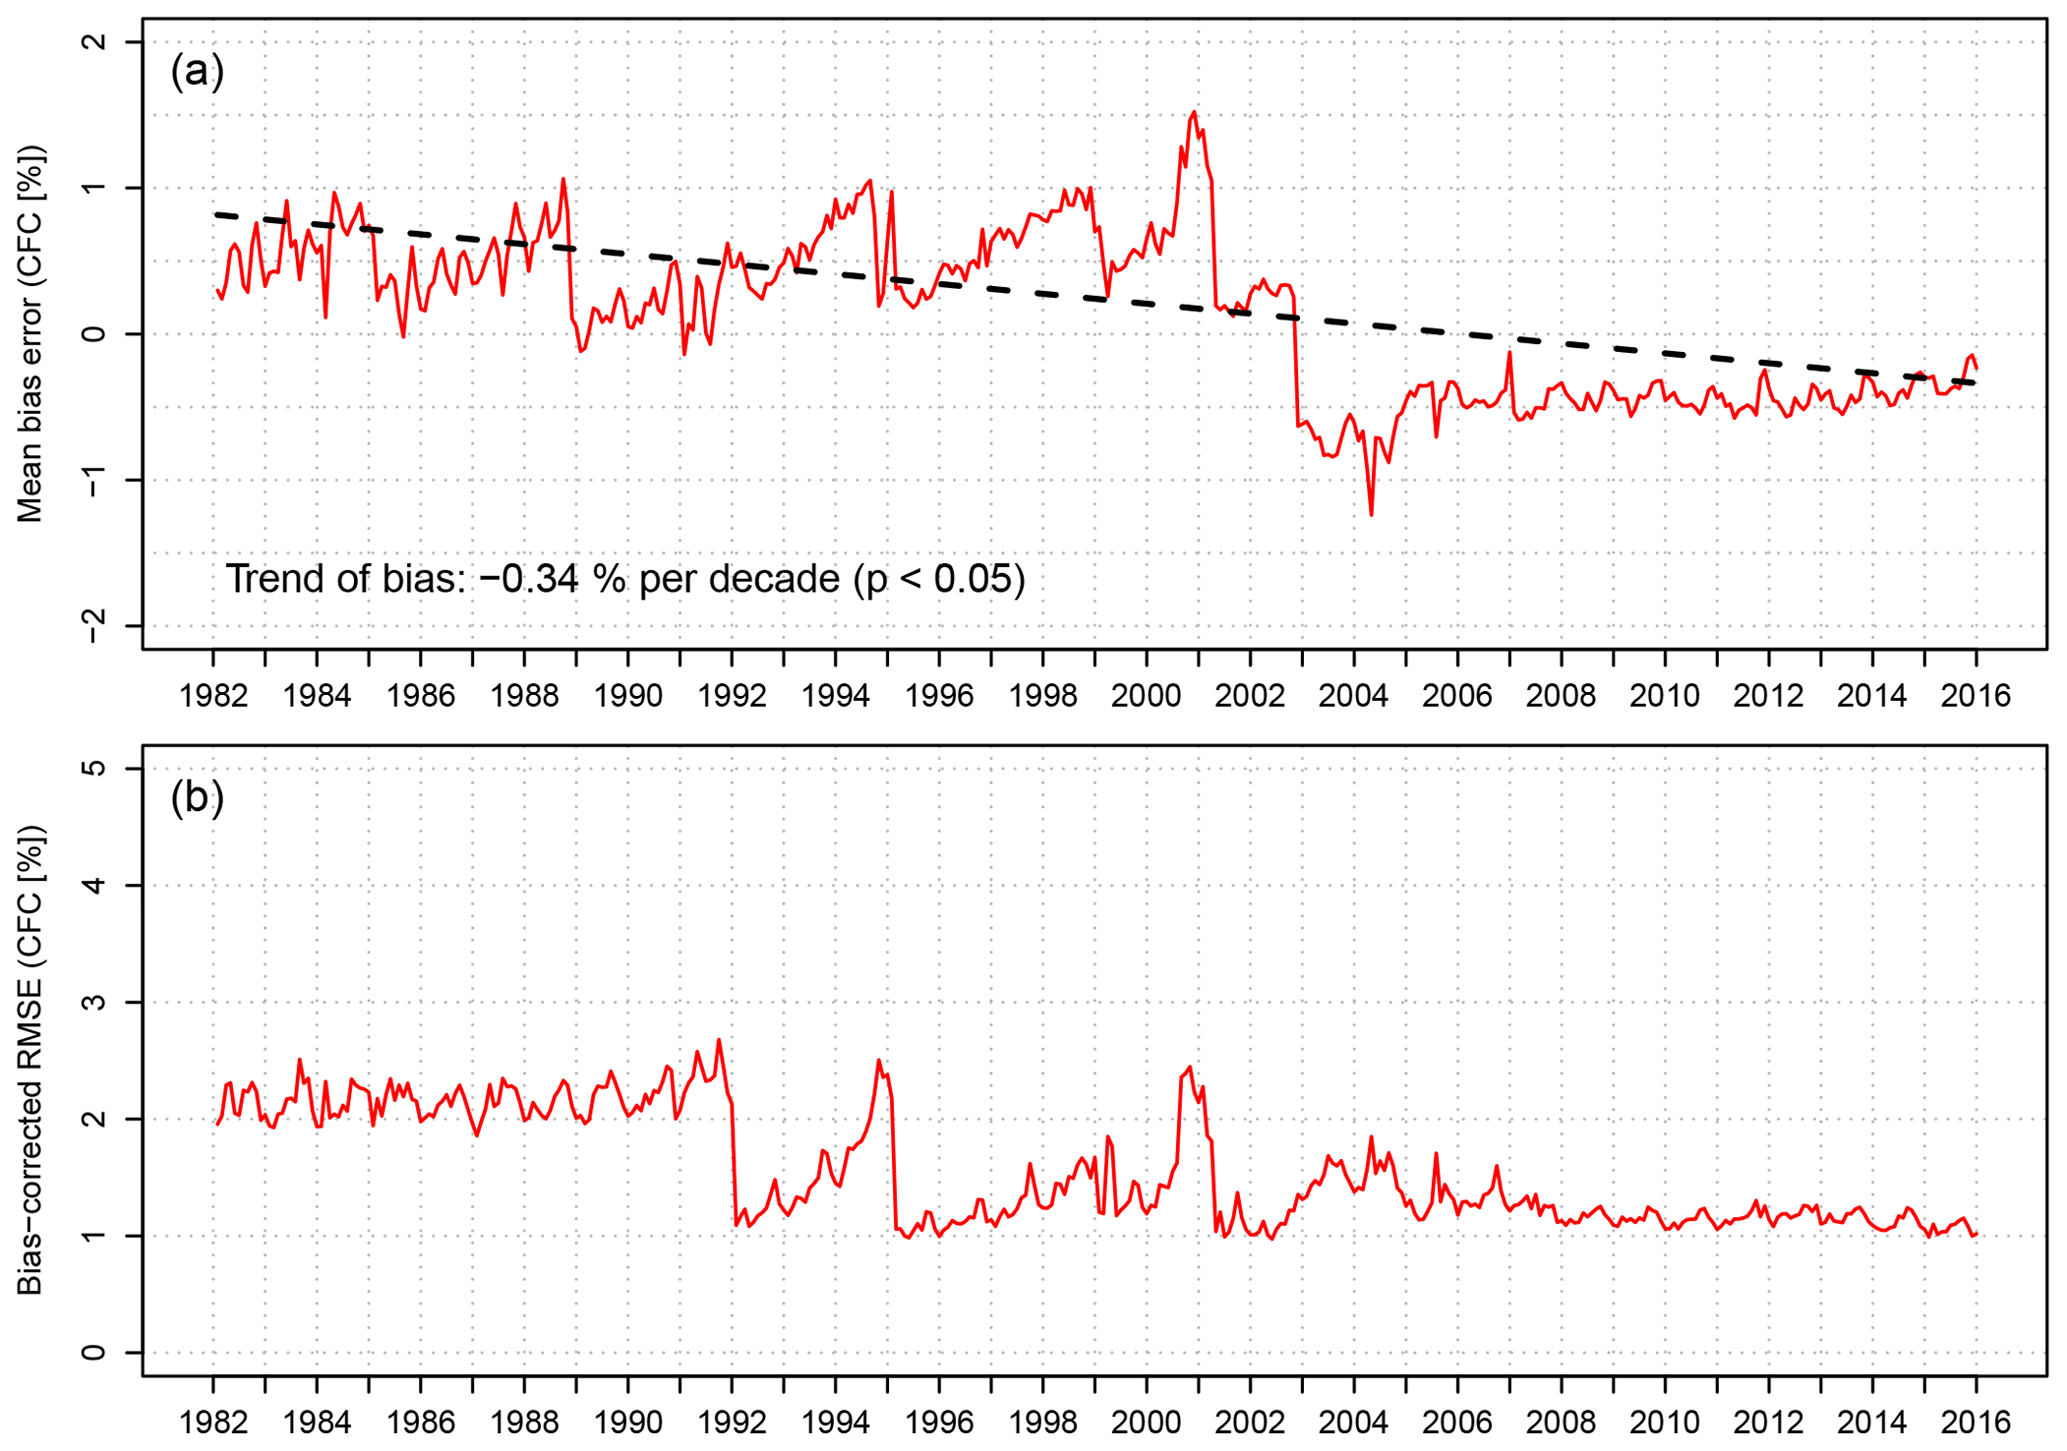
Figure 17Time series of MBE and bcRMSE caused by orbital drift and discrete sampling of the CFC diurnal cycle presented for AVHRR-like CDR derived from combined morning and afternoon satellites.
This study presents the quantitative assessment of errors and spurious temporal trends in AVHRR-based CDRs induced by undersampling of the CFC diurnal cycle and NOAA satellite orbital drift. For the individual satellites and specific locations, these CFC errors may reach up to ±10 % (MBE), 9 % (bcRMSE), and ±7 % per decade (spurious trends). The datasets derived from a single satellite are not commonly used in the climate analyses, and usually they feature larger errors than the CDRs derived by combining several platforms. In this respect, the absolute CFC errors for the multi-AVHRR CDR can reach up to ±3 % (MBE), 4 % (bcRMSE), and ±1 % per decade (spurious trends). The distinction between satellite platforms discussed in this study allows for assessment of the CFC errors for a limited period within the AVHRR CDR. This in turn provides valuable information while selecting NOAA and MetOp satellites and time ranges to be included in a CDR. Furthermore, the distinction between the satellite nodes (ascending and descending) allows for separate performance assessments for nighttime and daytime conditions.
The CFC errors discussed here originate solely from the undersampling of cloud cover diurnal cycle combined with the satellite orbital-drift effect and as such are not related to the accuracy of the cloud discrimination (masking) on the AVHRR imagery. To assess the accuracy of a cloud mask, the instantaneous satellite observations originating from the Level-2 product are closely collocated with a reference observation to avoid bias caused by the time shift (Bojanowski et al., 2014). Nevertheless, while aggregating the instantaneous measurements to daily or monthly means, the problem of the undersampling of a distinct CFC diurnal cycle arises. The number of available observations varies with the number of simultaneously operating satellites. Depending on the location- and time-specific diurnal cycle regime, the number of observations may or may not be sufficient to represent the CFC daily mean value correctly. This representativeness issue depends on the amplitude of the CFC diurnal cycle. For a small amplitude even a single observation, regardless of the acquisition time, may be enough to represent the mean CFC value. In the case of a large diurnal CFC amplitude, several observations are required to compute the true CFC mean. However, by chance even a single observation that corresponds to the mean estimate might be sufficient in such a case. Ultimately, it has to be emphasized that regardless of the accuracy of the cloud masking algorithm, the undersampling of the CFC diurnal cycle leads to errors and spurious trends in the aggregated CFC that have been quantified in this study.
The estimated spurious temporal trends in the AVHRR CFC CDR over the Meteosat disc (−0.34 % per decade) comply with the GCOS (Global Climate Observing System) temporal stability requirement of a maximum of 1 % per decade. Yet, there are regions where the spurious trends exceed 1 % per decade and consequently renders the AVHRR-based CFC CDRs not applicable to climate analyses. The GCOS stability requirement is fulfilled by the AVHRR CDR after 2002 due to the increased number of available observations per day acquired by several simultaneously operating satellites. However, in such a case other CDRs (e.g. Platnick et al., 2015; Stengel et al., 2017) derived from MODIS (operating since 2000) offer a better quality of the cloud discrimination (due to improved spectral resolution) and to date have not featured satellite orbital drift.
The correspondence of the spurious CFC temporal trends computed using artificial AVHRR-like CDR with the trends originating from the CLARA-A2 CDR is moderate. In Fig. 16 we show the observed trends in CFC calculated from the CLARA-A2 L2B for morning and afternoon satellites separately. If regionally similar trends are shown in the observed and spurious trends (Fig. 14), it can be expected that no trend is really occurring there. This is for example the case for the Arabian Peninsula, for which a negative CFC trend is observed for morning (AM) satellites, while spurious trends show the same sign and similar values. Likewise, observations of low-latitude regions on the western coast of Africa show a positive CFC trend, which is likely not real. On the other hand, in spite of the clear positive spurious trend estimated for Europe, the CLARA-A2 observations do not show any trend. Hence, we expect that a real negative trend in CFC for Europe is hidden by the effect of the undersampling of the CFC diurnal cycle and satellite orbital drift. This trend would be in line with other findings, for instance of Bojanowski and Musiał (2018) and Pfeifroth et al. (2018). For the afternoon (PM) NOAA satellites, we can expect that observed positive trend in the central Atlantic Ocean is lower than in reality due to the negative spurious trend. Further, the observed positive trend in tropical Africa may not be real. Although we present the estimated spurious trends as a component of the observed trends in CDR, we do not recommend a numerical subtraction of spurious from observed trends as a method for the AVHRR-based cloud CDR correction. We refer to the evidence of COMET's good performance and stability, but in our analysis we neglected potential climatological changes in the CFC diurnal cycles, and we used averaged monthly mean diurnal cycles. Notwithstanding, we expect that the results presented will allow for a realistic interpretation of the cloud CDRs derived from the AVHRR sensors.
The cloud fractional cover climate data records (CFC CDRs) generated from the measurements of the AVHRR sensor mounted aboard a series of the NOAA and MetOp polar-orbiting satellites are subject to errors originating from the undersampling of the cloudiness diurnal cycle as well from satellite orbital drift. These errors may lead to spurious temporal trends revealed during climatological analyses. This study provides a unique quantitative assessment of the errors and spurious trends in the AVHRR-based CFC CDRs. For individual NOAA satellites the errors reach up to 10 % of MBE and 7 % per decade of spurious trends. For the entire data record encompassing all NOAA and MetOp satellites the values are 3 % and 1 %, respectively. The spurious temporal trend of the AVHRR-like CFC CDR averaged over the Meteosat disc (−0.34 % per decade) complies with the GCOS temporal stability requirement of a maximum of 1 % per decade. Yet, there are regions where the spurious trends exceed 1 % per decade and consequently renders the AVHRR-based CFC CDRs not applicable to climatic analyses. The GCOS stability requirement is fulfilled by the AVHRR CDRs after 2002, but it loses the minimum time span of 30 years to be applicable in the climatological analyses, and it can be replaced by the MODIS-based CFC CDRs that feature better spectral resolution and to date have not experienced satellite drift.
The estimated spurious trends were confronted with the CFC trends revealed by the AVHRR-based CLARA-A2 CDR. According to our study, the trends revealed by the CLARA-A2 (and other AVHRR-based CDRs) may be incorrect for several regions. The analysis covered the Meteosat disc due to the spatial extent of the CM SAF COMET dataset used as the reference. The global-scale analysis would be beneficial, but it would require the application of a climate reanalysis (e.g. ERA-5) which has not been yet proven to resolve the cloud diurnal cycle accurately.
The study was motivated by a need for an improved description of errors incorporated in the CFC CDRs caused by temporal sampling and orbital drift of NOAA and MetOp platforms, which provide one of the longest satellite climatological datasets. We expect that the error estimates will allow for a correct interpretation of AVHRR-based CDRs, reveal a potential improvement of the orbital-drift-corrected dataset, and ultimately contribute to the development of a yet-missing methodology for satellite orbital-drift correction that would be commonly applied to the AVHRR-based CDRs. Not only do these include cloud fractional cover but also other essential climate variables related to cloud physical properties, atmospheric composition, aerosol concentration, and surface radiation balance.
Given that Ek is the modelled AVHRR CFC and Mk is the CFC from the reference COMET dataset, for time step k and length of the time series n, the performance statistics are defined as the following.
- Mean bias error:
-
- Bias-corrected root mean square error:
-
The data used in this study are the CM SAF's Cloud, Albedo and Radiation dataset (CLARA-A2; https://doi.org/10.5676/EUM_SAF_CM/CLARA_AVHRR/V002, Karlsson et al., 2017b) and the CM SAF's Cloud Fractional Cover dataset from Meteosat First and Second Generation (COMET; https://doi.org/10.5676/EUM_SAF_CM/CFC_METEOSAT/V001 Stöckli et al., 2017b; https://doi.org/10.3390/rs11091052, Stöckli et al., 2019).
JB conceptualized and administered the project, validated and visualized the data, and wrote the original draft of the paper. JB and JM created the project methodology, used the software, and reviewed and edited the paper.
The author declares that there is no conflict of interest.
The authors would like to thank the EUMETSAT Satellite Application Facility on Climate Monitoring (https://www.cmsaf.eu/, last access: 26 September 2018) for providing COMET and CLARA-A2 climate data records.
This research was funded by the National Science Centre Poland through a POLONEZ grant (no. 2015/19/P/ST10/03990320), which received funding from the European Union's Horizon 2020 research and innovation programme through a Marie Skłodowska-Curie grant (agreement no. 66577).
This paper was edited by Andrew Sayer and reviewed by two anonymous referees.
Benjamini, Y. and Hochberg, Y.: Controlling the false discovery rate: a practical and powerful approach to multiple testing, J. Roy. Stat. Soc. B Met., 57, 289–300, available at: http://www.jstor.org/stable/2346101 (last access: 16 February 2014), 1995. a
Bergman, J. W. and Salby, M. L.: Diurnal Variations of Cloud Cover and Their Relationship to Climatological Conditions, J. Climate, 9, 2802–2820, https://doi.org/10.1175/1520-0442(1996)009<2802:DVOCCA>2.0.CO;2, 1996. a
Bojanowski, J. S. and Musiał, J. P.: Meteosat observations of diurnal variation of cloud fractional cover, in: Proceedings to the EUMETSAT Meteorological Satellite Conference, 17–21 September 2018, Tallin, Estonia, 2018. a, b, c, d
Bojanowski, J. S., Stöckli, R., Tetzlaff, A., and Kunz, H.: The Impact of Time Difference between Satellite Overpass and Ground Observation on Cloud Cover Performance Statistics, Remote Sens., 6, 12866–12884, https://doi.org/10.3390/rs61212866, 2014. a
Bojanowski, J. S., Stöckli, R., Duguay-Tetzlaff, A., Finkensieper, S., and Hollmann, R.: Performance Assessment of the COMET Cloud Fractional Cover Climatology across Meteosat Generations, Remote Sensing, 10, 804, https://doi.org/10.3390/rs10050804, 2018. a, b
Ceppi, P., Brient, F., Zelinka, M. D., and Hartmann, D. L.: Cloud feedback mechanisms and their representation in global climate models, WIREs Climate Change, 8, e465, https://doi.org/10.1002/wcc.465, 2017. a
Chambers, J. M. and Hastie, T. J.: Statistical Models in S, Wadsworth & Brooks/Cole, Michigan University, 1992. a
Devasthale, A., Karlsson, K.-G., Quaas, J., and Grassl, H.: Correcting orbital drift signal in the time series of AVHRR derived convective cloud fraction using rotated empirical orthogonal function, Atmos. Meas. Tech., 5, 267–273, https://doi.org/10.5194/amt-5-267-2012, 2012. a, b
Dybbroe, A., Karlsson, K. G., and Thoss, A.: NWCSAF AVHRR cloud detection and analysis using dynamic thresholds and radiative transfer modeling. Part I: Algorithm description, J. Appl. Meteorol., 44, 39–54, 2005. a
Eastman, R. and Warren, S. G.: Arctic Cloud Changes from Surface and Satellite Observations, J. Climate, 23, 4233–4242, https://doi.org/10.1175/2010JCLI3544.1, 2010. a
Fontana, F., Lugrin, D., Seiz, G., Meier, M., and Foppa, N.: Intercomparison of satellite- and ground-based cloud fraction over Switzerland (2000–2012), Atmos. Res., 128, 1–12, https://doi.org/10.1016/j.atmosres.2013.01.013, 2013. a
Foster, M. J. and Heidinger, A.: PATMOS-x: Results from a Diurnally Corrected 30-yr Satellite Cloud Climatology, J. Climate, 26, 414–425, https://doi.org/10.1175/JCLI-D-11-00666.1, 2013. a, b, c
Fowler, L. D., Wielicki, B. A., Randall, D. A., Branson, M. D., Gibson, G. G., and Denn, F. M.: Use of a GCM to explore sampling issues in connection with satellite remote sensing of the Earth radiation budget, J. Geophys. Res., 105, 20757–20772, https://doi.org/10.1029/2000JD900239, 2000. a
Free, M., Sun, B., and Yoo, H. L. A.: Comparison between Total Cloud Cover in Four Reanalysis Products and Cloud Measured by Visual Observations at U.S. Weather Stations, J. Climate, 29, 2015–2021, https://doi.org/10.1175/JCLI-D-15-0637.1, 2016. a
Heidinger, A. K., Foster, M. J., Walther, A., and Zhao, X.: The pathfinder atmospheres-extended AVHRR climate dataset, B. Am. Meteorol Society, 95, 909–922, https://doi.org/10.1175/BAMS-D-12-00246.1, 2014. a, b
Ignatov, A., Laszlo, I., Harrod, E. D., Kidwell, K. B., and Goodrum, G. P.: Equator crossing times for NOAA, ERS and EOS sun-synchronous satellites, Int. J. Remote Sens., 25, 5255–5266, https://doi.org/10.1080/01431160410001712981, 2004. a
Jones, P. W.: First- and Second-Order Conservative Remapping Schemes for Grids in Spherical Coordinates, Mon. Weather Rev., 127, 2204–2210, 1999. a
Karlsson, K.-G. and Håkansson, N.: Characterization of AVHRR global cloud detection sensitivity based on CALIPSO-CALIOP cloud optical thickness information: demonstration of results based on the CM SAF CLARA-A2 climate data record, Atmos. Meas. Tech., 11, 633–649, https://doi.org/10.5194/amt-11-633-2018, 2018. a
Karlsson, K.-G. and Johansson, E.: On the optimal method for evaluating cloud products from passive satellite imagery using CALIPSO-CALIOP data: example investigating the CM SAF CLARA-A1 dataset, Atmos. Meas. Tech., 6, 1271–1286, https://doi.org/10.5194/amt-6-1271-2013, 2013. a, b
Karlsson, K.-G., Anttila, K., Trentmann, J., Stengel, M., Fokke Meirink, J., Devasthale, A., Hanschmann, T., Kothe, S., Jääskeläinen, E., Sedlar, J., Benas, N., van Zadelhoff, G.-J., Schlundt, C., Stein, D., Finkensieper, S., Håkansson, N., and Hollmann, R.: CLARA-A2: the second edition of the CM SAF cloud and radiation data record from 34 years of global AVHRR data, Atmos. Chem. Phys., 17, 5809–5828, https://doi.org/10.5194/acp-17-5809-2017, 2017a. a, b, c
Karlsson, K.-G., Anttila, K., Trentmann, J., Stengel, M., Meirink, F. J., Devasthale, A., Hanschmann, T., Kothe, S., Jääskeläinen, E., Sedlar, J., Benas, N., van Zadelhoff, G.-J., Schlundt, C., Stein, D., Finkensieper, S., Håkansson, N., Hollmann, R., Fuchs, P., and Werscheck, M.: CLARA-A2: CM SAF cLoud, Albedo and surface RAdiation dataset from AVHRR data – Edition 2, Satellite Application Facility on Climate Monitoring, https://doi.org/10.5676/EUM_SAF_CM/CLARA_AVHRR/V002, 2017b. a
Kendall, M. G.: A new measure of rank correlation, Biometrika, 30, 81–93, https://doi.org/10.1093/biomet/30.1-2.81, 1938. a
Kirk-Davidoff, D. B., Goody, R. M., and Anderson, J. G.: Analysis of Sampling Errors for Climate Monitoring Satellites, J. Climate, 18, 810–822, https://doi.org/10.1175/JCLI-3301.1, 2005. a
Kotarba, A. Z.: A comparison of MODIS-derived cloud amount with visual surface observations, Atmos. Res., 92, 522–530, https://doi.org/10.1016/j.atmosres.2009.02.001, 2009. a
Leroy, S. S.: The Effects of Orbital Precession on Remote Climate Monitoring, J. Climate, 14, 4330–4337, https://doi.org/10.1175/1520-0442(2001)014<4330:TEOOPO>2.0.CO;2, 2001. a
Mann, H. B.: Nonparametric Tests Against Trend, Econometrica, 13, 245–259, 1945. a
Meerkötter, R., König, C., Bissolli, P., Gesell, G., and Mannstein, H.: A 14-year European Cloud Climatology from NOAA/AVHRR data in comparison to surface observations, Geophys. Res. Lett., 31, L15103, https://doi.org/10.1029/2004GL020098, 2004. a
Musiał, J. and Bojanowski, J.: AVHRR LAC satellite cloud climatology over Central Europe derived by the Vectorized Earth Observation Retrieval (VEOR) method and PyLAC software, Geoinformation Issues, 9, 39–52, 2017. a
Musial, J. P., Hüsler, F., Sütterlin, M., Neuhaus, C., and Wunderle, S.: Probabilistic approach to cloud and snow detection on Advanced Very High Resolution Radiometer (AVHRR) imagery, Atmos. Meas. Tech., 7, 799–822, https://doi.org/10.5194/amt-7-799-2014, 2014. a
Pfeifroth, U., Bojanowski, J. S., Clerbaux, N., Manara, V., Sanchez-Lorenzo, A., Trentmann, J., Walawender, J. P., and Hollmann, R.: Satellite-based trends of solar radiation and cloud parameters in Europe, Adv. Sci. Res., 15, 31–37, https://doi.org/10.5194/asr-15-31-2018, 2018. a, b
Platnick, S., Hubanks, P., Meyer, K., and King, M. D.: MODIS Atmosphere L3 Monthly Product (08_L3), NASA MODIS Adaptive Processing System, Goddard Space Flight Center, USA, https://doi.org/10.5067/MODIS/MOD08_M3.006, 2015. a
Rossow, W. B. and Schiffer, R. A.: Advances in Understanding Clouds from ISCCP, B. Am. Meteorol. Soc., 80, 2261–2287, 1999. a, b
Salby, M. and Callaghan, P.: Sampling error in climate properties derived from satellite measurements: Consequences of undersampled diurnal variability, J. Climate, 10, 18–36, 1997. a
Salby, M. L.: Sampling Theory for Asynoptic Satellite Observations. Part I: Space-Time Spectra, Resolution, and Aliasing, J. Atmos. Sci., 39, 2577–2600, https://doi.org/10.1175/1520-0469(1982)039<2577:STFASO>2.0.CO;2, 1982a. a
Salby, M. L.: Sampling Theory for Asynoptic Satellite Observations. Part II: Fast Fourier Synoptic Mapping, J. Atmos. Sci., 39, 2601–2614, https://doi.org/10.1175/1520-0469(1982)039<2601:STFASO>2.0.CO;2, 1982b. a
Salby, M. L.: Irregular and diurnal variability in asynoptic measurements of stratospheric trace species, J. Geophys. Res., 92, 14781–14805, https://doi.org/10.1029/JD092iD12p14781, 1987. a
Schulzweida, U.: CDO User Guide (Version 1.9.8), Zenodo, https://doi.org/10.5281/zenodo.3539275, 2019. a
Stengel, M., Mieruch, S., Jerg, M., Karlsson, K. G., Scheirer, R., Maddux, B., Meirink, J. F., Poulsen, C., Siddans, R., Walther, A., and Hollmann, R.: The Clouds Climate Change Initiative: Assessment of state-of-the-art cloud property retrieval schemes applied to AVHRR heritage measurements, Remote Sens. Environ., 162, 363-379, https://doi.org/10.1016/j.rse.2013.10.035, 2015. a
Stengel, M., Stapelberg, S., Sus, O., Schlundt, C., Poulsen, C., Thomas, G., Christensen, M., Carbajal Henken, C., Preusker, R., Fischer, J., Devasthale, A., Willén, U., Karlsson, K.-G., McGarragh, G. R., Proud, S., Povey, A. C., Grainger, R. G., Meirink, J. F., Feofilov, A., Bennartz, R., Bojanowski, J. S., and Hollmann, R.: Cloud property datasets retrieved from AVHRR, MODIS, AATSR and MERIS in the framework of the Cloud_cci project, Earth Syst. Sci. Data, 9, 881–904, https://doi.org/10.5194/essd-9-881-2017, 2017. a, b
Stengel, M., Stapelberg, S., Sus, O., Finkensieper, S., Würzler, B., Philipp, D., Hollmann, R., Poulsen, C., Christensen, M., and McGarragh, G.: Cloud_cci Advanced Very High Resolution Radiometer post meridiem (AVHRR-PM) dataset version 3: 35-year climatology of global cloud and radiation properties, Earth Syst. Sci. Data, 12, 41–60, https://doi.org/10.5194/essd-12-41-2020, 2020. a
Stephens, G. L., Vane, D. G., Boain, R. J., Mace, G. G., Sassen, K., Wang, Z., Illingworth, A. J., O'Connor, E. J., Rossow, W. B., Durden, S. L., Miller, S. D., Austin, R. T., Benedetti, A., and Mitrescu, C.: The CloudSat mission and the A-TRAIN, B. Am. Meteorol. Soc., 83, 1771–1790, https://doi.org/10.1175/BAMS-83-12-1771, 2002. a
Stöckli, R., Duguay-Tetzlaff, A., Bojanowski, J. S., and Hollmann, R.: Meteosat Cloud Fractional Cover Edition 1, Algorithm Theoretical Basis Document (ATBD), Satellite Application Facility for Climate Monitoring, EUMETSAT, Germany, Tech. rep., 75 pp., 2017a. a
Stöckli, R., Duguay-Tetzlaff, A., Bojanowski, J. S., Hollmann, R., Fuchs, P., and Werscheck, M.: CM SAF ClOud Fractional Cover dataset from METeosat First and Second Generation – Edition 1 (COMET Ed. 1), Satellite Application Facility on Climate Monitoring (CM SAF), https://doi.org/10.5676/EUM_SAF_CM/CFC_METEOSAT/V001, 2017b. a, b
Stöckli, R., Bojanowski, J. S., John, V. O., Duguay-Tetzlaff, A., Bourgeois, Q., Schulz, J., and Hollmann, R.: Cloud Detection with Historical Geostationary Satellite Sensors for Climate Applications, Remote Sensing, 11, 1052, https://doi.org/10.3390/rs11091052, 2019. a, b
Theil, H.: A rank invariant method of linear and polynomial regression analysis, in: Proceedings of the Koninklijke Nederlandse Akademie Wetenschappen, Series A Mathematical Sciences 53, pp. 386–392, 521–525, 1397–1412, 1950. a
Winker, D. M., Vaughan, M. A., Omar, A., Hu, Y., Powell, K. A., Liu, Z., Hunt, W. H., and Young, S. A.: Overview of the CALIPSO Mission and CALIOP Data Processing Algorithms, J. Atmos. Ocean. Tech., 26, 2310–2323, https://doi.org/10.1175/2009JTECHA1281.1, 2009. a
Wu, D. L., Baum, B. A., Choi, Y.-S., Foster, M. J., Karlsson, K.-G., Heidinger, A., Poulsen, C., Pavolonis, M., Riedi, J., Roebeling, R., Sherwood, S., Thoss, A., and Watts, P.: Toward Global Harmonization of Derived Cloud Products, B. Am. Meteorol. Soc., 98, ES49–ES52, https://doi.org/10.1175/BAMS-D-16-0234.1, 2017. a
Wylie, D., Jackson, D. L., Menzel, W. P., and Bates, J. J.: Trends in Global Cloud Cover in Two Decades of HIRS Observations, J. Climate, 18, 3021–3031, https://doi.org/10.1175/JCLI3461.1, 2005. a
Young, A. H., Knapp, K. R., Inamdar, A., Hankins, W., and Rossow, W. B.: The International Satellite Cloud Climatology Project H-Series climate data record product, Earth Syst. Sci. Data, 10, 583–593, https://doi.org/10.5194/essd-10-583-2018, 2018. a