the Creative Commons Attribution 4.0 License.
the Creative Commons Attribution 4.0 License.
 | 23 Dec 2020
A single-beam photothermal interferometer for in situ measurements of aerosol light absorption
Jannis Röhrbein
Peter Steigmeier
Luka Drinovec
Griša Močnik
Ernest Weingartner
We have developed a novel single-beam photothermal interferometer and present here its application for the measurement of aerosol light absorption. The use of only a single laser beam allows for a compact optical set-up and significantly easier alignment compared to standard dual-beam photothermal interferometers, making it ideal for field measurements. Due to a unique configuration of the reference interferometer arm, light absorption by aerosols can be determined directly – even in the presence of light-absorbing gases. The instrument can be calibrated directly with light-absorbing gases, such as NO2, and can be used to calibrate other light absorption instruments. The detection limits (1σ) for absorption for 10 and 60 s averaging times were determined to be 14.6 and 7.4 Mm−1, respectively, which for a mass absorption cross section of 10 m2 g−1 leads to equivalent black carbon concentration detection limits of 1460 and 740 ng m−3, respectively. The detection limit could be reduced further by improvements to the isolation of the instrument and the signal detection and processing schemes employed.
- Article
(2498 KB) - Full-text XML
-
Supplement
(792 KB) - BibTeX
- EndNote


According to estimates from the World Health Organization (WHO), particulate air pollution contributes to about 7 million premature deaths each year, making it one of the leading causes of early mortality worldwide (WHO, 2014). Studies of short-term health effects suggest that black carbon (BC) particles, a component of carbonaceous aerosols, are a better indicator of the effect of harmful particulate substances from combustion sources exert on human health than any other metric (Janssen et al., 2011, 2012), and it is acknowledged that BC poses tremendous harm to public health. New estimates based on re-evaluation of data from across Europe suggest that air pollution leads to more than double the number of deaths than previously thought (Lelieveld et al., 2019).
Besides its health relevance, aerosol black carbon also significantly affects the Earth's climate (Bond et al., 2013; Myhre et al., 2013). Aerosols influence our climate by their ability to scatter and absorb solar radiation (Myhre et al., 2013). As BC particles are highly efficient light absorbers, they are considered to be the second most important anthropogenic climate forcer after CO2 (Bond et al., 2013). However, the uncertainty of the BC warming effect is still very high; the best estimate of the radiative forcing of BC is +1.1 W m−2 (90 % uncertainty bounds +0.17 to +2.1 W m−2; Bond et al., 2013).
Aerosol light absorption is quantified using the wavelength-dependent absorption coefficient babs(λ), which is defined as the attenuation of light due to absorption in the medium per unit length. The total attenuation of light passing through a sample is determined by the absorption and scattering (bscat) coefficients, using the Beer–Lambert law as follows:
where I is the intensity of light remaining after transmission through a medium of length x given an initial intensity I0. In order to relate aerosol light absorption to a mass concentration of (absorbing) aerosol particles, the mass absorption cross section (MAC) of the aerosol is required as follows: , where m is the mass concentration of the light absorbing aerosol component. For typical ambient BC aerosols measured at λ=637 nm, the MAC is approximately 10 m2 g−1 (Petzold et al., 2002); however, the uncertainty is that this value is large due to the unavailability of traceable reference methods (Zanatta et al., 2016). In order to clarify the quantity that is measured in such experiments, Petzold et al. (2013) recommend using the term equivalent black carbon (eBC) when its mass is derived by optical measurements.
Aerosol light absorption is commonly measured ex situ using filter-based devices, such as the Aethalometer (Drinovec et al., 2015), multi-angle absorption photometer (MAAP; Petzold et al., 2002), particle soot absorption photometer (PSAP; Bond et al., 1999) and continuous light absorption photometer (CLAP; Ogren et al., 2017). In such measurements, the aerosol particles are deposited into a filter, and the light transmission through the sample-laden filter is measured relative to the unloaded filter. The advantage of filter-based techniques is that they are straightforward, allow for unattended operation and are relatively inexpensive. In addition, they have low detection limits due to the accumulation of the absorbing species on the filter over time. The detection limits can reach babs < 0.05 Mm−1 when the sample is collected over a sufficiently long time (Springston and Sedlacek, 2007; Backman et al., 2017). The durability and sensitivity of filter-based instruments have led to their employment in environmental monitoring stations. These methods have significant drawbacks, however, as they suffer from large systematic errors caused by the modification of particle properties upon deposition in the filter (Weingartner et al., 2003; Lack et al., 2008; Drinovec et al., 2015, 2017; Lee, 2019). In addition, various optical interactions between the deposited particles and the filter medium can enhance or lower the measured absorption. One major issue is the cross sensitivity to scattering material embedded in the filter, which enhances the apparent absorption (Arnott et al., 2005; Collaud Coen et al., 2010).
Due to the artefacts inherent in filter-based measurements, it is advantageous to measure the aerosol absorption with the particles suspended in the air. Several in situ measurement techniques exist, amongst which the most common are the extinction minus scattering and photoacoustic methods. In the extinction minus scattering method, light extinction and light scattering are measured separately, with light absorption being defined as the difference between the measured quantities. The measurements can be very accurate but encounter difficulties for aerosols featuring high single-scattering albedo (above approx. 0.75) in which extinction and scattering are both large and have almost equal quantities (Bond et al., 1999; Schnaiter et al., 2005). Instruments based on the photoacoustic effect measure the light absorption of the sample directly as a pressure wave generated after the absorption of light in the aerosol and subsequent heating of the gas. As the photoacoustic signal is only generated by light absorption, artefacts from light scattering are completely eliminated. The photoacoustic method encounters a significant bias when measuring hygroscopic aerosols in elevated relative humidity (RH) or samples with volatile coatings – this artefact arises from the loss in the latent heat of these particle-bound volatile species as they evaporate from the heated particles, reducing the apparent acoustic signal (Arnott et al., 2003; Raspet et al., 2003; Murphy, 2009; Langridge et al., 2013). Some photoacoustic instruments can achieve detection limits of babs ≈ 0.1 Mm−1 (with 60 s averaging; Lack et al., 2006), though most instruments have considerably higher detection limits (Linke et al., 2016).
In situ absorption methods have a further advantage over traditional measurements, namely the ability to traceably calibrate the instrument using an absorbing gaseous species such as NO2 (Arnott et al., 2000; Nakayama et al., 2015) or O3 (Lack et al., 2006, 2012; Davies et al., 2018). Such internal primary calibration standards are unavailable for filter-based instrumentation, which rely on comparative measurements with reference instruments and reference aerosols; not only are such calibration processes prone to biases, they also cannot be performed in the field, requiring the instrument to be shipped to the calibration facility.
Photothermal interferometry (PTI) is an in situ direct absorption measurement technique originally developed for measurements of trace gases (Davis and Petuchowski, 1981; Fulghum and Tilleman, 1991; Mazzoni and Davis, 1991) that has also been applied to aerosol measurements (Davis and Petuchowski, 1981; Fluckiger et al., 1985; Lin and Campillo, 1985; Moosmüller and Arnott, 1996; Sedlacek, 2006; Sedlacek and Lee, 2007; Moosmüller et al., 2009; Lack et al., 2014; Lee and Moosmüller, 2020). In PTI, the light absorption babs of a sample is measured by probing light-absorption-induced changes of a refractive index using interferometry. Previous realisations of PTI require two lasers, i.e. one of high power that is modulated and absorbed by the sample (pump) and a second continuous-wave (CW) interferometry laser (probe). Upon absorption of pump beam light by the sample, energy is transferred via heat conduction to the buffer gas, which results in highly localised heating and thus a refractive index change within the pump beam volume, which is measured by the probe beam. At the shot noise limit, the theoretical detection limit of PTI has been calculated to be babs < 0.01 Mm−1 (30 s integration time; Sedlacek, 2006), though for aerosol measurements the practical detection limit is consistently considerably higher (e.g. > 0.2 Mm−1 from Sedlacek and Lee, 2007).
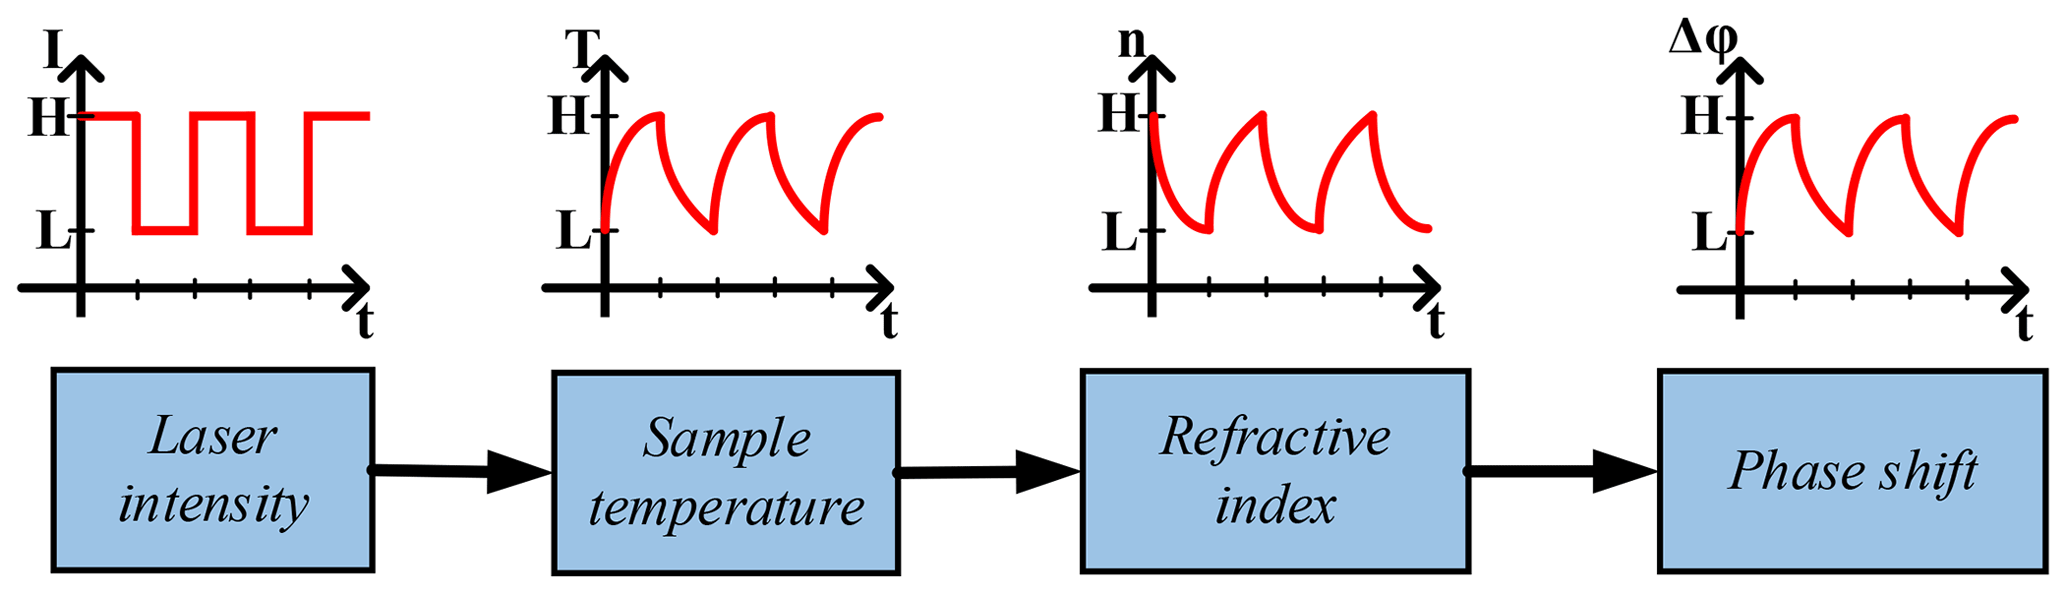
Figure 1Scheme of PTI signal generation and measurement. For standard pump–probe PTI measurements, the laser power at the low level is L=0.
The primary difficulties associated with achieving the theoretical detection limits are the sensitivity of interferometric measurements to external noise sources, the difficulty of maintaining the optimal alignment of the pump and probe beams and measurement artefacts due to cross sensitivity to other absorbing species, such as NO2, volatile organic compounds (VOCs) and O3. Improvements to isolation systems and adoption of folded interferometer configurations has led to a significant reduction in noise (Moosmüller and Arnott, 1996). The alignment of the laser beams requires the instrument to be calibrated using a species of known absorption, and this calibration must be repeated periodically to track the sensitivity (beam overlap) of the PTI. Otherwise, uncorrected changes in sensitivity are interpreted as changes in the aerosol light absorption. Measurement artefacts due to the cross sensitivity of PTI to other absorbing species have typically been compensated for by simultaneously measuring a filtered sample stream and subtracting the offset.
In order to address the aforementioned difficulties associated with the PTI technique, a new PTI instrument employing a single laser and unique beam configuration has been developed. This instrument greatly simplifies the alignment of the interferometer, maximises the sensitivity of the measurement and enables artefact-free measurement of aerosol absorption in the presence of absorbing gaseous species. We report here on the experimental realisation of this instrument, which we have termed the modulated single-beam PTI (MSPTI) configuration – its initial characterisation with NO2 and the first laboratory measurements of carbonaceous aerosols. Future improvement of the sensitivity and durability of the MSPTI is planned, enabling its use as a field-monitoring instrument.
In the PTI technique, the absorption-based induced change of the refractive index of the buffer gas is detected via the relative phase shift of light waves passing through the sample vs. those traversing the reference medium within the interferometer. Substances (particles, molecules, etc.) that absorb light at the pump laser wavelength transfer the absorbed energy to the surrounding buffer gas via heat conduction, resulting in a local increase in the buffer gas temperature. As the refractive index of a gas depends upon its density, which is itself temperature dependent, modulation of the pump laser intensity in the presence of a light-absorbing substance results in the local modulation of the refractive index. Light passing through this volume experiences a periodic phase shift, which can be measured via interferometry. Figure 1 shows a schematic of this process.
The measured phase shift Δφ is related to the absorption coefficient babs via the following relation (Moosmüller et al., 1997; Sedlacek, 2006):
The first term can be considered constant for a given temperature, where n, T, ρ and Cp are the refractive index, temperature, density and heat capacity of the air, respectively. λProbe is the interferometer laser wavelength, and Δt denotes the heating time within the modulation cycle. The second term can be defined as the sensitivity of the PTI measurement, where l is the length of the overlap of the beams within the sample volume, PPump is the modulation amplitude of the pump beam power and A is the effective cross-sectional area of the laser beams. Therefore, maximum sensitivity is achieved by maximising the length of the interaction and the pump laser power and minimising the cross-sectional area of the beams (though requiring that the cross sections overlap).

Figure 2A potential realisation of a standard two-beam photothermal interferometer, similar to published configurations (see, e.g., Lee and Moosmüller, 2020). The pump laser is set to overlap the probe beam in the measurement arm of the interferometer within the aerosol chamber. Note: BS – beam splitter; M – mirror; DM – dichroic mirror; F – bandpass filter; BD – beam dump; AC – aerosol chamber; D – detector.
In standard realisations of PTI, a single-sample chamber is placed either in the measurement arm alone or across both arms of the interferometer. One potential realisation of a standard PTI set-up is shown in Fig. 2. The modulated pump beam is set to overlap the probe beam within the sample chamber in the measurement (lower) arm. As interferometric measurements are relative, the resultant signal contains an modulated component associated with light absorption and an offset due to the optical path length difference between the two arms of the interferometer.
Interferometric detection schemes use the wave properties of light to measure minuscule changes in optical path lengths. An interferometer typically consists of two optical paths (designated measurement and reference arms) and two output beams in which light from the respective paths are combined. The light waves interfere in the output beams, causing the measured intensities of the output beams to vary with the phase difference between the measurement and reference light waves (which is determined by the difference in the optical path length between the two arms). The light intensity in each output beam (measured with the respective detectors) can then be defined in terms of this phase difference φmeas−φref, which we will assign as the interferometric phase φ, and is given by the following:
where I0 is the intensity of the laser before the initial beam splitter.
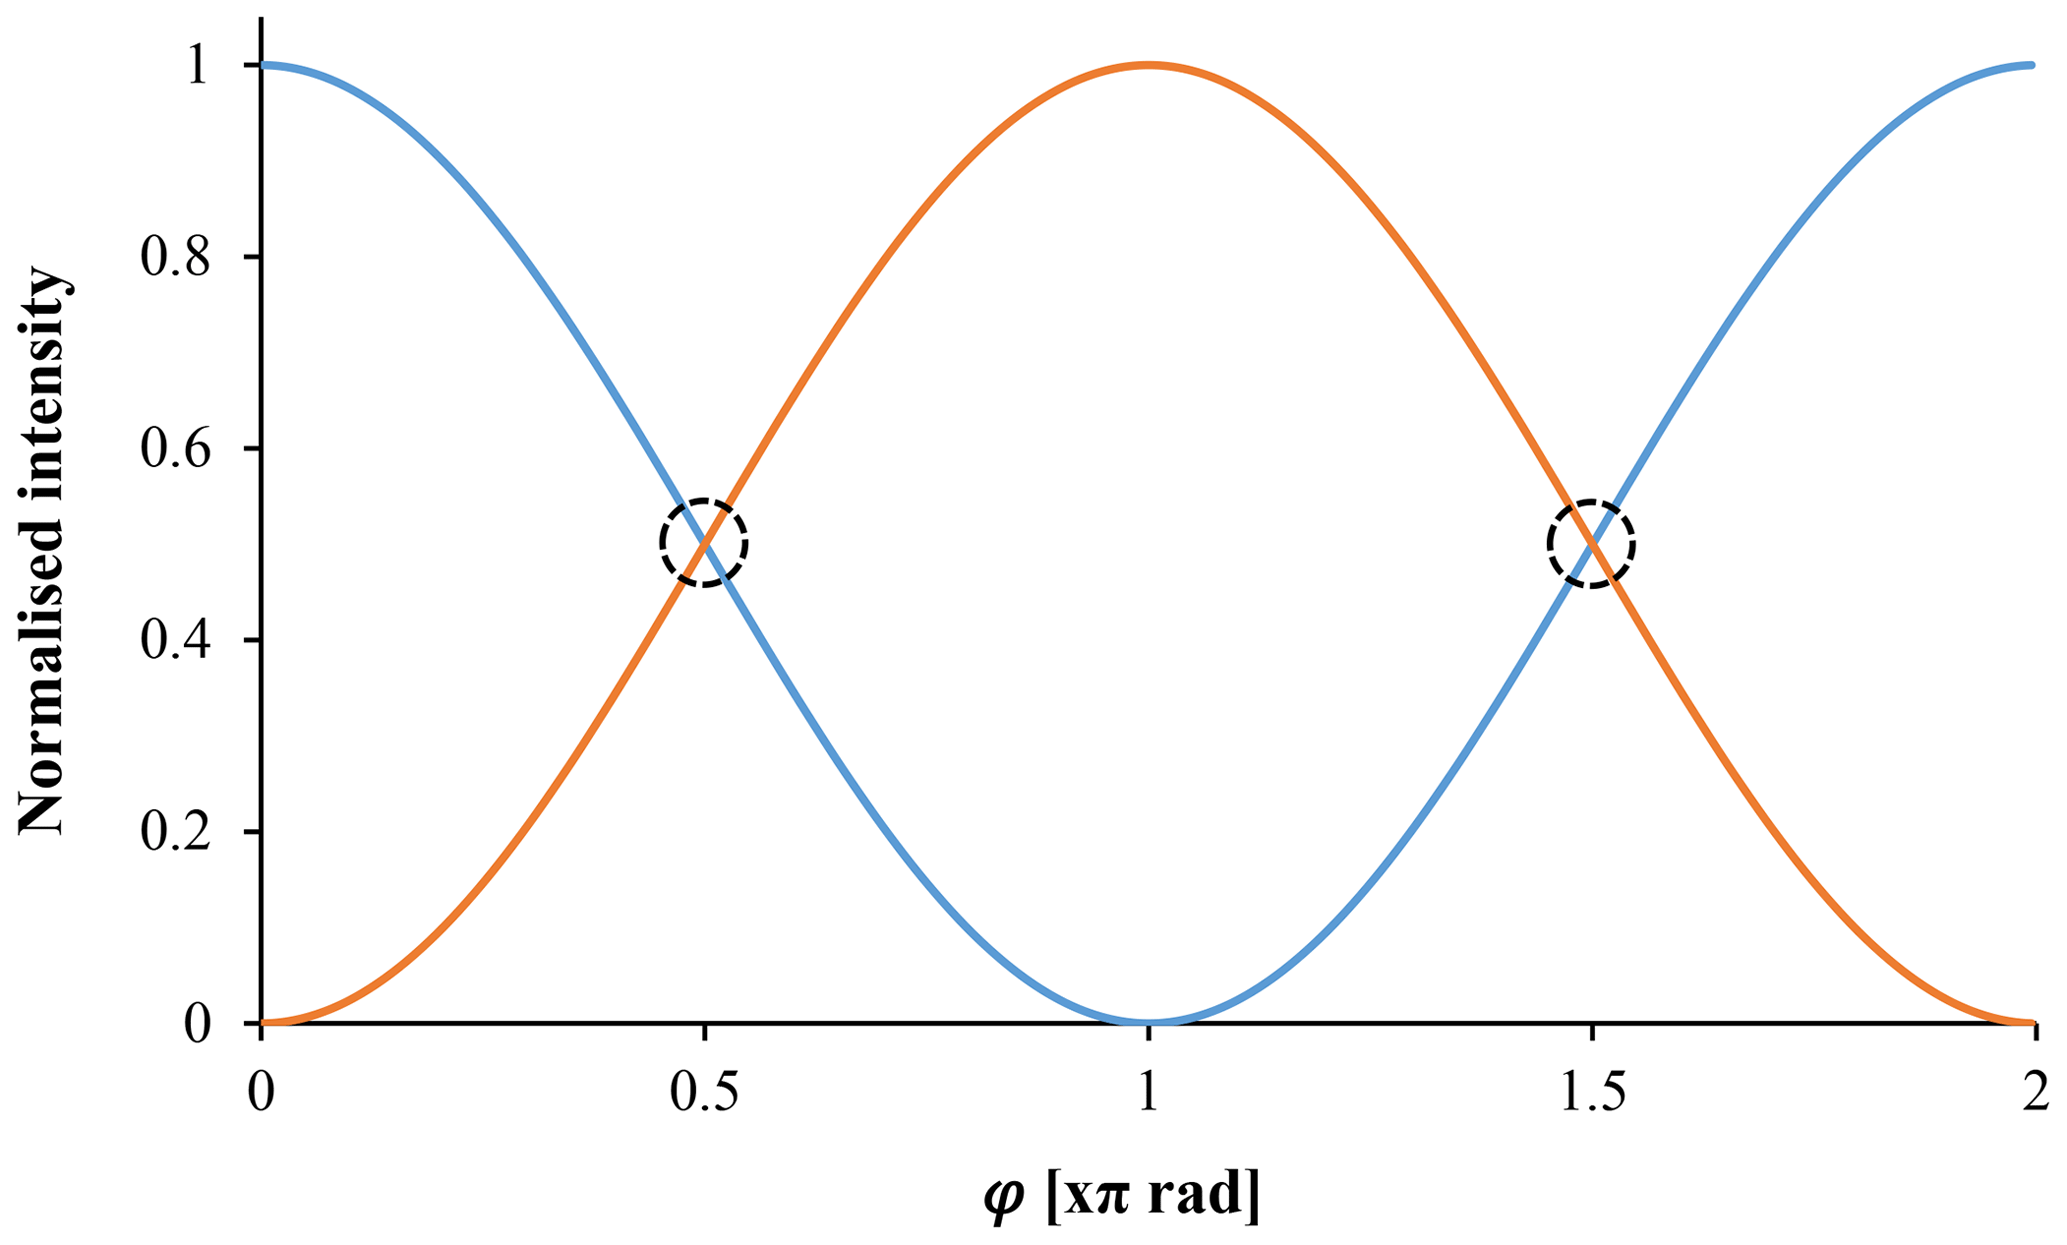
Figure 3The intensity of light measured by each detector in the interferometer as a function of the interferometric phase. The dashed circles indicate the quadrature points where the light intensity falling on each detector is approximately equal. At these points, the relationship between a small phase shift Δφ and the measured intensities is approximately linear, and the sensitivity of the measurement is maximal.
Interference of the beams leads to the limits of totally constructive Ix=I0 and totally destructive interference Ix=0 at each detector. These limits are shifted by π radians for D2 compared to D1, thus maintaining the conservation of energy. The relationship between the intensity measured at the detectors and the phase difference between the interfering light waves for an ideal interferometer is shown in Fig. 3.
For the measurement of a small, time-dependent phase shift Δφ(t), such as that produced via light absorption in PTI, it is necessary to consider the interferometric phase φ. Due to the sinusoidal relationship between the measured signals and φ, the relationship between a small change in the phase difference between the waves Δφ(t) and the change in the measured intensity ΔI is not constant and depends on φ. This property of the measurement is shown in Fig. 3. At , where , the slope , and thus, the sensitivity of the measurement is maximised. In order to take advantage of this, PTI measurements are typically performed in phase quadrature by actively regulating φ to . Previous PTI instruments (Moosmüller and Arnott, 1996; Sedlacek, 2006; Sedlacek and Lee, 2007) have used a number of different methods to regulate the phase difference between the two arms of the interferometer, with the application of a piezoelectric element to move one of the interferometer optical elements being the most common solution.
At the quadrature points, the relationship between a sufficiently small phase change Δφ(t) (e.g. for sin Δφ≅Δφ) and the measured intensities can be approximated by the following:
where I1 and I2 are the intensities of light measured by the detectors in the two outputs of the interferometer as a function of time. In the ideal case of a light source of constant intensity and an optically thin medium, I1+I2 is constant.
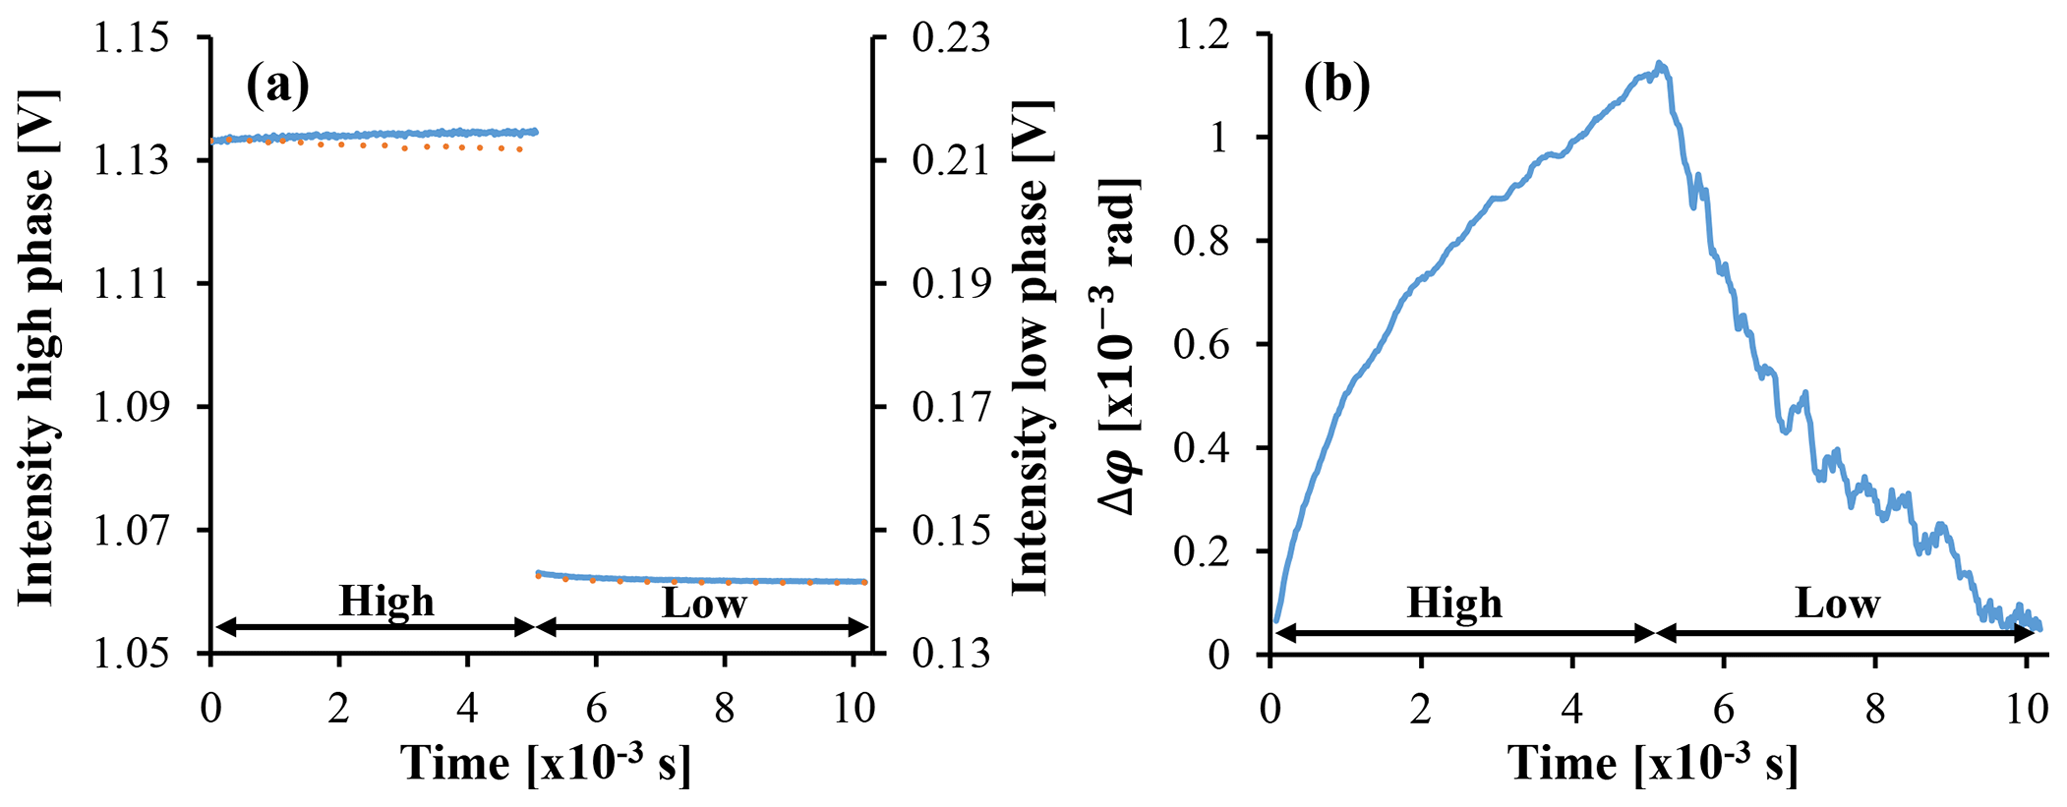
Figure 4(a) Typical raw signals from the interferometer outputs (I1, I2; blue and red dotted lines, respectively) measured during a modulation cycle with a strongly absorbing sample. Over the course of the heating (high) phase, an intensity difference arises between the outputs. (b) This effect is seen more clearly in the resultant phase shift, which is calculated by normalising the difference of the raw signals by the total intensity (Eq. 5). The baseline offset has been subtracted.
Phase shifts may additionally arise from sources other than the photothermal effect, such as from acoustic noise and changes in the length of the interferometer due to vibrations. Low-frequency noise can be separated from phase shifts due to the photothermal effect by modulating the pump laser at a higher frequency and restricting the detection bandwidth to this frequency. This is typically performed experimentally using a lock-in amplifier. Unwanted variations in phase (phase noise) can be reduced through the choice of the interferometer geometry. The current preferred interferometer geometry for aerosol measurements is a folded one, for example a folded Jamin interferometer (Moosmüller and Arnott, 1996; Sedlacek, 2006). This design minimises the influence of interferometric noise by placing both arms of the interferometer in parallel and close proximity and through the use of an etalon and retroreflector. The use of these two optical components ensures that any noise that is coupled into the interferometer affects both arms equally and thus cancels out.
Here we present a new PTI configuration, which we have named the MSPTI, in which the pump and probe beams are replaced by a single modulated laser beam. This beam has the same optical path as the probe beam in a conventional PTI set-up and is modulated between two sufficiently different intensity levels. A larger intensity difference between the levels leads to an increased PTI signal; however, signal-to-noise limitations restrict the choice of Ilow in the case that measurements are made during the laser low phase. In this study, Ilow was set to , which allowed a qualitative indication of the signal response during the cooling phase. The major advantage of the modulated configuration is the simplified optical alignment of the system. As a single beam fulfils both pump and probe functions, the pump–probe co-incident volume is, by definition, the entire beam volume. This ensures maximum heating and detection sensitivities and enables the use of significantly lower pump intensities, thus reducing the potential for the destruction of the sample and measurement noise arising from heating of the interferometer optical components.
The MSPTI configuration requires a different approach to signal evaluation than standard PTI. As the probe beam is not maintained at constant intensity, additional data analysis steps are required in order to optimally extract the PTI signal encoded on the modulated laser beam. The MSPTI configuration also places additional constraints on the single laser employed. The standard requirements for the interferometric probe beam of low noise and significant coherence length remain, but high CW power is additionally required. For the MSPTI prototype, we have chosen to employ a diode-pumped solid-state laser operating at 532 nm, modulated with an external acousto-optic modulator (AOM) to improve rise and fall times and laser stability.
The measured phase shift in the MSPTI is equivalent to the two-beam case, with only slight modification required to the formulae. The pump and probe subscripts are dropped from Eq. (2), and PPump is replaced by ΔP, the modulated laser power in the measurement chamber (for the case of a 50:50 beam splitter and no optical losses, ΔP is half of the modulated power exiting the laser). Performing these substitutions results in Eq. (6), which is valid for the simplified case of a laser beam with constant diameter.
For the case of a focused laser beam with a Gaussian intensity distribution with focal point in the middle of measurement chamber, it can be shown (see the Supplement) that the phase change due to the PTI effect is as follows:
where 2a is the length of the measurement chamber and zr is the Rayleigh distance for the modulated beam focused in the middle of the measurement chamber. For the case where the length of the chamber is twice the Rayleigh distance, a=zr, and the sensitivity becomes . The sensitivity of the measurement approaches the limit , for . Thus, the maximum sensitivity achievable for an arbitrary interaction (chamber) length is limited and cannot be further increased through improved focusing.
Unlike the case of standard PTI, in which the small phase changes are measured from a stable CW laser intensity, the MSPTI signal is dominated by the modulation of the laser intensity. Thus, lock-in detection cannot be directly performed with the difference signal of the interferometer outputs, and a normalisation step is required. This is performed by normalising the time-dependent difference signal from the detectors by the total light intensity (refer to Eq. 5 above). This step accounts for the dependence of the phase change signal on the total light intensity of the interferometer beam. An example of this normalisation step is shown in Fig. 4.
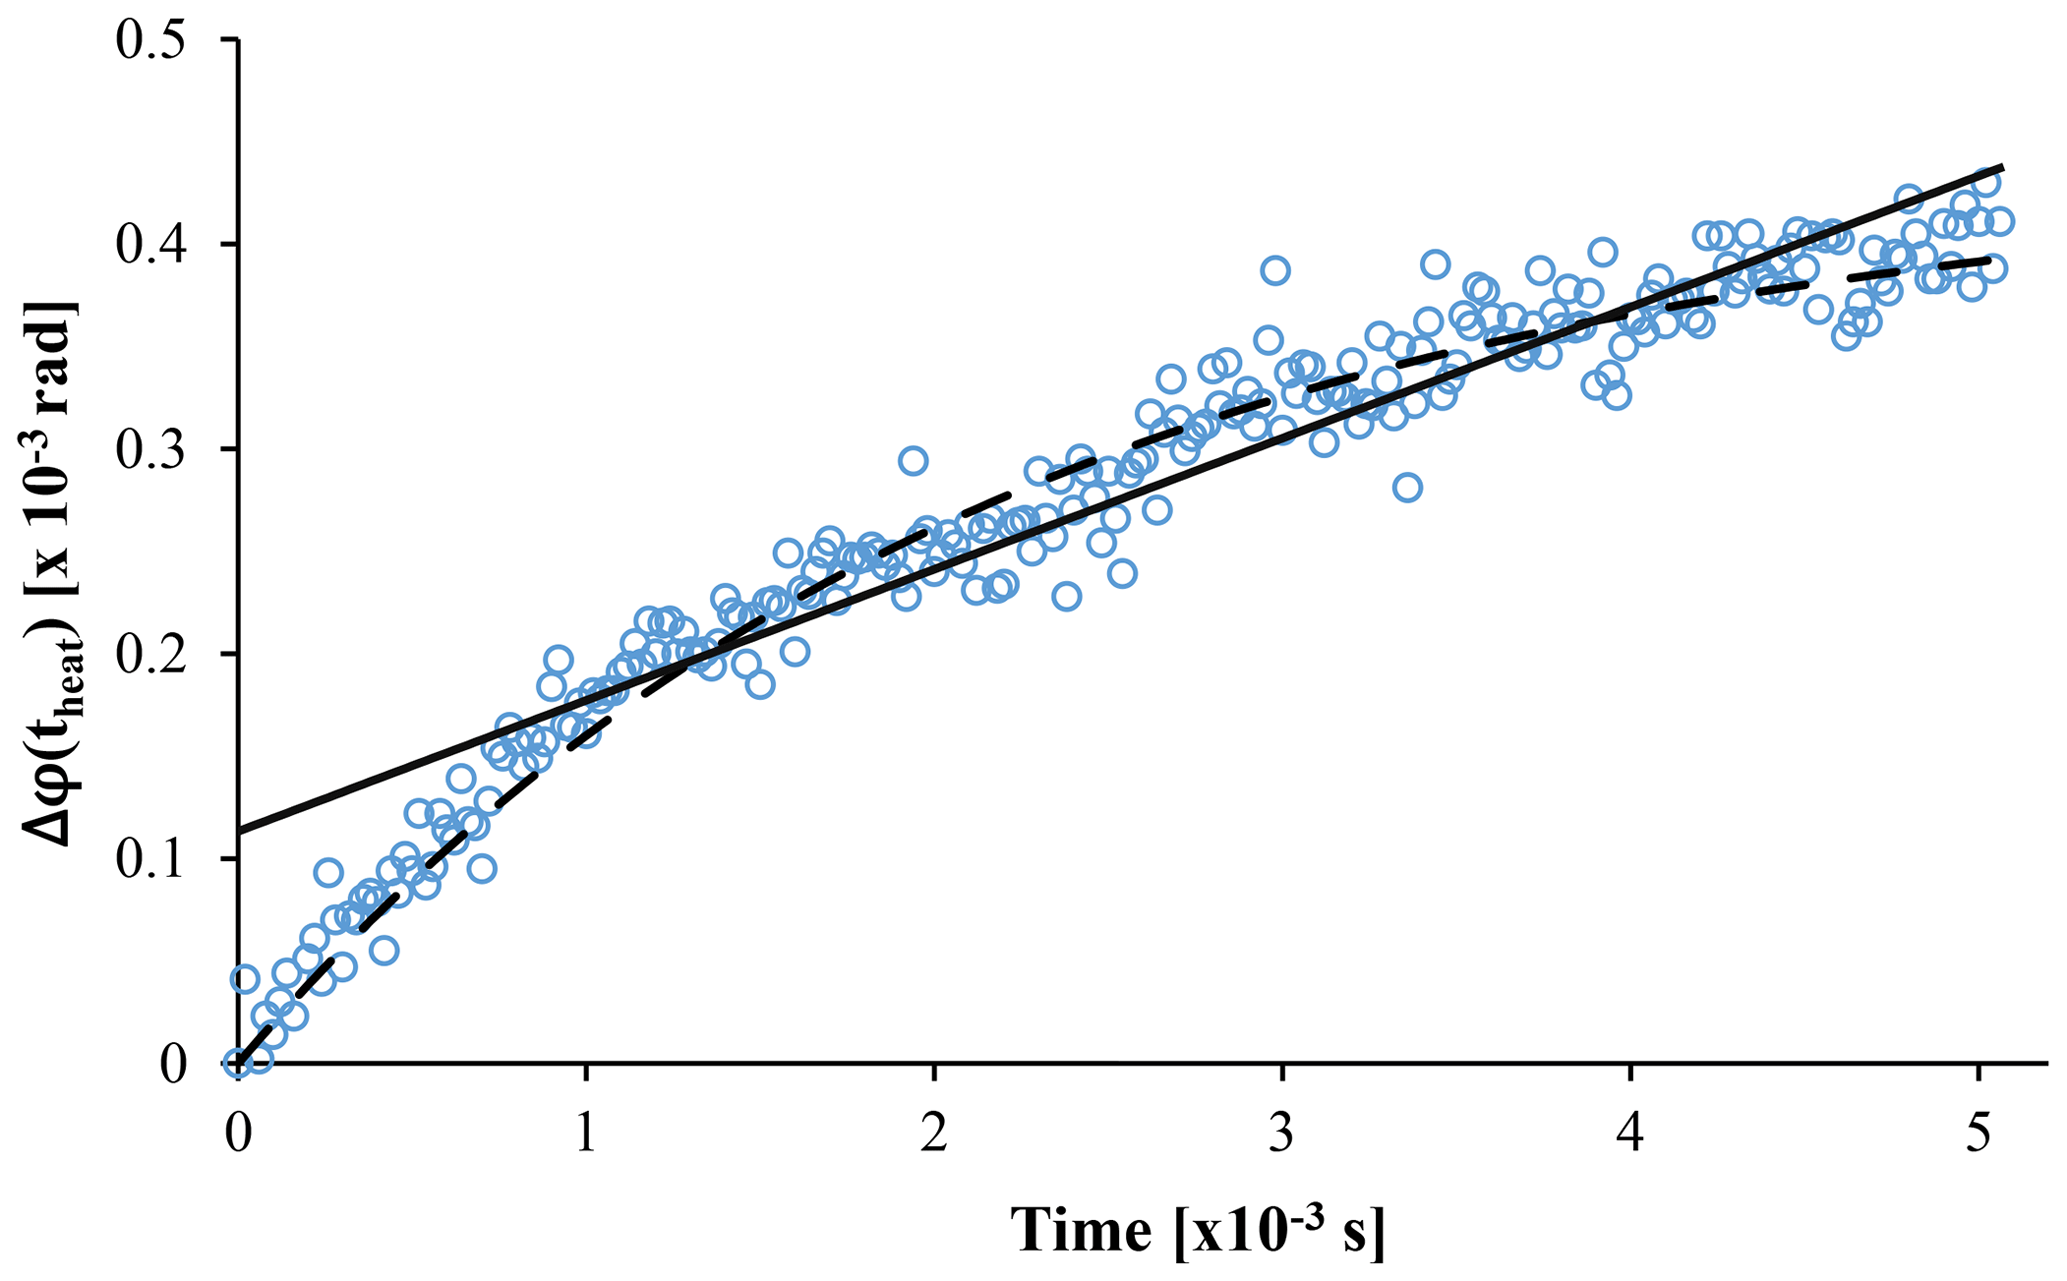
Figure 5Measured phase shift during the heating phase averaged over a 1 s interval for a strongly absorbing aerosol (approximately 100 µg m−3 eBC) in Ar. The black dashed line represents the best least squares exponential fit, while the solid line is the linear fit to the data.
Thus, a new PTI signal-processing method was developed to address the additional complications of the MSPTI method when compared to standard pump–probe PTI. Signal processing was performed in software, after digitising the raw signals from the photodetectors. As the desired quantity from the measurement is the magnitude of the light absorption by the aerosol, it was sufficient to analyse the heating (or high) phases alone. To ensure maximum signal-to-noise ratio and avoid reducing the data further, the heating curves were analysed in full. An example heating curve calculated from Eq. (5) for approximately 100 µg m−3 (eBC) of electrical discharge soot is shown in Fig. 5. From Eq. (6), it could be expected that the phase shift due to light absorption should increase linearly with the duration of the heating phase Δt. However, the example heating curve shown in Fig. 5 deviates considerably from linearity as the heating phase progresses. This is due to the loss in absorbed energy in the form of heat out of the sensing (laser) volume with time. Taken to the limit of Δt→∞ for a non-modulated laser beam, Eq. (6) implies that Δφ→∞; however, in reality, Δφ approaches equilibrium as the heat arising from absorption of the laser beam is balanced by the heat flowing out of the detection volume. Thus, Eq. (6) is only valid for heating times Δt shorter than a characteristic time.
Empirically, the best fit to the data was found to be an exponential of the following form:
where a is a parameter representing the limit of the phase change due to the temperature increase in the sample volume due to light absorption and temperature loss outside of the laser beam volume, τ is the mean lifetime of the cooling process and is dependent on the beam geometry, and c is the absolute offset from phase quadrature. Equation (8) is closely related to Newton's law of cooling adapted to be expressed in terms of phase shift and with the addition of a heating term due to light absorption during the heating cycle. An example of the least squares best fit of this form is shown as the dashed line in Fig. 5.
As the characteristic cooling time τ is predominantly dependent on the geometry of the heating/sensing volume, and this does not change during measurements, further simplification of the fit to obtain Δφ(theat) is possible. It was found that, for a specific range of heating times, the exponential fit could be approximated with a linear one, with slope . An example least squares linear fit to a heating curve is shown as the dotted line in Fig. 5. The quality of the linear fit to the data appears poor; however, it still contains the required information for the calculation of Δφ(theat) and babs when calibrated using a species of known absorption. The interested reader is directed to the Supplement for additional details.
It should be noted that this analysis only holds for the specific cases of a single-beam modulated interferometer and a two-beam interferometer with exactly equal and perfectly overlapped pump and probe volumes. For the general case of significantly different pump and probe beam geometries, the dynamics of the system will differ considerably from those obtained in this work (Monson et al., 1989).
The physical layout of the interferometer is based on the folded Jamin interferometers of Moosmüller and Sedlacek (Moosmüller and Arnott, 1996; Sedlacek, 2006) and is shown in Fig. 6. The etalon in the Jamin design has been replaced by separate beam splitter and mirror optics, which are mounted in a solid metal block. The overlap of the interfering beams can be adjusted with the positioning of the mirror by way of thumbscrews. The resulting layout is a folded Mach–Zehnder interferometer. As both the reference and measurement beams are incident on the beam splitter and mirror, the effects of mechanical (vibrational) noise are reduced when compared to standard Michelson or Mach–Zehnder designs. The insensitivity to mechanical noise is not as complete as for the Jamin design, as the two optical elements are able to move with respect to each other, but the design does allow for flexibility in the design of the aerosol chamber.
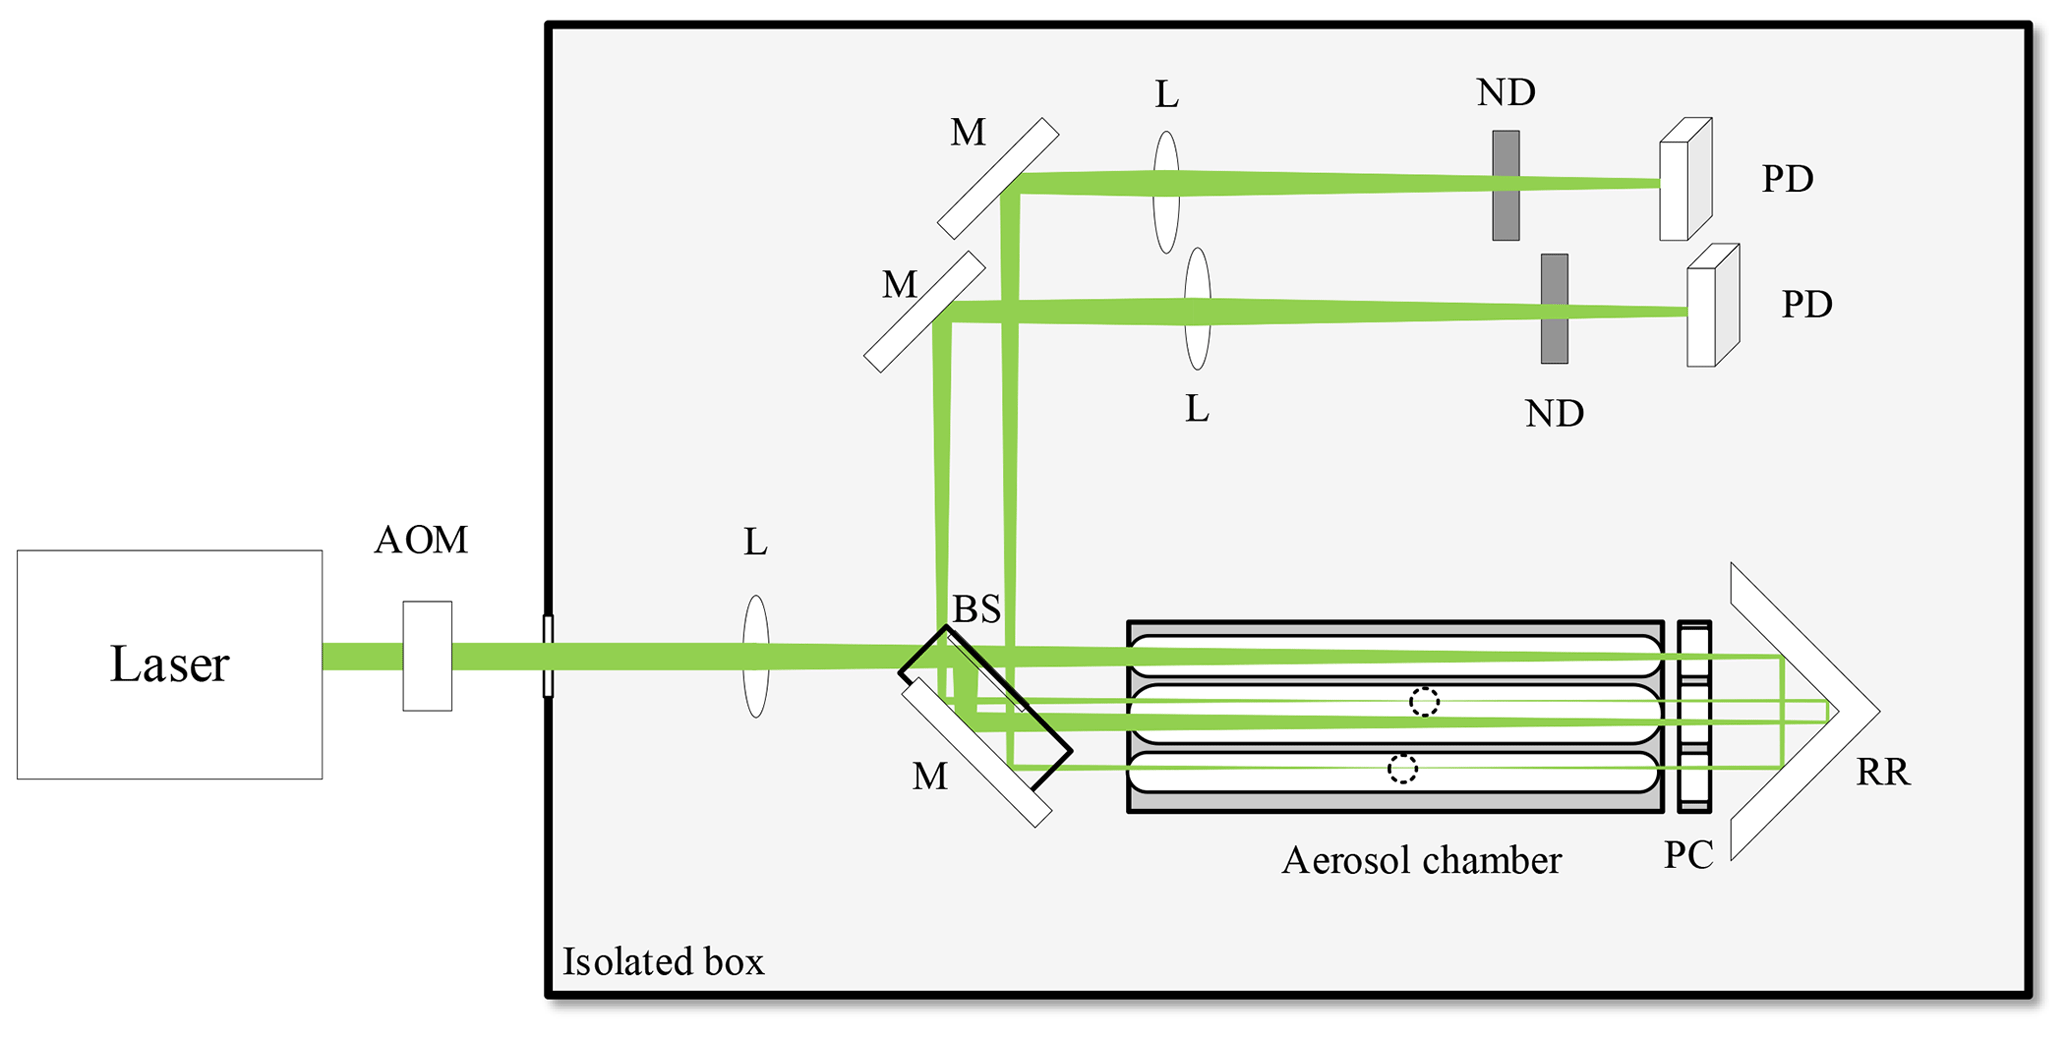
Figure 6Schematic of the modulated single-beam photothermal interferometry (MSPTI) prototype. The label M denotes mirrors, while L, AOM, BS, PC, RR, ND and PD denote a focusing lens, acousto-optic modulator, beam splitter, pressure chamber, retroreflector, neutral density filter and photodiode, respectively. The dashed circles show the positions of the beam focus in each arm of the interferometer. An image of the experimental set-up is shown in Fig. S6 in the Supplement.
The MSPTI design additionally requires a different aerosol chamber design compared to standard PTI instruments. In the case of MSPTI, the single modulated beam is present in both reference and measurement arms of the interferometer, and therefore, a difference in aerosol composition between the reference and measurement arms is required. In the current MSPTI prototype, the aerosol chamber consists of three isolated cells – one for the measurement arm (sample) and two for the reference arm. A high-efficiency particulate air (HEPA)-grade absolute filter separates the sample and reference cells. A schematic of the flow set-up for the MSPTI instrument is shown in Fig. 7.
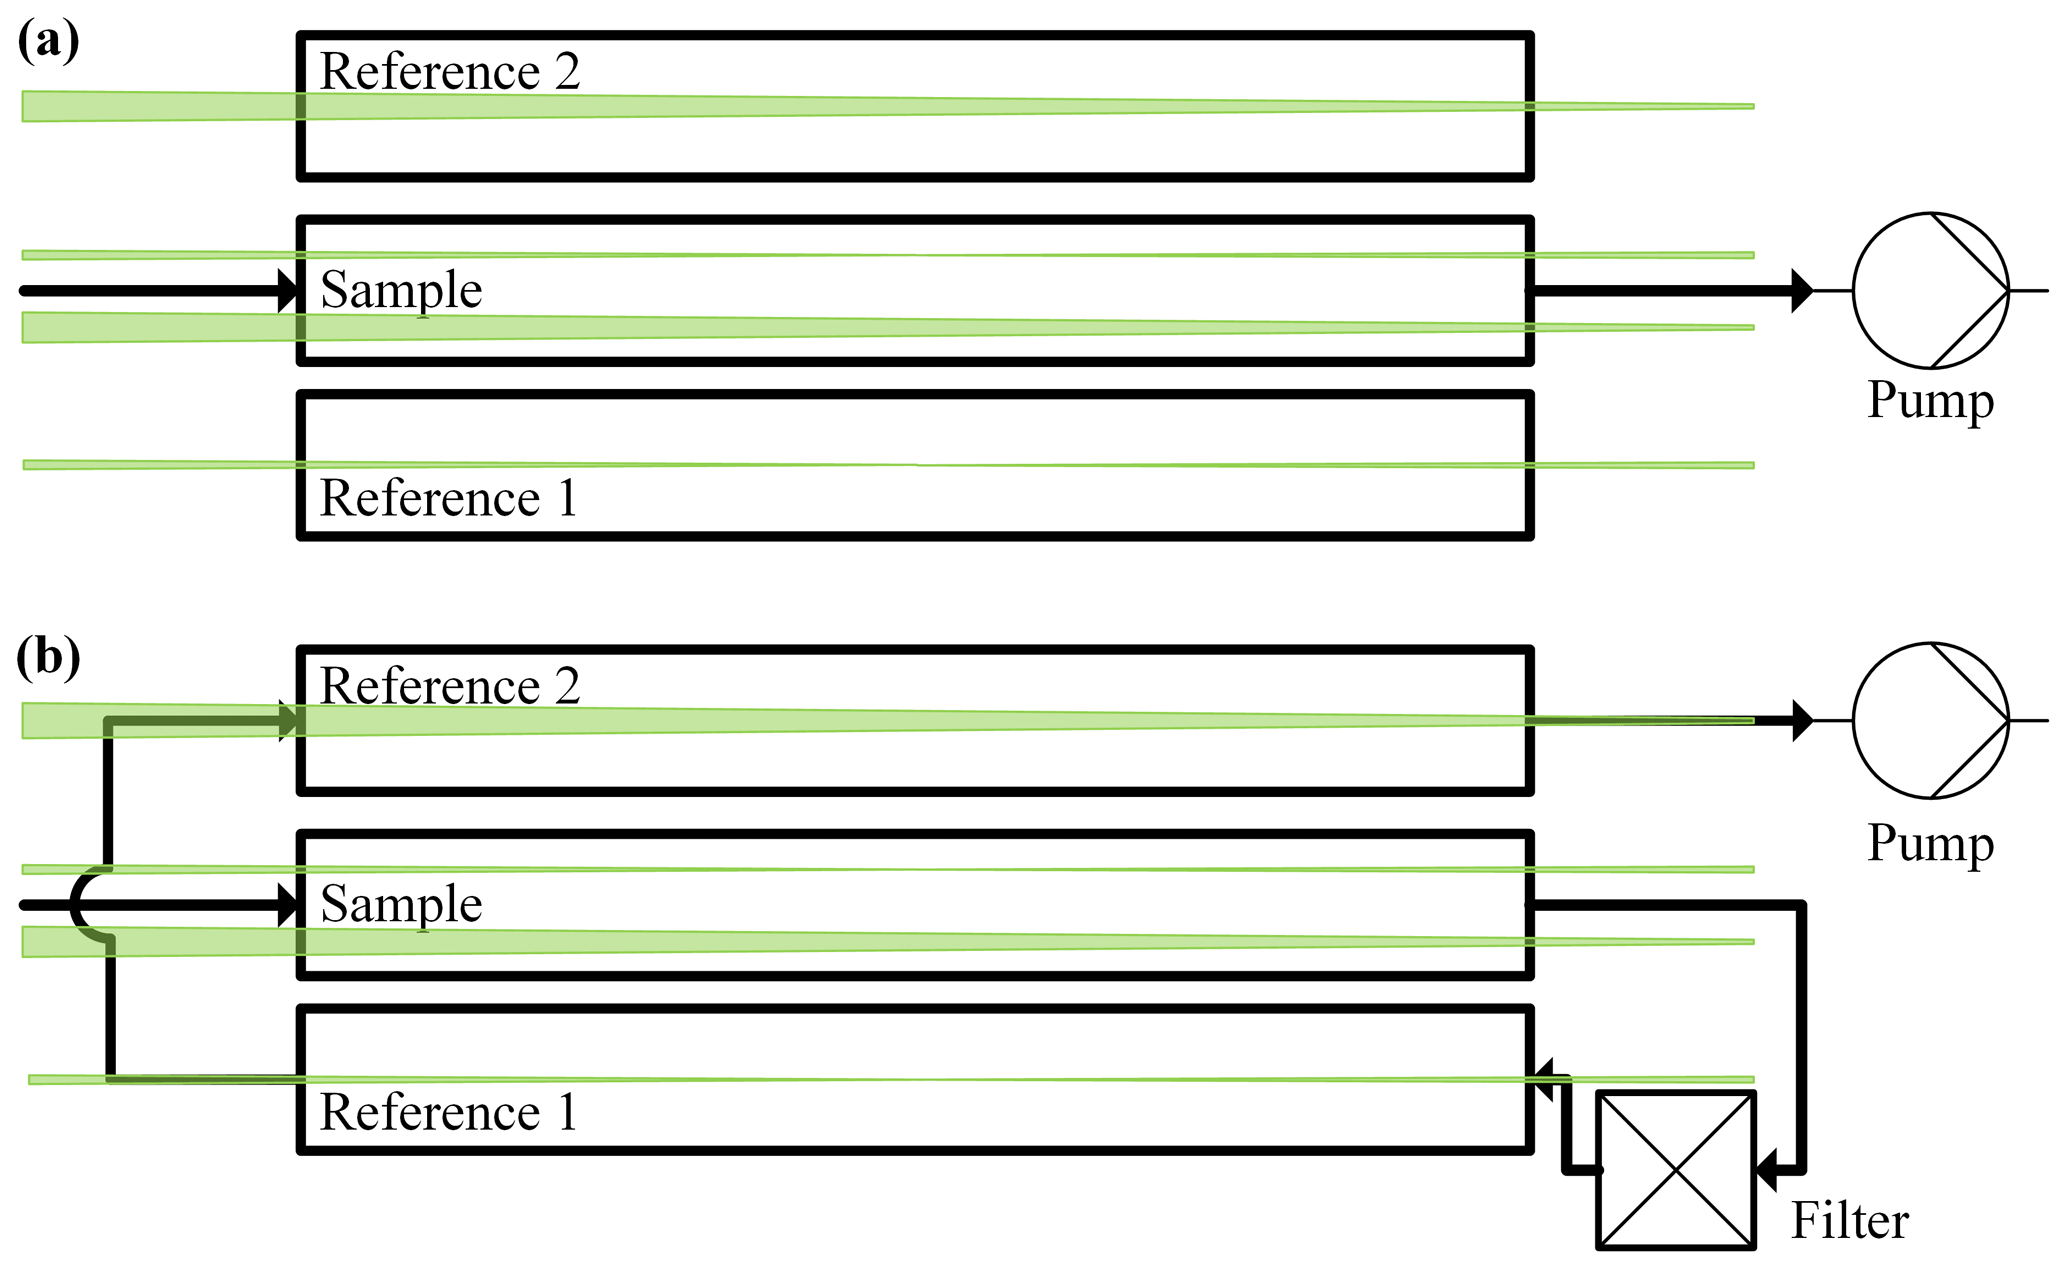
Figure 7Gas flow system for the MSPTI prototype. Calibration measurements are performed, as in (a), by filling the sample cell with the calibration gas and the reference cells with non-absorbing synthetic air. All three cells are connected for standard measurements, as in (b), with the filtered sample flowing through both reference chambers in sequence.
The effective perfect beam overlap for the MSPTI in both sample and reference chambers confers an additional advantage – the ability to directly subtract absorption by gaseous species. As the light-absorbing gaseous species are present in the same concentration in both arms of the interferometer, the photothermal effect due to these gaseous species is the same, and the net phase difference is zero. This compensation of the gas absorption requires both equal laser intensity in the sample and reference arms of the interferometer and equal sensitivity due to the positioning of the two focal points. Equal intensity can be achieved with a 50:50 beam splitter (at the laser wavelength). Equal sensitivities also require that the Rayleigh distance from the focal points lie entirely within the respective chambers. Fulfilment of these prerequisites thus enables the determination of the light absorption of the aerosol only, even though the complex sample mixture may additionally feature absorbing gases and light-scattering aerosol.
In the MSPTI instrument, phase quadrature is actively regulated using a pressure cell in the reference beam path. As the refractive index of a gas depends on pressure, the optical path length of the reference path can be adjusted by varying the pressure in the cell (positioned between the reference arm and the retroreflector in Fig. 6). The quadrature regulation is performed at frequencies below 1 Hz in order to counteract slow changes in the optical path lengths, such as from thermal drifts or changes in the refractive index of the gas. The advantage of this method is its simplicity (it does not require the production of custom optics) and the lack of moving parts.
The alignment of the interferometer is comparatively simple. The modulated beam is coupled into the interferometer block at an angle of 45∘ relative to the beam splitter, after which the retroreflector is adjusted so that the returning beams pass through the cells in the aerosol chamber as required. The focusing lens is then inserted before the interferometer block, and its position is adjusted so that the focus is centred within the aerosol chamber. Finally, the overlap of the interfering beams is optimised by adjusting the mirror in the interferometer block until it is parallel with the beam splitter and maximum interferometric contrast is acquired. No further adjustment of beam overlap is required.
The PTI instrument is mounted on an optical breadboard (Thorlabs, Inc.; B60120A). Solid-borne vibrations are damped using a set of passive vibration isolators (Thorlabs, Inc.; PWA090). The interferometer is housed within a metal box lined with acoustic foam for isolation from air currents and external noise sources.
The laser source is a diode-pumped solid-state laser (Laser Quantum gem; 450 mW) at 532 nm. The laser power was regulated at 200 mW in this study. Before entering the interferometer, the beam first passes through a half-wave plate (Thorlabs, Inc.; WPH05M-532), which rotates the polarisation to vertical. Intensity modulation of the beam is performed with an acousto-optic modulator (AOM; AA Opto Electronic; AA.MT110-A1.5-VIS), and the 0th order output is selected in order to maximise the available laser power for PTI. Subsequently, the beam is expanded by a factor of 3 by a Galilean beam expander, and the polarisation is rotated by 45∘ for optimal splitting at the non-polarising beam splitter in the interferometer. All mirrors employed in the interferometer are broadband dielectric mirrors designed for use at visible wavelengths (Thorlabs, Inc.; BB1-E02).
The modulated interferometer in this work is of folded Mach–Zehnder design and consists of a broadband dielectric mirror (Thorlabs, Inc.; BBSQ2-E02), a 50:50 amplitude-splitting beam splitter optimised for 532 nm (Thorlabs, Inc.; BSW4R-532) and a 50.8 mm diameter retroreflector (Edmund Optics; model no. 49-666). The mirror and beam splitter are mounted into a single custom-machined metal block in order to reduce relative movements of the optics and shift mechanical vibrations to higher frequencies. The mirror tilt is adjustable in two planes via thumbscrews in order to align the beams and achieve maximum interferometric contrast (97 % typical). The laser focus inside the interferometer was checked using a charge-coupled device (CCD) camera (Basler AG; acA1300-30µm) and optimised by adjusting the position of the focusing lens (Thorlabs, Inc.; LA1908-A).
Custom-built aerosol and pressure chambers are situated within the interferometer. Each of the chambers consists of three individual cells which are separately sealed using optical windows (Edmund Optics; model no. 46-100) with O rings. The reference arm of the interferometer consists of the two outer cells of each chamber. The central sample cell comprises the measurement arm through which the laser passes twice. Samples are introduced into the central cell and are then either exhausted (NO2 calibration measurements) or flow through an absolute filter and then each outer cell in series (standard aerosol measurements), as shown in Fig. 5. The gas flow is subsequently measured using a flowmeter (WISAG; 1000 series). One outer cell of the pressure cell is connected to a regulated pressure valve (Parker; 980-005101-015) and is controlled by a software-based proportional–integral (PI) controller.
In the detection component, the diverging beams are refocused using biconvex lenses (Thorlabs, Inc.; LB1945-A-ML), and the optical power is reduced with neutral-density (ND) filters (Thorlabs, Inc.; NE10A). Detection of the interfering laser beams is performed with a photodiode in each interferometer output (Thorlabs, Inc.; DET36A) operating in photoconductive mode. The use of two detectors allows the rejection of false signals, such as changes in laser intensity. The detected photocurrents are converted into voltages using a 1.2 kΩ resistor in parallel to the photodiode and subsequently digitised (National Instruments; USB-6356).

Figure 8MSPTI signal dependence on the heating time for 1 part per million (ppm) of NO2 in synthetic air. For shorter heating times, the PTI signal is linearly dependent on the heating time (dotted line). Error bars represent 1 standard deviation (SD) of the 10 s integrated data.
Carbonaceous aerosols are generated with a spark discharge soot generator (Palas; GFG 1000). Argon (Messer; 4.8) is used as the inert carrier gas for the discharge and subsequent transport of the generated particles. Comparison measurements of eBC concentrations are performed using an Aethalometer (Aerosol d.o.o.; AE33). PTI is an in situ light-absorption measurement technique, and as such, it is possible to use an absorbing gas to calibrate the sensitivity of the instrument (Lack et al., 2006). In the visible range, NO2 and O3 gases have the highest absorption cross sections, and NO2 was chosen as the calibration gas for this study. The initial characterisation of the MSPTI was additionally performed with NO2 in order to determine the optimal operating conditions for the instrument. The optimal operating frequency can be determined by investigating the relationship between the duration of the laser high period (heating time) and the resultant PTI signal. NO2 concentrations are prepared from a mixture of 1 part per million (ppm) NO2 in excess synthetic air (Messer; 5.6), using mass flow controllers (Vögtlin Instruments; red-y GSC-B9SA-DD23 and GSC-B9SA-DD26), and a NO2 monitor (Horiba; APNA-370) was available for reference concentration measurements.
As can be seen in Eq. (6), the measured phase shift for PTI is linearly dependent on the heating time. This, however, is only valid for sufficiently short heating times. If the heating time exceeds a characteristic value , dependent on the beam radius w and the gas thermal diffusivity D, then this equality is no longer maintained as heat flows out of the sensing volume during the measurement and no longer contributes to the signal (Monson et al., 1989). This is observed as a flattening of the heating curves with increasing heating time and results in the apparent reduction in absorption. The calculations of Monson et al. (1989) were performed for collimated laser beams and under the condition that the probe beam diameter was much smaller than that of the pump beam. In the current case, the pump and probe diameters are equal and vary with z, leading to a non-cylindrically symmetric temperature distribution along z. If we, however, assume an average beam radius of 0.1 mm within the sample cell, then becomes 0.53 ms for a gas thermal diffusivity of 19 mm2 s−1. This is in reasonable agreement with the heating curve shown in Fig. 5, in which the deviation of the observed phase shift from linearity begins at ∼ 0.7 ms.
In order to determine the optimal modulation frequency of the laser beam, the PTI signal for 1 ppm NO2 was measured for a range of different modulation frequencies. The results of these measurements are shown in Fig. 8 as a function of heating time. In order to enable comparison with previous works, the measured signals have been converted to phase shifts with units of radians. At shorter heating times, the PTI signal is observed to increase linearly as a function of the heating time, in agreement with Eq. (6). The transition out of the linear regime occurs at a heating time of ∼5 ms (∼ 100 Hz modulation frequency). This result is consistent with the value previously reported by Sedlacek (Sedlacek, 2006) for a two-beam experimental PTI set-up.
It must be noted that all heating curves recorded in this study were non-linear, even for heating times within the linear regime. The linear relationship between PTI signal and the heating time for shorter heating times only implies that the shape of the heating curves remains constant for heating times within this range. Heating curves of a constant shape are evaluated consistently by the chosen linear fit mechanism, thus allowing the transfer of calibration measurements from one heating time to another. Outside of the linear regime, calibration measurements cannot easily be transferred from one heating time to another; however, measurements performed for an arbitrary heating time are still in good agreement with Eq. (6) as long as the shape of the heating curves remains constant (e.g. with the concentration of the light-absorbing species).
A modulation frequency of 91 Hz was chosen in this study in order to avoid a significant noise band around 100 Hz, which was observed during the initial laboratory measurements. Operation at 91 Hz ensured a larger signal than operation at frequencies above 100 Hz, but meant that the MSPTI was operated outside of the aforedescribed linear regime. Therefore, calibration measurements were also performed at 91 Hz, such that the application of Eq. (6) was valid for this modulation frequency. This is explained further in the following paragraphs, which detail the calibration procedure employed in this work.
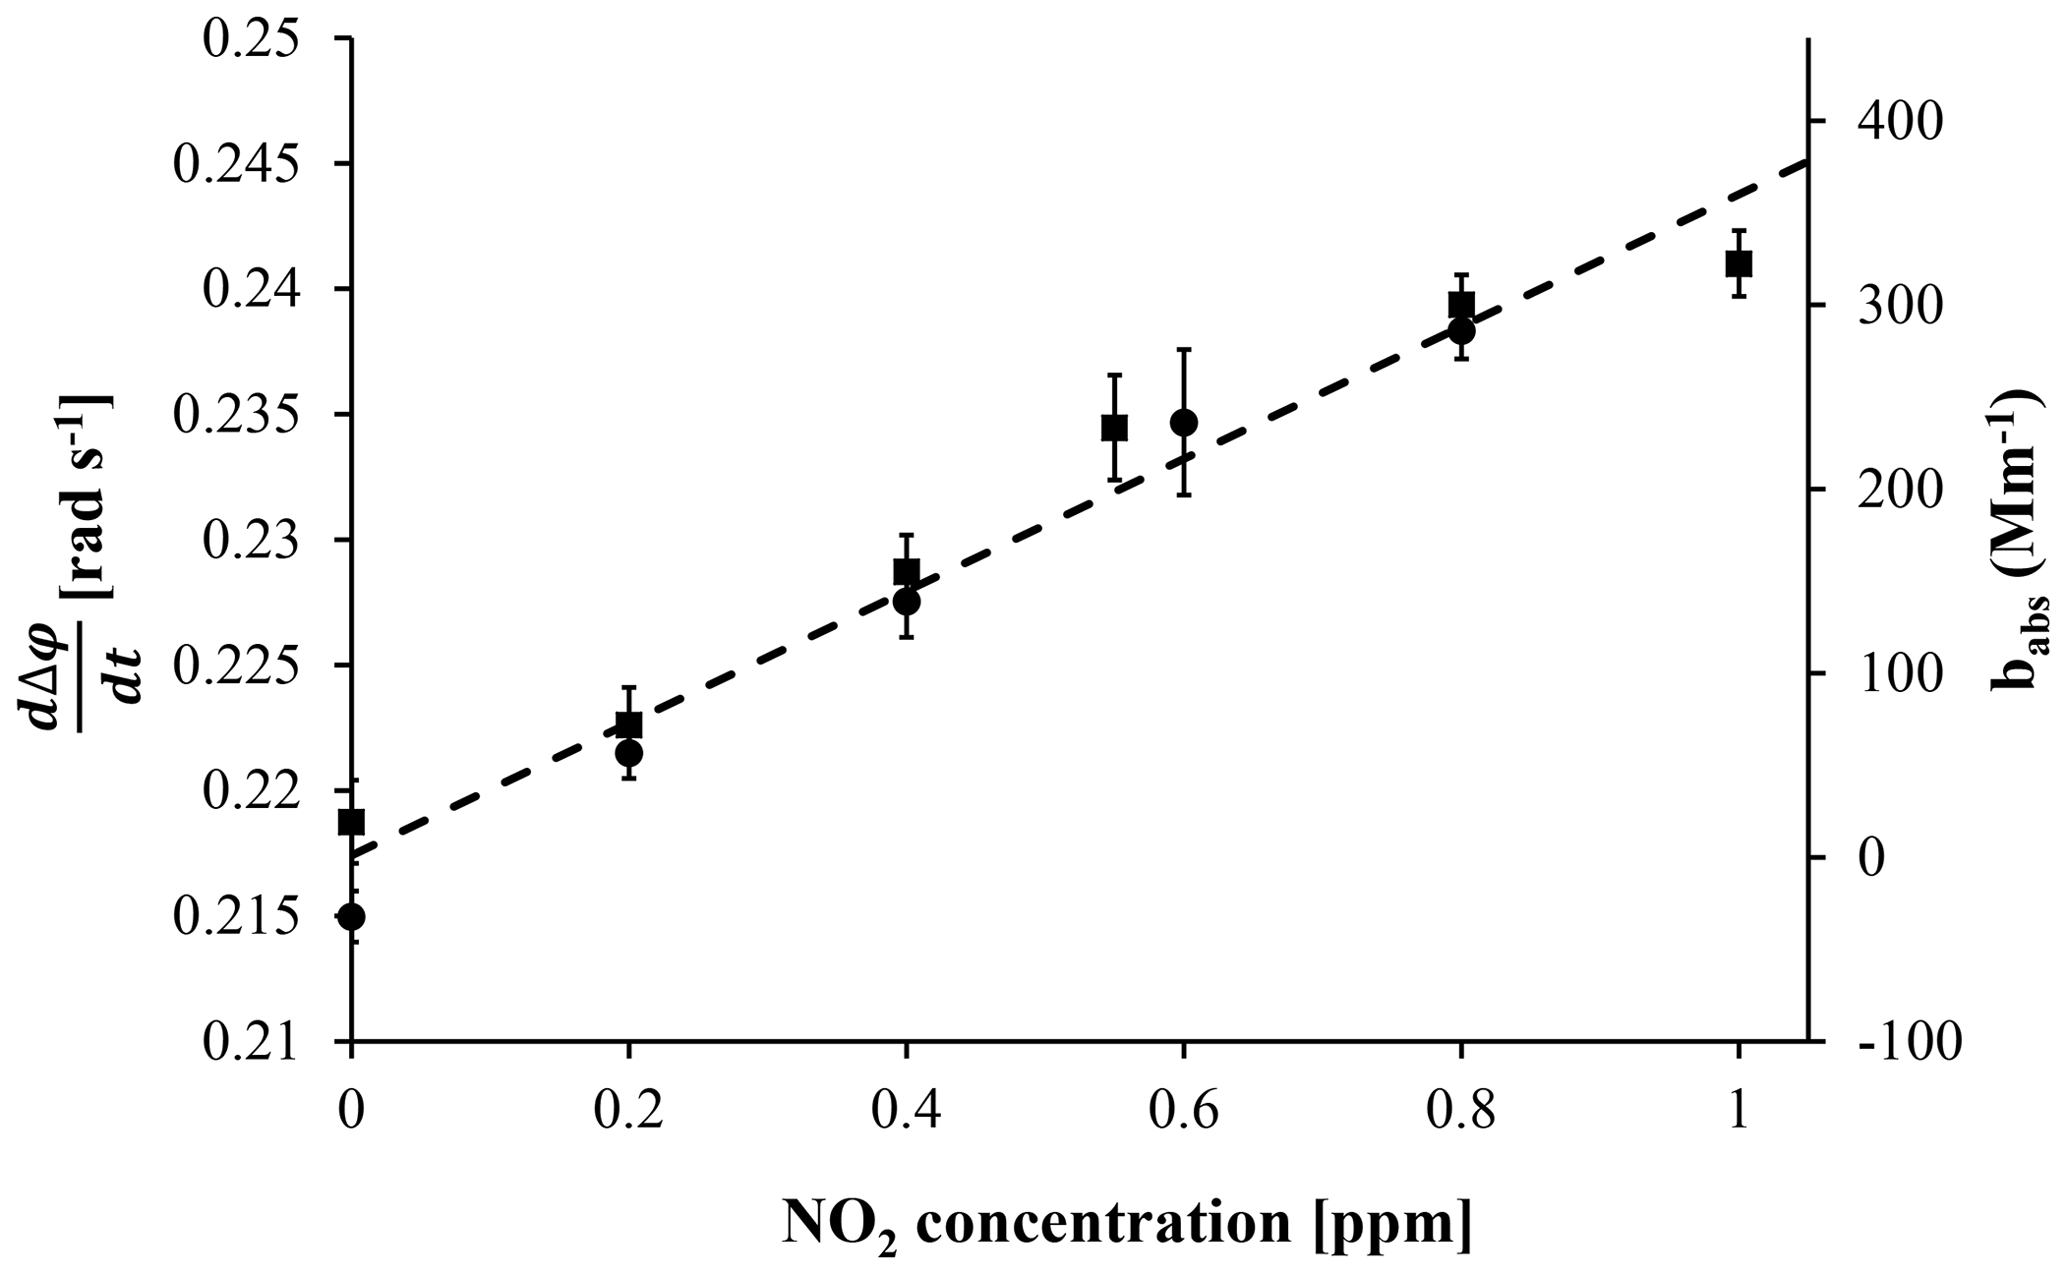
Figure 9PTI signal measured for two consecutive measurement series (filled squares for increasing concentration series; filled circles for the decreasing series), with NO2 concentrations between 0.2 and 1 ppm, measured at a flow rate of 0.5 L min−1. The data are presented in internal interferometric units (primary y axis) and absorption units (secondary y axis; conversion via calibration using the literature absorption values for NO2; see main text for details). Error bars indicate 1 SD of the data integrated over 10 s. The dashed line represents the best linear fit to the data set.
The sensitivity of the instrument was experimentally determined from the MSPTI signal dependence on NO2 concentration. For these measurements, the aerosol chamber was connected so that the NO2 flowed through the sample chamber and was then exhausted (see Fig. 7a, calibration configuration). The reference chambers were filled with synthetic air for the calibration procedure. Measurements were performed for 0.2 to 1 ppm of NO2 in synthetic air at a flow rate of 0.5 L min−1, and the results are plotted in Fig. 9. The two data sets represent two separate measurements, where the concentration of NO2 was firstly increased stepwise from 0 to 1 ppm and then decreased back to 0 ppm. No obvious measurement hysteresis was observed between the data sets. The offset of the measurement is attributed to PTI signals generated in the optical components in the interferometer.
The data show a clear linear relationship between the PTI signal and NO2 mixing concentration set in the flow system and show the validity of the developed signal analysis. From the slope of the concentration curve and the absorption cross section of NO2 reported in the literature, the sensitivity () of the MSPTI instrument can be calculated with Eq. (6). The absorption cross section of NO2 used was 1.47 × 10⁻¹⁹ cm2 molecule−1, which was obtained by convoluting the data of Vandaele et al. (2002; accessed from the MPI-Mainz UV/VIS Spectral Atlas; Keller-Rudek et al., 2013) with a Gaussian function at the reported laser wavelength of 532.075 nm and spectral bandwidth of 30 GHz. Using this value and the typical literature values for air at standard temperature and pressure, a sensitivity () of 6.80 kW m−1 is calculated for the MSPTI system. This value is approximately 2 orders of magnitude lower than the theoretical value determined by measuring the properties of the laser beam at its focus (see the Supplement for the calculation). One major reason for this is the application of a linear fit to the heating curves in this study (see Fig. 5 and accompanying text), which is affected by heat loss out of the laser volume during the measurement. As Eqs. (6) and (7) do not account for the heat loss out of the measurement volume during the measurement, any signal loss due to this process negatively impacts the magnitude of determined from the calibration measurements. This is true for measurements performed at modulation frequencies both within and outside the linear range of Fig. 8, but the effect is larger for modulation frequencies outside of the linear range. The reason for this can be seen in the linear fit of Fig. 5. The non-linear signal due to diffusional loss of heat outside the probe volume suppresses the measurement of the total amount of energy deposited into the system. An exponential fit to the heating curves and subsequent use of for the determination of the phase change due to light absorption would lead the magnitude of the sensitivity determined from the calibration to approach the value obtained by measuring the beam parameters.
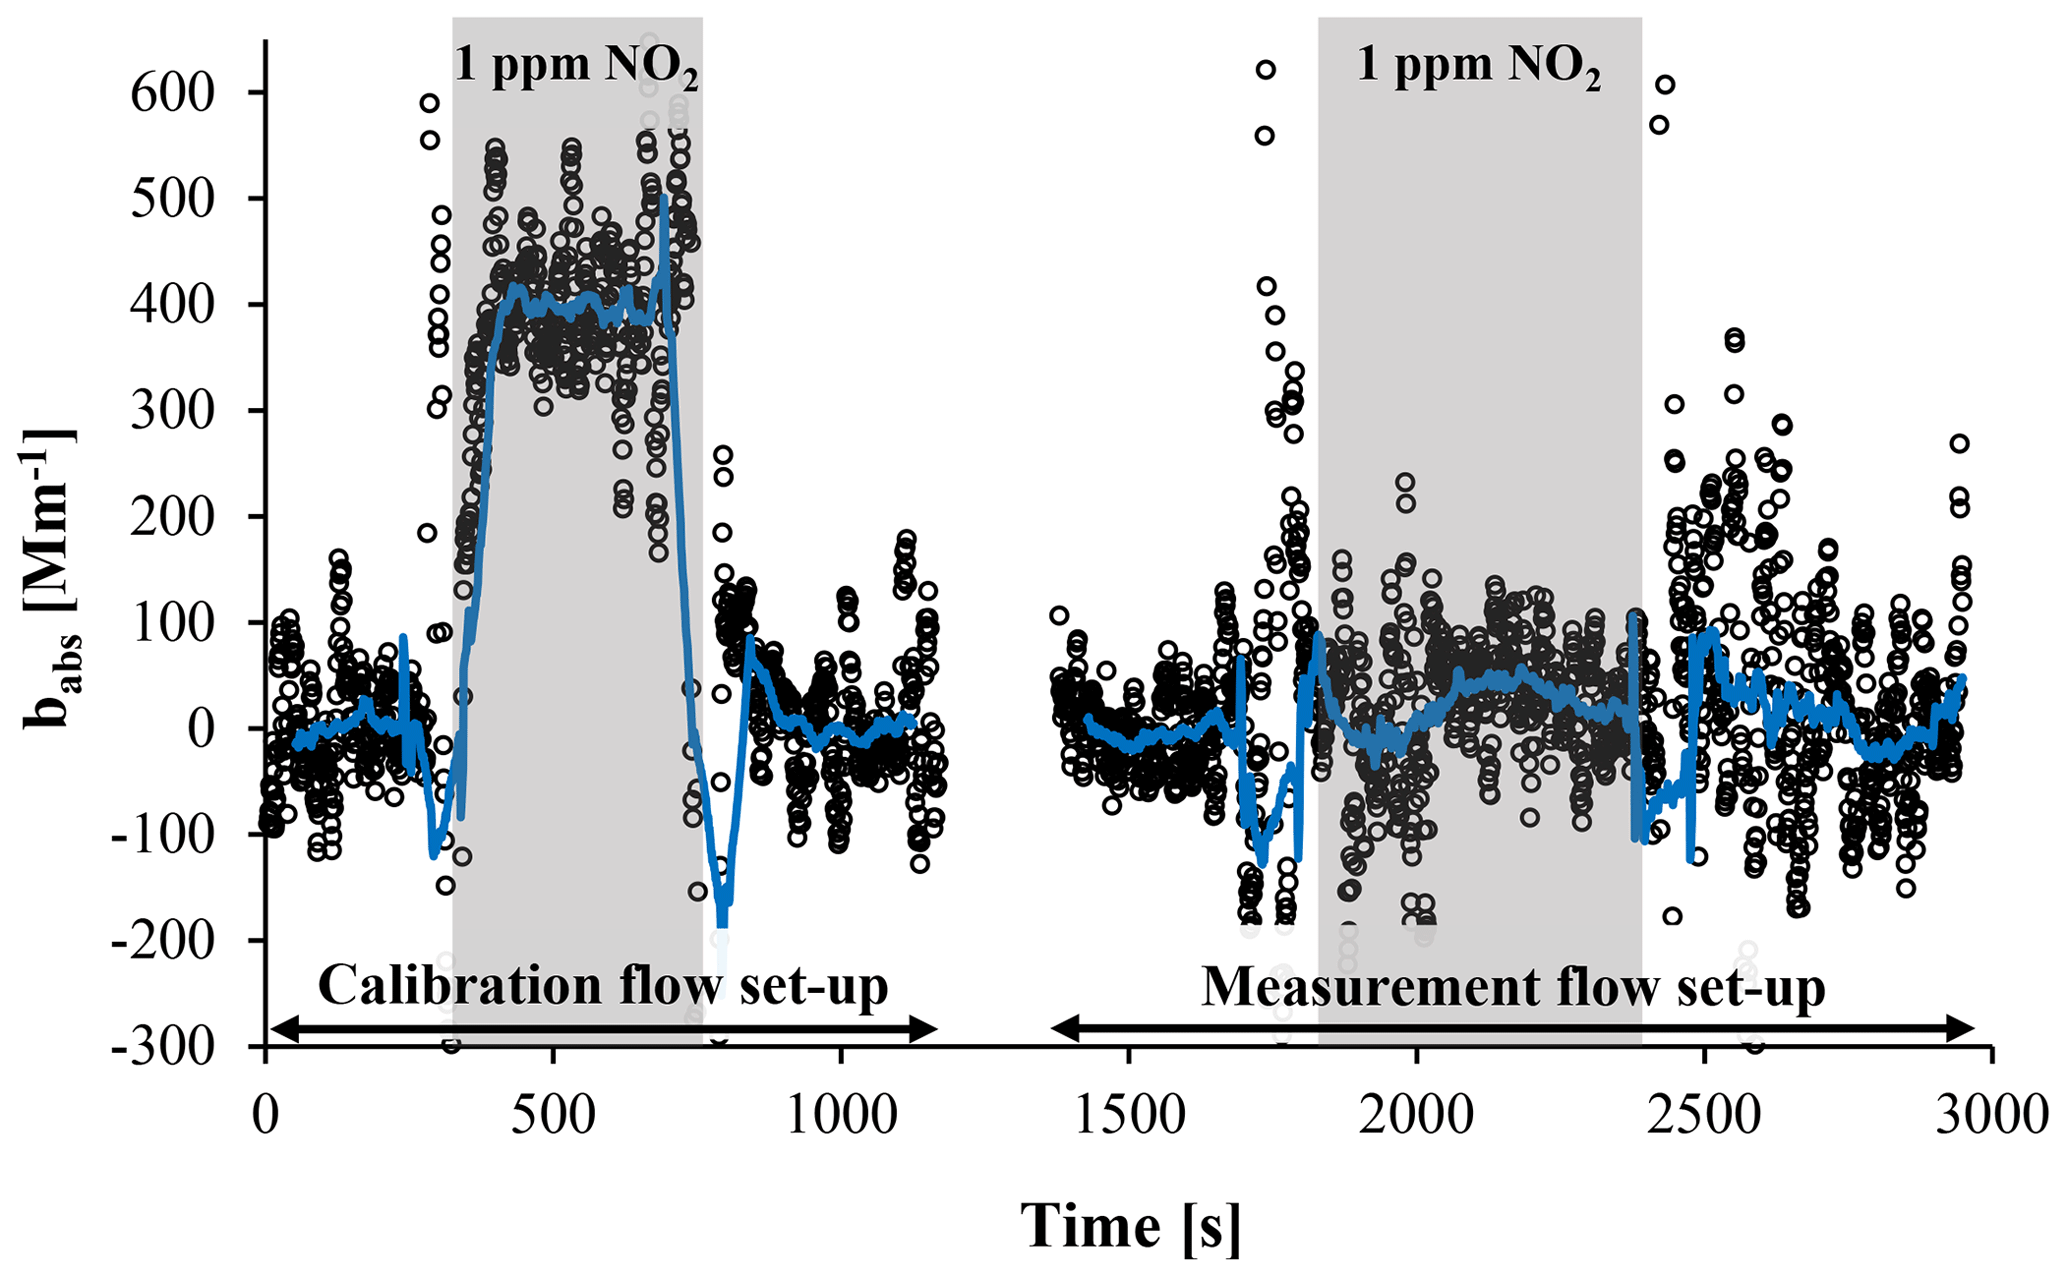
Figure 10Demonstration of the relative nature of the MSPTI measurement. Circles represent averages over 10 s, whereas the blue line is the 100 s moving average. In the measurement flow configuration, NO2 is present in both sample and reference chambers and no longer contributes to the MSPTI signal.
Besides the ability to perform a primary calibration of the MSPTI with NO2, a further advantage of the instrumental design over existing PTI instruments is the ability to directly differentiate aerosol absorption from absorption from gaseous species during a standard measurement. This removes the need to intermittently determine the absorption background from gases using filtered measurements as per other techniques. In the standard measurement configuration, aerosol enters the sample chamber, passes an absolute filter and then flows through the reference chamber. The absolute filter traps the aerosol particles but transmits the gas, which then flows through the reference chambers. To demonstrate the relative nature of PTI measurements and the advantages of the MSPTI set-up in separating gas and aerosol absorption, comparison measurements of NO2 were performed using the calibration and standard flow set-ups. The results of these measurements for a flow rate of 0.5 L min−1 are presented in Fig. 10. For the calibration flow set-up, the NO2 is only present in the sample cell, and a PTI signal is measured. In the standard flow set-up, NO2 is present at the same concentration in the sample and reference cells, and no signal is observed within experimental error. Thus, with the new MSPTI configuration, aerosol absorption can be measured independent of gas absorption, which reduces possible artefacts in the determination of aerosol absorption in ambient measurements. This is a significant advantage over previous PTI designs, which rely on either periodic measurements of the background gas absorption, NO2 denuders or the measurements of other sensors to determine the aerosol absorption from the total absorption.
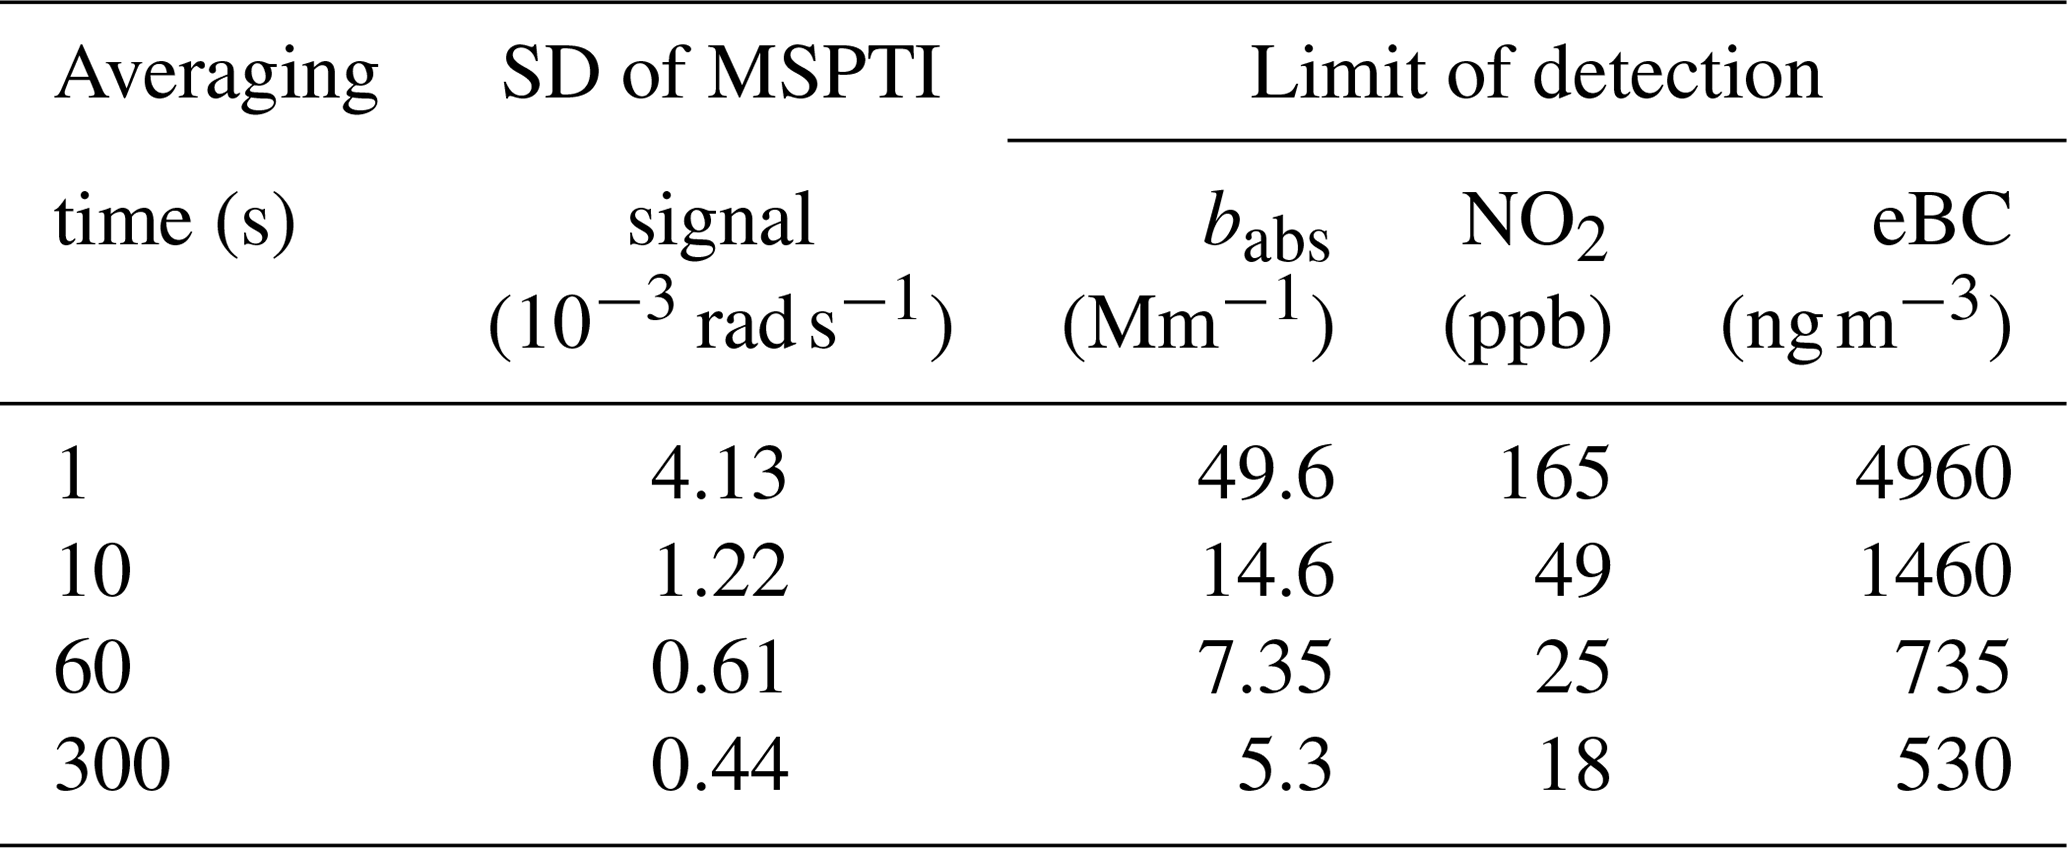
The detection limit dependence on the averaging time was determined from a baseline measurement with no flow, during which no effort was made to control noise in the laboratory. The raw data from the baseline measurement show a linear drift in apparent absorption, most probably due to a slow change in splitting ratio of the beam splitter over time, causing a change in the laser power in both arms of the interferometer and, therefore, the absorption by optical elements in the each arm. The exact source of the drift is yet to be confirmed as it is complicated by positive and negative contributions by optics in either interferometer arm. The drift, however, could be easily corrected by subtracting a linear fit from the data. The data and linear fit for evaluation of the drift are shown in the Supplement. In standard measurements, the baseline is determined at regular intervals with filtered air to account for such baseline drifts. The experimentally measured standard deviations (SDs) for the raw and drift corrected data are shown in Fig. 11. The Allan deviation of the same data is provided for comparison purposes in Fig. S8. The SD of the raw data is dominated by the observed drift and improves very little for longer averaging durations. The SD of the drift-corrected data reduces at a rate of approximately t−½ up to an averaging time of 60 s, after which the rate of reduction reduces. For the calculation of the detection limits of the instrument (1σ), SDs for averaging times of 1, 10, 60 and 300 s were compared to the NO2 calibration measurement in Fig. 9. Baseline drift-corrected detection limits of our current instrument are summarised in terms of MSPTI signal (rad s−1), babs, NO2 concentration and eBC (MAC = 10 m2 g−1) for selected integration times in Table 1.
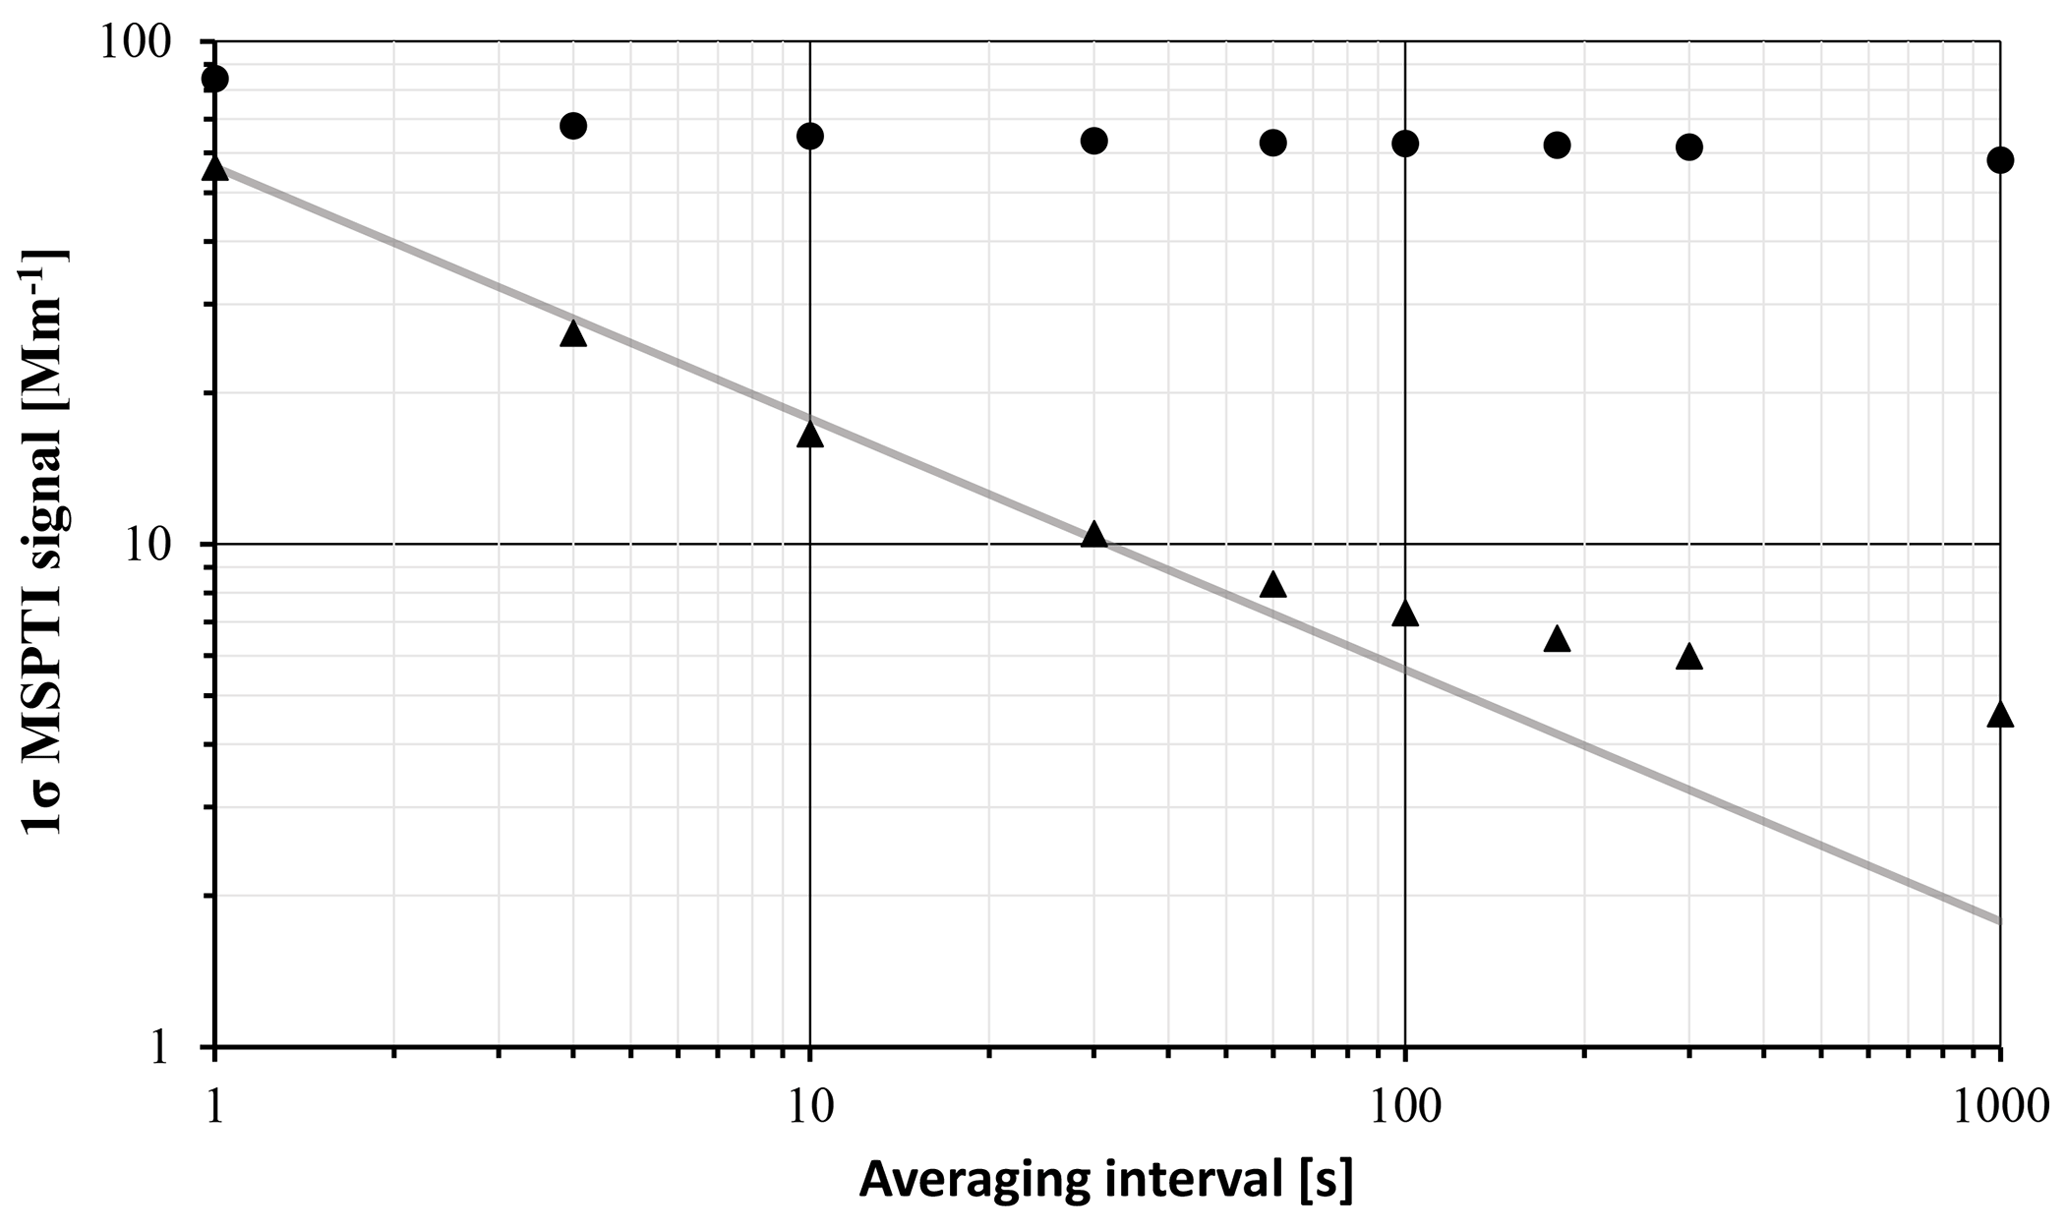
Figure 11The SD of the baseline for drift-uncorrected (filled circles) and drift-corrected data (filled triangles). The drift-corrected data approximately follow a square root dependence (grey line) on the averaging interval up to an averaging interval of 60 s. Note the logarithmic scales.
Table 1Limits of detection for the MSPTI for different integration times. Measured phase shifts were converted into absorption coefficients using the conversion factor from the NO2 calibration presented in Fig. 9. The eBC concentration was calculated with a MAC value of 10 m2 g−1. This is lower than the value of 12 m2 g−1 obtained by transferring the measurements of ambient BC particles by Zanatta et al. (2016) to 532 nm using an Angström exponent of 1. Electrical-discharge-generated BC has been shown to have a MAC value lower than that of ambient soot (Schnaiter et al., 2003). As the MAC of the BC from the employed BC generator has not been measured directly, the limits of detection for eBC should be taken as a reference only. Note: ppb – parts per billion.
Initial measurements of aerosols were performed by sampling from a reservoir pre-filled with graphitic soot produced using a spark discharge source and diluted with laboratory air. The aerosol was sampled from the volume at a rate of 0.25 L min−1, through the PTI in the measurement flow configuration, using a pump connected to the outlet of the interferometer flow system. Comparison measurements were made using an Aethalometer AE33 sampling at 2 L min−1, which was connected separately to the sampling volume in order to reduce the contribution from the AE33 pump to the MSPTI signal noise. The AE33 reported loading corrected values. eBC measured at λ = 520 nm were converted into absorption coefficients according to the following:
where MACinstr = 13.14 m2 g−1 and Cinstr = 1.57 are the MAC and filter multiple-scattering enhancement parameter values used by the instruments' firmware, respectively. This conversion was corrected with the updated value of Cnew = 2.6, value from (WMO, 2016, normalised as in Drinovec et al., 2015).

Figure 12Comparison of measured light absorption for the MSPTI (blue) and AE33 (green) sampling from a common pre-prepared aerosol reservoir filled with graphitic soot prepared with an electrical discharge source. Data points represent a 9 s running average of 1 s data. Black arrows indicate automated filter changes for the AE33, and the red arrow indicates a suspected mode hop by the MSPTI laser.
The MSPTI signal was converted to babs, using the sensitivity calculated from the NO2 calibration (vide supra). The results of a typical measurement are presented in Fig. 12. The AE33 signal shows strong loading artefacts at high soot concentrations, which are not completely corrected by the internal correction algorithm (Drinovec et al., 2015). Also seen are the automated filter changes of the AE33, indicated by black arrows, which are triggered when the light extinction through the sample spot exceeds a pre-specified value. A discontinuity can be seen at around 15:15 in the MSPTI data, indicated by a red arrow, which is assigned to a laser mode hop. This leads to a change in the background level and, as such, can be corrected using regular background measurements. This artefact has been left uncorrected in order to show the effects of laser noise in the measurement. Improvements to the laser cooling system will be made in future development of the interferometer in order to stabilise the temperature and, thus, lasing mode of the diode-pumped solid-state (DPSS) laser.
The noise visible in the MSPTI signal can be attributed to several sources. Large outliers in the MSPTI signal are attributed to mechanical shocks that are transported to the interferometer. Other obvious outliers can be assigned to imperfect isolation of the interferometer to external acoustic noise sources (pumps and discussions in the laboratory) and laser instability. Additionally, noise from the pump in the AE33 is coupled through the sampling reservoir and adds to the baseline noise of the PTI measurement. This can be seen at 17:30 local time (LT) in the measurement data when an absolute filter was inserted into the sampling line to determine the background signal level, thus better isolating the MSPTI from noise transported from the sampling volume through the sampling line. The SD of the data collected with the filter is a factor of 6.5 lower than the aerosol measurement and shows the need for an improvement in decoupling the MSPTI from external noise sources via the sampling line. For this measurement with the associated noise sources, the MSPTI instrument was determined to have a higher detection limit (1σ) of approximately babs = 17 Mm−1 (eBC ∼ 1.7 µg m−3) for an averaging period of 10 s, which agrees well with the values determined for the measurements of NO2 summarised in Table 1.
Future improvements to the MSPTI set-up are primarily targeted at the reduction in noise in the measurements. The laboratory tests show that an improvement in the isolation of the interferometer is required when operating in noisy environments. New outer and inner enclosures for the MSPTI are currently being evaluated for this purpose. Improvements to the data analysis system to reduce the detection bandwidth and thus improve noise rejection are ongoing and are expected to bring a significant improvement in the detection limit. First measurements with 400 mW (200 mW per interferometer arm) laser power show a two-fold signal increase with no associated increase in noise. This implies that the system is interferometer noise limited, and a further increase in the laser power would lead to an equal improvement in the detection limit. Potential improvement is foreseen by employing a balanced photodiode detector and amplifying the difference signal to better employ the full range of the analogue-to-digital converter.
We have demonstrated a new PTI prototype utilising only a single laser with a significantly improved ease of alignment compared to existing PTI instruments. The MSPTI design also allows for the direct measurement of aerosol absorption in the presence of absorbing gases, which would normally require a complicated correction, a scrubber or secondary measurement of the gas absorption for other in situ aerosol absorption measurements.
With a detection limit of aerosol absorption of ∼ 10–20 Mm−1 for an integration time of 10 s, the MSPTI set-up does not currently improve upon the best reported detection limits for PTI measurements of aerosols (see e.g. Sedlacek and Lee, 2007) but simplifies its operational use in the field. Improvements to the isolation of the interferometer and data handling and analysis are expected to reduce the detection limit to the point where unattended field measurements of ambient aerosol concentrations are possible.
The improvement in the handling and alignment of the interferometer is significant and of great advantage when operated by non-experts in field measurements. Furthermore, the ability to directly measure aerosol absorption without bias from light-absorbing gaseous species further reduces the potential for measurement artefacts due to concentration changes in these species. It also opens up the potential to employ the MSPTI in emission measurements, where the concentrations of absorbing gaseous species can be significant and fluctuate rapidly.
Data are available upon request.
The supplement related to this article is available online at: https://doi.org/10.5194/amt-13-7097-2020-supplement.
BV, JR, PS and EW designed and developed the MSPTI. BV and JR carried out the experiments and analysed the data. LD and GM provided input into the experimental design. BV wrote the paper with JR, EW, LD and GM providing valuable additions.
The authors declare that they have no conflict of interest. Luka Drinovec and Griša Močnik are employed at the potential future manufacturers of the instrument.
The research leading to these results has received funding from the Swiss National Science Foundation (SNSF; grant no. 200021_172649), the 16ENV02 Black Carbon project of the European Union through the European Metrology Programme for Innovation and Research (EMPIR) and the EUROSTARS (IMALA (grant no. 11386)). We thank Jeonghoon Lee for his help and encouragement in the initial stages of the project, Martin Gysel (PSI) for the use of the AE33, Christoph Hüglin (EMPA) for the loan of the NO2 monitor, Arthur Sedlacek, Martin Krejci and Herbert Looser for fruitful discussions, Staffan Sjögren for the initial work on evaluating PTI configurations, and André Meier, Manuela Wipf, Daniel Egli, Patrick Specht for their assistance and technical expertise. We thank AMES d.o.o. for the technical support.
A patent application was filed for the described technology.
This research has been supported by the Swiss National Science Foundation (grant no. 200021_172649), the European Metrology Programme for Innovation and Research (EMPIR Black Carbon 16ENV02), and the EUROSTARS programme (IMALA (grant no. 11386)).
This paper was edited by Charles Brock and reviewed by three anonymous referees.
Arnott, W. P., Moosmüller, H., and Walker, J. W.: Nitrogen dioxide and kerosene-flame soot calibration of photoacoustic instruments for measurements of light absorption by aerosols, Rev. Sci. Instrum., 71, 4545–4552, https://doi.org/10.1063/1.1322585, 2000.
Arnott, W. P., Moosmüller, H., Sheridan, P. J., Ogren, J. A., Raspet, R., Slaton, W. V., Hand, J. L., Kreidenweis, S. M., and Collett, J. L.: Photoacoustic and filter-based ambient aerosol light absorption measurements: Instrument comparisons and the role of relative humidity, J. Geophys. Res., 108, 4034, https://doi.org/10.1029/2002jd002165, 2003.
Arnott, W. P., Hamasha, K., Moosmüller, H., Sheridan, P. J., and Ogren, J. A.: Towards aerosol light-absorption measurements with a 7-wavelength Aethalometer: Evaluation with a photoacoustic instrument and 3-wavelength Nephelometer, Aerosol Sci. Tech., 39, 17–29, https://doi.org/10.1080/027868290901972, 2005.
Backman, J., Schmeisser, L., Virkkula, A., Ogren, J. A., Asmi, E., Starkweather, S., Sharma, S., Eleftheriadis, K., Uttal, T., Jefferson, A., Bergin, M., Makshtas, A., Tunved, P., and Fiebig, M.: On Aethalometer measurement uncertainties and an instrument correction factor for the Arctic, Atmos. Meas. Tech., 10, 5039–5062, https://doi.org/10.5194/amt-10-5039-2017, 2017.
Bond, T. C., Anderson, T. L., and Campbell, D.: Calibration and intercomparison of filter-based measurements of visible light absorption by aerosols, Aerosol Sci. Tech., 30, 582–600, https://doi.org/10.1080/027868299304435, 1999.
Bond, T. C., Doherty, S. J., Fahey, D. W., Forster, P. M., Berntsen, T., DeAngelo, B. J., Flanner, M. G., Ghan, S., Karcher, B., Koch, D., Kinne, S., Kondo, Y., Quinn, P. K., Sarofim, M. C., Schultz, M. G., Schulz, M., Venkataraman, C., Zhang, H., Zhang, S., Bellouin, N., Guttikunda, S. K., Hopke, P. K., Jacobson, M. Z., Kaiser, J. W., Klimont, Z., Lohmann, U., Schwarz, J. P., Shindell, D., Storelvmo, T., Warren, S. G., and Zender, C. S.: Bounding the role of black carbon in the climate system: A scientific assessment, J. Geophys. Res.-Atmos., 118, 5380–5552, https://doi.org/10.1002/jgrd.50171, 2013.
Collaud Coen, M., Weingartner, E., Apituley, A., Ceburnis, D., Fierz-Schmidhauser, R., Flentje, H., Henzing, J. S., Jennings, S. G., Moerman, M., Petzold, A., Schmid, O., and Baltensperger, U.: Minimizing light absorption measurement artifacts of the Aethalometer: evaluation of five correction algorithms, Atmos. Meas. Tech., 3, 457–474, https://doi.org/10.5194/amt-3-457-2010, 2010.
Davies, N. W., Cotterell, M. I., Fox, C., Szpek, K., Haywood, J. M., and Langridge, J. M.: On the accuracy of aerosol photoacoustic spectrometer calibrations using absorption by ozone, Atmos. Meas. Tech., 11, 2313–2324, https://doi.org/10.5194/amt-11-2313-2018, 2018.
Davis, C. C. and Petuchowski, S. J.: Phase fluctuation optical heterodyne spectroscopy of gases, Appl. Optics, 20, 2539–2554, https://doi.org/10.1364/ao.20.002539, 1981.
Drinovec, L., Močnik, G., Zotter, P., Prévôt, A. S. H., Ruckstuhl, C., Coz, E., Rupakheti, M., Sciare, J., Müller, T., Wiedensohler, A., and Hansen, A. D. A.: The ”dual-spot” Aethalometer: an improved measurement of aerosol black carbon with real-time loading compensation, Atmos. Meas. Tech., 8, 1965–1979, https://doi.org/10.5194/amt-8-1965-2015, 2015.
Drinovec, L., Gregorič, A., Zotter, P., Wolf, R., Bruns, E. A., Prévôt, A. S. H., Petit, J.-E., Favez, O., Sciare, J., Arnold, I. J., Chakrabarty, R. K., Moosmüller, H., Filep, A., and Močnik, G.: The filter-loading effect by ambient aerosols in filter absorption photometers depends on the coating of the sampled particles, Atmos. Meas. Tech., 10, 1043–1059, https://doi.org/10.5194/amt-10-1043-2017, 2017.
Fluckiger, D. U., Lin, H. B., and Marlow, W. H.: Composition measurement of aerosols of submicrometer particles by phase fluctuation absorption-spectroscopy, Appl. Optics, 24, 1668–1681, https://doi.org/10.1364/AO.24.001668, 1985.
Fulghum, S. F. and Tilleman, M. M.: Interferometric calorimeter for the measurement of water-vapor absorption, J. Opt. Soc. Am., 8, 2401–2413, https://doi.org/10.1364/josab.8.002401, 1991.
Janssen, N. A., Gerlofs-Nijland, M. E., Lanki, T., Salonen, R. O., Cassee, F., Hoek, G., Fischer, P., Brunekreef, B., and Krzyzanowski, M.: Health effects of black carbon, World Health Organization, Copenhagen, Denmark, available at: https://www.euro.who.int/__data/assets/pdf_file/0004/162535/e96541.pdf (last access: 16 June 2020), 2012.
Janssen, N. A. H., Hoek, G., Simic-Lawson, M., Fischer, P., van Bree, L., ten Brink, H., Keuken, M., Atkinson, R. W., Anderson, H. R., Brunekreef, B., and Cassee, F. R.: Black carbon as an additional indicator of the adverse health effects of airborne particles compared with PM10 and PM2.5, Environ. Health Persp., 119, 1691–1699, https://doi.org/10.1289/ehp.1003369, 2011.
Keller-Rudek, H., Moortgat, G. K., Sander, R., and Sörensen, R.: The MPI-Mainz UV/VIS Spectral Atlas of Gaseous Molecules of Atmospheric Interest, Earth Syst. Sci. Data, 5, 365–373, https://doi.org/10.5194/essd-5-365-2013, 2013.
Lack, D. A., Lovejoy, E. R., Baynard, T., Pettersson, A., and Ravishankara, A. R.: Aerosol absorption measurement using photoacoustic spectroscopy: Sensitivity, calibration, and uncertainty developments, Aerosol Sci. Tech., 40, 697–708, https://doi.org/10.1080/02786820600803917, 2006.
Lack, D. A., Cappa, C. D., Covert, D. S., Baynard, T., Massoli, P., Sierau, B., Bates, T. S., Quinn, P. K., Lovejoy, E. R., and Ravishankara, A. R.: Bias in filter-based aerosol light absorption measurements due to organic aerosol loading: Evidence from ambient measurements, Aerosol Sci. Tech., 42, 1033–1041, https://doi.org/10.1080/02786820802389277, 2008.
Lack, D. A., Richardson, M. S., Law, D., Langridge, J. M., Cappa, C. D., McLaughlin, R. J., and Murphy, D. M.: Aircraft instrument for comprehensive characterization of aerosol optical properties, part 2: Black and brown carbon absorption and absorption enhancement measured with photo acoustic spectroscopy, Aerosol Sci. Tech., 46, 555–568, https://doi.org/10.1080/02786826.2011.645955, 2012.
Lack, D. A., Moosmueller, H., McMeeking, G. R., Chakrabarty, R. K., and Baumgardner, D.: Characterizing elemental, equivalent black, and refractory black carbon aerosol particles: A review of techniques, their limitations and uncertainties, Anal. Bioanal. Chem., 406, 99–122, https://doi.org/10.1007/s00216-013-7402-3, 2014.
Langridge, J. M., Richardson, M. S., Lack, D. A., Brock, C. A., and Murphy, D. M.: Limitations of the photoacoustic technique for aerosol absorption measurement at high relative humidity, Aerosol Sci. Tech., 47, 1163–1173, https://doi.org/10.1080/02786826.2013.827324, 2013.
Lee, J.: Performance test of MicroAeth® AE51 at concentrations lower than 2 µg∕m3 in indoor laboratory, Appl. Sci., 9, 2766, https://doi.org/10.3390/app9132766, 2019.
Lee, J. and Moosmüller, H.: Measurement of light absorbing aerosols with folded-Jamin photothermal interferometry, Sensors, 20, 2615, https://doi.org/10.3390/s20092615, 2020.
Lelieveld, J., Klingmuller, K., Pozzer, A., Poschl, U., Fnais, M., Daiber, A., and Munzel, T.: Cardiovascular disease burden from ambient air pollution in Europe reassessed using novel hazard ratio functions, Eur. Heart J., 40, 1590–1596, https://doi.org/10.1093/eurheartj/ehz135, 2019.
Lin, H. B. and Campillo, A. J.: Photothermal aerosol absorption-spectroscopy, Appl. Optics, 24, 422–433, https://doi.org/10.1364/AO.24.000422, 1985.
Linke, C., Ibrahim, I., Schleicher, N., Hitzenberger, R., Andreae, M. O., Leisner, T., and Schnaiter, M.: A novel single-cavity three-wavelength photoacoustic spectrometer for atmospheric aerosol research, Atmos. Meas. Tech., 9, 5331–5346, https://doi.org/10.5194/amt-9-5331-2016, 2016.
Mazzoni, D. L. and Davis, C. C.: Trace detection of hydrazines by optical homodyne interferometry, Appl. Optics, 30, 756–764, https://doi.org/10.1364/AO.30.000756, 1991.
Monson, B., Vyas, R., and Gupta, R.: Pulsed and CW photothermal phase shift spectroscopy in a fluid medium: Theory, Appl. Optics, 28, 2554–2561, https://doi.org/10.1364/AO.28.002554, 1989.
Moosmüller, H. and Arnott, W. P.: Folded Jamin interferometer: A stable instrument for refractive-index measurements, Opt. Lett., 21, 438–440, https://doi.org/10.1364/ol.21.000438, 1996.
Moosmüller, H., Arnott, W. P., and Rogers, C. F.: Methods for real time, in situ measurement of aerosol light absorption, JAPCA J. Air Waste Ma., 47, 157–166, https://doi.org/10.1080/10473289.1997.10464430, 1997.
Moosmüller, H., Chakrabarty, R. K., and Arnott, W. P.: Aerosol light absorption and its measurement: A review, J. Quant. Spectrosc. Ra., 110, 844–878, https://doi.org/10.1016/j.jqsrt.2009.02.035, 2009.
Murphy, D. M.: The effect of water evaporation on photoacoustic signals in transition and molecular flow, Aerosol Sci. Tech., 43, 356–363, https://doi.org/10.1080/02786820802657392, 2009.
Myhre, G., Shindell, D., Bréon, F.-M., Collins, W., Fuglestvedt, J., Huang, J., Koch, D., Lamarque, J.-F., Lee, D., Mendoza, B., Nakajima, T., Robock, A., Stephens, G., Takemura, T., and Zhang, H.: Anthropogenic and natural radiative forcing, in: Climate change 2013: The physical science basis. Contribution of working group I to the fifth assessment report of the Intergovernmental Panel on Climate Change, Cambridge University Press, Cambridge, UK and New York, NY, USA, 2013.
Nakayama, T., Suzuki, H., Kagamitani, S., Ikeda, Y., Uchiyama, A., and Matsumi, Y.: Characterization of a three wavelength Photoacoustic Soot Spectrometer (PASS-3) and a Photoacoustic Extinctiometer (PAX), J. Meteorol. Soc. Jpn., 93, 285–308, https://doi.org/10.2151/jmsj.2015-016, 2015.
Ogren, J. A., Wendell, J., Andrews, E., and Sheridan, P. J.: Continuous light absorption photometer for long-term studies, Atmos. Meas. Tech., 10, 4805–4818, https://doi.org/10.5194/amt-10-4805-2017, 2017.
Petzold, A., Kramer, H., and Schönlinner, M.: Continuous measurement of atmospheric black carbon using a multi-angle absorption photometer, Environ. Sci. Pollut. R., 9, 78–82, 2002.
Petzold, A., Ogren, J. A., Fiebig, M., Laj, P., Li, S.-M., Baltensperger, U., Holzer-Popp, T., Kinne, S., Pappalardo, G., Sugimoto, N., Wehrli, C., Wiedensohler, A., and Zhang, X.-Y.: Recommendations for reporting ”black carbon” measurements, Atmos. Chem. Phys., 13, 8365–8379, https://doi.org/10.5194/acp-13-8365-2013, 2013.
Raspet, R., Slaton, W. V., Arnott, W. P., and Moosmüller, H.: Evaporation-Condensation Effects on Resonant Photoacoustics of Volatile Aerosols, J. Atmos. Ocean. Tech., 20, 685–695, https://doi.org/10.1175/1520-0426(2003)20<685:ECEORP>2.0.CO;2, 2003.
Schnaiter, M., Horvath, H., Mohler, O., Naumann, K. H., Saathoff, H., and Schock, O. W.: UV-VIS-NIR spectral optical properties of soot and soot-containing aerosols, J. Aerosol Sci., 34, 1421–1444, https://doi.org/10.1016/S0021-8502(03)00361-6, 2003.
Schnaiter, M., Schmid, O., Petzold, A., Fritzsche, L., Klein, K. F., Andreae, M. O., Helas, G., Thielmann, A., Gimmler, M., Mohler, O., Linke, C., and Schurath, U.: Measurement of wavelength-resolved light absorption by aerosols utilizing a UV-VIS extinction cell, Aerosol Sci. Tech., 39, 249–260, https://doi.org/10.1080/027868290925958, 2005.
Sedlacek, A. and Lee, J.: Photothermal interferometric aerosol absorption spectrometry, Aerosol Sci. Tech., 41, 1089–1101, https://doi.org/10.1080/02786820701697812, 2007.
Sedlacek III., A. J.: Real-time detection of ambient aerosols using photothermal interferometry: Folded Jamin interferometer, Rev. Sci. Instrum., 77, 064903, https://doi.org/10.1063/1.2205623, 2006.
Springston, S. R. and Sedlacek, A. J.: Noise characteristics of an instrumental particle absorbance technique, Aerosol Sci. Tech., 41, 1110–1116, https://doi.org/10.1080/02786820701777457, 2007.
Vandaele, A. C., Hermans, C., Fally, S., Carleer, M., Colin, R., Mérienne, M. F., Jenouvrier, A., and Coquart, B.: High-resolution fourier transform measurement of the NO2 visible and near-infrared absorption cross sections: Temperature and pressure effects, J. Geophys. Res.-Atmos., 107, ACH 3-1–ACH 3-12, https://doi.org/10.1029/2001JD000971, 2002.
Weingartner, E., Saathoff, H., Schnaiter, M., Streit, N., Bitnar, B., and Baltensperger, U.: Absorption of light by soot particles: Determination of the absorption coefficient by means of Aethalometers, J. Aerosol Sci., 34, 1445–1463, https://doi.org/10.1016/S0021-8502(03)00359-8, 2003.
WHO: 7 million premature deaths annually linked to air pollution, available at: http://www.who.int/mediacentre/news/releases/2014/air-pollution/en/ (last access: 18 June 2020), 2014.
WMO 2016: WMO/GAW aerosol measurement procedures, guidelines, and recommendations, 2nd edn., World Meteorological Organization, GAW Report No. 227, 93 pp., available at: https://library.wmo.int/opac/doc_num.php?explnum_id=3073 (last access: 16 June 2020), 2016.
Zanatta, M., Gysel, M., Bukowiecki, N., Muller, T., Weingartner, E., Areskoug, H., Fiebig, M., Yttri, K. E., Mihalopoulos, N., Kouvarakis, G., Beddows, D., Harrison, R. M., Cavalli, F., Putaud, J. P., Spindler, G., Wiedensohler, A., Alastuey, A., Pandolfi, M., Sellegri, K., Swietlicki, E., Jaffrezo, J. L., Baltensperger, U., and Laj, P.: A European aerosol phenomenology-5: Climatology of black carbon optical properties at 9 regional background sites across Europe, Atmos. Environ., 145, 346–364, https://doi.org/10.1016/j.atmosenv.2016.09.035, 2016.