the Creative Commons Attribution 4.0 License.
the Creative Commons Attribution 4.0 License.
 | 20 Feb 2020
A new instrument for time-resolved measurement of HO2 radicals
Thomas H. Speak
Mark A. Blitz
Daniel Stone
OH and HO2 radicals are closely coupled in the atmospheric oxidation and combustion of volatile organic compounds (VOCs). Simultaneous measurement of HO2 yields and OH kinetics can provide the ability to assign site-specific rate coefficients that are important for understanding the oxidation mechanisms of VOCs. By coupling a fluorescence assay by gaseous expansion (FAGE) laser-induced fluorescence (LIF) detection system for OH and HO2 with a high-pressure laser flash photolysis system, it is possible to accurately measure OH pseudo-1st-order loss processes up to ∼100 000 s−1 and to determine HO2 yields via time-resolved measurements. This time resolution allows discrimination between primary HO2 from the target reaction and secondary production from side reactions. The apparatus was characterized by measuring yields from the reactions of OH with H2O2 (1:1 link between OH and HO2), with C2H4∕O2 (where secondary chemistry can generate HO2), with C2H6∕O2 (where there should be zero HO2 yield), and with CH3OH∕O2 (where there is a well-defined HO2 yield).
As an application of the new instrument, the reaction of OH with n-butanol has been studied at 293 and 616 K. The bimolecular rate coefficient at 293 K, cm3 molec.−1 s−1, is in good agreement with recent literature, verifying that this instrument can measure accurate OH kinetics. At 616 K the regeneration of OH in the absence of O2, from the decomposition of the β-hydroxy radical, was observed, which allowed the determination of the fraction of OH reacting at the β site (0.23±0.04). Direct observation of the HO2 product in the presence of oxygen has allowed the assignment of the α-branching fractions (0.57±0.06) at 293 K and (0.54±0.04) at 616 K, again in good agreement with recent literature; branching ratios are key to modelling the ignition delay times of this potential “drop-in” biofuel.
- Article
(1721 KB) - Full-text XML
- BibTeX
- EndNote


In the atmosphere, HO2 and OH radicals () are closely coupled via several reactions as shown in Scheme 1. The short lifetimes of HOx radicals mean that concentrations are determined by chemical production and removal and not by transport processes, making them ideal candidates as test species for our understanding of atmospheric chemical mechanisms (Stone et al., 2012; Monks, 2005; Stockwell et al., 2012).
In Scheme 1, the reaction of alkoxy radicals with molecular oxygen is a major route to HO2 formation; however, this is not the only significant HO2 formation process; for example, in the atmospheric oxidation of n-butanol, HO2 can be formed via two different mechanisms. Abstraction by OH at the α position leads to a radical which reacts with oxygen to directly produce HO2 (Reactions R1a, R2) whereas abstraction at other sites leads to alkylperoxy radical (C4H9O2) formation with varying fractions of the RO2 forming alkoxy radicals, and subsequently HO2 (McGillen et al., 2013) on a longer timescale; see Scheme 2.
The fraction of alkoxy radicals formed depends on the mechanism of RO2 removal (reaction with NO or self- or cross-reactions) and the yield of HO2 from the alkoxy radical depends on the competition between decomposition, isomerization, and reaction with O2, which in turn will depend on the structure of the alkoxy radical, temperature, pressure, and concentration of oxygen (Orlando et al., 2003). Therefore, in order to determine the HO2 yield from the OH-initiated oxidation of compounds such as n-butanol, it is important to have a selective, sensitive, and time-resolved method of HO2 detection.
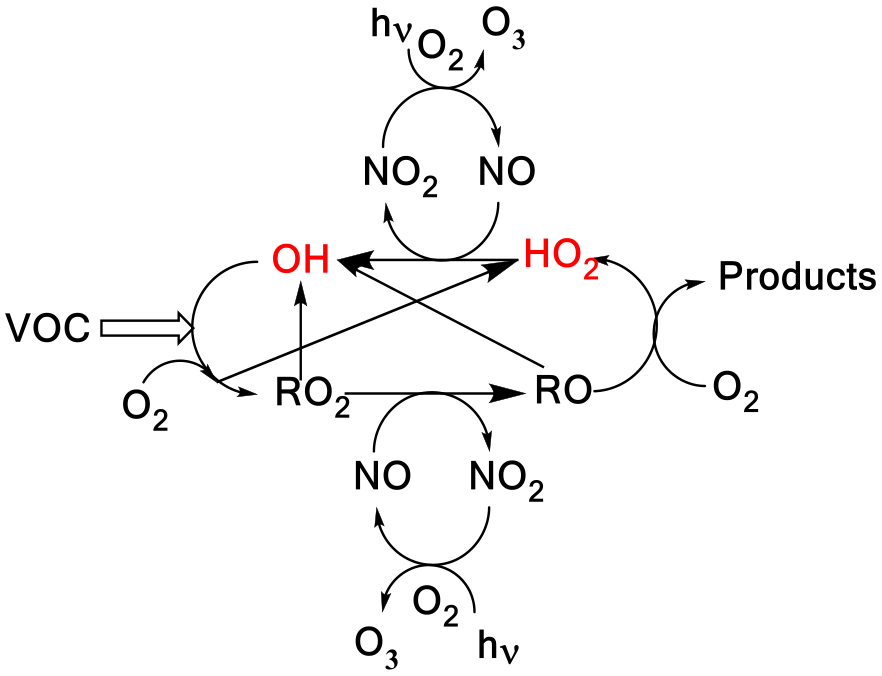
Scheme 1A simplified tropospheric HOx cycle showing the importance of these short-lived radical species to both the chemical removal of VOCs and the formation of ozone.

Scheme 2The potential sites for OH abstractions in the oxidation of n-butanol. Of particular importance to low-temperature combustion is the ratio of α to β branching fractions where α attack leads to chain inhibition and β to chain propagation.
The importance of HO2 chemistry is not limited to atmospheric processes; HO2 is a key intermediate in low-temperature (500–1000 K) combustion processes, particularly those involving oxygenated fuels (Zador et al., 2011). The mechanisms of low-temperature combustion are of particular interest in the development of new engine technologies such as reactively controlled compression ignition (RCCI) (Reitz and Duraisamy, 2015) and are closely linked to atmospheric oxidation mechanisms. Monitoring HO2 concentrations under the elevated temperatures and high pressures of combustion processes is therefore also of interest. In low-temperature combustion, HO2 formation is a chain-inhibition process, with OH reformation a chain-propagating or chain-branching process. The ratio of chain-branching to chain-inhibition processes is often the controlling factor in modelling ignition delay times (Agbro et al., 2017). High temperatures and concentrations of oxygen may be required to convert atmospheric processes, which take several tens of seconds at ambient temperatures (and hence may be influenced by surface chemistry or secondary reactions) to the milli- or microsecond timescale where they can be studied by flash photolysis techniques without such interferences (Medeiros et al., 2018).
Direct measurements of HO2 rely on absorption techniques, and kinetic information on HO2 reactions has been determined mainly using absorption spectroscopy. This can be achieved with either conventional absorption techniques, often in the UV (including multipass optics to enhance the pathlength), or in the IR with cavity ring-down spectroscopy (CRDS) (Assaf et al., 2018; Onel et al., 2017). However, the HO2 UV absorption spectrum (200–260 nm) is broad and featureless (Crowley et al., 1991), and as such overlaps with the UV absorptions of many other species present in atmospheric degradation pathways or combustion systems (particularly H2O2 and RO2). To utilize the selectivity of the structured IR spectra, absorption methods have been developed in both the mid- and near-IR (NIR) (Taatjes and Oh, 1997). Mid-IR absorption features for HO2 provide sufficient absorption cross sections for study (Jemialade and Thrush, 1990) but suffer from severe pressure broadening, reducing sensitivity under the conditions relevant to atmospheric and combustion systems (Thiebaud and Fittschen, 2006). Detection in the NIR has similar advantages in terms of a structured spectrum providing greater selectivity; the weaker absorption cross sections are compensated for by the higher powers and ease of use of NIR laser sources (Gianella et al., 2016). However, pressure broadening and interference from H2O absorptions can make these measurements difficult at even low concentrations of water (1014 molec. cm−3).
In the atmosphere (Stone et al., 2012) and in chamber studies (Glowacki et al., 2007), HO2 is detected using a sensitive but indirect method via conversion to OH, with detection of OH via laser-induced fluorescence (LIF) (Hard et al., 1984; Brune et al., 1995; Fuchs et al., 2011) or conversion to with subsequent detection of the acid via mass spectrometry (Edwards et al., 2003; Hanke et al., 2002). In the LIF method, also known as fluorescence assay by gaseous expansion (FAGE; Hard et al., 1984), which is the technique used in this study, OH is sampled into a low-pressure region through a pinhole. Low pressures allow for the temporal separation of resonant 308 nm fluorescence from the excitation pulse. Following the first detection axis for OH, a flow of NO is introduced which reacts with HO2 (Reaction R3):
The resulting OH is monitored at a second detector. The high sensitivity with which OH can be detected gives HO2 detection limits in the 108 molec. cm−3 range for 5–10 s averaging; however, to extract concentrations, both OH detection methods require calibration (Winiberg et al., 2015). For chamber measurements of HO2, comparisons with direct CRDS measurements have verified the reliability of the calibration process (Onel et al., 2017).
HO2 detection by LIF can be potentially sensitive to interferences from certain RO2 species, which may also be converted to OH on short timescales. Interferences can be minimized by short conversion times between NO injection and OH monitoring, utilizing low pressures, high flow rates of the sample gas, and low NO concentrations to separate OH generation from HO2 and RO2; reduced conversion of HO2 reduces the sensitivity of this technique and as such in practice a compromise between selectivity and sensitivity is used (Fuchs et al., 2011; Hard et al., 1984; Whalley et al., 2013).
The current paper describes a significant development on our earlier FAGE-based instrument for time-resolved OH detection (Stone et al., 2016). In this improved system, laser flash photolysis in a high-pressure (up to 5 bar), temperature-controllable (300–800 K) reactor (shown in Fig. 1), generated radicals which were then sampled through a pinhole forming a jet within the low-pressure detection region (shown in more detail in Fig. 2). OH radicals were monitored by LIF close to the pinhole. The jet breaks down after ∼20 mm and NO was injected after this point to convert some HO2 into OH, which was then detected by a second monitoring system. In general, LIF becomes less sensitive at higher temperatures (due to distribution of population over more rotational levels) and O2 concentrations (due to quenching). Sampling into the low-pressure region reduces both the effect of collisional quenching and temperature on the sensitivity of LIF detection, although there is a reduction in the number density of the HOx species in the expansion. We report the adaptation of our time-resolved OH FAGE instrument to allow HO2 detection, the characterization of the instrument (including development of a calibration method for HO2 yields of OH initiated reactions), and the investigation of the influence of RO2 species. Finally, we discuss the application of the technique to determine the yield of HO2 from the reaction of OH with n-butanol. The instrument has some similarities to that presented by Nehr et al. (2011) where a conventional OH lifetime instrument was altered to allow for chemical conversion of HO2 to OH and hence the sequential determination of OH and HO2.
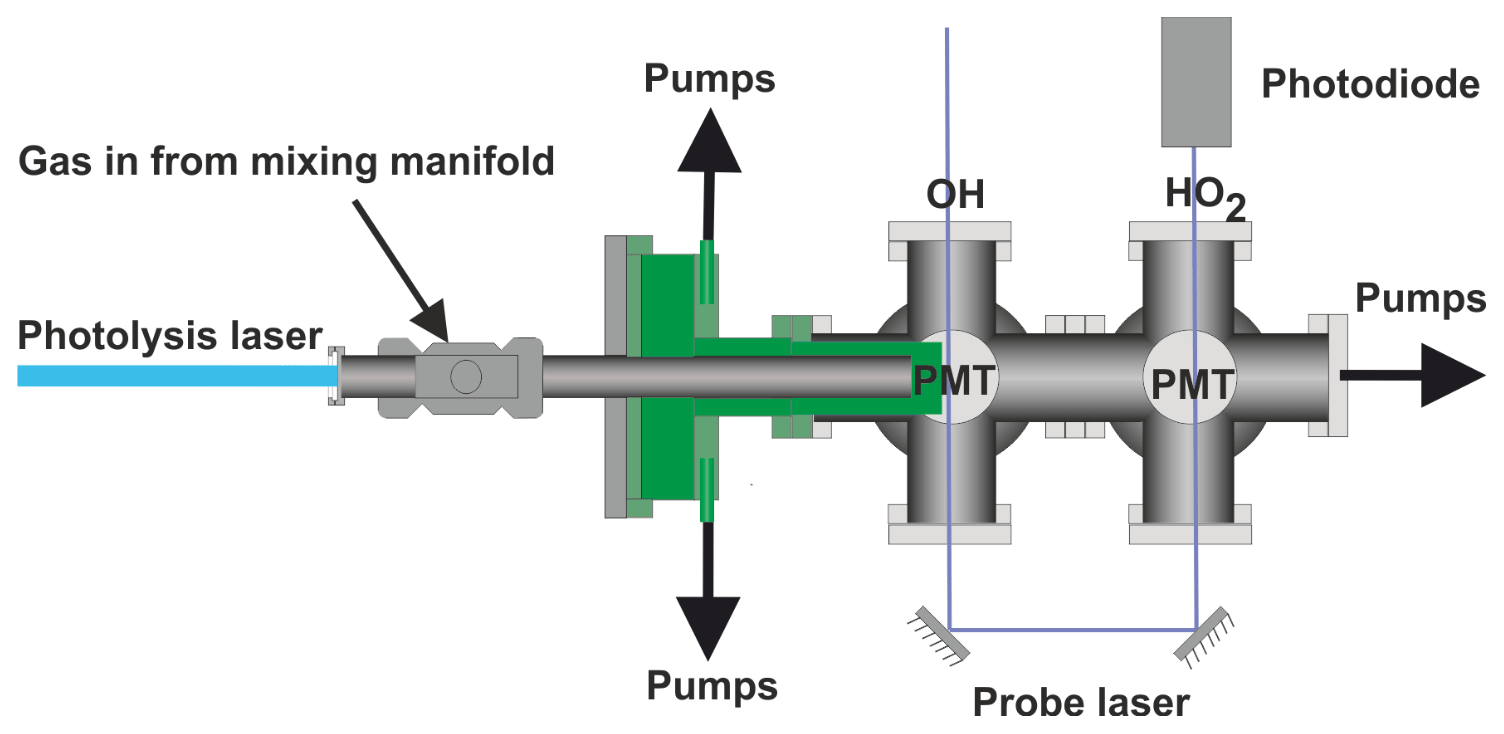
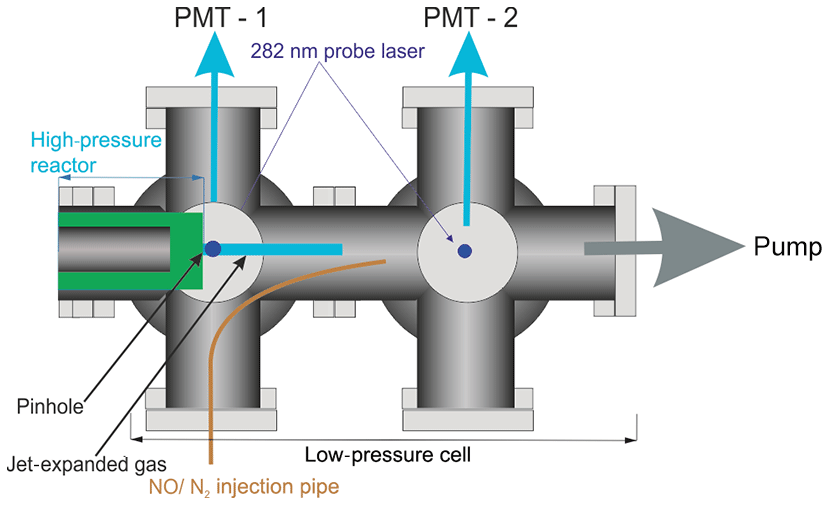
Figure 2Detailed schematic elevation of the low-pressure detection region of the reactor. The blue line represents the jet-expanded gas; the jet breaks down after approximately 2 cm. NO was injected through a 1.5 mm i.d. stainless-steel tube after the breakdown of the jet.
Reactions were carried out in a high-pressure (0.5–5 bar) reaction cell, which is described in greater detail in Stone et al. (2016) and schematics of which are shown in Figs. 1 and 2. The high-pressure reactor was a 0.5 m stainless-steel tube with a 22 mm internal diameter. Gas flows were delivered to the high-pressure cell from a mixing manifold where calibrated mass flow controllers (MFCs) allowed for accurate control of flow rates. Low-vapour-pressure compounds, OH precursors (H2O2), and substrates methanol and butanol, were delivered to the mixing manifold from thermostatted bubblers in pressure-regulated backing flows of nitrogen (N2). Ethane and oxygen were delivered directly from cylinders into the mixing manifold through MFCs. The gas flow rate through the cell was kept under laminar conditions with typical Reynolds values (Re) of 480 (corresponding to a flow rate for an experiment of 10 SLM (standard litres per minute) at 2 bar); in general conditions were maintained between 400 and 800 Re (Re laminar flow), with some experiments carried out with higher flow rates, up to 1800 Re.
Temperature control of the reactor between room temperature and 800 K was achieved by altering the voltage applied to a coil heater (WATROD tubular heater, Watlow) over the last 30 cm of the stainless-steel tube. The heated region was fitted with a quartz liner (inner diameter 18 mm) to reduce wall-initiated chemistry. A temperature readout, from a type-K thermocouple in the gas flow, close to the pinhole, was calibrated for given flow rates, pressures, and voltage settings by measuring the highly temperature-sensitive OH and methane rate coefficient, using the temperature dependence reported by Dunlop and Tully (1993). A more detailed description of this method is described within instrument characterization (Sect. 3.4).
The photolysis of the OH precursor, H2O2, at 248 nm (Lambda Physik, COMPex 200 operated using KrF at 1 or 5 Hz) or 266 nm (frequency quadrupled Nd:YAG output, Quantel, Q-smart 850 at 1 or 10 Hz) initiated the chemistry. No significant difference was noted in the kinetics or yields as a function of laser repetition rate.
Hydrogen peroxide was used as the OH precursor for all experiments where HO2 detection was performed because it also acts as an internal calibrator to relate OH and HO2 (highlighted in Reaction R5) in a 1:1 relationship, via Reaction (R5):
However, in general, other OH precursors can be used. The OH precursor was maintained at low concentrations (1×10¹⁴–1×10¹⁵ molec. cm−3) to minimize errors associated with assigning pseudo-1st-order kinetics for the loss of OH and to reduce radical–radical reactions. Maintaining a low radical precursor concentration had the additional advantage of minimizing attenuation of the photolysis beam, ensuring consistency in the initial radical concentrations generated along the length of the high-pressure cell. Initial OH concentrations were in the range 2×10¹¹–5×10¹³ molec. cm−3.
A pinhole (diameter <0.15 mm) at the end of the high-pressure reactor couples the reactor to the low-pressure (0.3–5 Torr) detection cell. Details on OH detection can be found in Stone et al. (2016). The accuracy of the instrument for OH measurement has recently been verified by measurements of the rate coefficient of the reaction of OH with isoprene (Medeiros et al., 2018), which are in excellent agreement with the literature. A more detailed schematic for the low-pressure detection cell is shown in Fig. 2.
In the first low-pressure detection cell, the OH was probed within the jet-expanded gas, close to pinhole (<5 mm), perpendicular to the gas flow. The OH was detected by off-resonance laser-induced fluorescence (LIF) at 308 nm following excitation with 282 nm light . The 282 nm light was the frequency-doubled output of a dye laser ((Rhodamine 6 G, Spectron) pumped at 532 nm by a Nd:YAG laser (Spectron), or (Rhodamine 6 G, Continuum) pumped by a Nd:YAG laser (Quantel, Q-smart 850)). Measuring the off-resonance fluorescence allowed the use of a filter (308±5 nm, Barr Associates) before the photomultiplier (PerkinElmer C1943P) to remove scattered light and improved the signal-to-noise ratio.
A delay generator (BNC DG535) was used to vary the delay (time resolution ∼10 ns) between the photolysis and probe laser, facilitating generation of time profiles of the OH concentration. The traces, typically 200–300 data points and ranging in time from ∼50 µs to 20 ms, were scanned through multiple times (5–20) and the signal at each time point was averaged, giving high-precision OH loss traces. An example OH trace from the first detection cell for Reaction (R5) is presented in Fig. 3. As reactions were carried out under pseudo-1st-order conditions ([OH]≪[substrate]), the time dependence of the OH LIF signal, If (proportional to the [OH]), was given by
where kOH=k5[H2O2]. In Fig. 3 two traces are presented from the first, OH, detection axis, these two traces were taken in consecutive experiments with a constant [H2O2] where the first trace ( s−1) was taken where N2 was flowed into the low-pressure region; the second trace ( s−1) was taken when this flow had been switched to NO to allow HO2 detection in the second detection cell, and errors are given as 2σ. The similarity of the OH decay traces when either N2 or NO was injected shows that there was no back-streaming of NO in the low-pressure cell and hence no HO2 conversion at the first detection axis.
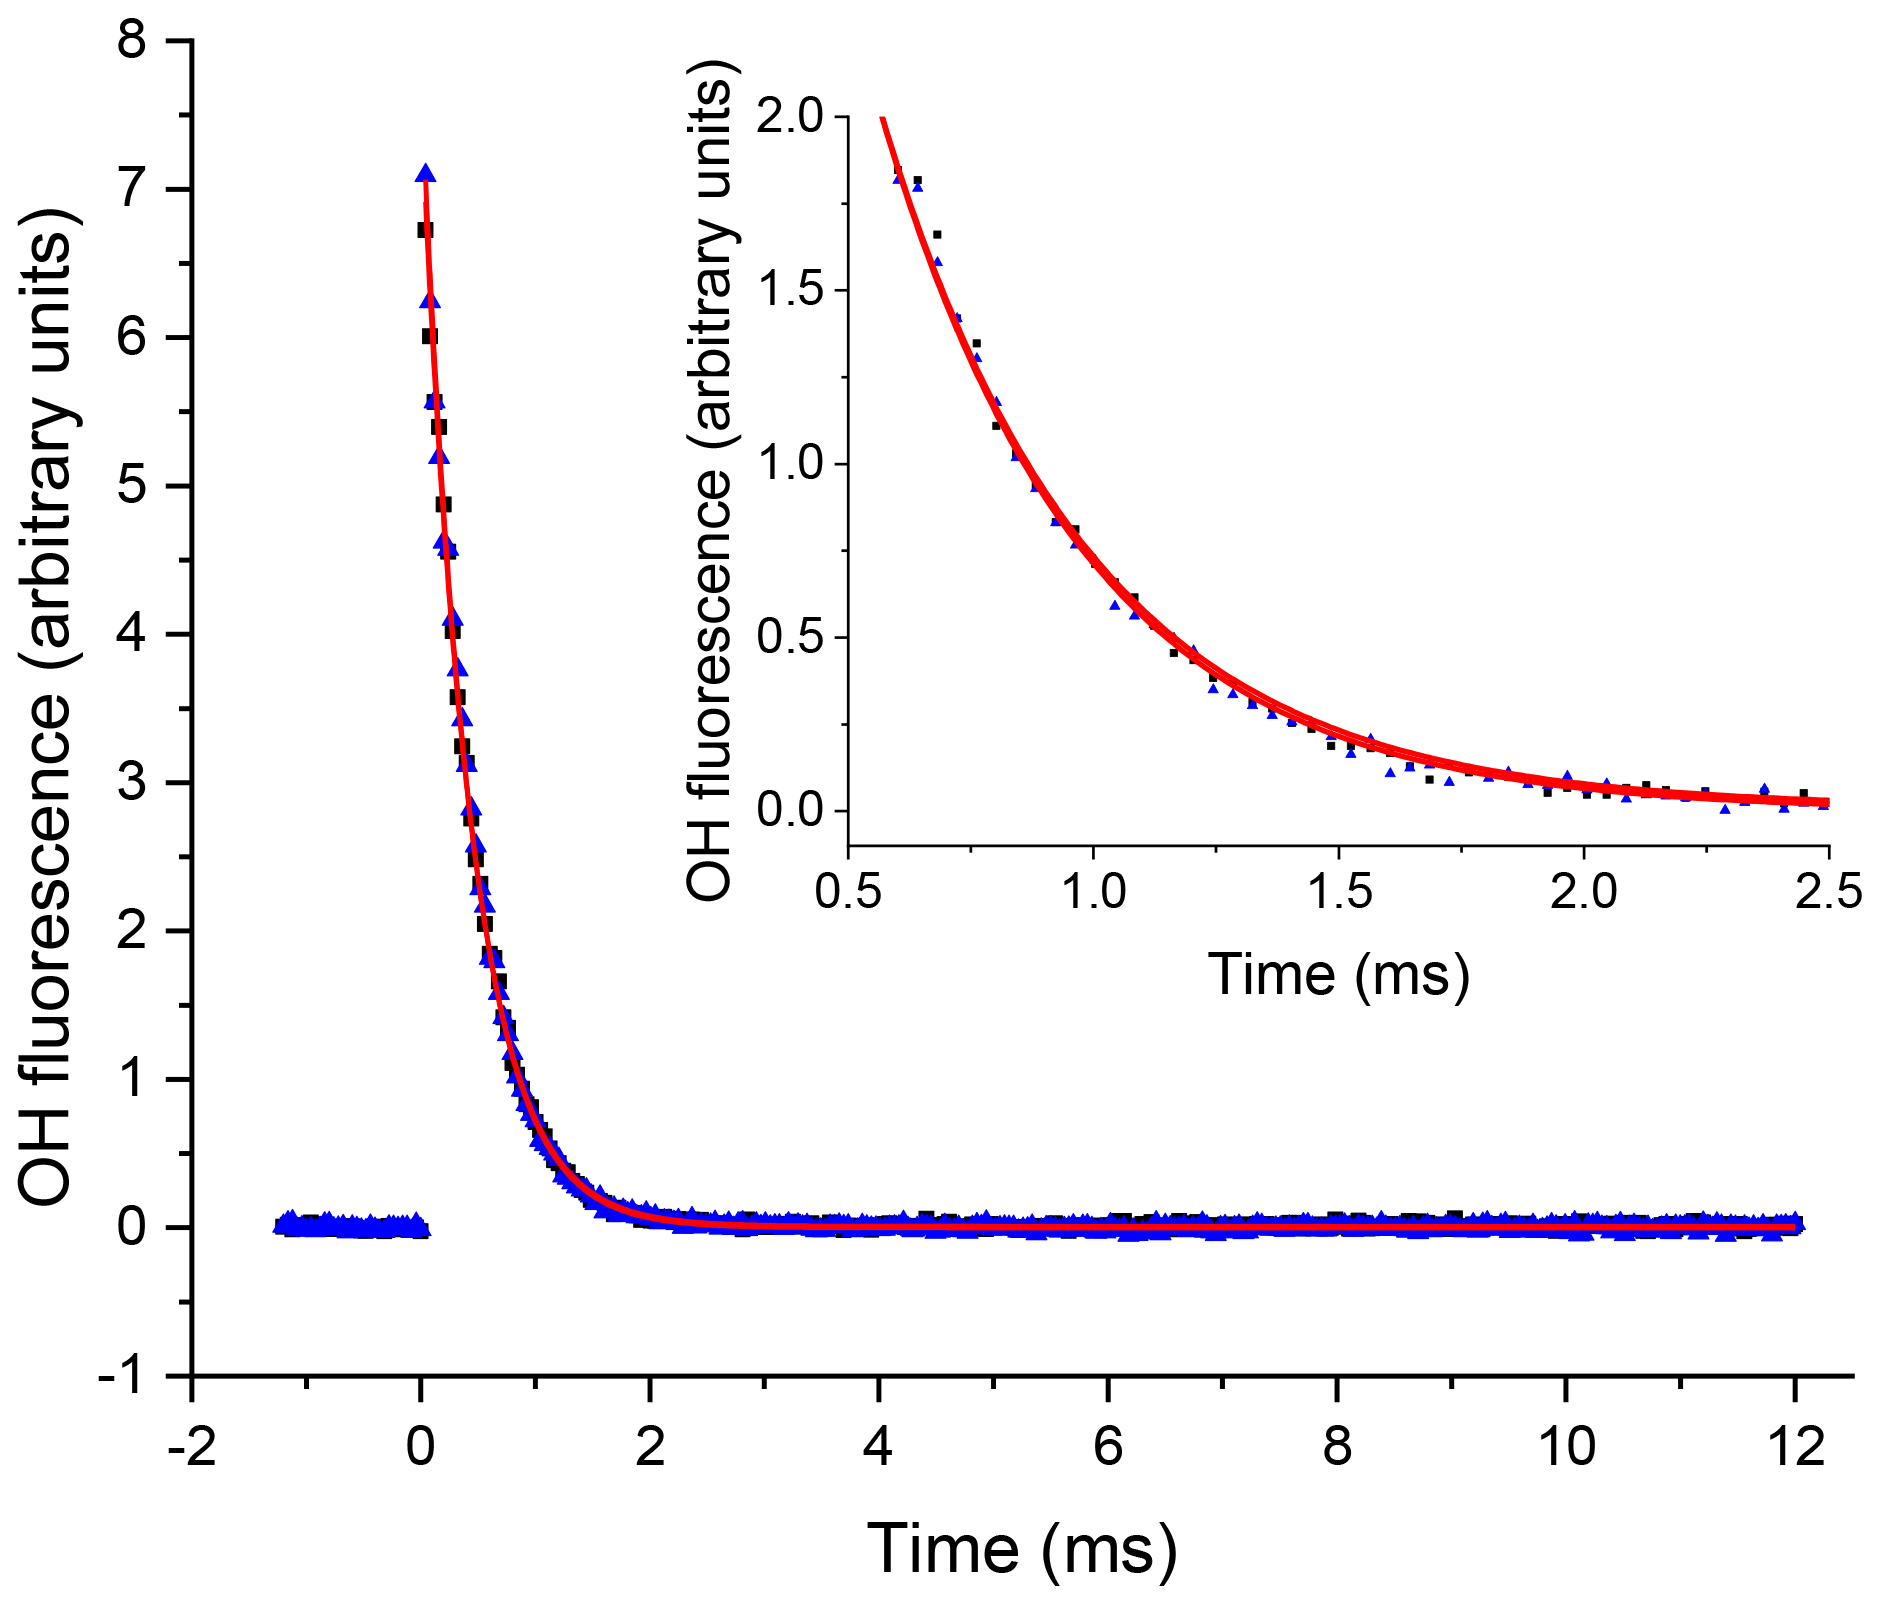
Figure 3An example of the OH signal (solid blue triangles) collected at the first detection axis for the reaction of OH with H2O2 ([H2O2] molec. cm−3, with a flow of N2 into the low-pressure cell, with open black squares representing the subsequent trace taken with a flow of NO. The red lines represent the non-linear least-squares fits to an exponential decay ( s−1 and s−1), 2σ errors.
HO2 radicals were monitored by the chemical transformation of HO2 to OH via reaction with NO (Reaction R3) in the low-pressure cell. Following the breakdown of the jet, after the Mach disk (>2 cm beyond the pinhole), a small flow (5 sccm) of NO or N2 was introduced into the low-pressure cell via a 1.5 mm i.d. stainless-steel pipe (for a typical 0.5 Torr pressure in the FAGE cell and the NO concentration was 5.5×10¹³ molec. cm−3). After passing through the first detection cell, the probe beam was redirected through the second low-pressure detection cell downstream of the NO pipe, allowing for the measurement of the OH concentration by LIF in the same manner as in the first cell.
By switching between a flow of N2 and NO, through the pipe, traces for OH loss and HO2 formation could be elucidated, examples of which are shown in Fig. 4. Subtraction of the two OH traces in Fig. 4 (upper red trace is with NO injection and the signal corresponds to reactant OH and OH produced from the titration of HO2 to OH; lower blue trace with N2 injection is reactant OH only) gave a resultant signal associated with HO2 production in the high-pressure reactor, shown as the pink trace in Fig. 4. The signal from the first PMT allowed for correction of the signal heights at the second PMT for changes in the probe laser power or wavelength, as any variations in laser power or wavelength affect the absolute signal retrieved from both PMTs; however, the relative signals retrieved from the PMTs remain consistent.
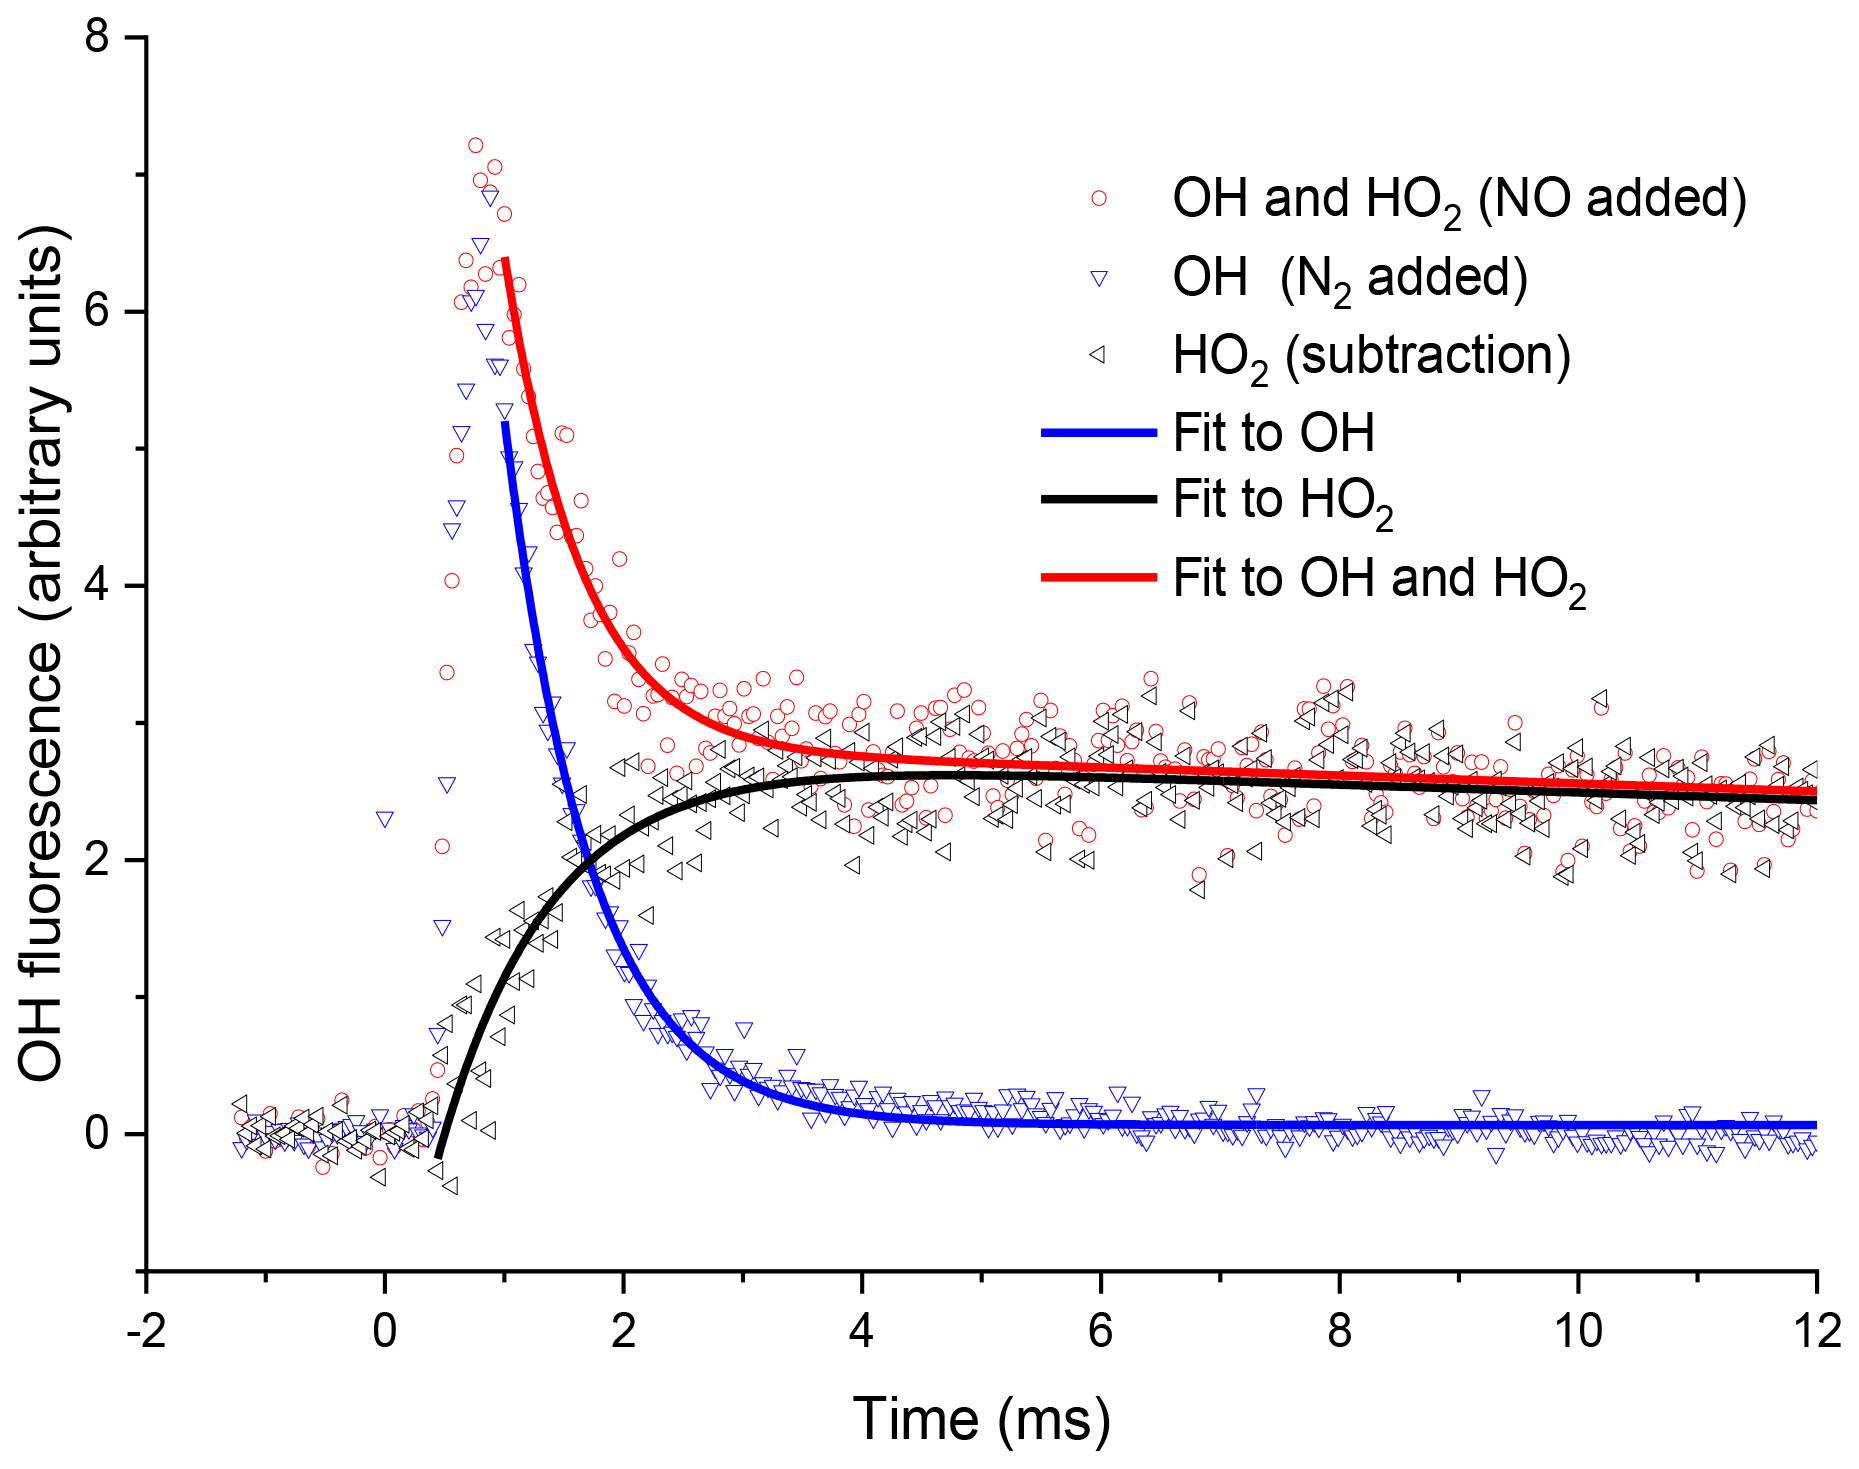
Figure 4Examples of OH fluorescence traces collected at the second detection axis under the same conditions for Fig. 3. The blue triangles are where N2 has been injected through the pipe, i.e. no HO2-to-OH conversion. The OH signal profile differs from that in Fig. 3, with s−1 (2σ errors), additionally, there is a time delay to peak OH, representing the transport time (primarily the time taken to travel from the breakdown of the jet to the second detection axis). The red circles are the OH signal obtained with NO injection. At short times the signal is dominated by reactant OH, but at times greater than 2 ms, the signal is dominated by OH titrated from the HO2 product. The resultant OH trace associated with HO2 formation in the high-pressure cell obtained by subtracting the two OH traces, obtained with either NO or N2 injection prior to the second detection axis, shown as black triangles, and a bi-exponential growth and decay fit, black curve, gave a formation rate coefficient, s−1 (2σ error).
Fits to the HO2 formation traces and OH loss traces from the second cell generated kinetic parameters which differed from the accurate parameters collected at the first detection axis, and s−1, where the accurate loss parameters from the first cell were s−1, 2σ errors. This difference was the result of transport effects. By comparison of the loss and formation parameters derived for OH+H2O2, for the first and second detection cells, HO2 formation rates could be assigned from a calibration plot (Fig. 7).
Neither of the OH determinations in the two detection axes provide absolute measurements of radical concentrations. Each detection axis could be calibrated as for chamber measurements, but for our purposes a calibration reaction linking photolytically produced OH and HO2 removes many sources of error compared to an absolute calibration. The reaction of OH with the radical precursor H2O2 which directly forms HO2 with a 100 % yield was used for calibration.
For reactions carried out where a reagent was added in addition to the H2O2, the resulting ratios can be compared with those from the calibration reaction to allow assignment of an observed HO2 yield. To assign the HO2 yield from the test reaction required accounting for secondary HO2 production in the high-pressure reactor, from OH+H2O2 and photolysis processes. From the known rate coefficients, it was possible to calculate the fraction of OH reacting with the H2O2 (typically 5 %–10 %) and hence the expected contribution to the HO2 signal. Photolytic production of HO2 was accounted for by measuring the observed HO2 signal in the absence of any H2O2.
In a typical experiment, the reaction of OH and H2O2 would be carried out four times, twice in the absence of NO and twice with the addition of NO to calibrate the instrument. Exponential fits to the OH decay as monitored in the first cell determine the peak OH signal. The OH signals at the second detector were recorded with only N2 addition (reagent OH reaching the second detector) and subtracted from the signal with NO added (reagent OH and HO2) to give the net HO2 signal. This profile was fitted to a bi-exponential growth and decay function to extract the peak HO2 signal for that set of conditions. Combinations of traces were then used to obtain an averaged value (and uncertainty) of the signal on the first PMT (OH) to the net HO2 signal at the second PMT for this calibration reaction where OH reactant and HO2 product have a 1:1 relationship. The same process was then performed in the presence of the compound of study. The removal pseudo-1st-order rate coefficient with H2O2 and the reagent of study () were compared to the removal pseudo-1st-order rate coefficient with only H2O2 () to assign what fraction of the OH reacted with the H2O2 precursor and hence the resulting contribution to the observed HO2. Comparison of the remaining peak ratio to the ratio from the H2O2 and OH calibration experiment provided the experimentally derived HO2 yield for reaction of OH and the reagent of study.
Branching ratios to direct HO2 formation could be assigned with an accuracy of ∼10 %; the limitations to this were signal-to-noise effects, where improved signal-to-noise ratio could be achieved by increasing the precursor concentration and photolysis energy. However, this was limited by the need to ensure pseudo-1st-order conditions were maintained and to minimize radical–radical processes. Ensuring the dominant reaction was between OH and the reagent of study, whilst still being able to accurately measure the initial OH conditions provided a limit to the maximum removal rates achievable ( s−1).
Many reactions of atmospheric and combustion interest are studied in the presence of oxygen leading to the generation of peroxy radicals (RO2). For certain RO2 there is a potential to generate OH and HO2 on a fast timescale and therefore three well-known reactions were chosen to characterize the instrument, OH and ethane, OH and ethylene, and OH and methanol.
OH and ethane (Reaction R6) give an assessment of any false yields generated from RO2 and NO from prototypical alkyl RO2 species that will be formed from many atmospherically relevant reactions. Ethylene and OH (Reaction R7) form a hydroxy alkyl peroxy radical, the typical RO2 species known to create interferences in FAGE HO2 detection systems (Fuchs et al., 2011; Hard et al., 1984; Whalley et al., 2013). Minimizing and understanding the HO2 yield from this reaction allowed for limits to the selectivity of the instrument to be known. The reaction of OH with methanol is a well-understood reaction; the two isomeric radical products react with oxygen on differing timescales to generate HO2. Complete conversion of both isomers should yield 100 % HO2.
As discussed in the experimental section, transport effects after the breakup of the sampling jet mean that rate coefficients measured in the second cell kX, 2nd (X=OH or HO2) differ from each other (transport effects scale with mass) and from those made in the first detection axis (kOH, 1st). Pseudo-1st-order rate coefficients from the two detection axes were compared to ascertain whether measurements in the second detection axes can be used to make quantitative kinetic measurements.
Finally, the layout of the apparatus makes it hard to accurately measure the temperature at which the reaction occurs; for reactions occurring on a millisecond timescale, the relevant reaction distance from the sampling pinhole is approximately 0.05–0.5 mm. Compared to a conventional slow flow laser flash photolysis/laser-induced fluorescence apparatus, where the reaction volume is the overlap of the perpendicular photolysis and probe laser beams, it is hard to accurately position the thermocouple, and additionally any thermocouple located close to the sampling pinhole may affect the flow into the low-pressure system. In addition to the difficulties in correctly siting a thermocouple, there are additional errors (flow, conduction, and radiative) that derive from measuring the temperature of a flowing gas with a thermocouple. We have therefore performed additional experiments to determine the temperature based on the well-characterized and temperature-sensitive reaction of OH and methane.
3.1 Interference by RO2 species
Selectivity in measuring HO2 concentrations plays an important role in the viability of detection methods for monitoring reactions important for atmospheric chemistry. At high pressures, the reaction of NO with many atmospherically relevant RO2 species in the presence of oxygen induces HO2 formation. Performing the titration in the low-pressure cell with the NO+HO2 reaction under “starved NO” conditions minimized this effect. This premise was validated by measuring the OH + ethane and OH + ethylene HO2 yields under high-oxygen conditions. In our system the typical oxygen concentrations in the high-pressure reactor were varied between 1×10¹⁶ and 5×10¹⁷ molec. cm−3, which led to concentrations in the low-pressure cell of 3×10¹² to 2×10¹⁵ molec. cm−3.
The reaction of OH + ethane (Reaction R6) under high-oxygen conditions permits the rapid formation of the ethylperoxy radical, which is an RO2 radical that has a typically slow, NO-propagated route to HO2 formation (Reactions R11–R12).
( cm3 molec.−1 s−1) (Atkinson et al., 2006)
( cm3 molec.−1 s−1) (Atkinson et al., 2006)
Under a variety of NO flows the apparent HO2 yield for the OH+C2H6 system was 3±6 %, which indicates that for most reactions carried out in our system, chemical transformation by reaction with NO was sensitive to HO2 rather than RO2 species, where the RO2 radical was the product of O2 addition to a simple alkyl radical.
The reaction of ethylene and OH (Reaction R7) in the presence of oxygen forms the hydroxyethylperoxy radical (HOCH2CH2O2), and reaction of HOCH2CH2O2 with NO in the presence of O2 provides a route for the prompt regeneration of OH. For this reaction, an apparent HO2 yield of 100±15 % was observed; however, by varying the concentration of NO added to the low-pressure cell (between 5×10¹³ and 5×10¹⁴ molec. cm−3), the formation rate of OH was reduced, minimizing the apparent yield observed (<70 %) and slowing the observed rate of OH regeneration (<1000 s−1).
( cm3 molec.−1 s−1) (Atkinson et al., 2006)
( s−1) (Orlando et al., 1998)
( cm3 molec.−1 s−1) (Atkinson et al., 2006)
For test reagents which can generate radicals similar to hydroxyethylperoxy, our instrument will detect both HO2 and RO2 with some selectivity to HO2. Potential RO2 interference can be tested by examining the HO2 yield as a function of added [NO].
3.2 OH + methanol
To verify the accuracy of the method for determining HO2 yields, the reaction of OH and methanol (Reaction R8) was examined. The branching ratio for the α abstraction to yield CH2OH (Reaction R8a) reported by the IUPAC evaluation (Atkinson et al., 2006) and based on the experimental data of McCaulley et al. (1989) is % at room temperature with the methoxy yield as (15±8) %. Reaction (R8) was studied at room temperature with the reaction being initiated by the photolysis of H2O2 at 248 nm. In the presence of low concentrations of oxygen ( molec. cm−3), the α abstraction still leads to prompt formation of HO2 via Reaction (R9), but Reaction (R10), CH3O+O2, occurs on a much longer timescale (the ratio is ∼5000; Atkinson et al., 2006) and is not observed under these conditions. The observed HO2 yield (87±10) % (first row of Table 1) gives the fraction of Reaction (R8) forming CH2OH and the value is consistent with the IUPAC evaluation.
Table 1HO2 yields from the reaction of OH with CH3OH with varying [O2] carried out at 295 K. Errors given as 2σ.
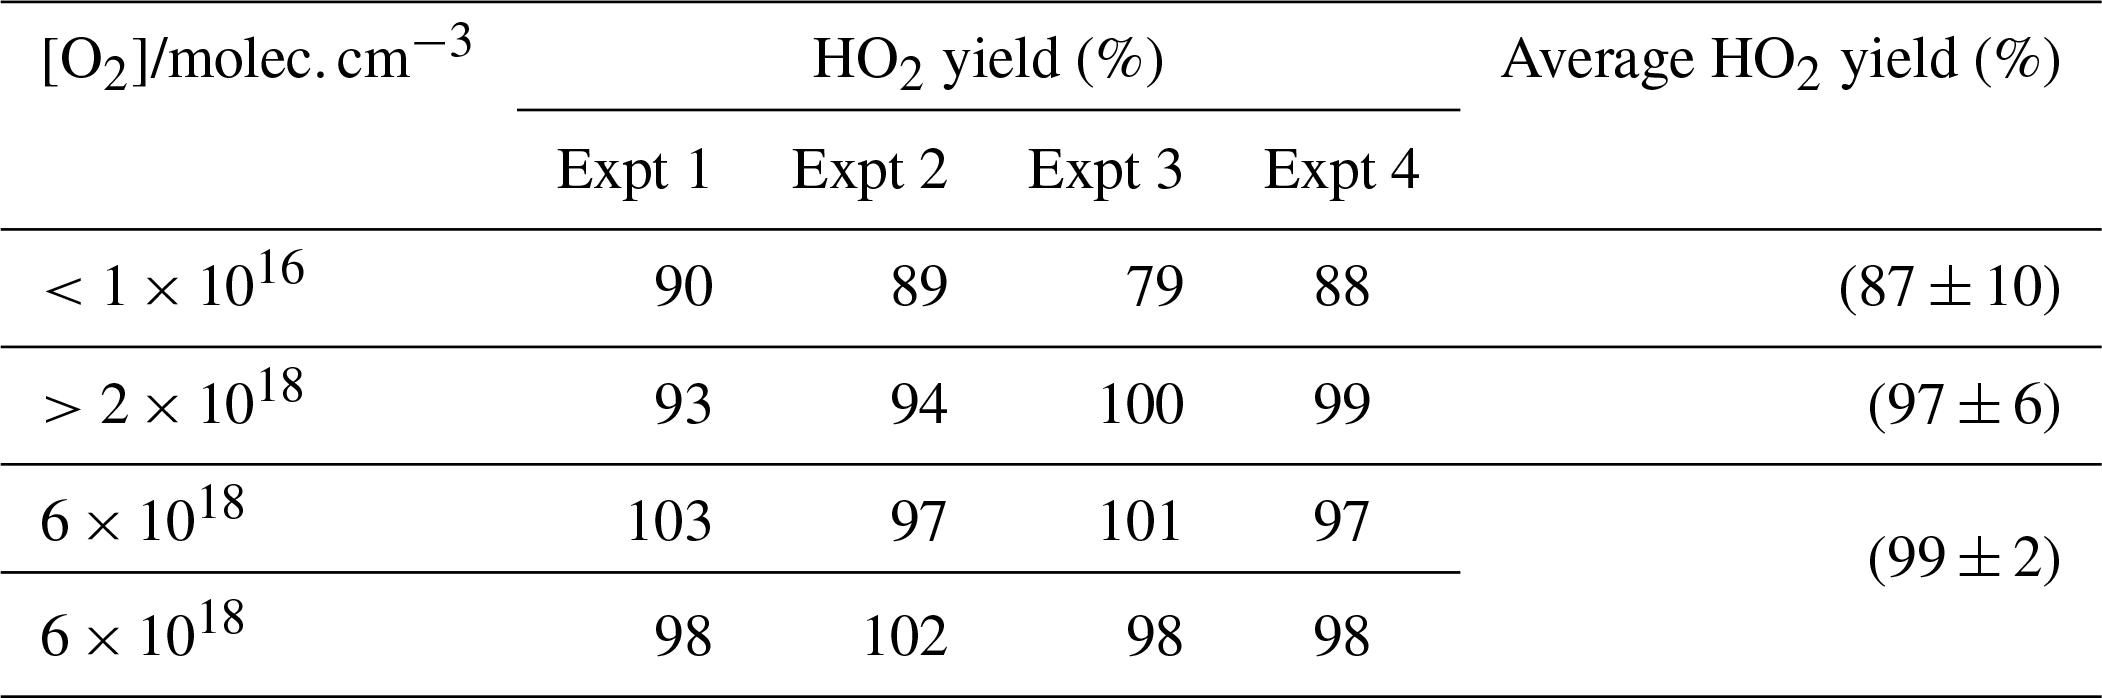
When higher concentrations of oxygen are used, the timescale for HO2 production from Reaction (R10) decreases and now both abstraction channels lead to HO2 detection in our apparatus. The resulting observed yield (final three rows of Table 1) is consistent with 100 % conversion of OH to HO2 and is statistically different from the low-oxygen measurements based on a Welch t test at the 98 % level. The reproduction of the literature HO2 yields from the reaction of OH with methanol under varying [O2] demonstrates that the instrument can accurately measure HO2 yields with good precision. It has additionally been demonstrated that the instrument had sufficient accuracy and precision to assign the branching ratios for differing abstraction channels when it was possible to separate the channels by the timescale for HO2 generation.
A possible interference that could distort the yield of HO2 is the role of the radical–radical reaction OH + HO2 (Assaf and Fittschen, 2016):
cm3 molec.−1 s−1 (Atkinson et al., 2006). At the low radical concentrations used in many experiments in this work, this reaction could contribute 5 %–10% of the OH loss in an OH+H2O2 calibration experiment. However, we have looked at the dependence of the HO2 yield from both OH∕H2O2 and from OH∕CH3OH, but we see no significant effects of secondary radical–radical reaction (<5%) as the calculated [OH]0 is changed from 5×10¹¹ to 5×10¹² molec. cm−3. For OH∕CH3OH the much larger concentrations of substrate used lead to faster pseudo-1st-order decays, so radical–radical contribution is significantly reduced. The work of Assaf and Fittschen (2016) suggests that a more significant deviation in the OH loss rates, and one that we ought to be able to detect given the precision of our data, should be observed. It is possible that our calculations of [OH]0 are overestimated, but we note that a study of the OH+H2O2 reaction by Wine et al. (1981), where they specifically looked for the interference on OH decays from Reaction (R15), could find no evidence for an increase in the loss of OH, when [HO2] was artificially increased.
3.3 Assessment of transport effects on observed kinetics
Due to the differing conditions in the two detection regions, the kinetics observed at the first detection axis, where OH LIF was performed in the jet-expanded gas, and in the second detection region, where LIF is performed 15 cm downstream from the pinhole after the breakdown of the jetting gas, will be treated separately. For validating the accuracy of the OH kinetics in the first cell, the reactions of OH and methane (CH4) (Dunlop and Tully, 1993) and OH and ethylene (C2H4) (Atkinson et al., 1982; Tully, 1983) were studied. The high accuracy and precision of this system for measuring OH kinetics has further been demonstrated in a recent publication on the reaction of OH and isoprene (C5H8) (Medeiros et al., 2018).
When these reactions were carried out at room temperature the expected bimolecular rate coefficients could be reproducibly accurately measured for observed rate coefficients less than 150 000 s−1.
Studies on the reaction of OH and ethylene at room temperature and 2.2 bar, shown in Fig. 5, gave a value of cm3 molec.−1 s−1 (2σ errors), which matched well with literature high-pressure limits for OH and ethylene, where a direct pulsed laser photolysis laser-induced fluorescence study by Tully (1983) gave cm3 molec.−1 s−1 and a relative rate study by Atkinson et al. (1982) found cm3 molec.−1 s−1. However, for pseudo-1st-order rate coefficients above ∼150 000 s−1, there was no longer a linear dependence of the rate coefficient with reagent concentration; transport effects are becoming significant even for OH detection in the jetting region.
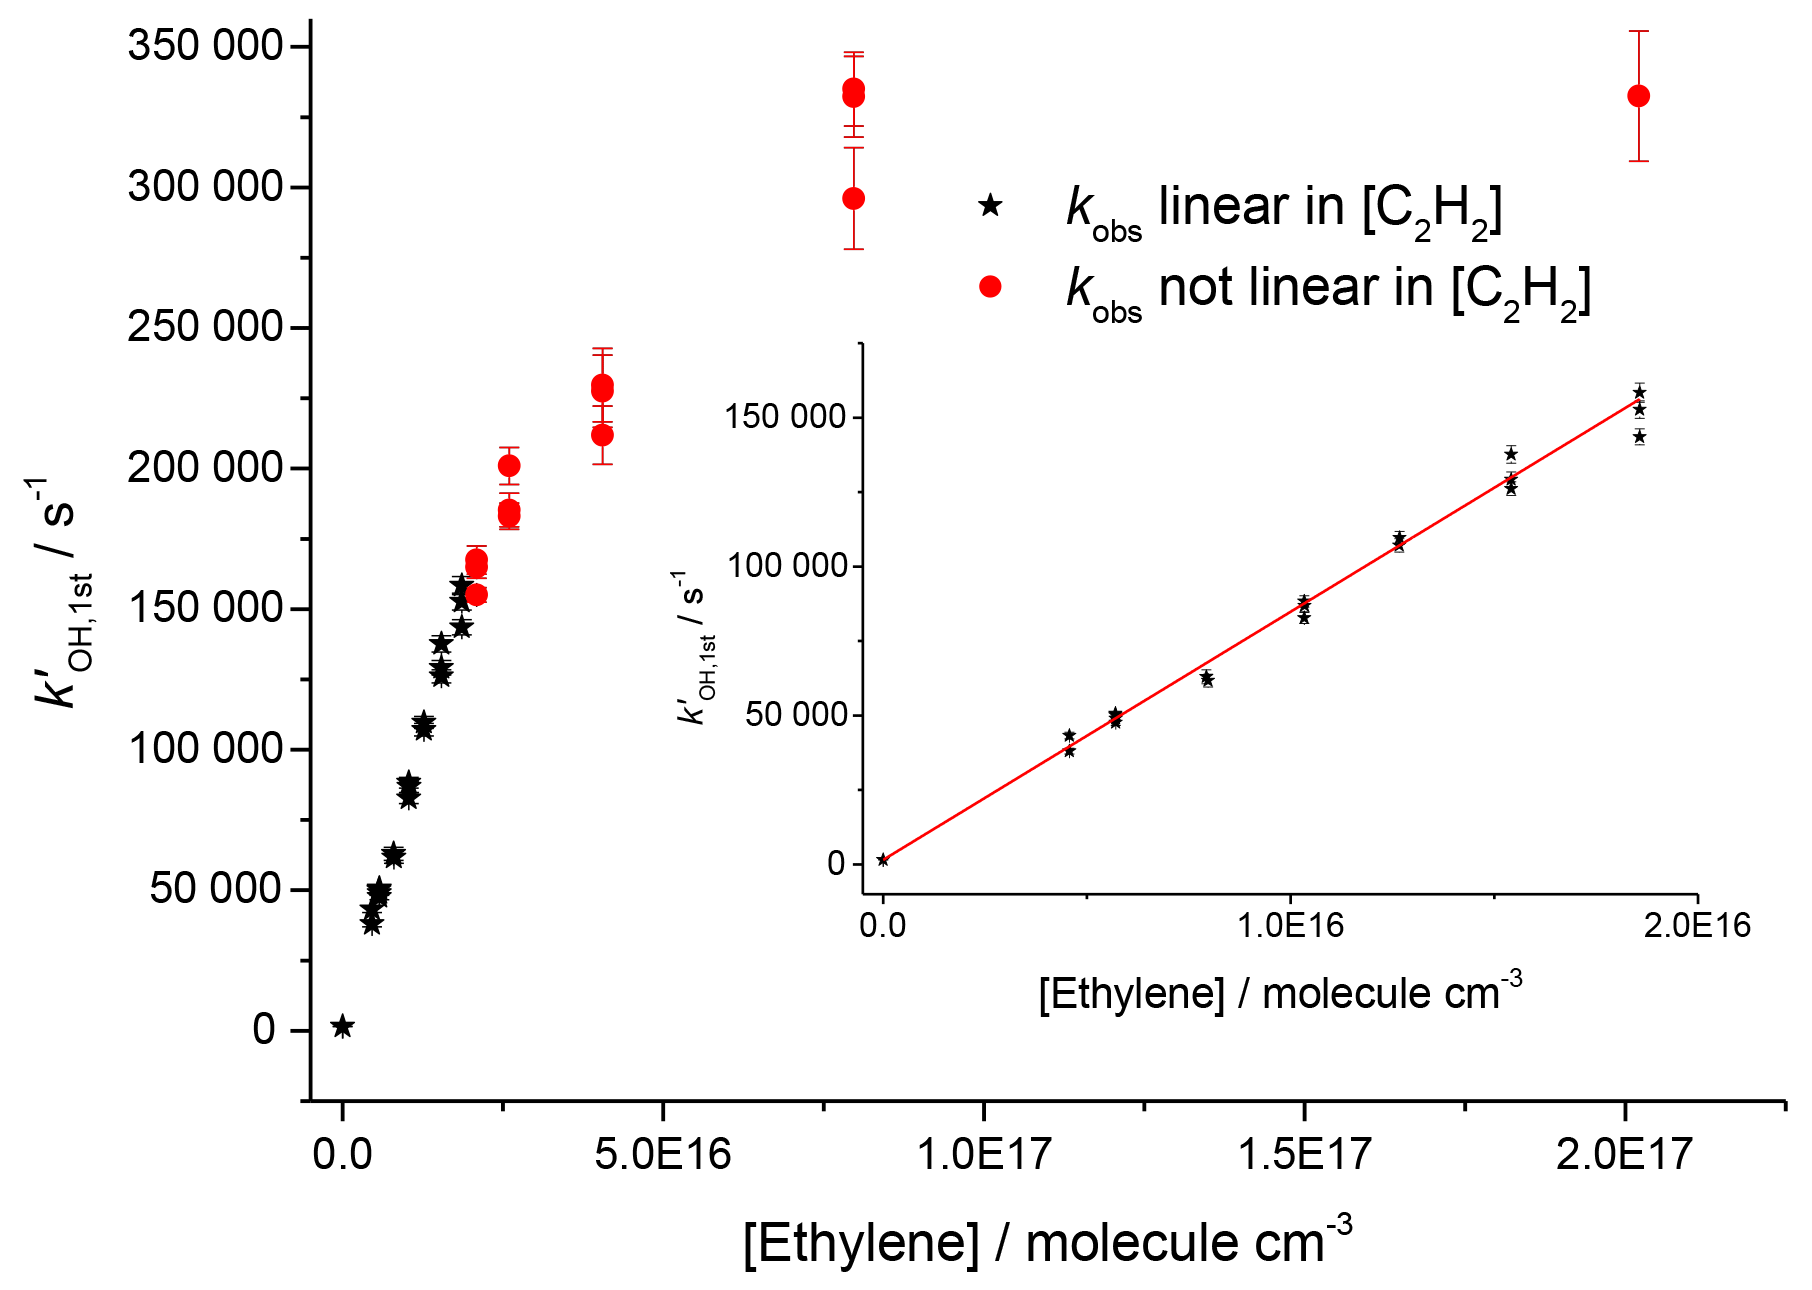
Figure 5Bimolecular plot of the pseudo-1st-order rate coefficient at the first detector, , vs. ethylene concentration. The figure demonstrates a linear relationship below ∼150 000 s−1 (see inset for detail in linear region) but with increasing curvature due to transport effects at higher values of . Black stars symbolize where was linear with [C2H4], and red circles show where showed greater than 5 % deviation from linearity.
The OH traces detected in the second cell deviated from those observed from the first cell, as shown in Figs. 3 and 4. There is understandably an increased time delay from time zero (the photolysis laser pulse) to arrival of OH radicals at the second detection axis due to the increased distance travelled after sampling (>150 mm versus <5 mm). Additionally, the arrival of OH to the second axis is spread out further in time due to transport issues relating to non-linear flow conditions at the breakdown of the jet, and the arrival of the OH being affected by its velocity distribution (Moore and Carr, 1977; Taatjes, 2007; Baeza-Romero et al., 2012). Figure 6 shows a plot of observed OH rate coefficient from the first detection axis (kOH, 1st) against observed rate coefficient from the second axis (kOH, 2nd) in the reaction of OH with H2O2. For values of kOH below 2500 s−1 it was possible to accurately assign an expected OH removal rate for reactions observed in the second cell (kOH, 2nd) given the observed OH kinetics at the first detection axis (kOH, 1st). This is useful to compare the kinetics of OH removal and HO2 production.

Figure 6Relationship between the observed rate coefficient for the reaction of OH with H2O2 observed in the first cell (kOH, 1st) and the observed OH removal rate in the second cell (kOH, 2nd). The difference is non-linear but a simple fit to this could be used to assign removal rates to traces observed in the second cell below 2500 s−1. The red line is the simplified fit of the form, , where A was some limit value above which no increase in measured rate coefficient would be observed.
As the observed kinetics in the second cell are significantly affected by the velocity distribution of the species being detected, there is again a deviation between the observed kinetics expected from the measurement of the OH radical loss and the kinetics for HO2 formation due to the differing masses of OH and HO2. Figure 7 shows the pseudo-1st-order rate coefficients for OH removal () and HO2 production () from the OH+H2O2 reaction determined at the second detection axis, plotted against the OH removal at the first detection axis. The two fits to the data shown in Fig. 7 had a ratio of gradients concordant with the root of the masses for HO2 and OH, 0.60±0.14 versus the expected relationship of 0.73. As with Fig. 6, it is possible to establish a calibration graph that relates the kinetics of HO2 production at the second detection axis with the primary kinetics taking place in the high-pressure reactor. This means that the timescale over which the HO2 yield was observed could be assigned and therefore it is possible to attribute HO2 yields to fast processes, intramolecular RO2 decompositions, R+O2 reactions, or slower radical–radical reactions.

Figure 7Relationship between the pseudo-1st-order rate coefficient for OH loss observed in the first cell () from the reaction of OH with H2O2 and the observed rate coefficients measured in the second cell ( where X = OH loss (black squares) or HO2 production (red circles)). A non-linear fit can be used to assign removal rates and HO2 formation rates to traces observed in the second cell below 2500 s−1.
3.4 Temperature corrections
It is difficult to know the exact temperature at the pinhole as introducing a thermocouple close to the region will affect the flows and cannot be used in routine operation. A translatable thermocouple was passed along the axis of the high-pressure reactor over a variety of temperatures and showed that the temperature of the gas at the pinhole varies with axial location. In addition, radial profiles showed that in our system there was insufficient heating length to achieve uniform radial heating of the laminar gas. From the axial measurements it was observed that slower flow rates (<5 SLM) allowed for reduced axial temperature gradients. However, these measurements showed that the only manner to achieve an even thermal profile would be a static cell.
A permanently seated thermocouple was placed perpendicularly to the flow, close to the sampling region, and measurements from this thermocouple were then compared with temperature assignments from the reaction of OH and methane using the temperature dependence assigned by Dunlop and Tully (1993). This was performed over a range of heater settings and flows to allow for temperature assignment. This method was also applied to a standard low-pressure cell where the flows can be reduced to slow enough flows that thermocouple measurements could accurately define the temperature to verify the method. Additionally, the well-determined OH+ ethylene adduct formation equilibrium was measured over a range of temperatures to provide an additional verification of the temperature assignment.
The method to assign a temperature from the reaction of OH and methane used the pseudo-1st-order rate coefficients () measured at the first detection axis over a range of added methane flows. An estimate of the temperature was made from the thermocouple measurement; this estimated temperature was used, along with the pressure in the reactor, to calculate the added methane concentration. Comparing the predicted pseudo-1st-order rate coefficient that this estimated concentration provided using the literature value of (Dunlop and Tully, 1993) to the measured rate coefficient produced a difference for each point. The estimated temperature was then iteratively changed to minimize the difference between estimated and measured rate coefficients. For this minimum value, the difference between thermocouple measurement and actual temperature was tabulated against the voltage setting for the heater. A parameterization of voltage versus temperature difference was used to estimate the temperature of the reactor for experiments where no OH and methane measurements were performed and has been shown to reliably predict the temperature of the reactor within 7 K when measurements have been made subsequently.
To assess the axial temperature gradients in the gas sampled through the pinhole over the timescales of reactions measured, OH and methane rate coefficients were measured using photolysis of water at 193 nm as a source of OH. Using water photolysis allowed for low removal rates of OH by precursor and assignment of OH and methane over a range of pseudo-1st-order rate coefficients ( 100–40 000 s−1 as shown in Fig. 8. This was performed at two temperatures (505, 680 K), and the slope of observed OH removal rate coefficients against concentration of methane appeared linear over the full range for both temperatures, thus verifying that over the distances sampled within experimental timeframes there is a minimal temperature gradient.
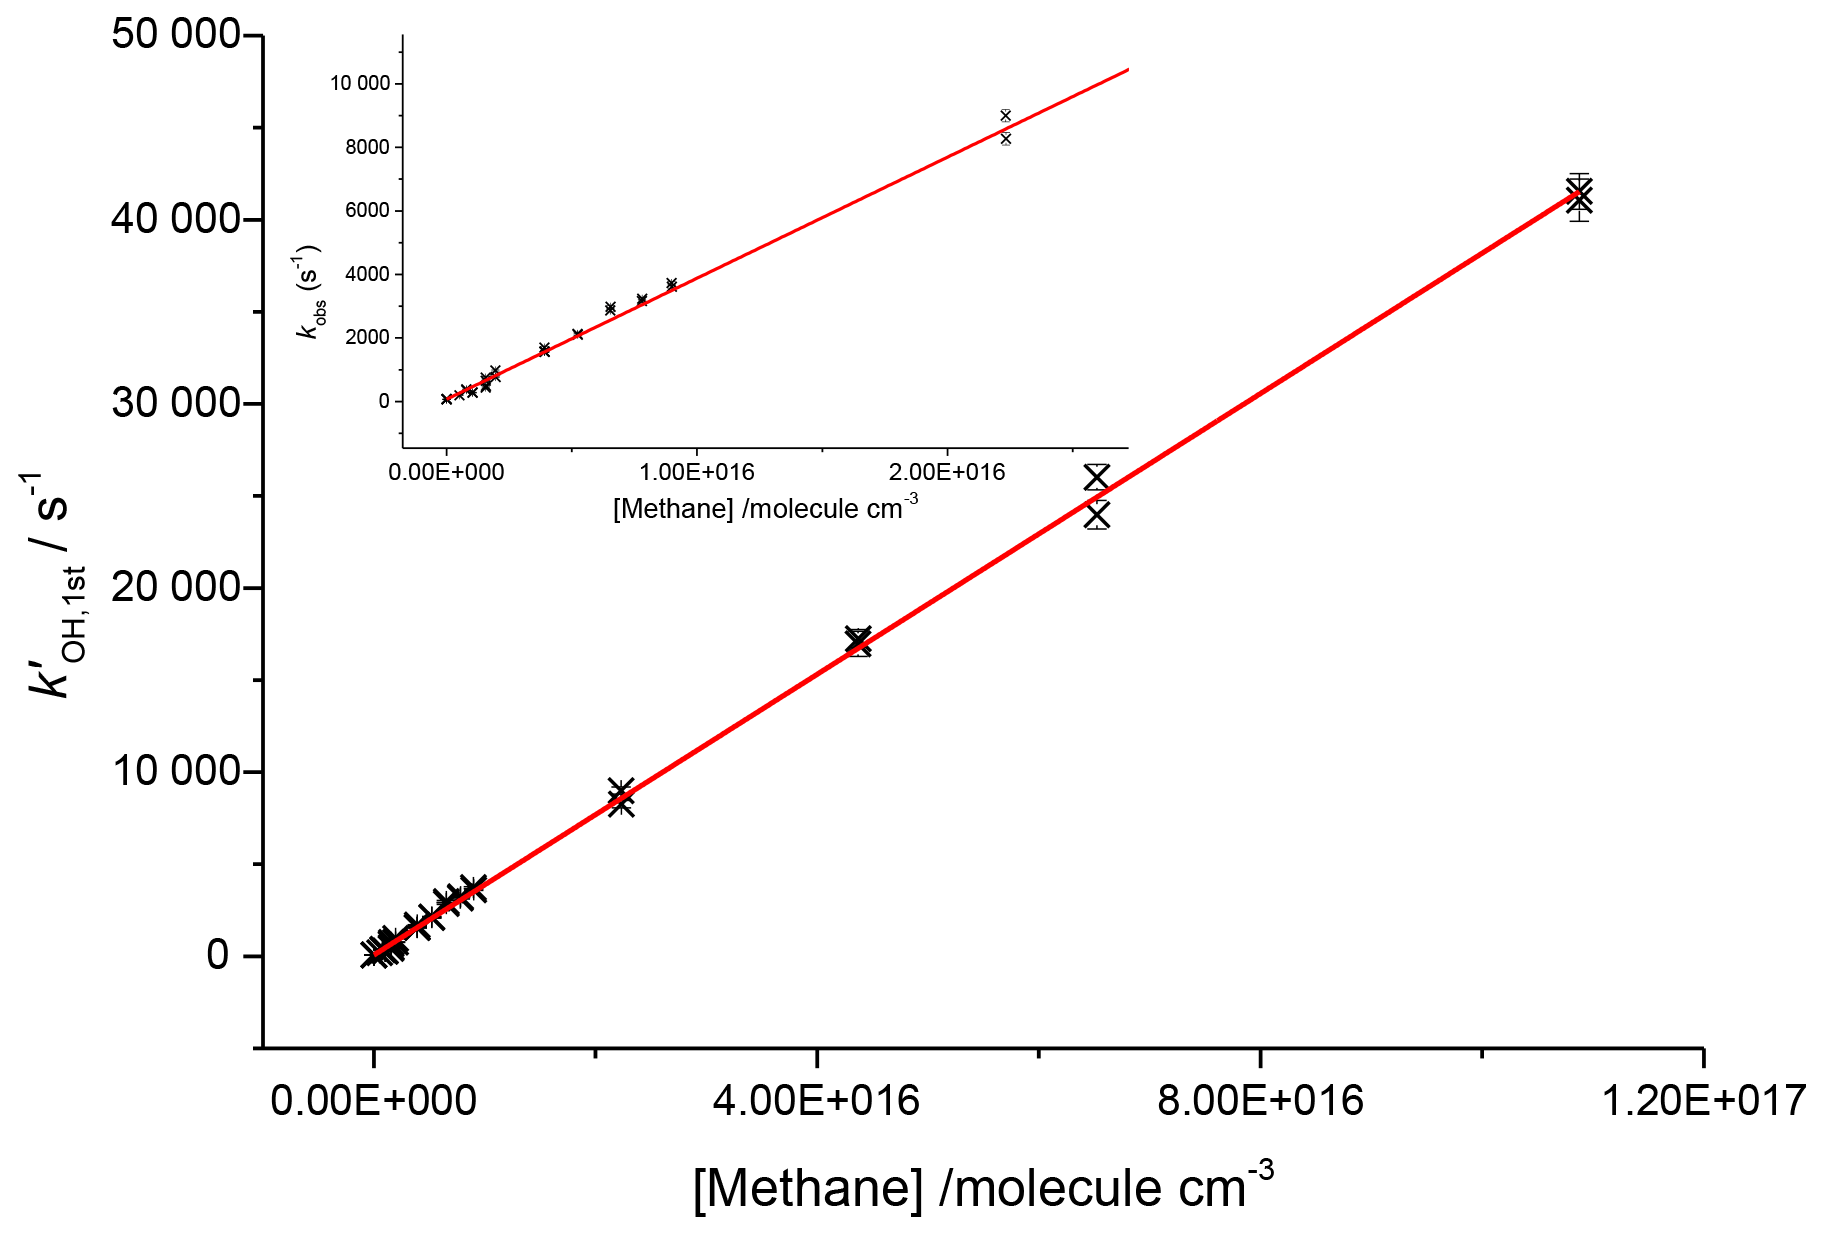
Figure 8Bimolecular plot for the reaction of OH and methane at 680 K and 1760 Torr using 193 nm photolysis of water as an OH precursor. Here the inset shows that even at removal rates <1000 s−1 the plot is still linear, indicating that within the measured experimental timescales there is little deviation in temperature.
The branching ratios for the sites of OH attack on n-butanol, as presented in Scheme 2, are of significance to the modelling of the ignition delay times for n-butanol (Agbro et al., 2017). Abstractions at the α and OH positions are chain-terminating reactions at low temperatures due to the formation of the relatively inert HO2 radical, and abstraction at the β site leads to chain propagation, through OH recycling. The new instrument permitted determination of the attack at the α and β sites; attack at the α site leads to prompt HO2 formation in the presence of O2; at elevated temperatures bi-exponential fits to non-single exponential OH loss traces in the absence of O2 (due to decomposition of the β hydroxy radical to OH and iso-butene) allowed for attack at the β site to be measured.
4.1 Room temperature OH kinetics
At room temperature under pseudo-1st-order conditions ( molec. cm−3, molec. cm−3), the OH loss traces recovered from the first detection axis from the jet expanded gas corresponded closely with single exponential decays. These decays relate to the overall loss process for the reaction of OH with n-butanol:
The resulting rate coefficients were plotted against the concentration of butanol, in the presence of both low and high oxygen, as shown in Fig. 9 (low oxygen molec. cm−3; high oxygen cm3 molec.−1 s−1), where , giving a resultant bimolecular removal rate of cm3 molec.−1 s−1 under low-oxygen conditions and cm3 molec.−1 s−1 under high-oxygen conditions.
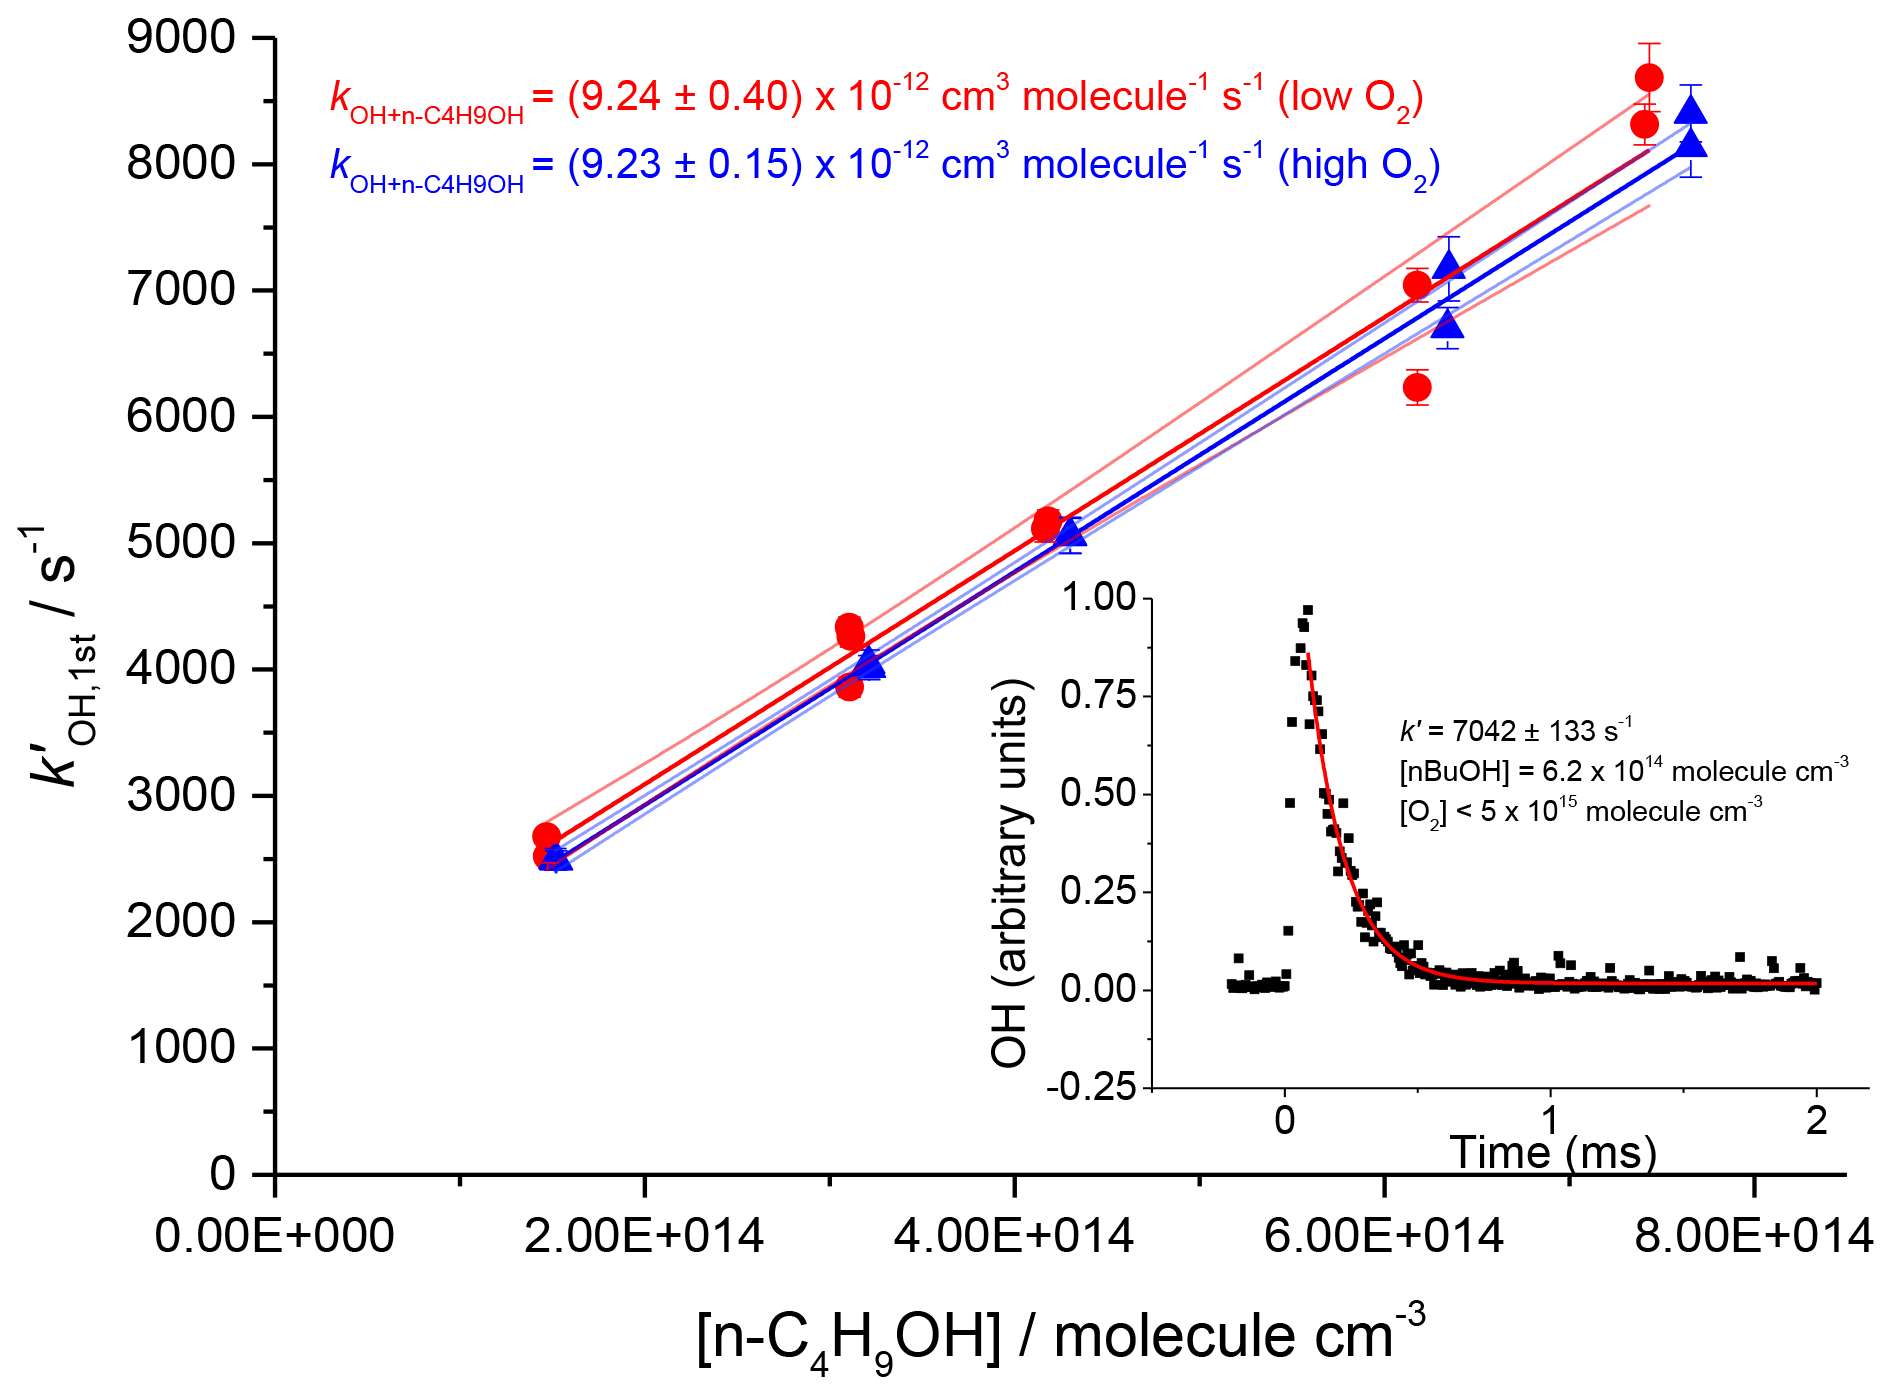
Figure 9Plots against the concentration of butanol, at two oxygen concentrations, and 1.2×10¹⁹ molec. cm−3. Bimolecular rate coefficients were taken from the slopes as cm3 molec.−1 s−1 under low-oxygen conditions (red circles with 95 % confidence limits), and cm3 molec.−1 s−1 under high oxygen conditions (blue triangles with 95 % confidence limits). The inset shows a typical OH temporal profile at the first detection axis.
The good agreement between the measured rate coefficients with varying [O2] verifies that, as expected under our experimental conditions at room temperature, the R radical formed from the β abstraction does not undergo fragmentation to OH and but-1-ene. The resultant combined data give an overall 293 K bimolecular rate coefficient for OH and n-butanol of cm3 molec.−1 s−1, which is in excellent agreement with the recent work of McGillen et al. (2013) of cm3 molec.−1 s−1.
4.2 Room temperature HO2 results
Experiments were carried out in high-oxygen conditions (3×10¹⁷–1.2×10¹⁸ molec. cm−3), at 296–303 K, and high pressures (1800–2000 Torr) of N2 bath gas using photolysis of hydrogen peroxide at two different wavelengths (248 and 266 nm), and the resulting HO2 yields are shown in Table 2. The resulting HO2 yield was determined to be (58±7) % at 266 nm and (55±12) % at 248 nm. As there is no significant variation in the yield with laser wavelength or power, we can treat the data in Table 2 as 12 independent estimates of the yield, giving an averaged HO2 yield of 57 % with a standard error (95 %) of 6 %. Therefore under the experimental conditions (pressure >1800 Torr, molec. cm−3), the HO2 yield, which originates from OH attack at the α abstraction site, was (57±6) %, with a minor contribution from abstraction from the hydroxyl group. The yield assigned is in good agreement with McGillen et al. (2013) at 57 % and Cavalli et al. (2002) at 52±7 %.
Table 2HO2 yields from experiments carried out at room temperature (293–298 K) with reaction initiated by photolysis of H2O2 at 248 and 266 nm.
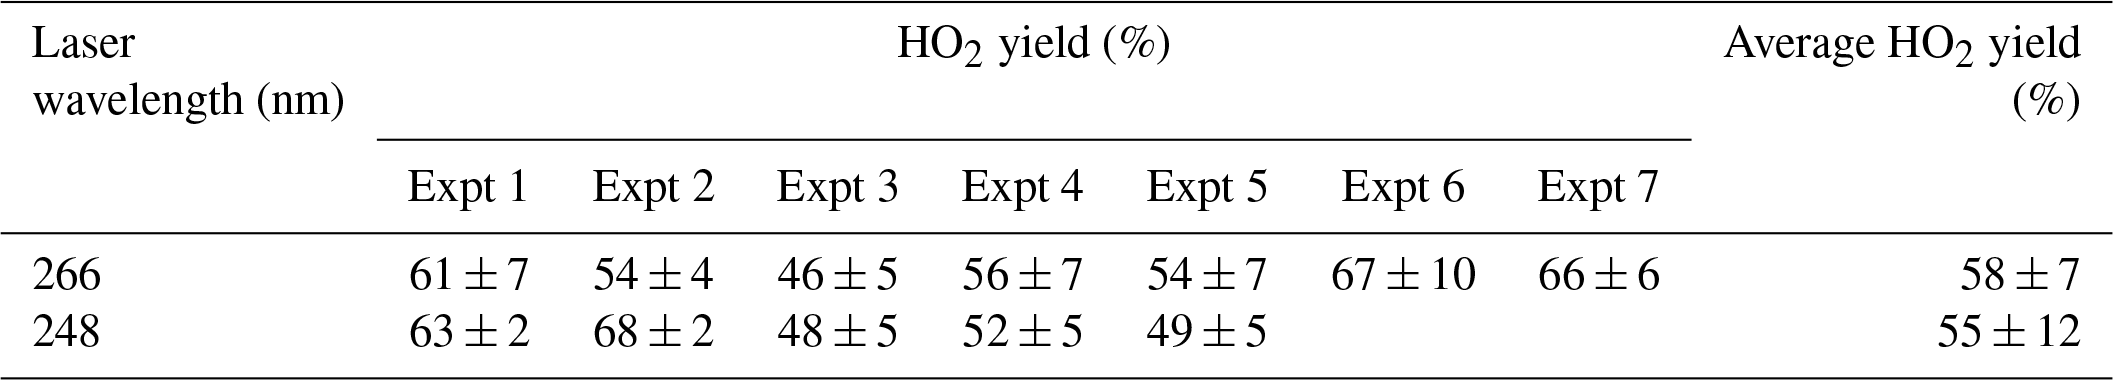
Experiments were carried out with photolysis at 266 nm and at a variety of laser energies at 248 nm the yields remained consistent with photolysis wavelength and power. Varying the laser power did alter the profiles of the HO2 traces recovered; the growth rates remained unaffected but the tails changed; decreasing laser power slowed the removal rate of HO2 (from greater than 100 s−1 to under 10 s−1) showing that radical–radical processes are the main source of HO2 loss from the system. If radical–radical reactions were an important source of any observed HO2 yield, changing laser power would have altered the HO2 yield and additionally the HO2 growth kinetics.
4.3 Higher temperature – HO2 yield and OH recycling
The R radical formed from abstraction at the β site (CH3CH2CHCH2OH) can regenerate OH and form butene, Scheme 2, in the absence of added oxygen. This process was not observed at ambient temperatures (293–305 K) but at elevated temperatures, 616–657 K, and the OH loss observed at the first detection axis was no longer well described by a single exponential loss process, Fig. 10. The non-exponential decays formed were due to OH being returned following decomposition of the β R radical. Bi-exponential fits to the recycling traces gave the fraction of OH returned (Medeiros et al., 2018), with an average β branching fraction of (23±4) %, Table 3.

Figure 10An example of the OH signal collected at the first detection axis for the reaction of OH with n-butanol ([nBuOH] molec. cm−3, at 616 K; black, red, and green points are three consecutive decays collected with differing timescales. The black line represents the least-squares fits to an exponential decay ( s−1), with the blue line representing a bi-exponential fit ( s−1)). Both lines are global fits to the three experiments.
Table 3OH recycling and HO2 yields from experiments carried out under elevated temperatures (>600 K); all experiments were carried out with photolysis at 248 nm.
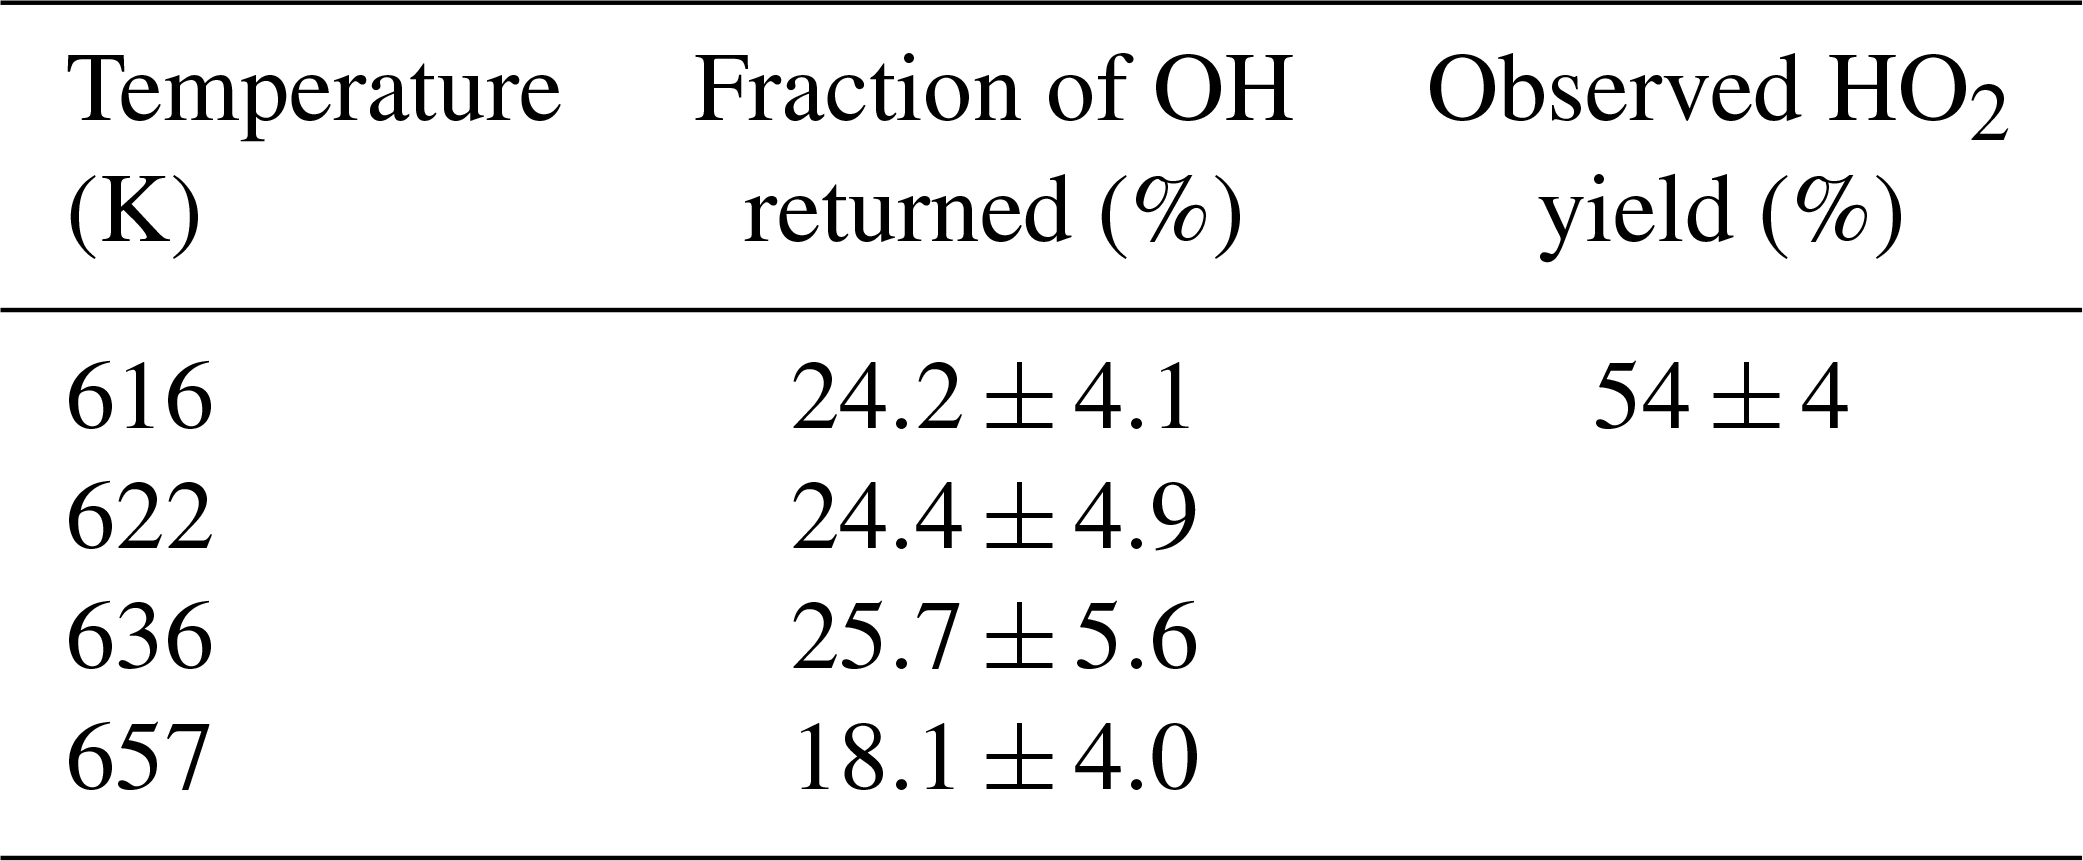
The HO2 yield measured at an elevated temperature (616 K), where OH recycling was also observed, was 54±4 % (Table 3), which is within error of the value (57±6 %) measured at room temperature (293 K), although it is not possible to partition the HO2 yield between α and OH abstraction. Over the temperature range tested the branching ratio for OH attack at the α position is therefore also likely to remain unchanged. With the sum of the α and β sites contributing (78±4) %, at 616 K, the remainder of the abstraction (∼22 %) occurs at the δ and γ sites. These results are in excellent agreement of the product study of Cavalli et al. (2002), which found (52±7) % α from the butanal product yield and (23±4) % β from the propanal yield using Fourier transform infrared (FTIR) detection and the site-specific analysis by McGillen et al. (2013) (57 % α and 26 % β). The product study of Hurley et al. (2009) found 44±4 % α and 19±2 % β values, which are lower than our experimental values but are within the combined error ranges. However, it should be noted that the β branching fraction of 23±4 % measured in this study was obtained at elevated temperatures, 616–657 K.
An instrument based on the FAGE technique for monitoring OH radicals and validated via reproduction of the literature kinetics of several OH reactions over a wide range of temperatures and pressures has been extended to allow for simultaneous HO2 and OH detection via the chemical titration of HO2 to OH with NO.
As mentioned in the introduction, the instrument has similarities to that presented by Nehr et al. (2011), where a FAGE system for sequential OH and HO2 is coupled to a lifetime instrument and yields of HO2 from OH-initiated reactions are reported. Although the principles of HOx detection used in both systems are similar, there are some significant differences between the two instruments. Some differences relate to the reaction cell in which the kinetics take place: 1 atm of air and 298 K for Nehr et al. (2011) and 0.5–5 atm of any gas and 298–800 K for this work. However, in principle, the Nehr et al. (2011) FAGE cell could be coupled to a different reaction cell to probe a wider range of conditions. A more substantial difference is the timescale of the chemistry taking place. Typical temporal profiles from Nehr et al. (2011) are of the order of a second compared to <10 ms in this work. The enhanced sensitivity of the Nehr et al. (2011) instrument means that radical–radical reactions should not interfere, but the technique may be subject to interferences from 1st-order (or pseudo-1st-order) reactions including heterogeneous processes. Detection of radicals in kinetics or yield experiments is difficult and studying reactions under a range of conditions is important to identify systematic errors; hence both instruments have a role to play.
The use of H2O2 as an OH precursor has been shown to provide a reliable method of internally characterizing our system for HO2 yield detection. Interferences that could arise from using this precursor for HO2 detection have been accounted for, and the presence of water that the H2O2 precursor introduces has no effect on the sensitivity of the LIF method, unlike IR absorption methods.
It has been demonstrated that this instrument can reliably assign HO2 yields and simultaneously measure OH kinetics, even under conditions of high temperatures and high oxygen concentrations, which could be challenging for other detection systems. Such conditions are important for exploring key combustion chemistry reactions and for converting slow atmospherically relevant processes to the microsecond timescales required to minimize secondary or heterogeneous chemistry.
By performing reactions under low NOx and low radical densities ( molec. cm−3), HO2 yields formed on fast timescales (>300 s−1) can be assigned to direct HO2 channels or reactions of alkyl (R) radicals with oxygen. Whilst some time resolution is lost at the HO2 detector, sufficient time resolution is retained in order to separate varying sources of HO2, for example the two channels leading to HO2 production in the system (Sect. 3.2) or from unwanted secondary chemistry.
For particular reactions, illustrated in this paper by the study of OH with methanol and butanol in the presence of oxygen, the simultaneous measurement of OH kinetics and HO2 yields can provide important site-specific information. In other systems, the onset of HO2 formation could allow for the assignment of new channels becoming important within complex mechanisms, potentially allowing for verifying the onset of OOQOOH chemistry within OH regeneration processes.
The raw data are available at the University of Leeds data repository and can be accessed at https://doi.org/10.5518/743 (Speak et al., 2019).
THS undertook most of the experimental measurements and contributed to the first draft of the paper. DS provided input into experimental design and analysis of transport effects. MAB and PWS led the project and completed the paper.
The authors declare that they have no conflict of interest.
This research has been supported by the NERC doctoral training programme “SPHERES” for T. Speak.
This paper was edited by Keding Lu and reviewed by Christa Fittschen and one anonymous referee.
Agbro, E., Tomlin, A. S., Lawes, M., Park, S., and Sarathy, S. M.: The influence of n-butanol blending on the ignition delay times of gasoline and its surrogates at high pressures, Fuel, 187, 211–219, https://doi.org/10.1016/j.fuel.201609.052, 2017.
Assaf, E. and Fittschen, C.: Cross Section of OH Radical Overtone Transition near 7028 cm−1 and Measurement of the Rate Constant of the Reaction of OH with HO2 Radicals, J. Phys. Chem. A, 120, 7051–7059, https://doi.org/10.1021/acs.jpca.6b06477, 2016.
Assaf, E., Liu, L., Schoemaecker, C., and Fittschen, C.: Absorption spectrum and absorption cross sections of the 2v1 band of HO2 between 20 and 760 Torr air in the range 6636 and 6639 cm−1, J. Quant. Spectrosc. Ra., 211, 107–114, https://doi.org/10.1016/j.jqsrt.2018.02.035, 2018.
Atkinson, R., Aschmann, S. M., Winer, A. M., and Pitts, J. N.: Rate constants for the reaction of OH radicals with a series of alkanes and alkenes at 299 ±2 K, Int. J. Chem. Kinet., 14, 507–516, https://doi.org/10.1002/kin.550140508, 1982.
Atkinson, R., Baulch, D. L., Cox, R. A., Crowley, J. N., Hampson, R. F., Hynes, R. G., Jenkin, M. E., Rossi, M. J., Troe, J., and IUPAC Subcommittee: Evaluated kinetic and photochemical data for atmospheric chemistry: Volume II – gas phase reactions of organic species, Atmos. Chem. Phys., 6, 3625–4055, https://doi.org/10.5194/acp-6-3625-2006, 2006.
Baeza-Romero, M. T., Blitz, M. A., Goddard, A., and Seakins, P. W.: Time-of-flight mass spectrometry for time-resolved measurements: Some developments and applications, Int. J. Chem. Kinet., 44, 532–545, https://doi.org/10.1002/kin.20620, 2012.
Brune, W. H., Stevens, P. S., and Mather, J. H.: Measuring OH and HO2 in the troposphere by laser-induced fluorescence at low-pressure, J. Atmos. Sci., 52, 3328–3336, https://doi.org/10.1175/1520-0469(1995)052<3328:MOAHIT>2.0.CO;2, 1995.
Cavalli, F., Geiger, H., Barnes, I., and Becker, K. H.: FTIR kinetic, product, and modeling study of the OH-initiated oxidation of 1-butanol in air, Environ. Sci. Technol., 36, 1263–1270, https://doi.org/10.1021/es010220s, 2002.
Crowley, J. N., Simon, F. G., Burrows, J. P., Moortgat, G. K., Jenkin, M. E., and Cox, R. A.: The HO2 radical UV absorption-spectrum measured by molecular modulation, UV diode-array spectroscopy, J. Photoch. Photobio. A, 60, 1–10, https://doi.org/10.1016/1010-6030(91)90001-a, 1991.
Dunlop, J. R. and Tully, F. P.: A kinetic study of OH radical reactions with methane and perdeuterated methane, J. Phys. Chem., 97, 11148–11150, https://doi.org/10.1021/j100145a003, 1993.
Edwards, G. D., Cantrell, C. A., Stephens, S., Hill, B., Goyea, O., Shetter, R. E., Mauldin, R. L., Kosciuch, E., Tanner, D. J., and Eisele, F. L.: Chemical ionization mass spectrometer instrument for the measurement of tropospheric HO2 and RO2, Anal. Chem., 75, 5317–5327, https://doi.org/10.1021/ac034402b, 2003.
Fuchs, H., Bohn, B., Hofzumahaus, A., Holland, F., Lu, K. D., Nehr, S., Rohrer, F., and Wahner, A.: Detection of HO2 by laser-induced fluorescence: calibration and interferences from RO2 radicals, Atmos. Meas. Tech., 4, 1209–1225, https://doi.org/10.5194/amt-4-1209-2011, 2011.
Gianella, M., Reuter, S., Aguila, A. L., Ritchie, G. A. D., and van Helden, J. P. H.: Detection of HO2 in an atmospheric pressure plasma jet using optical feedback cavity-enhanced absorption spectroscopy, New J. Phys., 18, 113027, https://doi.org/10.1088/1367-2630/18/11/113027, 2016.
Glowacki, D. R., Goddard, A., Hemavibool, K., Malkin, T. L., Commane, R., Anderson, F., Bloss, W. J., Heard, D. E., Ingham, T., Pilling, M. J., and Seakins, P. W.: Design of and initial results from a Highly Instrumented Reactor for Atmospheric Chemistry (HIRAC), Atmos. Chem. Phys., 7, 5371–5390, https://doi.org/10.5194/acp-7-5371-2007, 2007.
Hanke, M., Uecker, J., Reiner, T., and Arnold, F.: Atmospheric peroxy radicals: ROXMAS, a new mass-spectrometric methodology for speciated measurements of HO2 and SRO2 and first results, Int. J. Mass Spectrom., 213, 91–99, https://doi.org/10.1016/s1387-3806(01)00548-6, 2002.
Hard, T. M., O'Brien, R. J., Chan, C. Y., and Mehrabzadeh, A. A.: Tropospheric Free-radical determination by FAGE, Environ. Sci. Technol., 18, 768–777, 1984.
Hurley, M. D., Wallington, T. J., Lauirsen, L., Javadi, M. S., Nielsen, O. J., Yamanaka, T., and Kawasaki, M.: Atmospheric Chemistry of n-Butanol: Kinetics, Mechanisms, and Products of Cl Atom and OH Radical Initiated Oxidation in the Presence and Absence of NOx, J. Phys. Chem. A, 113, 7011–7020, https://doi.org/10.1021/jp810585c, 2009.
Jemialade, A. A. and Thrush, B. A.: Reactions of HO2 with NO and NO2 studied by midinfrared laser magnetic-resonance, J. Chem. Soc. Faraday T., 86, 3355–3363, https://doi.org/10.1039/ft9908603355, 1990.
McCaulley, J. A., Kelly, N., Golde, M. F., and Kaufman, F.: Kinetic studies of the reactions of F and OH with CH3OH, J. Phys. Chem., 93, 1014–1018, https://doi.org/10.1021/j100340a002, 1989.
McGillen, M. R., Baasandorj, M., and Burkholder, J. B.: Gas-Phase Rate Coefficients for the OH plus n-, i-, s-, and t-Butanol Reactions Measured Between 220 and 380 K: Non-Arrhenius Behavior and Site-Specific Reactivity, J. Phys. Chem. A, 117, 4636–4656, https://doi.org/10.1021/jp402702u, 2013.
Medeiros, D. J., Blitz, M. A., James, L., Speak, T. H., and Seakins, P. W.: Kinetics of the Reaction of OH with Isoprene over a Wide Range of Temperature and Pressure Including Direct Observation of Equilibrium with the OH Adducts, J. Phys. Chem. A, 122, 7239–7255, https://doi.org/10.1021/acs.jpca.8b04829, 2018.
Monks, P. S.: Gas-phase radical chemistry in the troposphere, Chem. Soc. Rev., 34, 376–395, https://doi.org/10.1039/B307982C, 2005.
Moore, S. B. and Carr, R. W.: Molecular velocity distribution effects in kinetic studies by time-resolved mass-spectrometry, Int. J. Mass Spectrom., 24, 161–171, https://doi.org/10.1016/0020-7381(77)80023-5, 1977.
Nehr, S., Bohn, B., Fuchs, H., Hofzumahaus, A., and Wahner, A.: HO2 formation from the OH plus benzene reaction in the presence of O2, Phys. Chem. Chem. Phys., 13, 10699–10708, https://doi.org/10.1039/c1cp20334g, 2011.
Onel, L., Brennan, A., Gianella, M., Ronnie, G., Lawry Aguila, A., Hancock, G., Whalley, L., Seakins, P. W., Ritchie, G. A. D., and Heard, D. E.: An intercomparison of HO2 measurements by fluorescence assay by gas expansion and cavity ring-down spectroscopy within HIRAC (Highly Instrumented Reactor for Atmospheric Chemistry), Atmos. Meas. Tech., 10, 4877–4894, https://doi.org/10.5194/amt-10-4877-2017, 2017.
Orlando, J. J., Tyndall, G. S., Bilde, M., Ferronato, C., Wallington, T. J., Vereecken, L., and Peeters, J.: Laboratory and theoretical study of the oxy radicals in the OH- and Cl-initiated oxidation of ethene, J. Phys. Chem. A, 102, 8116–8123, https://doi.org/10.1021/jp981937d, 1998.
Orlando, J. J., Tyndall, G. S., and Wallington, T. J.: The atmospheric chemistry of alkoxy radicals, Chem. Rev., 103, 4657–4689, 2003.
Reitz, R. D. and Duraisamy, G.: Review of high efficiency and clean reactivity controlled compression ignition (RCCI) combustion in internal combustion engines, Prog. Energ. Combust., 46, 12–71, https://doi.org/10.1016/j.pecs.2014.05.003, 2015.
Speak, T. H., Blitz, M. A., Stone, D., and Seakins, P. W.: Data for the publication “A new instrument for time-resolved measurement of HO2 radicals”, University of Leeds, Leeds, UK, https://doi.org/10.5518/743, 2019.
Stockwell, W. R., Lawson, C. V., Saunders, E., and Goliff, W. S.: A Review of Tropospheric Atmospheric Chemistry and Gas-Phase Chemical Mechanisms for Air Quality Modeling, Atmosphere, 3, 1–32, 2012.
Stone, D., Whalley, L. K., and Heard, D. E.: Tropospheric OH and HO2 radicals: field measurements and model comparisons, Chem. Soc. Rev., 41, 6348–6404, https://doi.org/10.1039/c2cs35140d, 2012.
Stone, D., Blitz, M., Ingham, T., Onel, L., Medeiros, D. J., and Seakins, P. W.: An instrument to measure fast gas phase radical kinetics at high temperatures and pressures, Rev. Sci. Instrum., 87, 054102, https://doi.org/10.1063/1.4950906, 2016.
Taatjes, C. A. and Oh, D. B.: Time-resolved wavelength modulation spectroscopy measurements of HO2 kinetics, Appl. Optics, 36, 5817–5821, https://doi.org/10.1364/ao.36.005817, 1997.
Taatjes, C. A.: How does the molecular velocity distribution affect kinetics measurements by time-resolved mass spectrometry?, Int. J. Chem. Kinet., 39, 565–570, https://doi.org/10.1002/kin.20262, 2007.
Thiebaud, J. and Fittschen, C.: Near infrared cw-CRDS coupled to laser photolysis: Spectroscopy and kinetics of the HO2 radical, Appl. Phys. B-Lasers O., 85, 383–389, https://doi.org/10.1007/s00340-006-2304-0, 2006.
Tully, F. P.: Laser photolysis laser-induced fluorescence study of the reaction of hydroxyl radical with ethylene, Chem. Phys. Lett., 96, 148–153, https://doi.org/10.1016/0009-2614(83)80481-3, 1983.
Whalley, L. K., Blitz, M. A., Desservettaz, M., Seakins, P. W., and Heard, D. E.: Reporting the sensitivity of laser-induced fluorescence instruments used for HO2 detection to an interference from RO2 radicals and introducing a novel approach that enables HO2 and certain RO2 types to be selectively measured, Atmos. Meas. Tech., 6, 3425–3440, https://doi.org/10.5194/amt-6-3425-2013, 2013.
Wine, P. H., Semmes, D. H., and Ravishankara, A. R.: A laser flash-photolysis kinetics study of the reaction , J. Chem. Phys., 75, 4390–4395, https://doi.org/10.1063/1.442602, 1981.
Winiberg, F. A. F., Smith, S. C., Bejan, I., Brumby, C. A., Ingham, T., Malkin, T. L., Orr, S. C., Heard, D. E., and Seakins, P. W.: Pressure-dependent calibration of the OH and HO2 channels of a FAGE HOx instrument using the Highly Instrumented Reactor for Atmospheric Chemistry (HIRAC), Atmos. Meas. Tech., 8, 523–540, https://doi.org/10.5194/amt-8-523-2015, 2015.
Zador, J., Taatjes, C. A., and Fernandes, R. X.: Kinetics of elementary reactions in low-temperature autoignition chemistry, Prog. Energ. Combust., 37, 371–421, https://doi.org/10.1016/j.pecs.2010.06.006, 2011.