the Creative Commons Attribution 4.0 License.
the Creative Commons Attribution 4.0 License.
 | 20 Feb 2020
Concurrent satellite and ground-based lightning observations from the Optical Lightning Imaging Sensor (ISS-LIS), the low-frequency network Meteorage and the SAETTA Lightning Mapping Array (LMA) in the northwestern Mediterranean region
Felix Erdmann
Eric Defer
Olivier Caumont
Richard J. Blakeslee
Stéphane Pédeboy
Sylvain Coquillat
The new space-based Lightning Imager (LI) onboard the Meteosat Third Generation (MTG) geostationary satellite will improve the observation of lightning over Europe, the Mediterranean Sea, Africa and the Atlantic Ocean from 2021 onwards. In preparation for the use of the upcoming MTG-LI data, we compare observations by the Lightning Imaging Sensor (LIS) on the International Space Station (ISS), which applies an optical technique similar to MTG-LI, to concurrent records of the low-frequency (LF) ground-based network Meteorage. Data were analyzed over the northwestern Mediterranean Sea from 1 March 2017 to 20 March 2018. Flashes are detected by ISS-LIS using illuminated pixels, also called events, within a given (2.0 ms) frame and during successive frames. Meteorage describes flashes as a suite of intra-cloud and cloud-to-cloud (IC) pulses and/or cloud-to-ground (CG) strokes. Both events as well as pulses and strokes are grouped to flashes using a novel in-house algorithm.
In our study, ISS-LIS detects about 57 % of the flashes detected by Meteorage. The flash detection efficiency (DE) of Meteorage relative to ISS-LIS exceeds 80 %. Coincident matched flashes detected by the two instruments show a good spatial and temporal agreement. Both peak and mean distances between matches are smaller than the ISS-LIS pixel resolution (about 5.0 km). The timing offset for matched ISS-LIS and Meteorage flashes is usually shorter than the ISS-LIS integration time frame (2.0 ms). The closest events and the pulses and strokes of matched flashes achieve sub-millisecond offsets. Further analysis of flash characteristics reveals that longer-lasting and more spatially extended flashes are more likely detected by both ISS-LIS and Meteorage than shorter-duration and smaller-extent flashes. The ISS-LIS relative DE is lower for daytime versus nighttime as well as for CG versus IC flashes.
A second ground-based network, the very high-frequency (VHF) SAETTA Lightning Mapping Array (LMA), further enhances and validates the lightning pairing between ISS-LIS and Meteorage. It also provides altitude information on the lightning discharges and adds a detailed lightning mapping to the comparison for verification and better understanding of the processes. Both ISS-LIS and Meteorage flash detections feature a high degree of correlation with the SAETTA observations (without altitude information). In addition, Meteorage flashes with ISS-LIS match tend to be associated with discharges that occur at significantly higher altitudes than unmatched flashes. Hence, ISS-LIS flash detection suffers from degradation, with low-level flashes resulting in lower DE.
- Article
(4415 KB) - Full-text XML
- BibTeX
- EndNote


Lightning defines electrical discharges within the atmosphere. The discharges can happen within a cloud, between clouds (IC), or between a cloud and the ground (CG). The total lightning activity (IC+CG) is of interest for, e.g., numerical weather prediction (NWP) as lightning serves as tracer for deep convection. The total lightning flash rate is associated with storm intensity features. For example, Deierling and Petersen (2008) found a strong correlation between the updraft volume above the −5 ∘C level in clouds and total lightning activity. Deierling et al. (2008) show a fairly stable relationship and strong correlation between the precipitation ice mass flux, the non-precipitation ice mass flux and their product on the one hand and the total lightning flash rate on the other. Graupel and small hail ice mass correlate especially well with the mean total lightning rate in their study. Among others, Mattos et al. (2017) investigated the life cycle of thunderstorms and processes leading to the different discharge types. They found in their analysis of 46 isolated thunderstorms that in 98 % of their cases, the first CG flash is preceded by IC lightning by approximately 6 min on average.
At this time, lightning observations in Europe are mainly made with ground-based sensors. To maximize the impact of lightning data on assimilation in NWP systems, total lightning should be observed continuously over large areas. In a few years, the new Lightning Imager (LI) onboard the Meteosat Third Generation (MTG) satellite (Stuhlmann et al., 2005) will provide continuous lightning observation over Europe, the Mediterranean Sea, Africa, the Atlantic Ocean and parts of Brazil. The satellite sensor will be able to detect total lightning including CG and IC flashes when launched in the 2021 time frame. The Lightning Imaging Sensor (LIS) on the International Space Station (ISS) (Blakeslee and Koshak, 2016) creates a unique opportunity to provide proxy data to help prepare research and operational applications for the MTG-LI data. It overpasses, among others, wide parts of Europe, including the entire Mediterranean region. ISS-LIS is in principle similar to the planned MTG-LI so that ISS-LIS data can to some extent mimic the upcoming MTG-LI data. In addition, a comparison between European ground-based lightning observation networks and ISS-LIS should improve the understanding of ground- and space-based lightning observations. All instruments and networks are hereafter simply referred to as lightning locating systems (LLSs).
These comparisons focus on the spatial and temporal coincidence of flashes reported by the various systems, resulting in measures of detection efficiency (DE) as a function of the flash parameters. This study uses the term relative DE. It is defined as the ratio of the number of matched flashes to the number of flashes in the other (reference) LLS, expressed as a percentage.
An LIS was previously operational on the Tropical Rainfall Measurement Mission (TRMM) satellite (e.g., Christian et al., 1999; Cecil et al., 2005). Several LLSs comparisons exist for regions covered by TRMM-LIS. The focus of the following (not exhaustive) literature review is on observational analyses rather than laboratory experiments; e.g., Boccippio et al. (2002). Ground-based LLSs observe different frequency ranges of the lightning radio signal. They are classified as, e.g., very low-frequency (VLF) and low-frequency (LF) LLSs as well as very high-frequency (VHF) LLSs (e.g., Fig. 2; Cummins and Murphy, 2009). A summary of detection characteristics, (dis)advantages and the range of the various ground-based LLSs is provided in Nag et al. (2015). VLF–LF systems detect lightning at middle to long ranges. Their DE is somewhat limited. It varies for different networks and flash types (CG flash DE is usually higher than IC flash DE for VLF–LF LLSs) but increases in general with lower baseline distance.
Thompson et al. (2014) aimed to explore suitable proxy data for the Geostationary Lightning Mapper (GLM) (Goodman et al., 2013). They report a pulse and stroke DE maximum for two long-range LLSs, the World Wide Lightning Location Network (WWLLN) and the Earth Networks Total Lightning Location Network (ENTLN), of 18.9 % and 63.3 %, respectively, relative to 18-month records of TRMM-LIS groups (a combination of adjacent illuminated pixels in the optical image that occur in the same 2 ms time frame). The maxima were found over the Pacific Ocean for WWLLN and near North America for ENTLN (within the analyzed region with the highest sensor density) in 2010 and 2011. They did not study how many WWLLN and ENTLN pulses and/or strokes had coincident TRMM-LIS groups.
Rudlosky et al. (2017) analyzed the performance of the Global Lightning Dataset 360 (GLD360) relative to TRMM-LIS from 2012 to 2014 in different regions. GLD360 was able to detect 63.6 % of the TRMM-LIS flashes in North America in 2014, the maximum DE reported in their study. The performance steadily increased from 2012 to 2014. The relative DE of GLD360 increased with the TRMM-LIS flash duration, flash extent and group number. The mean (median) location offset of the nearest GLD360 stroke to the matched TRMM-LIS flashes was 8.7 km (7.0 km). Rudlosky et al. (2017) applied the assumption that TRMM-LIS would detect all flashes within its field of view but did not study the reverse problem, i.e., the relative DE of TRMM-LIS to the GLD360 flashes or strokes.
Defer et al. (2005) used both the UK Met Office long-range VLF arrival time difference (ATD) system and TRMM-LIS to study the lightning activity in the eastern Mediterranean Sea for 20 d during winter 2008–2009. For their investigation of the flash scale, they developed and employed their own algorithm for TRMM-LIS flashes. The flash density analysis exhibits a general agreement between ATD and TRMM-LIS. The relatively small dataset, and the fact that ATD detected mostly CG lightning, limited the ability to gain overall statistics.
Bitzer et al. (2016) tested a Bayesian approach on the DE of TRMM-LIS and ENTLN by implementing the conditional DEs of the two LLSs relative to each other. They found a relative conditional group-to-pulse DE of 52 % (27 %) for TRMM-LIS to ENTLN (ENTLN to TRMM-LIS near North America in 2013). They also addressed peak timing differences and distances for the collocated discharges (again LIS groups, ENTLN pulses; see Sect. 3.2 for details). Bitzer et al. further tested the effect of assimilating one dataset into the other on the detected number of discharges; i.e., 23.6 % of discharges could be added to the total number of observed flashes after combining the datasets.
While the previous papers focused on the DE, Höller and Betz (2010) analyzed TRMM-LIS and a VLF–LF lightning location network (LINET) in order to generate random proxy optical data from a given set of LINET data using model distribution functions. The outcomes are of specific interest for proxy data for the MTG-LI. Besides the relative DEs (approximately 50 % for both LLSs), they investigated the distribution functions and correlations between the TRMM-LIS group and the LINET pulse and stroke number per flash, flash extent, and duration as well as between LINET pulse and stroke amplitude and TRMM-LIS group radiance. Although the Pearson correlation coefficients remained low, the approach can be further refined for high-fidelity MTG-LI proxy data.
VHF LLSs are sensitive to lightning channel formation and leader processes, which occur multiple times during a single flash. Hence, VHF LLSs typically feature high DE performances and three-dimensional (3-D) mapping of lightning channel propagation and spatial extent (Thomas et al., 2004). VHF LLSs depend on direct line-of-sight detection, and thus the range suffers from the Earth's curvature and terrain shading effects.
Thomas et al. (2000) presented a case study of a storm in Oklahoma, USA, at local nighttime. The storm was observed by both the local VHF lightning mapping array (LMA) and TRMM-LIS; 108 of the 128 LMA lightning discharges were detected by TRMM-LIS, and the LMA detected all TRMM-LIS flashes. The lightning missed by TRMM-LIS was mainly confined to low-altitude discharges, i.e., below 7.0 km. Optical signals of lightning discharges that propagated via scattering to the upper part of the cloud were easily detected by TRMM-LIS.
Blakeslee et al. (2013) studied the São Paulo LMA (SP LMA) dataset and its capability to serve as GLM proxy data. TRMM-LIS events were in good agreement with the concurrent SP LMA, ENTLN and LINET observations regarding latitude, longitude and timing. The records showed as expected more VHF (SP LMA) sources than VLF pulses and strokes (ENTLN and LINET) per flash.
Due to the TRMM satellite orbit, the comparisons of TRMM-LIS and ground-based LLSs records are restricted to tropical and subtropical regions between about 38∘ N and 38∘ S. As a result of its higher-inclination orbit, ISS-LIS now allows for the observation of extratropical thunderstorms to extend to 55∘ N and 55∘ S. The higher-latitude storms might show different behaviors to their tropical and subtropical counterparts due to modified cloud vertical extent and forcing like the general wind field, average temperature and temperature gradients. Our study concentrates on the characteristics of lightning flashes over the northwestern (NW) Mediterranean Sea and should contribute to a better understanding of both European storms and European LLSs. This allows for the first time an intercomparison of LIS and European LLSs. Three LLSs operating in different spectral regions (near-IR, VLF–LF, VHF) are compared: the satellite-based ISS-LIS operational since March 2017, the French Meteorage VLF–LF LLS and the VHF SAETTA LMA on Corsica. The relative DE of ISS-LIS to Meteorage (and reverse) is analyzed, while SAETTA is used to verify and understand the results. Indeed, the spatially and temporally high resolution of SAETTA's measurements capture the structure and the life cycle of each lightning flash and gather additional information, i.e., discharge altitude, to more thoroughly assess ISS-LIS and Meteorage strengths and weaknesses. Besides the commonly investigated relative DEs, distances and timing offsets, this work also examines specific characteristics of matched ISS-LIS and Meteorage flashes. It aims to provide the basis for mimicking optical satellite-based lightning data from a VLF–LF LLS.
In Sect. 2, ISS-LIS, Meteorage and SAETTA are introduced as are the data processing, developed algorithms and the investigation methodology. Results are presented in Sect. 3. A brief summary and a discussion are given in Sect. 4.
This paper aims to identify the individual lightning detection characteristics by the satellite-based ISS-LIS, the VLF–LF Meteorage and the VHF SAETTA LLSs. ISS-LIS, installed on the International Space Station in 2017, has been acquiring data since 1 March 2017. Our intercomparison of the LLSs covers the period from 1 March 2017 until 20 March 2018. The region was limited to 40.5 to 44.0∘ N and 7.0 to 11.0∘ E around the island of Corsica in the NW Mediterranean Sea. Figure 1 shows the domain with accumulated data of one overpass (a), an infrared (IR) satellite picture (b), and the example of one flash recorded by ISS-LIS, Meteorage and SAETTA (c). The three instruments are introduced within this section. In total, the ISS-LIS field of view (FOV) intersected the region of interest 851 times during the study period, with 26 of the overpasses exhibiting lightning activity. In this work, all times are given in Coordinated Universal Time (UTC). Altitudes are defined above sea level (a.s.l.). Distances are calculated using Vincenty's formulae (Vincenty, 1975) based on the WGS 84 reference ellipsoid, which is more accurate on Earth than, for example, great circle distances (assumes the Earth as an oblate sphere rather than a sphere). The term detection efficiency (DE) means in the following the DE for flashes, not the event or pulse–stroke DE.

Figure 1Observations of ISS-LIS events (as pixel centers), Meteorage pulses and strokes, and SAETTA VHF sources (as indicated) during one ISS overpass over Corsica on 10 September 2017 (a). The ISS-LIS viewtime is presented as grayscale in the background. Numbers in parentheses give the number of SAETTA VHF sources, ISS-LIS events, and Meteorage pulses and strokes, respectively. Panel (b) shows the infrared (IR 10.8 µm) satellite image of the same day at 01:15:00 UTC (data visualization provided by the AERIS/ICARE Data and Services Center). One flash over Corsica detected by the three LLSs during the same ISS overpass is shown in (c) as a map and (d) as time series of latitude, longitude, signal strength amplitude (dBW for SAETTA, kA for Meteorage and amplitude count for ISS-LIS) and altitude (LIS and Meteorage set to 15 km).
2.1 ISS-LIS
The ISS operates in low Earth orbit (LEO) and overpasses one region on the surface up to three times a day (up to two times in the tropics). Lightning observation of a specific point lasts up to 90 s per overpass due to the ISS orbit characteristics and the LIS FOV of approximately 655×655 km2. The optical lightning detection is performed at a wavelength of 777.4 nm at the atomic oxygen line. ISS-LIS observes both IC and CG discharges but cannot distinguish the lightning type. ISS-LIS captures an image of the Earth every 2 ms, referred to as a frame. The LIS focal plane consists of a 128×128 pixel charge-coupled device (CCD) that is read out every 2 ms. The pixel FOV ranges between 4.5 km (nadir) and 6.2 km at the edges (Dennis Buechler, personal communication 2019). Blakeslee and Koshak (2016) apply a four-step filtering approach, involving a spatial, spectral, temporal and background subtraction filter, to identify pixels with lightning activity. This is required to detect the lightning during daytime when the sunlight reflected off the cloud tops otherwise overwhelms and masks the lightning signal (i.e., it is daytime lightning detection that drives the design of space-based lightning detectors such as LIS and the new MTG-LI). An illuminated pixel that breaks a predefined threshold in a given 2 ms frame is identified as an event. Events define the smallest units of the optical signals in the ISS-LIS dataset. Their latitude and longitude correspond to the pixel center. A group is the next unit of ISS-LIS data. An ISS-LIS group contains one or more events occurring within the same time frame and in adjacent pixels of the ISS-LIS image (Christian et al., 2000). Next, groups are organized into flashes so that a flash can consist of one or multiple groups. A weighted Euclidean distance (WED) employs spatial and temporal clustering with 330 ms and 5.5 km, respectively, to merge groups in flashes (Mach et al., 2007). The locations of groups and flashes are defined by the radiance-weighted average positions of their events and groups, respectively. Finally, an area contains all flashes with distances of less than 16.5 km to each other. The National Aeronautics and Space Administration (NASA) provides the ISS-LIS at different post-processing levels. In the latest available version, P0.2, the quality control is already close to its (expected) final stage, but the data may contain some undetected minor errors (Blakeslee et al., 2017). The main difference will concern the detection efficiency. The fully validated flash density should not differ more than 5.0 % to 10.0 % from version P0.2 (Richard J. Blakeslee, personal communication, 2018). LIS data comprise 2 ms scientific data, e.g., the time, latitude, longitude and optical amplitude count of events and instrument, platform or external errors to verify the data quality, and housekeeping data. The available ISS-LIS P0.2 version data do not yet include the (background-)calibrated radiance. The strength of the optical signal is defined by the raw amplitude count. It depends somewhat on the background value, but in general the radiance increases with the raw count (Dennis E. Buechler, NASA MSFC, personal communication, 2019). The housekeeping data, received every second, contain among others LIS viewtime with information about the FOV at a certain time. It is provided on a grid. ISS-LIS viewtime is fundamental for the intercomparison to continuous observations at the ground.
The original ISS-LIS data contain times in International Atomic Time with reference to the 1 January 1993 format (TAI93). For intercomparison of the LLSs, times are converted to UTC while taking the missing leap seconds into account. The ISS-LIS times include a time-of-flight (TOF) correction accounting for the time photons need to travel from the optical source at cloud top to the satellite.
2.2 Meteorage
The Meteorage LF LLS uses Vaisala LS7002 sensors (Vaisala, 2013) at a frequency between 1 and 350 kHz. It includes 21 ground sensors across France and contributes to the European Cooperation for Lightning Detection (EUCLID). EUCLID comprises lightning sensors all over Europe and helps to improve the performance of national LLSs (Schulz et al., 2016). The LS7002 sensors measure the signals related to CG strokes as well as IC pulses and thus the total lightning. Vaisala has a CG DE of 95 % and a DE for IC of 50 %. Pédeboy et al. (2018a) stated that indeed 97 % of the CG flashes and 56 % of the IC flashes were detected by Meteorage (68.3 % overall DE relative to LMA flashes). The theoretical median location accuracy is approximately 250 m and improves inside the network to about 150 m. Pédeboy et al. (2018a) found a reduced median location accuracy for IC flashes of 1.64 km. Time synchronization applies a GPS receiver with an accuracy of 50 ns to UTC. The lightning location needs at least two sensors (each provides a time and an angle of arrival) by applying combined magnetic direction finding and time-of-arrival techniques. Lightning can be detected at a distance up to 1500 km from a sensor. In practice, the use of ionospheric reflection is avoided, hence limiting the sensor range to about 625 km. It ensures that the ground plane wave front of the signal is measured rather than a reflected wave of the lightning-related signal. Our study makes use of Meteorage lightning pulse and stroke data. For each pulse and stroke, the occurrence time, latitude, longitude, the amplitude with polarity and the type (IC/CG) are provided. Meteorage observes lightning continuously within its range. In the intercomparison with ISS-LIS, data are disregarded if observation space or time do not fit the corresponding ISS-LIS viewtimes.
2.3 SAETTA (Suivi de l’Activité Electrique Tridimensionnelle Totale de l’Atmosphère)
The LMA technology was developed by New Mexico Tech (Rison et al., 1999). The SAETTA LMA operates in the 60–66 MHz VHF band, with an 80 µs analysis window (Coquillat et al., 2014), and consists of 12 LMA stations distributed over the island of Corsica. The distance between the network's northernmost and southernmost (westernmost and easternmost) stations is approximately 180 km (70 km). The station altitude ranges from 3.8 to 1950.2 m a.s.l. SAETTA maps the total lightning activity. A minimum of six stations is needed to capture a lightning source in 3-D. Redundant information from more stations improves the location accuracy and consequently decreases the chance of mislocation and possible noise (e.g., single VHF sources in Fig. 1c). As a drawback, fewer VHF sources and flashes are detected simultaneously by more than six stations. Aiming at a high flash DE, coincident signals at six stations are sufficient for the LMA data in this study.
SAETTA data include the time, latitude, longitude, altitude and amplitude of each lightning source. Lightning location reaches up to a radius of 350 km from the center of the network. The VHF LLS depends on the direct line of sight to a lightning discharge. The altitude of the lowest detectable VHF source increases with the distance to the LMA due to Earth curvature. For example, sources at 100 km (200 km) of distance to a station at sea level must be at least 0.8 km (3.1 km) in altitude to be visible to that station. Equation (6) of Koshak et al. (2018) is applied here. Their study also investigates the effects of the LMA network geometry, mainly on the altitude errors. For SAETTA, Coquillat et al. (2019a) show that the displacement of two stations in 2016 markedly reduced the radial error and increased the altitude error over wide parts of the studied domain (Fig. 3 in Coquillat et al., 2019a). Therefore, when different sets of at least six stations are involved in the reconstruction of the VHF source position one would expect a different geometry of the network, which influences the location precision. In general the SAETTA location uncertainty increases with the distance to the network center. According to the theoretical model of Thomas et al. (2004), the radial, azimuthal and altitude errors are, at best for VHF sources at 10 km of altitude, 15, 8 and 40 m, respectively, within 50 km from the center of the network (Coquillat et al., 2019a). These theoretical errors reach about 300, 20 and 400 m, respectively, at the borders of the present study domain (Fig. 1a). SAETTA location errors are of the same order of magnitude as those of Meteorage CG location, while the LMA should capture lightning in more detail than the LF LLS.
SAETTA data are employed for locations and times of coincident ISS-LIS or Meteorage observations. Therefore, they are analyzed in space and time regarding the detected ISS-LIS and Meteorage lightning activity. A combined space–time filter identifies SAETTA sources within 0.2∘ (both latitude and longitude) and (simultaneously) 0.3 s of corresponding ISS-LIS events and Meteorage pulses and strokes. The filtering per (ISS-LIS or Meteorage) flash allows for analyzing the concurrent VHF measurements with, e.g., altitude information. Furthermore, SAETTA data are not used to exclude any ISS-LIS or Meteorage observations, and neither ISS-LIS nor Meteorage data are confined to any SAETTA data condition. They are, however, used to verify the applied data processing approaches, i.e., grouping elements (events, pulses and strokes) to flashes and the analysis of possible false alarms within the lightning detection of ISS-LIS and Meteorage. The maximum altitude of SAETTA sources is bounded at 15.0 km a.s.l., and the maximum reduced χ2, which defines a measure for the overall uncertainty of the time-of-arrival-based system (Thomas et al., 2004), is set to 0.5.
This study uses SAETTA source altitudes to define flash mean, minimum and maximum altitudes. The flash mean altitude is the true mean of all altitudes of sources coincident with the (ISS-LIS or Meteorage) flash. The minimum altitude is defined as the 10th percentile of the altitudes of concurrent SAETTA sources rather than the true minimum. It is aimed at reducing the influence of noise in the data. In the same manner the flash maximum altitude equals the 90th percentile of the concurrent SAETTA source altitudes instead of the true distribution maximum.
2.4 Flash-grouping algorithm
The NASA LIS flash-clustering algorithm distinguishes events, groups and flashes (Sect. 2.1). It makes use of a WED with a maximum difference of 5.5 km in space and 330 ms in time. The WED analyzes group centroids and not the events in the group to determine if two groups are considered part of the same flash. One flash cannot last longer than 2.0 s (Christian et al., 2000). An analysis of the (P0.2) NASA LIS flash-clustering algorithm revealed that it tends to separate flashes when compared to concurrent SAETTA observations. Similar results were observed by Defer et al. (2005). Consequently, a new algorithm is developed to merge the ISS-LIS events to flashes. It has the additional advantage of treating both ISS-LIS events and Meteorage pulses and strokes. The lightning elements sensed by each LLS, which are the smallest available lightning signals (events as well as pulses and strokes), are merged into flashes. More explicitly, an event of ISS-LIS (pulse and/or stroke of Meteorage) should belong to exactly one flash, and a flash is defined as a collection of events (pulses and strokes). Flash characteristics are derived from the underlying element characteristics; e.g., the positions of its elements are used instead of the mean flash location. This study makes use of the elementary ISS-LIS event data as provided by NASA prior to any data merging. It is accepted that ISS-LIS events do not have a direct representation in the Meteorage-like data. Former studies have claimed that LIS groups roughly correspond to the physical processes detected by VLF–LF LLSs (e.g., Bitzer et al., 2016; Höller and Betz, 2010). Nevertheless, those studies found significantly more groups than pulses and strokes within the same region and time period. Bitzer et al. (2016) found for the number of TRMM-LIS groups to ENTLN pulses and strokes a factor of about 28.4 globally and even 3.7 in North America in 2013. Höller and Betz (2010) analyzed 6.7 groups per pulse or stroke on average. Due to those results, LIS optical groups emerge from both discharge processes measured by VLF–LF sensors but also processes lacking significant VLF–LF radiation. In addition, the detected lightning sources of the applied VHF LLS comply more with the LIS events than the groups. Using events rather than group centroids improves in particular the finding of the coincident LMA data. The analysis of flash extents profits from the use of events in that the extent of an ISS-LIS flash corresponds to the full illuminated area rather than the ISS-LIS group centroid locations. The representation of the flash extent (density) will influence the future assimilation of lightning data in NWP models. A statistical analysis of (ISS-LIS) events and LF strokes and pulses will also be of interest for creating a proxy optical dataset, e.g., for MTG-LI, derived from LF data.
Our grouping algorithm analyzes the elements (events or pulses and strokes) and groups them based on their relative location and time of occurrence to each other. First, the spatial and temporal constraints, dsmerge and dtmerge, for elements within one flash must be determined. Then, a combined space–time test merges the elements into flashes. It starts with the first available element (in the data of one LLS) and identifies all elements (of the same LLS data) within the range of the constraints. Thereby, an element can only belong to the same flash if both the distance to any element of the flash is less than dsmerge and the time difference (to the same element) is shorter than dtmerge. All elements identified for a flash (including the initial element) are classified as used. For each used element within a flash, the test is repeated until no unused element can be added to the flash. This step allows for considering propagating flashes and the potentially increasing extent and duration of a flash while adding new elements. The algorithm continues until all elements are classified as used. Our algorithm does not limit the duration of a flash. The number of elements per flash also remains free to the algorithm.
The algorithm verification includes a sensitivity study for dsmerge and dtmerge (Fig. 2) as well as a comparison to NASA's algorithm and concurrent SAETTA observations (Fig. 3).
Figure 2 gives the number of flashes analyzed from all observations of the approximately 1-year period by using different dsmerge (panels a and c) and dtmerge (b, d) for ISS-LIS (a, b) and Meteorage (c, d). In general, as expected, smaller dsmerge and dtmerge increase the flash numbers because fewer individual elements are part of a given flash, and thus more flashes exist for the same elements. LIS flash numbers range from 236 to 4567 for the dsmerge (dtmerge) between 50.0 and 1.0 km (1.0 and 0.1 s), respectively. For the same constraints, Meteorage flash numbers vary from 340 to 1720 flashes.
The ISS-LIS flash number decreases rapidly for dsmerge between 0 and 10 km (Fig. 2a). The rapid change depends on the pixel size within the ISS-LIS image. Hence, it is expected that events of one flash are partitioned within the same frame if the dsmerge becomes smaller than the ISS-LIS image pixel size. ISS-LIS flash numbers remain constant for dsmerge greater than 15 km for all tested dtmerge; 0.3 s balances the need for consistency and the wish for a strict dtmerge (Fig. 2b). The resulting flashes are verified against concurrent 3-D SAETTA sources, which supported the choice of our constraints and the identification of resulting flashes. The spatial constraint (dsmerge of 15 km) refers directly to event locations and not to group centroids (as for NASA's algorithm). The chosen time constraint for ISS-LIS flashes (dtmerge of 300 ms) is similar to the P0.2 NASA flash-clustering algorithm (330 ms).
The same algorithm is applied to group the Meteorage pulses and strokes into flashes. It needs, however, modified constraints dsmerge and dtmerge since physical processes producing Meteorage pulses and strokes do not always correspond to ISS-LIS events and occur with significantly lower counts. Meteorage pulses and strokes do not cover the full structure and duration of a lightning flash. Figure 2b and d are analyzed for Meteorage flash numbers as demonstrated for ISS-LIS flash numbers in Fig. 2a and c. To find constant constraints suitable for various situations (e.g., vertical cloud structures, severity of a storm, flash rate), resulting flashes for different constraints are verified manually using SAETTA observations. Ultimately, Meteorage pulses and strokes belong to the same flash if they are detected within 20 km and 0.4 s. Due to the limited number of pulses and strokes, Meteorage dsmerge and dtmerge are coarser than the ISS-LIS merging constraints. Our constraints (20 km, 0.4 s) are consistent with Meteorage's flash-grouping algorithm using a separation distance of less than 10 km for subsequent CG strokes and 20 km if IC pulses are involved. The delay between subsequent discharges of the same flash must be smaller than 0.5 s in Meteorage's algorithm. Höller and Betz (2010) provided a clustering of LINET VLF–LF pulses and strokes to flash scale with 10 km and 1.0 s in space and time, respectively. Hence, their merging constraints for a flash are finer in space but coarser in time.
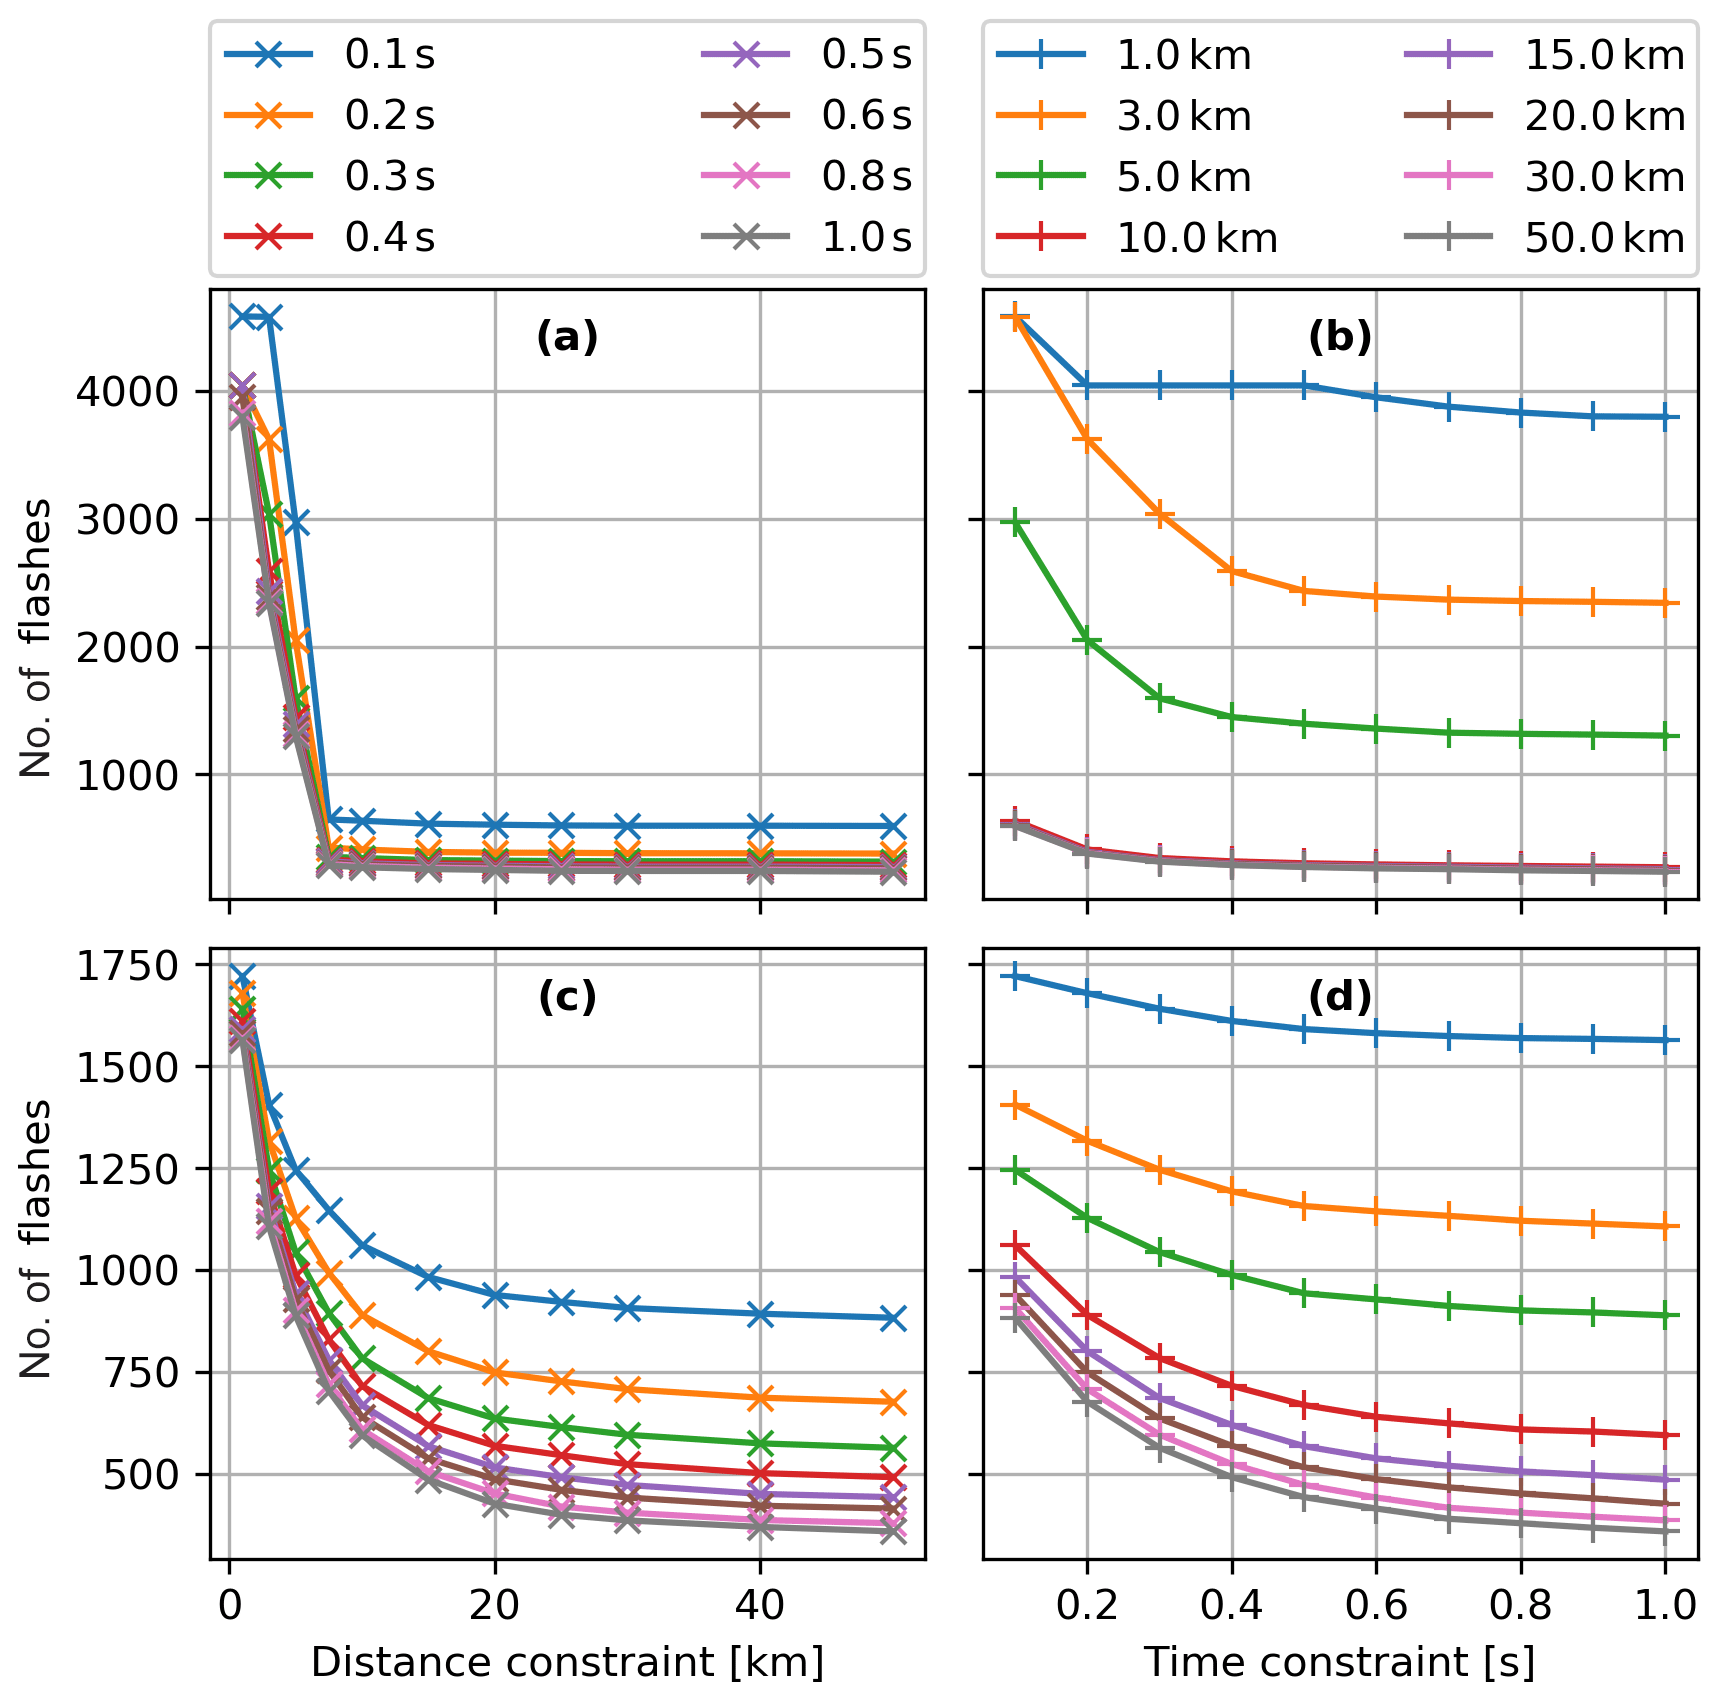
Figure 2Total flash number based on constant, equal time constraint dtmerge (line color) with varying distance dsmerge for elements of ISS-LIS (a) and Meteorage (c) flashes. Panels (b) and (d) are with constant, equal distance dsmerge (line color) and varying dtmerge for ISS-LIS and Meteorage, respectively.
The determination of dsmerge and dtmerge does not ensure a perfect arrangement of the elements in flashes. The objective is to find constraints leading to statistical representations of flashes in the ISS-LIS and Meteorage data. Therefore, all identified flashes are double-checked against concurrent 3-D SAETTA observations. Even if it is sometimes challenging to separate the flashes in the SAETTA data, the detailed VHF mapping helps us to understand the processes leading to the identification of the ISS-LIS and Meteorage flashes. The SAETTA data can also be used to find possible false alarms in the ISS-LIS and Meteorage data.
Figure 3 demonstrates the behavior of NASA's flash-merging algorithm and our developed algorithm for one example. It shows a short time period (6.5 s) during one ISS overpass on 10 September 2017. In Fig. 3a, there is a map of flash locations from the P0.2 NASA flash-merging algorithm and our developed algorithm as well as concurrent VHF SAETTA sources. The ISS-LIS events (not plotted) coincide generally well with the SAETTA observations in both location and time. The mapped observations are presented in latitude, longitude and altitude time series in Fig. 3b; 20 flashes from NASA's algorithm are confronted with 11 flashes from our developed algorithm for the same ISS-LIS events. NASA's merging algorithm somehow splits some flashes, e.g., the flash between 5.3 and 6.2 s where NASA's algorithm identifies five flashes. Our algorithm finds a single flash for that period, and the concurrent SAETTA observations support this result.
Our developed algorithm was additionally tested versus GLM flash-scale data. The GLM algorithm uses the distance between events and not (as ISS-LIS) between group centroids in order to merge events and/or groups to flashes. WED time and spacing for events and/or groups of one GLM flash are 330 ms and 16.5 km, respectively (Goodman et al., 2013). The GLM flash-scale data agree very well with the flashes identified by our algorithm utilizing the underlying GLM events.
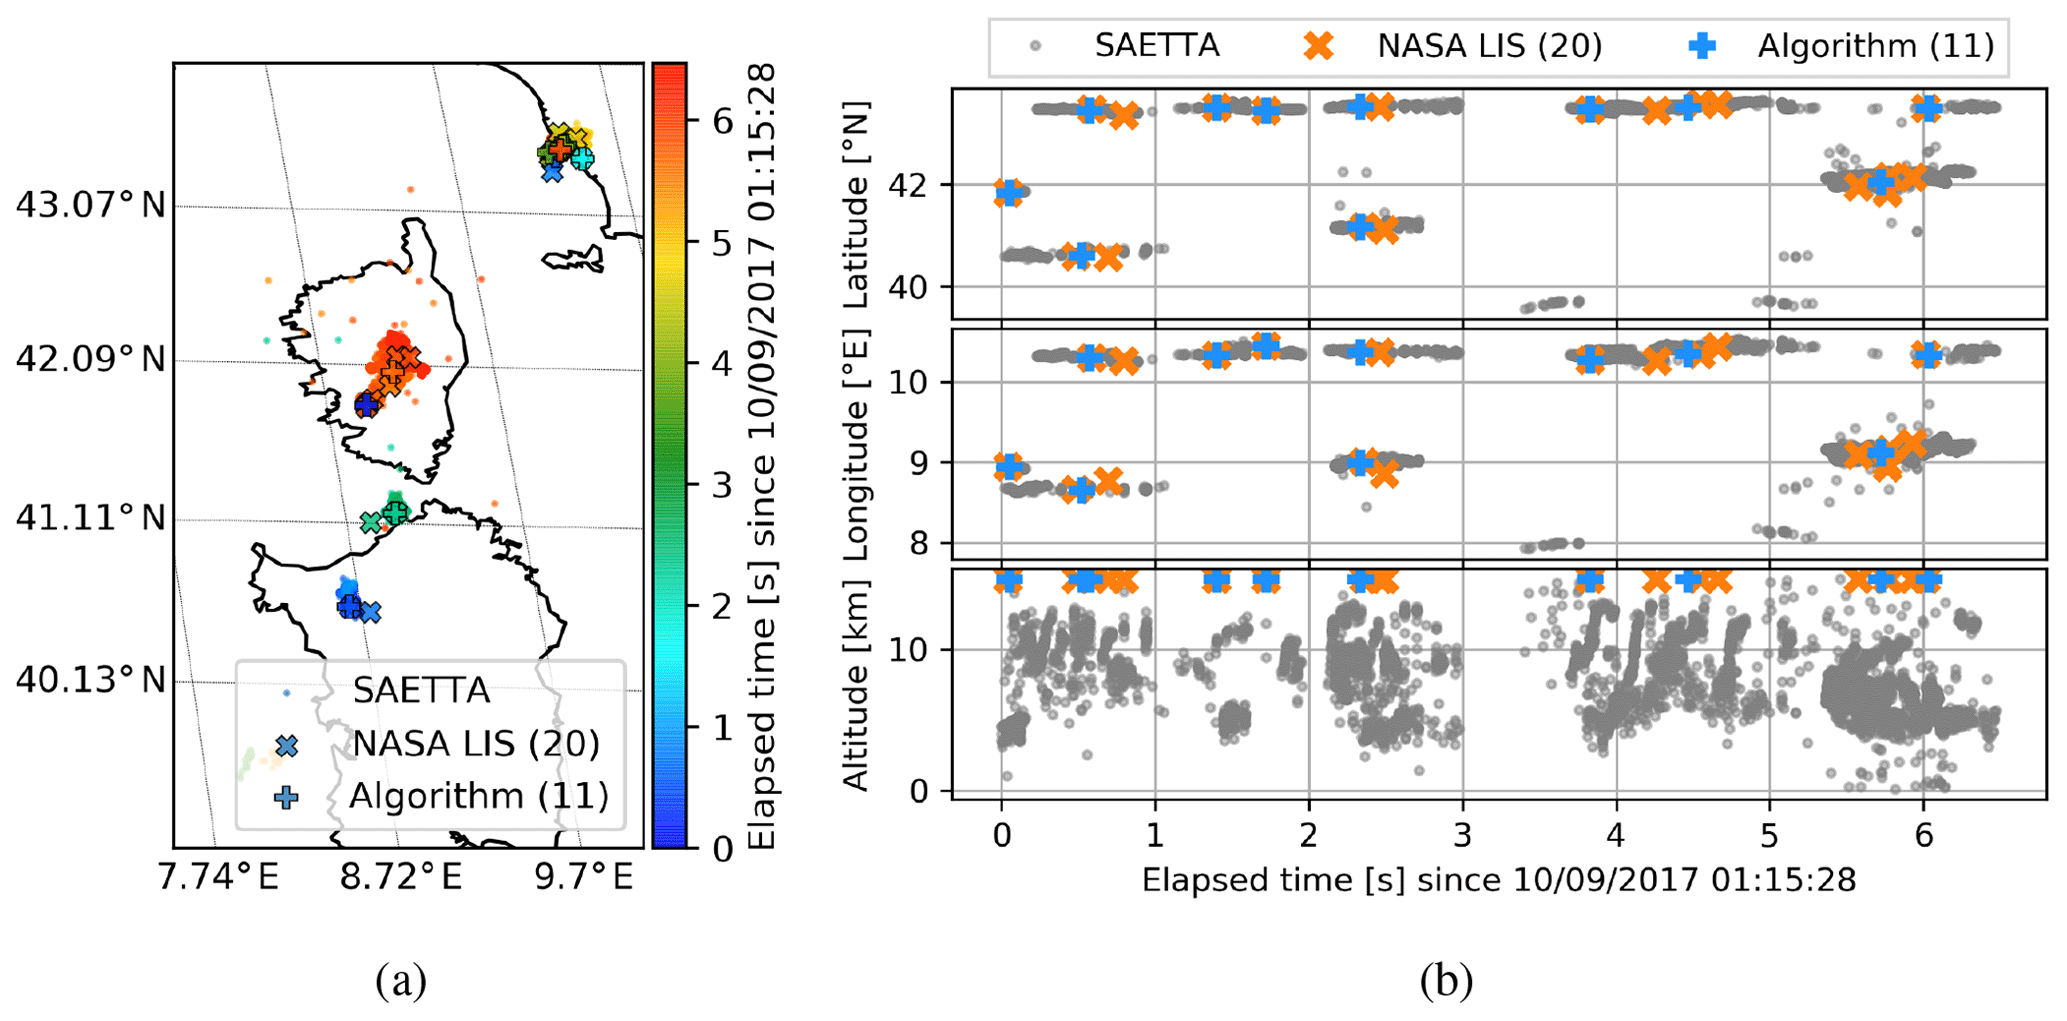
Figure 3The map (a) and time series (b) of SAETTA observations and the mean flash positions based on the NASA LIS algorithm and our developed algorithm for one situation on 10 September 2017. The numbers in parentheses in the legend indicate the number of identified flashes (both algorithms analyzed the same LIS events). Colors in (a) represent the elapsed time from the initial lightning activity. Note: flash altitudes in (b) are not known for ISS-LIS flashes but arbitrarily plotted at 15 km.
2.5 Flash-matching algorithm
ISS-LIS and Meteorage detect lightning in a different way. It was described how the different signals can be merged into a common entity, namely a flash. The intercomparison of LLSs uses the flash scale to find concurrent observations. Individual flashes of both LLSs are sorted into one of the four following categories: LIS detected by both (i.e., an ISS-LIS flash has a coincident Meteorage flash), LIS-only (i.e., no coincident Meteorage observations), Meteorage detected by both (i.e., a Meteorage flash with concurrent ISS-LIS events) or Meteorage-only (i.e., ISS-LIS does not detect the flash). Matching criteria in space (dsmatch) and time (dtmatch) are specified. The criteria dsmatch and dtmatch do not address the flash mean position and time, respectively, but the single events or pulses and strokes within a flash. Two flashes observed by different LLSs are defined as matched if at least two elements (one per flash) meet both dsmatch and dtmatch. A given flash of the reference LLS does not necessarily correspond to exactly one matched flash. It is also possible that a flash meets the matching criteria of more than one given flash (and is collocated with more than one flash). Hence, the two categories, which are LIS detected by both and Meteorage detected by both, are expected to have different counts.
The criteria dsmatch and dtmatch are determined through a sensitivity study of the relative DEs of ISS-LIS and Meteorage (Fig. 4). A spatial criterion lower than 10.0 km reduces the relative DE of both ISS-LIS and Meteorage rapidly (Fig. 4a: ISS-LIS, c: Meteorage). In general, the ISS-LIS relative DE is more sensitive to both dsmatch and dtmatch than the Meteorage relative DE. This result is triggered by the low number of Meteorage pulses and strokes (compared to the number of ISS-LIS events) effectively hampering the finding of suitable elements, i.e., pulses and strokes, for a collocation. The ISS-LIS relative DE decreases within the entire range of investigated times dtmatch. The most sensitive behavior occurs for dtmatch up to 1.5 s (Fig. 4b). Meteorage appears to be sensitive to dtmatch only up to 0.5 s (Fig. 4d). Despite the differences in sensitivity to the criteria between ISS-LIS and Meteorage, the aim is to use the same dsmatch and dtmatch for both LLSs. Finally, dsmatch of 20 km and dtmatch of 1.0 s are chosen to balance the individual sensitivities of the LLSs to the criteria. They allow for the identification of matches if, for example, ISS-LIS detects primary IC discharges of a flash and Meteorage only detects a CG stroke occurring during the final stage of the same flash. Our criteria are relatively coarse compared to some former studies (Sect. 1). Höller and Betz (2010) applied the same dtmatch but an even coarser dsmatch (i.e., 30 km) to match LINET VLF–LF flashes and TRMM-LIS flashes. Further investigation of the matched flashes, e.g., the distributions of the distances and timing offsets, will demonstrate to what extent matches rely on the fairly coarse criteria.
A detailed analysis of distances and timing offsets between matched flashes refines the matching algorithm further: the number of cases in which one flash is matched to multiple flashes of the second LLS should be reduced. Therefore, the refined algorithm initiates with finer matching criteria, i.e., 1 % of both dsmatch and dtmatch. It searches for one element detected by the second LLS that meets the finer criteria for any element of the given flash. Only if no match is found does the allowed distance and time difference increase by 1 % of dsmatch and dtmatch, respectively. The process repeats iteratively until either a match is found or the allowed distance (timing offset) exceeds the original dsmatch (dtmatch). In the latter case, the algorithm stops and the flash is labeled unmatched (note: the refined analysis is performed for matched flashes only; however, the algorithm can also treat the unmatched flashes). One or more matches for the given flash are still possible because of the discrete increments from one iteration to the following. There might also be flashes within an equal distance and equal time offset to the given flash.
The different LLSs detect flashes in different ways and with distinct characteristics. In this section, flash observations are compared and analyzed. As an example, the ISS overpass with the corresponding observations of ISS-LIS, Meteorage and SAETTA in Fig. 1 comprises (almost) the entire study region. It lasted 169 s from FOV entering to leaving the region. The effective viewtime per grid box is indicated in grayscale in Fig. 1a. Wide parts of the domain have been seen for at least 60 s. Figure 1b additionally shows an IR satellite image indicating the cloud tops. The example of a single flash observed by all three LLSs during this overpass is given in Fig. 1c. SAETTA captures the most detail of the flash structure, and there are significantly more ISS-LIS events than Meteorage pulses and strokes. All but the first Meteorage signals indicate an IC pulse. Since the first stroke is of type CG, the entire flash is characterized as a CG flash.
First, relative DEs of ISS-LIS and Meteorage are elucidated. The comparisons of matched flash location and timing differences are discussed, and finally characteristics of flashes, with a special interest in differences between matched and unmatched flashes, are analyzed.
3.1 Detection comparison
This DE analysis is realized on the flash scale. Flashes were preliminarily identified by our in-house algorithm, which merges ISS-LIS events as well as Meteorage pulses and strokes according to their locations and times of occurrence. Further investigations break the flash scale down into events and pulses and strokes, e.g., for the flash characteristics.
The period of observation spans from 1 March 2017 to 20 March 2018. In total, 330 ISS-LIS flashes and 569 Meteorage flashes are identified by our algorithm.
Besides the DE, the probability of false alarm (POFA) characterizes the quality of detection. Quantifying the POFA requires knowledge about the truth, which is the real number of flashes. SAETTA could provide a reference value to quantify the POFA; however, not all stations have operated continuously for the entire study period. Signals from at least six stations are needed to reconstruct and locate a discharge signal, and 31 of 330 (89 of 569) ISS-LIS (Meteorage) flashes were not detected by SAETTA. SAETTA's detection efficiency and accuracy also decrease with distance to the network's center. A vast majority of more than 90 % of all flashes occurred outside a distance of 100 km from SAETTA's center. There was evidence of VHF activity for the vast majority (95.0 %) of the flashes not reported by SAETTA (missed flashes). In 59.2 % of the cases, at least one and fewer than six stations recorded signals. SAETTA lightning was observed just outside our matching criteria (0.2 ∘, 0.3 s) for 28.3 % of the missed flashes. The result indicates that the POFA is low for both ISS-LIS and Meteorage (although it cannot be quantified).
Only three (12) of the ISS-LIS (Meteorage) flashes missed by SAETTA are located within 100 km of SAETTA's center. Due to the low total flash number within this close domain to SAETTA, a statistical analysis is ambiguous; 13 of the 15 missed flashes near SAETTA were missed due to station downtimes or filter criteria (spatial, temporal, reduced χ2; Sect. 2.3). Pédeboy et al. (2018b) reported Meteorage flashes missed by SAETTA with (absolute) peak currents exceeding 100 kA; 2 of the 12 missed Meteorage flashes close to SAETTA exhibit an (absolute) current above 100 kA. SAETTA data can, in fact, not provide the desired true flash numbers, mainly due to station downtimes, and the POFA of Meteorage and ISS-LIS cannot be calculated.
A total of 60.7 % (54) of the Meteorage flashes without concurrent SAETTA sources contain one pulse or stroke only. Those flashes with only one pulse or stroke (or one event in the case of ISS-LIS) are referred to as single-element flashes. Missing SAETTA observations for a single-element flash might be indicative of a locating and timing problem of the ISS-LIS event or Meteorage pulse and/or stroke (possible false alarm). The DE analysis distinguishes results for the complete dataset and excluded single-element flashes; 316 ISS-LIS and 367 Meteorage flashes remain after excluding the single-element flashes. Thus, the ISS-LIS (Meteorage) flash number is reduced by 14 (202) flashes compared to the overall count. ISS-LIS single-element flashes are rare, while there is a significant amount of Meteorage single-element flashes. The result is related to the differences in optical and LF lightning detection. The entire dataset contains 16 881 ISS-LIS events and 2144 Meteorage pulses and strokes (487 CG, 1657 IC); 15 578 events (92 %) are distributed over the ISS-LIS flashes with a match. For Meteorage, 1439 pulses and strokes (271 CG, 1168 IC) constitute the flashes with matches (67 %). Hence, 55.6 % (70.5 %) of the CG strokes (IC pulses) belong to flashes with coincident ground–space detection. Despite coarser dsmerge and dtmerge for a Meteorage flash than an ISS-LIS flash, Meteorage observed 239 flashes more than ISS-LIS within similar regions and time frames.
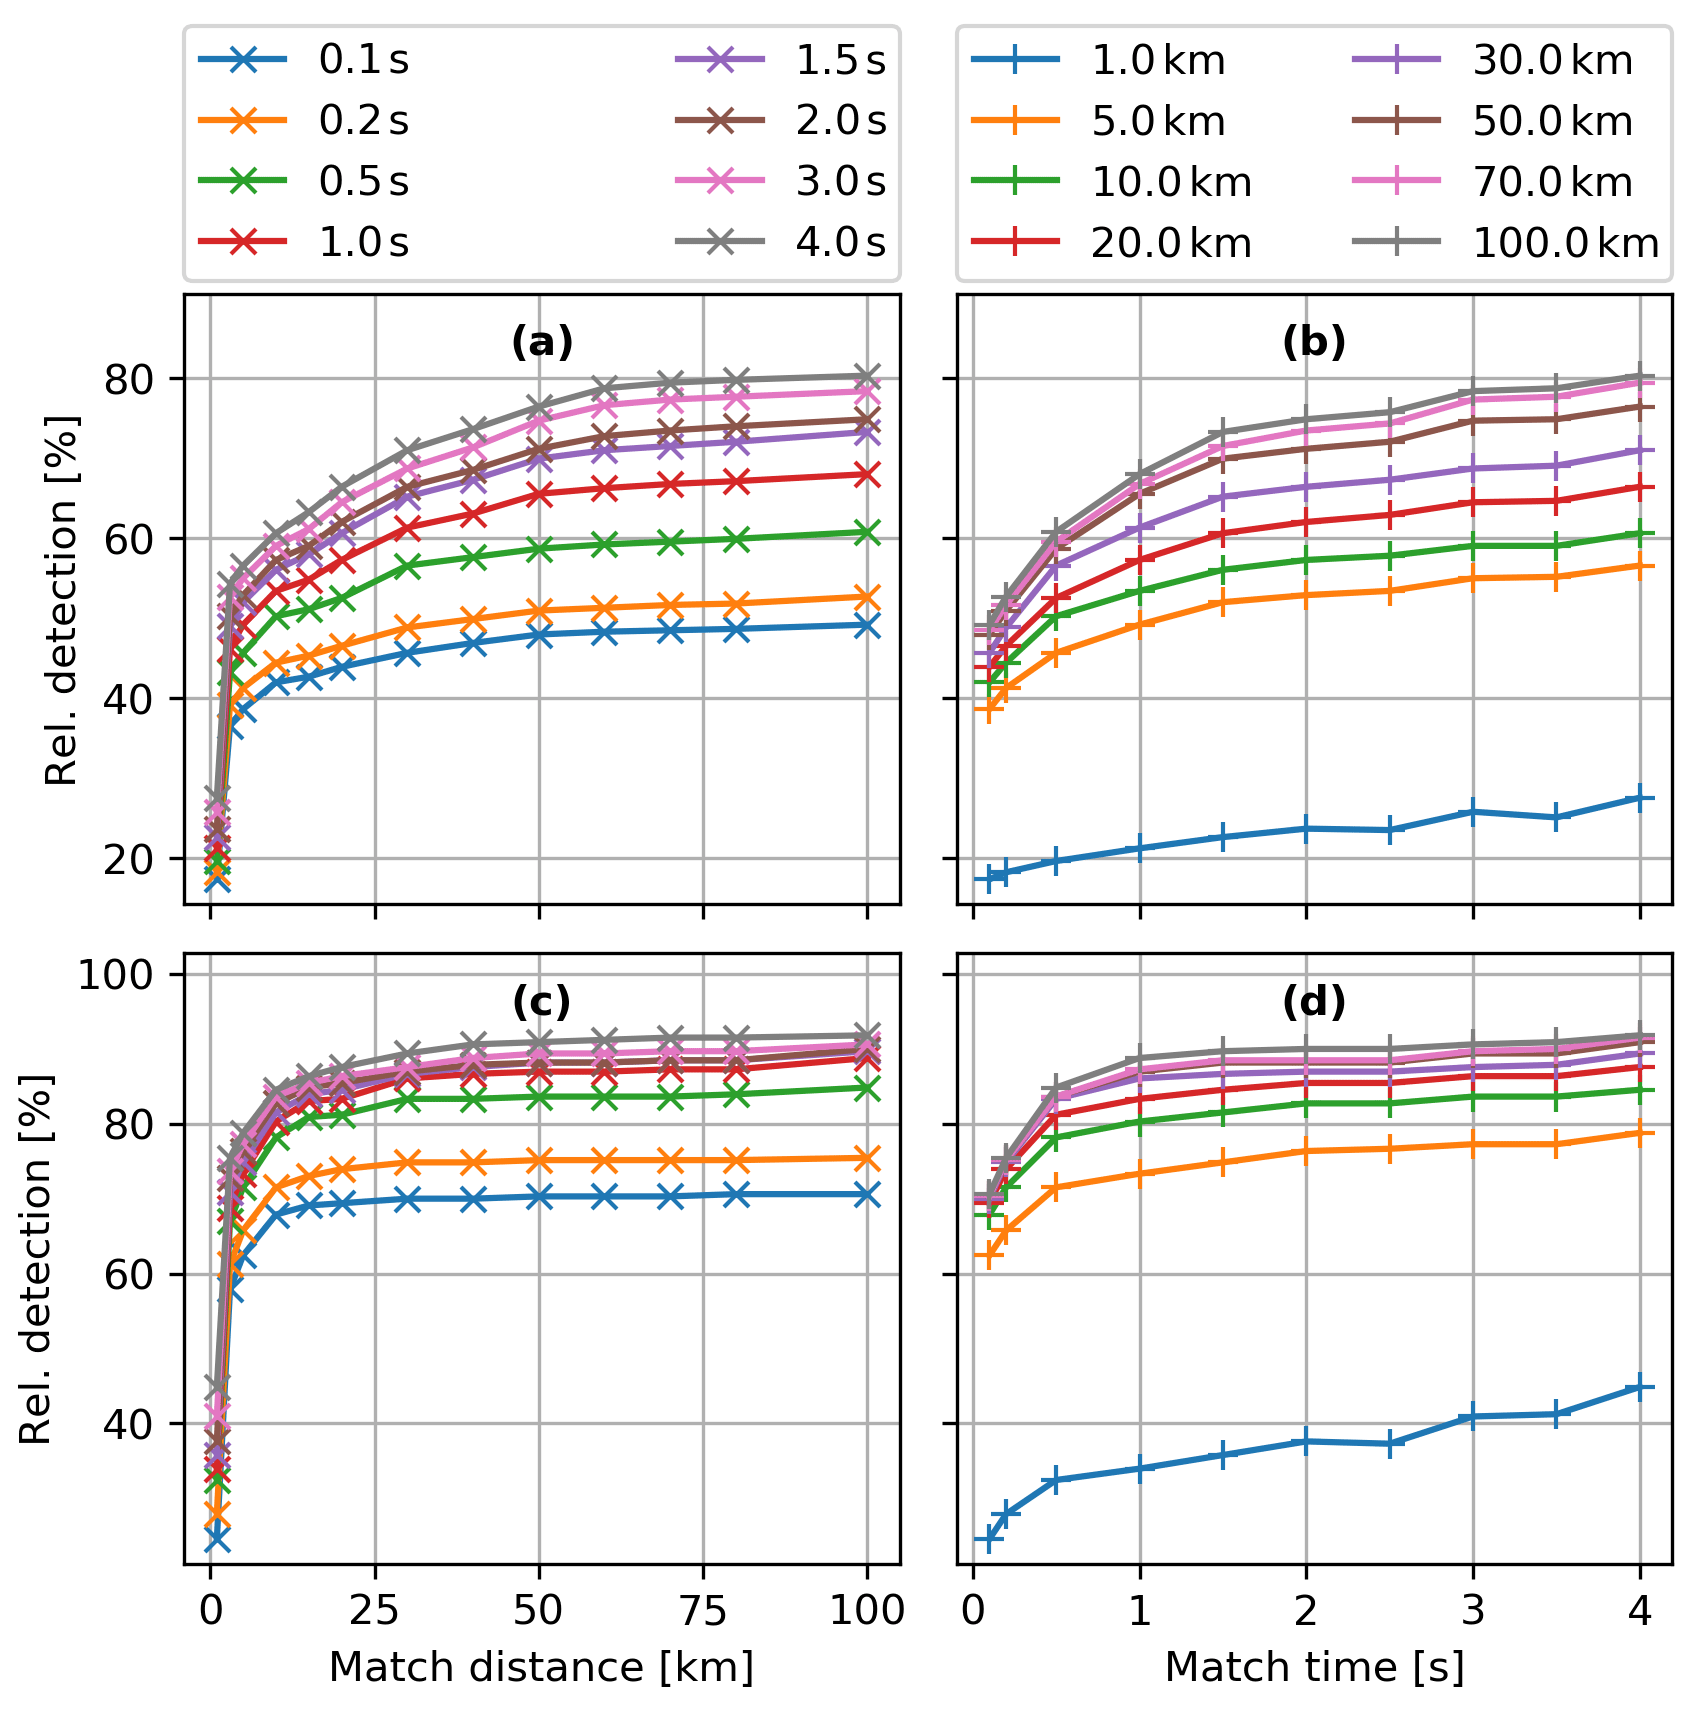
Figure 4Relative detection efficiency based on constant, equal time criterion dtmatch (line color) with varying distance dsmatch for ISS-LIS (a) and Meteorage (c). Panels (b) and (d) are with constant, equal distance dsmatch (line color) and varying dtmatch for ISS-LIS and Meteorage, respectively.
Figure 5a presents a histogram of the total flash detection counts within the four categories introduced in section 2.5. The number of single-element flashes is marked. Additionally, Fig. 5 includes a map of the locations of the flashes within each category. Figure 5b maps the flashes as a 2-D histogram on a grid. Flashes are detected all over the study domain for both ISS-LIS and Meteorage without any apparent pattern, even if the number of flashes is not sufficient to be statistically representative.
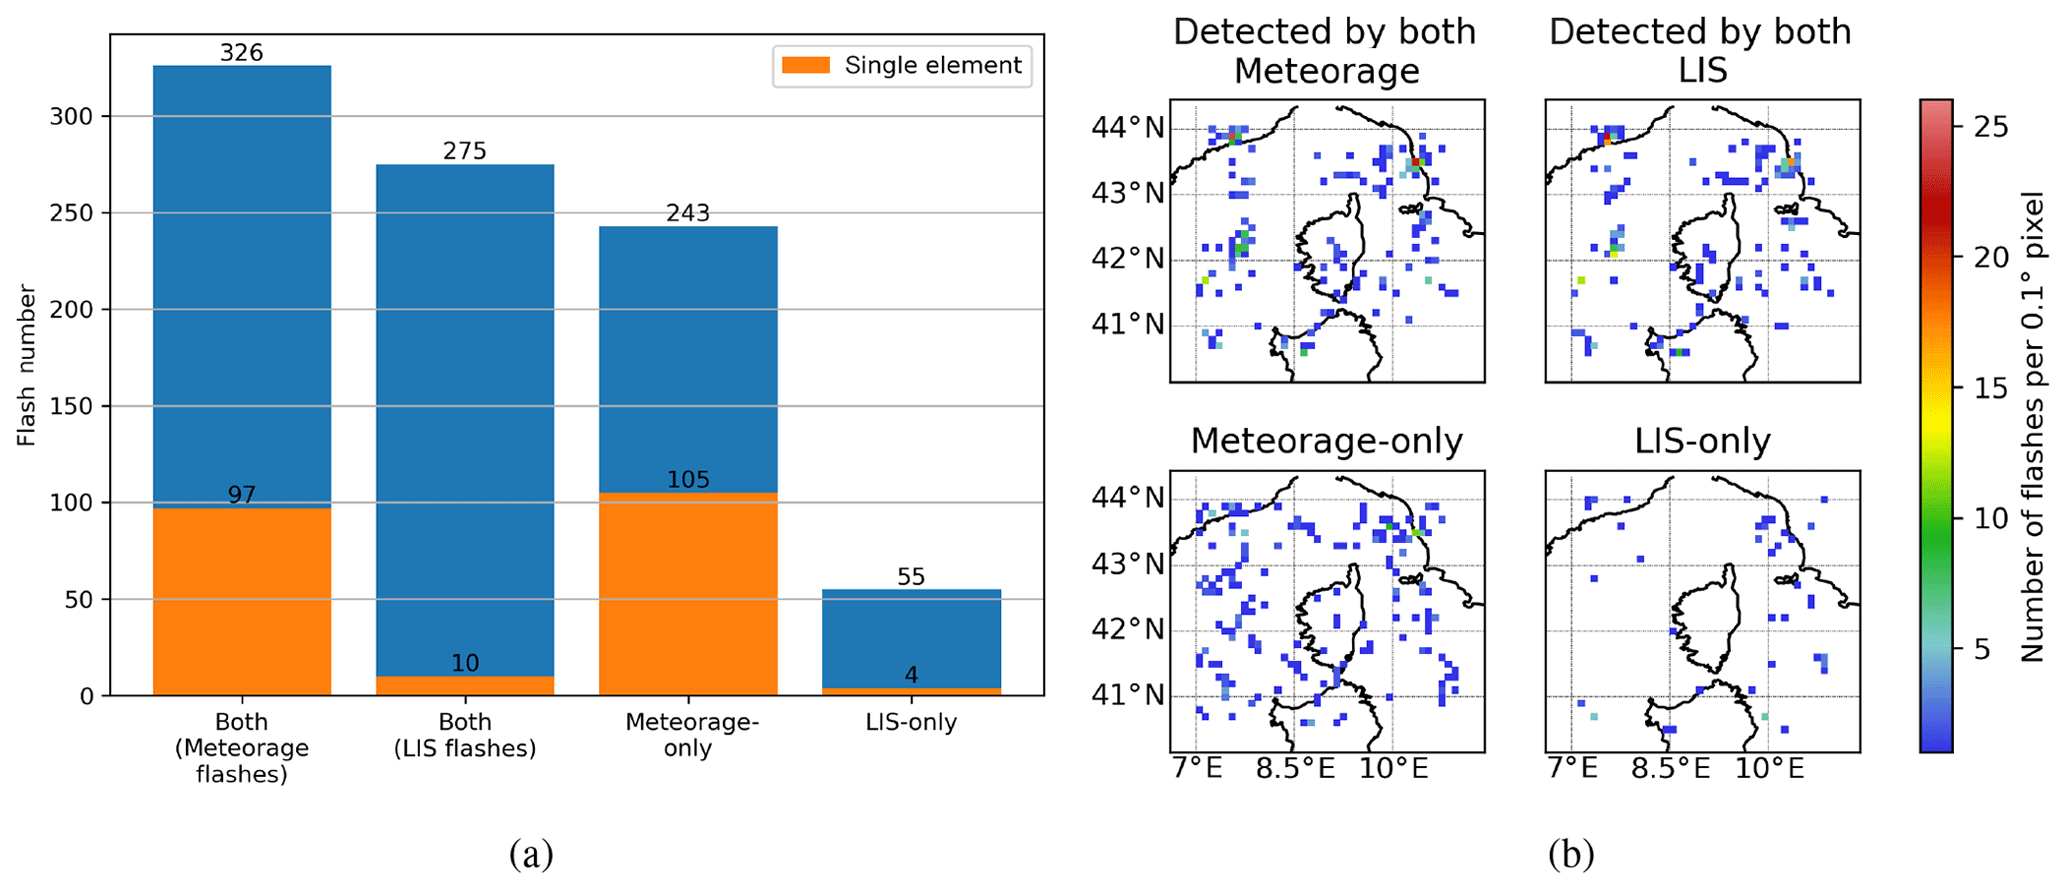
Figure 5Flash category histogram (a) and spatial distribution (b) while matching ISS-LIS and Meteorage flashes for the available ISS overpasses from March 2017 to March 2018. Categories show the number of Meteorage flashes seen by ISS-LIS: both (Meteorage flashes), the number of ISS-LIS flashes also detected by Meteorage (both LIS flashes), and flashes detected either by Meteorage (Meteorage-only) or ISS-LIS (LIS-only). The numbers of single-element flashes (event for ISS-LIS, pulse or stroke for Meteorage) are marked for each category as indicated.
Table 1 summarizes all relative DEs. Daytime covers the time from 05:00 to 17:00 UTC. Nighttime flashes are defined between 17:00 and 05:00 UTC.
Table 1Relative detection efficiencies (DEs) of Meteorage and ISS-LIS. The values in parentheses give the relative DEs for flashes with at least two elements. The flash numbers (100 %) to calculate the DEs are indicated. Note: ISS-LIS (Meteorage) DE uses Meteorage (ISS-LIS) flash numbers.
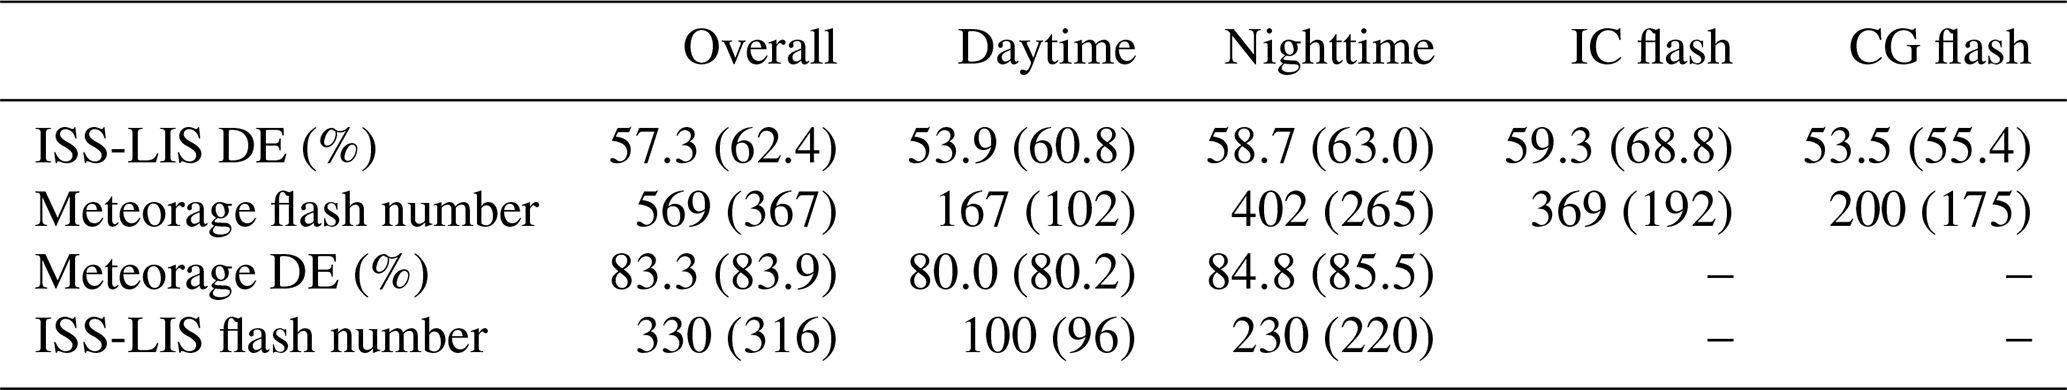
ISS-LIS was able to detect 326 of the 569 recorded Meteorage flashes from 1 March 2017 to 20 March 2018, a relative DE of 57.3 %. If the notable number of Meteorage single-element flashes is neglected, ISS-LIS detected 229 of the remaining 367 Meteorage flashes (62.4 %). ISS-LIS shows a low relative DE of less than 54 % for daytime flashes; 58.7 % of the Meteorage nighttime flashes are detected by ISS-LIS. In particular, the nighttime relative DE cannot reach the literature expectations of over 90 % for LIS (Boccippio et al., 2002). The ISS-LIS relative DE significantly depends on the Meteorage flash type. A flash with at least one CG stroke, referred to as a CG flash, is detected in only 53.5 % of the cases, while a pure IC flash is detected with 59.3 % relative DE. ISS-LIS could detect 68.8 % of the occurring Meteorage IC flashes with at least two pulses. If flashes with at least two pulses and/or strokes are considered, the relative DE of IC flashes surpasses that of CG flashes by almost 14 % and increases compared to the total IC flash relative DE by 9.5 %. Hence, CG flashes and single-pulse IC flashes especially decrease the total DE of ISS-LIS. All relative DEs use dsmatch of 20 km and dtmatch of 1.0 s. Finer criteria would further decrease the relative DE of ISS-LIS (higher sensitivity to the criteria than Meteorage; Fig. 4a).
Out of the total 330 ISS-LIS flashes, Meteorage detected 275 (83.3 %). The DE of Meteorage relative to ISS-LIS flashes with at least two events equals 83.9 % (265 of 316 flashes). The relative DE of the VLF–LF Meteorage LLS appears to be significantly higher than in former studies (Sect. 1) using LF LLSs and TRMM-LIS. It is assumed that the ISS-LIS detection efficiency is similar to that of TRMM-LIS in general (Richard J. Blakeslee, personal communication, 2019), and thus Meteorage provides a high-quality LF LLS. Moreover, the Meteorage detection efficiency in particular appears to be quite resistant to changes in dsmatch and dtmatch. For example, halving both criteria (10 km in space, 0.5 s in time) results in a relative detection efficiency of about 78 %. More details about the sensitivity to the matching criteria can be found in Sect. 2.5.
Meteorage detected 80.0 % of the 100 ISS-LIS daytime flashes. Its relative DE reaches 84.8 % for 230 ISS-LIS nighttime flashes. The relative DE depends on the performance of the LLS itself but also the performance and locating accuracy relative to the reference LLS. As ISS-LIS detects flashes optically, the influence of different lighting on ISS-LIS daytime and nighttime accuracy is investigated as part of the following section.
3.2 Distances and timing offsets between collocated flashes
In this section, the matched ISS-LIS and Meteorage flashes are studied regarding their relative location and time of occurrence. For each element of a flash detected by one LLS the closest (in time or in space, not a combined filter here) element of the matched flash(es) accounts for the statistic. One element can be closest to multiple elements of the second LLS. The entirety of elements of flashes with matches is analyzed statistically. Figure 6 presents the results for distances (a) and timing offsets (b) between events as well as pulses and strokes.
Figure 6a shows histograms of the distance between a given ISS-LIS event (Meteorage pulse and/or stroke) and the closest pulse and/or stroke (event) of a matched flash. The distribution given an ISS-LIS event peaks primarily between 2.50 and 3.00 km and secondarily at about 4.50 km, with a median (mean) of 4.74 km (5.68 km). The distribution given a Meteorage pulse or stroke has a broad maximum from 0.75 to 2.75 km, with a median (mean) of 2.31 km (3.60 km). The Meteorage pulse–stroke distance distribution features a more pronounced (if wider) peak for less distance than the distribution given an ISS-LIS event. This is due to the calculation method and the numbers of available events as well as pulses and strokes. The higher number of (and smaller distance between) ISS-LIS events allows in general for finding a closer event to a given Meteorage pulse or stroke than vice versa. The cumulative distribution functions (CDFs) within the plotted interval (Fig. 6aii) show that the distance distribution given an ISS-LIS event has a larger tail than the distribution given a Meteorage pulse or stroke. The 60th percentile is found at approximately 5.5 and 2.6 km for a given ISS-LIS event and Meteorage pulse or stroke, respectively. Both Meteorage IC pulses and CG strokes exhibit similar distributions to the overall Meteorage pulses and/or strokes (also in the CDFs; Fig. 6aii), with the peak between 0.75 and 2.75 km. The median (mean) distance for IC pulses and CG strokes and their match equals 2.36 km (3.63 km) and 2.22 km (3.51 km), respectively. Hence, CG strokes feature a slightly lower distance to matched events than IC pulses.
Distances are calculated between the closest ISS-LIS events (not groups or flashes as in former studies) and LF pulses and/or strokes. Events provide a finer resolution of the lightning discharge than groups, while group centroids use radiance-weighted event locations and are interpolated to sub-pixel locations. Bitzer et al. (2016), who used TRMM-LIS groups and ENTLN pulses, found for both conditional distributions median (mean) differences in location between 7.0 and 7.2 km (7.6 and 7.9 km) in North America. Those values are in accordance with the distances observed by Rudlosky et al. (2017) between TRMM-LIS flashes and GLD360 strokes. Zhang et al. (2019) thoroughly investigated TRMM-LIS performance and found additional latitudinal location offset resulting from TRMM yaw maneuvers. Their analysis suggests a correction for TRMM-LIS group locations that improves the TRMM-LIS group distance to NLDN pulses and/or strokes for the summers of 2012 and 2013. The distance distribution peaks for 1–2 km after the correction (5–6 km before the correction). The distribution peak distances before the correction were similar to those reported by Bitzer et al. (2016) and Rudlosky et al. (2017). Hence, it is assumed that distances between TRMM-LIS groups and VLF–LF LLS pulses and/or strokes are similar or slightly smaller than distances comparing ISS-LIS events and Meteorage LF pulses and/or strokes in this work. It should be mentioned that the TRMM-LIS pixel size is slightly smaller than that of ISS-LIS, i.e., 4.3 km (3.7 km) nadir after (before) TRMM boost versus 4.5 km nadir.
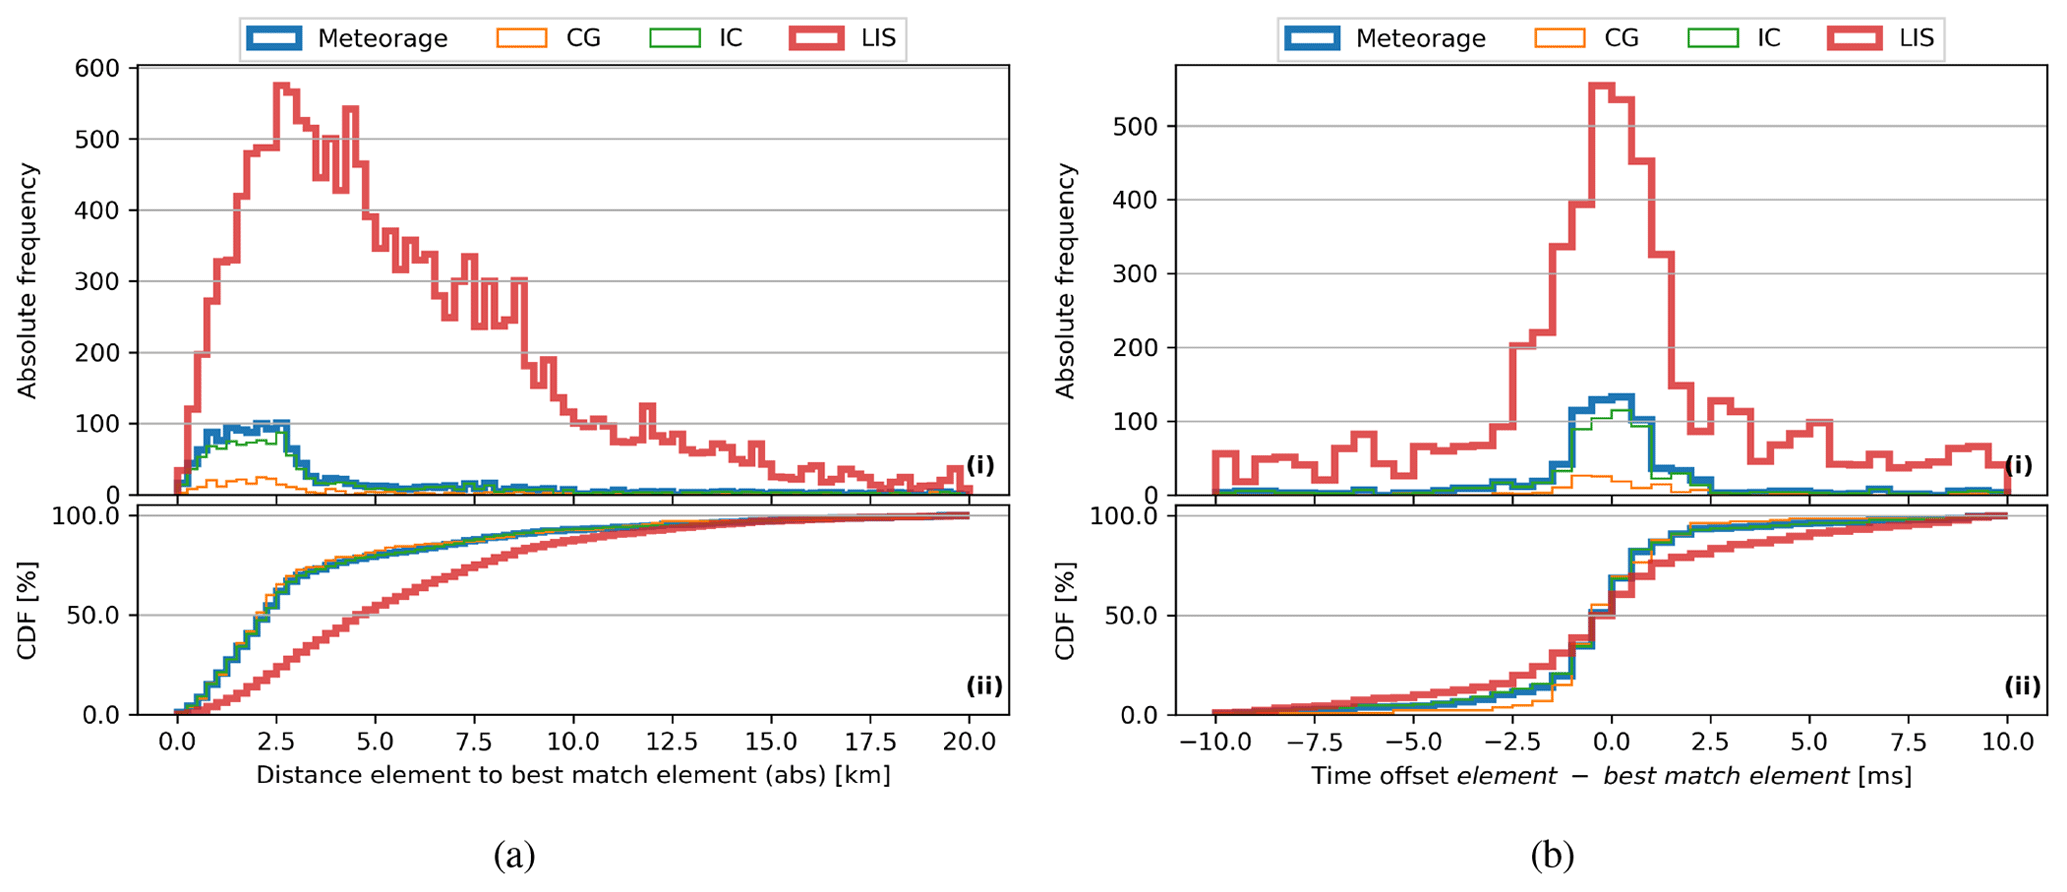
Figure 6Best match distance (a) and time offset (b) between a given Meteorage pulse or stroke (LIS event) and the closest ISS-LIS event (Meteorage pulse or stroke). Histogram (i) and cumulative distribution function (ii) with bins of 0.25 km (a) and 0.5 ms (b). Analyzed pulses and strokes (events) belong to flashes with matches (spatial and temporal filters), while the pulses and/or strokes (events) of unmatched flashes are not considered. For Meteorage, the discharge types (CG, IC) are distinguished. Only elements with absolute timing offsets of less than 10 ms are included in the plotted time offset distribution. A positive time indicates that the given element occurred later than the best match.
The optical ISS-LIS sensor might be affected by different lighting. Therefore, the accuracy of ISS-LIS flashes relative to ground-based LLSs is explicitly investigated during day and night (not shown as a figure). Daytime flash distances are concentrated mainly between 2.0 and 5.0 km, and the distribution peaks at about 3.5 km. The ISS-LIS nighttime flash distribution peaks at about 5.5 km of distance to matched Meteorage flashes. Given an ISS-LIS flash, the CDF distribution also rises faster for daytime than for nighttime flash distances. Hence, distances between coincident flashes are in fact smaller during daytime than during nighttime. The comparison of ISS-LIS flashes to SAETTA reveals a small difference of up to 0.05∘ latitude and longitude during both day- and nighttime. ISS-LIS flashes tend to occur slightly south and west of the corresponding SAETTA observations. The small location difference, considering dsmatch of 20 km and ISS-LIS spatial resolution of 4.5 km (nadir), does not significantly influence our results. In particular, ISS-LIS maintains its locating accuracy during daytime and during nighttime.
The timing offset subtracts the time of the matched element from the time of the given element. It yields positive and negative values according to which element occurred first, with a positive value indicating that the given element occurred later than its match. Again, the two conditions, which are given an ISS-LIS event and given a Meteorage pulse or stroke, are applied. The resulting distribution (Fig. 6b) peaks between −0.5 and 0.5 ms for a given ISS-LIS event and between −1.0 and 1.0 ms for a given Meteorage pulse or stroke. The distribution tails, with an absolute timing offset longer than 10 ms and up to 1.0 s, are not plotted. They are larger for a given ISS-LIS event than for a given Meteorage pulse or stroke. It is observed that Meteorage pulses and strokes often do not cover the entire duration of a flash. ISS-LIS events reflect the actual flash duration (reference to concurrent SAETTA sources) better than the Meteorage pulses and strokes. Hence, given an ISS-LIS event and looking for a matched Meteorage pulse or stroke, the number of available pulses and/or strokes is often limited. Several events can have the same closest pulse or stroke even if the events occurred in different time frames. It increases the probability of larger timing offsets, especially for a given ISS-LIS event compared to a given Meteorage pulse or stroke. The CDFs (Fig. 6bii) reveal that about 20 % (5 %) of the ISS-LIS events (Meteorage pulses and/or strokes) shown here exhibit timing offsets of more than 2.5 ms. About 20 % (10 %) of ISS-LIS events (Meteorage pulses and/or strokes) have values lower than −2.5 ms. In the overall distribution (not shown), time offsets exceed 10.0 ms for 43 % (22 %) of ISS-LIS events (Meteorage pulses and/or strokes). Negative time offsets exceed −10.0 ms for 25 % (22 %) of ISS-LIS events (Meteorage pulses and/or strokes). The distribution given an ISS-LIS event is slightly skewed towards positive time offsets (given that the ISS-LIS event occurred later than its best match stroke or pulse). The overall median (mean) values yield 2.36 ms (54.60 ms) and −0.00 ms (2.70 ms) given an ISS-LIS event and Meteorage pulse or stroke, respectively. The mean for a given ISS-LIS event is an artifact of the skewed distribution (also in the tails). Considering the ISS-LIS integration frame time of 2.0 ms, the remaining average statistics are close to the temporal accuracy of ISS-LIS. Both conditional distributions given ISS-LIS and given Meteorage show an overall similar shape (Fig. 6b). The matched element, considering both the ISS-LIS and Meteorage distributions, occurs with similar probability earlier or later (or simultaneously) than the element itself, and the distribution peak is centered at zero time offset. This is an interesting finding since, e.g., Höller and Betz (2010) and Bitzer et al. (2016) found that TRMM-LIS detected lightning on average 1 to 2 ms later than the ground-based LLSs. This is not the case for ISS-LIS in our study (and again one must consider the ISS-LIS integration time frame of 2.0 ms), although the order of magnitude of the time offsets agrees well with our results. Timing differences can in fact be directly compared to those studies as the closest event provides the same time as the closest group (groups merge several events within the same time frame and in adjacent pixels of ISS-LIS).
The distribution given an IC pulse is also symmetric around zero and shows a maximum between −1.0 and 1.0 ms (Fig. 6b). Its median (mean) is 0.00 ms (4.29 ms). For CG strokes, however, the distribution peaks between −1.0 ms and 0.0 ms. The negative distribution peak and median (mean) of −0.07 ms (−4.32 ms) indicate that ISS-LIS detected CG lightning slightly later than Meteorage. It might account for the time the light of the CG lightning needs to propagate towards the higher parts of the cloud and to become visible from space.
3.3 Characteristics of detected flashes
The previous sections dealt with the relative DEs, location and times of coincident ISS-LIS and Meteorage records. In this section the unmatched flashes (42.7 % Meteorage, 16.7 % ISS-LIS) are also considered to investigate the following flash characteristics: the number of elements (events, pulses and strokes) per flash, flash extent, flash duration, flash mean absolute (pulse–stroke) amplitudes and individual pulse–stroke amplitudes, flash mean (event) amplitude count, flash maximum (event) amplitude count, and the flash mean, minimum and maximum altitudes based on SAETTA observations. They are separated per matched and unmatched flash, per daytime (05:00 to 17:00 UTC) and nighttime (17:00 to 05:00 UTC), and per flash type (IC, CG). The ISS-LIS flash IC or CG attribute depends on the type of the matched Meteorage flash. There is no flash type associated with ISS-LIS-only flashes. As explained in Sect. 2.4, ISS-LIS events are analyzed. The statistical results obtained would be similar using groups instead of events, except for the flash extent and maximum amplitude count per flash. It should be noted that the number of daytime CG flashes is particularly limited (24 ISS-LIS and 42 Meteorage, meaning < 10 %). Flash extents add the north–south and the east–west distance of a flash. The north–south distance uses the maximum and minimum latitude of the flash elements. The east–west distance of a flash is defined as the distance between the longitudinal maximum and minimum of the elements at the mean latitude (as that distance also depends on the latitude). Flash durations, or the times from the first to the last element of a flash, are only limited by the viewing time of ISS-LIS. Theoretically, one flash could last for up to 90 s. Meteorage flash durations are not limited.
Statistics for ISS-LIS flash characteristics are summarized in Table 2. It contains the overall average and the averages, minima and maxima observed for matched and unmatched ISS-LIS flashes. ISS-LIS flashes have on average 51.2 events. Matched ISS-LIS flashes had more than twice as many events as the unmatched flashes (56.6 versus 23.7). The detailed event number distributions for matched and unmatched ISS-LIS flashes are shown in Fig. 7a and b, respectively. They include the histogram (i) and the CDF (ii). Daytime and nighttime flashes are distinguished for the flash types (only for matched flashes). The histogram bars add the numbers of the different categories for the corresponding bin. All following figures make use of the same layout. ISS-LIS nighttime flashes have about two times more events than daytime flashes. The background subtraction threshold for the optical signal is usually greater during daytime than during nighttime, and the sensor acquisition is less sensitive during the day (minimum event amplitude count of 10.0 and 9.0 during daytime and nighttime, respectively). This influences the number of events per flash, with a relative reduction of event numbers on bright backgrounds (daytime) compared to dark backgrounds (nighttime). For example, 16.3 % (2394 of 14 710) of nighttime events observed in this study have an amplitude count of 9.0 (value less than the daytime threshold). Additionally, ISS-LIS CG flashes comprise on average approximately 11 % more events than IC flashes.
Table 2Overall average and the average, minimum and maximum values of ISS-LIS flash characteristics for matched and unmatched flashes. The minimum (maximum) altitude represents the 10th (90th) percentile of concurrent SAETTA sources. Amplitude count is recorded per event.
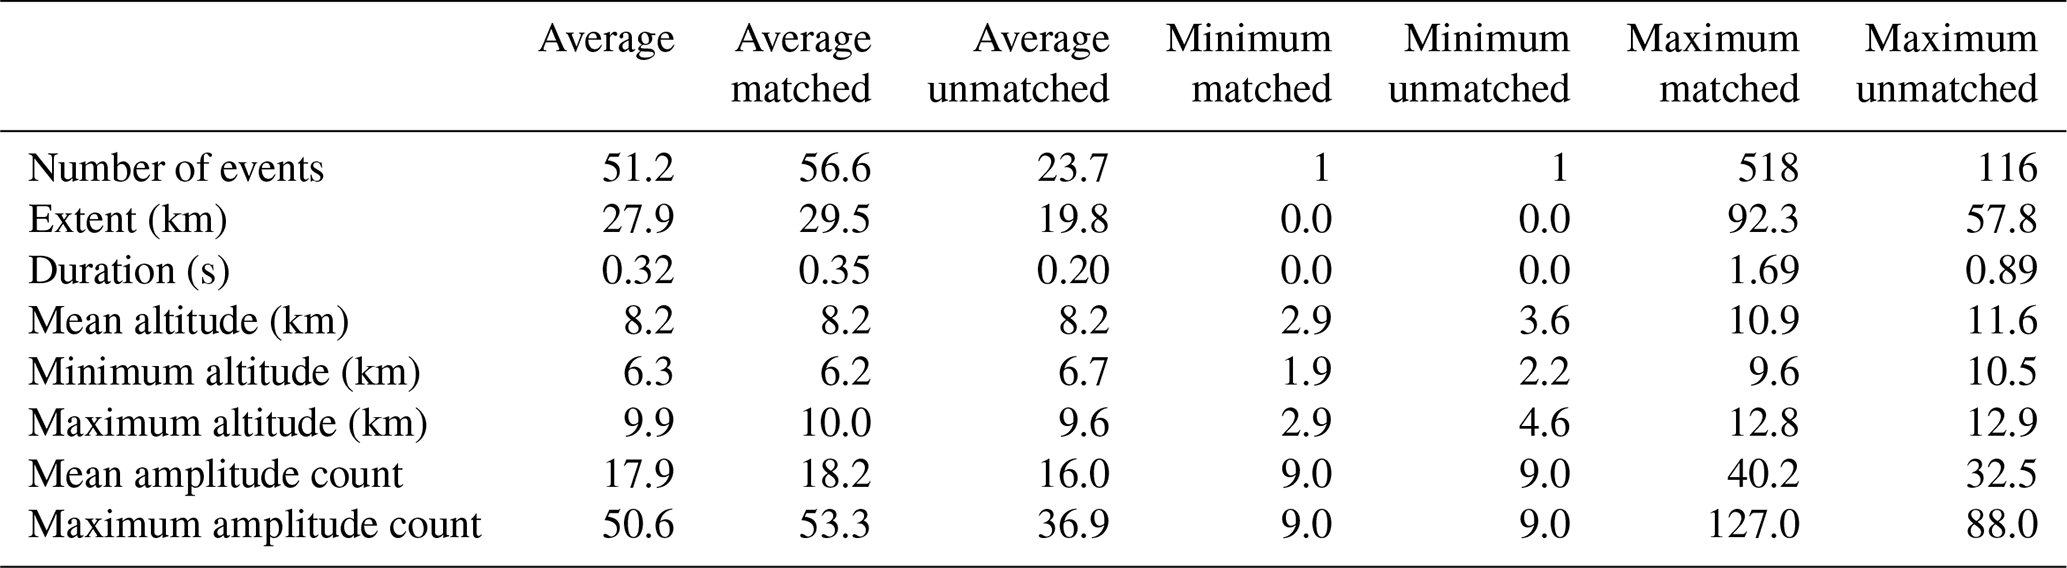
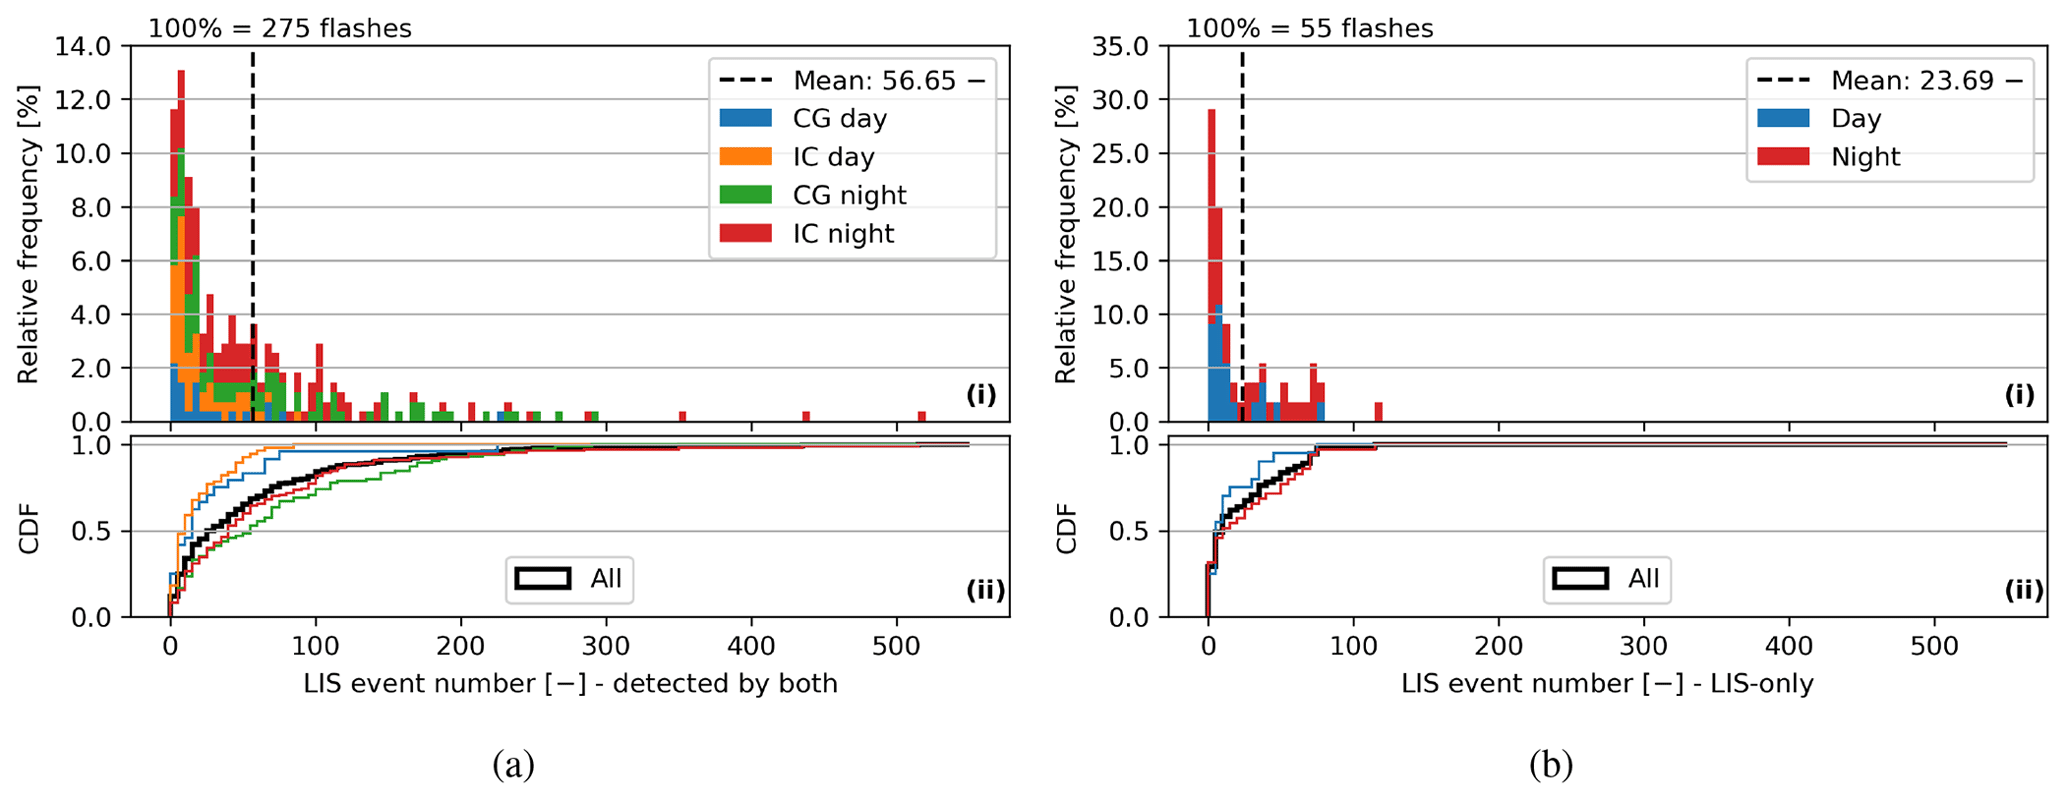
Figure 7LIS event numbers of ISS-LIS flashes with a coincident Meteorage flash (a) and unmatched ISS-LIS flashes (b). Daytime, nighttime and flash type, IC and CG, are indicated by the colors. The histogram (i) and corresponding CDF (ii) use the same colors. The CDF additionally shows a black curve for all data. The histogram bin width is constant at five events. Note: the CG–IC attribute for an ISS-LIS flash needs the matched Meteorage flash and does not exist for ISS-LIS-only flashes. The mean value is plotted as a dashed line. The total number of flashes is indicated above the histogram.
In accordance with the difference in event numbers, the matched ISS-LIS flashes feature a larger extent and longer duration than the unmatched ISS-LIS flashes (Table 2). ISS-LIS flash extents range from 0 km (single events) to about 92 km, as shown in the distributions in Fig. 8. Peterson et al. (2017), who studied the evolution and structure of extreme flashes observed by TRMM-LIS, found an LIS flash with a maximum event separation of 162 km. This size likely results from an elongation due to scattering of optically bright discharges.
This work found coincident Meteorage flashes for all but four ISS-LIS flashes with extents exceeding 40 km. ISS-LIS nighttime flashes are on average 13.2 km larger than daytime flashes (and comprise more events). The result is likely caused by the higher background subtraction threshold during the day than during the night. It could also result from an optical elongation of nighttime flashes. Large flashes with the maximum event separations in Peterson et al. (2017) also occurred at nighttime, but the groups of these flashes were not separated by a significant fraction of the event separation. Fundamentally different cloud structures or types during day and night might also influence the results. We would need additional information, e.g., measuring infrared brightness temperatures for the cloud tops, to verify this hypothesis. Referring to the flash types, the mean extent of ISS-LIS CG flashes is 6.1 km longer than for ISS-LIS IC flashes; however, the longest ISS-LIS flash is a nighttime IC flash.
One observed ISS-LIS flash lasted about 1.7 s (a CG nighttime flash), the longest duration found in this study. Peterson et al. (2017) found spurious flash durations up to 28 s in convective clouds, which result from high flash rates and slow storm motion. One large propagating flash lasted 5.04 s in their study. Figure 9 presents the duration distributions for the matched (a) and unmatched (b) ISS-LIS flashes. Matched ISS-LIS flashes last on average almost twice as long as ISS-LIS-only flashes, i.e., 0.35 s versus 0.20 s (also Table 2). About 10 % (25 %) of the matched (unmatched) flashes were recorded during a single LIS frame. Long-lasting flashes (duration longer than 0.5 s) were detected by both LLSs with high probability (92.6 %). ISS-LIS nighttime flashes last statistically 0.1 s longer than the daytime flashes. The result is in accordance with the ISS-LIS higher relative DE and more detected events at nighttime than during the day.
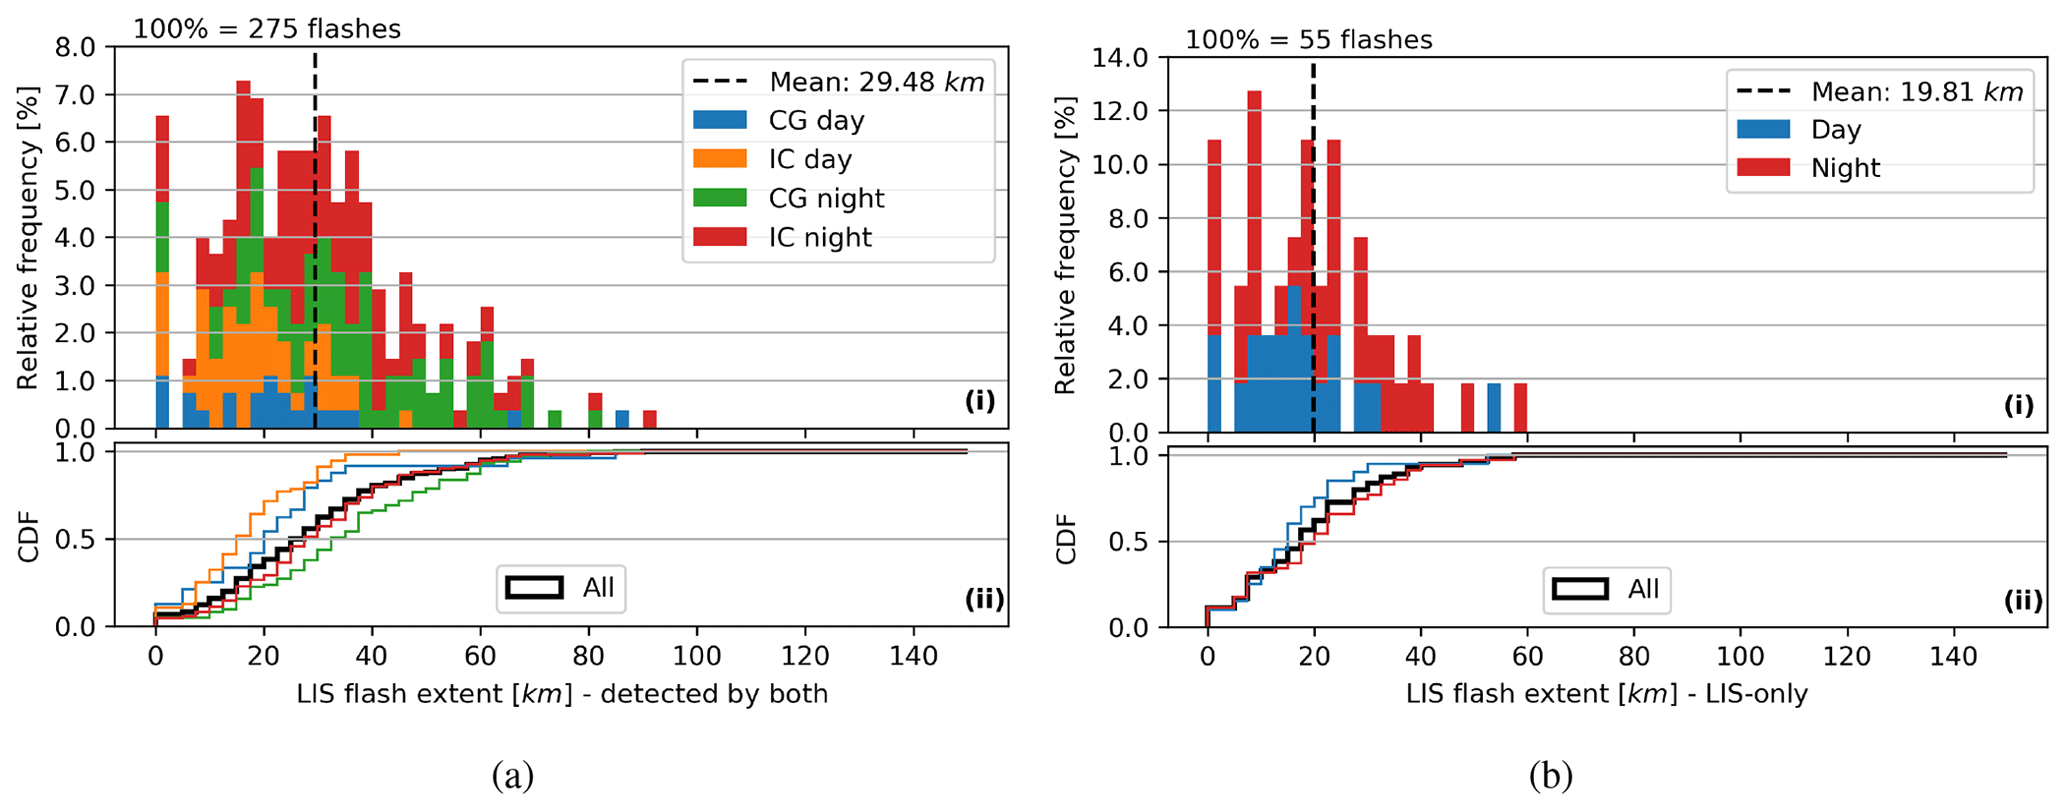
Figure 8Flash extents of ISS-LIS flashes with a coincident Meteorage flash (a) and unmatched ISS-LIS flashes (b). Daytime, nighttime and flash type, IC and CG, are indicated by the colors. The histogram (i) and corresponding CDF (ii) use the same colors. The CDF additionally shows a black curve for all data. The histogram bin width is constant at 2.5 km. Note: the CG–IC attribute for an ISS-LIS flash needs the matched Meteorage flash and does not exist for ISS-LIS-only flashes. The mean value is plotted as a dashed line. The total number of flashes is indicated above the histogram.

Figure 9Flash duration of ISS-LIS flashes with a coincident Meteorage flash (a) and unmatched ISS-LIS flashes (b). Daytime, nighttime and flash type, IC and CG, are indicated by the colors. The histogram (i) and corresponding CDF (ii) use the same colors. The CDF additionally shows a black curve for all data. The histogram bin width is constant at 0.05 s. Note: the CG–IC attribute for an ISS-LIS flash needs the matched Meteorage flash and does not exist for ISS-LIS-only flashes. The mean value is plotted as a dashed line. The total number of flashes is indicated above the histogram.
The averages, minima and maxima of Meteorage flash characteristics are summarized in Table 3. Meteorage flashes contain on average 3.8 (but up to 54) strokes and/or pulses. The distributions of pulse and stroke numbers per matched and unmatched flash are presented in Fig. 10a and b, including the stacked histogram (i) and the CDFs (ii) as explained for Fig. 7. Meteorage flashes seen by ISS-LIS are composed of 4.4 pulses and/or strokes on average. Meteorage-only flashes contain 2.9 pulses and/or strokes on average; 29.8 % of Meteorage flashes with a coincident ISS-LIS flash have only one pulse or stroke (10 CG, 87 IC). Single-element flashes constitute about 43.2 % of the unmatched Meteorage flashes (15 CG, 90 IC). As for ISS-LIS flashes, Meteorage flashes with a match not only contain more pulses and/or strokes, but also extend and last longer than the unmatched flashes (Table 3). The flash extent distributions in Fig. 11a and b show a mean (maximum) of 12.1 km (147.5 km) and 6.9 km (109.2 km) for matched and unmatched flashes, respectively. ISS-LIS detected all IC Meteorage flashes with extents above 32 km. The longest flashes are categorized as CG nighttime. In general, Meteorage CG flashes extend further than IC flashes. The mean extent equals 18.2 km (11.6 km) and 9.2 km (3.9 km) for matched (unmatched) CG and IC flashes, respectively. This is particularly small for unmatched IC flashes (as ISS-LIS can detect the longer IC flashes).
Table 3Overall average and the average, minimum and maximum values of Meteorage flash characteristics for matched and unmatched flashes. The minimum (maximum) altitude represents the 10th (90th) percentile of concurrent SAETTA sources. The maximum pulse–stroke amplitude is the maximum current observed for the flash (negative or positive).
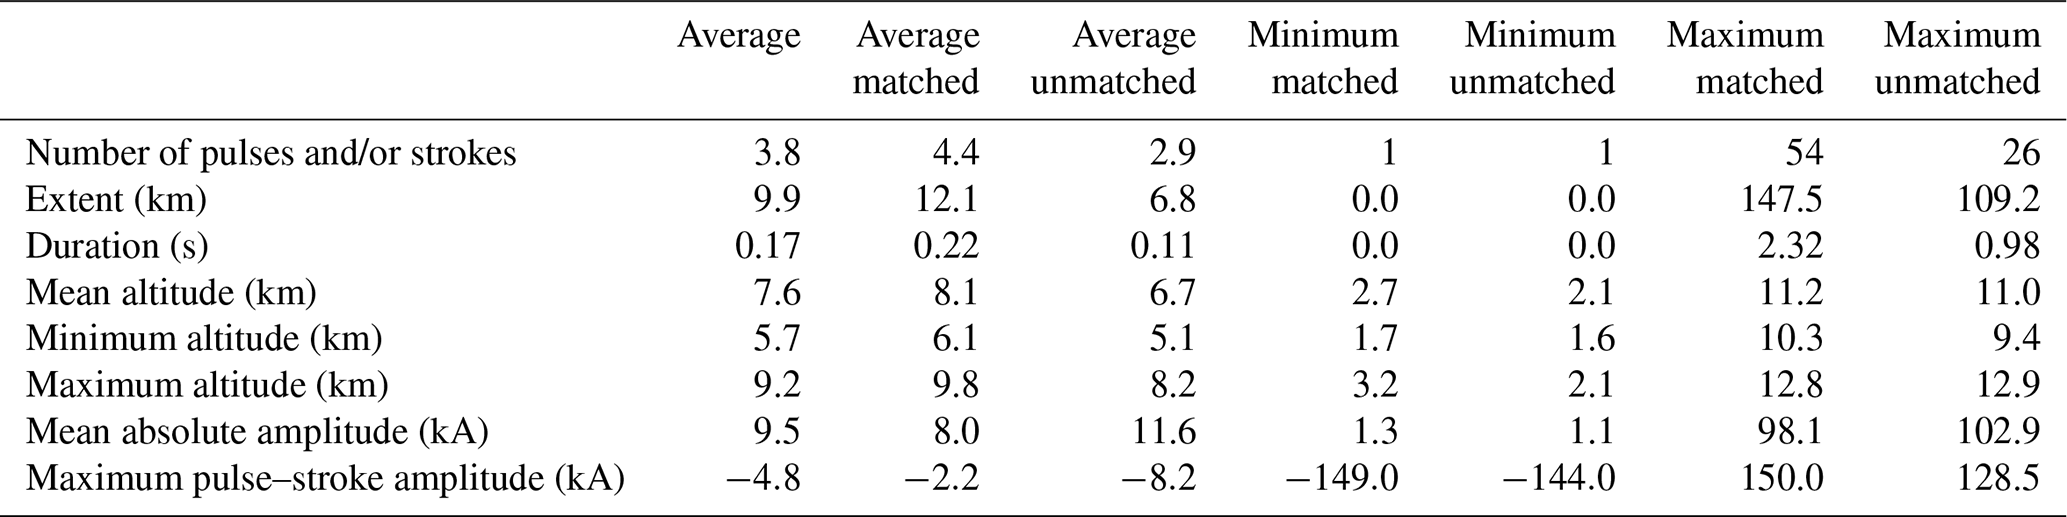

Figure 10Pulse–stroke number of Meteorage flashes with a coincident ISS-LIS flash (a) and unmatched Meteorage flashes (b). Daytime, nighttime and flash type, IC and CG, are indicated by the colors. The histogram (i) and corresponding CDF (ii) use the same colors. The CDF additionally shows a black curve for all data. The histogram bin width is constant at two pulses and/or strokes. The mean value is plotted as a dashed line. The total number of flashes is indicated above the histogram.
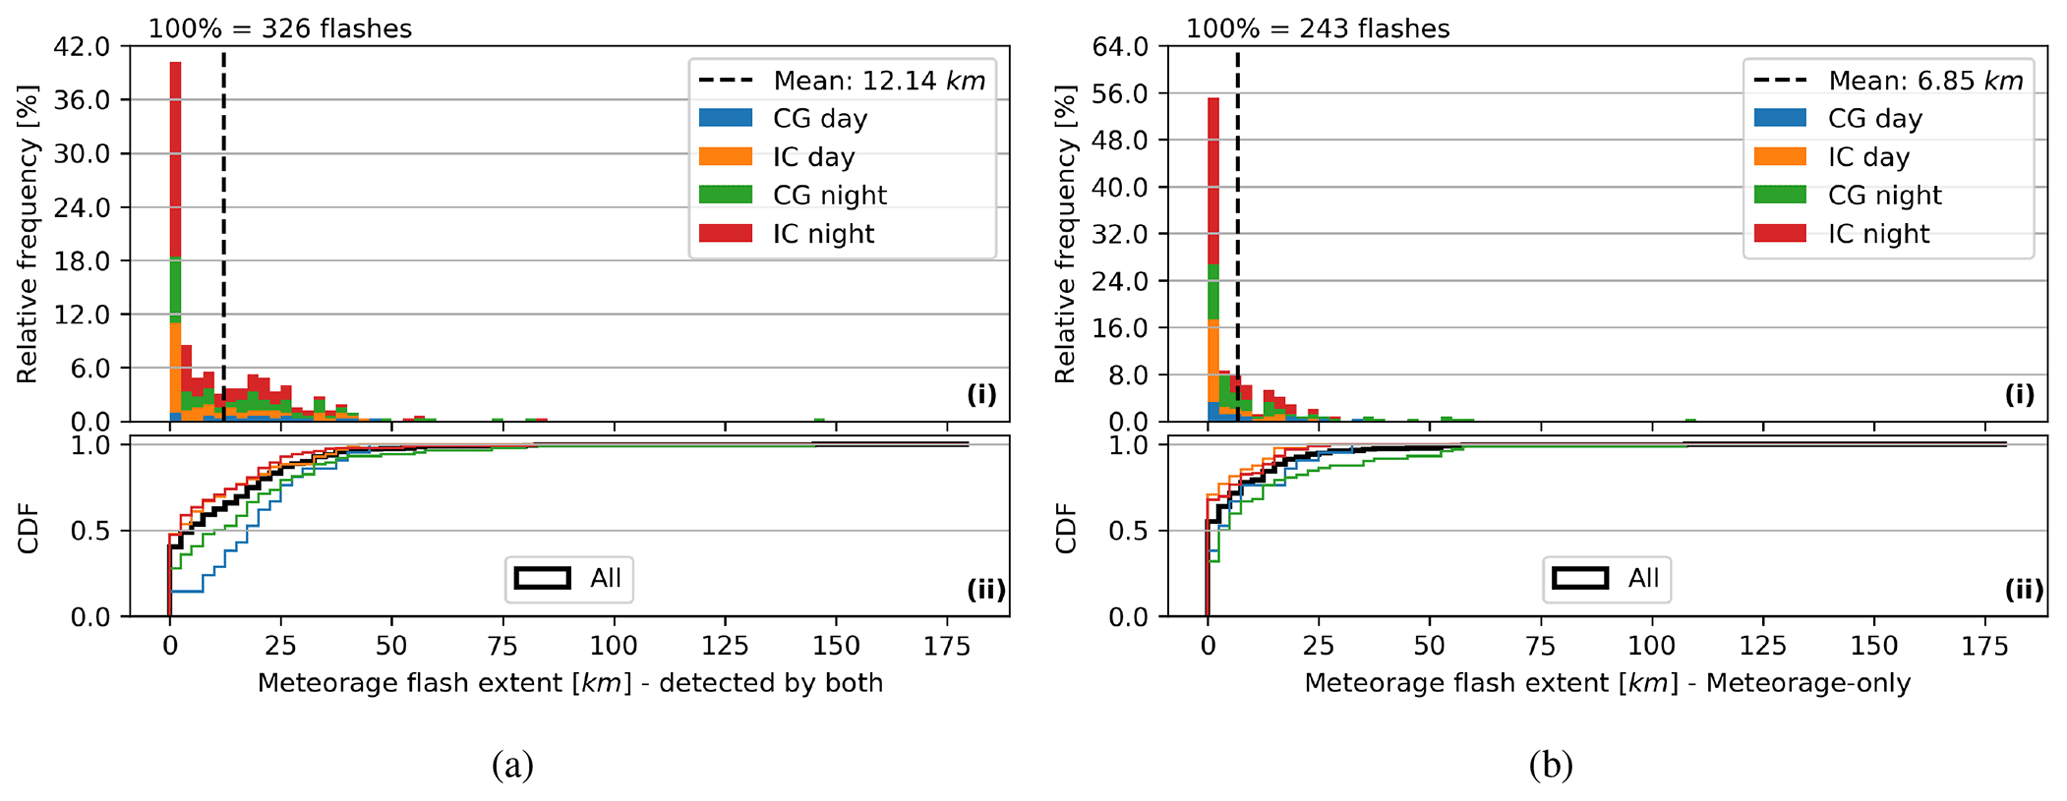
Figure 11Flash extent of Meteorage flashes with a coincident ISS-LIS flash (a) and unmatched Meteorage flashes (b). Daytime, nighttime and flash type, IC and CG, are indicated by the colors. The histogram (i) and corresponding CDF (ii) use the same colors. The CDF additionally shows a black curve for all data. The histogram bin width is constant at 2.5 km. The mean value is plotted as a dashed line. The total number of flashes is indicated above the histogram.
Meteorage flash durations support the findings, with matched flashes lasting on average (maximal) 0.22 s (2.3 s) and unmatched flashes lasting on average (maximal) 0.11 s (1.0 s). Figure 12a and b provide the duration distributions for Meteorage flashes. Distributions of both matched (a) and unmatched (b) flashes are sharply peaked for flashes shorter than 0.05 s (first bin; including single-element flashes, maximum of 13 pulses and/or strokes per flash). The CDF (Fig. 12aii and bii) illustrates that Meteorage CG flashes (mean 0.28 s) last statistically longer than Meteorage IC flashes (mean 0.11 s).

Figure 12Meteorage flash duration with a coincident ISS-LIS flash (a) and unmatched Meteorage flashes (b). Daytime, nighttime and flash type, IC and CG, are indicated by the colors. The histogram (i) and corresponding CDF (ii) use the same colors. The CDF additionally shows a black curve for all data. The histogram bin width is constant at 0.05 s. The mean value is plotted as a dashed line. The total number of flashes is indicated above the histogram.
To conclude, matched flashes contain more elements, are more extended and last longer than unmatched flashes for both ISS-LIS and Meteorage records. Meteorage flashes appear to be on average both smaller in extent and shorter in duration than ISS-LIS flashes. The finding is in accordance with the different expectations for optical (LIS) and LF (Meteorage) signals.
Seven (two ISS-LIS, five Meteorage) exceptionally long flashes (extent > 90 km or duration > 1.5 s) are analyzed using concurrent SAETTA observations. The VHF sources highlight the fact that there can be concurrent flashes that either merge and form one flash or propagate at different height levels. ISS-LIS and Meteorage detect both types as continuous flashes as the LLSs capture the flashes two-dimensionally. They can, in particular, not distinguish the different altitudes for the latter.
Then, the VHF SAETTA LLS is used to determine the altitude range of each ISS-LIS and Meteorage flash. The flash mean altitude, the flash minimum altitude and the flash maximum altitude (as defined in Sect. 2.3) constitute three additional flash characteristics. Since not every ISS-LIS and Meteorage flash was detected by SAETTA, flash numbers are reduced compared to the ones discussed in Sect. 3.1 to 256 ISS-LIS flashes with a match, 43 ISS-LIS-only flashes, 292 Meteorage flashes with a match and 188 Meteorage-only flashes. ISS-LIS mean event amplitude count and Meteorage mean pulse–stroke amplitude distributions are examined for the analyzed altitude levels of flashes. The lowest altitude of detectable VHF sources increases with distance to the LMA network, mainly due to Earth's curvature and also due to shading by the relief, especially in the south of the domain (Coquillat et al., 2019a). Hence, flash minimum (and mean) altitudes might suffer from undetected VHF sources at low altitudes.
Figure 13 presents the mean altitude of matched (a) and unmatched (b) ISS-LIS flashes as histograms (i) and CDFs (ii). The distributions of the flash mean amplitude counts in each altitude bin are included as a blue box plot (with the mean marked as a diamond; outliers not plotted). The distribution of mean altitudes for unmatched ISS-LIS flashes fits that of the matched ISS-LIS flashes (although the number of unmatched flashes is low). The mean flash altitudes average about 8.2 km (Table 2).
The overall ISS-LIS flash mean altitude distribution, which is dominated by 83.3 % flashes with a match, peaks at about 9.5 km, as shown in the histogram in Fig. 13ai. The daytime distribution has a second mode near 5.0 km of altitude. ISS-LIS flashes reach on average altitudes of 9.9 km and were observed up to almost 13 km of altitude (Table 2) (a noteworthy high value considering the tropopause at 10 to 12 km of altitude).
Differences between matched and unmatched ISS-LIS minimum flash altitudes are approximately 0.5 km, with matched flashes showing lower minima (distributions not shown). The difference is significant as it exceeds the predicted SAETTA altitude error (about 0.2 km over wide parts of the domain); 89.7 % of the 126 ISS-LIS flashes with minima less than (or equal to) 6.0 km of altitude have a coincident Meteorage flash. ISS-LIS flashes with minima above 6.0 km (173) are detected by Meteorage in 82.7 % of the cases. Overall, Meteorage better detected low-altitude ISS-LIS flashes than ISS-LIS flashes restricted to middle and high levels.
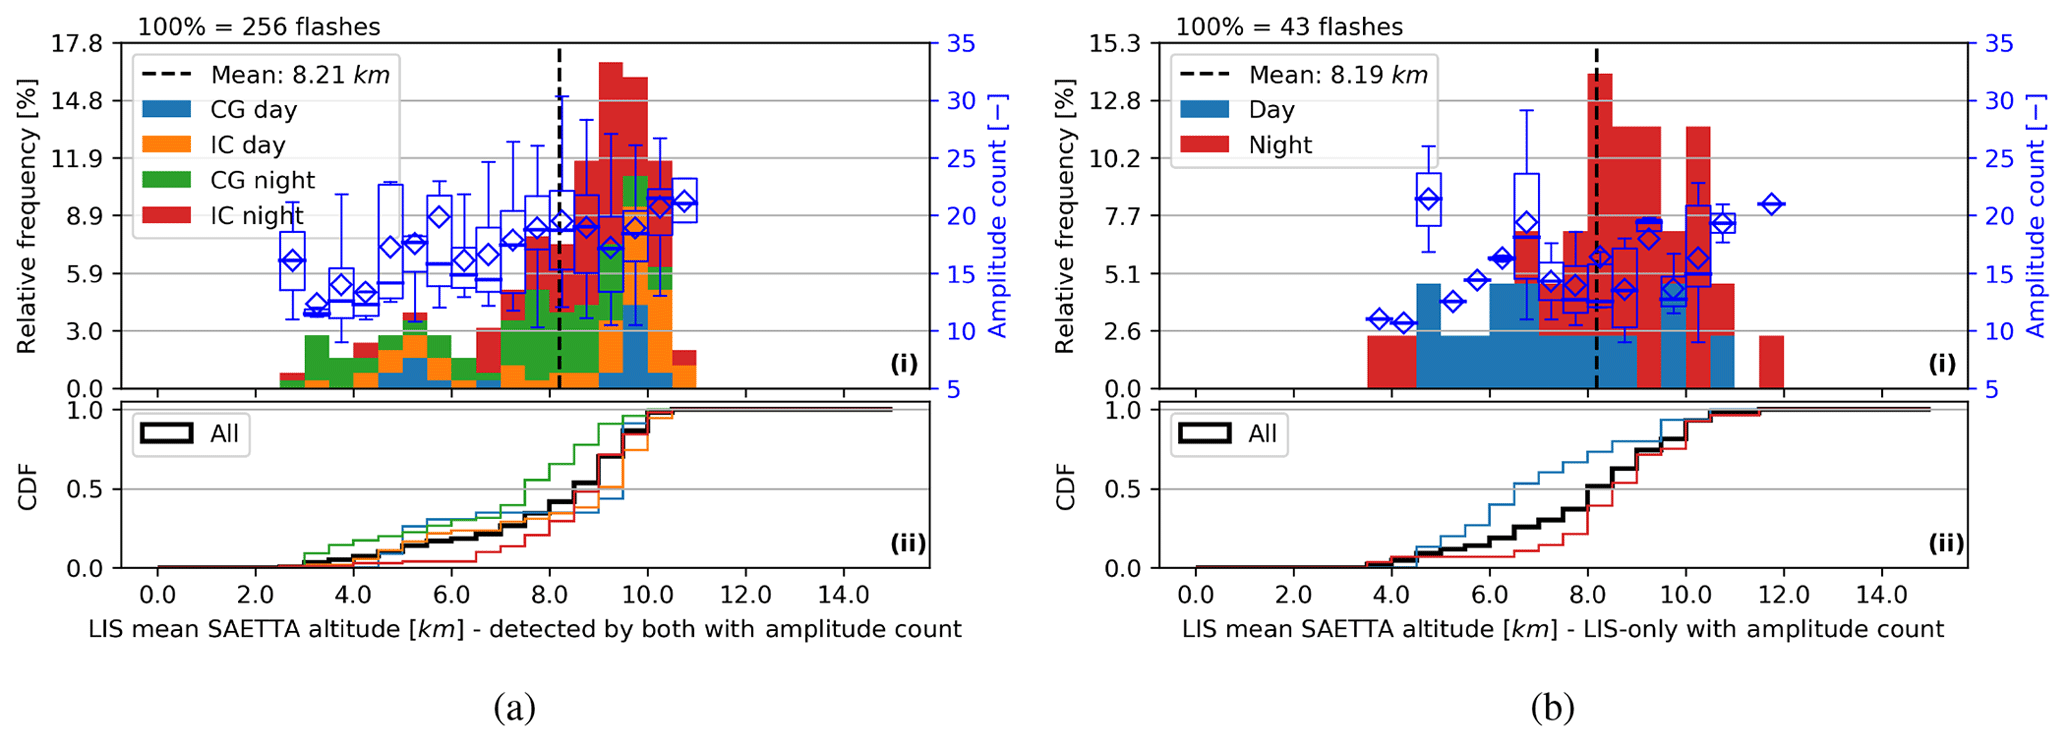
Figure 13Flash mean altitude of ISS-LIS flashes (from concurrent SAETTA observations) with a coincident Meteorage flash (a) and unmatched ISS-LIS flashes (b). Daytime, nighttime and flash type, IC and CG, are indicated by the colors. The histogram (i) and corresponding CDF (ii) use the same colors. The CDF additionally shows a black curve for all data. The histogram bin width equals 0.5 km. Note: the CG–IC attribute for an ISS-LIS flash needs the matched Meteorage flash and does not exist for ISS-LIS-only flashes. The mean value is plotted as a dashed line. The total number of flashes is indicated above the histogram. The blue box plots (median as a line, mean as a diamond, interquartile range – IQR – as a box, 1.5 IQR as whiskers; outliers not plotted) represent the distributions of the ISS-LIS mean event amplitude count per flash for each altitude bin.
The amplitude count of ISS-LIS flashes increases in general with the mean altitude (Fig. 13ai and bi). The highest observed flash mean altitudes occur mainly for pure IC flashes and show statistically high-amplitude counts. They likely originate within high-reaching convective clouds like cumulus congestus and cumulonimbus. Similar results regarding the amplitude count distributions were identified for the ISS-LIS flash maximum altitude distributions and maximum event amplitude count per flash at different altitudes (not shown). Matched and unmatched ISS-LIS flashes feature almost similar mean amplitude counts (Table 2). The overall brightest event (127.0) occurred during nighttime for a matched flash. The strongest optical signal during the day (105.0) is also recorded within a matched flash. Accordingly, maximum event amplitude counts averaged over all flashes of about 53.3 and 36.9 characterize matched and unmatched flashes, respectively (Table 2). Flashes containing the optically brightest events have a higher chance of producing significant LF signals and being detected by Meteorage than the optically darker flashes.
The comparison of altitudes of Meteorage flashes with and without ISS-LIS matches aims to study how ISS-LIS can detect low-altitude flashes. The flash mean (absolute) amplitude and maximum pulse–stroke amplitude per flash are additionally analyzed for each altitude bin in the histograms. The maximum amplitude per flash can either show a positive or negative current. Results are presented in Fig. 14 for the altitude maximum with the mean absolute amplitude per flash. Mean flash altitudes average 8.1 km for Meteorage flashes with a match (Table 3). They are on average 1.4 km lower for the Meteorage-only flashes. The mean altitude of matched flashes is similar to that of ISS-LIS matched flashes (Fig. 13a). The unmatched flashes, however, differ by about 1.5 km of altitude (difference well above the SAETTA altitude uncertainty). Meteorage flash maximum altitudes confirm this result (Fig. 14): flashes with a coincident ISS-LIS flash reach on average 9.8 km of altitude. The Meteorage-only flashes feature a maximum altitude of 8.2 km on average. The maximum altitude distribution peaks, as for the ISS-LIS matched flashes, at about 11.0 km of altitude (Fig. 14). For the Meteorage-only flashes, another mode exists between 6.5 and 7.0 km of altitude. The daytime distribution of unmatched Meteorage flashes peaks at the lower altitudes. It is indicative of the ISS-LIS reduced DE for low-altitude flashes (during all times and even more pronounced in daytime than during the night). Meteorage flashes with maxima exceeding 10.0 km (248) are detected by ISS-LIS in 75.4 % of the cases. The ISS-LIS relative DE for Meteorage flashes with maxima lower than (or equal to) 10.0 km (232) is only 45.3 %. This trend still influences the flash mean and minimum altitudes (Table 3). Hence, it is confirmed that ISS-LIS flash detection declines from high- to low-altitude flashes. The result agrees with the case study of Thomas et al. (2000), who found significantly less skill of TRMM-LIS for (CG) discharges near the cloud base than for lightning channels propagating to near the top of the clouds.
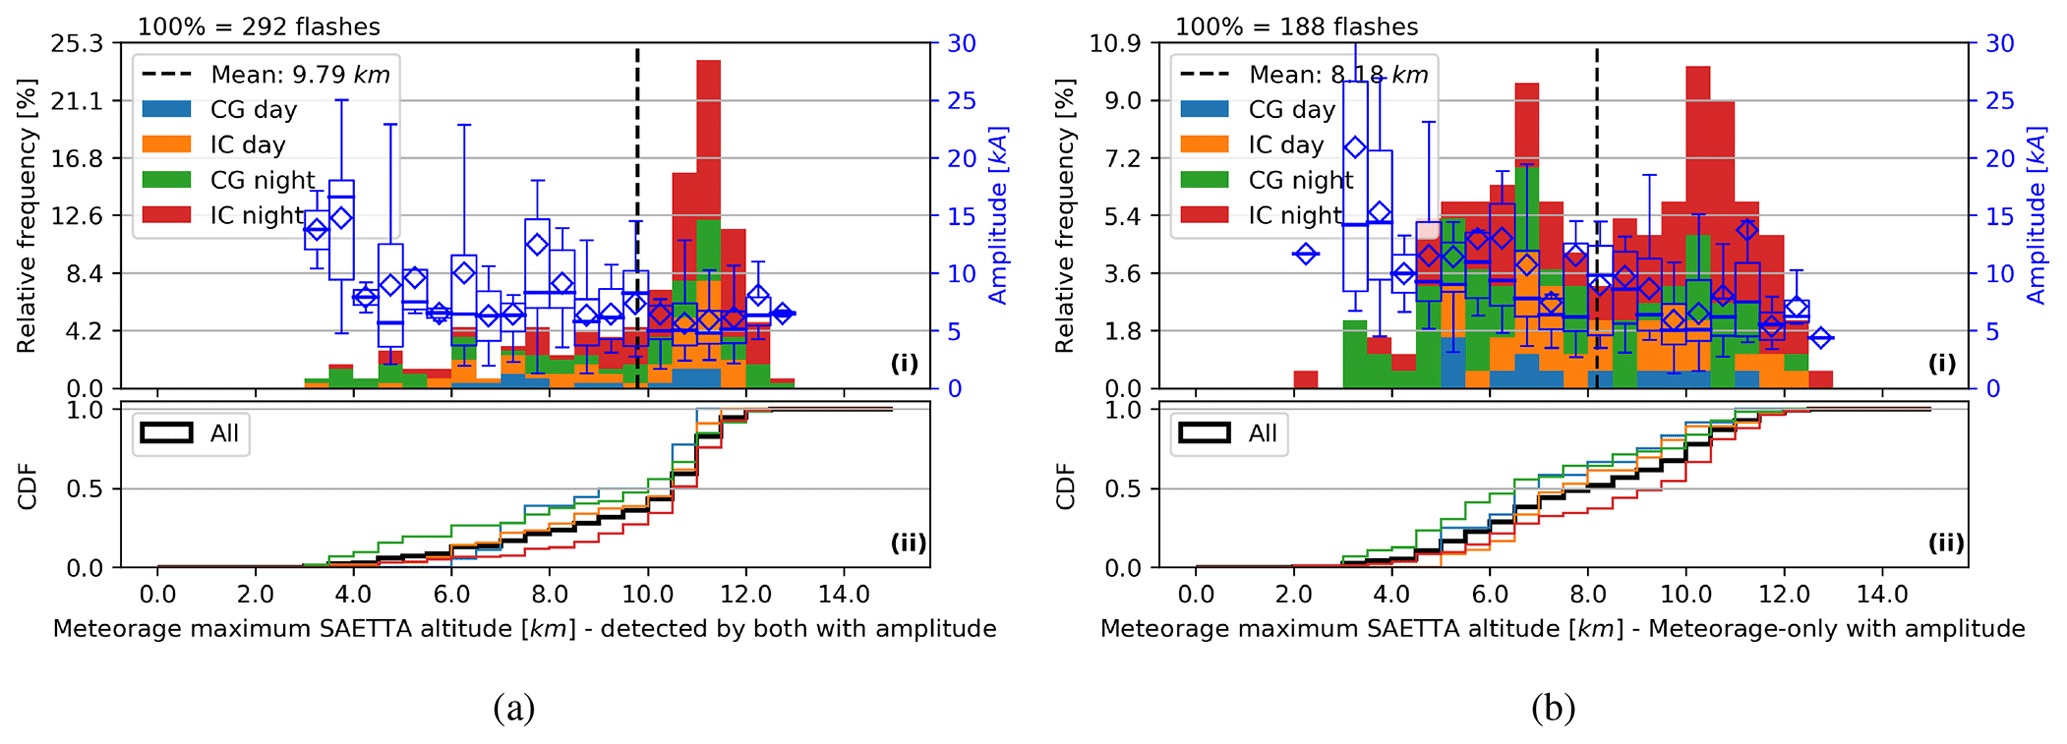
Figure 14Flash maximum altitude of Meteorage flashes (from concurrent SAETTA observations) with (a) and without (b) a coincident ISS-LIS flash. Daytime, nighttime and flash type, IC and CG, are indicated by the colors. The histogram (i) and corresponding CDF (ii) use the same colors. The CDF additionally shows a black curve for all data. The histogram bin width equals 0.5 km. The mean value is plotted as a dashed line. The total number of flashes is indicated above the histogram. The blue box plots (median as a line, mean as a diamond, IQR as a box, 1.5 IQR as whiskers; outliers not plotted) represent the distributions of the Meteorage mean absolute amplitude per flash for each altitude bin (scale fixed range from 0 to 30 kA).
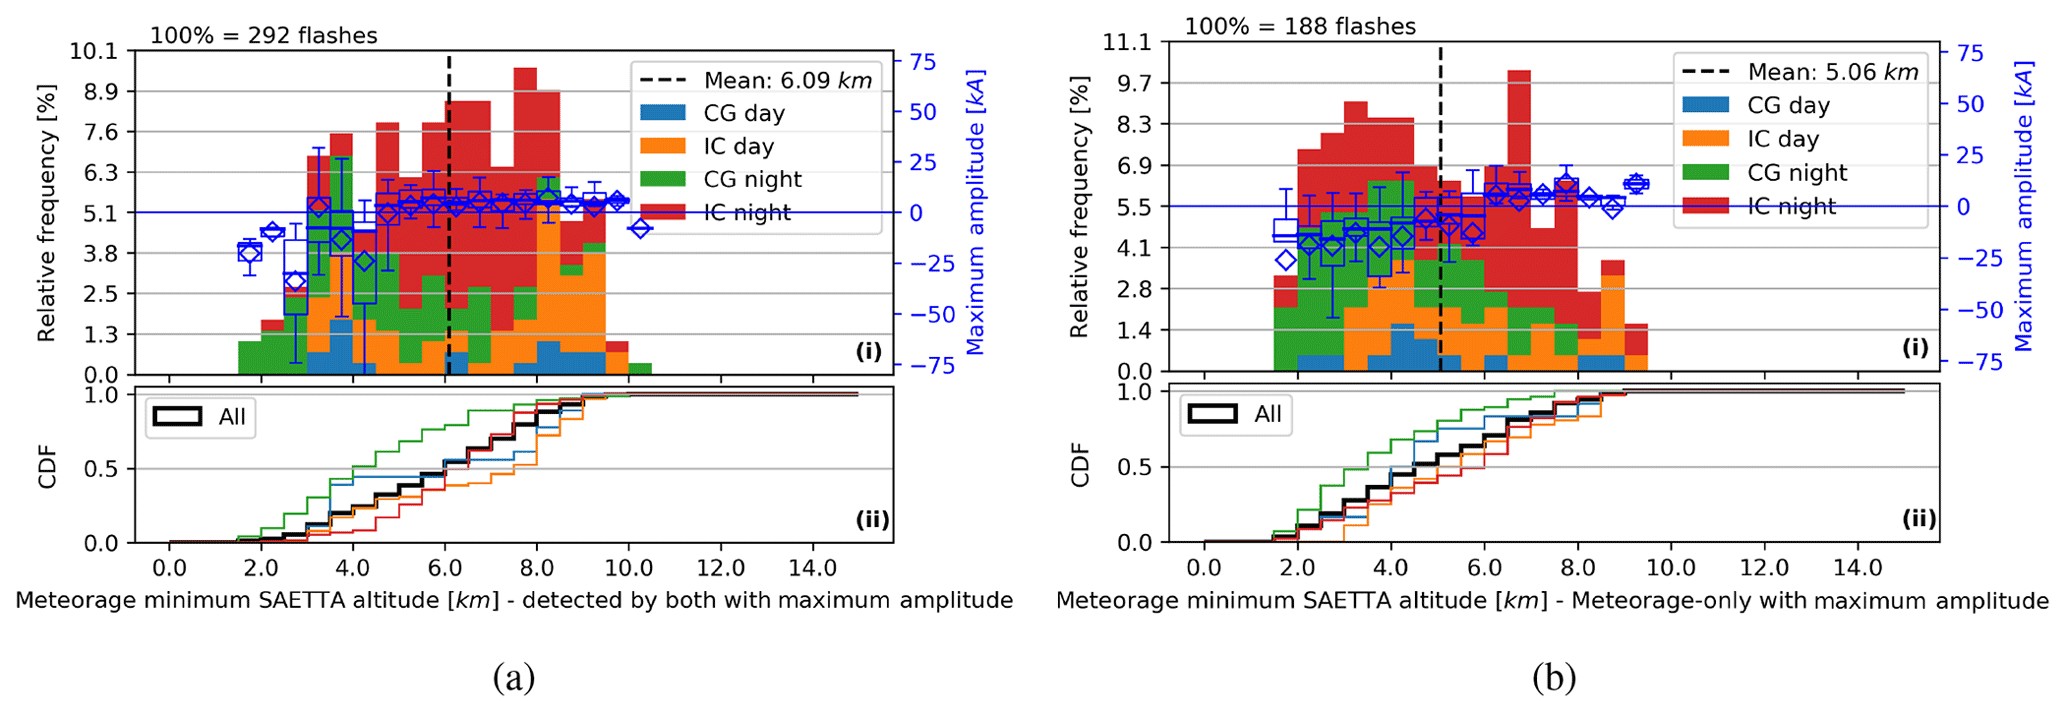
Figure 15As Fig. 14 for the minimum altitude of Meteorage flashes with (a) and without (b) a match. Here, the blue box plots represent the distributions of the Meteorage maximum (pulse–stroke) amplitude per flash (positive or negative currents) for each altitude bin.
Figure 15 shows the distribution of minimum flash altitudes with the maximum (pulse–stroke) amplitude per flash in each altitude bin. Low-altitude flashes (minimum altitudes below 5.0 km) feature statistically higher flash mean (not plotted) and maximum amplitudes than flashes occurring above 5.0 km of altitude (Fig. 15). Those flashes are mainly identified as CG flashes. The analysis of the flash maximum amplitude shows that those low-altitude flashes are dominated by negative maximum currents. The flashes with minimum altitudes above 5.0 km exhibit statistically more positive than negative maximum currents. Further investigation reveals that about 94 % of the (absolute) currents above 22.5 kA belong to CG strokes. The strongest currents reach up to 150.0 kA (both negative and positive currents) and are related to CG strokes. The vast majority (90.6 %) of the CG strokes have negative currents in this study. IC pulse currents do not exceed 50 kA. About 90 % of pulses and/or strokes with an amplitude below 10.0 kA are IC pulses. A similar result is provided by Cummins and Murphy (2009). They found that 90 % of positive LF currents with less than 10.0 kA belong to IC pulses. Negative currents are observed for approximately 26 % of the IC pulses.
The Meteorage mean (maximum) flash absolute amplitude equals 8.0 kA (13.2 kA) and 11.6 kA (18.1 kA) for matched and unmatched flashes, respectively. The difference between matched and unmatched flashes is attributed to some low- to mid-level flashes producing strong currents and not being detected by ISS-LIS (compare panels a and b in Figs. 14 and 15). However, the overall distributions of absolute flash amplitudes appear to be similar for matched and unmatched Meteorage flashes.
Flashes observed in this study show a statistical relationship between the polarity of the maximum (LF) current and the altitude. The relationship was detailed for the flash minimum altitudes and also appears for the flash maximum altitudes. In this study, flashes with maximum altitudes below 10.0 km exhibit mainly negative maximum currents. As it was found that the ISS-LIS DE is 30 % higher for flashes with maximum altitudes above 10.0 km than for flashes restricted to lower levels, the polarity of the flash maximum current might provide the first information on whether a flash is detected by ISS-LIS. This finding is probably specific for the storm types and flashes analyzed in this study (and region). The observed relationship between the polarity of the maximum current of a flash and its altitude might change for inverted-polarity storms or hybrid (IC+CG) flashes.
This study compares the results of the LF ground-based Meteorage LLS, the satellite sensor ISS-LIS and the VHF ground-based LMA SAETTA. The study domain is bounded to a region near Corsica in the Mediterranean Sea where SAETTA data are available. As ISS-LIS has been operating since March 2017, the period is confined to about 1 year from 1 March 2017 to 20 March 2018.
A new algorithm is developed to group ISS-LIS events as well as Meteorage pulses and strokes to flashes. The algorithm is validated using concurrent SAETTA observations and the results of the existing NASA LIS algorithm.
ISS-LIS detected in total 16 881 events distributed over 330 flashes during its overpasses of the study domain. Meteorage data are filtered for the times of ISS overpasses. It contains 2144 pulses and/or strokes (487 CG, 1657 IC) in 569 flashes. ISS-LIS detected about 57.3 % of the Meteorage flashes. Cloud-to-ground (CG) flashes and single-pulse intra-cloud and cloud-to-cloud (IC) flashes especially decrease the overall relative detection efficiency (DE) of ISS-LIS. A relative DE of 53.9 % was observed for flashes detected by Meteorage during daytime. LIS detected Meteorage IC flashes with about a 6 % higher relative DE than CG flashes. The LF Meteorage LLS was able to detect more than 80 % of all occurring ISS-LIS flashes.
Distances and timing offsets between matched ISS-LIS and Meteorage flashes are analyzed. A mode (median) distance (given a Meteorage flash) of about 1.8 km (2.3 km) indicates a fairly accurate collocation of the flashes. Given an ISS-LIS flash, the mode (median) distance equals about 3.0 km (4.7 km). The majority of distances between matched flashes are within the ISS-LIS pixel resolution (4.5 km nadir, 6.2 km at the edge of the field of view). The absolute timing offset distribution between a given Meteorage flash and the matched ISS-LIS flash is sharply peaked for less than 1.0 ms. Considering the ISS-LIS frame integration time of 2.0 ms, this is a very satisfying result. An analysis of the closest elements (events and pulses and/or strokes) reveals that, with similar probability, ISS-LIS or Meteorage detected lightning first, while the mode timing offsets remain within the LIS frame integration time. For CG strokes, however, ISS-LIS tended to detect the lightning activity later than Meteorage. All offsets increase relatively from the distribution given a Meteorage flash to the distribution given an ISS-LIS flash. This finding is likely caused by the significantly lower number of pulses and strokes than the number of events. Thus, it is more likely to find an event close to a pulse or stroke than vice versa.
For an enhanced understanding of the flash detection by ISS-LIS and Meteorage, characteristics of the flashes are investigated. In accordance with, e.g., Rudlosky et al. (2017) and Zhang et al. (2019), the probability of a match increases with a larger flash extent and flash duration. A matched flash extended on average almost twice as wide and lasted twice as long as a flash not seen by both ISS-LIS and Meteorage. In a similar manner, the matched flashes contained on average twice the number of elements as a flash observed by only one of the LLSs. ISS-LIS is sensitive to optical signals, while Meteorage detects LF signals of electrical discharges. Nevertheless, ISS-LIS flashes with at least one very bright event were more likely to be detected by Meteorage than optically darker flashes. Using the 3-D lightning location of concurrent SAETTA observations, ISS-LIS and Meteorage flash altitudes are compared. Altitude-related behaviors are likely driven by the range of IC and CG flash altitudes. Detailed results for the flash types are given in Sect. 3.3. Matched flashes of both ISS-LIS and Meteorage feature similar mean altitudes near 8.2 km on average. Unmatched Meteorage flashes occurred on average 1.4 km lower than Meteorage flashes seen by ISS-LIS. The maximum altitude of a flash significantly influenced the detectability by ISS-LIS (compare, e.g., Thomas et al., 2000). Meteorage flashes with maxima exceeding 10.0 km of altitude were detected by ISS-LIS in 75.4 % of the cases. The ISS-LIS relative DE for Meteorage flashes with maxima lower than 10.0 km of altitude is only 45.3 %. The Meteorage flash detection depended slightly on the flash minimum altitude; 89.7 % of the ISS-LIS flashes with minima less than 6.0 km of altitude had a coincident Meteorage flash. ISS-LIS flashes with minima above 6.0 km of altitude had a coincident Meteorage flash in 82.7 % of the cases.
Further investigation revealed that the optical brightness of ISS-LIS flashes is somewhat correlated with the flash altitude, with increasing (both mean and maximum event) amplitude counts for increasing flash altitudes. Meteorage amplitudes increased statistically with decreasing flash altitudes. The polarity and the current of the strongest pulse or stroke within a Meteorage flash showed particular potential to gain qualitative flash altitude information. Flashes with maximum currents of −10 kA or lower remained mainly below 10.0 km of altitude. As stated earlier, the ISS-LIS relative DE was 30 % higher for those flashes than for flashes with maximum altitudes above 10.0 km. This finding will need additional proof, but it can be useful for mimicking satellite lightning products using LF LLSs.
This study analyzes satellite observed lightning over an extratropical region and compares the observations to ground-based LLSs. Our results, including the statistics, use about 1 year of data within the limited region around Corsica island. This results in a limited number of lightning cases. The limited region enables the direct unique comparison of not only ISS-LIS and LF Meteorage but also the VHF SAETTA LLS. Hence, ISS-LIS and Meteorage flash detection is investigated in more detail, e.g., considering the concurrent SAETTA lightning source altitudes. The coincidences between ISS-LIS and Meteorage flashes do not always have a one-to-one correspondence. It is, in addition, an artifact of the relatively coarse match constraints of 20.0 km in space and 1.0 s in time. The constraints are validated and their influence on the results is seen in the matched distance and timing offset distributions. It should be mentioned that the available ISS-LIS data are the provisional P0.2 version for this work, which represents close to but not quite the fully validated data of ISS-LIS. Due to our limited number of cases, all ISS-LIS data are treated in the same way independent of the position within the ISS-LIS field of view (FOV). It is known that the ISS-LIS pixel (event) resolution and the DE decrease near the edge of the FOV. However, it was decided not to filter or reduce the observed cases further in order to allow for a statistical analysis. Our method can be applied to geostationary satellite LLSs, i.e., GLM and the future MTG-LI, and the comparison of their observations to ground-based LLSs. It is planned to study GLM and NLDN lightning observations in America using our methodology. The geostationary satellite observes one region continuously, and thus there will be many more cases for the statistics. The results might be compared to our results of the comparison of ISS-LIS and Meteorage.
ISS-LIS provisional science data are available via NASA and HyDRO Search at the following DOI: https://doi.org/10.5067/LIS/ISSLIS/DATA204 (Blakeslee et al., 2017). Fully validated ISS-LIS data are provided by NASA and HyDRO Search. SAETTA data are available to members of HyMeX on the HyMeX website and can be provided on demand. They are also available on the AERIS/SEDOO/HyMeX database (https://www.aeris-data.fr/, Coquillat et al., 2019b). Meteorage data are provided by and are the property of Meteorage as a company.
FEr, EDe and OCa designed the methodologies to merge and analyze the lightning data. FEr implemented the methods and verified both the code and results. FEr created all the plots. RJB, SPe and SCo provided the lightning data and some expertise on their quality. FEr wrote the paper. All authors contributed to revisions of the paper.
The authors declare that they have no conflict of interest.
This article is part of the special issue “Hydrological cycle in the Mediterranean (ACP/AMT/GMD/HESS/NHESS/OS inter-journal SI)”. It is not associated with a conference.
Felix Erdmann thanks the CNES and Météo-France for funding his PhD. This work is a contribution to the HyMeX program through the EXAEDRE project, grant ANR-16-CE04-0005, funded by the French research foundation ANR and the SOLID project, funded by CNES. Acknowledgements are also addressed to the CORSiCA-SAETTA main sponsors (Collectivité Territoriale de Corse through the Fonds Européen de Développement Régional of the European Operational Program 2007-2013 and the Contrat de Plan Etat Région, HyMeX/MISTRALS, Observatoire Midi-Pyrénées, Laboratoire d’Aérologie, CNES) and many individuals and regional institutions in Corsica that host the 12 stations of the network or helped us to find sites. The authors also want to thank the SAETTA team. EUMETSAT MSG/SEVIRI data were provided by SATMOS (Météo-France/CMS). We thank the AERIS/ICARE Data and Services Center for providing access to and visualization for the data used in Fig. 1b.
This research has been supported by the Centre National d'Etudes Spatiales (grant no. SOLID).
This paper was edited by Domenico Cimini and reviewed by Kenneth Cummins and two anonymous referees.
Bitzer, P. M., Burchfield, J. C., and Christian, H. J.: A Bayesian Approach to Assess the Performance of Lightning Detection Systems, J. Atmos. Ocean. Tech., 33, 563–578, https://doi.org/10.1175/JTECH-D-15-0032.1, 2016. a, b, c, d, e, f, g
Blakeslee, R. and Koshak, W.: LIS on ISS: Expanded Global Coverage and Enhanced Applications, The Earth Observer, 28, 4–14, 2016. a, b
Blakeslee, R. J., Bailey, J. C., Carey, L., Goodman, S. J., Rudlosky, S., Albrecht, R., Morales, C. A., Anselmo, E., and Neves, J.: São Paulo Lightning Mapping Array (SP-LMA): Network Assessment and Analyses for Intercomparison Studies and GOES-R Proxy Activities, J. Atmos. Ocean. Tech., 19, 1318–1332, 2013. a
Blakeslee, R. J., Mach, D. M., Stewart, M. F., Buechler, D., and Christian, H.: Non-Quality Controlled Lightning Imaging Sensor (LIS) on International Space Station (ISS) Provisional Science Data P0.2, https://doi.org/10.5067/LIS/ISSLIS/DATA204, dataset available online from the NASA Global Hydrology Center DAAC, Huntsville, Alabama, USA, 2017. a, b
Boccippio, D., Koshak, W. J., and Blakeslee, R. J.: Performance Assessment of the Optical Transient Detector and Lightning Imaging Sensor. Part I: Predicted Diurnal Variability, J. Atmos. Ocean. Tech., 19, 1318–1332, https://doi.org/10.1175/1520-0426(2002)019<1318:PAOTOT>2.0.CO;2, 2002. a, b
Cecil, D. J., Goodman, S. J., Boccippio, D. J., Zipser, E. J., and Nesbitt, S. W.: Three Years of TRMM Precipitation Features. Part I: Radar, Radiometric, and Lightning Characteristics, Mon. Weather Rev., 133, 543–566, https://doi.org/10.1175/MWR-2876.1, 2005. a
Christian, H. J., Blakeslee, R. J., Goodman, S. J., Mach, D. A., Stewart, M. F., Buechler, D. E., Koshak, W. J., Hall, J. M., Boeck, W. L., Driscoll, K., and Boccippio, D. J.: The Lightning Imaging Sensor, 11th International Conference on Atmospheric Electricity, NASA Conf. Publ. NASA/CP-1999-209261a, 746–749, 1999. a
Christian, H. J., Blakeslee, R. J., Goodman, S. J., and Mach, D. M.: Algorithm Theoretical Basis Document (ATBD) For the Lightning Imaging Sensor (LIS), Earth Observing System (EOS) Instrument Product, National Aeronautics and Space Administration George C. Marshall Space Flight Center, 2000. a, b
Coquillat, S., Defer, E., Jarnot, C., Lambert, D., Martin, J.-M., Pinty, J.-P., and Prieur, S.: SAETTA: fine-scale observation of the lightning activity in the framework of the CORSiCA Atmospheric Observatory, 8th HyMeX workshop, Valletta, 15–18 September, Valletta, Malta, 2014. a
Coquillat, S., Defer, E., de Guibert, P., Lambert, D., Pinty, J.-P., Pont, V., Prieur, S., Thomas, R. J., Krehbiel, P. R., and Rison, W.: SAETTA: high-resolution 3-D mapping of the total lightning activity in the Mediterranean Basin over Corsica, with a focus on a mesoscale convective system event, Atmos. Meas. Tech., 12, 5765–5790, https://doi.org/10.5194/amt-12-5765-2019, 2019a. a, b, c, d
Coquillat, S., Defer, E., De Guibert, P., Lambert, D., and Prieur, S.: SAETTA LMA L1 lightning data, AERIS/SEDOO/HyMeX database, available at: https://www.aeris-data.fr/, last access: 23 October 2019b. a
Cummins, K. L. and Murphy, M. J.: An Overview of Lightning Locating Systems: History, Techniques, and Uses, With an In-depth Look at the U.S. NLDN, IEEE Trans. Electromag. Compat., 51, 499–518, https://doi.org/10.1109/TEMC.2009.2023450, 2009. a, b
Defer, E., Lagouvardos, K., and Kotroni, V.: Lightning activity in the eastern Mediterranean region, J. Geophys. Res., 110, D24210, https://doi.org/10.1029/2004JD005710, 2005. a, b
Deierling, W. and Petersen, W. A.: Total lightning activity as an indicator of updraft characteristics, J. Geophys. Res., 113, D16210, https://doi.org/10.1029/2007JD009598, 2008. a
Deierling, W., Petersen, W. A., Lathman, J., Ellis, S., and Christian, H. J.: The relationship between lightning activity and ice fluxes in thunderstorms, J. Geophys. Res., 113, D15210, https://doi.org/10.1029/2007JD009700, 2008. a
Goodman, S. J., Blakeslee, R. J., Koshak, W. J., Mach, D., Bailey, J., Buechler, D., Carey, L., Schultz, C., Bateman, M., McCaul Jr., E., and Stano, G.: The GOES-R Geostationary Lightning Mapper (GLM), Atmos. Res., 125–126, 34–49, https://doi.org/10.1016/j.atmosres.2013.01.006, 2013. a, b
Höller, H. and Betz, H.-D.: Study on Inter-comparison of LIS and Ground-Based Lightning Location System Observations, Report ITT No. 09/996, EUMETSAT, Deutsches Zentrum für Luft- und Raumfahrt, 2010. a, b, c, d, e, f
Koshak, W. J., Mach, D. M., and Bitzer, P. M.: Mitigating VHF Lightning Source Retrieval Errors, J. Atmos. Ocean. Tech., 35, 1033–1052, https://doi.org/10.1175/JTECH-D-17-0041.1, 2018. a
Mach, D. M., Christian, H. J., Blakeslee, R. J., Boccippio, D. J., Goodman, S. J., and Boeck, W. L.: Performance assessment of the Optical Transient Detector and Lightning Imaging Sensor, J. Geophys. Res., 112, D09210, https://doi.org/10.1029/2006JD007787, 2007. a
Mattos, E. V., Machado, L. A. T., Williams, E. R., Goodman, S. J., Blakeslee, R. J., and Bailey, J. C.: Electrification life cycle of incipient thunderstorms, J. Geophys. Res.-Atmos., 122, 4670–4697, https://doi.org/10.1002/2016JD025772, 2017. a
Nag, A., Murphy, M. J., Schulz, W., and Cummins, K. L.: Lightning locating systems: Insights on characteristics and validation techniques, Earth Space Sci., 2, 65–93, https://doi.org/10.1002/2014EA000051, 2015. a
Peterson, M., Rudlosky, S., and Deierling, W.: The Evolution and Structure of Extreme Optical Lightning Flashes, J. Geophys. Res.-Atmos., 122, 13370–13386, https://doi.org/10.1002/2017JD026855, 2017. a, b, c
Pédeboy, S., Barnéoud, P., Defer, E., and Coquillat, S.: Analysis of the Intra-Cloud lightning activity detected with Low Frequency Lightning Locating Systems, 25th International Lightning Detection Conference, 7th International Lightning Meteorology Conference, 12–15 March, Ft. Lauderdale, Fl, USA, 2018a. a, b
Pédeboy, S., Defer, E., Kolmašová, I., Coquillat, S., Guibert, P. D., Lambert, D., Pinty, J.-P., Prieur, S., Santolík, O., Lán, R., and Uhlíř, L.: Analysis of the initiation phase in negative lightning flashes exhibiting an intense return stroke peak current, XVI International Conference on Atmospheric Electricity, 17–22 June, Nara City, Nara, Japan, 2018b. a
Rison, W., Thomas, R., Krehbiel, P., Hamlin, T., and Harlin, J.: A GPS-based Three-Dimensional Lightning Mapping System: Initial Observations in Central New Mexico, Geophys. Res. Lett., 26, 3573–3576, https://doi.org/10.1029/1999GL010856, 1999. a
Rudlosky, S. D., Peterson, M. J., and Kahn, D. T.: GLD360 Performance Relative to TRMM LIS, J. Atmos. Ocean. Tech., 34, 1307–1322, https://doi.org/10.1175/JTECH-D-16-0243.1, 2017. a, b, c, d, e
Schulz, W., Diendorfer, G., Pedeboy, S., and Poelman, D. R.: The European lightning location system EUCLID – Part 1: Performance analysis and validation, Nat. Hazards Earth Syst. Sci., 16, 595–605, https://doi.org/10.5194/nhess-16-595-2016, 2016. a
Stuhlmann, R., Rodriguez, A., Tjemkes, S., Grandell, J., Arriaga, A., Bézy, J.-L., Aminou, D., and Bensi, P.: Plans for EUMETSAT’s Third Generation Meteosat geostationary satellite programme, Adv. Space Res., 36, 975–981, https://doi.org/10.1016/j.asr.2005.03.091, 2005. a
Thomas, R. J., Krehbiel, P. R., Rison, W., Hamlin, T., Boccippio, D. J., Goodman, S. J., and Christian, H. J.: Comparison of ground-based 3-dimensional lightning mapping observations with satellite-based LIS observations in Oklahoma, Geophys. Res. Lett., 27, 1703–1706, https://doi.org/10.1029/1999GL010845, 2000. a, b, c
Thomas, R. J., Krehbiel, P. R., Rison, W., Hunyady, S. J., Winn, W. P., Hamlin, T., and Harlin, J.: Accuracy of the Lightning Mapping Array, J. Geophys. Res., 109, D14207, https://doi.org/10.1029/2004JD004549, 2004. a, b, c
Thompson, K. B., Bateman, M. G., and Carey, L. D.: A Comparison of Two Ground-Based Lightning Detection Networks against the Satellite-Based Lightning Imaging Sensor (LIS), J. Atmos. Ocean. Tech., 31, 2191–2205, https://doi.org/10.1175/JTECH-D-13-00186.1, 2014. a
Vaisala: Vaisala Thunderstorm Advanced Total Lightning Sensor LS7002, available at: https://www.vaisala.com/sites/default/files/documents/WEA-LS7002-Datasheet-B211284EN-A-LOW.pdf (last access: 28 June 2018), 2013. a
Vincenty, T.: Geodetic inverse solution between antipodal points, DMAAC Geodetic Survey Squadron, https://doi.org/10.5281/zenodo.32999, 1975. a
Zhang, D., Cummins, K. L., Bitzer, P. M., and Koshak, W. J.: Evaluation of the Performance Characteristics of the Lightning Imaging Sensor, J. Atmos. Ocean. Tech., 36, 1015–1030, https://doi.org/10.1175/JTECH-D-18-0173.1, 2019. a, b