the Creative Commons Attribution 4.0 License.
the Creative Commons Attribution 4.0 License.
 | 19 Feb 2021
Determination of equivalent black carbon mass concentration from aerosol light absorption using variable mass absorption cross section
Weilun Zhao
Wangshu Tan
Gang Zhao
Chuanyang Shen
Yingli Yu
Chunsheng Zhao
Atmospheric black carbon (BC) is the strongest solar radiative absorber in the atmosphere, exerting significant influences on the earth's radiation budget. The mass absorption cross section (MAC) is a crucial parameter for converting the light absorption coefficient (σab) to the equivalent BC mass concentration (EBC). Traditional filter-based instruments, such as the AE33, use a constant MAC of 7.77 m2/g at 880 nm to derive the EBC, which may lead to uncertainty in the EBC. In this paper, a new method of converting σab to the EBC is proposed by incorporating the variations of the MAC attributed to the influences of the aerosol coating state. A Mie simulation showed that the MAC varied dramatically with different core sizes and shell thicknesses. We compared our new method with the traditional method during a field measurement at a site on the North China Plain. The results showed that the MAC at 880 nm was smaller (larger) than 7.77 m2/g for particles smaller (larger) than 280 nm, resulting in an EBC mass size distribution derived from the new method that was higher (lower) than the traditional method for particles smaller (larger) than 280 nm. The size-integrated EBC derived from the new method was 16 % higher than that derived from the traditional method. Sensitivity analysis indicated that the uncertainty in the EBC caused by the refractive index (RI) was within 35 %, and the imaginary part of the RI had dominant influence on the derived EBC. This study emphasizes the necessity to take variations of the MAC into account when deriving the EBC from σab and can help constrain the uncertainty in EBC measurements.
- Article
(1012 KB) - Full-text XML
-
Supplement
(172 KB) - BibTeX
- EndNote


Black carbon (BC) is an important component of atmospheric aerosols (Ramanathan and Carmichael, 2008) because of its highly absorbing property. The environmental effect of BC is nonnegligible. The absorption of BC can significantly reduce visibility (Moosmuller et al., 2009). BC is considered a major factor for adverse health effects (Highwood and Kinnersley, 2006). The fractal aggregates morphology of BC provides substantial surface area for deposition of cancerogenic matter. The insoluble nature and fine size of BC make it deposit in the lungs for a long time. Because the significant impact of BC, extensive measurements have been made to monitor atmospheric loading of BC and provide information to policymakers for mitigation.
The BC mass concentration (mBC) is one of the important variables for BC measurement (Bond et al., 2013). Many methods have been proposed to determine mBC. For instance, the single-particle soot photometer (SP2) measures refractory BC (rBC) based on laser-induced incandescence (Schwarz et al., 2006). The organic-carbon–elemental-carbon (OCEC) analyzer determines elemental carbon (EC) through heating a collected sample in a subsequent helium/oxygen environment (Wu et al., 2012). Soot particle aerosol mass spectrometry (SP-AMS) combines laser-induced incandescence as well as laser vaporization used in mass spectrometry (Onasch et al., 2012) and also reports mBC as rBC. However, the abovementioned instruments are complicated in structure, highly expensive, hard to maintain and, as a result, not widely used.
Filter-based instruments, such as an aethalometer (Hansen et al., 1984), are commonly used for routine BC observations and dedicated campaigns (Castagna et al., 2019; Sandradewi et al., 2008; Helin et al., 2018) because they are convenient and easy to maintain. An aethalometer does not directly measure mBC but actually measures light absorption. An aethalometer converts the absorption coefficient (σab) at 880 nm to an equivalent BC mass concentration (EBC) (Petzold et al., 2013) through a fixed mass absorption cross section (MAC, 7.77 m2/g at 880 nm). However, field measurements indicated that the MAC showed both large temporal and spatial variability (Bond and Bergstrom, 2006; Lack et al., 2012; Cappa et al., 2012). For example, Bond et al. (2006) reported the MAC at 550 nm, varying from 1.6 to 15.9 m2/g. Sharma et al. (2002) reported the MAC at 880 nm, varying from 6.4 to 28.3 m2/g. It is not appropriate to use a fixed MAC when the EBC is derived from σab at 880 nm. The variation of the MAC has to be taken into account to reduce the uncertainty in the σab-derived EBC.
The mixing state of BC is one of the crucial reasons leading to a large variation in the MAC. Field measurements have indicated that fresh BC particles are generally subject to several coating processes while being transported in the atmosphere and tend to be covered in layers of other organic or inorganic components (Shiraiwa et al., 2007; Cappa et al., 2019; Bond et al., 2006). The gathered shell that builds up on the BC core, acting as a lens to focus additional incident light on the enclosed BC core, can enhance BC light absorption (Fuller et al., 1999). As a result, a coated BC particle will have a bigger MAC than the original pure BC particle. This light absorption enhancement is termed a “lensing effect” of the BC-containing particles. For typical core-coating mixed BC-containing particles, this lensing effect was found to enhance BC absorption by 50 %–100 % (Bond et al., 2006). Schwarz et al. (2008) found that fresh soot particles internally mixed with sulfates and organics during transportation, and the lensing effect enhanced the light absorption by a factor of 1.3–1.5.
At a given wavelength, such as 880 nm, the value of the MAC relies on the size and location of the BC core, coating thickness as well as the refractive index (RI) (Fuller et al., 1999; Lack and Cappa, 2010). A simplified core-shell configuration has been introduced to illustrate the structure of BC-containing particles and calculate the relevant optical properties. Several studies have demonstrated that it is appropriate to use the core-shell configuration for aged aerosols (Majdi et al., 2020; Liu et al., 2019; Li et al., 2019).
In previous studies (Zhao et al., 2019b; Ran et al., 2016a, b; Castagna et al., 2019), the variation of the MAC due to mixing state was not considered when deriving the EBC from σab. With the objective of improving the reliability of the σab-derived EBC, the Mie model incorporated with the core-shell configuration hypothesis was applied in this study to assess the limitation of the fixed MAC on the σab-derived EBC. Based on the detailed analysis of the relationship between the MAC, DBC and coating thickness (Tshell), a modified approach considering variation of the MAC due to mixing state was proposed for filter-based instruments to derive the EBC from σab. Detailed uncertainty analysis is carried out to assess the influence of assumptions used in this study. This modified method estimates the size-resolved EBC accurately and reduces the uncertainty in the σab-derived EBC with respect to mixing state.
2.1 Measurement sites
The EBC particle mass size distribution (BCPMSD) was obtained at the Zhangqiu Meteorology Station (36∘42′ N, 117∘30′ E), Shandong Province, surrounded by farmland and residential areas and a typical site for regional background conditions of the North China Plain (NCP). The field campaign lasted for about 1 month, from 23 July 2017 to 24 August 2017.
The number fraction of BC-containing aerosols (NBC) is required during conversion from absorption to the EBC. NBC was not measured simultaneously at Zhangqiu due to instrument limitations. NBC is a reference value in this work and obtained from measurements at Taizhou (32∘35′ N, 119∘57′ E). An SP2 was used to determine NBC at Taizhou from 24 May 2018 to 18 June 2018. The suburban Taizhou site lies at the south end of Jianghuai Plain in the east of China. This industrial area between the two megacities of Nanjing and Shanghai has experienced severe pollution during the past 30 years. Hence, NBC measured at Taizhou is representative and the campaign averaged NBC is used in this work. In addition, a comparison between AE33 and the three-wavelength photoacoustic soot spectrometer (PASS-3) at 405, 532 and 781 nm (Zhao et al., 2020) was also carried out at Taizhou for the scattering correction of AE33.
Besides Taizhou, the comparison between AE33 and PASS-3 was also conducted from 20 March 2018 to 30 April 2018 and from 10–19 October 2018 at Peking University (39∘59′ N, 116∘18′ E). This site is located northwest of Beijing, a megacity experiencing severe and complex urban pollution. From 21 March 2017 to 9 April 2017 at the Peking University site, simultaneous measurements from aethalometers AE51 (model 51, microAeth, USA) and AE33 at 880 nm were carried out to investigate the consistency between AE51 and AE33.
2.2 Instruments
All measurements at the three sites were conducted in temperature-controlled (24 ± 2 ∘C) containers, and a particle pre-impactor was used to remove particles larger than 10 µm from the input air stream. The drying systems in the three sites were configured with a Nafion dryer to keep the relative humidity of sample flow below 40 %. This type of dryer performs well in reducing aerosol losses. The transmission efficiency of the Nafion dryer is up to 90 % for particles smaller than 10 nm and rises up to 100 % for particles larger than 30 nm (the performance details of the Nafion dryer can be accessed at http://www.permapure.com, last access: 10 February 2021).
During the field campaign at the Zhangqiu site, the particle number size distribution (PNSD) as well as the BCPMSD were simultaneously determined using the measurement system developed by Ning et al. (2013) and improved by Zhao et al. (2019b). The polydisperse aerosol sample flow was first drawn into DMA (differential mobility analyzer) (Model 3080, TSI, USA) to select relatively monodispersed aerosol subpopulations with diameters ranging from 97 to 602 nm. Sheath and sample flows were set as 3 and 0.5 L/min, respectively. The selected monodispersed aerosol populations were further divided into two paths. One path (0.2 L/min) was drawn into AE51 for EBC measurements. The other path (0.3 L/min) was analyzed using CPC (condensation particle counter) (model 3772, TSI, USA) for number concentration measurements. As the standard sample flow for CPC 3772 is 1 L/min, a cleaned airflow of 0.7 L/min was added for compensation. A BCPMSD cycle measured here required 5 min and we averaged the data with a temporal resolution of 2 h.
The dry aerosol scattering coefficients at 525 nm were measured simultaneously to represent air pollution conditions by an integrated nephelometer (Ecotech Pty Ltd., Aurora 3000) with a flow rate of 3 L/min and temporal resolution of 1 min. Similar to the measured BCPMSD, aerosol scattering coefficients were also averaged with a temporal resolution of 2 h.
For AE51, the influence of loading effect was resolved by using . σab,corrected and σab,uncorrected are the corrected and uncorrected σab, respectively. Factor k is set as 0.004 (Zhao et al., 2019b) and ATN is the measured light attenuation by particles collected on the filter of AE51. A recommended compensation of 2.6 for AE51 is introduced here to mitigate the multiple scattering problem (Zhang et al., 2018). Zhao et al. (2019b) added AE33 (3 L/min) to measure the bulk EBC simultaneously while measuring the BCPMSD. The bulk EBC from AE33 and the integrated EBC from the BCPMSD measured by AE51 were then compared. Results showed that the variation trends and magnitudes of the EBC measured by AE33 and AE51 were in good agreement. Therefore, the BCPMSD measured by AE51 was regarded as the measurement results of AE33, and the size-resolved σab were retrieved by the constant MAC value of 7.77 m2/g used in AE33. The traditional BCPMSD is retrieved from AE51-measured size-resolved σab with a constant MAC value of 7.77 m2/g used for AE33. In our new method, the MAC varies with BC core size (DBC) and particle diameter (Dparticle).
For scattering correction, a scattering correction factor Cf is required to account for the scattering effect of the filter matrix: . Cf is determined by simultaneous measurement of σab by PASS-3 (σab,PASS-3) and AE33 (σab,AE33). σab,PASS-3 is considered σab,corrected and σab,AE33 is considered σab,uncorrected. The wavelengths of PASS-3 and AE33 are not the same. The measured wavelengths of AE33 (370, 470, 520, 590, 660, 880 and 950 nm) were interpolated to the measured wavelengths of PASS-3 (405, 532 and 781 nm). Specifically, for AE33, absorption coefficients at 405, 532 and 781 nm are calculated at wavelengths pairs of (370, 470 nm), (520, 590 nm) and (660, 880 nm) through the Ångström relationship:
More detailed information can be found in Zhao et al. (2020). Measurement results at Taizhou and Beijing showed that all the ratios of σab measured by AE33 with a measurement flow rate of 3 L/min and PASS-3 with flow rate of 1 L/min at the three wavelengths varied slightly over the East and North China Plain (±0.04) with an average value of 2.9. Therefore, as the measurement results between AE33 and AE51 were consistent, all the size-resolved σab from AE51 adopted in this study were corrected with Cf=2.9.
For the SP2 system, the aerosol samples were analyzed in SP2 (0.12 L/min) to identify the BC-containing particles and in CPC (0.28 L/min) to count the total number of particles. When a BC-containing particle travels through the laser beam (1064 nm) inside the SP2, it emits incandescent light. The avalanche photodetectors (APDs) around the laser beam can detect the incandescence signal. Then the BC-containing particle is detected. NBC can be determined as the ratio of the number of BC-containing particles to that of total aerosol particle. Detailed configuration of the SP2 system has been demonstrated in a previous study (Zhao et al., 2019a). According to the measurements at Taizhou, only 17 % of the ambient particles contained BC averagely for bulk aerosol populations. All the measurement systems at the three sites are shown in Fig. S1 in the Supplement.
For current filter-based instruments, the EBCs are generally derived from σab under the assumption of a constant MAC value. However, the MAC values are enhanced by different degrees when BC particles are mixed with other weakly absorbing materials, leading to large uncertainties on the EBC retrieval. In order to gain more accurate EBCs, it is critical to consider the discrepancies in the MAC caused by variations in the coating process, BC sizes, etc. Among with the core-shell configuration hypothesis, developing the relationship between the MAC, DBC and Tshell is a new approach to correlate the EBC with σab.
3.1 Core-shell geometry of aerosol particles
To evaluate the theoretical discrepancies in the MAC values caused by the corresponding impact factors, a proper model is required to simulate the optical properties of BC-containing particles to a good approximation. Three widely employed mixing states are used to represent the structure of BC-containing aerosols: internal, external and core-shell models (Ma et al., 2011; China et al., 2015). Generally, freshly emitted BC particles are chain-like aggregates of small spheres. During the coating process, the chain-like BC aggregates become more compact as they collapse and are coated as a core by organic and inorganic materials (Bond and Bergstrom, 2006). Therefore, a core-shell configuration is more plausible (Jacobson, 2000). Ma et al. (2012) also indicated that the core-shell assumption can provide a better performance in optical closure than the internal or external models. Furthermore, Moffet et al. (2016) studied particle mixing state and morphology using scanning transmission X-ray microscopy and highlighted that core-shell structure dominated the mixing state of ambient aerosol particles. Aerosols are assumed to be core-shell mixed with a spherical BC core in the center of the coating sphere. Therefore, the Mie model was used to simulate the optical properties of BC particles with a core-shell mixing state. The consistency in observed and theoretical values obtained using Mie and core-shell morphology support the suitability of this method (Cappa et al., 2012).
3.2 Simulation of the MAC for BC-containing particle using Mie theory
Many optical simulations for BC particles with concentric sphere geometry have been reported and the corresponding results show that the absorption of a pure BC particle will be enhanced when a shell composed of nonabsorbing material deposits on this pure BC particle. Since the optical properties were focused on rather than chemical compositions of the mixed aerosols, a simplified hypothesis of BC/sulfate mixtures, which is common in the atmosphere (Khalizov et al., 2009), was introduced in the algorithm for calculating the EBC.
The reason AE33 uses 880 nm to determine the EBC is that aerosol absorption at 880 nm is mainly from BC (Ramachandran and Rajesh, 2007). At shorter wavelength, absorption of organic carbon is no longer negligible, leading to difficulty extracting BC absorption from total aerosol absorption. Therefore, the MAC at 880 nm is discussed in this study and the MAC distribution for a wide range of core and coating sizes at the wavelength of 880 nm is simulated with Mie scattering theory. The RI, dependent on light wavelength, is an important parameter to determine aerosol optical properties. However, due to different sources of BC, both the real and imaginary part of the RI varies over a significantly wide range. Liu et al. (2018) summarized RI values for specific wavelengths and showed that the real part is generally in the range of 1.5 to 2.0 while the imaginary part usually varies from 0.5 to 1.1 (Sorensen, 2001; Bond and Bergstrom, 2006). Therefore, the real part and imaginary part of the RI were set to change from 1.5 to 2.0 and from 0.5 to 1.1, respectively, with a step increase of 0.01. Meanwhile, the RI of sulfate was set as 1.55–10−6i and the density of BC was set as 1.8 g/cm3, similar to Bond et al. (2006). A total of 3111 values were obtained, and the mean values are illustrated in Fig. 1. The DBC and total aerosol particle diameter () ranged from 10 to 700 nm.
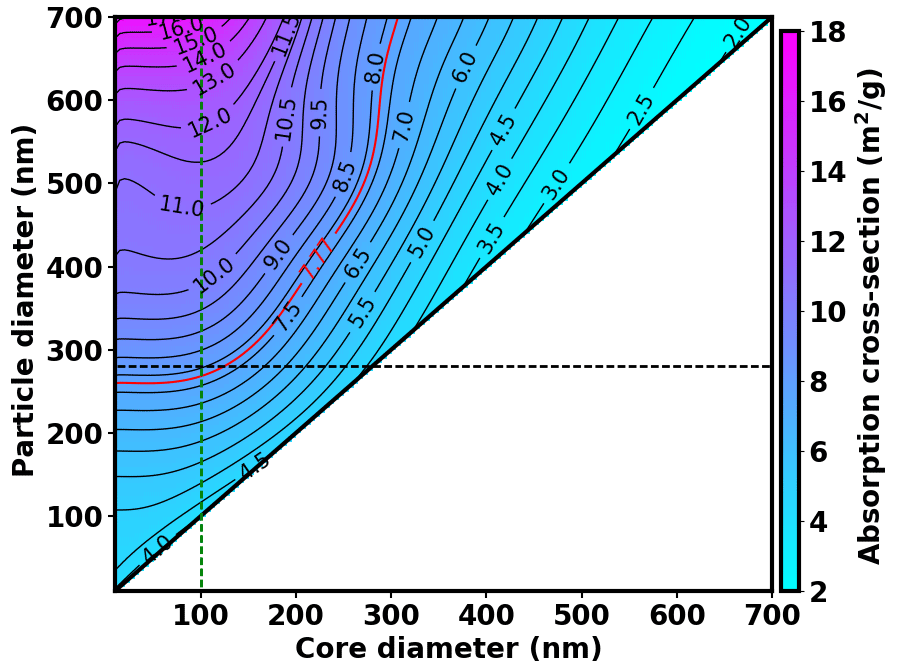
Figure 1Variations in the MAC as a function of DBC and Dparticle calculated using the concentric core-shell Mie model at a wavelength of 880 nm. The red solid line is the constant MAC value used in AE33. The bold black solid line is the 1:1 line that presents the variations in the MAC for pure BC particles with different DBC. The horizontal black dashed line distinguishes particles with a diameter of 280 nm while the vertical green dashed line indicates a DBC of 100 nm.
Figure 1 presents several features of the variation pattern of the MAC at 880 nm. The MAC values varied significantly with DBC and the thickness of the nonabsorbing coating, which indicated that light absorption of BC-containing particles was sensitive to the BC core and the coating. When the DBC was less than 100 nm, the thickness of the coating dominated the variation of the MAC values, and the MAC values increased with increasing Tshell. As the Tshell increased, the lensing effect became more significant, and the light absorption consequently also increased with increasing Tshell. The MAC value can increase from 4 m2/g to about 17 m2/g when the total aerosol size reached up to 700 nm, which indicated that light absorption can be enhanced significantly by the coating. When the DBC was larger than about 100 nm, both Tshell and DBC determined the MAC values and DBC played a more important role considering that the majority of the contour lines tilted to the axis of particle diameter. The MAC increased with increasing Tshell and decreased with increasing DBC. At this range (DBC>100 nm), the coating still enhanced absorption. For pure BC particles, the MAC decreased with increasing DBC when DBC>∼220 nm, which indicated that the absorption of large BC particles was less than that of small BC particles per unit mass. If the Dparticle or the coating (Tshell) was fixed, larger DBC generally corresponded to a smaller MAC. Not only did the MAC of coated BC-containing particles vary significantly, but the variation of the MAC of pure BC particles was also nonnegligible. For smaller pure BC particles, the MAC increased slightly with BC size until DBC reached 220 nm. Then, the MAC decreased with increasing DBC. Therefore, light absorption can be significantly influenced by coating state, and a constant MAC value of 7.77 m2/g used in AE33 is only appropriate for a very limited condition.
3.3 New method to retrieve the EBC by considering the variation of the MAC
In this subsection, a new method is introduced to determine the EBC from the measured σab. At a given ) selected by DMA, if DBC is prescribed, the corresponding Tshell is determined. Combining the simultaneously measured particle number concentration (N(Dparticle)) by CPC downstream from the DMA and the prescribed NBC, the number of BC-containing particles (NBC(Dparticle)) is then determined. σab can then be calculated using the Mie model with Dparticle, DBC and NBC(Dparticle). If the calculated σab matches the measured σab by AE51, then the prescribed DBC is considered the diameter of the BC core at Dparticle. Otherwise, DBC is changed until the calculated σab equals the measured σab. The MAC can be calculated using the Mie model with Dparticle, DBC and a presumed BC density. The EBC at Dparticle is then derived by dividing the measured σab by the MAC. The BCPMSD can then be derived through changing Dparticle selected by DMA.
As the absorption properties of BC particles in different coating states have been evaluated with the Mie model, as shown in Fig. 1, a simplified algorithm was proposed for deriving the BCPMSD through a pre-calculated look-up table. For each Dparticle selected by DMA, if a DBC is assumed, the corresponding MAC of the particle can be derived from the look-up table. Then, the σab can be derived from the MAC, the assumed BC density (1.8 g/cm3 in this study) and NBC (17 % for each Dparticle). We adjusted the guessed DBC until the difference between calculated and measured σab was within an acceptable range (0.1 %). Consequently, the DBC and thus the EBC at Dparticle were determined. The EBCs at different aerosol sizes were derived separately. Finally, the size-resolved EBC and the bulk EBC were obtained. The iterative procedure is illustrated in Fig. 2.
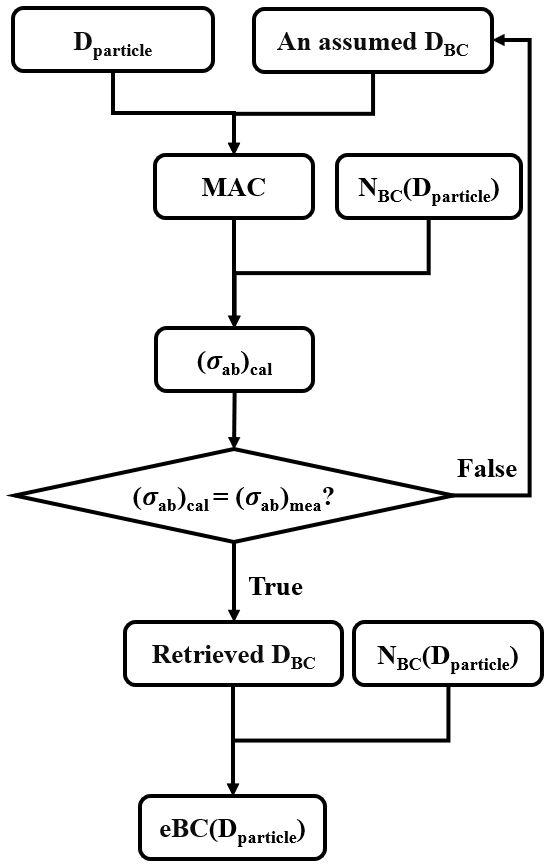
Figure 2Schematic diagram of the iterative algorithm for retrieving the EBC at a fixed particle diameter based on the look-up table of the MAC, particle size and core size. (σab)cal and (σab)mea represent calculated and measured absorption coefficients, respectively. NBC(Dparticle) indicates the number concentration of particles containing BC at the given Dparticle.
It should be pointed out that the retrieval algorithm of the BCPMSD is based on the assumption that BC-containing particles of a fixed diameter are all core-shell mixed and the corresponding DBC for a specific Dparticle is the same. The uncertainties caused by using an idealized core-shell model are discussed in Sect. 5.1. A constant number percentage (17 %) of BC-containing particles was adopted in this study. However, the BC-containing particle fraction varied with the primary source, time, coagulation and extent of atmospheric process. The influence attributed to the constant fraction of BC-containing particles is discussed in Sect. 5.2. Additionally, Bond et al. (2013) summarized the density for different graphitic materials. The density values are 1.8–2.1 g/cm3 for pure graphite, 1.8–1.9 g/cm3 for pressed pellets of BC and 1.718 g/cm3 for fullerene soot. A constant density (1.8 g/cm3) for BC was briefly used to calculate the MAC and BC mass from the volume of particles with a diameter of DBC. Therefore, the uncertainty of the derived EBC in this study simply depends on the ratio of 1.8 g/cm3 and the real density. Finally, the MAC values in the look-up table were the mean values for different RIs and the corresponding effects are discussed in Sect. 5.3.
Figure 3 provides a comprehensive overview of the variations in measured and retrieved size-resolved parameters during the campaign. As evident from Fig. 3a, for the BCPMSD derived by the new method, two modes were found. Figure 4a shows the averaged BCPMSD derived from the new method and AE33 during the campaign. The fine mode was located between 97–240 nm while the coarse mode was located between 240–602 nm. Figure 3b represents the relative deviations between the BCPMSD derived from the newly proposed method and those derived from a constant MAC value of 7.77 m2/g at 880 nm. The results show that there exist two opposite deviation trends before and after the turning point around 280 nm. For aerosol particles larger than 280 nm, the EBCs derived by the new method were mostly lower than those derived with the constant MAC value of 7.77 m2/g at 880 nm. In contrast, when aerosol particles were smaller than 280 nm, the EBCs from the new method were significantly higher than those calculated by the constant MAC, as shown in Fig. 3c. Figure 3c shows the time series of the size-resolved MAC during the derivation process of the BCPMSD. According to Fig. 3c, for aerosol particles smaller than 280 nm, the corresponding MAC was lower than 7.77 m2/g at 880 nm. This is because the MAC values of particles smaller than 280 nm are mostly lower than 7.77 m2/g, as represented in Fig. 1. A smaller MAC implies a weaker absorption ability, which means that the same measured σab will correspond to an increased EBC. Therefore, more EBCs were derived from the new method. For aerosol particles larger than 280 nm, in order to match the measured σab, the corresponding DBC were generally found to be in those regions of the look-up table where the MAC values were larger than 7.77 m2/g at 880 nm (Fig. 3c). Thus, the BC mass loadings for particles larger than 280 nm were found to be less than those calculated with the constant MAC value of 7.77 m2/g at 880 nm. From Fig. 3c, it can be seen that the MAC varied from less than 4 m2/g to larger than 10 m2/g at 880 nm, which implies a large variability of the absorption ability of BC-containing particles. Therefore, if the conversion between the EBC and σab is required, the consideration of variation in mixing state is highly recommended. The simultaneously measured scattering coefficients at 525 nm were introduced here to represent air pollution. As shown in Fig. 3d, the observation station experienced different levels of pollution. Deviations of the EBC derived from the newly proposed method and the constant MAC at different aerosol sizes did not show dependencies on pollution conditions.
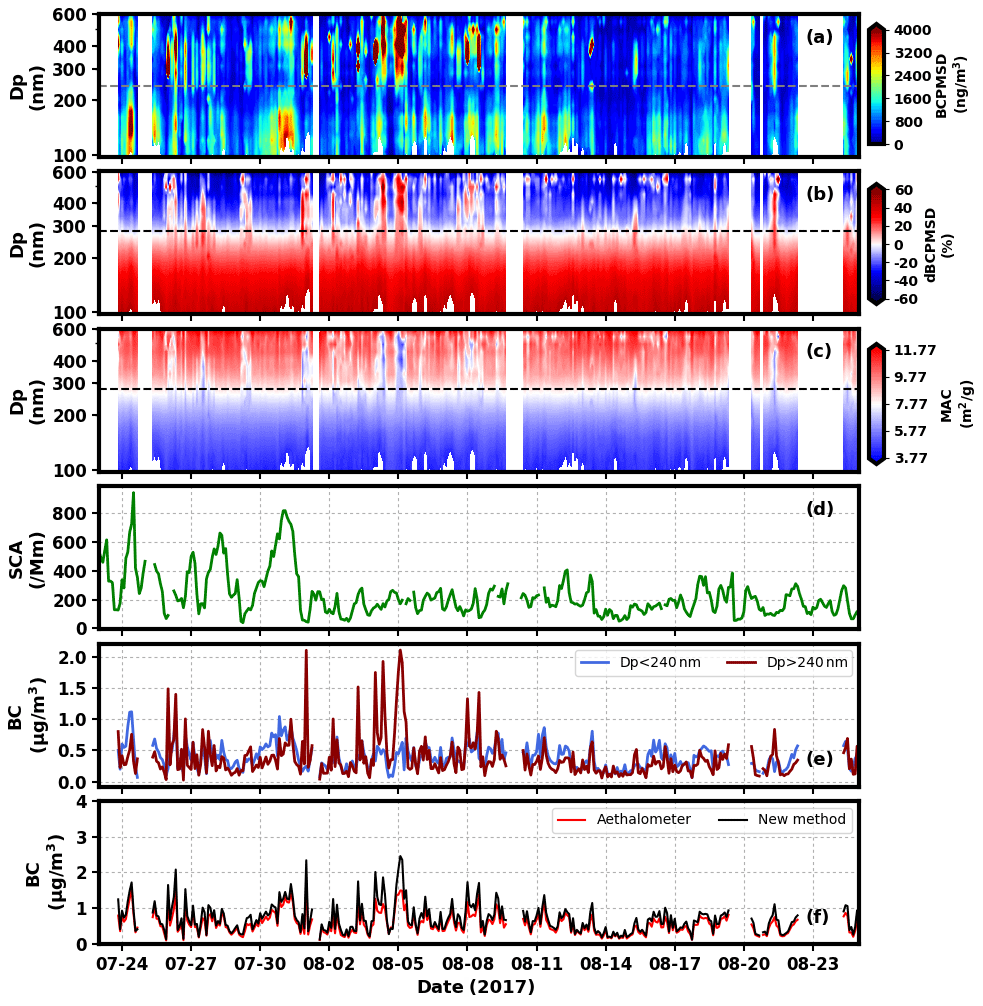
Figure 3Time series of (a) the BCPMSD derived from the new method proposed in this work. The dashed line indicates the particle size of 240 nm. (b) Relative deviations between the BCPMSD derived from the new method (varied MAC) and constant MAC at 7.77 m2/g. The dashed line indicates the particle size of 280 nm. (c) The size-resolved MAC. The dashed line indicates the particle size of 280 nm. (d) The scattering coefficients at 525 nm. (e) The EBC integrated for particles smaller than 220 nm (blue) and larger than 220 nm (red). (f) The EBC determined by the new method (black) and constant MAC of 7.77 m2/g (red).
Figure 3e shows the time series of the EBC in fine and coarse modes. The EBCs were more concentrated in the fine mode than in the coarse mode. The EBCs in fine mode were found to be higher than those in the coarse mode for 73 % of the campaign duration. The variation trends of the bulk EBCs calculated by considering the variations of the MAC and a constant MAC were similar (Fig. 3f). The bulk EBCs calculated by the new method were higher than those derived by the constant MAC in 83 % of the campaign duration.
The EBCs calculated from the new method and AE33 for different aerosol size ranges were statistically analyzed. As shown in Fig. 4, for all EBCs of aerosols ranging between 97–602 and 97–280 nm derived from the new method and AE33, strong linear relationships were observed with correlation coefficients of 0.99 and 1.00, respectively. The ratios between the EBCs derived from AE33 and the new method for aerosol diameter ranges of 97–602 and 97–280 nm were 0.84 and 0.69, respectively, indicating that the EBC obtained from AE33 was 16 % lower for bulk aerosol particles and 31 % lower for aerosols smaller than 280 nm. For the diameter range of 280–602 nm, the MAC values varied significantly and the deviations in the EBC derived from the new method and AE33 were divided into two types with a boundary of 0.7 µg/m3. If the EBC derived from AE33 was lower than 0.7 µg/m3, there was a relatively consistent ratio of 1.13 between the EBC from the new method and AE33, with a correlation coefficient of 0.95. Therefore, BC mass loading from the AE33 algorithm was 13 % higher for aerosol particles larger than 280 nm and an EBC lower than 0.7 µg/m3. However, when the EBC derived from AE33 was larger than 0.7 µg/m3, data points become discrete and the relationship between the EBC derived from AE33 and the new method could be expressed through an equation (). However, these comparisons for aerosols at different size ranges were obtained based on the measurements in the NCP. Additionally, the number of samples where the EBCs of 280–602 nm were larger than 0.7 µg/m3 was too small. Further studies on the BCPMSD in conjunction with the PNSD measurements at different sites need to be carried out.
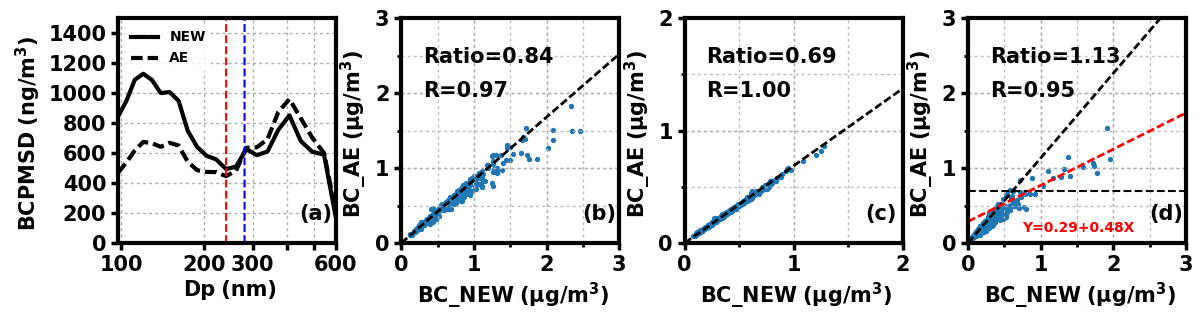
Figure 4Comparison between the EBC derived from the new method and from a constant MAC of 7.77 m2/g used by AE33. Panel (a) shows the results of the BCPMSD. The dashed black line is the result of a constant MAC of 7.77 m2/g used by AE33, and the solid black line represents the results from the new method. The dashed red line is the split line of 240 nm between fine mode and coarse mode, and the dashed blue line is the split line of 280 nm between the opposite tendencies of deviations in the BCPMSD. (b) The bulk EBC integrated from 97 to 602 nm. (c) The fine mode EBC integrated from 97 to 280 nm. (d) The coarse mode EBC integrated from 280 to 606 nm. The dashed black line represents the boundary of 0.7 µg/m3 and the red dashed line is the regression line for the EBC larger than 0.7 µg/m3.
5.1 The uncertainties of the MAC caused by using the idealized core-shell model
An idealized concentric core-shell model with a spherical BC core fully coated by sulfate was configured to study the MAC of BC aerosols and derive the EBC in this study. However, freshly emitted BC particles were found to normally exist in the form of loose cluster-like aggregates with numerous spherical primary monomers (Liu et al., 2015). Soon after, these aggregates become coated with other components and collapse to a more compact form during the coating process (Zhang et al., 2008; Peng et al., 2016). Therefore, the uncertainty in the idealized core-shell configuration is discussed in this subsection.
5.1.1 The formation of BC aggregates with a determined morphology
The fractal aggregates of BC have been well described by fractal geometries through the well-known statistical scaling law (Sorensen, 2001):
where N is the number of “same-sized” monomers in the cluster, a is the monomer radius, and Df and kf are known as the fractal dimension and fractal prefactor, respectively, determining the morphology of the BC cluster. The compactness of a fractal aggregate increases with increasing Df or kf. Rg is the gyration radius, inferring the overall aggregate radius, determined by
where ri represents the distance of the ith monomer from the center of mass of the BC cluster.
In order to generate fractal-like aggregates with given N, Rg, a, Df and kf, the sequential algorithm proposed in Filippov et al. (2000) is introduced in this study to add the primary monomers one by one. On condition that there is an aggregate including N−1 monomers, the Nth monomer is constantly placed randomly until it has at least one contact point with the previously attached N−1 monomers with no overlapping. Besides, the mass center of the next Nth monomer must obey the rule as follows:
where rN−1 and rN are the mass center of the first N−1 monomers and the Nth monomer, respectively. After the fractal configuration of BC aggregates, the absorption properties of BC-containing particles need to be evaluated.
The fractal dimensions for aged BC aggregates are generally close to 3 (Kahnert et al., 2012). The aim of this study is to evaluate the effects of aerosol microphysics on the absorption enhancement of fully coated BC particles, which can be regarded as the aged BC aerosols. Therefore, the fractal dimension Df is set to be 2.8 and kf is generally set to be 1.2. The diameter of the primary monomers is usually between 20–50 nm and the number of primary monomers for an aggregate is between 50–300. The size of the BC core calculated by the new method is smaller than 300 nm most of the time during the Zhangqiu campaign. The diameter of the primary monomers is set to be 50 nm and the number of primary monomers for an aggregate ranges from 2 to 200, leading to the largest size of volume equivalent BC core close to 300 nm. The real part of BC is generally in the range of 1.5 to 2.0, while the imaginary part usually varies from 0.5 to 1.1 (Liu et al., 2018). Therefore, the mean values of 1.75 for the BC real part and 0.8 for the BC imaginary part are adopted here to calculate the MAC values for BC–sulfate mixtures at a wavelength of 880 nm.
5.1.2 Multiple sphere T-matrix (MSTM) method
As the traditional Mie model is not available for the fractal aggregates, the widely used multiple sphere T-matrix (MSTM) method is employed here to quantify the absorption properties of BC clusters (Mackowski and Mishchenko, 1996; Mackowski, 2014). The addition theorem of vector spherical wave functions is used in the MSTM method to describe the mutual interactions among the system. The T-matrix of aggregates used to derive particle optical properties can be obtained from these individual monomers. The MSTM method can calculate light scattering and absorption properties of the randomly oriented aggregates without numerical averaging over particle orientations if the position, size and refractive index of every spherical element are given. However, the MSTM method is only applicable to evaluate the aggregates of spheres without overlapping and it is carried out with high computational demand.
The deviations shown in Fig. 5 are derived by subtracting the MAC values calculated by the MSTM model from those calculated by the Mie model. The results show that most of the MAC values calculated by assuming BC particles in the form of cluster-like aggregates are smaller when the size of BC core is smaller than 150 nm and the overall deviation is within 4 %, which indicates that Mie theory is a good approximation to the BC aggregates even when DBC reaches 200 nm. When the BC core is larger than 200 nm, the MAC values calculated by the MSTM model increase with the thickness of shell and will be larger than those derived from concentric core-shell model. The deviations between the MAC values calculated by the idealized concentric core-shell model and letting BC particles be in the form of cluster-like aggregates are overall within 15 %.
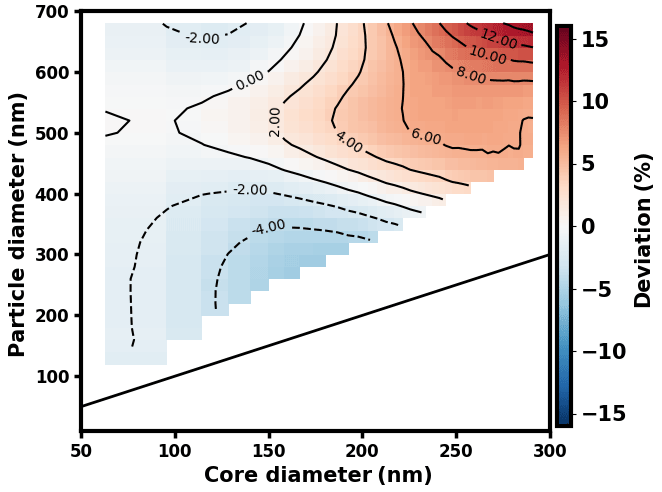
Figure 5Relative deviations of the MAC values calculated by the idealized concentric core-shell model and letting BC particles be in the form of cluster-like aggregates. The solid line is the 1:1 line.
5.2 The uncertainties of the derived EBC caused by using a constant BC-containing particle fraction
Figure 6 shows the deviation of the BCPMSD calculated from different NBC (8.5 %, 17 %, 34 %). For the newly proposed method, using a constant NBC does not change the size-resolved distribution mode. There is still a fine mode and coarse mode with a boundary of 240 nm. Besides, the influence of using different NBC to the derived EBC is very limited when particles are larger than 200 nm. However, the deviations between the EBC derived from different NBC are large when particle diameters are smaller than 200 nm. At this range, if NBC is underestimated, the EBC will be underestimated. On the contrary, the EBC is overestimated if NBC is overestimated.
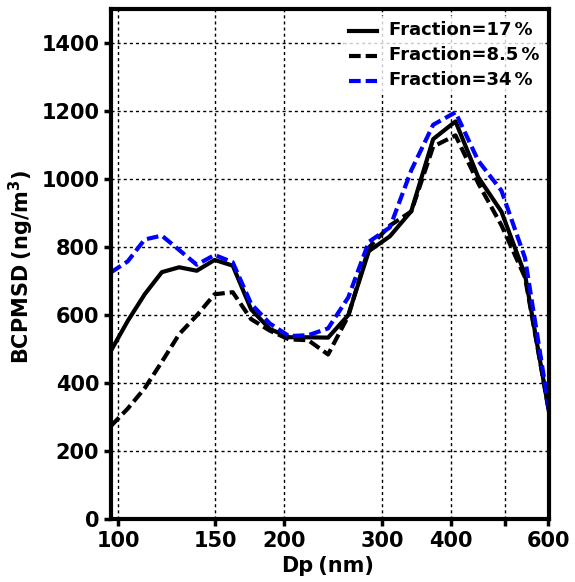
Figure 6The derived BCPMSD by using different constant BC-containing particle fractions. The solid black line represents the result derived from a fraction of 17 %. The dashed black line and blue line show the results derived from fractions of 8.5 % and 34 % , respectively.
5.3 The uncertainties of the MAC caused by variation of the RI
As the RI of BC is still reported to vary over a wide range and the MAC used in this study was a mean value, it is critical to assess the impact caused by variation in the real and imaginary parts of the RI on the calculated MAC and the derived EBC. For aerosol particles with given DBC and Tshell, we calculated the MAC of BC with the real part of the RI ranging from 1.5 to 2.0 and the imaginary part ranging from 0.5 to 1.1. The step increase of both the real and imaginary parts was 0.01 and there were 3111 MAC values for every aerosol particle with given DBC and Tshell. The ratio of the standard deviation to the mean value for these 3111 MAC values have been presented to demonstrate the uncertainty in the MAC due to the uncertainty of BC RI.
Figure 7a shows the uncertainties in the MAC along different values of DBC and Tshell. It shows that aerosol particles with a small BC core have larger uncertainties and all the uncertainties were below 24 %, implying a large variation in absorption for BC-containing particles with a small BC core. When Dparticle was fixed, the uncertainties decreased with increasing DBC. When DBC was determined, the uncertainties did not change much with Tshell, indicating the importance of quantifying DBC for BC-containing particles in order to reduce RI-related uncertainty in absorption. For pure BC particles, the uncertainties also significantly decreased with increasing BC particle size from over 22 % at 100 nm to less than 2 % at 600 nm. Figure 7b shows the uncertainties when the imaginary part was fixed at 0.8 and the real part ranged from 1.5 to 2.0 with an interval of 0.01. It can be seen that when the imaginary part of the RI was fixed, variations in the real part led to slight uncertainties. All the uncertainties were found to be below 14 %. Figure 7c demonstrates the uncertainties when the real part was fixed at 1.75 and the imaginary part ranged from 0.5 to 1.1 with an interval of 0.01. Comparing Fig. 7a and c, we can see that the patterns of the MAC uncertainties were similar. Overall, the uncertainties were dominated by the variations of the imaginary part and only slightly affected by variations in the real part. Therefore, it is highly recommended to reduce the uncertainties in the imaginary part for a more precise absorption measurement.

Figure 7Uncertainty in the MAC of BC when (a) the real part of the RI ranges from 1.5 to 2.0 and the imaginary part ranges from 0.5 to 1.1, (b) the real part of the RI ranges from 1.5 to 2.0 and the imaginary part is fixed at 0.8 and (c) the real part of the RI is fixed at 1.75 and the imaginary part ranges from 0.5 to 1.1. The bold black solid line is the 1:1 line and presents the uncertainty of the MAC for pure BC particles with different RIs.
The variation of the EBC caused by the uncertainties in the RI was further evaluated. As stated in Sect. 3.2, for a MAC (880 nm) point at (Dparticle, DBC) of Fig. 1, it is a mean value averaged with respect to both the real part of the RI varied from 1.5 to 2.0 and the imaginary part of the RI varied from 0.5 to 1.1. The mean MAC (880 nm) plus the corresponding standard deviation (MAC + SD) and minus the corresponding standard deviation (MAC − SD) were used to show the uncertainties in the EBC caused by variation of the BC RI. As we can see from Fig. 8a, irrespective of whether the MAC was MAC + SD or MAC − SD, there was no change in the mode of the BCPMSD. The derived EBC of all particles ranging from 97–602 nm increased when MAC − SD was used and decreased when MAC + SD was used. Compared to the bulk EBC derived by the mean MAC, those derived by MAC − SD were higher within 35 % (Fig. 8b). The decrease in the derived EBC caused by MAC + SD was less than the increase in the derived EBC caused by the MAC − SD. For both fine and coarse mode particles, the deviations in the EBC caused by MAC + SD or MAC − SD were also within 35 % (Fig. 8c and d). This sensitivity study indicates that the accuracy of the derived BCPMSD is sensitive to the accuracy of the MAC, especially when the actual MAC is less than the mean MAC.

Figure 8(a) The BCPMSD calculated by using the look-up table with the mean MAC (black line), the mean MAC plus the corresponding standard deviation (red line) and the mean MAC minus the corresponding standard deviation (blue line). The EBC derived by the look-up table with the mean MAC versus those derived by the look-up table with the mean MAC plus standard deviation (red dots) or the mean MAC minus standard deviation (blue dots) for (b) aerosol particles ranging from 97–602 nm, (c) aerosol particles ranging from 97–240 nm (fine mode) and (d) aerosol particles ranging from 240–602 nm (coarse mode). The dashed black line represents the 35 % deviation from the 1:1 line (dashed gray lines).
There was significant variability in the MAC values of BC with the size of the BC core and the thickness of the coating, which exerted a significant influence on the optical method for deriving the EBC. In this study, a new method was proposed to derive the EBC considering the lensing effect of the core-shell structure and the consequent MAC variations.
A look-up table describing the variations of the MAC at 880 nm attributed to the coating state and size of the BC core was established theoretically using the Mie simulation and assuming a core-shell configuration for BC-containing aerosols. The MAC at 880 nm varied significantly with different sizes of core and shell from less than 2 m2/g to over 16 m2/g, indicating a large variation in absorption ability for BC-containing particles. Then, the EBCs at different aerosol sizes were derived by finding an appropriate BC core configured with a MAC value from the look-up table to close the calculated and measured σab.
This newly proposed method was applied to a campaign measurement on the NCP. There were two modes for the BCPMSD at the accumulation mode separated by 240 nm. For 73 % of the cases, the EBCs of the fine mode were larger than those of the coarse mode during the measurement. The EBCs derived by the new method were mostly lower than those derived by a constant MAC of 7.77 m2/g for particles larger than 280 nm and higher for particles smaller than 280 nm. Similarly, the bulk EBC accumulated from the BCPMSD derived from the new method were mostly higher than those derived from a constant MAC of 7.77 m2/g.
Uncertainty analysis was carried out with respect to assumptions used in this study. The uncertainty caused by the idealized core-shell model was analyzed by substituting the core with cluster-like aggregates using the MSTM method, and the resulting relative uncertainties were within 15 %. The uncertainties caused by using a constant number fraction of BC-containing particles were analyzed by halving and doubling its value, and the results showed that particles larger than 200 nm were insensitive to the number fraction of BC-containing particles, whereas for particles smaller than 200 nm, the EBCs would be underestimated if the BC-containing particle fraction was underestimated. The uncertainty in the derived EBC that was caused due to the wide range of RI of the BC core was also studied. The results indicated that the uncertainty of the imaginary part results in larger uncertainties to the MAC compared with the real part. The relative uncertainty of the derived EBC was within 35 %.
This study provides a new way to derive the EBC from σab for the widely used filter-based measurements. This research deepens our understanding of the uncertainty in measured EBCs caused by the utilization of a constant MAC and illustrates the great necessity to take the variation of the MAC into account. The new method improves the measurements of the BCPMSD and deepens the understanding of the significant influence of mixing state on the absorption of BC.
The code used in this study are available upon request from the authors.
The measurement data involved in this study are available from the authors upon request.
The supplement related to this article is available online at: https://doi.org/10.5194/amt-14-1319-2021-supplement.
CZ determined the main goal of this study. WZ and WT designed the methods. WZ carried them out and prepared the paper with contributions from all coauthors.
The authors declare that they have no conflict of interest.
This research was supported by the National Natural Science Foundation of China (grant no. 41590872).
This paper was edited by Alexander Kokhanovsky and reviewed by three anonymous referees.
Bond, T. C. and Bergstrom, R. W.: Light absorption by carbonaceous particles: An investigative review, Aerosol Sci. Technol., 40, 27–67, https://doi.org/10.1080/02786820500421521, 2006.
Bond, T. C., Habib, G., and Bergstrom, R. W.: Limitations in the enhancement of visible light absorption due to mixing state, J. Geophys. Res.-Atmos., 111, D20211, https://doi.org/10.1029/2006jd007315, 2006.
Bond, T. C., Doherty, S. J., Fahey, D. W., Forster, P. M., Berntsen, T., DeAngelo, B. J., Flanner, M. G., Ghan, S., Karcher, B., Koch, D., Kinne, S., Kondo, Y., Quinn, P. K., Sarofim, M. C., Schultz, M. G., Schulz, M., Venkataraman, C., Zhang, H., Zhang, S., Bellouin, N., Guttikunda, S. K., Hopke, P. K., Jacobson, M. Z., Kaiser, J. W., Klimont, Z., Lohmann, U., Schwarz, J. P., Shindell, D., Storelvmo, T., Warren, S. G., and Zender, C. S.: Bounding the role of black carbon in the climate system: A scientific assessment, J. Geophys. Res.-Atmos., 118, 5380–5552, https://doi.org/10.1002/jgrd.50171, 2013.
Cappa, C. D., Onasch, T. B., Massoli, P., Worsnop, D. R., Bates, T. S., Cross, E. S., Davidovits, P., Hakala, J., Hayden, K. L., Jobson, B. T., Kolesar, K. R., Lack, D. A., Lerner, B. M., Li, S. M., Mellon, D., Nuaaman, I., Olfert, J. S., Petaja, T., Quinn, P. K., Song, C., Subramanian, R., Williams, E. J., and Zaveri, R. A.: Radiative Absorption Enhancements Due to the Mixing State of Atmospheric Black Carbon, Science, 337, 1078–1081, https://doi.org/10.1126/science.1223447, 2012.
Cappa, C. D., Zhang, X. L., Russell, L. M., Collier, S., Lee, A. K. Y., Chen, C. L., Betha, R., Chen, S. J., Liu, J., Price, D. J., Sanchez, K. J., McMeeking, G. R., Williams, L. R., Onasch, T. B., Worsnop, D. R., Abbatt, J., and Zhang, Q.: Light absorption by ambient black and brown carbon and its dependence on black carbon coating state for two California, USA, cities in winter and summer, J. Geophys. Res.-Atmos., 124, 1550–1577, https://doi.org/10.1029/2018jd029501, 2019.
Castagna, J., Calvello, M., Esposito, F., and Pavese, G.: Analysis of equivalent black carbon multi-year data at an oil pre-treatment plant: Integration with satellite data to identify black carbon transboundary sources, Remote Sens. Environ., 235, 111429, https://doi.org/10.1016/j.rse.2019.111429, 2019.
China, S., Scarnato, B., Owen, R. C., Zhang, B., Ampadu, M. T., Kumar, S., Dzepina, K., Dziobak, M. P., Fialho, P., Perlinger, J. A., Hueber, J., Helmig, D., Mazzoleni, L. R., and Mazzoleni, C.: Morphology and mixing state of aged soot particles at a remote marine free troposphere site: Implications for optical properties, Geophys. Res. Lett., 42, 1243–1250, https://doi.org/10.1002/2014gl062404, 2015.
Filippov, A. V., Zurita, M., and Rosner, D. E.: Fractal-like aggregates: Relation between morphology and physical properties, J. Colloid Interface Sci., 229, 261–273, https://doi.org/10.1006/jcis.2000.7027, 2000.
Fuller, K. A., Malm, W. C., and Kreidenweis, S. M.: Effects of mixing on extinction by carbonaceous particles, J. Geophys. Res.-Atmos., 104, 15941–15954, https://doi.org/10.1029/1998jd100069, 1999.
Hansen, A. D. A., Rosen, H., and Novakov, T.: The aethalometer - an instrument for the real-time measurement of optical-absorption by aerosol-particles, Sci. Total Environ., 36, 191–196, https://doi.org/10.1016/0048-9697(84)90265-1, 1984.
Helin, A., Niemi, J. V., Virkkula, A., Pirjola, L., Teinila, K., Backman, J., Aurela, M., Saarikoski, S., Ronkko, T., Asmi, E., and Timonen, H.: Characteristics and source apportionment of black carbon in the Helsinki metropolitan area, Finland, Atmos. Environ., 190, 87–98, https://doi.org/10.1016/j.atmosenv.2018.07.022, 2018.
Highwood, E. J. and Kinnersley, R. P.: When smoke gets in our eyes: The multiple impacts of atmospheric black carbon on climate, air quality and health, Environ. Int., 32, 560–566, https://doi.org/10.1016/j.envint.2005.12.003, 2006.
Jacobson, M. Z.: A physically-based treatment of elemental carbon optics: Implications for global direct forcing of aerosols, Geophys. Res. Lett., 27, 217–220, https://doi.org/10.1029/1999gl010968, 2000.
Kahnert, M., Nousiainen, T., Lindqvist, H., and Ebert, M.: Optical properties of light absorbing carbon aggregates mixed with sulfate: assessment of different model geometries for climate forcing calculations, Opt. Exp., 20, 10042–10058, https://doi.org/10.1364/oe.20.010042, 2012.
Khalizov, A. F., Xue, H. X., Wang, L., Zheng, J., and Zhang, R. Y.: Enhanced light absorption and scattering by carbon soot aerosol internally mixed with sulfuric acid, J. Phys. Chem. A, 113, 1066–1074, https://doi.org/10.1021/jp807531n, 2009.
Lack, D. A. and Cappa, C. D.: Impact of brown and clear carbon on light absorption enhancement, single scatter albedo and absorption wavelength dependence of black carbon, Atmos. Chem. Phys., 10, 4207–4220, https://doi.org/10.5194/acp-10-4207-2010, 2010.
Lack, D. A., Langridge, J. M., Bahreini, R., Cappa, C. D., Middlebrook, A. M., and Schwarz, J. P.: Brown carbon and internal mixing in biomass burning particles, P. Natl. Acad. Sci. USA, 109, 14802–14807, https://doi.org/10.1073/pnas.1206575109, 2012.
Li, Z., Tan, H., Zheng, J., Liu, L., Qin, Y., Wang, N., Li, F., Li, Y., Cai, M., Ma, Y., and Chan, C. K.: Light absorption properties and potential sources of particulate brown carbon in the Pearl River Delta region of China, Atmos. Chem. Phys., 19, 11669–11685, https://doi.org/10.5194/acp-19-11669-2019, 2019.
Liu, C., Yin, Y., Hu, F. C., Jin, H. C., and Sorensen, C. M.: The effects of monomer size distribution on the radiative properties of black carbon aggregates, Aerosol Sci. Technol., 49, 928–940, https://doi.org/10.1080/02786826.2015.1085953, 2015.
Liu, C., Chung, C. E., Yin, Y., and Schnaiter, M.: The absorption Ångström exponent of black carbon: from numerical aspects, Atmos. Chem. Phys., 18, 6259–6273, https://doi.org/10.5194/acp-18-6259-2018, 2018.
Liu, H., Pan, X., Wu, Y., Wang, D., Tian, Y., Liu, X., Lei, L., Sun, Y., Fu, P., and Wang, Z.: Effective densities of soot particles and their relationships with the mixing state at an urban site in the Beijing megacity in the winter of 2018, Atmos. Chem. Phys., 19, 14791–14804, https://doi.org/10.5194/acp-19-14791-2019, 2019.
Ma, N., Zhao, C. S., Nowak, A., Müller, T., Pfeifer, S., Cheng, Y. F., Deng, Z. Z., Liu, P. F., Xu, W. Y., Ran, L., Yan, P., Göbel, T., Hallbauer, E., Mildenberger, K., Henning, S., Yu, J., Chen, L. L., Zhou, X. J., Stratmann, F., and Wiedensohler, A.: Aerosol optical properties in the North China Plain during HaChi campaign: an in-situ optical closure study, Atmos. Chem. Phys., 11, 5959–5973, https://doi.org/10.5194/acp-11-5959-2011, 2011.
Ma, N., Zhao, C. S., Müller, T., Cheng, Y. F., Liu, P. F., Deng, Z. Z., Xu, W. Y., Ran, L., Nekat, B., van Pinxteren, D., Gnauk, T., Müller, K., Herrmann, H., Yan, P., Zhou, X. J., and Wiedensohler, A.: A new method to determine the mixing state of light absorbing carbonaceous using the measured aerosol optical properties and number size distributions, Atmos. Chem. Phys., 12, 2381–2397, https://doi.org/10.5194/acp-12-2381-2012, 2012.
Mackowski, D. W.: A general superposition solution for electromagnetic scattering by multiple spherical domains of optically active media, J. Quant.e Spectrosc. Ra., 133, 264–270, https://doi.org/10.1016/j.jqsrt.2013.08.012, 2014.
Mackowski, D. W. and Mishchenko, M. I.: Calculation of the T matrix and the scattering matrix for ensembles of spheres, J. Opt. Soc. Am. A-Opt. Image Sci. Vis., 13, 2266–2278, https://doi.org/10.1364/josaa.13.002266, 1996.
Majdi, M., Kim, Y., Turquety, S., and Sartelet, K.: Impact of mixing state on aerosol optical properties during severe wildfires over the Euro-Mediterranean region, Atmos. Environ., 220, 117042, https://doi.org/10.1016/j.atmosenv.2019.117042, 2020.
Moffet, R. C., O'Brien, R. E., Alpert, P. A., Kelly, S. T., Pham, D. Q., Gilles, M. K., Knopf, D. A., and Laskin, A.: Morphology and mixing of black carbon particles collected in central California during the CARES field study, Atmos. Chem. Phys., 16, 14515–14525, https://doi.org/10.5194/acp-16-14515-2016, 2016.
Moosmuller, H., Chakrabarty, R. K., and Arnott, W. P.: Aerosol light absorption and its measurement: A review, J. Quant. Spectrosc. Ra., 110, 844–878, https://doi.org/10.1016/j.jqsrt.2009.02.035, 2009.
Ning, Z., Chan, K. L., Wong, K. C., Westerdahl, D., Mocnik, G., Zhou, J. H., and Cheung, C. S.: Black carbon mass size distributions of diesel exhaust and urban aerosols measured using differential mobility analyzer in tandem with Aethalometer, Atmos. Environ., 80, 31–40, https://doi.org/10.1016/j.atmosenv.2013.07.037, 2013.
Onasch, T. B., Trimborn, A., Fortner, E. C., Jayne, J. T., Kok, G. L., Williams, L. R., Davidovits, P., and Worsnop, D. R.: Soot Particle Aerosol Mass Spectrometer: Development, Validation, and Initial Application, Aerosol Sci. Technol., 46, 804–817, https://doi.org/10.1080/02786826.2012.663948, 2012.
Peng, J. F., Hu, M., Guo, S., Du, Z. F., Zheng, J., Shang, D. J., Zamora, M. L., Zeng, L. M., Shao, M., Wu, Y. S., Zheng, J., Wang, Y., Glen, C. R., Collins, D. R., Molina, M. J., and Zhang, R. Y.: Markedly enhanced absorption and direct radiative forcing of black carbon under polluted urban environments, P. Natl. Acad. Sci. USA, 113, 4266–4271, https://doi.org/10.1073/pnas.1602310113, 2016.
Petzold, A., Ogren, J. A., Fiebig, M., Laj, P., Li, S.-M., Baltensperger, U., Holzer-Popp, T., Kinne, S., Pappalardo, G., Sugimoto, N., Wehrli, C., Wiedensohler, A., and Zhang, X.-Y.: Recommendations for reporting “black carbon” measurements, Atmos. Chem. Phys., 13, 8365–8379, https://doi.org/10.5194/acp-13-8365-2013, 2013.
Ramachandran, S. and Rajesh, T. A.: Black carbon aerosol mass concentrations over Ahmedabad, an urban location in western India: Comparison with urban sites in Asia, Europe, Canada, and the United States, J. Geophys. Res.-Atmos., 112, D06211, https://doi.org/10.1029/2006jd007488, 2007.
Ramanathan, V. and Carmichael, G.: Global and regional climate changes due to black carbon, Nat. Geosci., 1, 221–227, https://doi.org/10.1038/ngeo156, 2008.
Ran, L., Deng, Z. Z., Wang, P. C., and Xia, X. A.: Black carbon and wavelength-dependent aerosol absorption in the North China Plain based on two-year aethalometer measurements, Atmos. Environ., 142, 132–144, https://doi.org/10.1016/j.atmosenv.2016.07.014, 2016a.
Ran, L., Deng, Z., Xu, X., Yan, P., Lin, W., Wang, Y., Tian, P., Wang, P., Pan, W., and Lu, D.: Vertical profiles of black carbon measured by a micro-aethalometer in summer in the North China Plain, Atmos. Chem. Phys., 16, 10441–10454, https://doi.org/10.5194/acp-16-10441-2016, 2016b.
Sandradewi, J., Prevot, A. S. H., Szidat, S., Perron, N., Alfarra, M. R., Lanz, V. A., Weingartner, E., and Baltensperger, U.: Using aerosol light absorption measurements for the quantitative determination of wood burning and traffic emission contributions to particulate matter, Environ. Sci. Technol., 42, 3316–3323, https://doi.org/10.1021/es702253m, 2008.
Schwarz, J. P., Gao, R. S., Fahey, D. W., Thomson, D. S., Watts, L. A., Wilson, J. C., Reeves, J. M., Darbeheshti, M., Baumgardner, D. G., Kok, G. L., Chung, S. H., Schulz, M., Hendricks, J., Lauer, A., Karcher, B., Slowik, J. G., Rosenlof, K. H., Thompson, T. L., Langford, A. O., Loewenstein, M., and Aikin, K. C.: Single-particle measurements of midlatitude black carbon and light-scattering aerosols from the boundary layer to the lower stratosphere, J. Geophys. Res.-Atmos., 111, D16207, https://doi.org/10.1029/2006jd007076, 2006.
Schwarz, J. P., Spackman, J. R., Fahey, D. W., Gao, R. S., Lohmann, U., Stier, P., Watts, L. A., Thomson, D. S., Lack, D. A., Pfister, L., Mahoney, M. J., Baumgardner, D., Wilson, J. C., and Reeves, J. M.: Coatings and their enhancement of black carbon light absorption in the tropical atmosphere, J. Geophys. Res.-Atmos., 113, D03203, https://doi.org/10.1029/2007jd009042, 2008.
Sharma, S., Brook, J. R., Cachier, H., Chow, J., Gaudenzi, A., and Lu, G.: Light absorption and thermal measurements of black carbon in different regions of Canada, J. Geophys. Res.-Atmos., 107, AAC11, https://doi.org/10.1029/2002jd002496, 2002.
Shiraiwa, M., Kondo, Y., Moteki, N., Takegawa, N., Miyazaki, Y., and Blake, D. R.: Evolution of mixing state of black carbon in polluted air from Tokyo, Geophys. Res. Lett., 34, L16803, https://doi.org/10.1029/2007gl029819, 2007.
Sorensen, C. M.: Light scattering by fractal aggregates: A review, Aerosol Sci. Technol., 35, 648–687, https://doi.org/10.1080/027868201316900007, 2001.
Wu, C., Ng, W. M., Huang, J. X., Wu, D., and Yu, J. Z.: Determination of Elemental and Organic Carbon in PM2.5 in the Pearl River Delta Region: Inter-Instrument (Sunset vs. DRI Model 2001 Thermal/Optical Carbon Analyzer) and Inter-Protocol Comparisons (IMPROVE vs. ACE-Asia Protocol), Aerosol Sci. Technol., 46, 610–621, https://doi.org/10.1080/02786826.2011.649313, 2012.
Zhang, R. Y., Khalizov, A. F., Pagels, J., Zhang, D., Xue, H. X., and McMurry, P. H.: Variability in morphology, hygroscopicity, and optical properties of soot aerosols during atmospheric processing, P. Natl. Acad. Sci. USA, 105, 10291–10296, https://doi.org/10.1073/pnas.0804860105, 2008.
Zhang, Y., Zhang, Q., Cheng, Y., Su, H., Li, H., Li, M., Zhang, X., Ding, A., and He, K.: Amplification of light absorption of black carbon associated with air pollution, Atmos. Chem. Phys., 18, 9879–9896, https://doi.org/10.5194/acp-18-9879-2018, 2018.
Zhao, G., Tan, T., Zhao, W., Guo, S., Tian, P., and Zhao, C.: A new parameterization scheme for the real part of the ambient urban aerosol refractive index, Atmos. Chem. Phys., 19, 12875–12885, https://doi.org/10.5194/acp-19-12875-2019, 2019a.
Zhao, G., Tao, J., Kuang, Y., Shen, C., Yu, Y., and Zhao, C.: Role of black carbon mass size distribution in the direct aerosol radiative forcing, Atmos. Chem. Phys., 19, 13175–13188, https://doi.org/10.5194/acp-19-13175-2019, 2019b.
Zhao, G., Yu, Y., Tian, P., Li, J., Guo, S., and Zhao, C.: Evaluation and Correction of the Ambient Particle Spectral Light Absorption Measured Using a Filter-based Aethalometer, Aerosol Air Qual. Res., 20, 1833–1841, https://doi.org/10.4209/aaqr.2019.10.0500, 2020.