the Creative Commons Attribution 4.0 License.
the Creative Commons Attribution 4.0 License.
 | 24 Feb 2021
A new measurement approach for validating satellite-based above-cloud aerosol optical depth
Charles K. Gatebe
Hiren Jethva
Ritesh Gautam
Rajesh Poudyal
Tamás Várnai
The retrieval of aerosol parameters from passive satellite instruments in cloudy scenes is challenging, partly because clouds and cloud-related processes may significantly modify aerosol optical depth (AOD) and particle size, a problem that is further compounded by 3D radiative processes. Recent advances in retrieval algorithms such as the “color ratio” method, which utilizes the measurements at a shorter (470 nm) and a longer (860 nm) wavelength, have demonstrated the simultaneous derivation of AOD and cloud optical depth (COD) for scenes in which absorbing aerosols are found to overlay low-level cloud decks. This study shows simultaneous retrievals of above-cloud aerosol optical depth (ACAOD) and aerosol-corrected cloud optical depth (COD) from airborne measurements of cloud-reflected and sky radiances using the color ratio method. These airborne measurements were taken over marine stratocumulus clouds with NASA's Cloud Absorption Radiometer (CAR) during the SAFARI 2000 field campaign offshore of Namibia. The ACAOD is partitioned between the AOD below-aircraft (AOD_cloudtop) and above-aircraft AOD (AOD_sky). The results show good agreement between AOD_sky and sun-photometer measurements of the above-aircraft AOD. The results also show that the use of aircraft-based sun-photometer measurements to validate satellite retrievals of the ACAOD is complicated by the lack of information on AOD below aircraft. Specifically, the CAR-retrieved AOD_cloudtop captures this “missing” aerosol layer caught between the aircraft and cloud top, which is required to quantify above-cloud aerosol loading and effectively validate satellite retrievals. In addition, the study finds a strong anticorrelation between the AOD_cloudtop and COD for cases in which COD < 10 and a weaker anticorrelation for COD > 10, which may be associated with the uncertainties in the color ratio method at lower AODs and CODs. The influence of 3D radiative effects on the retrievals is examined, and the results show that at cloud troughs, 3D effects increase retrieved ACAOD by about 3 %–11 % and retrieved COD by about 25 %. The results show that the color ratio method has little sensitivity to 3D effects at overcast stratocumulus cloud decks. These results demonstrate a novel airborne measurement approach for assessing satellite retrievals of aerosols above clouds, thereby filling a major gap in global aerosol observations.
- Article
(16098 KB) - Full-text XML
- BibTeX
- EndNote


The uncertainties of atmospheric aerosol measurements in the vicinity of clouds have implications for the direct shortwave radiative aerosol effect and forcing on the climate system. Also, aerosols are known to exert an indirect forcing on climate by altering cloud properties and precipitation. According to the last Assessment Report of the Intergovernmental Panel on Climate Change (Boucher et al., 2013), the interactions between clouds and aerosols remain among the largest sources of uncertainty, pointing to a lack of good understanding of the aerosol–cloud system and holding back progress in the enhancement of Earth system predictions and projections.
Space-based retrievals of aerosol optical properties in the vicinity of clouds are complex because of the difficulty of distinguishing the contributions from aerosols and clouds in top-of-atmosphere (TOA) reflectance measurements. However, in the last 2 decades, several studies have demonstrated new approaches for aerosol retrievals in the vicinity of clouds. Absorbing aerosols such as smoke plumes, desert dust, and volcanic ash have been monitored from satellite observations in the presence of clouds using the ultraviolet measurements of the Total Ozone Mapping Spectrometer (TOMS) on Nimbus 7 (Herman et al., 1997; Torres et al., 1998), the Ozone Monitoring Instrument (OMI) on Aura (Torres et al., 2012), and the Scanning Imaging Absorption Spectrometer for Atmospheric Chartography (SCIAMACHY) (De Graaf et al., 2007). The near-UV retrieval approach was extended to the visible and near-infrared spectral regions for simultaneous derivation of aerosol optical depth (AOD) and cloud optical depth (COD) based on Moderate Resolution Imaging Spectroradiometer (MODIS) measurements in regions where light-absorbing carbonaceous and dust aerosols overlay low-level clouds (see Jethva et al., 2013; Sayer et al., 2016). Similarly, Waquet et al. (2009) developed a method based on multiangle polarization measurements at visible and near-infrared wavelengths to retrieve aerosol properties over clouds and successfully applied it to measurements of the Polarization and Directionality of Earth Reflectances (POLDER)–Polarization and Anisotropy of Reflectances for Atmospheric Sciences Coupled with Observations from a Lidar (PARASOL) instrument. These advancements have provided hope for realizing global-scale monitoring of aerosol properties over clouds, thereby filling a major gap in global aerosol observations, but significant challenges remain in the validation of the above-cloud aerosol products (Shinozuka et al., 2020; Redemann et al., 2020). There is no question that above-cloud aerosol retrievals need to be validated with airborne measurements.
This study demonstrates the applicability of the color ratio method (Jethva et al., 2013, 2016), which utilizes measurements at a shorter (470 nm) and a longer (860 nm) wavelength for the simultaneous derivation of AOD and COD, to airborne observations. The study uses airborne data taken over marine stratocumulus clouds by NASA's Cloud Absorption Radiometer (CAR) during the SAFARI 2000 field campaign offshore of Namibia. The CAR instrument provides unique views of the cloud–aerosol system from far away, from close up, from inside clouds, and from all the viewing directions (see King et al., 1986; Gatebe et al., 2012; Gautam et al., 2016; Varnai et al., 2019; Gatebe and King, 2016; Melnikova and Gatebe, 2018). The area selected has a unique and reliable juxtaposition of regional and temporal patterns of meteorological conditions that are conducive to persistent low-level clouds as seen from satellite imagery over the southeastern Atlantic region (see Fig. 1), a region known to be impacted by optically thick smoke from intense biomass burning activities (agriculture crop residue burning in central and southern Africa) (Das et al., 2020). The primary objective of this study is to retrieve aerosol optical depth above clouds using a novel airborne measurement approach of simultaneously measuring scattered radiation above and below the aircraft, thereby demonstrating an effective observational tool to validate satellite-based aerosol retrievals above clouds.
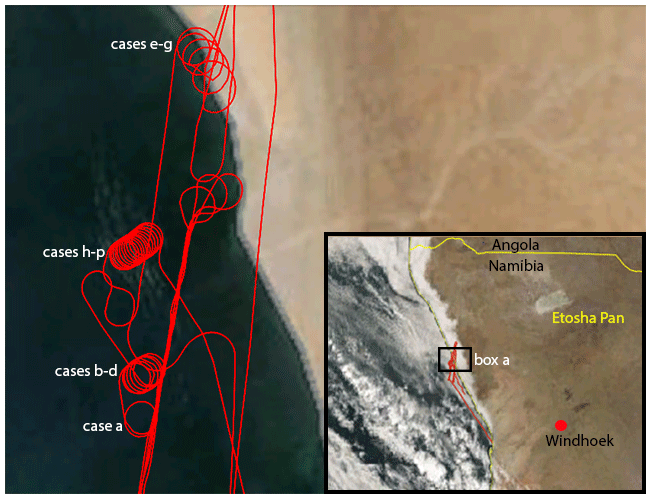
Figure 1Location of the measurements. On 13 September 2000, NASA's Cloud Absorption Radiometer (CAR) on board the University of Washington Convair-580 research aircraft obtained measurements over marine stratocumulus offshore of Namibia at several locations marked by the aircraft ground track on the inset map. The aircraft completed multiple circular flight tracks (> 16) at different locations, shown on the enlarged map of the rectangular box area and labeled alphabetically as a–p based on the time of observations (see Table 1). The circular flight tracks were performed primarily for the airborne measurements of bidirectional reflectance distribution function (BRDF) (cases a–d and h–p) and in a few instances (cases e–g) represent vertical profiles for physical and chemical measurements. The marine stratus clouds were extensive, as seen by the MODIS Terra instrument on the same day at around 09:25 UTC (see the map inset). The CV-580 flight began just prior to 10:00 UTC and ended at 13:00 UTC. The enlarged map is derived from a GWELD-generated browse image (Roy and Zhang 2019).
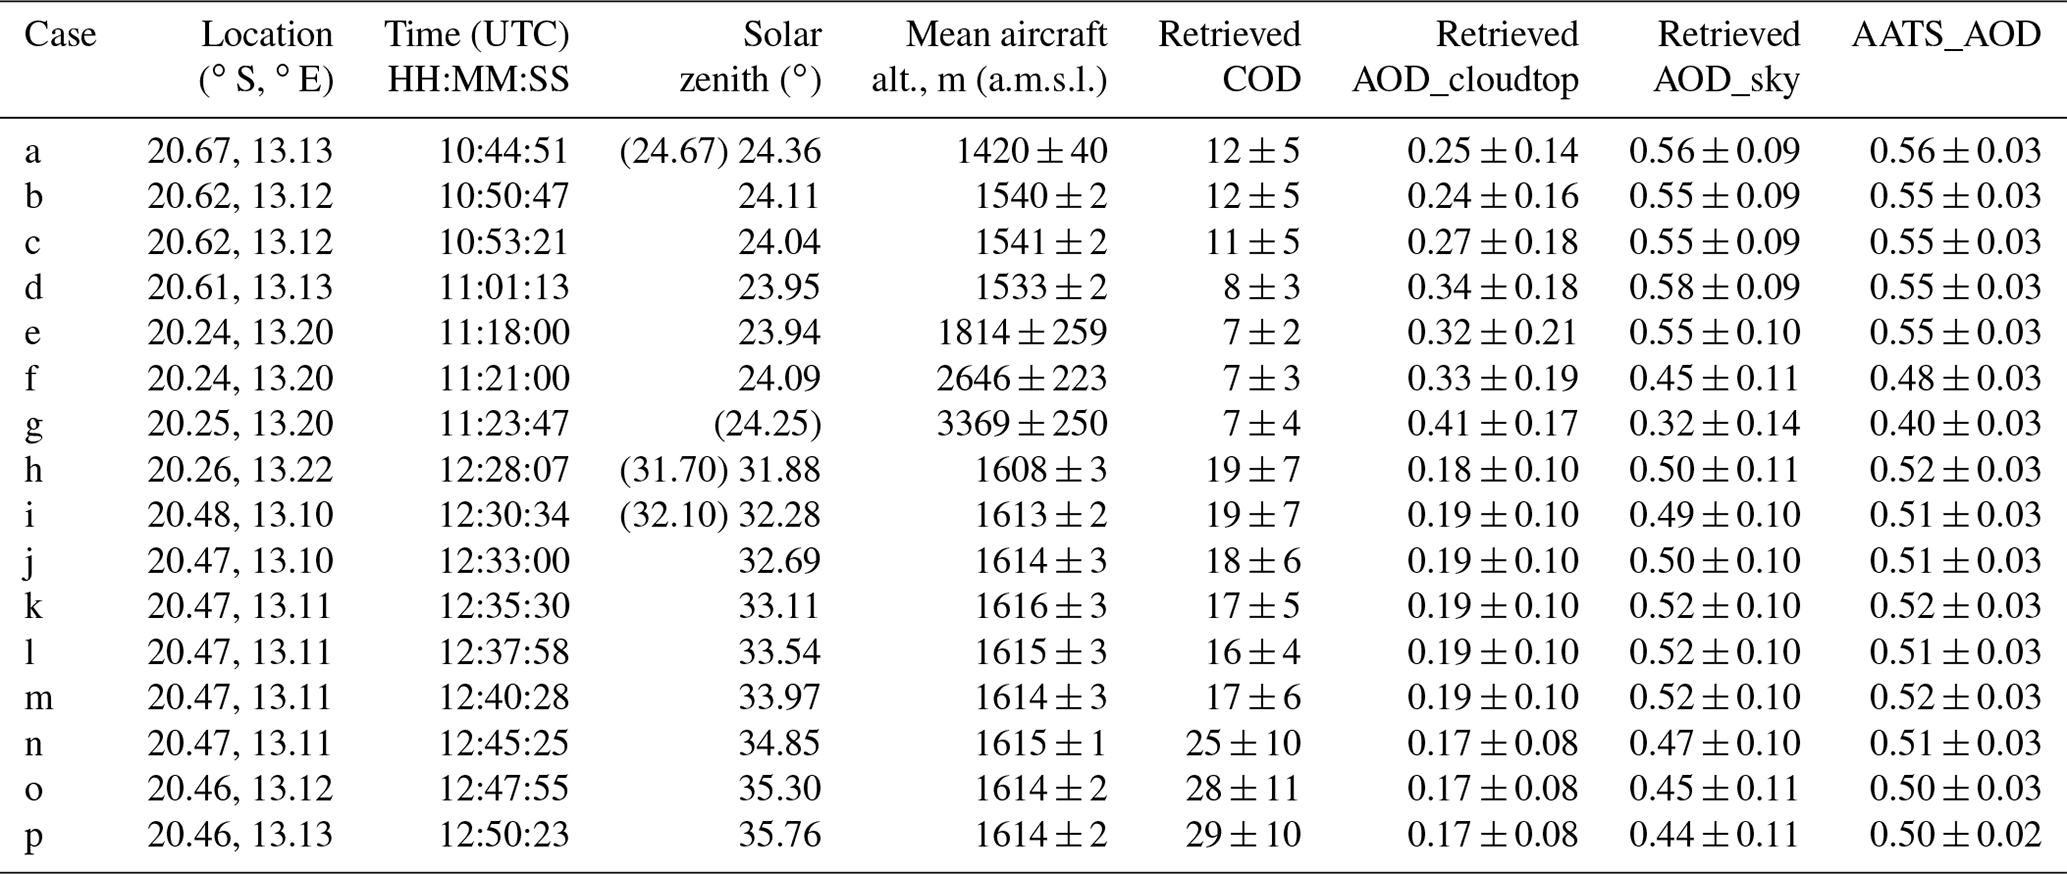
The southeast Atlantic is widely used to study aerosol direct and indirect radiative effects because of the presence of stratiform marine clouds over the ocean and the annual recurrence of very high concentrations of biomass burning aerosols between June and September (see Das et al., 2020; De Graaf et al., 2007, 2012; Keil and Haywood, 2003; Meyer et al., 2013; Sayer et al., 2016; Pistone et al., 2019; LeBlanc et al., 2020). The measurements analyzed here were taken aboard the University of Washington's Convair-580 research aircraft. During several portions of the flight analyzed here, the aircraft followed a circular flight track (Fig. 1) at a nearly constant distance from the cloud top (∼ 650 m) occurring below ∼ 1 km of altitude (Gatebe et al., 2003; Sinha et al., 2003). The image acquired by MODIS Terra on the same day at about 09:25 UTC (see Fig. 1, inset map) shows widespread clouds over the entire Namibian coast. There were reports during the Southern African Regional Science Initiative (SAFARI 2000) dry season campaign (Swap et al., 2002) that optically thick smoke that originated from intense biomass burning activities was advected over to the marine stratiform clouds off the Namibian coast. The CV-580 flight began just prior to 10:00 UTC and ended at about 13:00 UTC. Table 1 summarizes the times and locations of the cases analyzed, which are labeled alphabetically as a–p based on the time of observations.
Table 1Retrieved parameters from a total of 16 CAR bidirectional reflectance–distribution function (BRDF) cases taken on 13 September 2000 during the SAFARI 2000 campaign. AOD values are derived at λ = 0.500 µm.
2.1 Aircraft and sensors
The CAR instrument flew aboard the UW CV-580 research aircraft (Fig. 2a) and obtained the bidirectional reflectance distribution function (BRDF) over an extensive and persistent stratocumulus cloud deck with an overlaying smoke aerosol layer. The aircraft was also equipped with other instruments to measure gases, aerosols, and radiation (see Appendix A by Peter V. Hobbs in the work of Sinha et al., 2003). Figure 2b shows a cutaway drawing of CAR. The instrument is approximately 72 cm long, 41 cm wide, and 39 cm deep; it weighs 42 kg. CAR was designed primarily to image the sky and surface at an instantaneous field of view (IFOV) of 1∘ through a 190∘ plane as shown in Fig. 2c. CAR measures both transmitted and reflected radiances at 14 narrow spectral bands located in the ultraviolet, visible, and near-infrared spectrum (0.340–2.303 µm; Fig. 2d). This combination provides a convenient and efficient means of obtaining complete BRDFs for any surface type at a landscape level and ensures that surface albedo, which is an angular-weighted integration of the reflection function over a hemisphere, can be derived from these measurements covering the required angular range (Nicodemus et al., 1977; Kimes et al., 1987).
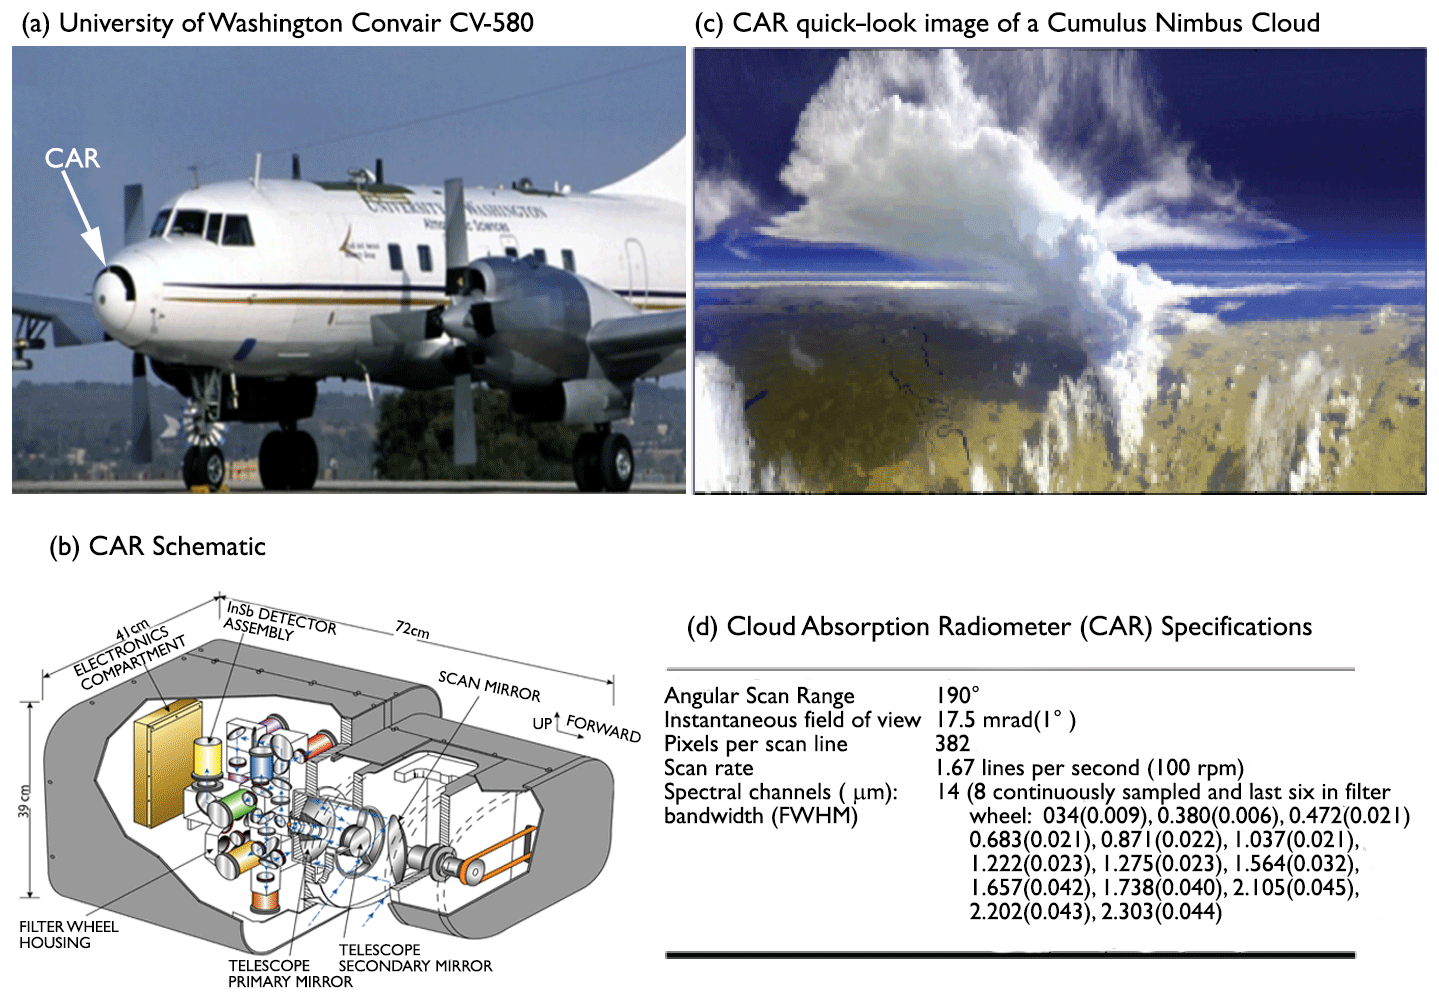
Figure 2(a) The University of Washington's Convair-580 research aircraft in Pietersburg, South Africa, for SAFARI 2000. (b) Schematic of NASA's Cloud Absorption Radiometer (CAR), which was mounted in the nose of the CV-580 aircraft. (c) A cumulonimbus cloud observed with CAR during flight no. 2034 on 14 September 2011 at 18:35–18:40 UTC in Florida to illustrate the kind of images acquired by CAR. (d) Specifications for the CAR, which contains 14 narrow spectral bands between 0.34 and 2.30 µm.
During the BRDF measurements over the marine stratiform clouds, the instrument obtained unique views of the cloud–aerosol system, scanning from zenith to the horizon and then from the horizon to nadir, covering the entire 360∘ range of azimuthal directions as the aircraft flew in a circular flight track (see Gatebe et al., 2003; Fig. 3). The quick-look red–green–blue (RGB) image in Fig. 3 (R = 1.04 µm, G = 0.87 µm, and B = 0.47 µm) illustrates measurements taken from 12:27 to 12:54 UTC. The Sun can be seen in the sky at about a 33∘ view zenith angle, which also corresponds to the solar zenith angle, and a bright cloud system is seen on the image from view zenith angles of 90–180∘. The horizon coincides with the 90∘ view zenith angle, which is easily identified by the contrast between the sky and surface. In this image, the principal plane is defined by the vertical plane containing the Sun and the plane that is equidistant between two solar disks.

Figure 3CAR quick-look image (constructed from three bands at 1.04, 0.87, and 0.47 µm) obtained over marine stratocumulus clouds. The circular flight track by the aircraft allows the CAR to image the sky and surface in all viewing zenith and azimuthal angles, covering an area defined by a diameter of about 4 km on the surface (assuming the aircraft is flying 600 m above the surface). The unique feature of these measurements is the solar disks, which define the start and end point for each circle. A prominent feature of the marine stratocumulus clouds is the presence of a cloud bow ring associated with scattering by water droplets and with a peak at an approximately 75∘ zenith angle in the antisolar direction.
Note that the circular flight track during the BRDF measurements above the clouds (∼ 650 m) is about 4 km in diameter, and with an aircraft bank angle of 20–30∘, which is compensated by CAR to help maintain the full 180∘ view from zenith to nadir, the plane took ∼ 3 min to complete an orbit. Marine stratiform clouds are generally characterized by a well-defined cloud-top height corresponding to a strong boundary layer inversion. Given this viewing geometry of the cloud–aerosol system, the CAR measurements permit the retrieval of aerosol optical properties above clouds separated into above and below the aircraft, plus the cloud optical properties, using the color ratio method. These measurements provide the best data for validating above-cloud aerosol retrieved from satellite measurements, analogous to the validation of cloud-free aerosol retrievals from satellites, which is typically done with observations from the AErosol RObotic NETwork (AERONET) ground-based sun-photometer network (Holben et al., 1998).
2.2 The color ratio method and its application to airborne observations
The color ratio (CR) method has been used to simultaneously retrieve the above-cloud aerosol optical depth (ACAOD) and aerosol-corrected COD from OMI (Torres et al., 2012) and MODIS observations (Jethva et al., 2013, 2016). The technique is physically based on the reduction of the ultraviolet (UV), visible (VIS), and near-infrared (NIR) radiation reaching the top of atmosphere due to particle absorption above cloud. The effects of aerosol absorption have a spectral signature, in which the absorption strength is found to be stronger at shorter wavelengths than at longer wavelengths. This produces a strong color effect in spectral measurements, and hence it is called the color ratio method. The method employs the VLIDORT V2.6 polarized radiative transfer model (Spurr, 2006) for the simulation of lookup table (LUT) reflectances. VLIDORT treats the outgoing radiance in a pseudo-spherical geometry. Therefore, it is expected that the aerosol radiance simulation at slant geometry, i.e., a viewing zenith angle > 70∘, may not carry the same accuracy as the case with lower viewing angles. This may result in less accurate retrievals at extreme viewing geometries. Additionally, larger retrieval errors at lower cloud optical depth measurements and heterogeneity in aerosol and cloud fields also add to the apparent dependence on scattering angle.
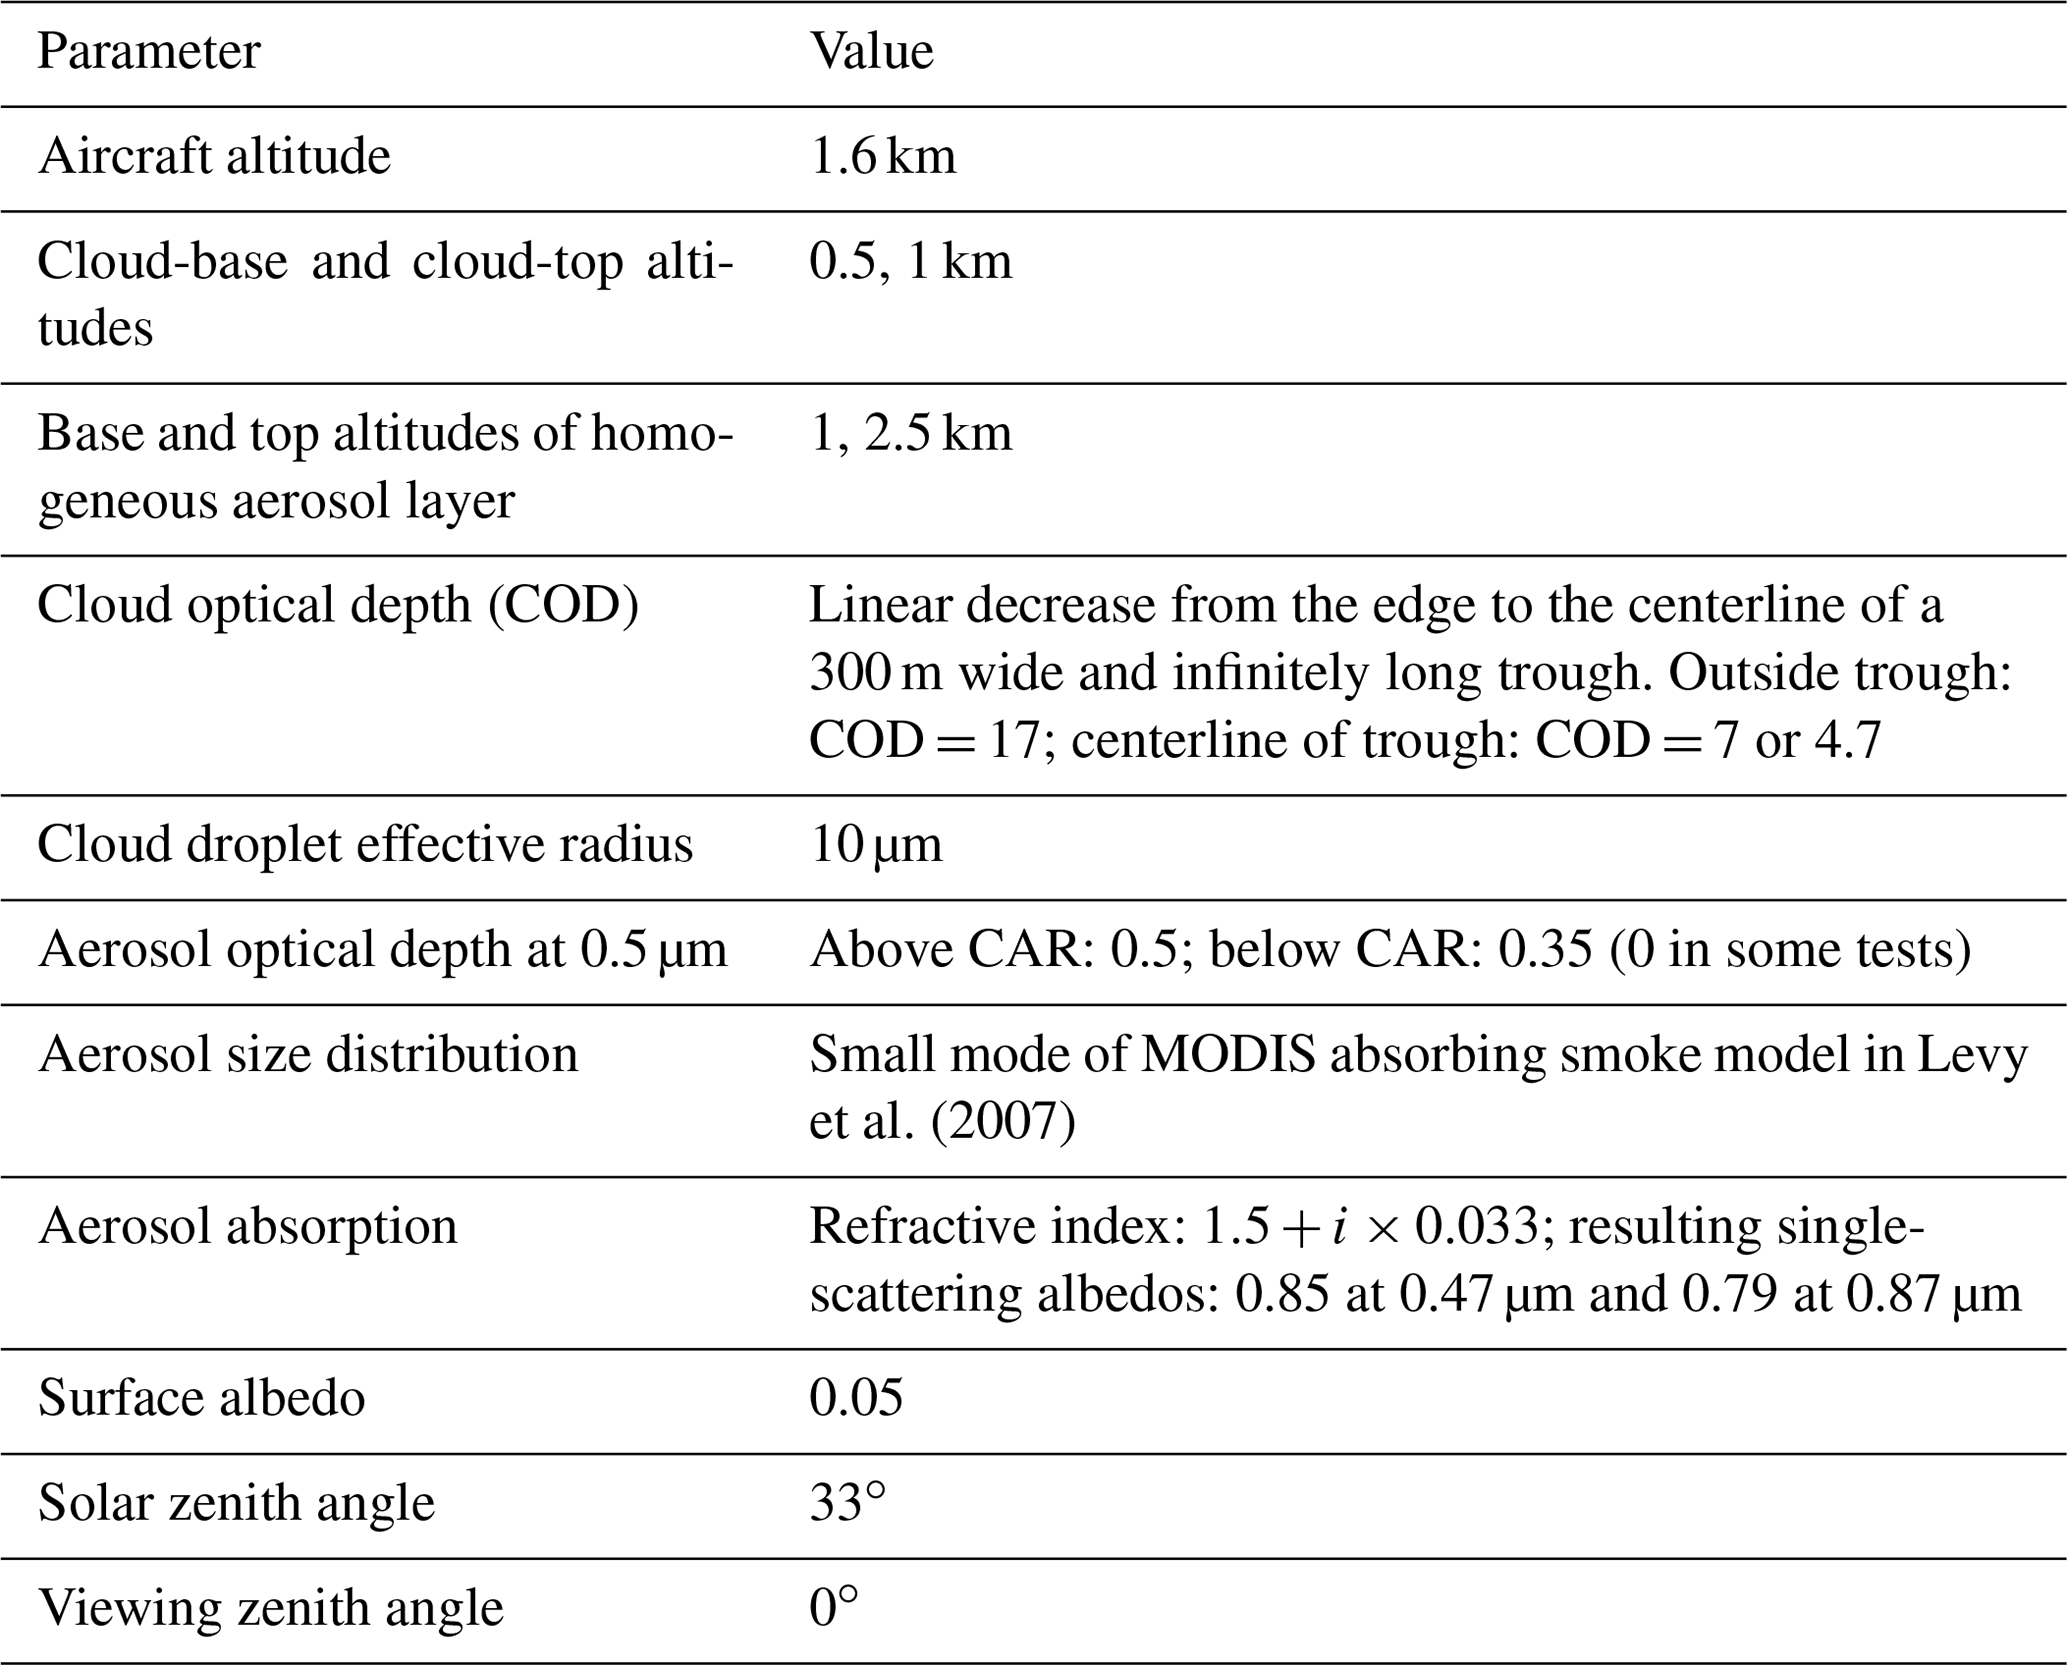
Table 2Aerosol microphysical–optical properties of the carbonaceous smoke model and radiative transfer configurations assumed in the radiative transfer simulations.
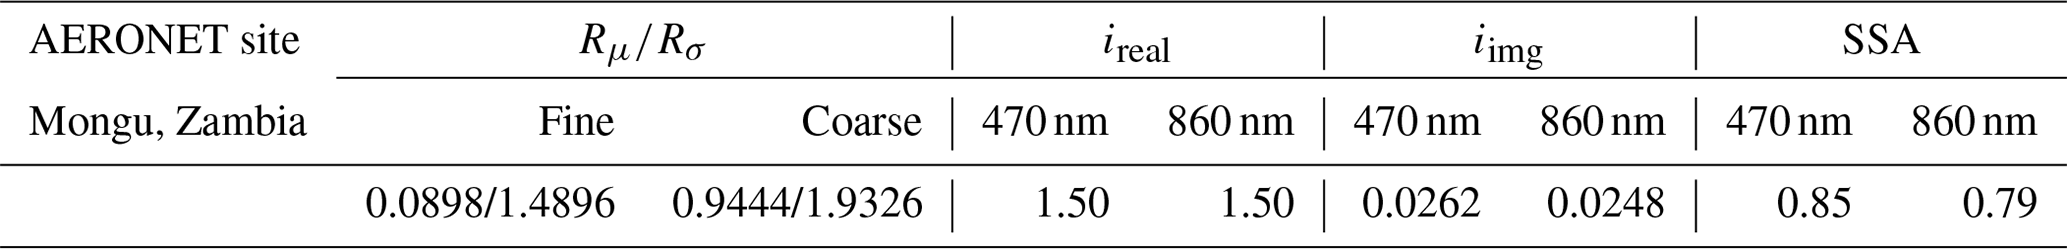
Aerosol and geometry configuration in RT calculations. Aerosol optical depth nodes (500 nm): [0.0, 0.1, 0.2, 0.3, 0.4, 0.5, 0.7]. Extinction Ångström exponent: 1.77. Aerosol layer height for above-cloud aerosols: 1.0–1.5 km uniform profile. Aerosol layer height for above-aircraft aerosols: 1.75–3.75 km uniform profile. Solar zenith angle: [0, 10, 20, 30, 40, 50, 60]. Viewing zenith angle: [0, 6, 12, 18, 24, 30, 36, 42, 48, 54, 60, 66, 72, 80]. Relative azimuth angle: [0, 20, 40, 60, 80, 100, 120, 140, 160, 180].
The aerosol microphysical–optical properties of carbonaceous smoke model and radiative transfer configurations assumed in the radiative transfer simulations are shown in Table 2. The aerosol model used here in the ACAOD inversion is identical to the one employed in Jethva et al. (2016), wherein the MODIS retrievals of ACAOD were found to be in very good agreement (RMSE ∼ 0.05 % and 99 % matchups within predicted uncertainty) with those directly measured from an AATS sun photometer. The results imply that the aerosol microphysical–optical properties assumed in the inversion based on the long-term ground-based AERONET inversion at an inland site in Mongu are suitable for ACAOD retrievals over the adjacent Atlantic Ocean. The retrieved ACAOD at 470 and 860 nm is converted to its value at 500 nm according to the spectral extinction assumed in the selected aerosol models.
The near-UV-based color ratio algorithm has been applied to the long-term record of OMI to derive a global product of ACAOD (Jethva et al., 2018). The ACAOD product has been validated against airborne measurements taken from the HSRL-2 lidar operated during the ORACLES campaign conducted over the southeastern Atlantic Ocean. On the other hand, the ACAOD derived from the visible–near-IR observations of MODIS was validated against the direct AOD measurements acquired from the airborne NASA Ames Airborne Tracking Sun Photometer (AATS) and the Spectrometer for Sky-Scanning, Sun-Tracking Atmospheric Research (4STAR) sun photometers operated during different field campaigns (Jethva et al., 2016; Schmid et al., 2003). In both OMI and MODIS validation studies, the satellite-retrieved ACAOD product was found to agree well with the airborne measurements within the expected uncertainty limits associated with the inversion technique, which mainly arises from the chosen aerosol model and its absorption properties.
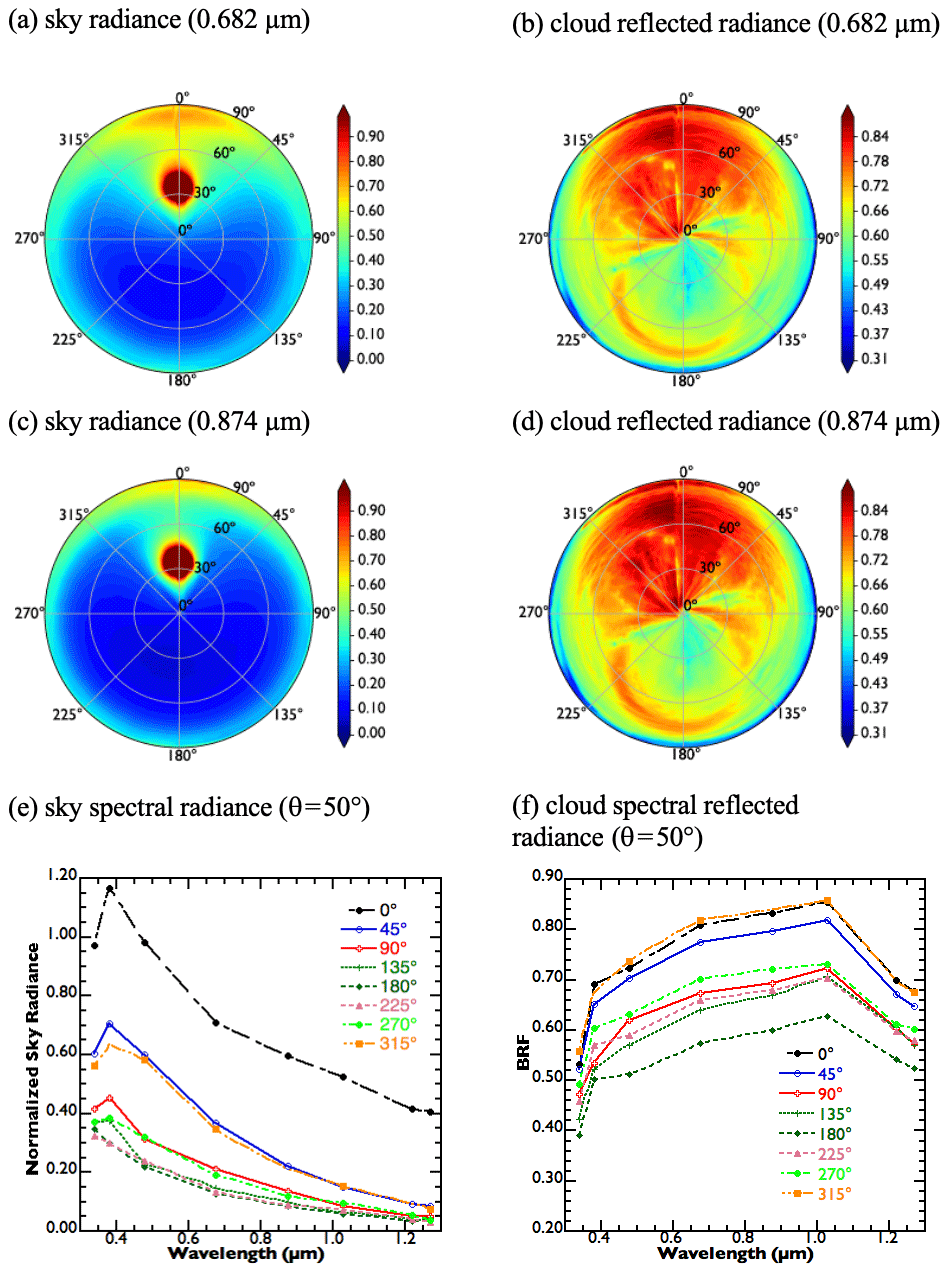
Figure 4Measured angular distribution of sky radiance (a, c) and cloud-reflected radiance (b, d) at selected wavelengths (λ = 0.682 µm and λ = 0.874 µm) obtained at about 12:47:55 UTC with a solar zenith angle of ∼ 35.30∘ (Table 1: case o). The measured (sky or surface) radiance in any given direction is normalized by the solar irradiance incident at the top of the atmosphere, assuming mean Sun–Earth distance, converted to a nondimensional quantity equivalent to effective BRF (or BRDF times π). The view zenith angle (θ) on the polar plots is represented as the radial distance from the center (0∘) towards the periphery (90∘) and the azimuthal angle (φ) as the arc length from the solar principal plane (0∘ 360∘). The principal plane is within the 0–180∘ azimuthal plane (the vertical plane passing through the solar position). Panels (e) and (f) show measured radiance at eight CAR spectral bands (0.34–1.27 µm) (sky and clouds) at a constant view zenith angle (50∘) at different azimuthal planes angled 0, 45, 90, 135, 180, 225, 270, and 315∘.
Here, the CR method was applied to CAR observations, which include direct and diffuse solar radiance (or sky radiance), at eight spectral channels (see Fig. 4.). The direct solar component is given by the extraterrestrial solar radiance attenuated by atmospheric absorption and scattering. On the other hand, sky radiance results from single- and multiple-scattering processes due to the interaction of sunlight with aerosols and gas molecules. Atmospheric gas molecules (e.g., nitrogen, oxygen, carbon dioxide, ozone, water vapor) and aerosols are likely to strongly affect the solar radiance in the visible and near-infrared regions. The attenuation (scattering and/or absorption) by each atmospheric constituent is strongly dependent on wavelength and can be determined through the optical thickness using simple parametric models (e.g., Zibordi and Voss, 1989). In the case of CAR measurements close to the Sun (solar aureole), the signal from the direct solar radiance measurements saturates the detectors, and therefore pixels that are especially close to the solar direction (scattering angles are ≤ 10∘) should be excluded from any retrieval (Gatebe et al., 2010). The sky radiance distribution seen here is typical of clear skies (cloud-free), whereby the radiance of a point in the sky depends both on its position relative to the Sun (i.e., azimuth angle) and on its air mass number (i.e., zenith angle). The sky radiance distribution is generally symmetrical about the principal plane, wherein the maximum value of the sky radiance for each wavelength is observed. This is illustrated in Fig. 4e at 45∘ ≈ 315∘, 90∘ ≈ 270∘, and 135∘ ≈ 225∘ for λ > 0.4 µm. The minimum values of sky radiance are found to be in the area directly opposite to the Sun's position.
The CAR observations are indicative of the presence of absorbing aerosols above the clouds due to apparent brightening and darkening, which is evident when looking at the measured sky radiances and the cloud bidirectional reflectance factor (BRF) (see Fig. 4). Aerosol loading has a strong influence, especially in the forward scattering directions (relative azimuth angle (φ) < 90∘ and φ > 270∘), with reflectances in the shorter wavelengths (e.g., 0.38 µm) larger by a factor of > 2 relative to the longer wavelengths (e.g., 1.22 µm; Fig. 4e). The asymmetry depicted in Fig. 4e is largely attributed to aerosol scattering and not to Rayleigh scattering, as the latter is expected to exhibit a symmetrical distribution in either scattering direction. More interestingly, there seems to be a strong aerosol absorption signal above clouds. It is well known that clouds reflect uniformly across the visible–near-IR spectrum; however, the presence of absorbing aerosols above clouds (in this case smoke transported from southwestern Africa) induces an overall absorption or darkening in the UV and shorter visible wavelengths, thus resulting in a strong reflectance gradient from the UV to blue to near-IR spectrum, with ∼ 35 % reduced reflectance at 0.34 µm compared to that at 1.04 µm, as seen in Fig. 4f. Overall, the positive spectral gradient seen in Fig. 4f is normally associated with cloud darkening at the shorter wavelengths (see Gautam et al., 2016).
2.3 The 3D radiative transfer simulations
To examine 3D influences in CAR retrievals, we performed 1D and 3D radiative transfer simulations using a Monte Carlo model that powers the online simulator of 3D radiative processes that was created as part of the I3RC (Intercomparison of 3D Radiation Codes) project and is publicly available at http://i3rcsimulator.umbc.edu/ (last access: 14 February 2021). This model was validated through I3RC intercomparison experiments (e.g., Cahalan et al., 2005) and was used in several other studies (e.g., Várnai et al., 2013). The key simulation parameters are listed in Table 3; additional details and the results of the simulations are discussed in Sect. 3.4.
Table 3Key parameters of the simulations used for exploring the impact of three-dimensional radiative processes.
3.1 The observations
Figures 5 and 6 show the full BRF of low stratiform clouds at selected wavelengths of 0.472 and 0.870 µm, respectively, from each of the 16 different cases described in Sect. 2. The two wavelengths form the basis of the color ratio method for the simultaneous retrieval of above-cloud aerosol optical depth (ACAOD) and cloud optical depth (COD). The spectral BRF of stratiform clouds observed in the 16 cases is highly anisotropic due to a combination of factors ranging from cloud heterogeneity (including sub-pixel heterogeneity) to solar illumination geometry, sensor viewing geometry, and cloud parameters such as optical thickness and effective radius (see Cornet et al., 2018). The 16 cases have a range of solar zenith angles (23∘ < SZA < 36∘). Measurements span an area of ∼ 55 km (N–S) × ∼ 12 km (E–W), with most cases (nine cases: cases h–p) concentrated over a much smaller area (∼ 8 km × ∼ 4 km) (see Fig. 1). The observations were taken at approximately the same altitude (Table 1, cases a–d: 1420–1541 m above mean sea level or a.m.s.l.; cases h–p: 1608-1616 m a.m.s.l.), implying that corresponding pixels for different cases have a similar measurement scale. The only exceptions (cases e–f) were taken at different altitudes during the aircraft spiral from 1814 to 3369 m a.m.s.l.. The cloud-top height was ∼ 1000 m a.m.s.l. (Sinha et al., 2003), and the cloud geometrical thickness was at most 300 m (see Melnikova and Gatebe, 2018; Sect. 2.2). Based on these characteristics, the 16 cases may be classified into three groups (see Table 1). Group 1 includes cases a–d with SZA ≈ 24∘; measurements were taken close to each other in time at Δt < 16 min with an altitude at ≈ 1508 m, and the location is about the same as shown in Fig. 1. Group 2 includes cases e–g with SZA ≈ 24∘, Δt < 6 min, altitude approximately variable from low to high, and at the same location near the Namibian coastline as shown in Fig. 1. Group 3 includes cases h–p with SZA ≈ 34∘, Δt < 23 min, and altitude ≈ 1614 m; the location is about the same as shown in Fig. 1. Since stratiform clouds are formed and maintained by a balance of various marine boundary layer processes (see Duynkerke and Teixeira, 2001; Wood, 2012; Feingold et al., 2017), the variations in the BRF patterns with time, especially where other parameters are similar, are possibly linked to the formation of open cells caused by drizzle–cloud dynamical interactions, inevitably leading to changes in the cloud liquid water path and BRF. The pronounced circular brightness feature (see cases h–p, Fig. 5, λ = 0.470 µm; Fig. 6, λ = 0.870 µm) shows a cloud bow (or primary rainbow), which is typical of water clouds (see Gatebe et al., 2003, wherein case h was analyzed in detail). Figure 7 shows the derived spectral albedo (with atmosphere) for all 16 cases at λ = 0.470 µm and λ = 0.870 µm (see Table 4 for the spectral albedo, with atmosphere, for all the wavelengths). Clearly, Group 3 cases had a higher spectral albedo and were optically thicker, while Group 2 cases from near the Namibian coastline had the lowest spectral albedo (with atmosphere). It is interesting to note that the spectral albedo remains almost constant in Group 2 cases despite the change in measurement scale during the spiral. In the following subsections, we will examine how the surface reflectance anisotropy impacts retrievals of the optical depth (both clouds and aerosols) using the color ratio method.
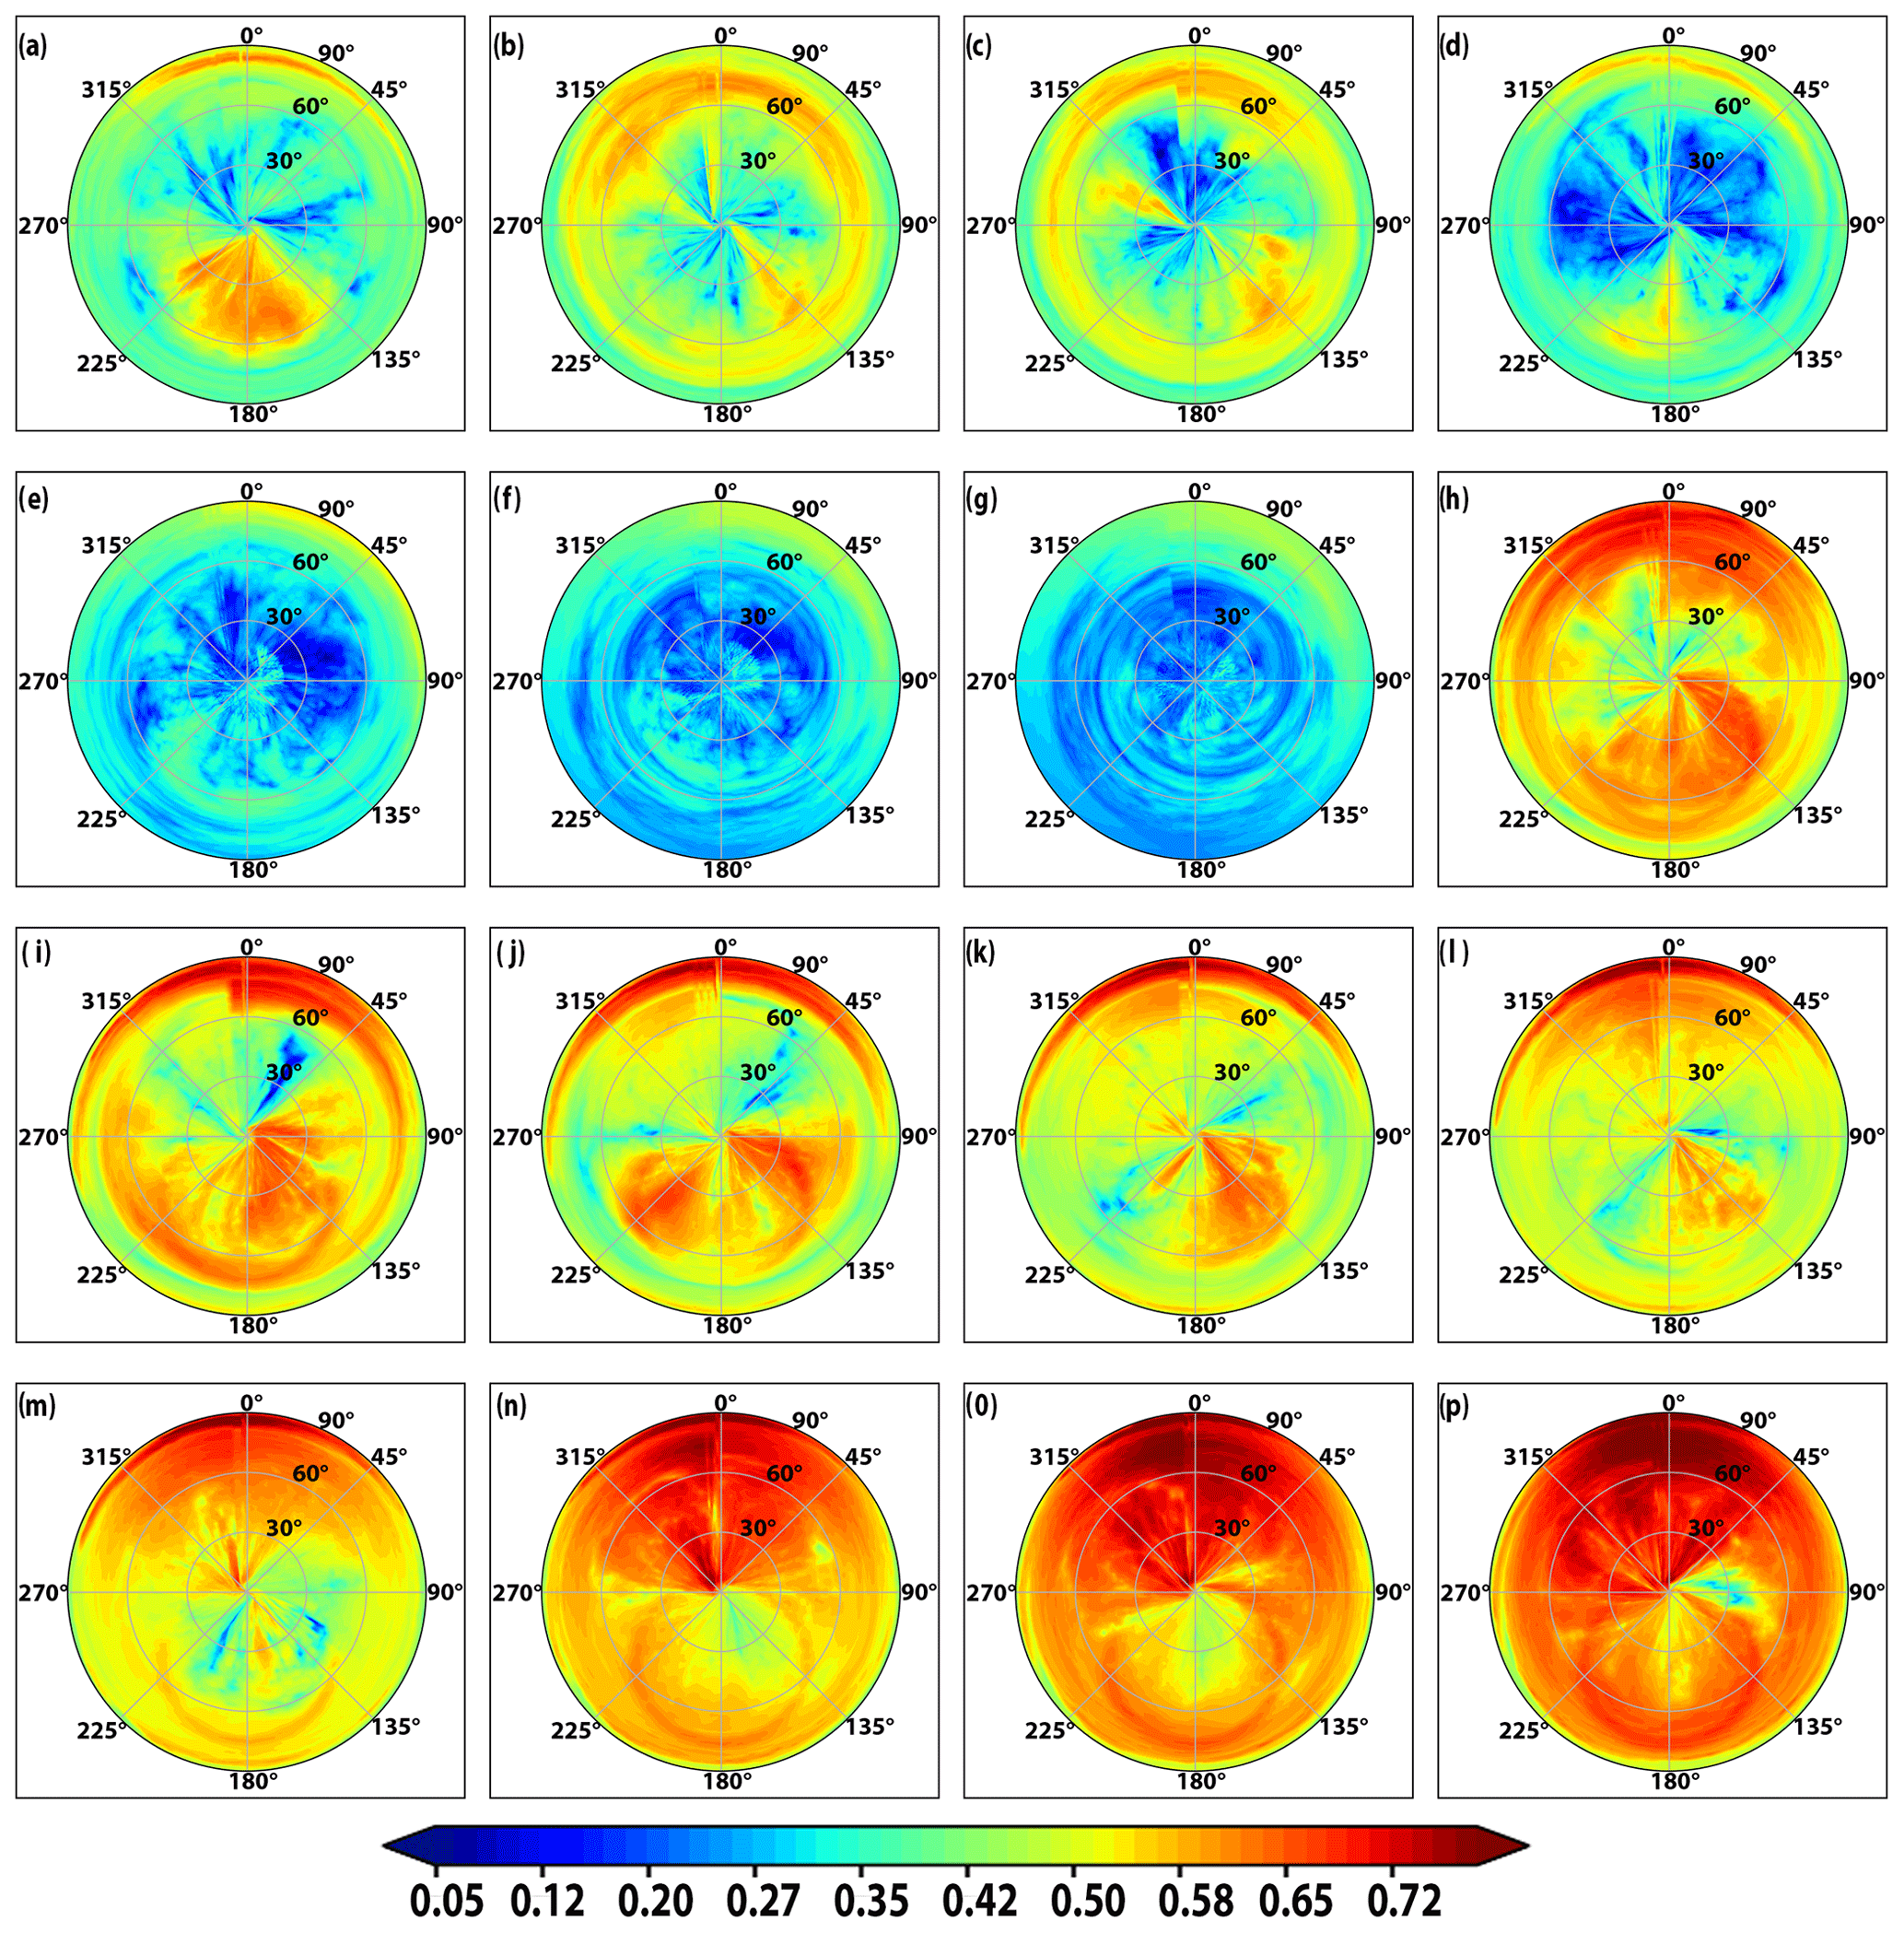
Figure 5BRF at λ = 0.472 µm for different solar zenith angles (23∘ < SZA < 34∘) and cloud optical thickness. Marine stratocumulus clouds are often extensive and flat but contain areas that have thinner clouds or even open cells that allow radiation to penetrate through, and therefore they have lower BRF values, as shown in blue. A prominent feature of marine stratocumulus clouds is the presence of a cloud bow ring associated with scattering by water droplets and with a peak at an approximately 75∘ zenith angle in the antisolar direction.
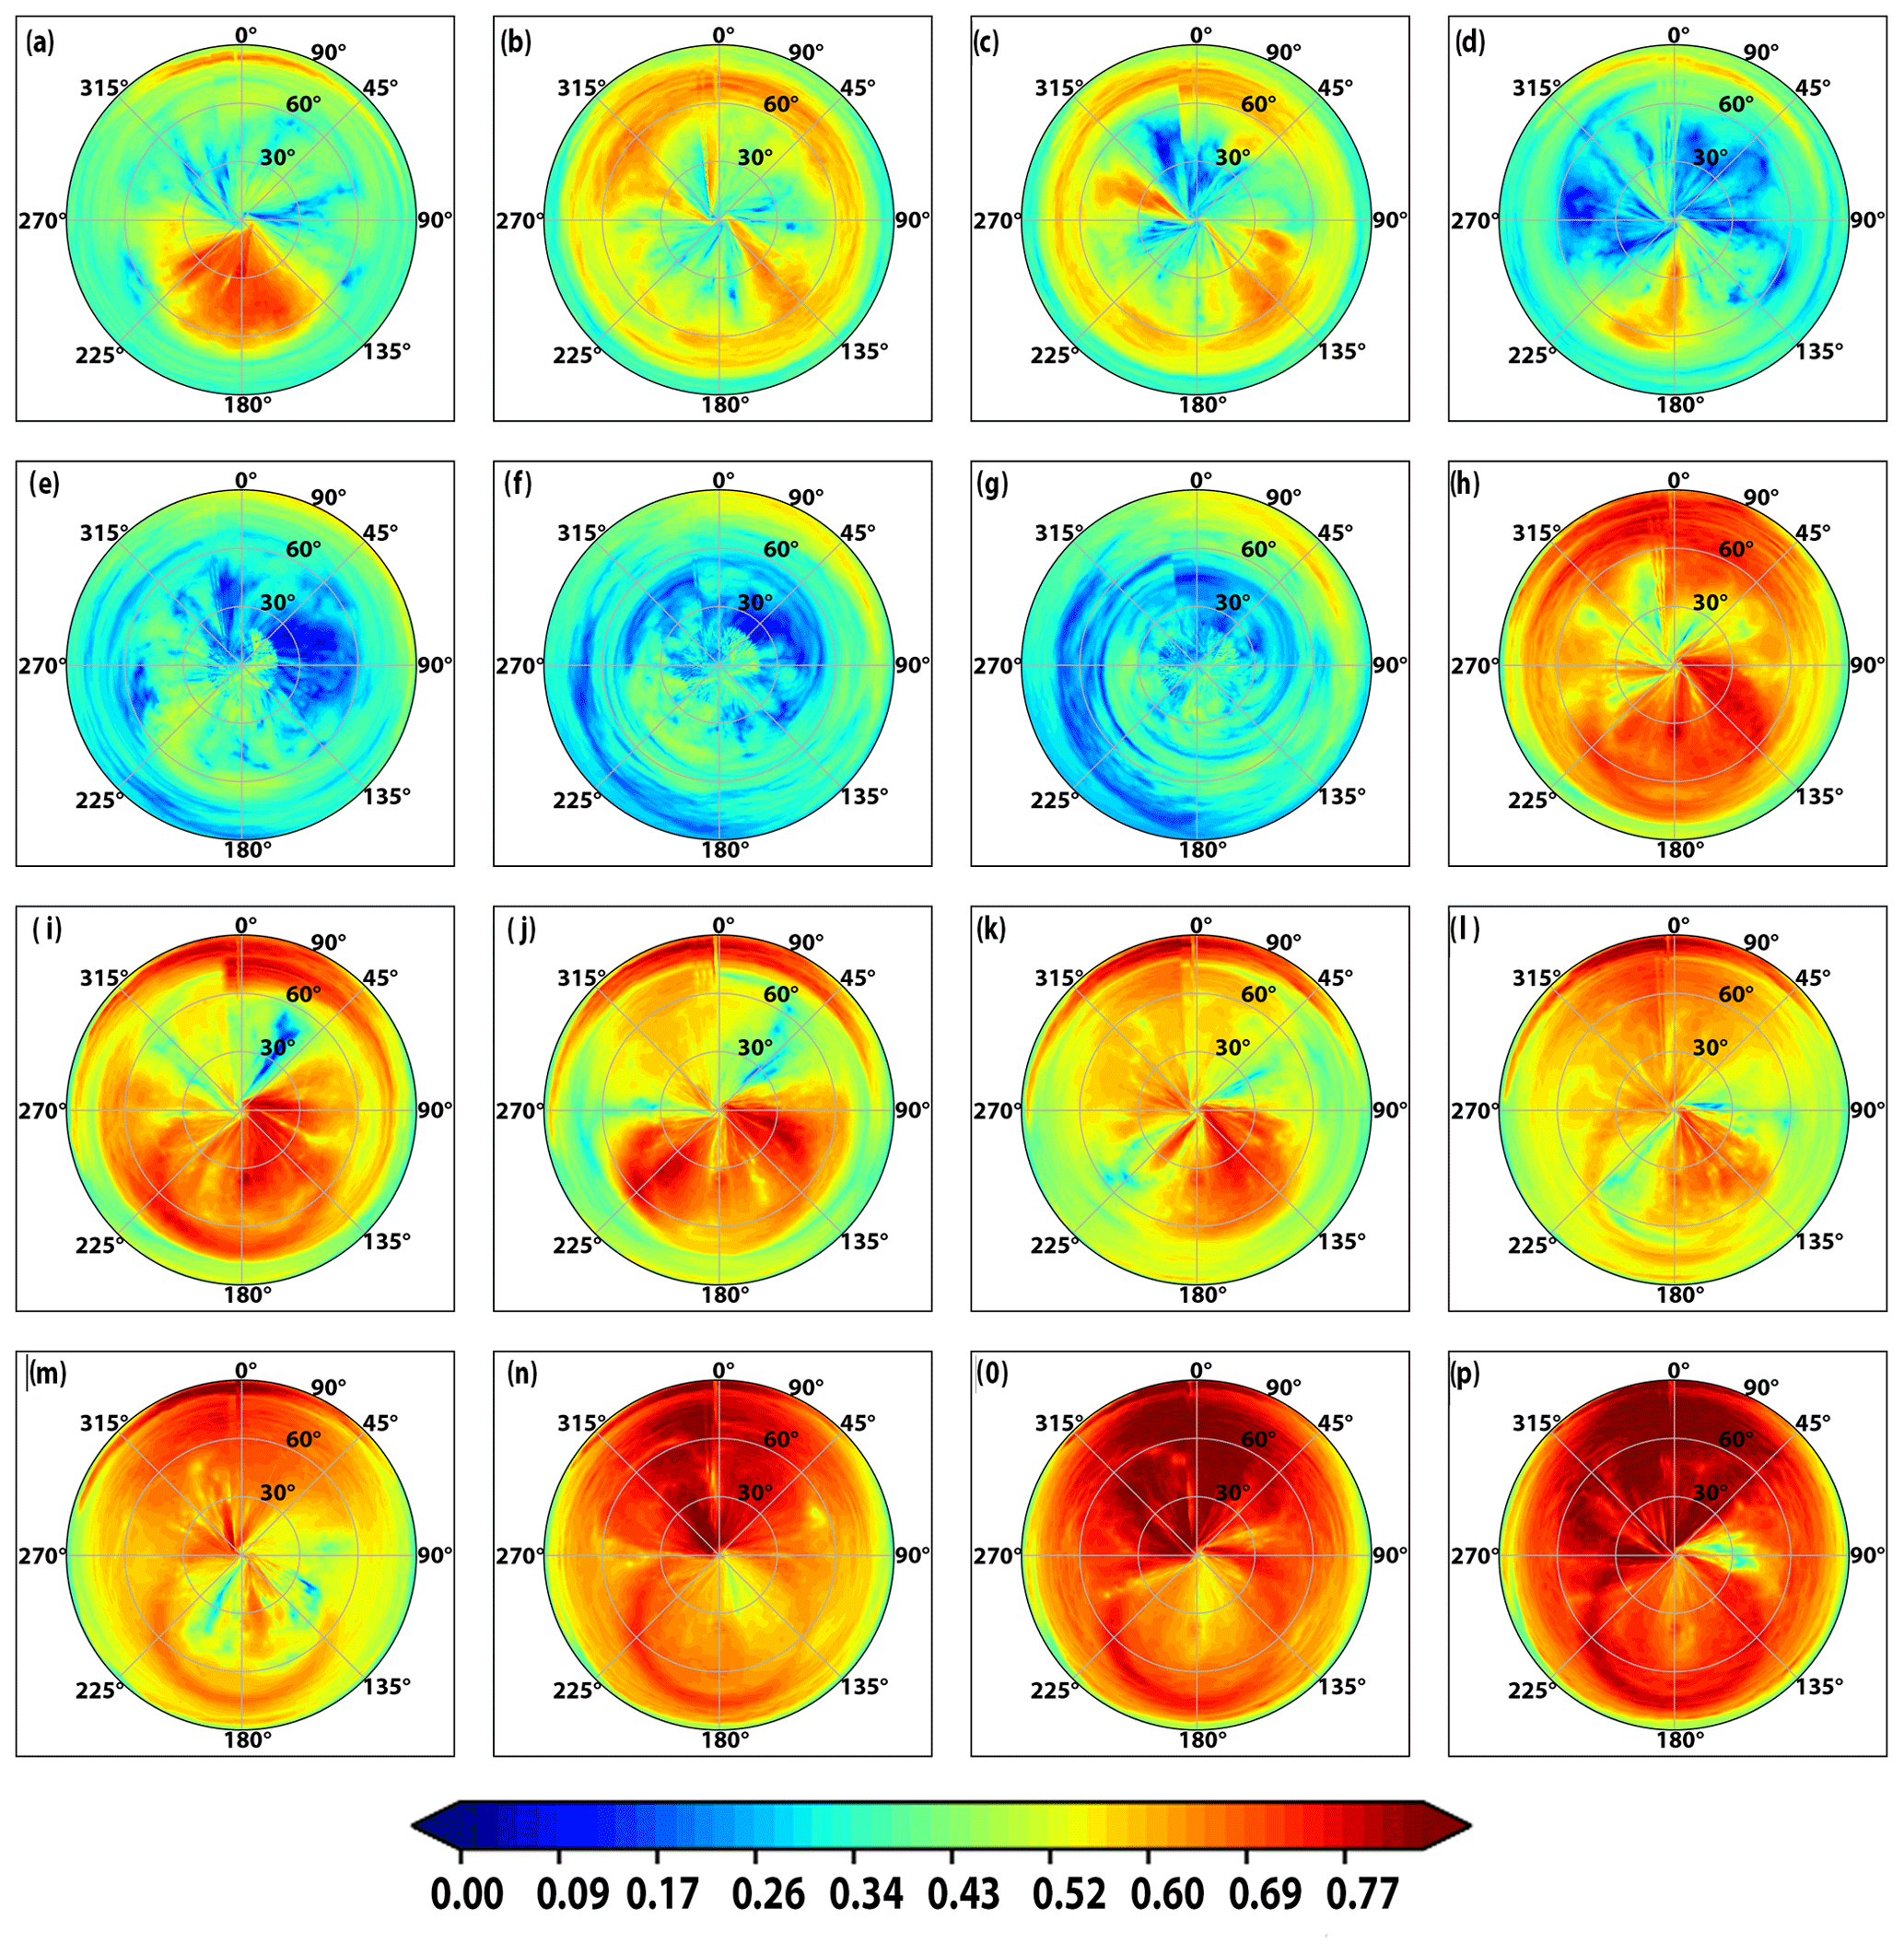
Figure 6BRF at 0.874 µm obtained at different solar zenith angles (23∘ < SZA < 34∘) and locations over the marine stratocumulus off the Skeleton Coast in Namibia for the 16 cases described in Table 1. A prominent feature of marine stratocumulus clouds is the presence of a cloud bow ring associated with scattering by water droplets and with a peak at an approximately 75∘ zenith angle in the antisolar direction.
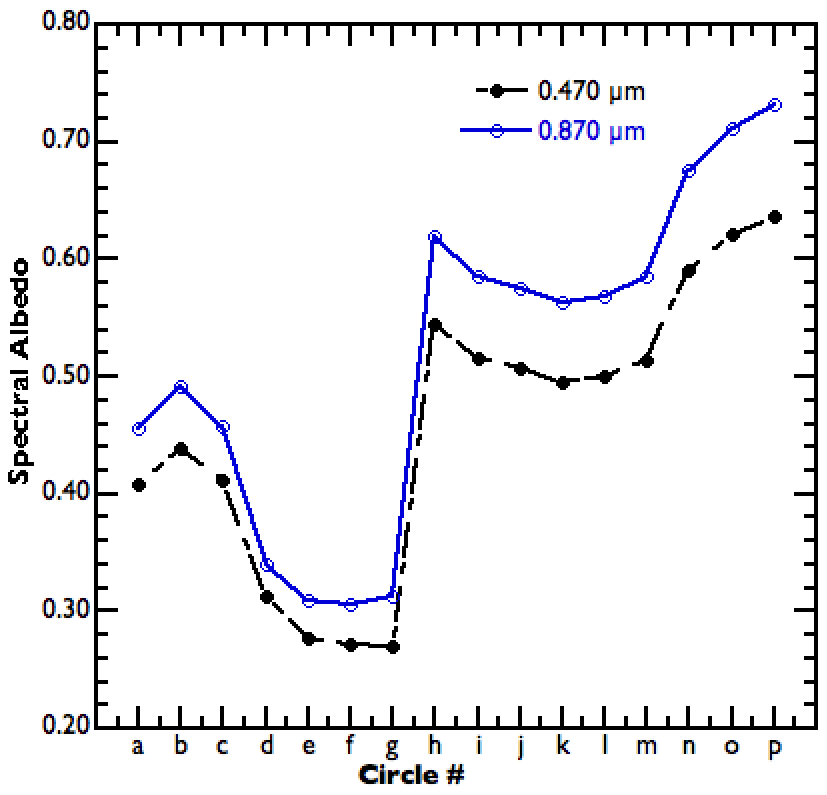
Figure 7Spectral albedo (with atmosphere) for all 16 cases at λ = 0.470 µm and λ = 0.870 µm.
Table 4Measured spectral albedo (with atmosphere) for each BRDF case.

3.2 The retrieved ACAOD and COD
Figure 8 shows the retrieved AOD for aerosol layers located above the aircraft level (AOD_sky) derived from the observed diffuse sky radiance by CAR. The retrievals were performed using a single-channel fit at 470 nm between the observed sky radiance aerosol lookup table, accounting for the variations in AOD and geometry. Note that the aerosol model used for AOD_sky retrievals was the same for the inversion of AOD below aircraft (AOD_cloudtop). It is complicated to characterize and model the anisotropic effects of reflecting clouds with varying optical depths on the hemispherical diffuse sky radiances measured by CAR. Therefore, we adopted a simple approach to account for these effects, at least partially, by retrieving AOD above the aircraft and assuming an averaged underneath-cloud optical depth field retrieved from the AOD_cloudtop inversion for each CAR BRDF case. For the most part the hemispherical distribution of retrieved AOD_sky along the azimuth direction is found to be smooth and nearly uniform, suggesting that the sky retrievals of AOD are not significantly affected by cloud anisotropy and that the simple approach of assuming an averaged value of COD for the full azimuthal scan works reasonably well in capturing the cloud effects on the sky radiances. The angular pattern in cases a–d is similar and in good agreement with the airborne direct sun-photometer measurements, as discussed later (Fig. 12 and Table 1).
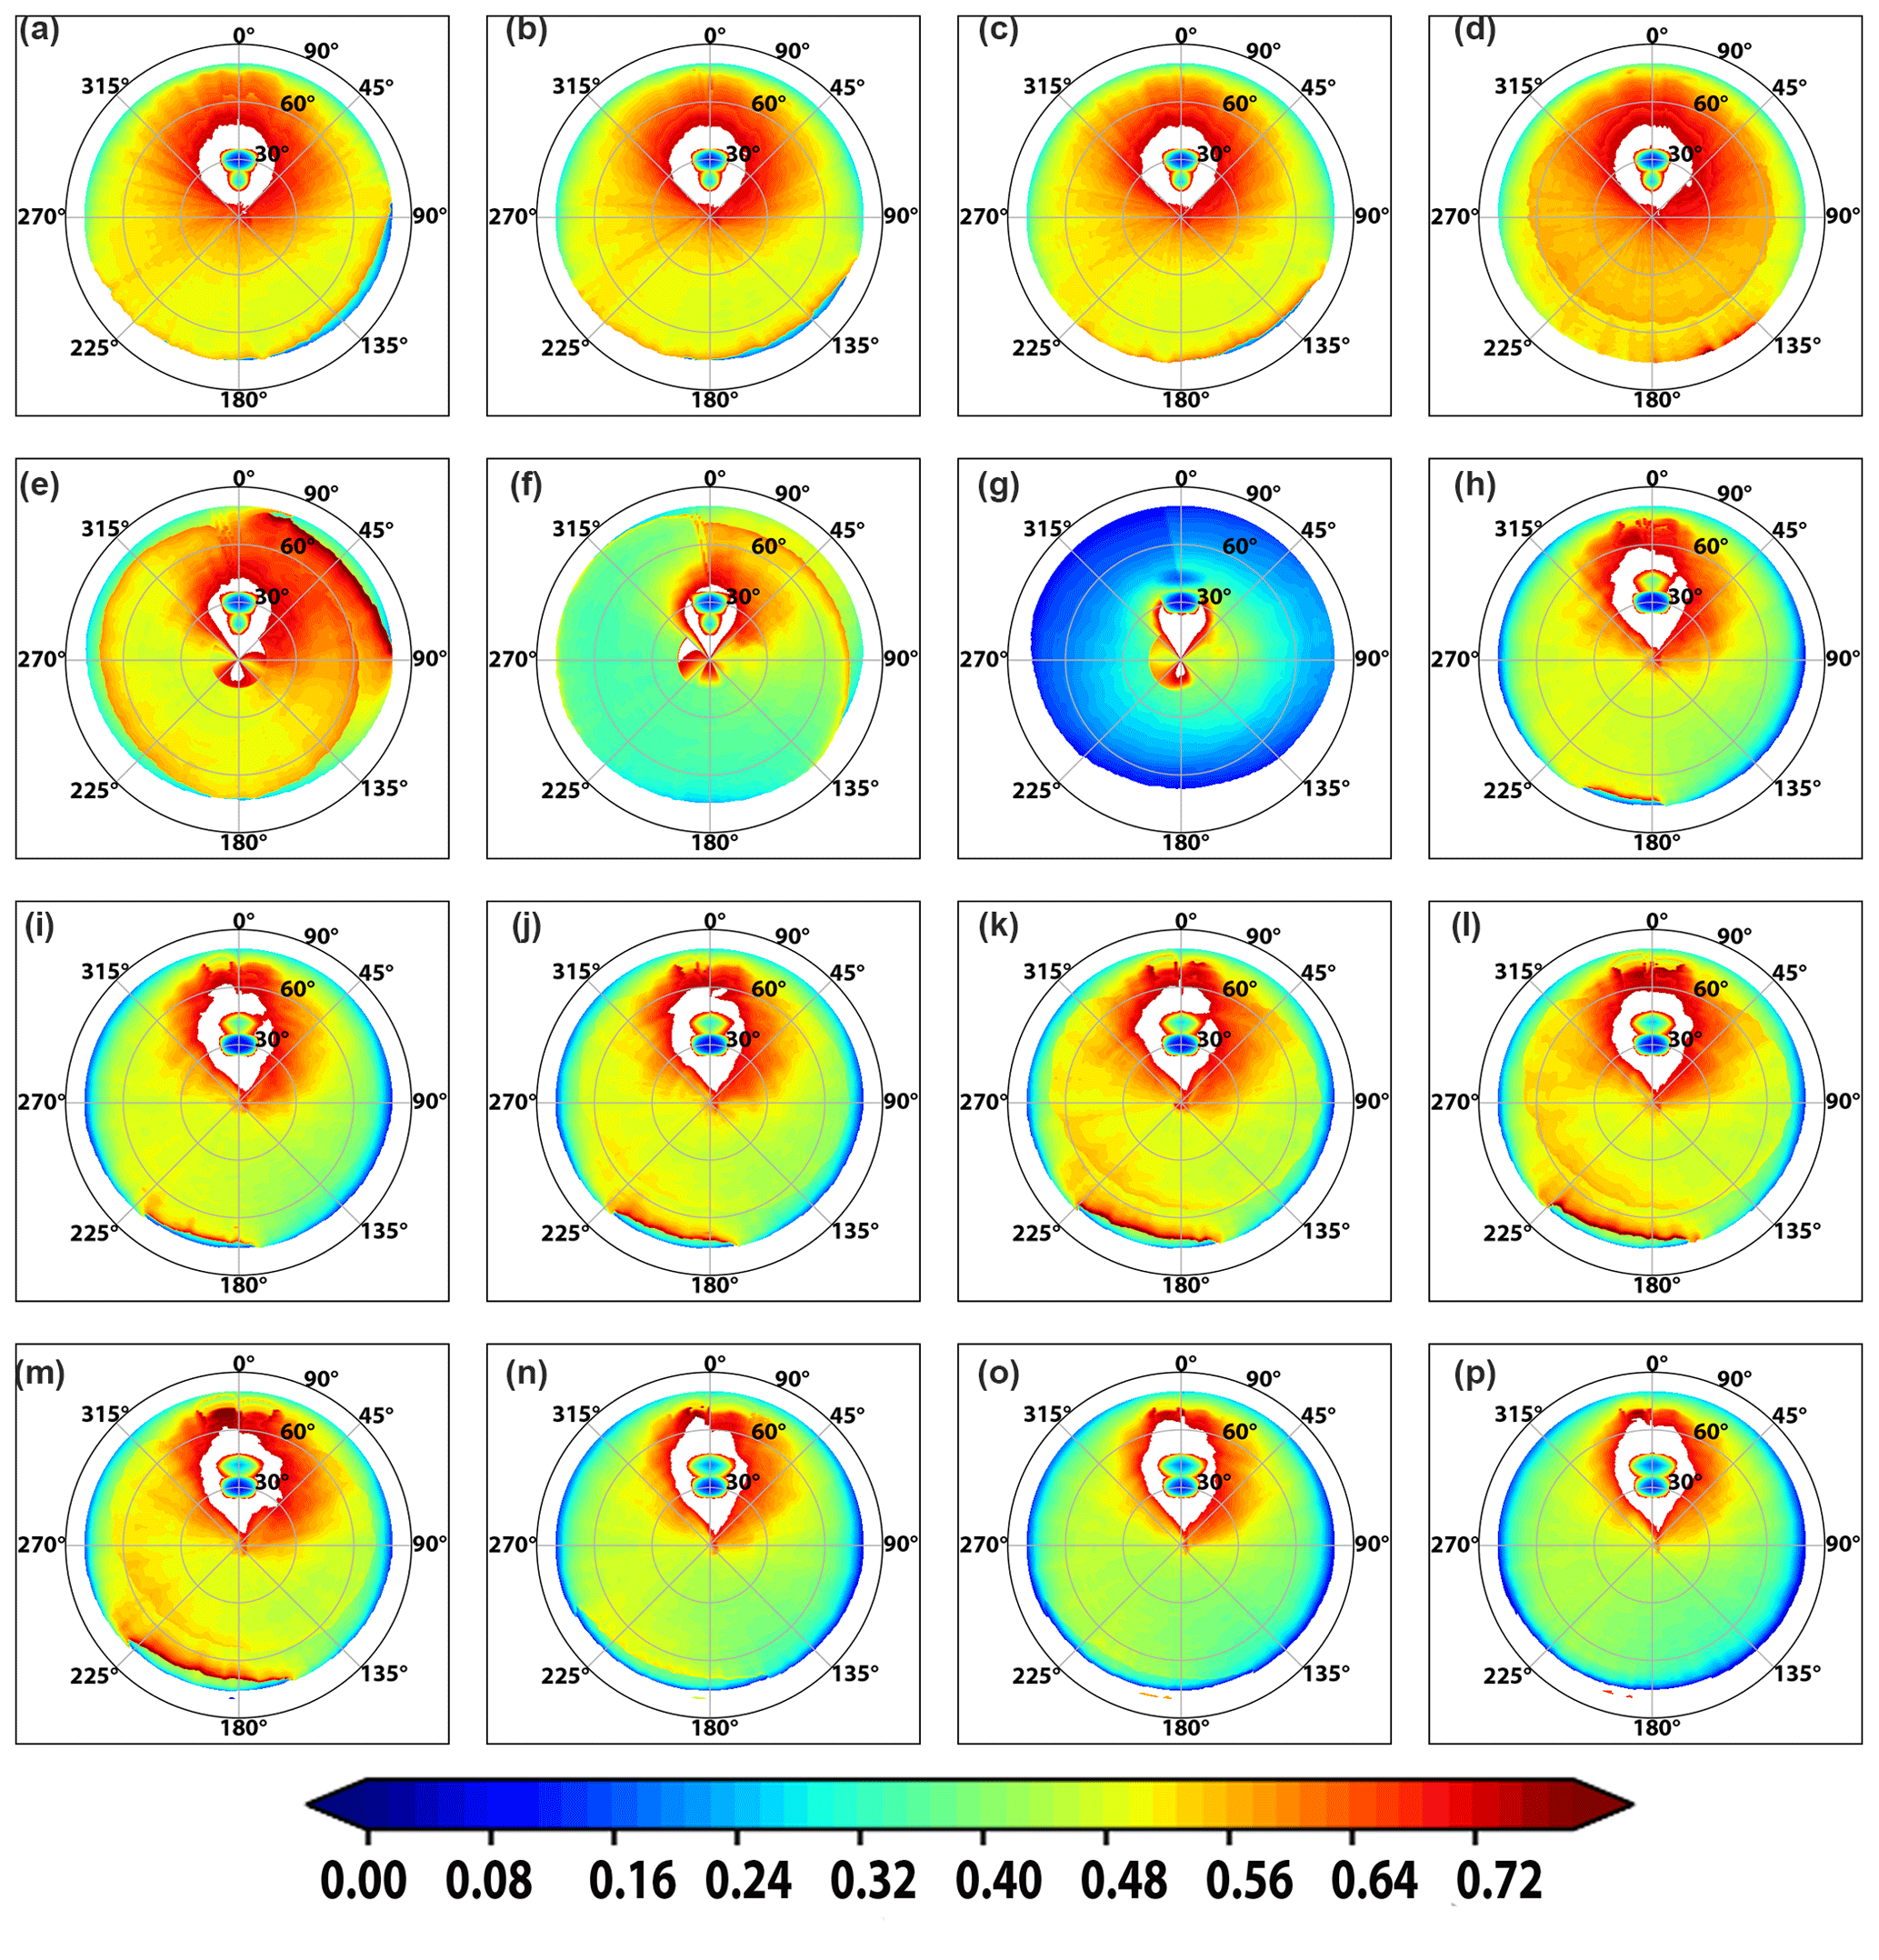
Figure 8Retrieved aerosol optical depth (λ = 0.500 µm) above clouds and the aircraft, obtained from the CAR sky radiance measurements. Note that the actual retrievals are performed at 470 and 860 nm assuming an extinction Ångström exponent of 1.77 (see also Table 2). Pixels without valid retrievals are shaded white. The spurious retrieval of AOD around the solar disk is a result of saturation in the CAR reflectance measurements, partly due to the inability of the RT model to simulate reflectance when directly looking at the Sun.
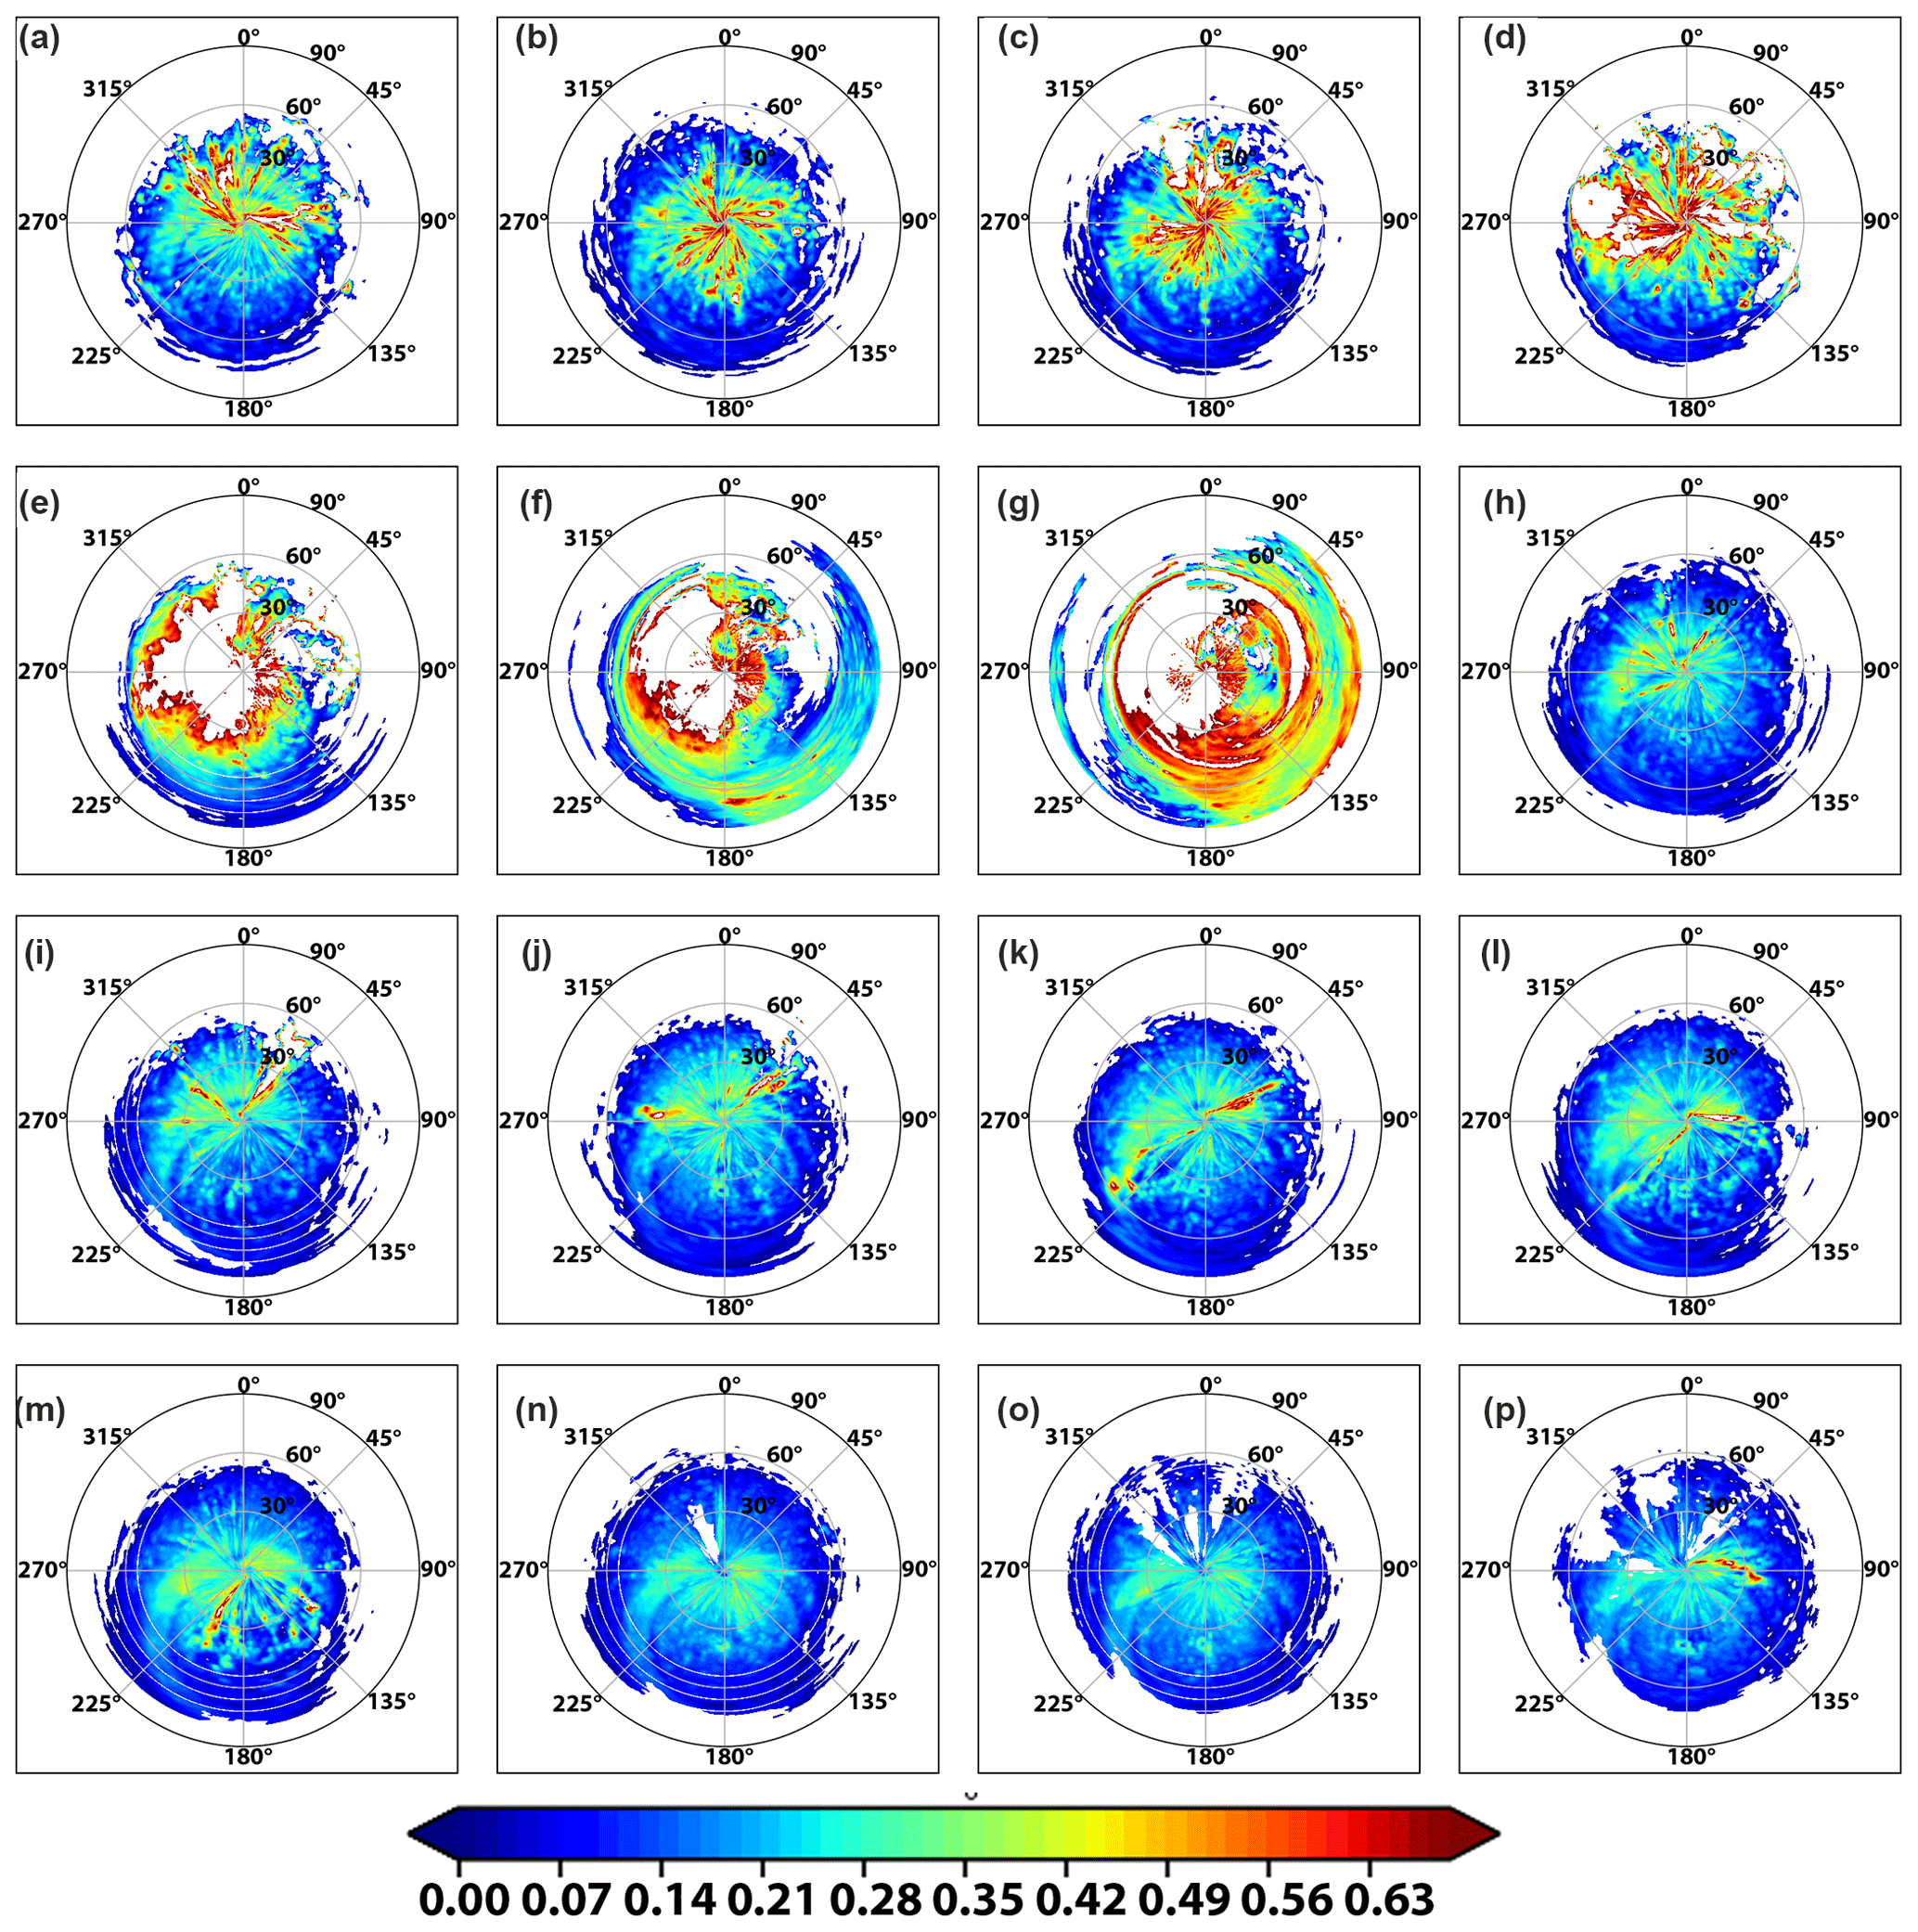
Figure 9Retrieved aerosol optical depth (λ = 0.500 µm) above clouds and below the aircraft (AOD_cloudtop). Note that the actual retrievals are performed at 470 and 860 nm assuming an extinction Ångström exponent of 1.77 (see also Table 2). Pixels without valid retrievals are shaded white.
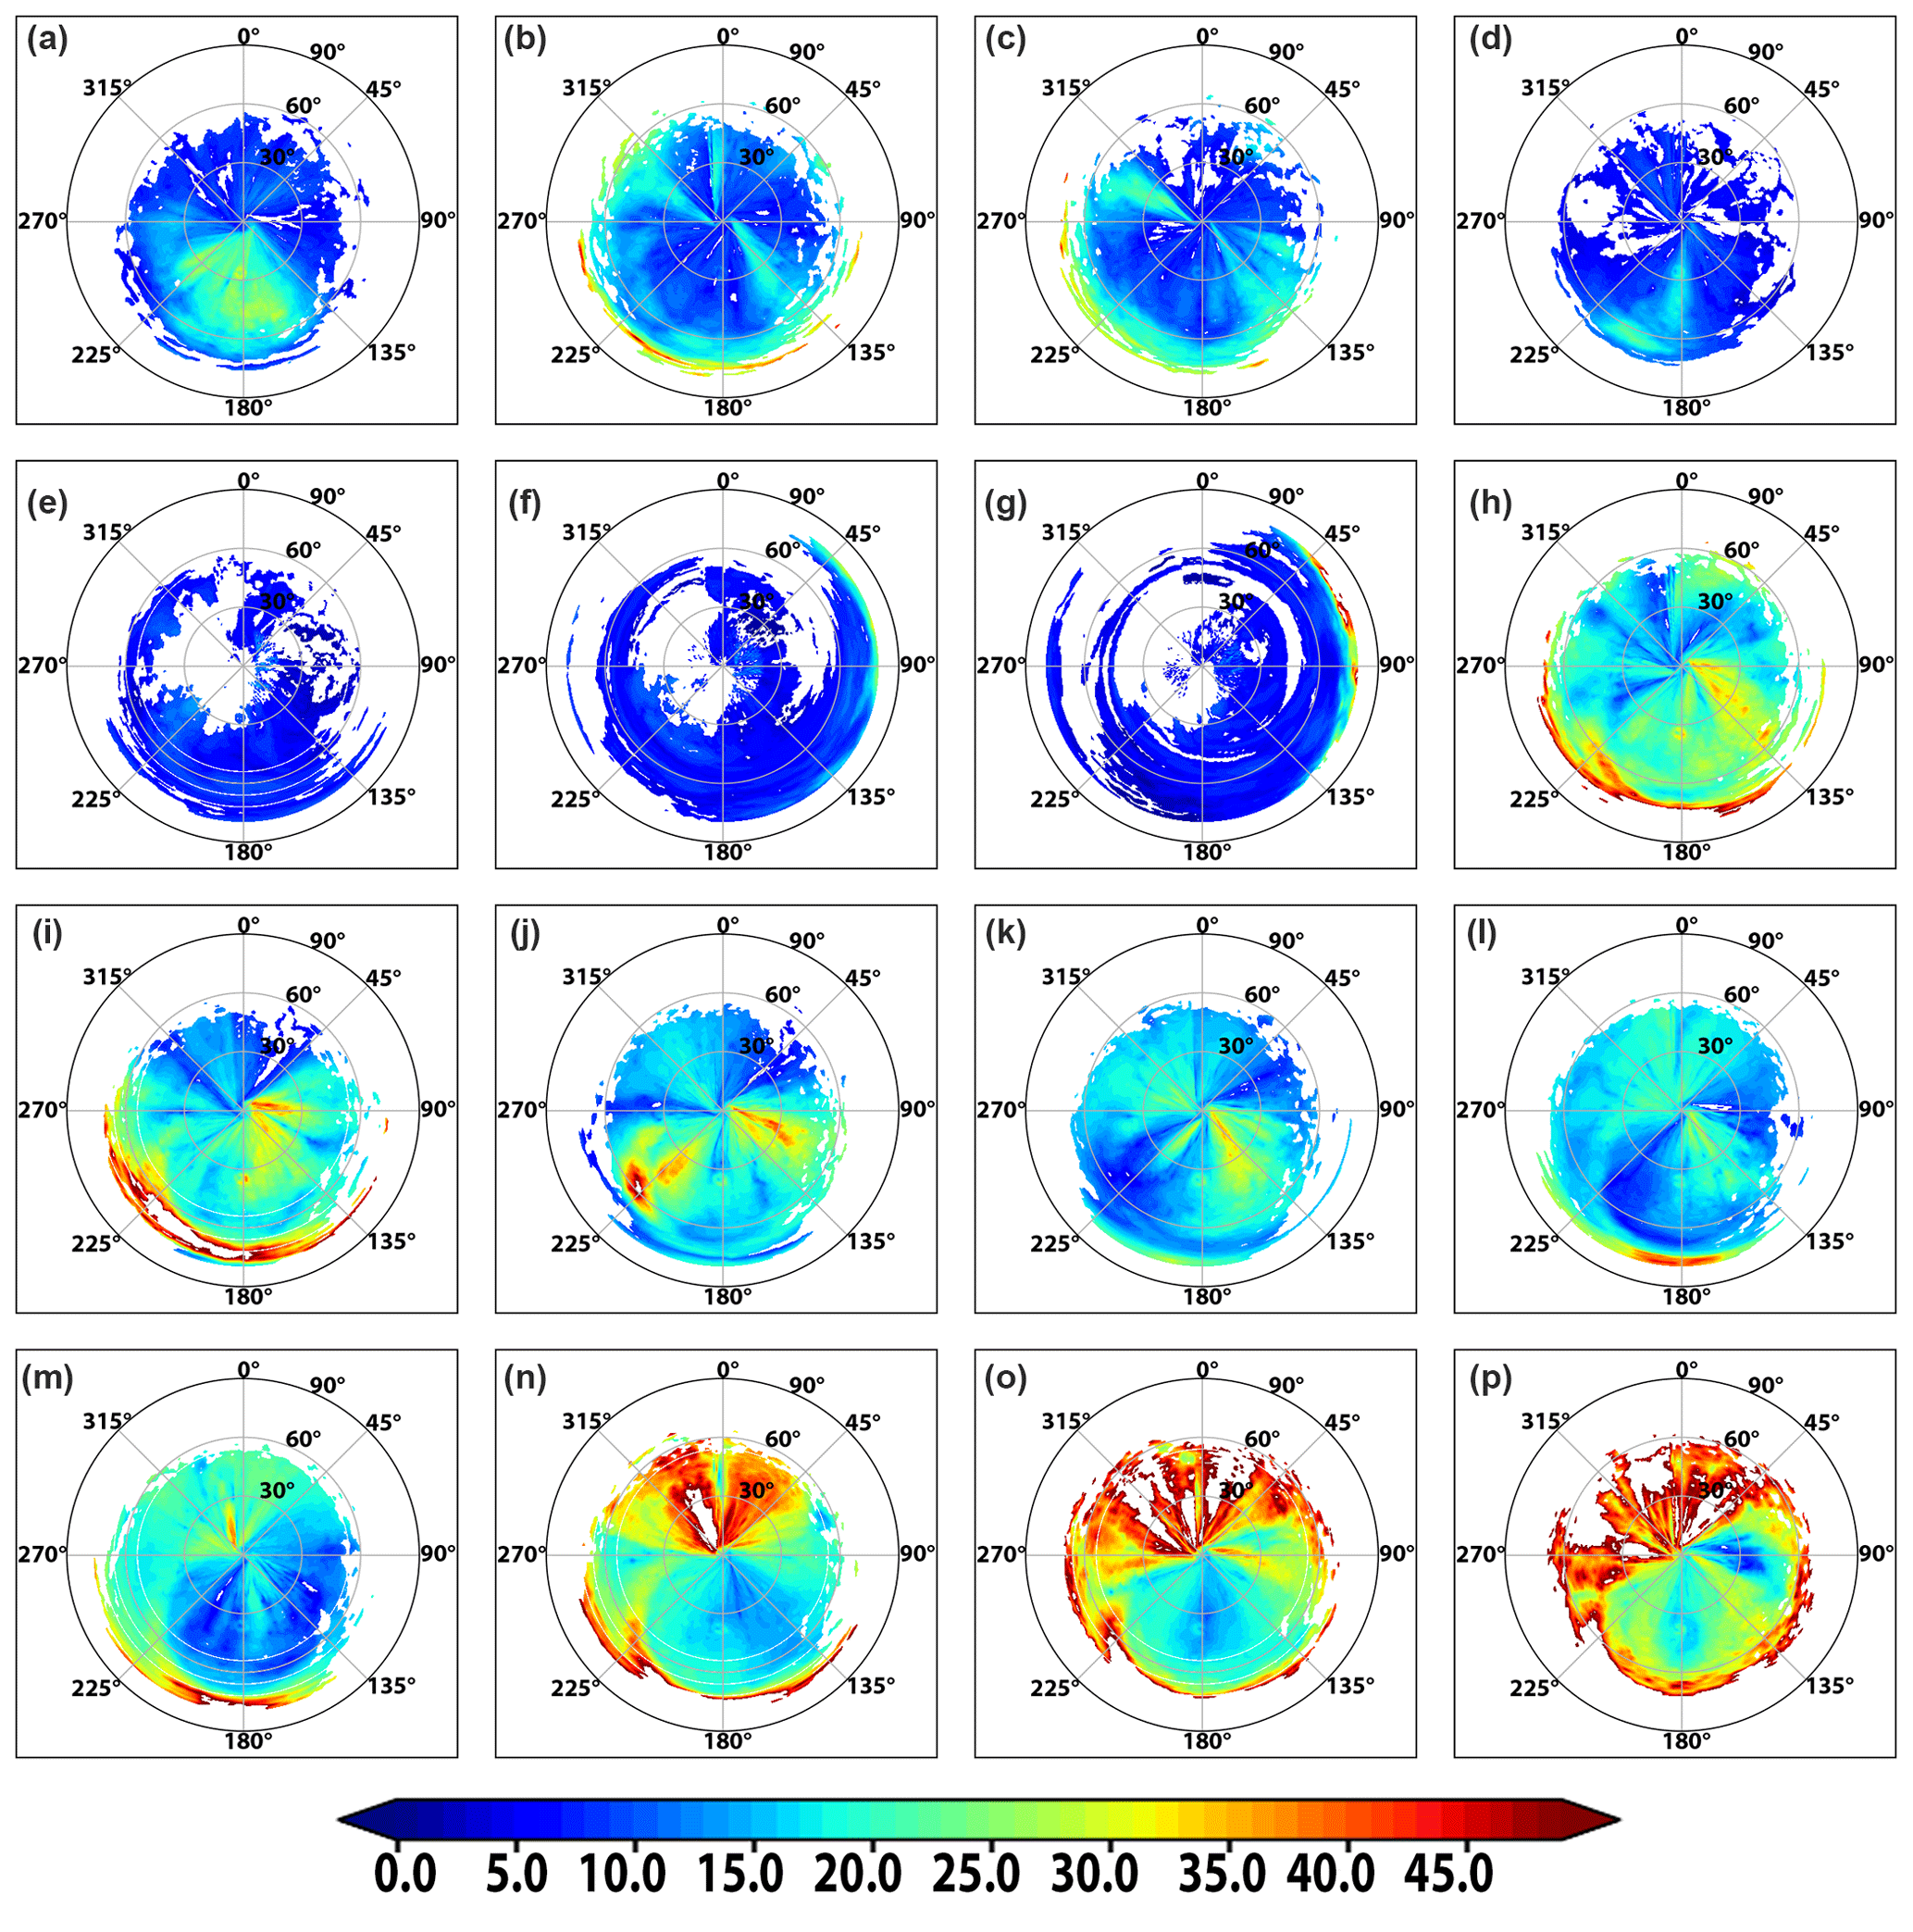
The retrieved AODs below the aircraft (AOD_cloudtop) for all 16 CAR BRDF cases are shown in Fig. 9. The white areas in each polar plot are devoid of AOD_cloudtop retrievals because there is no cloud detection and/or the observations fall outside the color ratio vs. reflectance lookup table domain including extreme viewing geometry. In almost all cases (a–p), the retrieved AOD_cloudtop shows a dependence on viewing zenith angle, whereby lower (higher) AOD_cloudtop values are associated with slant (near-nadir) viewing angles (see also Fig. 11 – scatter plots of AOD_cloudtop vs. COD). Such a gradient in the retrieved AOD_cloudtop can result from the limitations of the radiative transfer calculations at slant angles and the fact that CAR observations are interpreted within the lookup table after linearly interpolating between aerosol geometry nodes. The nodes in geometry used in the RT calculations include solar view zenith angles (sza_nodal), view zenith angles (vza_nodal), and relative azimuthal angles (raa_nodal) (see Table 2). Another salient feature of the retrieved AOD_cloudtop field is the intermittent patches of high AODs that extend in the viewing zenith direction along an azimuthal plane. A careful qualitative inspection of this feature with BRFs measured at 0.47 µm (see Fig. 5) and 0.87 µm (Fig. 6) reveals that the higher AODs are spatially collocated with relatively lower values of BRF, indicating that these observations belonged to clear-sky, partially cloudy sky, or thin heterogeneous scenes for which the assumption of fully overcast thick homogeneous pixels made in the CR algorithm breaks down. Under such situations, it is expected that the uncertainty in the retrieved AOD_cloudtop would be larger than the expected errors due to other algorithmic assumptions. This issue is explored further in Sect. 3.4 under the influence of 3D effects on the retrieved AOD_cloudtop and COD.
Another important observation in Fig. 9 is the increasing magnitudes of AOD above cloud for cases e, f, and g. Table 1 shows that the altitude of aircraft for these three cases was recorded as 1533 ± 2, 1814 ± 259, and 2646 ± 223 m a.m.s.l. It is expected that as the aircraft altitude moves higher in the atmosphere, the CAR sensor would see an aerosol layer of greater geometrical thickness, thereby resulting in greater aerosol extinction and AOD. The retrieved AOD_cloudtop for these cases precisely demonstrates this effect by showing increasing magnitudes for higher aircraft altitudes.
The color ratio algorithm, along with the above-cloud AOD, also co-retrieves aerosol-corrected cloud optical depth, which is shown in Fig. 10. Unlike aerosol fields seen both above and below the aircraft level with homogeneous distributions, the cloud optical depth fields retrieved from most of the cases show a great deal of variability along the azimuthal plane. Except for cases m, n, o, and p, all other cases (a through l) show overall higher cloud optical depth in the backscattering directions in the bottom hemisphere opposite to the Sun and between the azimuth angles 90 and 270∘. Unlike polar-orbiting satellite observations at a fixed geometry for a given overpass, the CAR measurements offer a complete picture over all the viewing directions relative to the Sun direction. This unique observational geometry provides increased information content that could allow quantification of the effects of angular reflectance distribution in remote sensing retrieval algorithms.
3.3 The relationship between AOD_cloudtop and COD
Figure 11 shows scatter plots of AOD_cloudtop vs. COD for view zenith angles 0–30∘ (blue), 30–60∘ (green), and 60–90∘ (red), which show very interesting patterns. The retrievals of AOD_cloudtop are found to exhibit a systematic dependence on COD (similar to an exponential decay function), especially the blue and green dots, and larger values of AOD_cloudtop correspond to lower values of COD crawling along the x axis on the right as COD increases. An exception to this rule are the retrievals made at higher view zenith angles of 60–90∘ (red), for which the retrieved ACAOD remains low (< 0.2) despite an increase in the COD, which seems unrealistic and confirms some of the limitations of the color ratio method. Another exception is seen in cases e, f, and g, for which AOD_cloudtop vs. COD shows no clear dependence on viewing zenith angle and COD was around 5, indicating that these observations belonged to clear-sky, partially cloudy sky, or thin heterogeneous scenes for which the assumption of fully overcast thick homogeneous pixels made in the CR algorithm breaks down. The relationship between the two retrieved quantities appears to be confined for COD < 10, after which both retrievals are found to be unrelated to each other. Such observed dependence was expected as noticed in the color ratio algorithm introduced in Jethva et al. (2013). Uncertainties in satellite ACAOD inversion are known to be larger at lower CODs. This is because the retrieval domain space, i.e., color ratio versus reflectance at a longer wavelength, at lower CODs becomes narrower with steep changes in the color ratio, especially at COD < 10. Therefore, any uncertainty in the assumptions made in the retrieval algorithm, i.e., single-scattering albedo, an assumption of fully overcast pixels, and linear interpolation between the nodes whereby reflectances and the ratio of a joint aerosol–cloud scene behave nonlinearly, would result in the amplification of error in the retrieved ACAOD. These artifacts are more pronounced at lower values of both ACAOD and COD, for which uncertainties in the retrieved ACAOD could reach 40 % to 80 % at COD < 10 and ACAOD < 0.5 typically observed in the present CAR AOD retrievals (Jethva et al., 2013, Table II). Figure 11 results also suggest a strong inverse relationship between the AOD_cloudtop and COD for cases in which COD < 10 and a weaker inverse relationship for COD > 10. Additionally, studies (e.g., Torres et al., 2012; Jethva et al., 2018) have estimated uncertainty limits in ACAOD for a typical range of satellite viewing geometry (i.e., solar zenith angle 20–40∘, viewing zenith angle 0–40∘, and relative azimuth angle 100–150∘), while varying the single-scattering albedo and aerosol layer height. The error estimates of ACAOD, not reported in these papers, were found to be nearly stable as a function of geometry in the stated ranges. A nearly uniform retrieval of sky-looking AOD (above aircraft and clouds) shown for different CAR profiles in Fig. 8 further demonstrates the stability of the algorithm for a viewing zenith range 0–60∘. At slant angles > 60∘ and around the edge of the scan, the limitation of radiative transfer calculations due to its pseudo-spherical treatment in the RT code restricts the accuracy of AOD inversion. However, we note that no explicit cloud screening was performed on the measurements. All measurements go through the ACA algorithm whereby if they fit into the retrieval domain, i.e., color ratio vs. reflectance at 860 nm, then a corresponding retrieval of ACAOD and aerosol-corrected COD is obtained. It is possible that heterogeneity in aerosol and cloud fields in the observed scene can introduce uncertainty in the retrievals. For instance, a mixture of cloudy and cloud-free scenes observed in a particular measurements can affect both AOD and COD inversions.
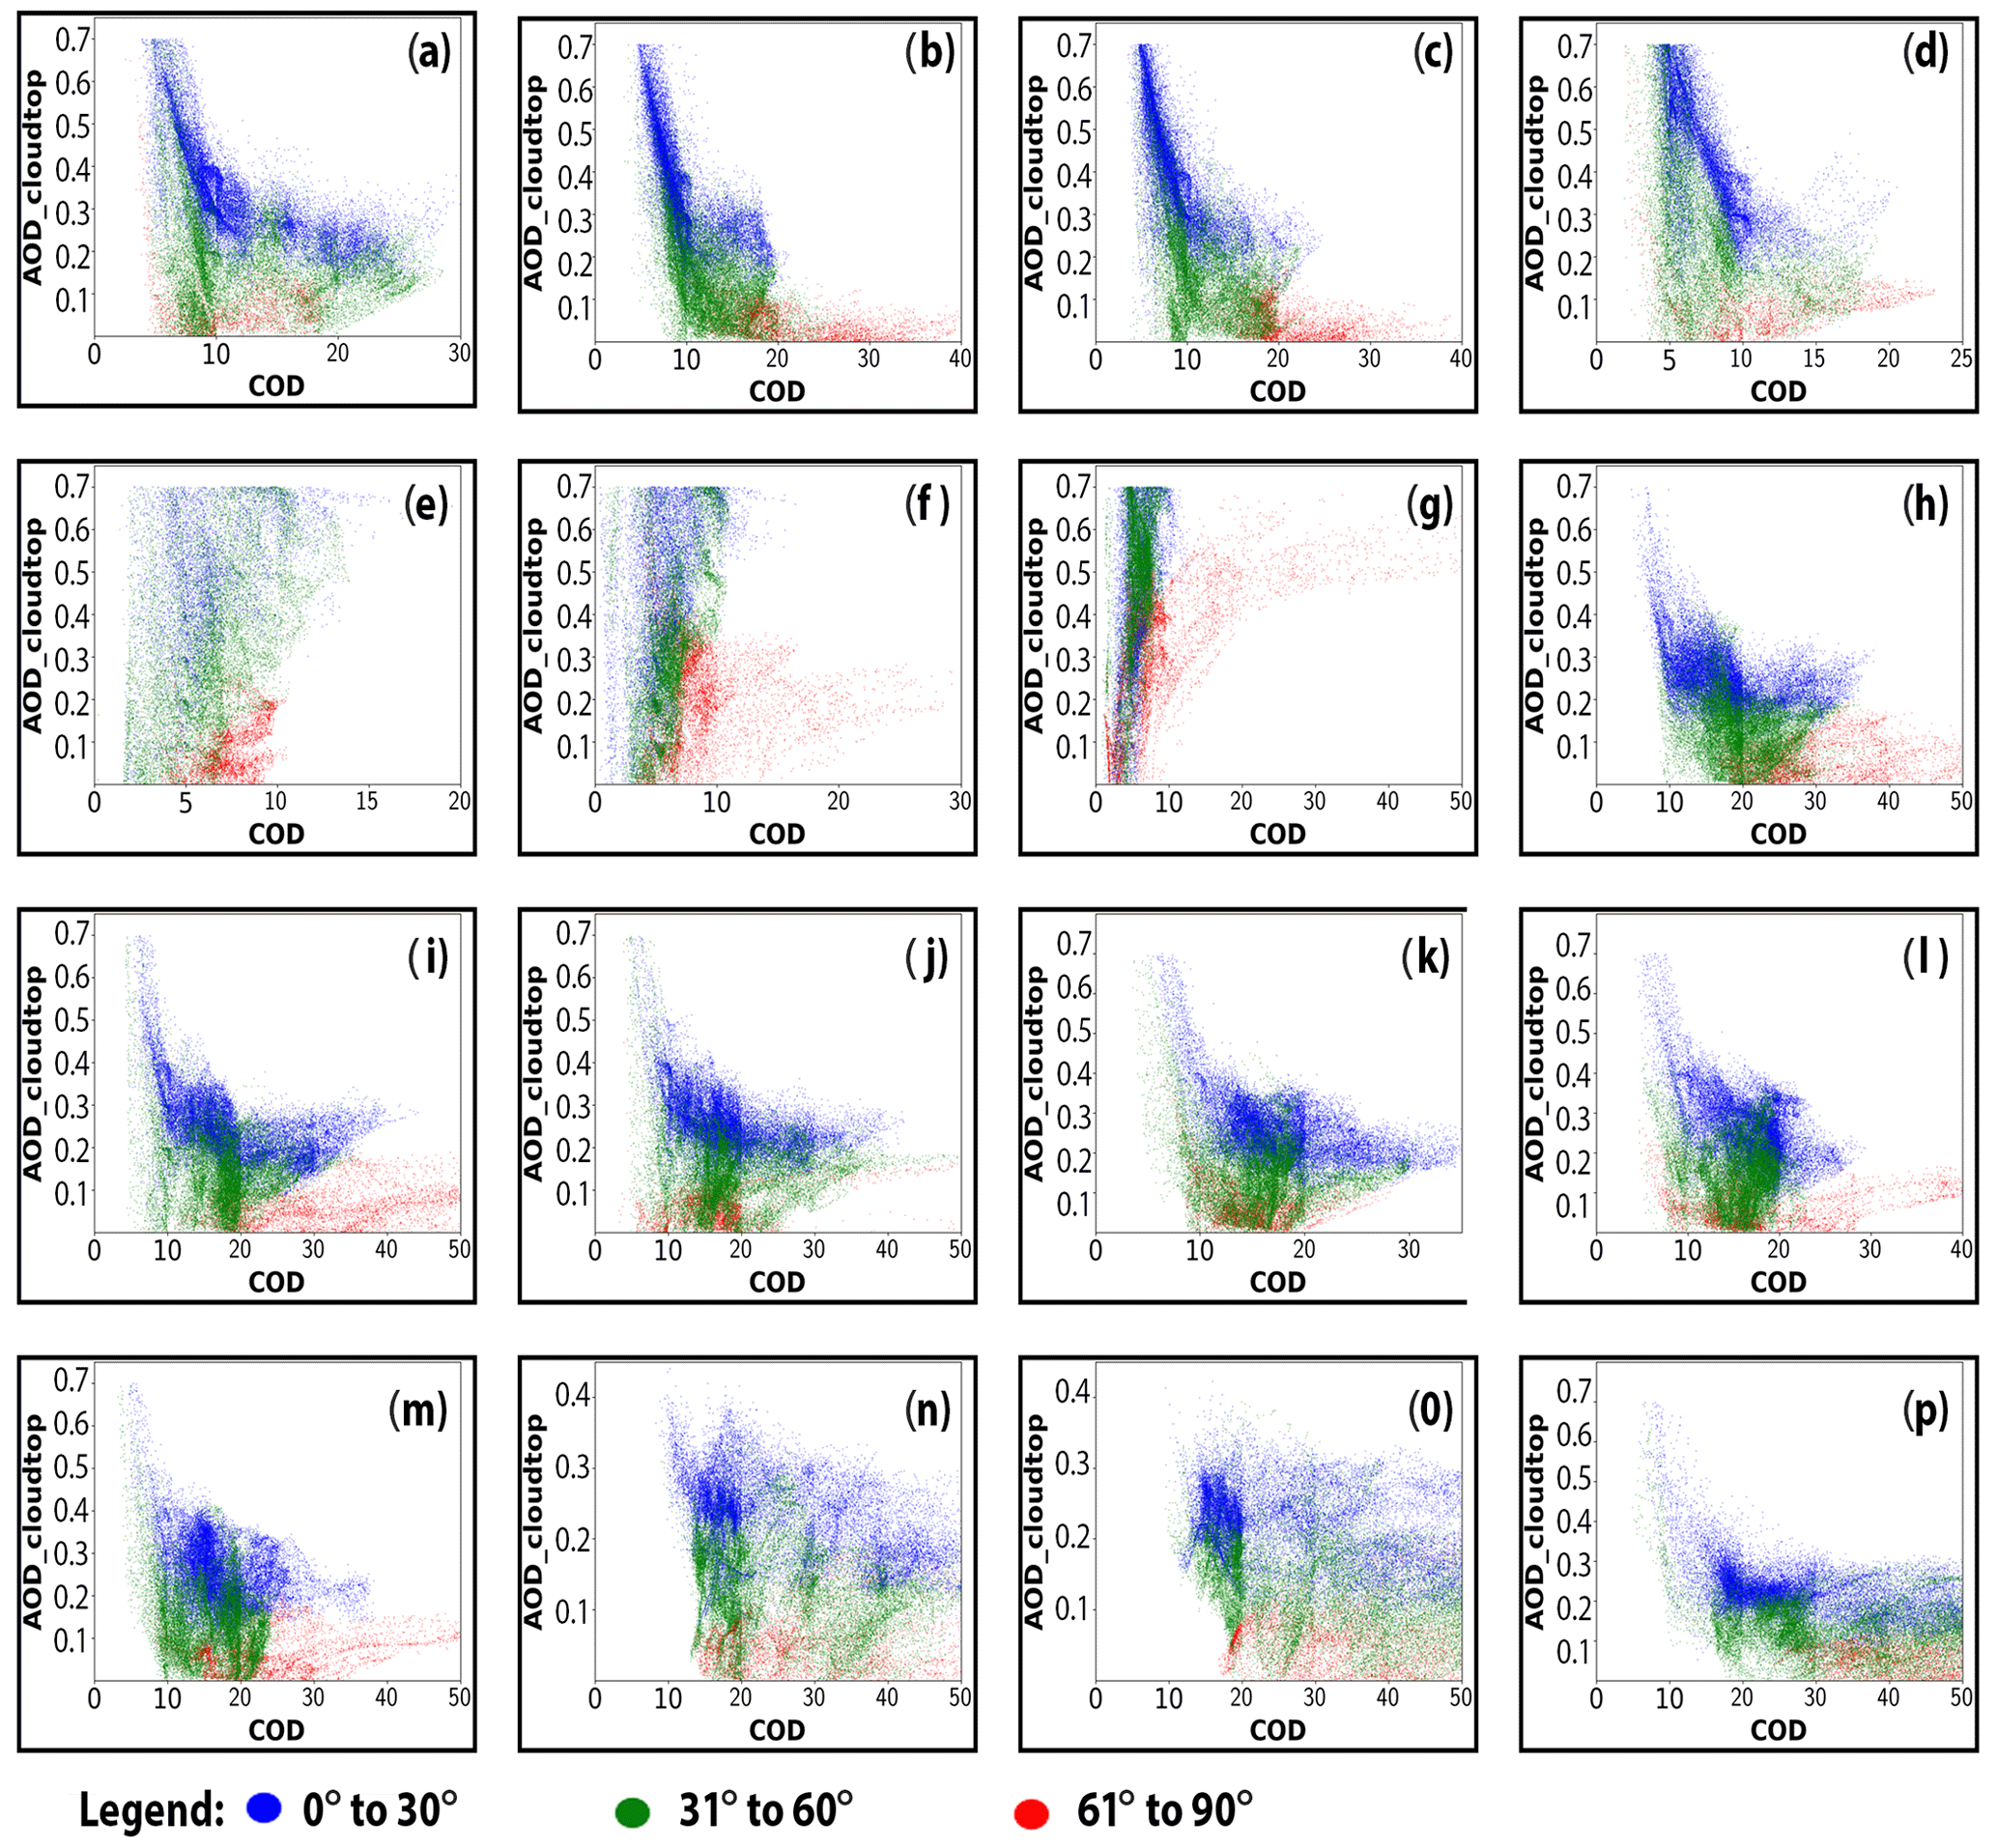
Figure 11Scatter plot ACAOD vs. COD for view zenith angles 0–30∘ (blue dots), 30–60∘ (green dots), and 60–90∘ (red dots).
Figure 12 shows the two main aerosol above-cloud-retrieved parameters, namely AOD_sky, when CAR views upward while flying above the cloud field, and the AOD below aircraft (AOD_cloudtop), when CAR views downward and measures the cloud field averaged over all the viewing directions (see also Table 1, columns 6–9). The summation of AOD_sky and AOD_cloudtop provides the column AOD above the stratocumulus cloud fields (ACAOD), as retrieved from CAR measurements over marine stratus clouds during SAFARI 2000 in the southeast Atlantic region. In addition to the two aerosol above-cloud parameters retrieved from CAR, Fig. 12 also shows simultaneous COD retrievals using CAR measurements and AOD retrievals from the AATS sun photometer that made coincident measurements of AOD on the UW CV-580 flights. The AOD retrievals from AATS are based on direct sun-photometer measurements and therefore represent aerosol loading above the aircraft level.
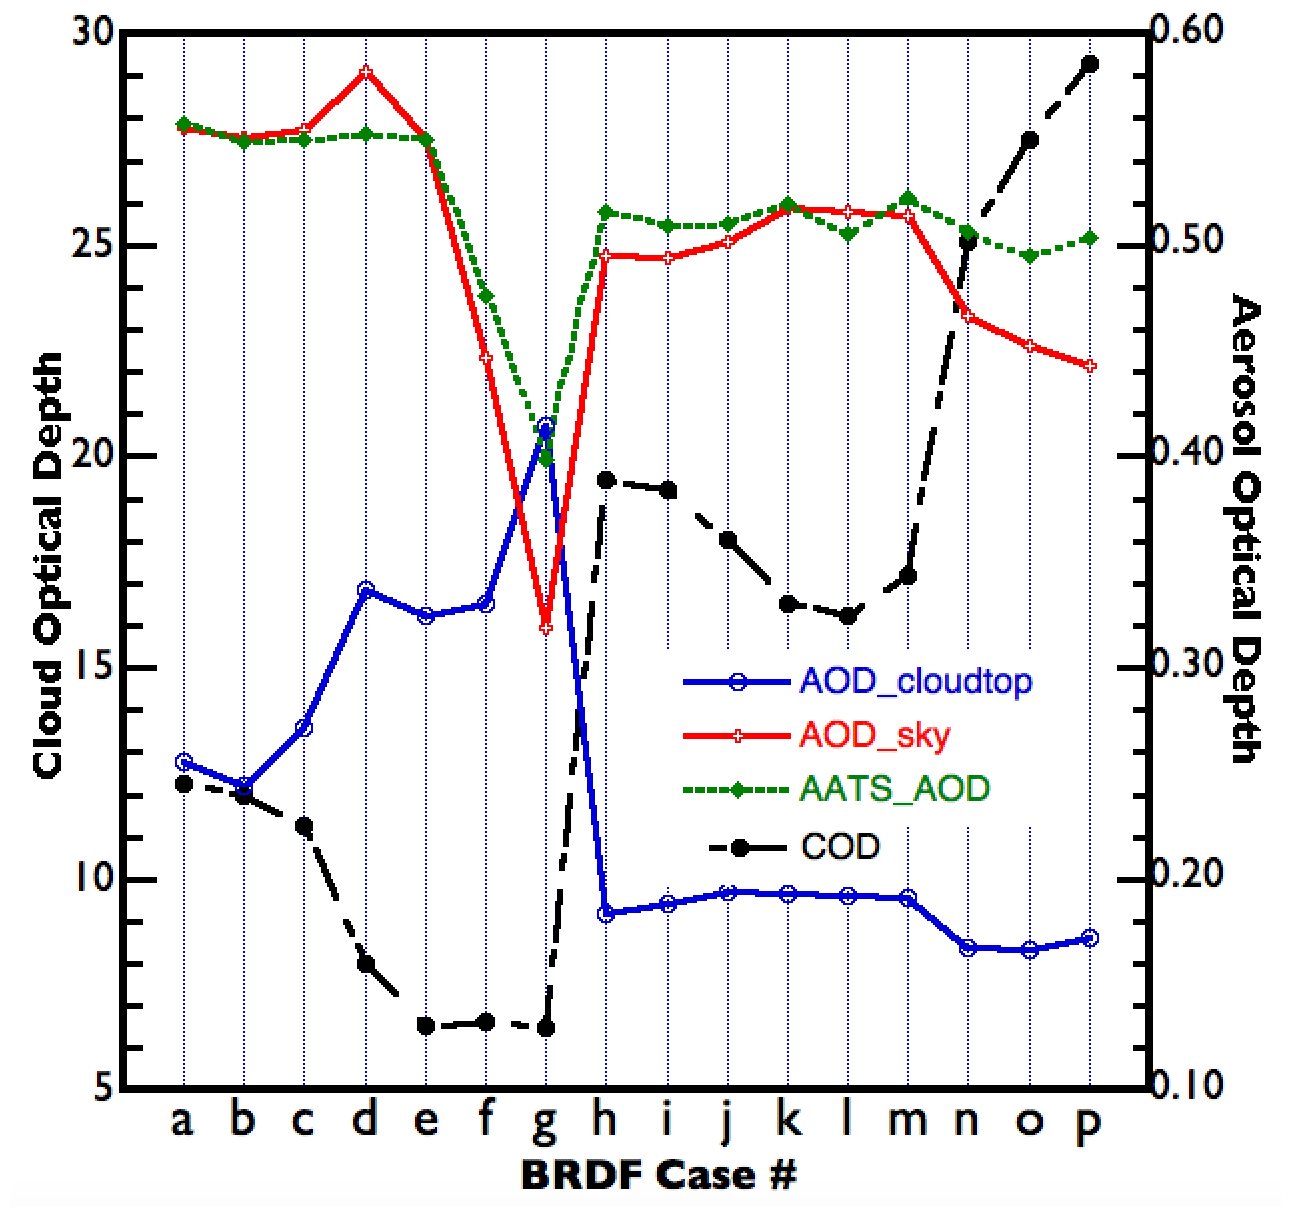
Figure 12Comparison of the retrieved parameters averaged over all the viewing directions for each case (a–p).
In the case of the flight transects shown in Fig. 1, the AATS AOD retrievals were largely obtained above the marine stratocumulus clouds. However, when the cloud top is well separated from the aircraft, i.e., the altitude of the aircraft is higher than that of the cloud tops, the AATS measurements do not capture the aerosol layer below the aircraft as the instrument is always pointing upwards toward the Sun. Therefore, the reported AOD data from AATS are not representative of the total column AOD above clouds unless the aircraft is flying at the same altitude at which the cloud top is located. Often, the altitude difference is not negligible; for example, during the SAFARI flights shown in Fig. 3, there was a clear separation of ∼ 600 m between the aircraft and cloud top. Specifically, the CAR-retrieved AOD_cloudtop captures this missing aerosol layer caught between the aircraft and cloud top, which is in addition to the AOD_sky retrieved above the aircraft level. The latter quantity is equivalent to that retrieved by AATS, whereas AOD_cloudtop is the remainder of the column AOD that we retrieve from CAR in this study. For these reasons, Jethva et al. (2016), in validating MODIS-retrieved ACAOD for the same 13 September 2000 AATS flight, extrapolated the airborne measurements from the respective altitudes to cloud top using detailed profile measurements and an associated altitude–AOD polynomial in order to make the comparisons between satellite and airborne measurements consistent.
To illustrate the various retrievals, we consider flight measurements from cases h–p. The CODs associated with marine stratocumulus clouds (cases h–m) vary between 15 and 20 (Fig. 12). These retrievals (for cases h–m) are based on relatively homogeneous clouds observed during the three separate circular measurements obtained from transects a–d, e–g, and h–p. These relatively homogeneous and similar sets of circular transects are also noted in the BRF polar plots shown in Fig. 6h–m. The simultaneous retrievals of Sky_AOD show moderately high aerosol loading, with an AOD of 0.5 across circles h–m, which is in very close agreement with the AATS_AOD retrievals. Consistency in AOD retrievals (above the aircraft level) between the two disparate measurement approaches, i.e., AATS and CAR, is generally found throughout the data obtained from the 16 cases (a–p), as indicated by the high correlation (R2 = 0.92) between the two retrievals shown in Table 1. However, the central distinction here is that the CAR approach also allows us to directly retrieve aerosols above clouds that are present below the aircraft level (AOD_cloudtop). For instance, in case h, the AOD_cloudtop is 0.18 and the Sky_AOD is 0.50, implying that the total above-cloud column AOD is 0.68 or 31 % higher relative to the AATS_AOD retrieval. Overall, we find AOD_cloudtop ranging between 0.18 and 0.41 from the 16 cases shown in Fig. 12, indicating a notable enhancement of the overall presence of aerosols above clouds. These observations show that a significant aerosol layer is not captured by the aircraft sun photometer, indicating the strength and effectiveness of nearly simultaneous multiangular measurements scanning the sky and surface, as demonstrated in this study using CAR measurements.
3.4 The influence of 3D effects on the retrieved ACAOD and COD
Numerous earlier studies indicate that passive remote sensing of both cloud and aerosol properties can be significantly impacted by three-dimensional (3D) radiative processes (e.g., Marshak and Davis, 2005; Wen et al., 2006; http://i3rc.gsfc.nasa.gov/Publications.htm, last access: 14 February 2021). Since the impact of 3D effects is different for different observations and retrieval algorithms (e.g., Cornet et al., 2018), we next examine the impact of 3D effects on the CAR aerosol and cloud retrievals discussed above. Our goal is not to provide quantitative estimates of 3D effects; instead we examine whether 3D effects are likely to play a substantial role in shaping the behavior of CAR-retrieved cloud and aerosol optical depths.
Our tests consider the scene shown in Figs. 5k, 6k, 9k, and 10k to be representative of heterogeneous areas with potentially significant 3D effects. The figures show that around the 60∘ azimuth angle, CAR observed a roughly 300 m wide and very long trough in which the retrieved COD drops by roughly 50 % (Fig. 10k), while the retrieved AOD_cloudtop increases by roughly 50 % (Fig. 9k). Figures 9, 10, and 11 show that this behavior is not unique and that in many cases with COD values below 10 or sometimes even 20, the retrieved AOD values increase sharply as COD decreases. In principle, this behavior appears consistent with earlier findings that showed 3D effects to increase retrieved AOD values for pixels that were surrounded by brighter (thick cloud-covered) areas (e.g., Wen et al., 2013).
Table 5Simulated CAR BRFs at the center of a hypothetical trough.
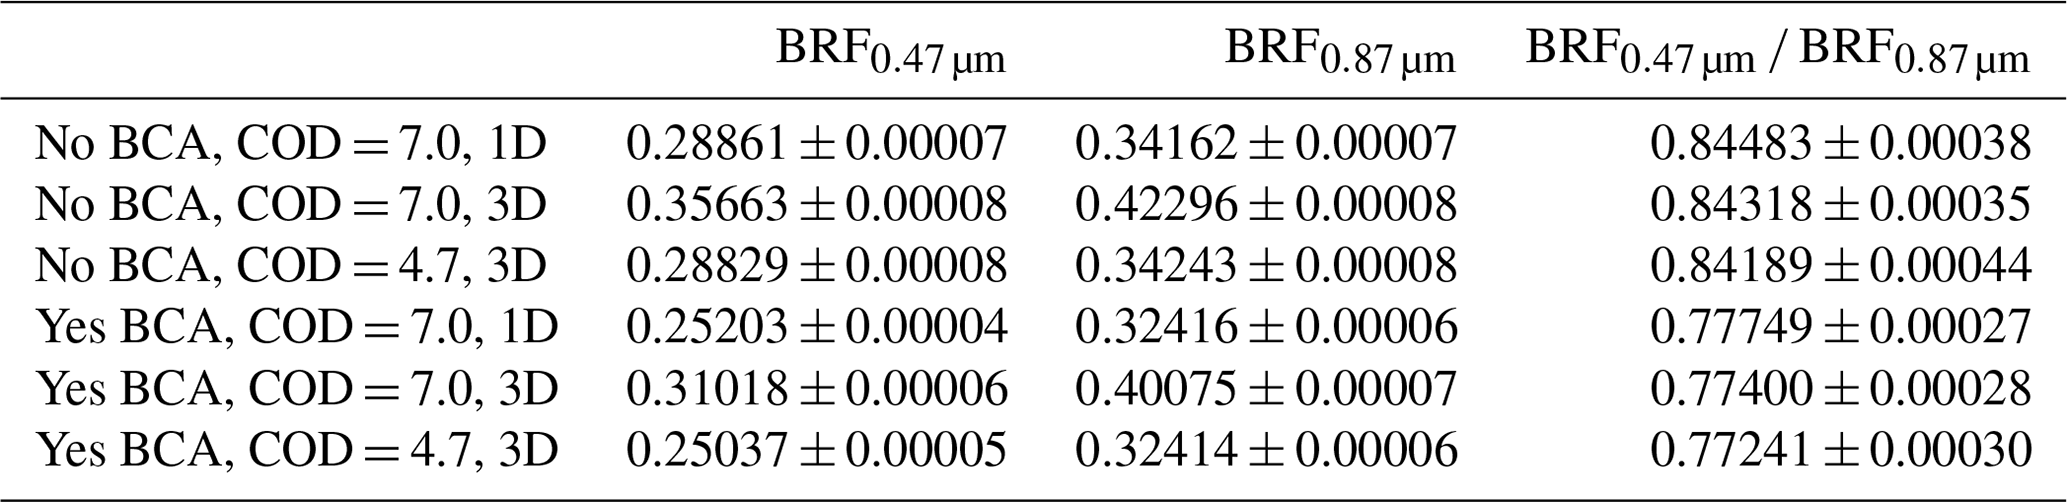
As discussed in Sect. 2.3, we examined the impact of 3D radiative effects through Monte Carlo simulations whose results are listed in Table 5. In each row of this table, the left column indicates whether or not below-CAR aerosols (BCAs) were considered, what the cloud optical depth was at the trough center, and whether the simulations considered 1D or 3D radiative processes. The indicated uncertainties come from Monte Carlo simulation noise.
Since COD retrievals are shaped mainly by the 0.87 µm reflectance values, 3D BRFs exceeding 1D BRFs by about 25 % for COD = 7 indicate that 3D radiative processes significantly enhance CAR BRFs and thus the COD values retrieved in the center of the trough, which means that 3D effects make the COD drop in the trough appear less deep than it really is. This behavior is consistent with earlier studies showing that radiative smoothing (caused by the diffusion of photons scattered from thick to thin areas) makes horizontal cloud variability appear less strong than it really is. Several studies proposed counteracting this effect by artificially roughening the retrieved COD fields (e.g., Marshak et al., 1998; Zinner et al., 2006), but these methods have yet to gain wide usage. By performing additional simulations, we found that if we decreased COD at the center of the trough from 7 to 4.7, 3D simulations would yield 0.87 µm BRF values around 0.32, thus resulting in hypothetical retrievals yielding COD = 7 (similar to the actual CAR retrievals). We note, however, that the value of 4.7 depends on our assumption of cloud-base altitude (hence cloud geometrical thickness), so it is somewhat uncertain.
Regarding aerosol retrievals, we first examine how 3D radiative processes affect the key signal of our ACAOD retrievals, which is the impact of below-CAR aerosols (BCAs) on the BRF(0.47 µm) BRF(0.87 µm) color ratio (CR) values. Specifically, we compare the CR values for the BCA and no BCA cases and check whether the CR difference is similar in 1D and 3D radiative simulations.
While the calculations above use the retrieved value of COD = 7 at the center of the linear trough, we also tested whether the results change if the 3D simulations use COD = 4.7 instead.
These results indicate that 3D processes strengthen the impact of BCAs on CR values by about 3 %–10 %.
To estimate the impact of these CR changes on retrieved ACAOD values, we examined the nonlinearity of the CR–ACAOD relationship using additional 1D Monte Carlo simulations. These simulations used the same setup as in Table 2, except that below-aircraft ACAOD values were increased by 20 %. The simulations (identified by the subscript IBCA) gave BRFIBCA(0.47 µm) = 0.24523 ± 0.00004 and BRFIBCA(0.87 µm) = 0.32069 ± 0.00006, yielding CRIBCA = 0.76469 ± 0.00027. Comparing the impact of original and increased BCA amounts on CR gives
This indicates that a 20 % enhancement in ACAOD causes a 19 % enhancement in the CR signal, which implies that a 10 % change in CR is consistent with a 10 % × 20 19 = 10.5 % change in ACAOD. Considering the uncertainties, we can say that the 3 %–10 % impact of 3D effects on CR values corresponds to a 3 %–11 % impact on retrieved ACAOD values.
To understand this result, we need to consider both the radiative smoothing discussed above for COD retrievals and the 3D process often called “bluing” (e.g., Marshak et al., 2008). Bluing occurs when nearby thick clouds reflect more sunlight than the clouds in the field of view do, and some of the extra reflection is then scattered into the instrument field of view by air molecules and aerosol particles that reside between the cloud and the sensor. As expected, Table 5 reveals that 3D processes do indeed enhance BRFs: for COD = 7, BRF3D values exceed the corresponding BRF1D values at both 0.47 and 0.87 µm. However, the table also reveals that given a certain 0.87 µm BRF value, 3D and 1D processes yield fairly similar 0.47 µm BRFs and thus color ratios: BRF ≈ BRF and CR ≈ CR.
The weak impact of 3D effects on CR is likely due to two factors. First, while the bluing process implies a larger molecular and aerosol scattering enhancement at 0.47 µm than at 0.87 µm (i.e., a higher CR), this is partially compensated for by the aerosol absorption cross section being larger at 0.47 µm than at 0.87 µm. Second, many of the 3D effects that cause the enhancements apparent in Table 5 are likely caused by the in-cloud radiative smoothing process discussed above, which causes similar relative enhancements in the trough BRFs at 0.47 and 0.87 µm: cloud droplets, which cause radiative smoothing through multiple scattering, have similar scattering properties at 0.47 and 0.87 µm.
We note that simulations (not shown) indicate that 3D effects would have a similar or even weaker influence on ACAOD retrievals over the linear trough if the measurements were taken not by CAR flying only 600 m above the clouds but by a satellite passing overhead. This is because the compensating effect of aerosol scattering and absorption and the spectrally neutral in-cloud radiative smoothing cause 3D relative enhancements that are spectrally quite neutral.
Overall, the results discussed above imply that 3D radiative processes had a significant impact on retrieved cloud optical depths, but also that the 3D impact on retrieved ACAOD values is fairly small and is not the main reason for the retrieved ACAOD values increasing over thin clouds.
In conclusion, the study accomplished the simultaneous retrieval of above-cloud total aerosol optical depth (ACAOD) and aerosol-corrected cloud optical depth (COD) from airborne CAR measurements of cloud-reflected and sky radiances using the color ratio method. The ACAOD is partitioned between the AOD below the aircraft (AOD_cloudtop) and the AOD above the aircraft (AOD_sky) with full angular coverage provided by the CAR measurements. The study demonstrates a novel measurement approach for retrieving and quantifying aerosols above clouds, in particular recovering the aerosol layer between cloud tops and the aircraft level that is missed in typical airborne sun-photometer measurements of above-cloud aerosols. Overall, this work provides a path forward for filling a critical gap in aircraft-based sun-photometer measurement strategies that are currently used to validate satellite retrievals of the ACAOD.
The results show a strong anticorrelation between the AOD_cloudtop and COD for cases in which COD < 10 and a weaker anticorrelation for COD > 10. The impact of 3D radiative effects on the retrievals is examined, and the results show that at cloud troughs, 3D effects increase retrieved ACAOD by about 3 %–11 % and retrieved COD by about 25 %. This indicates that the color ratio method has little sensitivity to 3D effects at overcast stratocumulus cloud decks. The results also display good agreement between CAR and sun-photometer measurements of above-aircraft AOD. However, the results also show that the use of aircraft-based sun-photometer measurements to validate satellite retrievals of the ACAOD is complicated by the lack of information on AOD below the aircraft, indicating the strength and effectiveness of nearly simultaneous multiangular measurements scanning the sky and surface, as demonstrated in this study using CAR measurements.
Any custom computer code and/or algorithm used to generate results reported in the paper that are central to its main claims will promptly be made available upon request to editors, reviewers, and readers.
The primary data used in this study are from CAR, which are stored and distributed in NetCDF format by the NASA Earth Observing System Data and Information System (EOSDIS). The data used in this study are available at https://doi.org/10.5067/RAQCJ0SV90IE (Gatebe et al., 2019).
CKG and RP were responsible for data curation. CKG acquired funding. CKG, HJ, RG, and TV conducted the investigation. HJ and TV were responsible for the methodology, and RP was responsible for visualization. CKG wrote the original draft. CKG, HJ, RG, and TV wrote, reviewed, and edited the paper.
The authors declare that they have no conflict of interest.
We are grateful to all our colleagues, especially Michael D. King, who helped in many ways and made it possible to collect the analyzed observations.
This research has been supported by NASA's Atmospheric Composition Campaign Data Analysis and Modeling solicitation through cooperative agreement no. NNG11HP16A between the NASA Goddard Space Flight Center and the Universities Space Research Association.
This paper was edited by Sebastian Schmidt and reviewed by two anonymous referees.
Boucher, O., Randall, D., Artaxo, P., Bretherton, C., Feingold, G., Forster, P., Kerminen, V.-M., Kondo, Y., Liao, H., Lohmann, U., Rasch, P., Satheesh, S. K., Sherwood, S., Stevens, B. and Zhang, X. Y.: Clouds and Aerosols, in: Climate Change 2013: The Physical Science Basis. Contribution of Working Group I to the Fifth Assessment Report of the Intergovernmental Panel on Climate Change, edited by: Stocker, T. F., Qin, D., Plattner, G.-K., Tignor, M., Allen, S. K., Boschung, J., Nauels, A., Xia, Y., Bex, V., and Midgley, P. M., Cambridge University Press, Cambridge, United Kingdom and New York, NY, USA, 2013.
Cahalan, R. F., Oreopoulos, L., Marshak, A., Evans, K. F., Davis, A. B., Pincus, R., Yetzer, K., Mayer, B., Davies, R., Ackerman, T., Barker, H., Clothiaux, E., Ellingson, R., Garay, M., Kassianov, E., Kinne, S., Macke, A., O'Hirok, W., Partain, P., Prigarin, S., Rublev, A., Stephens, G., Szczap, F., Takara, E., Várnai, T., Wen, G., and Zhuravleva, T.: The International Intercomparison of 3D Radiation Codes (I3RC): Bringing together the most advanced radiative transfer tools for cloudy atmospheres, B. Am. Meteorol. Soc., 86, 1275–1293, 2005.
Cornet, C., C.-Labonnote, L., Waquet, F., Szczap, F., Deaconu, L., Parol, F., Vanbauce, C., Thieuleux, F., and Riédi, J.: Cloud heterogeneity on cloud and aerosol above cloud properties retrieved from simulated total and polarized reflectances, Atmos. Meas. Tech., 11, 3627–3643, https://doi.org/10.5194/amt-11-3627-2018, 2018.
Das, S., Harshvardhan, H., and Colarco, P. R.: The influence of elevated smoke layers on stratocumulus clouds over the SE Atlantic in the NASA Goddard Earth Observing System (GEOS) model, J. Geophys. Res.-Atmos., 125, e2019JD031209, https://doi.org/10.1029/2019JD031209, 2020
De Graaf, M., Stammes, P., and E. Aben, A. A.: Analysis of reflectance spectra of UV-absorbing aerosol scenes measured by SCIAMACHY, J. Geophys. Res., 112, D02206, https://doi.org/10.1029/2006JD007249, 2007.
De Graaf, M., Tilstra, L. G., Wang, P., and Stammes, P.: Retrieval of the aerosol direct radiative effect over clouds from spaceborne spectrometry, J. Geophys. Res., 117, D07207, https://doi.org/10.1029/2011JD017160, 2012.
Duynkerke, P. G. and Teixeira, J., A comparison of the ECMWF Reanalysis with FIRE I observations: Diurnal variation of marine stratocumulus, J. Climate, 14, 1466–1478, 2001.
Feingold, G., Balsells, J., Glassmeier, F., Yamaguchi, T., Kazil, J., and McComiskey, A.: Analysis of albedo versus cloud fraction relationships in liquid water clouds using heuristic models and large eddy simulation, J. Geophys. Res.-Atmos., 122, 7086–7102, https://doi.org/10.1002/2017JD026467, 2017.
Gatebe, C. K. and King, M. D.: Airborne spectral BRDF of various surface types (ocean, vegetation, snow, desert, wetlands, cloud decks, smoke layers) for remote sensing applications, Remote Sens. Environ., 179, 131–148, https://doi.org/10.1016/j.rse.2016.03.029, 2016.
Gatebe, C. K., King, M. D., Platnick, S., Arnold, G. T., Vermote, E. F., and Schmid, B.: Airborne spectral measurements of surface-atmosphere anisotropy for several surfaces and ecosystems over southern Africa, J. Geophys. Res., 108, 8489, https://doi.org/10.1029/2002JD002397, 2003.
Gatebe, C. K., Dubovik, O., King, M. D., and Sinyuk, A.: Simultaneous retrieval of aerosol and surface optical properties from combined airborne- and ground-based direct and diffuse radiometric measurements, Atmos. Chem. Phys., 10, 2777–2794, https://doi.org/10.5194/acp-10-2777-2010, 2010.
Gatebe, C. K., Varnai, T., Poudyal, R., Ichoku, C., and King, M. D.: Taking the pulse of pyrocumulus clouds, Atmos. Environ., 52, 121–130, https://doi.org/10.1016/j.atmosenv.2012.01.045, 2012.
Gatebe, C. K., King, M., and Poudyal, R.: CAR Safari BRDF Measurements L1 V2, Greenbelt, MD, USA, Goddard Earth Sciences Data and Information Services Center (GES DISC), https://doi.org/10.5067/RAQCJ0SV90IE, 2019.
Gautam, R., Gatebe, C. K., Singh, M. K., Várnai, T., and Poudyal, R.: Radiative characteristics of clouds embedded in smoke derived from airborne multiangular measurements, J. Geophys. Res.-Atmos., 121, 9140–9152, 2016.
Herman, J. R., Bhartia, P. K., Torres, O., Hsu, C., Seftor, C., and Celarier, E.: Global distribution of UV-absorbing aerosols from Nimbus 7/TOMS data, J. Geophys. Res., 102, 16911–16922, https://doi.org/10.1029/96JD03680, 1997.
Holben, B. N., Eck, T. F., Slutsker, I., Tanre ́, D., Buis, J. P., Setzer, A., Vermote, E., Reagan, J. A., Kaufman, Y. J., Nakajima, T., Lavenu, F., Jankowiak, I., and Smirnov, A., AERONET – A Federated Instrument Network and Data Archive for Aerosol Characterization, Remote Sens. Environ., 66, 1–16, 1998.
Jethva, H., Torres, O., Remer, L., and Bhartia, P.: A Color Ratio Method for Simultaneous Retrieval of Aerosol and Cloud Optical Thickness of Above-Cloud Absorbing Aerosols From Passive Sensors: Application to MODIS Measurements, IEEE T. Geosci. Remote, 51, 3862–3870, https://doi.org/10.1109/TGRS.2012.2230008, 2013.
Jethva, H., Torres, O., Remer, L., Redemann, J., Livingston, J., Dunagan, S., Shinozuka, Y., Kacenelenbogen, M., Rosenheimer, M. S., and Spurr, R.: Validating MODIS above-cloud aerosol optical depth retrieved from “color ratio” algorithm using direct measurements made by NASA's airborne AATS and 4STAR sensors, Atmos. Meas. Tech., 9, 5053–5062, https://doi.org/10.5194/amt-9-5053-2016, 2016.
Jethva, H., Torres, O., and Ahn, C.: A 12-year long global record of optical depth of absorbing aerosols above the clouds derived from the OMI/OMACA algorithm, Atmos. Meas. Tech., 11, 5837–5864, https://doi.org/10.5194/amt-11-5837-2018, 2018.
Keil, A. and Haywood, J. M.: Solar radiative forcing by biomass burning aerosol particles during SAFARI 2000: A case study based on measured aerosol and cloud properties, J. Geophys. Res., 108, 8467, https://doi.org/10.1029/2002JD002315, 2003.
Kimes, D. S., Sellers, P. J., and Newcomb, W. W., Hemispherical reflectance variations of vegetation canopies and implications for global and regional energy budget studies, J. Clim. Appl. Meteorol., 26, 959–972, 1987.
King, M. D., Strange, M. G., Leone, P., and Blaine, L. R.: Multiwavelength scanning radiometer for airborne measurements of scattered radiation within clouds, J. Atmos. Ocean. Tech., 3, 513–522, https://doi.org/10.1175/1520-0426(1986)003<0513:MSRFAM>2.0.CO;2, 1986.
LeBlanc, S. E., Redemann, J., Flynn, C., Pistone, K., Kacenelenbogen, M., Segal-Rosenheimer, M., Shinozuka, Y., Dunagan, S., Dahlgren, R. P., Meyer, K., Podolske, J., Howell, S. G., Freitag, S., Small-Griswold, J., Holben, B., Diamond, M., Wood, R., Formenti, P., Piketh, S., Maggs-Kölling, G., Gerber, M., and Namwoonde, A.: Above-cloud aerosol optical depth from airborne observations in the southeast Atlantic, Atmos. Chem. Phys., 20, 1565–1590, https://doi.org/10.5194/acp-20-1565-2020, 2020.
Levy, R. C., Remer, L. A., and Dubovik, O.: Global aerosol optical properties and application to Moderate Resolution Imaging Spectroradiometer aerosol retrieval over land, J. Geophys. Res., 112, D13210, https://doi.org/10.1029/2006JD007815, 2007.
Marshak, A. and Davis, A. B.: 3D Radiative Transfer in Cloudy Atmospheres, Springer, Heidelberg, Germany, 686 pp., 2005.
Marshak, A., Davis, A., Cahalan, R., and Wiscombe, W.: Nonlocal Independent Pixel Approximation, direct and inverse problems, IEEE T. Geosci. Remote, 36, 192–205, https://doi.org/10.1109/36.655329, 1998.
Marshak, A., Wen, G., Coakley, J., Remer, L., Loeb, N. G., and Cahalan, R. F.: A simple model for the cloud adjacency effect and the apparent bluing of aerosols near clouds, J. Geophys. Res., 113, D14S17, https://doi.org/10.1029/2007JD009196, 2008.
Melnikova, I. and Gatebe, C. K.: Vertical Profile of Cloud Optical Parameters Derived from Airborne Measurements Above, Inside and Below Clouds, J. Quant. Spectrosc. Ra., 214, 39–60, https://doi.org/10.1016/j.jqsrt.2018.04.005, 2018.
Meyer, K., Platnick, S., Oreopoulos, L., and Lee, D.: Estimating the direct radiative effect of absorbing aerosols overlying marine boundary layer clouds in the southeast Atlantic using MODIS and CALIOP, J. Geophys. Res.-Atmos., 118, 4801–4815, https://doi.org/10.1002/jgrd.50449, 2013.
Nicodemus, F. E., Richmond, J. C., Hsia, J. J., Ginsberg, I. W., and Limperis, T.: Geometric considerations and nomenclature for reflectance, USA Department of Commerce/National Bureau of Standards, NBS Monogr., 160, 1–52, 1977.
Pistone, K., Redemann, J., Doherty, S., Zuidema, P., Burton, S., Cairns, B., Cochrane, S., Ferrare, R., Flynn, C., Freitag, S., Howell, S. G., Kacenelenbogen, M., LeBlanc, S., Liu, X., Schmidt, K. S., Sedlacek III, A. J., Segal-Rozenhaimer, M., Shinozuka, Y., Stamnes, S., van Diedenhoven, B., Van Harten, G., and Xu, F.: Intercomparison of biomass burning aerosol optical properties from in situ and remote-sensing instruments in ORACLES-2016, Atmos. Chem. Phys., 19, 9181–9208, https://doi.org/10.5194/acp-19-9181-2019, 2019.
Redemann, J., Wood, R., Zuidema, P., Doherty, S. J., Luna, B., LeBlanc, S. E., Diamond, M. S., Shinozuka, Y., Chang, I. Y., Ueyama, R., Pfister, L., Ryoo, J., Dobracki, A. N., da Silva, A. M., Longo, K. M., Kacenelenbogen, M. S., Flynn, C. J., Pistone, K., Knox, N. M., Piketh, S. J., Haywood, J. M., Formenti, P., Mallet, M., Stier, P., Ackerman, A. S., Bauer, S. E., Fridlind, A. M., Carmichael, G. R., Saide, P. E., Ferrada, G. A., Howell, S. G., Freitag, S., Cairns, B., Holben, B. N., Knobelspiesse, K. D., Tanelli, S., L'Ecuyer, T. S., Dzambo, A. M., Sy, O. O., McFarquhar, G. M., Poellot, M. R., Gupta, S., O'Brien, J. R., Nenes, A., Kacarab, M. E., Wong, J. P. S., Small-Griswold, J. D., Thornhill, K. L., Noone, D., Podolske, J. R., Schmidt, K. S., Pilewskie, P., Chen, H., Cochrane, S. P., Sedlacek, A. J., Lang, T. J., Stith, E., Segal-Rozenhaimer, M., Ferrare, R. A., Burton, S. P., Hostetler, C. A., Diner, D. J., Platnick, S. E., Myers, J. S., Meyer, K. G., Spangenberg, D. A., Maring, H., and Gao, L.: An overview of the ORACLES (ObseRvations of Aerosols above CLouds and their intEractionS) project: aerosol-cloud-radiation interactions in the Southeast Atlantic basin, Atmos. Chem. Phys. Discuss. [preprint], https://doi.org/10.5194/acp-2020-449, in review, 2020.
Roy, D. and Zhang, H.: NASA Global Web-Enabled Landsat Data Annual Global 30 m V031 [Data set], NASA EOSDIS Land Processes DAAC, https://doi.org/10.5067/MEaSUREs/GWELD/GWELDYR.031, 2019.
Sayer A. M., Hsu, N. C., Bettenhausen, C., Lee, J., Redemann, J., Schmid, B., and Shinozuka, Y.: Extending “Deep Blue” aerosol retrievalcoverage to cases of absorbingaerosols above clouds: Sensitivityanalysis and ?rst case studies, J. Geophys. Res.-Atmos., 121, 4830–4854, https://doi.org/10.1002/2015JD024729, 2016.
Schmid, B., Redemann, J., Russell, P. B., Hobbs, P. V., Hlavka, D. L., McGill, M. J., Holben, B. N., Welton, E. J., Campbell, J. R., Torres, O., Kahn, R. A., Diner, D. J., Helm- linger, M. C., Chu, D. A., Robles-Gonzalez, C., and de Leeuw, G.: Coordinated airborne, spaceborne, and ground-based measurements of massive thick aerosol layers during the dry season in southern Africa, J. Geophys. Res., 108, 8496, https://doi.org/10.1029/2002JD002297, 2003.
Shinozuka, Y., Saide, P. E., Ferrada, G. A., Burton, S. P., Ferrare, R., Doherty, S. J., Gordon, H., Longo, K., Mallet, M., Feng, Y., Wang, Q., Cheng, Y., Dobracki, A., Freitag, S., Howell, S. G., LeBlanc, S., Flynn, C., Segal-Rosenhaimer, M., Pistone, K., Podolske, J. R., Stith, E. J., Bennett, J. R., Carmichael, G. R., da Silva, A., Govindaraju, R., Leung, R., Zhang, Y., Pfister, L., Ryoo, J.-M., Redemann, J., Wood, R., and Zuidema, P.: Modeling the smoky troposphere of the southeast Atlantic: a comparison to ORACLES airborne observations from September of 2016, Atmos. Chem. Phys., 20, 11491–11526, https://doi.org/10.5194/acp-20-11491-2020, 2020.
Sinha, P., Hobbs, P. V., Yokelson, R. J., Blake, D. R., Gao, S., and Kirchstetter, T. W.: Distributions of trace gases and aerosols during the dry biomass burning season in southern Africa, J. Geophys. Res., 108, 4536, https://doi.org/10.1029/2003JD003691, 2003.
Spurr, R. J. D.: VLIDORT: A linearized pseudo-spherical vector discrete ordinate radiative transfer code for forward model and retrieval studies in multilayer multiple scattering media, J. Quant. Spectrosc. Ra., 102, 316–342, https://doi.org/10.1016/j.jqsrt.2006.05.005, 2006.
Swap, R., Annegarn, H. J., Suttles, J. T., Haywood, J., Helmlinger, M. C., Hely, C., Hobbs, P. V., Holben, B. N., King, M. D., Landmann, T., Maenhaut, W., Otter, L., Pak, B., Piketh, S. J., Platnick, S., Privette, J., Roy, D., Thompson, A. M., Ward, D. E., and Yokelson, R. J.: The Southern African Regional Science Initiative (SAFARI 2000), Overview of the dry season field campaign, S. Afr. J. Sci., 98, 125–130, 2002.
Torres, O., Bhartia, P. K., Herman, J. R., Ahmad, Z., and Gleason, J.: Derivation of aerosol properties from satellite mea- surements of backscattered ultraviolet radiation: Theoretical basis, J. Geophys. Res., 103, 17099–17110, https://doi.org/10.1029/98JD00900, 1998.
Torres, O., Jethva, H., and Bhartia, P. K.: Retrieval of Aerosol Optical Depth above Clouds from OMI Observations: Sensitivity Analysis and Case Studies, J. Atmos. Sci., 69, 1037–1053, https://doi.org/10.1175/JAS-D-11-0130.1, 2012.
Várnai, T., Marshak, A., and Yang, W.: Multi-satellite aerosol observations in the vicinity of clouds, Atmos. Chem. Phys., 13, 3899–3908, https://doi.org/10.5194/acp-13-3899-2013, 2013.
Várnai, T., Gatebe, C., Gautam, R., Poudyal, R., and Su, W.: Developing an Aircraft-Based Angular Distribution Model of Solar Reflection from Wildfire Smoke to Aid Satellite-Based Radiative Flux Estimation, Remote Sens., 11, 1509, https://doi.org/10.3390/rs11131509, 2019.
Waquet, F., Riedi, J., Labonnote, L. C., Goloub, P., Cairns, B., Deuzeand, J. -L., and Tanre, D.: Aerosol Remote Sensing over Clouds Using A-Train Observations, J. Atmos. Sci., 66, 2468–2480, https://doi.org/10.1175/2009JAS3026.1, 2009.
Wen, G., Marshak, A., and Cahalan, R. F.: Impact of 3D clouds on clear sky reflectance and aerosol retrieval in a biomass burning region of Brazil, IEEE Geosci. Remote S., 3, 169–172, https://doi.org/10.1109/LGRS.2005.861386, 2006.
Wen, G., Marshak, A., Levy, R. C., Remer, L. A., Loeb, N. G., Várnai, T., and Cahalan, R. F.,: Improvement of MODIS aerosol retrievals near clouds. J. Geophys. Res., 118, 9168–9181, https://doi.org/10.1002/jgrd.50617, 2013.
Wood, R.: Stratocumulus clouds, Mon. Weather Rev., 140, 2373–2423, https://doi.org/10.1175/MWR-D-11-00121.1, 2012.
Zibordi, G. and Voss, K. J., Geometric and spectral distribution of sky radiance: Comparison between simulations and field measurements, Remote Sens. Environ., 27, 343–358, 1989.
Zinner, T., Mayer, B., and Schröder, M.: Determination of three-dimensional cloud structures from high-resolution radiance data, J. Geophys. Res., 111, D08204, https://doi.org/10.1029/2005JD006062, 2006.