the Creative Commons Attribution 4.0 License.
the Creative Commons Attribution 4.0 License.
 | 24 Mar 2021
Performance evaluation of multiple satellite rainfall products for Dhidhessa River Basin (DRB), Ethiopia
Misgana Kebede Muleta
Berhan Gessesse Awoke
Precipitation is a crucial driver of hydrological processes. Ironically, a reliable characterization of its spatiotemporal variability is challenging. Ground-based rainfall measurement using rain gauges is more accurate. However, installing a dense gauging network to capture rainfall variability can be impractical. Satellite-based rainfall estimates (SREs) could be good alternatives, especially for data-scarce basins like in Ethiopia. However, SRE rainfall is plagued with uncertainties arising from many sources. The objective of this study was to evaluate the performance of the latest versions of several SRE products (i.e., CHIRPS2, IMERG6, TAMSAT3 and 3B42/3) for the Dhidhessa River Basin (DRB). Both statistical and hydrological modeling approaches were used for the performance evaluation. The Soil and Water Analysis Tool (SWAT) was used for hydrological simulations. The results showed that whereas all four SRE products are promising to estimate and detect rainfall for the DRB, the CHIRPS2 dataset performed the best at annual, seasonal and monthly timescales. The hydrological simulation-based evaluation showed that SWAT's calibration results are sensitive to the rainfall dataset. The hydrological response of the basin is found to be dominated by the subsurface processes, primarily by the groundwater flux. Overall, the study showed that both CHIRPS2 and IMERG6 products could be reliable rainfall data sources for the hydrological analysis of the DRB. Moreover, the climatic season in the DRB influences rainfall and streamflow estimation. Such information is important for rainfall estimation algorithm developers.
- Article
(2339 KB) - Full-text XML
- BibTeX
- EndNote


Precipitation is an important hydrological component (Behrangi et al., 2011; Meng et al., 2014). Accurate representation of its spatiotemporal variability is crucial to improve hydrological modeling (Grusson et al., 2017). Ironically, precipitation is one of the most challenging hydrometeorological data to be accurately represented (Yong et al., 2014). Climatic and topographic conditions are the primary factors that affect the accuracy of rainfall measurements.
Rainfall is measured either using ground-based (i.e., rain gauge and radar) or satellite sensors, in which all measurement methods exhibit limitations (Thiemig et al., 2013). In addition, commercial microwave links (CMLs) have been introduced recently as a cheap and fast rainfall estimation method (Smiatek et al., 2017), but they do not have a fully tested methodology (Nebuloni et al., 2020). Ground-based rainfall measurements using rain gauges are direct and generally accurate near the sensor location. However, rain gauges, for instance, either are of poor density to represent spatial and temporal variability in precipitation or may not even exist in many basins, especially in developing countries (Behrangi et al., 2011). Rain-gauge-based rainfall measurement techniques provide point measurements and are subject to missing data mainly due to measurement errors (Kidd et al., 2012; Maggioni et al., 2016). It may also be infeasible to install and maintain dense ground-based gauging stations in remote areas like mountains, deserts, forests and large water bodies (Dinku et al., 2018; Tapiador et al., 2012). On the other hand, radar-based rainfall measurement techniques cover larger areas and provide rainfall data at high spatial and temporal scales (Sahlaoui and Mordane, 2019). However, radar rainfall measurements have limitations due to the attenuation of the radar signal by several features that negatively affect the quality of rainfall measurement (Villarini and Krajewski, 2010; Berne and Krajewski, 2013; Sahlaoui and Mordane, 2019). Satellite-based rainfall estimates (SREs), however, provide high-resolution precipitation data including in areas where ground-based rainfall measurements are impractical, sparse or nonexistent (Stisen and Sandholt, 2010).
Consequently, high-resolution precipitation products have been developed over the last 3 decades. These products include Tropical Rainfall Measuring Mission (TRMM) Multi-satellite Precipitation Analysis (TMPA; Huffman et al., 2007), the Precipitation Estimation from Remotely Sensed Information using Artificial Neural Networks (PERSIANN; Sorooshian et al., 2000), Climate Prediction Center (CPC) morphing algorithm (CMORPH) (Joyce et al., 2004), African Rainfall Climatology (ARC; Xie and Arkin, 1995), Tropical Applications of Meteorology using SATellite (TAMSAT) (Maidment et al., 2017) and the Climate Hazards Group InfraRed Precipitation with Station data (CHIRPS) (Funk et al., 2015). The consistency, spatial coverage, accuracy and spatiotemporal resolution of SREs have been improved over time (Behrangi et al., 2011).
As indirect rainfall estimation techniques, SRE products possess uncertainties resulting from errors in measurement, sampling, retrieval algorithm and bias correction processes (Dinku et al., 2010; Gebremichael et al., 2014; Tong et al., 2014). Local topography and climatic conditions can also affect the accuracy of SRE estimation (Bitew and Gebremichael, 2011). Hence, SRE products should be carefully evaluated before using the products for any application. Statistical and hydrological modeling are two common methods for evaluating SREs. The statistical evaluation method examines the intrinsic precipitation data quality including its spatiotemporal characteristics via pairwise comparison of the SRE products and ground observations. Scale mismatches between area-averaged SRE data and point-like ground-based measurements are the most critical drawback. The hydrological modeling method evaluates the performance of an SRE product for a specific application such as streamflow predictive ability at watershed scale (Su et al., 2017). The two methods complement each other in that the statistical method provides information on data quality, while the hydrological model technique assesses the usefulness of the data for hydrological applications (Thiemig et al., 2013). However, most studies used only statistical evaluation methods (e.g., Dinku et al., 2018; Ayehu et al., 2018).
Studies have recommended SRE products for data-scarce basins (Behrangi et al., 2011; Bitew and Gebremichael, 2011; Thiemig et al., 2013). However, there is no consensus regarding the “best” SRE product for different climatic regions. Nesbitt et al. (2008) found that CMORPH and PERSIANN produced higher rainfall rates compared to TRMM for the mountain ranges of Mexico. Dinku et al. (2008) reported the better performance of the TRMM and CMORPH products in Ethiopia and Zimbabwe, whereas PERSIANN outperformed TRMM in South America according to de Goncalves et al. (2006). Interestingly, the performance of SRE products seems to differ even within a basin. For the Blue Nile Basin in Ethiopia, for example, CMORPH overestimated precipitation for the lowland areas but underestimated it for the highlands (Bitew and Gebremichael, 2011; Habib et al., 2012; Gebremichael et al., 2014). The discrepancy in the findings of these studies shows the performance of SREs varies with region, topography, season and climatic conditions of the study area (Kidd and Huffman, 2011; Seyyedi et al., 2015; Nguyen et al., 2018; Dinku et al., 2018). As such, many studies have recommended SRE evaluation at a local scale to verify its performance for specific applications (Hu et al., 2014; Toté et al., 2015; Kimani et al., 2017; Ayehu et al., 2018).
Studies have examined the performance of SREs in Ethiopia (Haile et al., 2013; Worqlul et al., 2014; Ayehu et al., 2018; Dinku et al., 2018). However, a majority of these studies used the statistical method to evaluate SREs, and no study has been completed for the Dhidhessa River Basin (DRB). With only 0.32 rain gauges per 1000 km2, the DRB meets the World Meteorological Organization (WMO) data-scarce basin classification (WMO, 1994). Evaluating the performance of various SRE products in terms of characterizing the spatiotemporal distribution of rainfall in the DRB could assist with the planning and management of existing and planned water resource projects in the river basin.
SREs have been continuously updated to minimize bias and uncertainty. Evaluating and validating improved products for various climatic regions would be valuable (Kimani et al., 2017). Recently improved SRE products include Tropical Rainfall Measuring Mission (TRMM) Multi-Satellite Precipitation Analysis version 7 (hereafter referred to as 3B43 for monthly and 3B42 for daily products), Climate Hazards Group InfraRed Precipitation with Station data version 2 (CHIRPS2), Tropical Applications of Meteorology using SATellite version 3 (TAMSAT3) and Integrated Multi-satellitE Retrievals for GPM version 6B (IMERG6). Studies have reported improvements in these new versions compared to their predecessors. However, to the best of the authors' knowledge, the rainfall detection and hydrological simulation capability of these SRE datasets were not evaluated for the basins in Ethiopia including the DRB. This study examined the latest SRE products in terms of their rainfall detection and estimation skills and how to improve the hydrological prediction for the DRB, a medium-sized river basin with scarce gauging data. As such, the objectives of this study were (1) to evaluate the intrinsic rainfall data quality and detection skills of multiple SRE products (i.e., 3B42/3, CHIRPS2, TAMSAT3 and IMERG6) and (2) to examine hydrological prediction performances of SREs for the DRB. The Soil and Water Assessment Tool (SWAT), a physically based semi-distributed model that has performed well in humid tropical regions like Ethiopia, was used for the hydrological simulation.
2.1 Descriptions of the study area
The Dhidhessa River drains into the Blue Nile River (Fig. 1). It is one of the largest and most important river basins in Ethiopia in terms of its physiography and hydrology (Yohannes, 2008). Located between 7∘42′43 to 10∘2′55′′ N latitude and 35∘31′23 to 37∘7′60′′ E longitude, the river basin exhibits highly variable topography that ranges from 619 m to 3213 m above mean sea level (amsl). The Dhidhessa River starts from the Sigmo mountain ranges and travels 494 km before it joins the Blue Nile River around the Wanbara and Yaso districts. The outlet considered for this study is the confluence of the Dhidhessa River and the Blue Nile River which covers a total drainage area of 28 175 km2. The river basin has many perennial tributaries (Fig. 1).

Figure 1Location map of Dhidhessa River Basin with ground stations (USGS, 1998).
Temperature and precipitation in the Dhidhessa River Basin exhibit substantial spatial and seasonal variability. The mean maximum and minimum daily air temperatures in the river basin range from 20–33 to 6–19 ∘C, respectively. The long-term mean annual rainfall ranges from 1200 to 2200 mm in the river basin. Soils in the DRB are generally deep and have high organic content, implying that they have high infiltration potential. The dominant soil type is Acrisols, while Cambisols and Nitisols are common (OWWDSE1). Igneous, sedimentary and metamorphic rocks are common, but igneous rock, particularly basalt, is dominant in the basin.2 Forest, shrubland, grassland and agriculture are the dominant land cover types in the basin (Kabite et al., 2020). Major crops include perennial and cash crops like coffee, mango and avocado (OWWDSE, 2014).
2.2 Data sources and descriptions
For this study, we used different spatial and temporal datasets such as a digital elevation model (DEM), climate, streamflow, soil and land cover from different sources (Table 1).
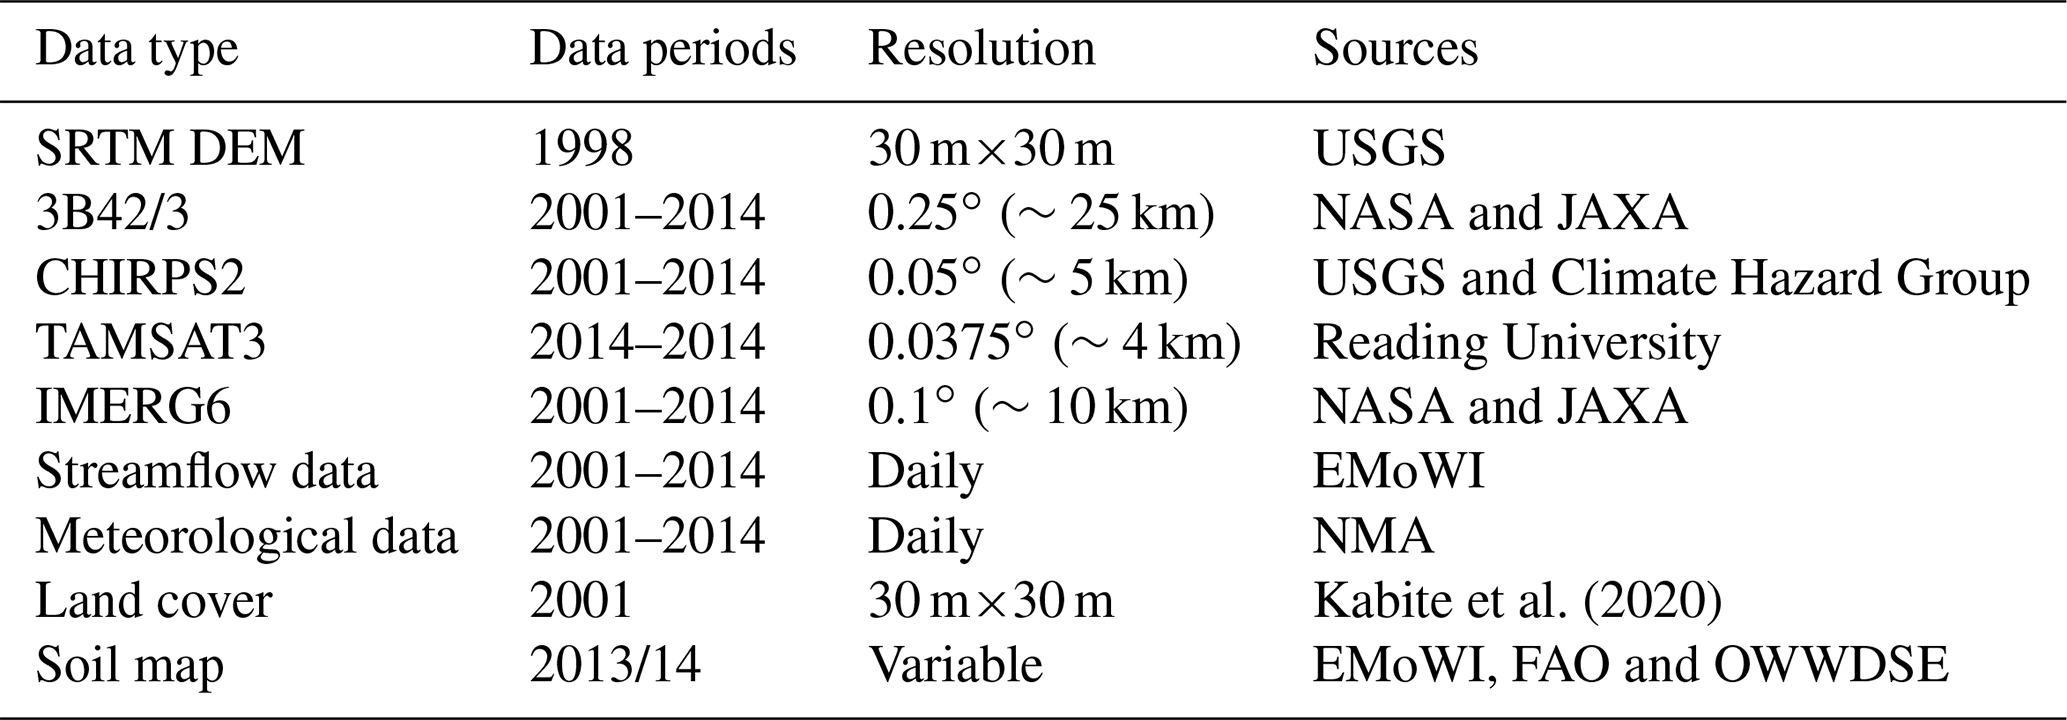
The DEM derived from the Shuttle Radar Topography Mission (SRTM) of 30 m×30 m spatial resolution was obtained from the United States Geological Survey (USGS). It is one of the input data for the SWAT model from which topographic and drainage parameters (e.g., drainage pattern, slope and watershed boundary) were derived. The soil map was obtained from the sources described in Table 1. The soil physical properties required for the SWAT model were derived from the soil map. The supervised image classification was used to prepare the land cover map of 2001. Together with the land cover and soil maps, a DEM was used to create hydrological response units (HRUs).
Rainfall data for nine stations within the river basin and for three nearby stations (Fig. 1) from 2001 to 2014 were obtained from the National Meteorological Agency (NMA) of Ethiopia. The rainfall data were used to evaluate the SREs using the statistical and hydrological modeling evaluation methods. In addition, Enhancing National Climate Service Time Series (ENACTS) gridded (4 m × 4 m) minimum and maximum air temperature data were obtained from the National Meteorological Agency (NMA) of Ethiopia. Daily streamflow data from 2001 to 2014 were obtained for a station near the town of Arjo (Fig. 1) from the Ethiopian Ministry of Water, Irrigation and Energy (EMoWI).
The hydrometeorological stations used for this study were selected due to their long-term records and better data quality. The observed streamflow was used to calibrate and validate the SWAT model. The land use map for 2001 and soil map were obtained from Kabite et al. (2020) and the Ethiopian Ministry of Water, Irrigation and Energy (EMoWI), respectively.
Satellite rainfall products
The satellite rainfall estimates (SREs) considered in this study include 3B42/3, TAMSAT3, CHIRPS2 and IMERG6. These datasets were selected because of several reasons including that they (i) have relatively high spatial resolutions, (ii) are gauge-adjusted products, (iii) are the latest products and have been found to perform well by recent studies, and (iv) were not compared for the basins in Ethiopia, particularly IMERG6.
The TMPA provides rainfall products for the area covering 50∘ N–50∘ S for the period of 1998 to the present at and 3 h spatial and temporal resolution, respectively. The 3 h rainfall product is aggregated to daily (3B42) and monthly (3B43) gauge-adjusted post-real-time precipitation. The performance of the 3B42v7 is superior compared to its predecessor (i.e., 3B42v6) and the real-time TMPA product (3B42RT) (Yong et al., 2014). The 3B43 was used in this study for the statistical evaluation, while the 3B42 was used for the hydrological performance evaluation. The detailed description is given by Huffman et al. (2007).
The TAMSAT3 algorithm estimates precipitation in an indirect method using the cloud-index method, which compares the cold cloud duration (CCD) with a predetermined temperature threshold. The CCD is the length of time that a satellite pixel is colder than a given temperature threshold. The algorithm calibrates the CCD using parameters that vary seasonally and spatially but are constant from year to year. This makes interannual variations in rainfall dependent only on the satellite observation. The dataset covers the whole of Africa at ∼4 km and 5 d (pentadic) resolutions for the period of 1983 to the present. The original 5 d temporal resolution is disaggregated to daily time steps using daily CCDs from which monthly data are derived. TAMSAT3 algorithm is improved compared to its processor (i.e., TAMSAT2). The details are described in Maidment et al. (2017).
The Climate Hazards Group InfraRed Precipitation with Stations (CHIRPS) is a quasi-global precipitation product at ∼5 km (0.05∘) spatial resolution and is available at daily, pentadic (5 d) and monthly timescales. The CHIRPS precipitation data are available from 1981 to the present. It is a gauge-adjusted dataset which is calculated using weighted bias ratios rather than using absolute station values, which minimizes the heterogeneity of the dataset (Dinku et al., 2018). The latest version of CHIRPS that uses more station data (i.e., CHIRPS version 2 hereafter CHIRPS2) was used in this study. A detailed description of CHIRIPS2 is given in Funk et al. (2015).
The Global Precipitation Measurement (GPM) is the successor of TRMM with better rainfall detection capability. GPM provides precipitation measurements at 0.1∘ and half-hourly spatial and temporal resolutions. Integrated Multi-satellitE Retrievals for GPM (IMERG) is one of the GPM precipitation products estimated from all constellation microwave sensors, infrared-based observations from geosynchronous satellites and monthly gauge precipitation data. IMERG is the successor algorithm of TMPA. The IMERG products includes Early Run (near real time with a latency of 6 h), Late Run (reprocessed near real time with a latency of 18 h) and Final Run (gauge-adjusted with a latency of 4 months). The IMERG Final Run product provides more accurate precipitation information compared to the near-real-time products as it is gauge-adjusted. The latest release of GPM IMERG Final Run version 6B (IMERG6) was used for this study. The details are described in Huffman et al. (2014).
In this study, the performances of 3B42/3, TAMSAT3, CHIRPS2 and IMERG6 rainfall products were evaluated statistically and hydrologically. All the SREs considered in this study are gauge-corrected, and thus bias correction may not be required. Therefore, rain gauge stations (e.g., Jimma and Nekemte) that were used for calibrating the SRE datasets were excluded for fair comparison. The lists of rain gauge stations used for this study are shown in Fig. 1 and Appendix Table A1. The detail summaries of the data types used for this study are shown in Table 1.
2.3 Methodology
Satellite rainfall estimates offer several advantages compared to the conventional methods but can also be prone to multiple errors. The rainfall detection capability of SREs can be affected by local climate and topography (Xue et al., 2013; Meng et al., 2014). Therefore, the performance of SREs should be examined for a particular area before using the products for any application (Hu et al., 2014; Toté et al., 2015; Kimani et al., 2017).
The two common SRE performance evaluation methods are statistical (i.e., ground truthing) and hydrological modeling performance (Behrangi et al., 2011; Bitew and Gebremichael, 2011; Thiemig et al., 2013; Abera et al., 2016; Jiang et al., 2017), and they were used in this study. The methods complement each other, and their combined application is recommended for more reliable SRE evaluation techniques. The statistical evaluation method involves a pairwise comparison of SREs and the rain gauge products. The method provides insight into the intrinsic data quality, whereas the modeling approach assesses the usefulness of the data for a desired application (Thiemig et al., 2013). Statistical evaluation was performed for all the SRE products considered in this study (i.e., 3B43, CHIRPS2, TAMSAT3 and IMERG6) to examine their rainfall detection skills. Continuous and categorical validation indices were used to evaluate the performance of the products. In addition, the SRE product and gauge datasets were independently used as forcing to calibrate and verify the SWAT model. Accordingly, streamflow prediction performance of the rainfall products was evaluated graphically and using statistical indices.
2.3.1 Statistical evaluation of satellite rainfall estimates
The statistical SRE evaluation method was conducted at monthly, seasonal and annual timescales for the overlapping period of all the rainfall data sources (i.e., 2001–2014). A daily comparison was excluded from this study due to weak performance reported in previous studies (Ayehu et al., 2018; Zhao et al., 2017; Li et al., 2018). This is attributed to the measurement time mismatch between ground and satellite rainfall products.
Two approaches are commonly used for the statistical evaluation method. The first approach is pixel-to-pixel pairwise comparisons of the spatially interpolated gauge-based and satellite-based data. The second approach is a point-to-pixel pairwise comparison in which satellite rainfall estimates are extracted for each gauge location, and the satellite-gauge data pairs are generated and compared. The second approach was used for this study. This is because the 12 rainfall stations considered in this study are too unevenly distributed throughout the basin to accurately represent spatial variability in rainfall in the DRB as required for the first approach. As a result, we chose to extract gauge–satellite rainfall pair values at each rain gauge location instead of interpolating the gauge measurements into gridded products.
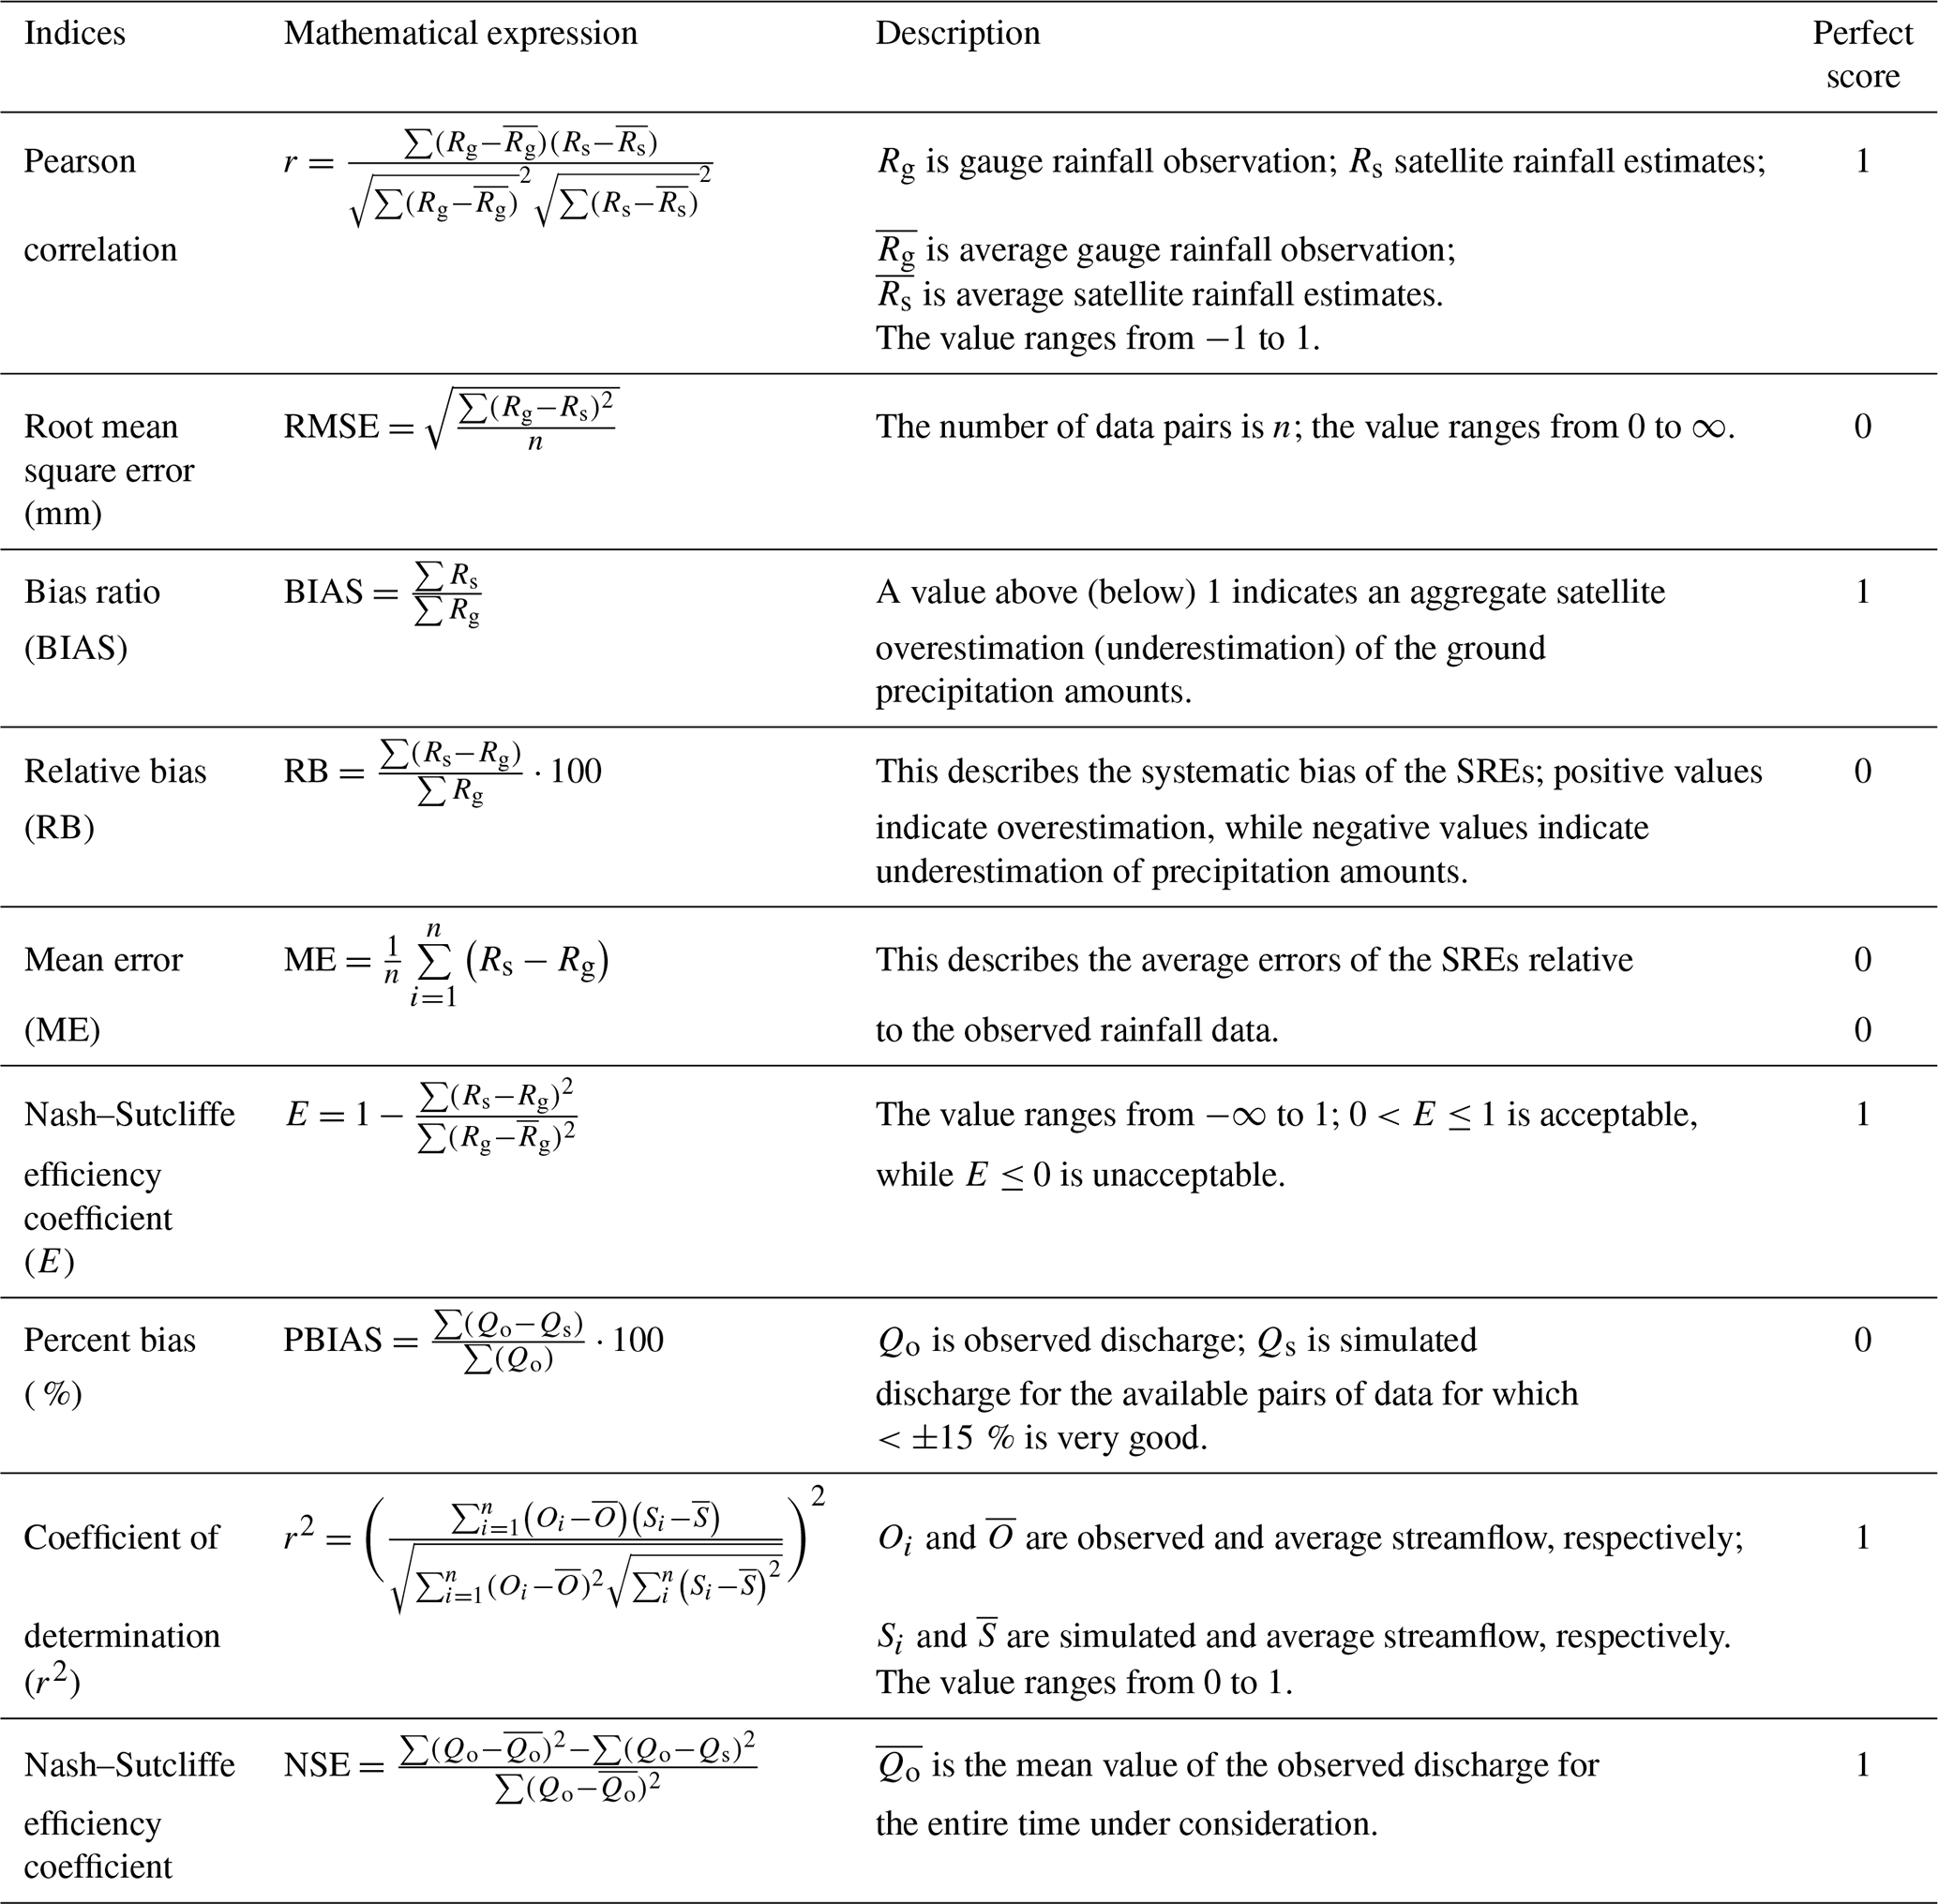
Accordingly, 168 and 2016 paired data points were extracted for annual and monthly analysis, respectively, and were evaluated using continuous validation indices such as Pearson correlation coefficient (r), bias ratio (BIAS), Nash–Sutcliffe efficiency (E) and root mean square error (RMSE). The Pearson correlation coefficient (r) evaluates how well the estimates correspond to the observed values, BIAS reflects how the satellite rainfall estimate over- or underestimates the rain gauge observations, and E shows how well the estimate predicted the observed time series. On the other hand, RMSE measures the average magnitude of the estimate errors. The summary of performance indices are presented in Table 2.
Table 2SRE evaluation indices, mathematical descriptions and perfect score.
In addition to the continuous validation indices, tercile categories (i.e., percentile-based evaluation) along with probability of exceedance were performed to test the performance of SREs in detecting low- and high-end values. The tercile (percentile) and probability of exceedance methods better evaluate the rainfall detection capabilities of SREs at monthly timescales compared to the other categorical indices such as probability of detection (POD), false alarm ratio (FAR) and critical success index (CSI). This is because the POD, FAR and CSI are not effective for monthly based analysis but effective for daily based analysis.
Tercile is a set of data that is partitioned into three equal groups each containing one-third of the total data. To calculate terciles, percentiles were used for this study. Accordingly, the low, middle and high terciles were defined using the 33rd, 67th and 100th percentiles. As such, the first 33rd percentile is named lower tercile (P33), the second 33rd percentile is named medium tercile (P67), and the third 33rd percentile is named higher tercile (P100). On the other hand, the probability of exceedance was calculated as a percentage of a given event to be equaled or exceeded.
where P represents the percentage probability that a given event will be equaled or exceeded, m represent ranks of the event value, with 1 being the largest possible value, and n is the total number of events or data points on record.
In general, SREs with r>0.7 and relative bias (RB) within 10 % can be considered as reliable precipitation measurement sources (Brown, 2006; Condom et al., 2011). However, attention should be given to certain indices depending on the application of the product (Toté et al., 2015). For flood forecasting purposes, for example, an underestimation of rainfall should be avoided (i.e., mean error, ME, >0 is desirable). In contrast, for drought monitoring, an overestimation must be avoided (i.e., ME<0 is preferred) (Dembélé and Zwart, 2016).
2.3.2 SWAT model setup
The Soil and Water Assessment Tool (SWAT) is a semi-distributed, deterministic and continuous simulation watershed model that simulates many water quality and quantity fluxes (Arnold et al., 2012). It is a physically based and computationally efficient model that has been widely used for various hydrological and/or environmental applications in different regions of the world (Gassman et al., 2014). Furthermore, the capability of the SWAT model to be easily linked with calibration, sensitivity analysis and uncertainty analysis tools (e.g., SWAT Calibration and Uncertainty Program, SWAT-CUP) made it more preferable.
The SWAT model follows a two-level discretization scheme: (i) subbasin creation based on topographic data and (ii) hydrological response unit (HRU) creation by further discretizing the subbasin based on land use and soil type. An HRU is a basic computational unit assumed to be homogeneous in hydrological response. Hydrological processes are first simulated at the HRU level and then routed at the subbasin level (Neitsch et al., 2009). The SWAT model estimates surface runoff using the modified United States Department of Agriculture (USDA) Soil Conservation Service (SCS) curve number method. In this study, a minimum threshold area of 400 km2 was used for determining the number of subbasins, and a 5 % threshold for the soil, slope and land use was used for the HRU definition. Accordingly, 13 subbasins and 350 HRUs are created for the Arjo gauging station as outlets.
2.3.3 SWAT model calibration and validation
The hydrological modeling performance evaluation technique is commonly performed by either calibrating the hydrological model with gauge rainfall data and then validating with SREs (i.e., static parameters) or calibrating and validating the model independently with each rainfall product (i.e., dynamic parameters) and then comparing accuracies of the streamflow predicted using the capacity of the rainfall products. The latter is preferred for watersheds such as the DRB where gauging stations are sparse and unevenly distributed. Moreover, studies have reported that independently calibrating the hydrological model with SREs and gauge data improves the performance of the hydrological model (Zeweldi et al., 2011; Vernimmen et al., 2012; Lakew et al., 2017).
The calibration, validation and sensitivity analysis of SWAT was done using the SWAT-CUP software. The sequential uncertainty fitting (SUFI-2) implemented in SWAT-CUP was used in this study (Abbaspour et al., 2007). SUFI-2 provides more reasonable and balanced predictions than the generalized likelihood uncertainty estimation (GLUE) and the parameter solution (ParaSol) methods (Zhou et al., 2014; Wu and Chen et al., 2015) offered by the tool. It also estimates parameter uncertainty attributed to input data and model parameter and structure as total uncertainty (Abbaspour, 2015). The total uncertainty in the model prediction is commonly measured by P factor and R factor. P factor represents the percentage of observed data enveloped by the 95 % prediction uncertainty (95PPU) simulated by the model. The R factor represents the ratio of the average width of the 95PPU band to the standard deviation of observed data. For realistic model prediction, P factor ≥0.7 and R-factor ≤1.5 are desirable (Abbaspour et al., 2007; Arnold et al., 2012).
The first steps in the SWAT model calibration and validation process is determining the most sensitive parameters for a given watershed. For this study, 19 parameters were identified based on the recommendations of previous studies (Roth et al., 2018; Lemann et al., 2019). Global sensitivity analysis was performed on the 19 parameters from which 11 parameters were found to be sensitive for the DRB, and they were used for the calibration, verification and uncertainty analysis. The hydrological simulations were performed for the 2001 to 2014 period. A 2-year spin-up (warm-up) period (i.e., 2001 and 2002), a 6-year calibration period (2003 to 2008) and a 6-year verification period (2009 to 2014) were used. Graphical and statistical measures were used to evaluate the prediction capability of the rainfall datasets. Accordingly, the performance of the model forced by each rainfall dataset was tested using the most widely used statistical indices (i.e., R2, NSE and PBIAS) in addition to the P factor and R factor.
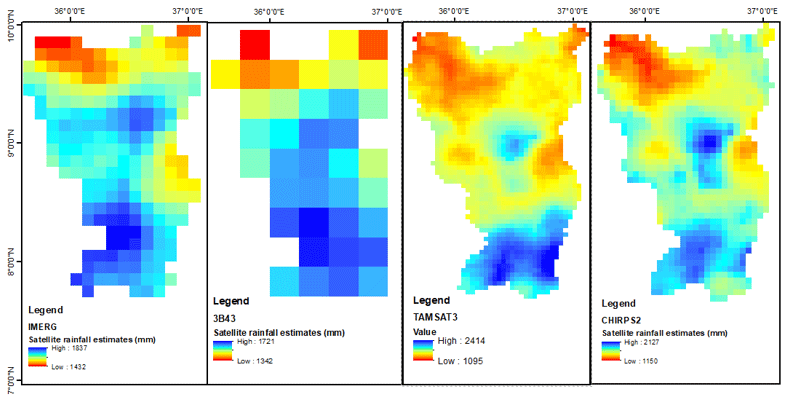
Figure 2Spatial mean annual rainfall distribution of the four SREs for the DRB (2001 to 2014).
3.1 Statistical evaluation
Figure 2 compares mean annual spatial rainfall distributions in the DRB. Average annual rainfall of the study area for the 2001 to 2014 period was 1682.09 mm yr−1 (1150 to 2127 mm yr−1), 1698.59 mm yr−1 (1432 to 1837 mm yr−1), 1699.06 mm yr−1 (1092 to 2414 mm yr−1) and 1680.28 mm yr−1 (1342 to 1721 mm yr−1) according to the CHIRPS2, IMERG6, TAMSAT3 and 3B43 products, respectively. For reference, mean annual rainfall for the DRB is 1650 mm yr−1 based on the rain gauge data, which is within 1.8 % to 3 % of the estimates provided by the products. However, total annual rainfall range estimates were substantially different among the products. The decreasing rainfall trend from the southern (highlands) to the northern (lowlands) part of the basin was captured by all products. In particular, TAMSAT3 and CHIRPS2 captured the rainfall variability in better detail perhaps due to their high spatial resolution. On the other hand, the resolution of the 3B43 rainfall product seems too coarse to satisfactorily represent spatial variability in rainfall in the basin.
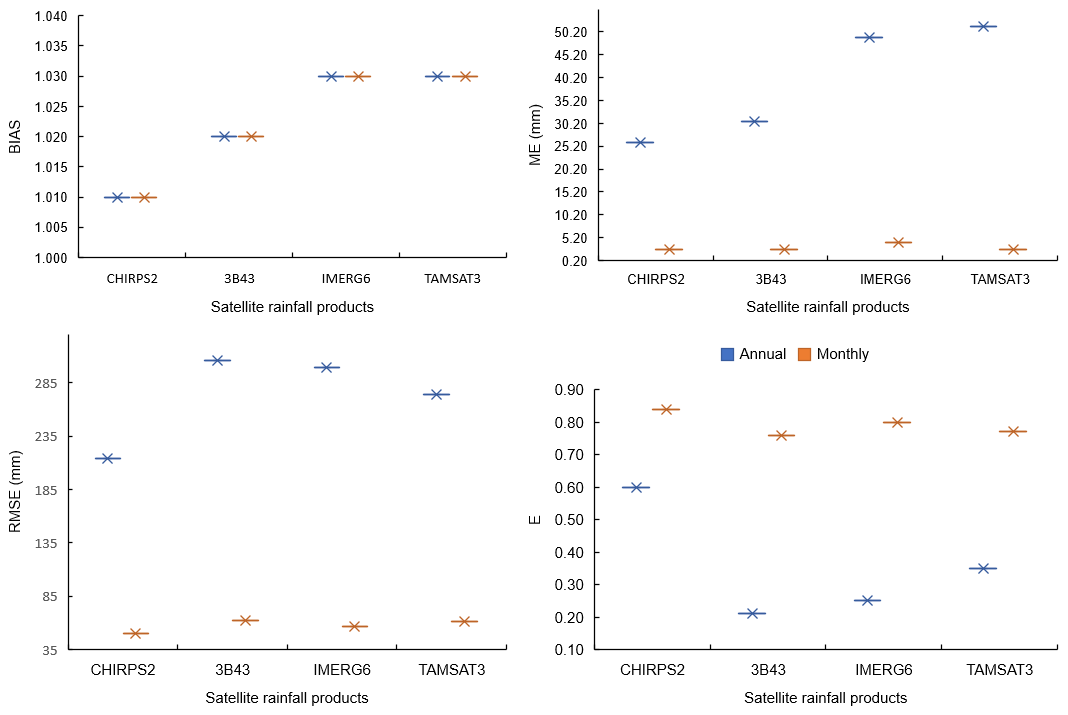
Figures 3 to 5 show the results of statistical evaluation indices calculated from rainfall from the rain gauges and from the SRE products. More specifically, Figs. 3 and 4 show correlation coefficients for the annual and monthly timescales, respectively. The results show that all four SRE products produced rainfall that correlates better with the ground-based rainfall observations at monthly timescales than at annual timescales. This is because the performance of SREs improved with increased time aggregation and peaks at monthly timescales. More likely, the seasonal variability is much larger than the interannual variability. The seasonal variability is, apparently, captured reasonably well, causing a higher degree of correlation for monthly data. The values of statistical evaluation indices for all products are summarized in Table 3. The results show that the CHIRPS2 performed better for the DRB with relatively higher r and E and lower BIAS, ME and RMSE for annual and monthly timescales, respectively.
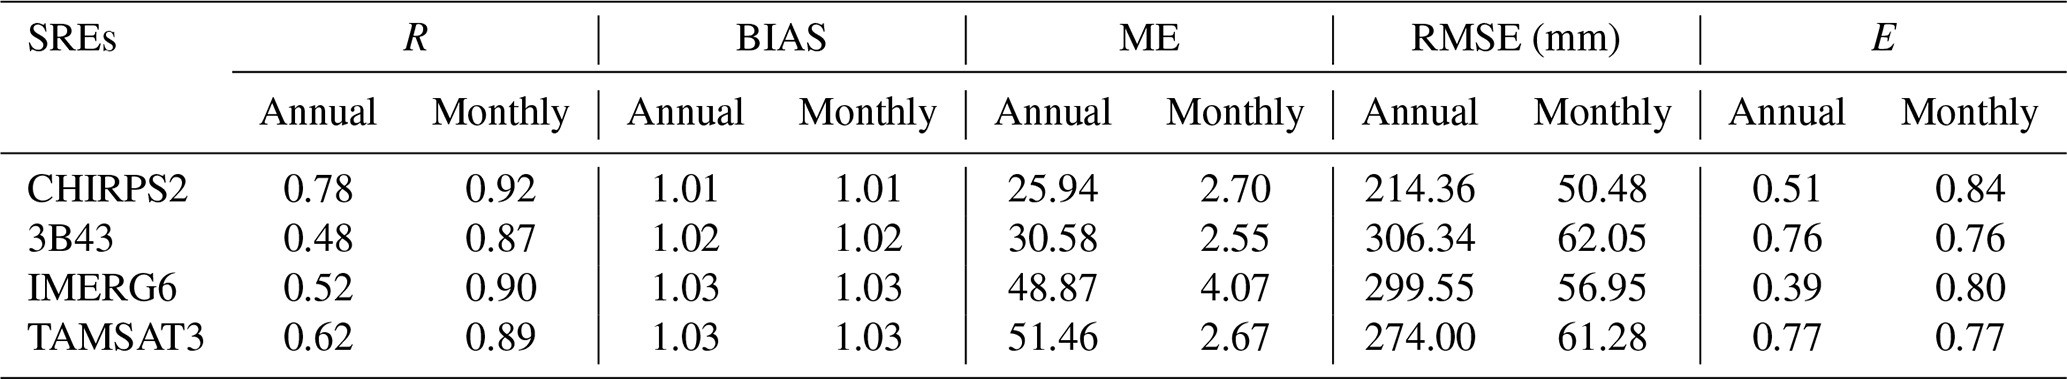
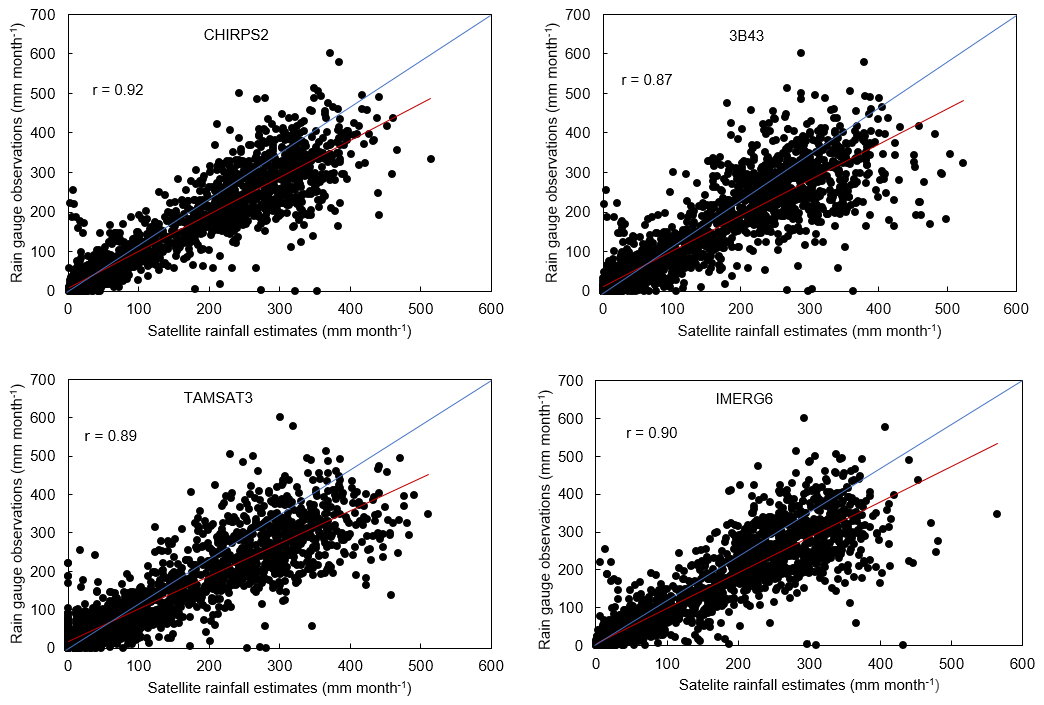
Figures 3 to 5 and Table 3 show that generally, CHIRPS2 performed better than the other three products for the DRB. Correlation coefficients for both monthly and annual timescales, as well as all the indices presented in Fig. 5, favor CHIRPS2, indicating its superior performance. The relative performance of the other three SREs is inconsistent as it varies with the statistical indices used in this study. The 3B43 product, for example, performed worse based on Figs. 3 and 4 (i.e., correlation coefficients for annual and monthly timescales) and RMSE and E (Fig. 5) but performed better than the other two SREs based on BIAS and ME.

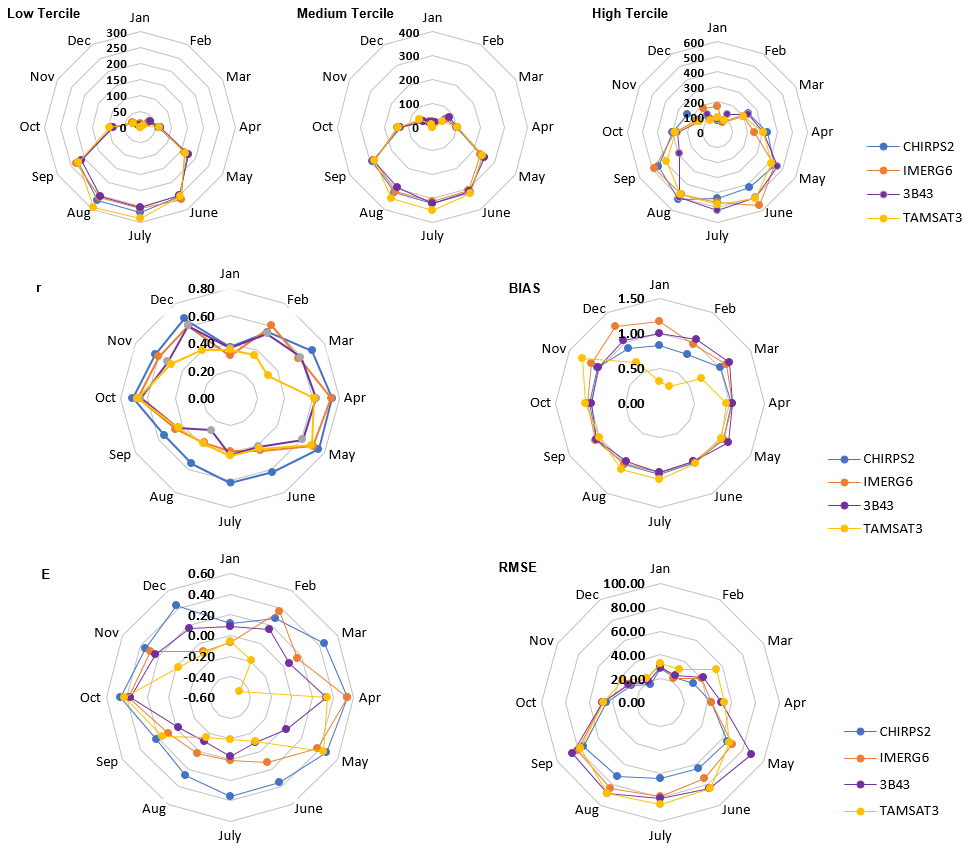
The tercile (percentile) categorical and probability of exceedance analysis results (Fig. 6) show that all the SREs considered in this study have a high rainfall detection capability for the DRB. Rainfall threshold used for this figure is 1 mm d−1. The lower tercile (33rd percentile; P33), middle tercile (67th percentile; P67) and higher tercile (100th percentile; P100) of all SREs have values closer to the corresponding gauge values, indicating that the SREs detect rainfall for the DRB. However, CHIRPS2, 3B43 and IMERG6 have lower tercile, medium tercile and higher tercile values much closer to the gauges, respectively. Moreover, the probability of exceedance further confirms the rainfall detection capability of the SREs considered in this study for the DRB. The probability of exceedance result indicated that TAMSAT3 has an 80 % probability to exceed 0 mm, whereas the other products have nearly 100 % probability. This is because TAMSAT3 has more observations with zero rainfall values compared to the other products. Overall, TAMSAT3 exhibited relatively less rainfall detection skill, which could be attributed to the relatively greater sensitivity of TAMSAT3 to topographic effects.

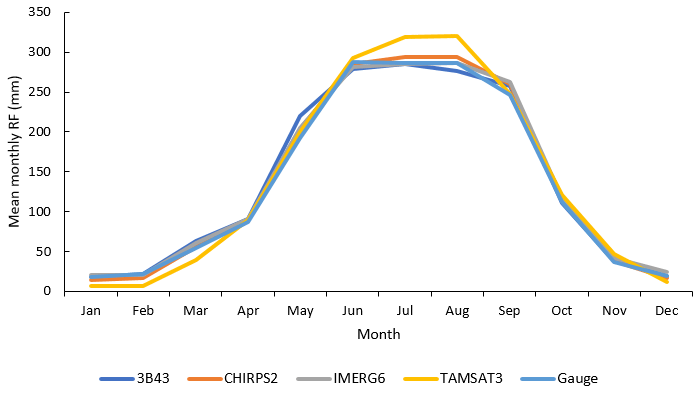
Figure 7 shows the seasonal SRE performance evaluation results. The figure generally shows that the performance of the SREs varied from season to season and among the rainfall products. The main rainy season in the DRB is from June to September, while a short rainy season ranges from March to May, but the rest is the dry season (Fig. 9). For example, CHIRPS2 is superior in detecting and estimating rainfall events for the DRB for all months (seasons). The rainfall detection and estimating capability of CHIRPS2 is better for the rainy season compared to the dry season. Likewise, the rainfall detection capability of TAMSAT3 is stronger for the rainy season (May to November) but weaker for the dry season (December to April). Compared to the other SRE products, TAMSAT3 generally poorly correlated for all months (seasons), and its BIAS was the highest for the rainy season but the lowest for the dry season.
3.2 Hydrological modeling performance evaluation
The centroid of each subbasin was used as gauging locations and used for extracting rainfall for all the SRE rainfall datasets. Thus, each subbasin is represented by a dense group of separate gauges unlike that of the measured rainfall representation. The performance of the rainfall products was evaluated using SWAT-CUP at monthly time steps.
Table 4 shows details of the calibrated parameters, including their ranges, best fit values and sensitivity ranks when different rainfall datasets are used as inputs for the DRB. The best fit values were multiplied by 1 plus the given value and replaced by the given value for the parameters with r prefix and v prefix. The table shows that ranges and the best fit values vary from one rainfall data source to another. This indicates the sensitivity of hydrological model performance to rainfall products, and thus the accurate characterization of rainfall variability is very critical for reliable hydrological predictions. This finding is consistent with studies that reported that different precipitation datasets influence model performance, parameter estimation and uncertainty in streamflow predictions (Sirisena et al., 2018; Goshime et al., 2019). The relative sensitivity of the parameters also varied between the rainfall datasets. In general, the threshold depth of water in the shallow aquifer required for return flow to occur (mm) (GWQMN.gw), base flow alpha factor (ALPHA_BF.gw), groundwater delay (day) (GW_DELAY.gw), deep aquifer percolation fraction (RCHRG_DP.gw), and runoff curve number for moisture condition II (CN2.mgt) are the top five sensitivity parameters. This seems to indicate that groundwater processes dominate streamflow in the DRB. This could be attributed to the dominantly deep and permeable soil, vegetated land surface, and dominant tertiary basaltic rocks in the DRB (Conway, 2000; Kabite and Gessesse, 2018). The groundwater parameters can have a strong effect on the amount of streamflow that can cause the over- or underestimation of streamflow. For this reason, the validation of streamflow was sorely dependent on the rainfall products.
Table 4Initial parameter ranges, fit values and sensitivity ranks for rainfall data sources.
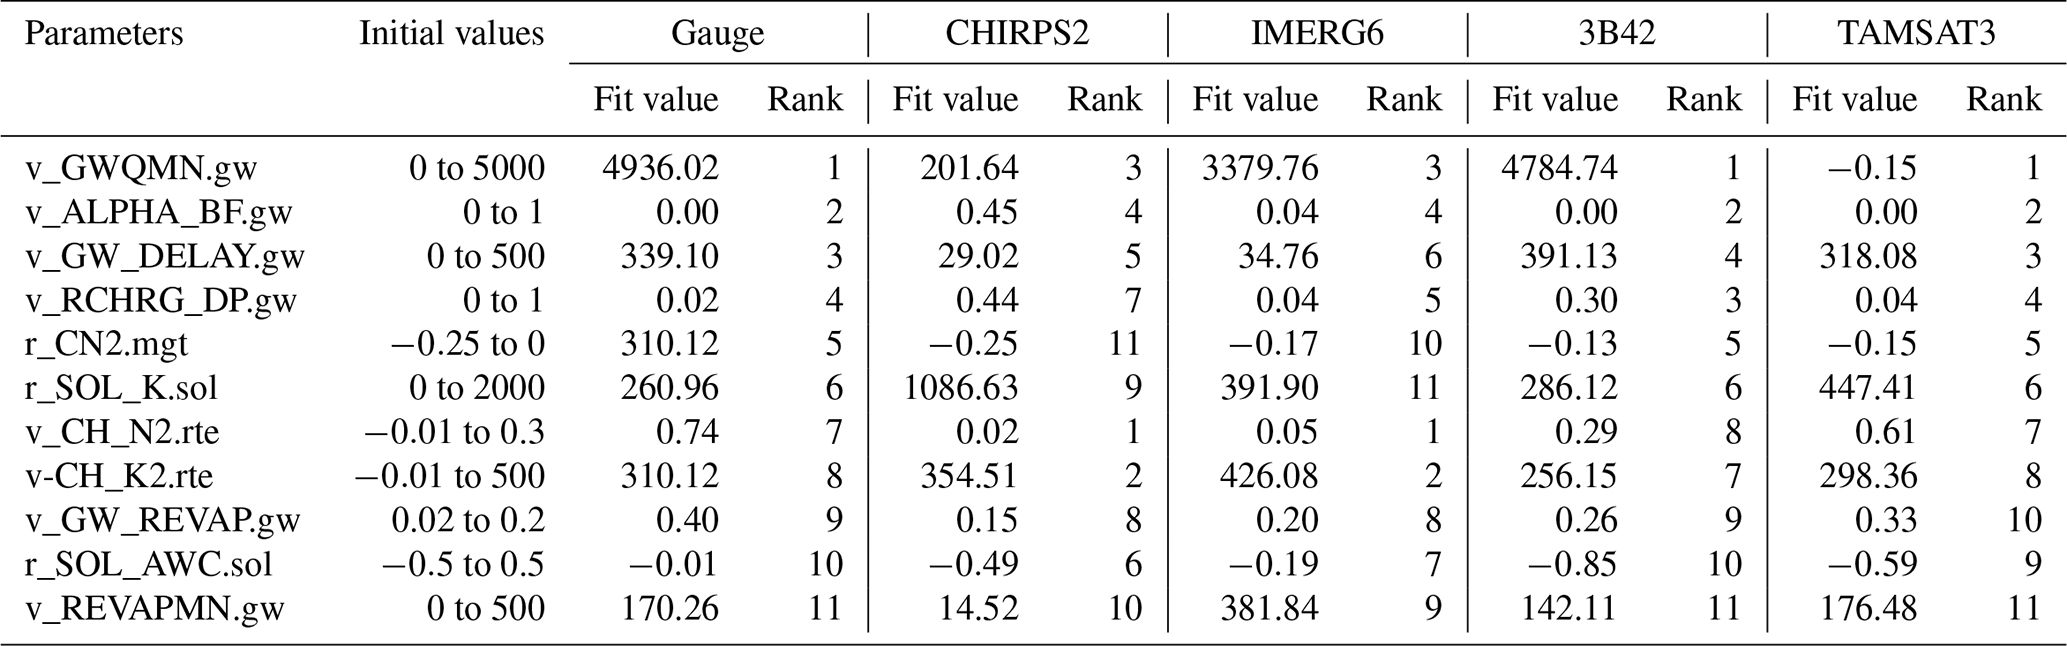
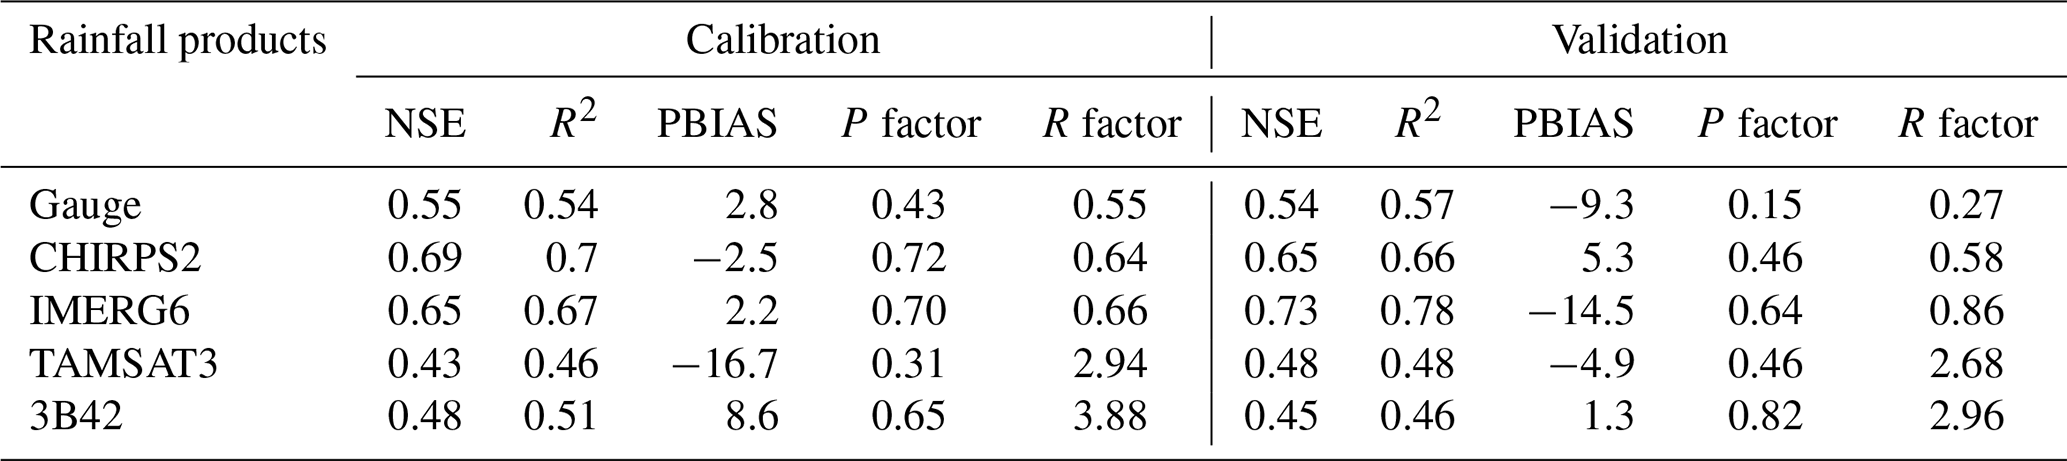
Figure 8 compares the observed and the predicted streamflows for the calibration (2003 to 2008) and verification (2009 to 2014) periods for all five rainfall datasets. The goodness of the streamflow predictions is also summarized in Table 5. The results show that the peak streamflow is underestimated for all rainfall products, including gauges, but the streamflow volume is generally overestimated. This could be due to the uncertainty in SREs for the extreme rainfall events at daily scales (Jiang et al., 2017) and the SWAT model errors. The overestimated streamflows could also be attributed to the overestimation of rainfalls by the SREs as described in the previous sections. Generally, the indices provided in Table 4 indicate that the streamflow predictions are good for CHIRPS2 and IMERG6 and satisfactory for the gauged rainfall but not for TAMSAT3 and 3B42 according to the classification system of Moriasi et al. (2007). The performance of the SREs is consistent with the climatology of the products. Mean monthly rainfall from 2001 to 2014 showed that TAMSAT3 and 3B42 deviate more from observed rainfall, while CHIRPS2 and IMERG6 are relatively closer (Fig. 9).
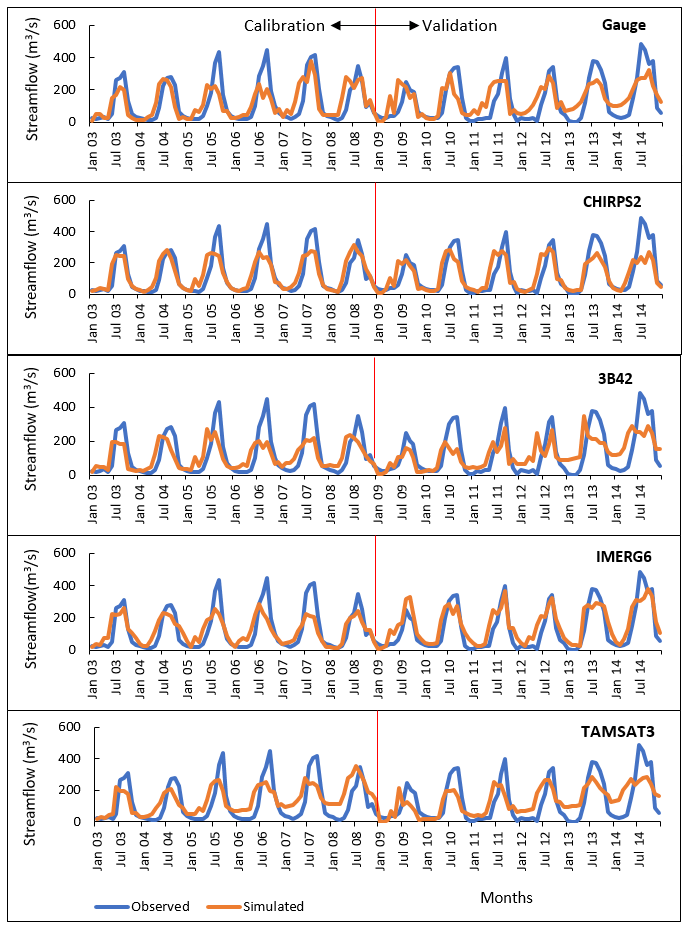
Table 5Calibration and validation results for the different rainfall products.
The statistical SRE evaluation results showed that all the rainfall products captured the spatiotemporal rainfall variability in the DRB except the 3B43. The poor performance of 3B43 in capturing the basin's rainfall variability is in agreement with findings of two previous studies done for other basins in Ethiopia (Dinku et al., 2008; Worqlul et al., 2014). The reasons could be attributed to the fact that gauge adjustment for the 3B43 product did not use adequate gauge data from Ethiopian highlands due to the lack of data (Haile et al., 2013) and coarse spatial resolution of the dataset (Huffman et al., 2007). However, Gebremicael et al. (2019) reported the better performance of 3B43 for the Tekeze–Atbara Basin, which is located in the northern mountainous area of Ethiopia.
A better correlation of SREs with observed rainfall was observed at monthly rather than at annual timescales for all products. This is consistent with studies that reported the performance of SREs improved with increased time aggregation that peaks at monthly timescales (Dembélé and Zwart, 2016; Katsanos et al., 2016; Zhao et al., 2017; Ayehu et al., 2018; Li et al., 2018; Guermazi et al., 2019). The weak agreement of SREs with observed data at annual timescales shows that the SREs considered in this study generally did not capture the interannual rainfall variability. In this regards, particularly the 3B43 product failed to capture annual rainfall variability compared to the other three SREs. Overall, all four SRE products overestimated rainfall for the DRB by 10 % for CHIRPS2 to 30 % for IMERG6 and TAMSAT3 (Fig. 5). This finding is consistent with studies that reported the overestimation of IMERG6 and 3B43 products for the alpine and gorge regions of China (Chen et al., 2019). However, Gebremicael et al. (2019) reported underestimation of rainfall by CHIRPS2 for the Tekeze–Atbara Basin, which is a mountainous and arid basin in northern Ethiopia. Ayehu et al. (2018) also reported a slight underestimation of rainfall by CHIRPS2 for the upper Blue Nile Basin. The discrepancy between our finding and the previous studies done for the basins in Ethiopia may be due to differences in watershed characteristics such as topography, vegetation cover and climatic conditions.
Generally, this study showed that the SRE products considered in this study exhibited a satisfactory rainfall detection and estimation capability for the DRB. The products could be applicable for flood forecasting applications for the DRB (Toté et al., 2015). CHIRPS2 performed better than the other three SREs for annual, seasonal and monthly timescales in detecting and estimating rainfall for the basin. The superiority of CHIRPS2 was also reported by previous studies for different parts of the world (Katsanos et al., 2016; Dembélé and Zwart, 2016), including basins in Ethiopia (Bayissa et al., 2017; Ayehu et al., 2018; Dinku et al., 2018; Gebremicael et al., 2019). For example, Dinku et al. (2018) reported better rainfall estimation capability of CHIRPS2 for eastern Africa compared to African Rainfall Climatology version 2 (ARC2) and TAMSAT3 products. Ayehu et al. (2018) reported the better performance of CHIRPS2 for the Blue Nile Basin compared to ARC2 and TAMSAT3. The better performance of CHIRPS2 has been attributed to the capability of the algorithm to integrate satellite, gauge and reanalysis products and its high spatial and temporal resolution (Funk et al., 2015). In contrast, generally, the 3B43 rainfall product performed poorly for the DRB for all timescales. This could be due to its coarse spatial resolution and lack of gauge adjustments for the highlands of Ethiopia (Haile et al., 2013). The IMERG6 showed a better rainfall detection and estimation capability for the study area than the 3B43 product, which is consistent with findings of previous studies (Huffman et al., 2015; Zhang et al., 2018, 2019). The better performance of IMERG6 is attributed to the inclusion of dual and high-frequency channels which improve light and solid precipitation detection capabilities (Huffman et al., 2015).
The hydrological simulation performance evaluation results of SREs showed that the accurate characterization of rainfall variability is very critical for reliable hydrological predictions. This finding is consistent with studies that reported that different precipitation datasets influence model performance, parameter estimation and uncertainty in streamflow predictions (Sirisena et al., 2018; Goshime et al., 2019). The overestimation of streamflow for all SRE products could result from uncertainty in SREs for extreme rainfall events at daily scales (Zhao et al., 2017). The overestimated streamflow could also be attributed to the overestimation of rainfalls by the SREs as described in the previous sections and the uncertainty in the SWAT model.
Overall, this study showed that CHIRPS2 and IMERG6 predicted streamflow better than the gauge rainfall and other two SRE products for the DRB. The superior hydrological performance of SRE products compared to gauge rainfall data was also reported by many other studies (Grusson et al., 2017; Bitew and Gebremichael, 2011; Goshime et al., 2019; Xian et al., 2019; Li et al., 2018; Belete et al., 2020). For example, Bitew and Gebremichael (2011) reported that satellite-based rainfall predicted streamflow better than gauge rainfall for complex high-elevation basins in Ethiopia. Likewise, a bias-corrected CHIRP rainfall dataset resulted in better streamflow prediction than a gauge rainfall dataset for the Ziway watershed in Ethiopia (Goshime et al., 2019).
The relatively poor performance of gauge rainfall compared to the CHIRPS2 and IMERG6 shows that the existing rainfall gauges do not represent spatiotemporal variability in rainfall in the DRB. The rain gauges are sparse, spatially uneven and incomplete records for the DRB. As previously mentioned, rain gauge density for the DRB is 0.32 per 1000 km2, which is much lower than the World Meteorological Organization (WMO) recommendation of one gauge per 100–250 km2 for mountainous areas of tropical regions such as the DRB (WMO, 1994).
In contrast to several previous studies on SRE evaluation, the present study combined statistical and hydrological performance evaluations in the data-scarce river basin of the upper Blue Nile Basin, the Dhidhessa River Basin. This method is important for identifying SREs that better detect and estimate rainfall and selecting application-specific rainfall products such as for hydrological and climate change studies. The results of this study also highlight the seasonal dependence of rainfall detection and hydrological performance capabilities of SREs for the DRB and similar basins in Ethiopia. In addition, the performance of IMERG6, which is the latest SRE product, was evaluated for Ethiopian basins for the first time. Overall, this study showed that CHIRPS2 and IMERG6 rainfall products performed best in terms of detecting and estimating rainfall, as well as predicting streamflow, for the DRB.
Satellite rainfall estimation is an alternative rainfall data source for hydrological and climate studies for data-scarce regions like Ethiopia. However, SREs contain uncertainties attributed to errors in measurement, sampling, retrieval algorithm and bias correction processes. Moreover, the accuracy of the rainfall estimation algorithm is influenced by topography and the climatic conditions of a given area. Therefore, SRE products should be evaluated locally before they are used for any application. In this study, we examined the intrinsic data quality and hydrological simulation performance of CHIRPS2, IMERG6, 3B42/3 and TAMSAT3 rainfall datasets for the DRB. The statistical evaluation results generally revealed that all four SRE products showed a promising rainfall estimation and detection capability for the DRB. Particularly, all SREs captured the south–north declining rainfall patterns of the study area. This could be due to the fact that all the SRE products were gauge adjusted and that they are the latest improved versions. However, all the SRE datasets overestimated rainfall for the DRB, indicating that the rainfall products could be applicable for flood studies but not for drought studies. The results also showed the stronger correlation of all SREs with measured rainfall data for the monthly timescales than for the annual timescales, which shows that all the rainfall products considered in this study cannot capture interannual rainfall variability.
The quantitative statistical indices showed that CHIRPS2 performed the best in estimating and detecting rainfall events for the DRB at monthly and annual timescales. This is likely due to the fact that CHIRPS2 was developed by merging satellite, reanalysis and gauge datasets at high spatial resolution, whereas 3B43 performed poorly for the basin.
The hydrological-modeling-based performance evaluation showed that ranges, best fit values and relative sensitivities of SWAT's calibration parameters varied with the rainfall datasets. Overall, groundwater-flow-related parameters such as GWQMN.gw, ALPHA_BF.gw, GW_DELAY.gw and RCHRG_DP.gw were found to be more sensitive for all rainfall products. This showed that subsurface processes dominate hydrological responses in the DRB. The hydrological simulation performance results also showed that all the rainfall products, including the observed rainfall, overestimated streamflow and especially the high flows. The peak streamflow overestimation could be attributed to the uncertainty in SRE rainfall to predict at shorter timescales (e.g., daily) and event rainfalls. The study showed CHIRPS2 and IMERG6 predicted streamflow for the basin satisfactorily and even outperformed the performance of the gauge rainfall. The relatively poor performance of the gauge rainfalls can be attributed to the fact that the gauges are too sparse to accurately characterize rainfall variability in the basin. Overall, the CHIRPS2 and IMERG6 products seem to perform better for the DRB in detecting rainfall events, estimating rainfall quantity, and improving streamflow predictions. The new insights of this study include the following: (i) the SRE evaluation was done by combining statistical and hydrological modeling methods, (ii) the SREs considered in this study are the latest products and are reported to be the best in different studies (IMERG6 is the most recent product, and it is being evaluated in Ethiopian basins for the first time in this study), and (iii) the rainfall detection and estimation, as well as the streamflow prediction capability of SREs, is dependent on seasons. The results of this study are of interest to both scientific communities and water resource managers, and this paper has made a good contribution to improve our understanding of the latest SREs for Ethiopia and the DRB. However, the streamflow simulation capability of the selected SRE products should be tested for other hydrological model to see if model types affect the results.
Table A1List of rain gauge stations used for SRE evaluation.
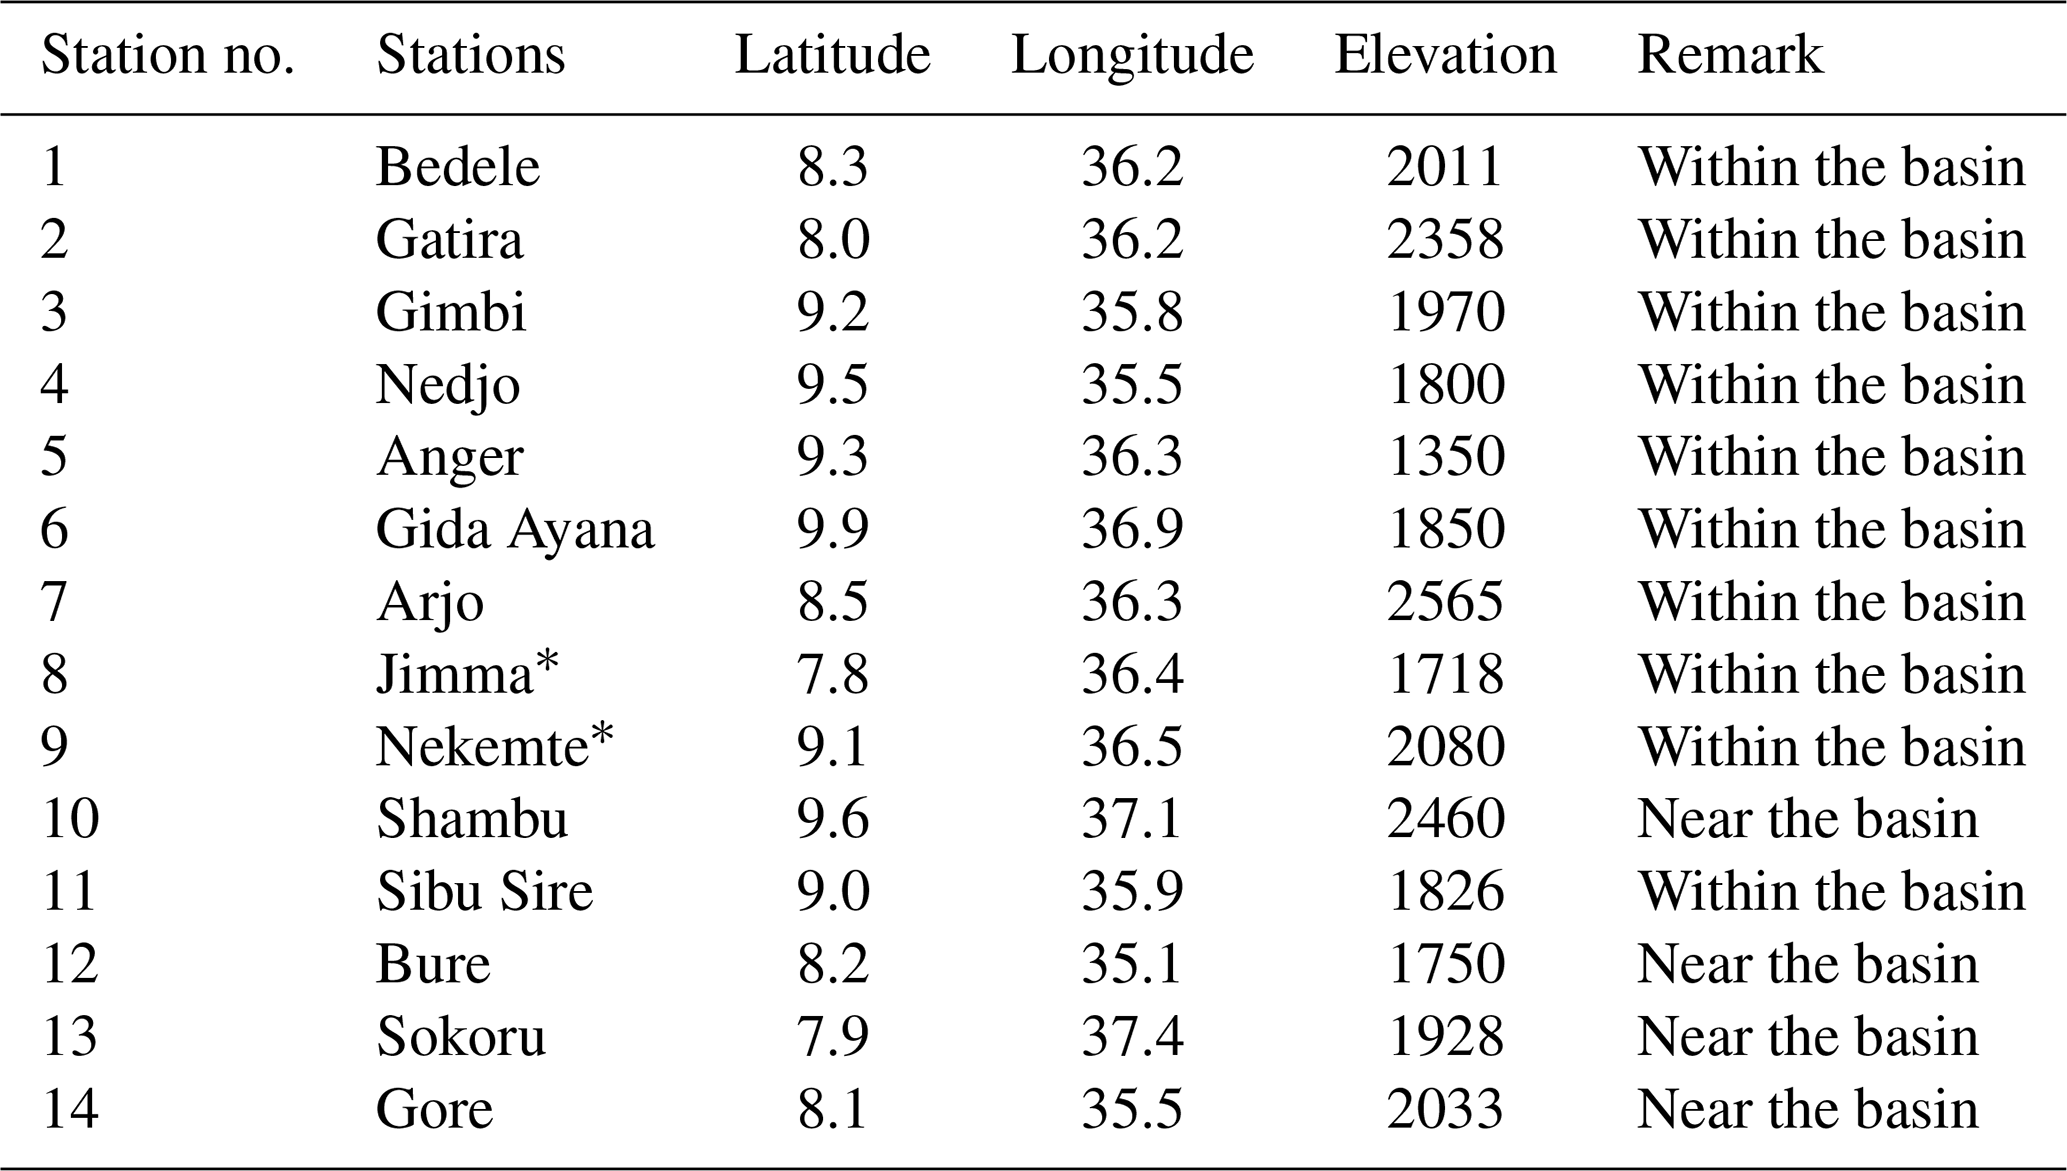
* Systematically removed from being used for calibration as they are already used for SRE calibration.
The data used for this study will be provided upon request.
GKW conceptualized the study, collected and analyzed data required for this study, interpreted and discussed the results, and wrote the manuscript. MKM and BGA reviewed and edited the manuscript. GKW, MKM and BGA read and agreed to the published version of the paper.
The authors declare that they have no conflict of interest.
We are grateful to the Ethiopian Space Science and Technology Institute for providing partial financial support for this research. We are also thankful to the developers of the CHIRPS2, IMERG6, TAMSAT3 and 3B42 datasets and for providing the data free of charge. The National Meteorological Agency of Ethiopia and the Ethiopian Ministry of Water, Irrigation and Energy are also acknowledged for providing climate and streamflow data, respectively.
The sources of rainfall products utilized in this study are described in the article, and we will provide the data upon request.
This paper was edited by Marloes Gutenstein-Penning de Vries and reviewed by two anonymous referees.
Abbaspour, K. C.: SWAT-CUP 2012: SWAT Calibration and Uncertainty Programs-A User Manual, Swiss Federal Institute of Aquatic Science and Technology, Eawag, Switzerland, 2015.
Abbaspour, K. C., Yang, J., Maximov, I., Siber, R., Bogner, K., Mieleitner, J., Zobrist, J., and Srinivasan, R.: Modelling hydrology and water quality in the pre-alpine/alpine watershed using SWAT, J. Hydrol., 333, 413–430, 2007.
Abera, W., Brocca, L., and Rigon, R.: Comparative evaluation of different satellite rainfall estimation products and bias correction in the Upper Blue Nile (UBN) basin, Atmos. Res., 178–179, 471–483, 2016.
Arnold, J. G., Moriasi, D. N., Gassman, P. W., Abbaspour, K. C., White, M. J., Srinivasan, R., Santhi, C., Harmel, R. D., Van Griensven, A., Van Liew, M. W., Kannan, N., and Jha, M. K.: SWAT: Model use, calibration, and validation, T. ASABE, 55, 1491–1508, 2012.
Ayehu, G. T., Tadesse, T., Gessesse, B., and Dinku, T.: Validation of new satellite rainfall products over the Upper Blue Nile Basin, Ethiopia, Atmos. Meas. Tech., 11, 1921–1936, https://doi.org/10.5194/amt-11-1921-2018, 2018.
Bayissa, Y., Tadesse, T., Demisse, G., and Shiferaw, A.: Evaluation of satellite-based rainfall estimates and application to monitor meteorological drought for the Upper Blue Nile Basin, Ethiopia, Remote Sens., 9, 669, https://doi.org/10.3390/rs9070669, 2017.
Behrangi, A., Khakbaz, B., Jaw, T. Ch., Kouchak, A. A., Hsu, K., and Sorooshian, S.: Hydrologic evaluation of satellite precipitation products over a mid-size basin, J. Hydrol., 397, 225–237, 2011.
Belete, M., Deng, J., Wang, K., Zhou, M., Zhu, E., Shifaw, E., and Bayissa, Y.: Evaluation of satellite rainfall products for modeling water yield over the source region of Blue Nile Basin, Sci. Total Environ., 708, 134834, https://doi.org/10.1016/j.scitotenv.2019.134834, 2020.
Berne, A. and Krajewski, W. F.: Radar for hydrology: Unfulfilled promise or unrecognized potential?, Adv. Water Resour., 51, 357–366, 2013.
Bitew, M. M. and Gebremichael, M.: Evaluation of satellite rainfall products through hydrologic simulation in a fully distributed hydrologic model, Water Resour. Res., 47, 1–11, 2011.
Brown, J. E. M.: An analysis of the performance of hybrid infrared and microwave satellite precipitation algorithm over India and adjacent regions, Remote Sens. Environ., 101, 63–81, 2006.
Chen, J., Wang, Z., Wu, X., Chen, X., Lai, C., and Zeng, Z., and Li, J.: Accuracy evaluation of GPM multi-satellite precipitation products in the hydrological application over alpine and gorge regions with sparse rain gauge network, Hydrol. Res., 50, 1710–1729, 2019.
Condom, T., Rau, P., and Espinoza, J. C.: Correction of TRMM 3B43 monthly precipitation data over the mountainous areas of Peru during the period 1998–2007, Hydrol. Process., 25, 1924–1933, 2011.
Conway, D.: The Climate and Hydrology of the Upper Blue Nile River, Geogr. J., 1, 49–62, 2000.
de Goncalves, L. G. G., Shuttleworth, W. J., Nijssen, B., Burke, E. J., Marengo, J. A., Chou, S. C., Houser, P., and Toll, D. L.: Evaluation of model-derived and remotely sensed precipitation products for continental South America, J. Geophys. Res., 111, D16113, https://doi.org/10.1029/2005JD006276, 2006.
Dembélé, M. and Zwart, S. J.: Evaluation and comparison of satellite-based rainfall products in Burkina Faso, West Africa, Int. J. Remote Sens., 37, 3995–4014, 2016.
Dinku, T., Chidzambwa, S., Ceccato, P., Connor, S., and Ropelewski, C.: Validation of highresolution satellite rainfall products over complex terrain, Int. J. Remote Sens., 29, 4097–4110, 2008.
Dinku, T., Ruiz, F., Connor, S. J., and Ceccato, P.: Validation and Intercomparison of Satellite Rainfall Estimates over Colombia, J. Appl. Meteorol. Clim., 49, 1004–1014, 2010.
Dinku, T., Funk, C., Peterson, P., Maidment, R., Tadesse, T., Gadain, H., and Ceccato, P.: Validation of the CHIRPS satellite rainfall estimates over eastern Africa, Q. J. Roy. Meteor. Soc., 144, 292–312, 2018.
Funk, C., Verdin, A., Michaelsen, J., Peterson, P., Pedreros, D., and Husak, G.: A global satellite-assisted precipitation climatology, Earth Syst. Sci. Data, 7, 275–287, https://doi.org/10.5194/essd-7-275-2015, 2015.
Gassman, P. W., Sadeghi, A. M., and Srinivasan, R.: Applications of the SWAT model special section: Overview and insights, J. Environ. Qual., 43, 1–8, 2014.
Gebremicael, T. G., Mohamed, Y. A., van der Zaag, P., Gebremedhin, M., Gebremeskel, G., Yazew, E., and Kifle, M.: Evaluation of multiple satellite rainfall products over the rugged topography of the Tekeze-Atbara basin in Ethiopia, Int. J. Remote Sens., 40, 4326–4345, 2019.
Gebremichael, M., Bitew, M. M., Hirpa, F. A., and Tesfay, G. N.: Accuracy of satellite rainfall estimates in the Blue Nile Basin: Lowland plain versus highland mountain, Water Resour. Res., 50, 8775–8790, 2014.
Goshime, D. W., Absi, R., and Ledésert, B.: Evaluation and Bias Correction of CHIRP Rainfall Estimate for Rainfall-Runoff Simulation over Lake Ziway Watershed, Ethiopia, Hydrology, 6, 68, https://doi.org/10.3390/hydrology6030068, 2019.
Grusson, Y., Antil, F., Sauvage, S., and Perz, S.: Testing the SWAT Model with Gridded Weather Data of Different Spatial Resolution, Water, 9, 54, https://doi.org/10.3390/w9010054, 2017.
Guermazi, E., Milano, M., and Reynard, E.: Performance evaluation of satellite-based rainfall products on hydrological modelling for a transboundary catchment in northwest Africa, Theor. Appl. Clim., 138, 1695-1713, 2019.
Habib, E., Haile, A. T., Tian, T., and Joyce, R. J.: Evaluation of the High-Resolution CMORPH Satellite Rainfall Product Using Dense Rain Gauge Observations and Radar-Based Estimates, J. Hydrmeteol., 13, 1784–1798, 2012.
Haile, A. T., Habib, E., Elsaadani, M., and Rientjes, T.: Intercomparison of satellite rainfall products for representing rainfall diurnal cycle over the Nile basin, Int. J. Appl. Earth Obs., 21, 230–240, 2013.
Hu, Q., Yang, D., Li, Z., Mishra, A. K., Wang, Y., and Yang, H.: Multi-scale evaluation of six high-resolution satellite monthly rainfall estimates over a humid region in China with dense rain gauges, Int. J. Remote Sens., 35, 1272–1294, 2014.
Huffman, G. J., Bolvin, D. T., Nelkin, E. J., Wolff, D. B., Adler, R. F., Gu, G., Hong, Y., Bowman, K. P., and Stocker, E. F.: The TRMM Multisatellite Precipitation Analysis (TMPA): quasiglobal, multiyear, combined-sensor precipitation estimates at fine scales, J. Hydrometeorol., 8, 38–55, 2007.
Huffman, G. J., Bolvin, D. T., Braithwaite, D., Hsu, K., Joyce, R., Xie, P., and Yoo, S. H.: NASA global precipitation measurement (GPM) integrated multi-satellite retrievals for GPM (IMERG), in: Algorithm Theoretical Basis Document (ATBD), Number 4.4, NASA/GSFC, Greenbelt, MD, USA, 30 pp., 2014.
Huffman, G. J., Bolvin, D. T., Braithwaite, D., Hsu, K., Joyce, R. J., Kidd, C., Nelkin, E. J., and Xie, P.: NASA Global Precipitation Measurement (GPM) Integrated Multi-satellitE Retrievals for GPM (IMERG): Algorithm Theoretical Basis Document (ATBD), V06, NASA/GSFC, Greenbelt, MD, USA, 39 pp., 2015.
Jiang, S., Liu, S., Ren, L., Yong, B., Zhang, L., Wang, M., Lu, Y., and He, Y.: Hydrologic Evaluation of Six High Resolution Satellite Precipitation Products in Capturing Extreme Precipitation and Streamflow over a Medium-Sized Basin in China, Water, 10, 25, https://doi.org/10.3390/w10010025, 2017.
Joyce, R. J., Janowiak, J. E., Arkin, P. A., and Xie, P.: CMORPH: a method that produces global precipitation estimates from passive microwave and infrared data at high spatial and temporal resolution, J. Hydrometeorol., 5, 487–503, 2004.
Kabite, G. and Gessesse, G.: Hydro-geomorphological characterization of Dhidhessa River Basin, Ethiopia, International Soil and Water Conservation Research, 6, 175–183, 2018.
Kabite, G., Muleta, M. K., and Gessesse, B.: Spatiotemporal land cover dynamics and drivers for Dhidhessa River Basin (DRB), Ethiopia, Modeling Earth Systems and Environment, 6, 1089–1103, 2020.
Katsanos, D., Retalis, A., and Michaelides, S.: Validation of a high-resolution precipitation database (CHIRPS) over Cyprus for a 30-year period, Atmos. Res., 169, 459–464, 2016.
Kidd, C. and Huffman, G.: Global precipitation measurement, Meteorol. Appl. 18, 334–353, 2011.
Kidd, C., Bauer, P., Turk, J., Huffman, G. J., Joyce, R., Hsu, K. L., and Braithwaite, D.: Intercomparison of high-resolution precipitation products over northwest Europe, J. Hydrometeorol., 13, 67–83, 2012.
Kimani, M. W., Hoedjes, J. C. B., and Su, Z.: An assessment of satellite-derived rainfall products relative to ground observations over East Africa, Remote Sens., 9, 430, https://doi.org/10.3390/rs9050430, 2017.
Lakew, H. B., Moges, S. A., and Asfaw, D. H.: Hydrological Evaluation of Satellite and Reanalysis precipitation products in the Upper Blue Nile Basin: A case study of Gilgal Abbay, Hydrology, 4, 39, https://doi.org/10.3390/hydrology4030039, 2017.
Lemann, T., Roth, V., Zeleke, G., Subhatu, A., Kassawmar, T., and Hurni, H.: Spatial and Temporal Variability in Hydrological Responses of the Upper Blue Nile basin, Ethiopia, Water, 11, 21, https://doi.org/10.3390/w11010021, 2019.
Li, D., Christakos, G., Ding, X., and Wu, J.: Adequacy of TRMM satellite rainfall data in driving the SWAT modeling of Tiaoxi catchment (Taihu lake basin, China), J. Hydrol., 556, 1139–1152, 2018.
Maggioni, V., Meyers, P. C., and Robinson, M. D.: A Review of Merged High-Resolution Satellite Precipitation Product Accuracy during the Tropical Rainfall Measuring Mission (TRMM) Era, J. Hydrometeorol., 17, 1101–1117, 2016.
Maidment, R., Emily, B., and Matt, Y.: TAMSAT Daily Rainfall Estimates, Version 3.0, Dataset, University of Reading, https://doi.org/10.17864/1947.112, 2017.
Meng, J., Li, Z., Hao, J., and Wang, S. Q.: Suitability of TRMM Satellite Rainfall in Driving Distributed Hydrological Model in the Source Region of Yellow River, J. Hydrol., 509, 320–332, 2014.
Moriasi, D. N., Arnold, J. G., Van Liew, M. W., Bingner, R. L., Harmel, R. D., and Veith, T. L.: Model evaluation guidelines for systematic quantification of accuracy in watershed simulations, T. ASABE, 50, 885–900, 2007.
Nebuloni, R., D'Amico, M., Cazzaniga, G., De Michele, C., and Deidda, C.: Rainfall estimate using Commercial Microwave Links (CML): first outcomes of the MOPRAM project, EGU General Assembly, Vienna, Austria, 23–28 April 2017, EGU2020-1040, 2020.
Neitsch, S. L., Arnold, J. G., Kiniry, J. R., and Williams, J. R.: Soil & Water Assessment Tool-Theoretical Documentation Version 2009, Texas Water Resour. Inst., Technical Report No. 406, Texas A&M University System College Station, Texas 77843-2118, 647 pp., 2009.
Nesbitt, S. W., Gochis, D. J., and Lang, T. J.: The diurnal cycle of clouds and precipitation along the Sierra Madre Occidental observed during NAME-2004: Implications for warm season precipitation estimation in complex terrain, J. Hydrometeorol., 9, 728–743, 2008.
Nguyen, T. H., Masih, I., Mohamed, Y. A., and Van Der Zaag, P.: Validating rainfall-runoff modelling using satellite-based and reanalysis precipitation products in the Sre Pok catchment, the Mekong River basin, Geosciences, 8, 164–184, 2018.
Roth, V., Lemann, T., Zeleke, G., Subhatu, A. T., Nigussie, T. K., and Hurni, H.: Effects of climate change on water resources in the upper Blue Nile Basin of Ethiopia, Heliyon, 4, E00771, https://doi.org/10.1016/j.heliyon.2018.e00771, 2018.
Sahlaoui, Z. and Mordane, S.: Radar Rainfall Estimation in Morocco: Quality Control and Gauge Adjustment, Hydrology, 6, 41, https://doi.org/10.3390/hydrology6020041, 2019.
Seyyedi, H., Angagnostou, E. N., Beinghley, E., and McCollum, J.: Hydrologic evaluation of satellite and reanalysis precipitation datasets over a mid-latitude basin, Atmos. Res., 164–165, 37–48, 2015.
Sirisena, T. A. J. G., Maskey, S., Ranasinghe, R., and Babel, M. S.: Effects of different precipitation inputs on streamflow simulation in the Irrawaddy River Basin, Myanmar, J. Hydrol.: Reg. Studies., 19, 265–278, 2018.
Smiatek, G., Keis, F., Chwala, C., Fersch, B., and Kunstmann, H.: Potential of commercial microwave link network derived rainfallfor river runoff simulations, Environ. Res. Lett., 12, 034026, https://doi.org/10.1088/1748-9326/aa5f46, 2017.
Sorooshian, S., Hsu, K.-L., Gao, X., Gupta, H. V., Imam, B., and Braithwaite, D.: Evaluation of PERSIANN system satellite-based estimates of tropical rainfall, B. Am. Meteorol. Soc., 81, 2035–2046, 2000.
Stisen, S. and Sandholt, I.: Evaluation of remote-sensing-based rainfall products through predictive capability in hydrological runoff modeling, Hydrol. Process., 24, 879–891, 2010.
Su, J., Lü, H., Wang, J., Sadeghi, A., and Zhu, Y.: Evaluating the Applicability of Four Latest Satellite-Gauge Combined Precipitation Estimates for Extreme Precipitation and Streamflow Predictions over the Upper Yellow River Basins in China, Remote Sens., 9, 1176, https://doi.org/10.3390/rs9111176, 2017.
Tapiador, F. J., Turk, F. J., Petersen, W., Hou, A. Y., García-Ortega, E., Machado, L. A. T., Angelis, C. F., Salio, P., Kidd, C., Huffman, G. J., and de Castro, M.: Global precipitation measurement: Methods, datasets and applications, Atmos. Res., 104–105, 70–97, 2012.
Thiemig, V., Rojas, R., Zambrano-Bigiarini, M., and Roo, A. D.: Hydrological evaluation of satellite-based rainfall estimates over the Vota and Baro-Akobo Basin, J. Hydrol., 499, 324–333, 2013.
Tong, K., Su, F., Yang, D., and Hao, Z.: Evaluation of satellite precipitation retrievals and their potential utilities in hydrologic modeling over the Tibetan Plateau, J. Hydrol., 519, 423–437, 2014.
Toté, C., Patricio, D., Boogaard, H., Van der Wijngaart, R., Tarnavsky, E., and Funk, C.: Evaluation of Satellite Rainfall Estimates for Drought and Flood Monitoring in Mozambique, Remote Sens., 7, 1758–1776, 2015.
Vernimmen, R. R. E., Hooijer, A., Mamenun, Aldrian, E., and van Dijk, A. I. J. M.: Evaluation and bias correction of satellite rainfall data for drought monitoring in Indonesia, Hydrol. Earth Syst. Sci., 16, 133–146, https://doi.org/10.5194/hess-16-133-2012, 2012.
Villarini, G. and Krajewski, W. F.: Review of the different sources of uncertainty in single polarization radar-based estimates of rainfall, Surv. Geophys., 31, 107–129, 2010.
WMO (World Meteorological Organization): Guide to Hydrological Practices: Data Acquisition and Processing, Analysis, Forecasting and Other Applications, Geneva, Switzerland, 770 pp., 1994.
Worqlul, A. W., Maathuis, B., Adem, A. A., Demissie, S. S., Langan, S., and Steenhuis, T. S.: Comparison of rainfall estimations by TRMM 3B42, MPEG and CFSR with ground-observed data for the Lake Tana basin in Ethiopia, Hydrol. Earth Syst. Sci., 18, 4871–4881, https://doi.org/10.5194/hess-18-4871-2014, 2014.
Wu, H. and Chen, B.: Evaluating uncertainty estimates in distributed hydrological modeling for the Wenjing River watershed in China by GLUE, SUFI-2, and ParaSol methods, Ecol. Eng., 76, 110–121, 2015.
Xian, L., Wenqi, W., Daming, H., Yungang, L., and Xuan., J.: Hydrological Simulation Using TRMM and CHIRPS Precipitation Estimates in the Lower Lancang-Mekong River Basin, Chinese Geographical Science, 29, 13–25, 2019.
Xie, P. and Arkin, A.: An Inter-comparison of Gauge Observations and Satellite Estimates of Monthly Precipitation, J. Appl. Meteorol., 34, 1143–1160, 1995.
Xue, X., Hong, Y., Limaye, A. S., Gourley, J. J., Huffman, G. J., Khan, S. I., and Chen, S.: Statistical and Hydrological Evaluation of TRMM-Based Multi-Satellite Precipitation Analysis over the Wangchu Basin of Bhutan: Are the Latest Satellite Precipitation Products 3B42V7 Ready for Use in Ungauged Basins?, J. Hydrol., 499, 91–99, 2013.
Yohannes, O.: Water Resources and Inter-Riparian Relations in the Nile Basin: The Search for an integrative Discourse, 270 pp., ISBN 13: 978-0-7914-7431-0, 2008.
Yong, B., Chen, B., Gourley, J. J., Ren, L., Hong, Y., Chen, X., Wang, W., Chen, S., and Gong, L.: Inter-comparison of the Version-6 and Version-7 TMPA precipitation products over high and low latitudes basins with independent gauge networks: is the newer version better in both real-time and post-real-time analysis for water resources and hydrologic ext, J. Hydrol., 508, 77–87, 2014.
Zeweldi, D. A., Gebremichael, M., and Downer, C. W.: On CMORPH rainfall for streamflow simulation in a small, Hortonian watershed, J. Hydrometeorol., 12, 456–466, 2011.
Zhang, C., Chen, X., Shao, H., Chen, S., Liu, T., Chen, C., Ding, Q., and Du, H.: Evaluation and Inter-comparison of High-Resolution Satellite Precipitation Eastimates-GPM, TRMM, and CMORPH in the Tianshan Mountain Area, Remote Sens., 10, 1543, https://doi.org/10.3390/rs10101543, 2018.
Zhang, Z., Tian, J., Huang, Y., Chen, X., Chen, S., and Duan, Z.: Hydrologic Evaluation of TRMM and GPM IMERG Satellite-Based Precipitation in a Humid Basin of China, Remote Sens., 11, 431, https://doi.org/10.3390/rs11040431, 2019.
Zhao, Y., Xie, Q., Lu, Y., and Hu, B.: Hydrologic Evaluation of TRMM Multisatellite Precipitation Analysis for Nanliu River Basin in Humid Southwestern China, Sci. Rep., 7, 2470, https://doi.org/10.1038/s41598-017-02704-1, 2017.
Zhou, J., Liu, Y., Guo, H., and He, D.: Combining the SWAT model with sequential uncertainty fitting algorithm for streamflow prediction and uncertainty analysis for the Lake Dianchi Basin, China, Hydrol. Process., 28, 521–533, 2014.
Oromia Water Works Design and Supervision Enterprise (OWWDSE): Dhidhessa Sub-Basin Soil Survey Report, Dhidhessa-Dabus Integrated Land Use Planning Study Project, unpublished
Geological Survey of Ethiopia (GSE): Geology of the Nekemte and Gimbi Area, Sheet Number: NC-37-9 and NC-36-12, respectively, unpublished