the Creative Commons Attribution 4.0 License.
the Creative Commons Attribution 4.0 License.
 | 26 Mar 2021
New observations of NO2 in the upper troposphere from TROPOMI
John F. Roberts
Robert G. Ryan
Henk Eskes
K. Folkert Boersma
Sungyeon Choi
Joanna Joiner
Nader Abuhassan
Alberto Redondas
Michel Grutter
Alexander Cede
Laura Gomez
Monica Navarro-Comas
Nitrogen oxides () in the NOx-limited upper troposphere (UT) are long-lived and so have a large influence on the oxidizing capacity of the troposphere and formation of the greenhouse gas ozone. Models misrepresent NOx in the UT, and observations to address deficiencies in models are sparse. Here we obtain a year of near-global seasonal mean mixing ratios of NO2 in the UT (450–180 hPa) at by applying cloud-slicing to partial columns of NO2 from TROPOMI. This follows refinement of the cloud-slicing algorithm with synthetic partial columns from the GEOS-Chem chemical transport model. TROPOMI, prior to cloud-slicing, is corrected for a 13 % underestimate in stratospheric NO2 variance and a 50 % overestimate in free-tropospheric NO2 determined by comparison to Pandora total columns at high-altitude free-tropospheric sites at Mauna Loa, Izaña, and Altzomoni and MAX-DOAS and Pandora tropospheric columns at Izaña. Two cloud-sliced seasonal mean UT NO2 products for June 2019 to May 2020 are retrieved from corrected TROPOMI total columns using distinct TROPOMI cloud products that assume clouds are reflective boundaries (FRESCO-S) or water droplet layers (ROCINN-CAL). TROPOMI UT NO2 typically ranges from 20–30 pptv over remote oceans to >80 pptv over locations with intense seasonal lightning. Spatial coverage is mostly in the tropics and subtropics with FRESCO-S and extends to the midlatitudes and polar regions with ROCINN-CAL, due to its greater abundance of optically thick clouds and wider cloud-top altitude range. TROPOMI UT NO2 seasonal means are spatially consistent (R=0.6–0.8) with an existing coarser spatial resolution (5∘ latitude × 8∘ longitude) UT NO2 product from the Ozone Monitoring Instrument (OMI). UT NO2 from TROPOMI is 12–26 pptv more than that from OMI due to increase in NO2 with altitude from the OMI pressure ceiling (280 hPa) to that for TROPOMI (180 hPa), but possibly also due to altitude differences in TROPOMI and OMI cloud products and NO2 retrieval algorithms. The TROPOMI UT NO2 product offers potential to evaluate and improve representation of UT NOx in models and supplement aircraft observations that are sporadic and susceptible to large biases in the UT.
- Article
(6371 KB) - Full-text XML
-
Supplement
(2375 KB) - BibTeX
- EndNote


Nitrogen oxides () in the upper troposphere (UT; ∼8–12 km) influence the oxidizing capacity of the atmosphere and global climate, as the formation and radiative forcing of tropospheric ozone are most efficient in the predominantly NOx-limited UT (Mickley et al., 1999; Bradshaw et al., 2000; Dahlmann et al., 2011; Worden et al., 2011). Sources of NOx to the UT include local emissions from lightning and cruising altitude aircraft, deep convective uplift of surface pollution, downwelling from the stratosphere, long-range transport, and chemical recycling of NOx from stable reservoir compounds (Ehhalt et al., 1992; Lamarque et al., 1996; Schumann, 1997; Jaeglé et al., 1998; Bradshaw et al., 2000; Bertram et al., 2007). The lifetime of NOx in the UT varies from a few hours to a few days depending on availability of hydrogen oxides () and peroxy radicals (RO2) to convert NOx to reservoir compounds (Jaeglé et al., 1998; Bradshaw et al., 2000; Nault et al., 2016).
Current understanding of UT NOx is erroneous, as demonstrated by misrepresentation in chemical transport models (CTMs) of the vertical distribution, relative abundance (ratios of NO NO2), and absolute magnitude of UT NOx when compared to in situ measurements from research aircraft (Boersma et al., 2011; Travis et al., 2016; Silvern et al., 2018). Models are used to determine the contribution of ozone to anthropogenic climate change in the absence of reliable historical measurements (Pavelin et al., 1999). Models also provide prior information about the vertical distribution of NO2 for retrieval of vertical column densities of NO2 from space-based UV–visible instruments. Errors in these retrievals are particularly vulnerable to biases in modelled UT NO2, due to greater sensitivity of space-based observations to the UT than the middle and lower troposphere (Travis et al., 2016; Silvern et al., 2019). This impedes accurate top-down inference of air quality variability, surface concentrations, and precursor emissions (Stavrakou et al., 2013; Silvern et al., 2019). Models include heavily parameterized representation of lightning (Tost et al., 2007; Allen et al., 2010; Ott et al., 2010; Murray et al., 2012, 2013), the largest global influencer of NOx in the UT (Bradshaw et al., 2000; Marais et al., 2018), and may misrepresent the reaction kinetics and physical processing of NOx for the cold, low-pressure conditions of the UT (Chang et al., 2011; Henderson et al., 2011, 2012; Stavrakou et al., 2013; Amedro et al., 2019).
Observations that have been used to better understand UT NOx are mostly limited to research and commercial aircraft campaigns. For research aircraft, the record of observations in the UT since the early 1990s have been sustained almost exclusively by the NASA DC8 plane, with recent contributions from the German High Altitude and Long Range Research Aircraft (HALO) (Wendisch et al., 2016). There are also commercial aircraft campaigns, but these are mostly limited to heavily trafficked flight corridors that are often in the stratosphere at cruising altitude (Thomas et al., 2015; Stratmann et al., 2016). In situ measurements of NO2 in the UT can also be biased by interference from NOx reservoir compounds that thermally decompose to NO2 in the instrument inlet (Browne et al., 2011; Reed et al., 2016). Standard remote sensing products of NO2 from space-based nadir- and limb-viewing instruments provide global coverage, but either as a single piece of vertical information in the troposphere in the nadir as tropospheric column densities (Levelt et al., 2018) or as vertically resolved NO2 in the limb limited to NO2 abundances above the tropopause (Newchurch et al., 1996; Brogniez et al., 2002; Sioris et al., 2004; Brohede et al., 2007; Jones et al., 2012; Dubé et al., 2021).
Near-global research products of seasonal mean vertically resolved tropospheric NO2 have been retrieved by applying the cloud-slicing technique to partial columns of NO2 from the space-based Ozone Monitoring Instrument (OMI) (Choi et al., 2014; Belmonte Rivas et al., 2015). Cloud-slicing involves regressing clusters of partial NO2 columns above optically thick clouds against corresponding cloud-top pressures. The resultant regression slopes are converted to NO2 mixing ratios that represent average NO2 across the cloud-top altitude range (Ziemke et al., 2001). The advantages of cloud-slicing include enhanced signal over bright optically thick clouds (van der A et al., 2020) and removal of the dry stratosphere due to lack of clouds there. Near-global multiyear (2005–2007) seasonal means of UT NO2 from cloud-sliced OMI partial columns have been shown to reproduce the spatial variability of UT NO2 measured with bias-corrected NASA DC8 aircraft measurements of NO2 over North America, though at very coarse scales (seasonal, ) (Marais et al., 2018). Even so, the OMI product confirms the dominant global influence of lightning on UT NOx and provides global constraints on lightning NOx production rates (280±80 mol NOx per lightning flash) and annual lightning NOx emissions (5.9±1.7 Tg N) (Marais et al., 2018). OMI pixels are at relatively coarse resolution (13 km × 24 km at nadir), and there is substantial data loss after 2007 due to the so-called row anomaly (Schenkeveld et al., 2017; Torres et al., 2018). The recently launched (October 2017) TROPOMI instrument on the Sentinel-5P satellite has the same spatial coverage as pre-row-anomaly OMI (swath width of 2600 km) but with a finer nadir pixel resolution of 7.2 km × 3.5 km (along track × across track) until 5 August 2019, further refined thereafter to 5.6 km × 3.5 km (Argyrouli et al., 2019). This offers better cloud-resolving capability and greater data pixel density than OMI with potential to retrieve finer-resolution NO2 in the UT.
Here we refine and test the cloud-slicing retrieval using synthetic partial NO2 columns from the GEOS-Chem CTM before retrieving UT NO2 from TROPOMI partial NO2 columns with cloud information from two distinct TROPOMI cloud products. Application of cloud-slicing to TROPOMI follows evaluation of TROPOMI total, stratospheric, and tropospheric columns with ground-based measurements of NO2 from Pandora and multi-axis differential optical absorption spectroscopy (MAX-DOAS) at free-tropospheric monitoring sites. We also evaluate TROPOMI UT NO2 with the OMI UT NO2 product.
Targeting cloudy scenes could yield representation errors in NO2 mixing ratios in the UT, due to the influence of clouds on NOx photochemistry (Holmes et al., 2019), large enhancements in NOx from lightning and convective uplift of surface pollution that accompany cloud formation (Price and Rind, 1992; Bertram et al., 2007), and low sampling frequency due to strict data filtering (Choi et al., 2014). We test the ability of the cloud-slicing technique to return accurate, representative mixing ratios of NO2 in the UT by applying this technique to synthetic partial columns from GEOS-Chem. The “true” NO2 used to evaluate cloud-sliced NO2 is obtained by averaging NO2 across the same vertical range as the cloud-sliced NO2 for the same cloudy model grid squares as are cloud-sliced (true cloudy UT NO2) and for all clear and cloudy model grid squares (true all-sky UT NO2).
Synthetic NO2 is from GEOS-Chem version 12.1.0 (the International GEOS-Chem User Community, 2018) simulated at a horizontal resolution of (latitude × longitude) extending over 47 vertical layers from the surface to 0.01 hPa for the nested domains available in version 12.1.0. These include North America (9.75–60∘ N, 130–60∘ W), western Europe (30–70∘ N, 15∘ W–61.25∘ E), and Southeast Asia (15–55∘ N, 70–140∘ E). Dynamic (3-hourly) boundary conditions are from a coarse-resolution () global GEOS-Chem simulation. The model is driven with NASA GEOS-FP assimilated meteorology and includes comprehensive emission inventories from anthropogenic and natural sources. These include local emissions of NOx in the UT from lightning as described by Murray et al. (2012) and from aircraft using the Aviation Emissions Inventory Code (AEIC) inventory detailed in Stettler et al. (2011). The model is simulated in boreal summer (June–August) when variability in UT NOx in all nested domains is dominated by lightning (Marais et al., 2018). The model is sampled daily at 12:00–15:00 local time (LT) to be consistent with the TROPOMI overpass time (13:30 LT). Two years (2016 and 2017) are simulated to increase data density. The model years predate TROPOMI, but this has no bearing on assessment of the cloud-slicing technique.
The cloud-slicing approach we apply to synthetic partial columns above synthetic clouds to estimate seasonal means of UT NO2 is the same as will be applied to TROPOMI, so model variables are only used if these are also available in or can be derived from publicly available TROPOMI data products. GEOS-Chem daily partial NO2 column densities (stratosphere + partial troposphere) and the corresponding GEOS-FP cloud-top pressures at 450–180 hPa and are gathered into grid squares of the target resolution of . Any grids of gathered pixels with non-uniform overlying stratospheric column NO2 are discarded, as diagnosed with a strict stratospheric column NO2 relative standard deviation of 0.02. Variability in stratospheric NO2 is mostly from oxidation of nitrous oxide (N2O) in the mid-stratosphere (Crutzen, 1970). Its variability is dominated by solar insolation and stratospheric circulation but is also influenced by upwelling from the troposphere and downwelling from the mesosphere (Randall et al., 1998; Gruzdev and Elokhov, 2011). GEOS-FP thermal tropopause heights are used to determine the vertical extent of the stratosphere in the model. As many as 256 partial columns can be gathered in a grid, so we increase the number of possible cloud-sliced NO2 retrievals by subdividing clusters of at least 100 partial NO2 columns into clusters of at least 40. A threshold of 80 instead of 100 yields similar seasonal mean UT NO2. Subdividing the clusters of partial columns doubles the number of cloud-sliced NO2 data used to obtain multiyear seasonal means. Additional filtering is applied to clusters to remove extreme NO2 partial columns (partial columns falling outside the 10th to 90th percentile range) that have a large influence on regression of NO2 partial columns against cloud-top pressures, clusters with fewer than 10 partial columns after screening for extreme values, and clusters that do not extend across a sufficiently wide altitude range (cloud-top pressure range ≤140 hPa and standard deviation ≤30 hPa). GEOS-Chem cloud-top heights are diagnosed in the model as the pressure at the top edge of the highest model layer of GEOS-FP upward moist convective mass flux.
The slope of the relationship between cloud-top heights and partial columns for each cluster is estimated with reduced major axis (RMA) regression, and the standard deviation of the slope, obtained with bootstrap resampling, is used as the error estimate of the slope. Additional filtering is applied to retain slopes that have low relative error (relative error on the slope ≤1.0). We find that a relatively large proportion of slopes (15 %) are negative and would yield negative cloud-sliced UT NO2. Most of these occur over remote regions with low NO2 concentrations. These are diagnosed as slopes significantly less than zero (sum of slope and slope error <0) and removed. The retained slopes and errors (molec. cm−2 hPa−1) are converted to mixing ratios (pptv). The derivation of the mathematical expression for this conversion is detailed in Ziemke et al. (2001). The final step is to remove outliers (UT NO2 >200 pptv) caused by steep slopes. A threshold of 200 pptv is used, as this far exceeds the maximum seasonal mean UT NO2 of 145 pptv in the OMI cloud-sliced UT NO2 product (Marais et al., 2018). We find that only three cloud-sliced retrievals exceed 200 pptv. Seasonal means are obtained by Gaussian-weighting individual estimates of cloud-sliced UT NO2 to the pressure centre (315 hPa). Gaussian weights are calculated as where is the mean cloud-top pressure of the gathered points used in the cloud-sliced UT NO2 retrieval, 315 hPa is the pressure centre, and 135 hPa is the distance from the pressure centre to the edges.
The cloud-slicing retrieval adopted here is mostly similar to that applied to OMI to estimate mid-tropospheric NO2 at 900–650 hPa (Choi et al., 2014) and UT NO2 at 450–280 hPa (Marais et al., 2018). We extend the ceiling of the retrieval to 180 hPa (∼12.5 km) to better capture the vertical extent of the upper troposphere. Another notable distinction is that the method applied to OMI used vertical gradients of NO2 from the NASA Global Modeling Initiative (GMI) CTM to diagnose scenes with non-uniform NO2, to satisfy the assumption that NO2 is vertically uniform for conversion of regression slopes to mixing ratios (Ziemke et al., 2001; Choi et al., 2014). The threshold used for this is 0.33 pptv hPa−1. We dispense with this step, as its application to TROPOMI requires a model at a similar fine spatial resolution to TROPOMI, and CTMs may underestimate vertical NO2 gradients in the UT (Boersma et al., 2011; Travis et al., 2016; Silvern et al., 2018). Anyway, we find that the strict filtering applied to GEOS-Chem partial columns removes most (85 %) scenes with absolute NO2 vertical gradients ≥0.33 pptv hPa−1 for a target resolution of .
Figure 1 shows GEOS-Chem seasonal mean cloud-sliced and true cloudy UT NO2 at . The latter is also Gaussian-weighted to 315 hPa. The uncertainty in individual cloud-sliced values, estimated as the RMA regression slope error, ranges from 6 % to the imposed error limit, 99 %. This is reduced to <2 % for the multiyear seasonal means in Fig. 1 due to temporal averaging. Agreement between the cloud-sliced and true cloudy UT NO2 is shown in the scatterplot in Fig. 2. Successful cloud-sliced retrievals can exceed 35 for many grid squares, though these do not exhibit better agreement with the “truth” than the grid squares with fewer (<10) retrievals. The two datasets are spatially consistent (R=0.64) and exhibit similar variance (slope ). The cloud-sliced UT NO2 has a small positive offset in background UT NO2 (intercept pptv). On average, cloud-sliced UT NO2 is 17 % more than the true cloudy UT NO2, but this depends on the spatial resolution of the retrieved cloud-sliced product. Regression slopes increase from 0.87±0.03 for cloud-sliced UT NO2 obtained at to 1.4±0.2 at , and the cloud-sliced UT NO2 is 4.1 % less than the true cloudy UT NO2 at and 37 % more at . The increasingly positive bias with spatial resolution is because a greater relative proportion of clusters with NO2 vertical gradients ≥0.33 pptv hPa−1 are retained at coarser resolution. The percentage retained relative to all clusters with more than 10 data points and uniform overlying stratospheric NO2 increases from 9 % for to 15 % for and 23 % for . Maps of synthetic cloud-sliced UT NO2 at and are in Fig. S1 in the Supplement. Strict data filtering in the cloud-slicing steps removes 90 % of the clusters of GEOS-Chem partial columns for the product. Most (33 %) data loss is due to the strict relative standard deviation threshold applied to stratospheric NO2. Cloud-slicing is very sensitive to this threshold. Relaxing it from a relative standard deviation of 0.02 to 0.03 increases data retention from 10 % to 17 % but increases the positive bias in cloud-sliced UT NO2 from 17 % to 45 %. This is due to an increase in the contribution of variability in the stratosphere to the cloud-slicing regression slopes.
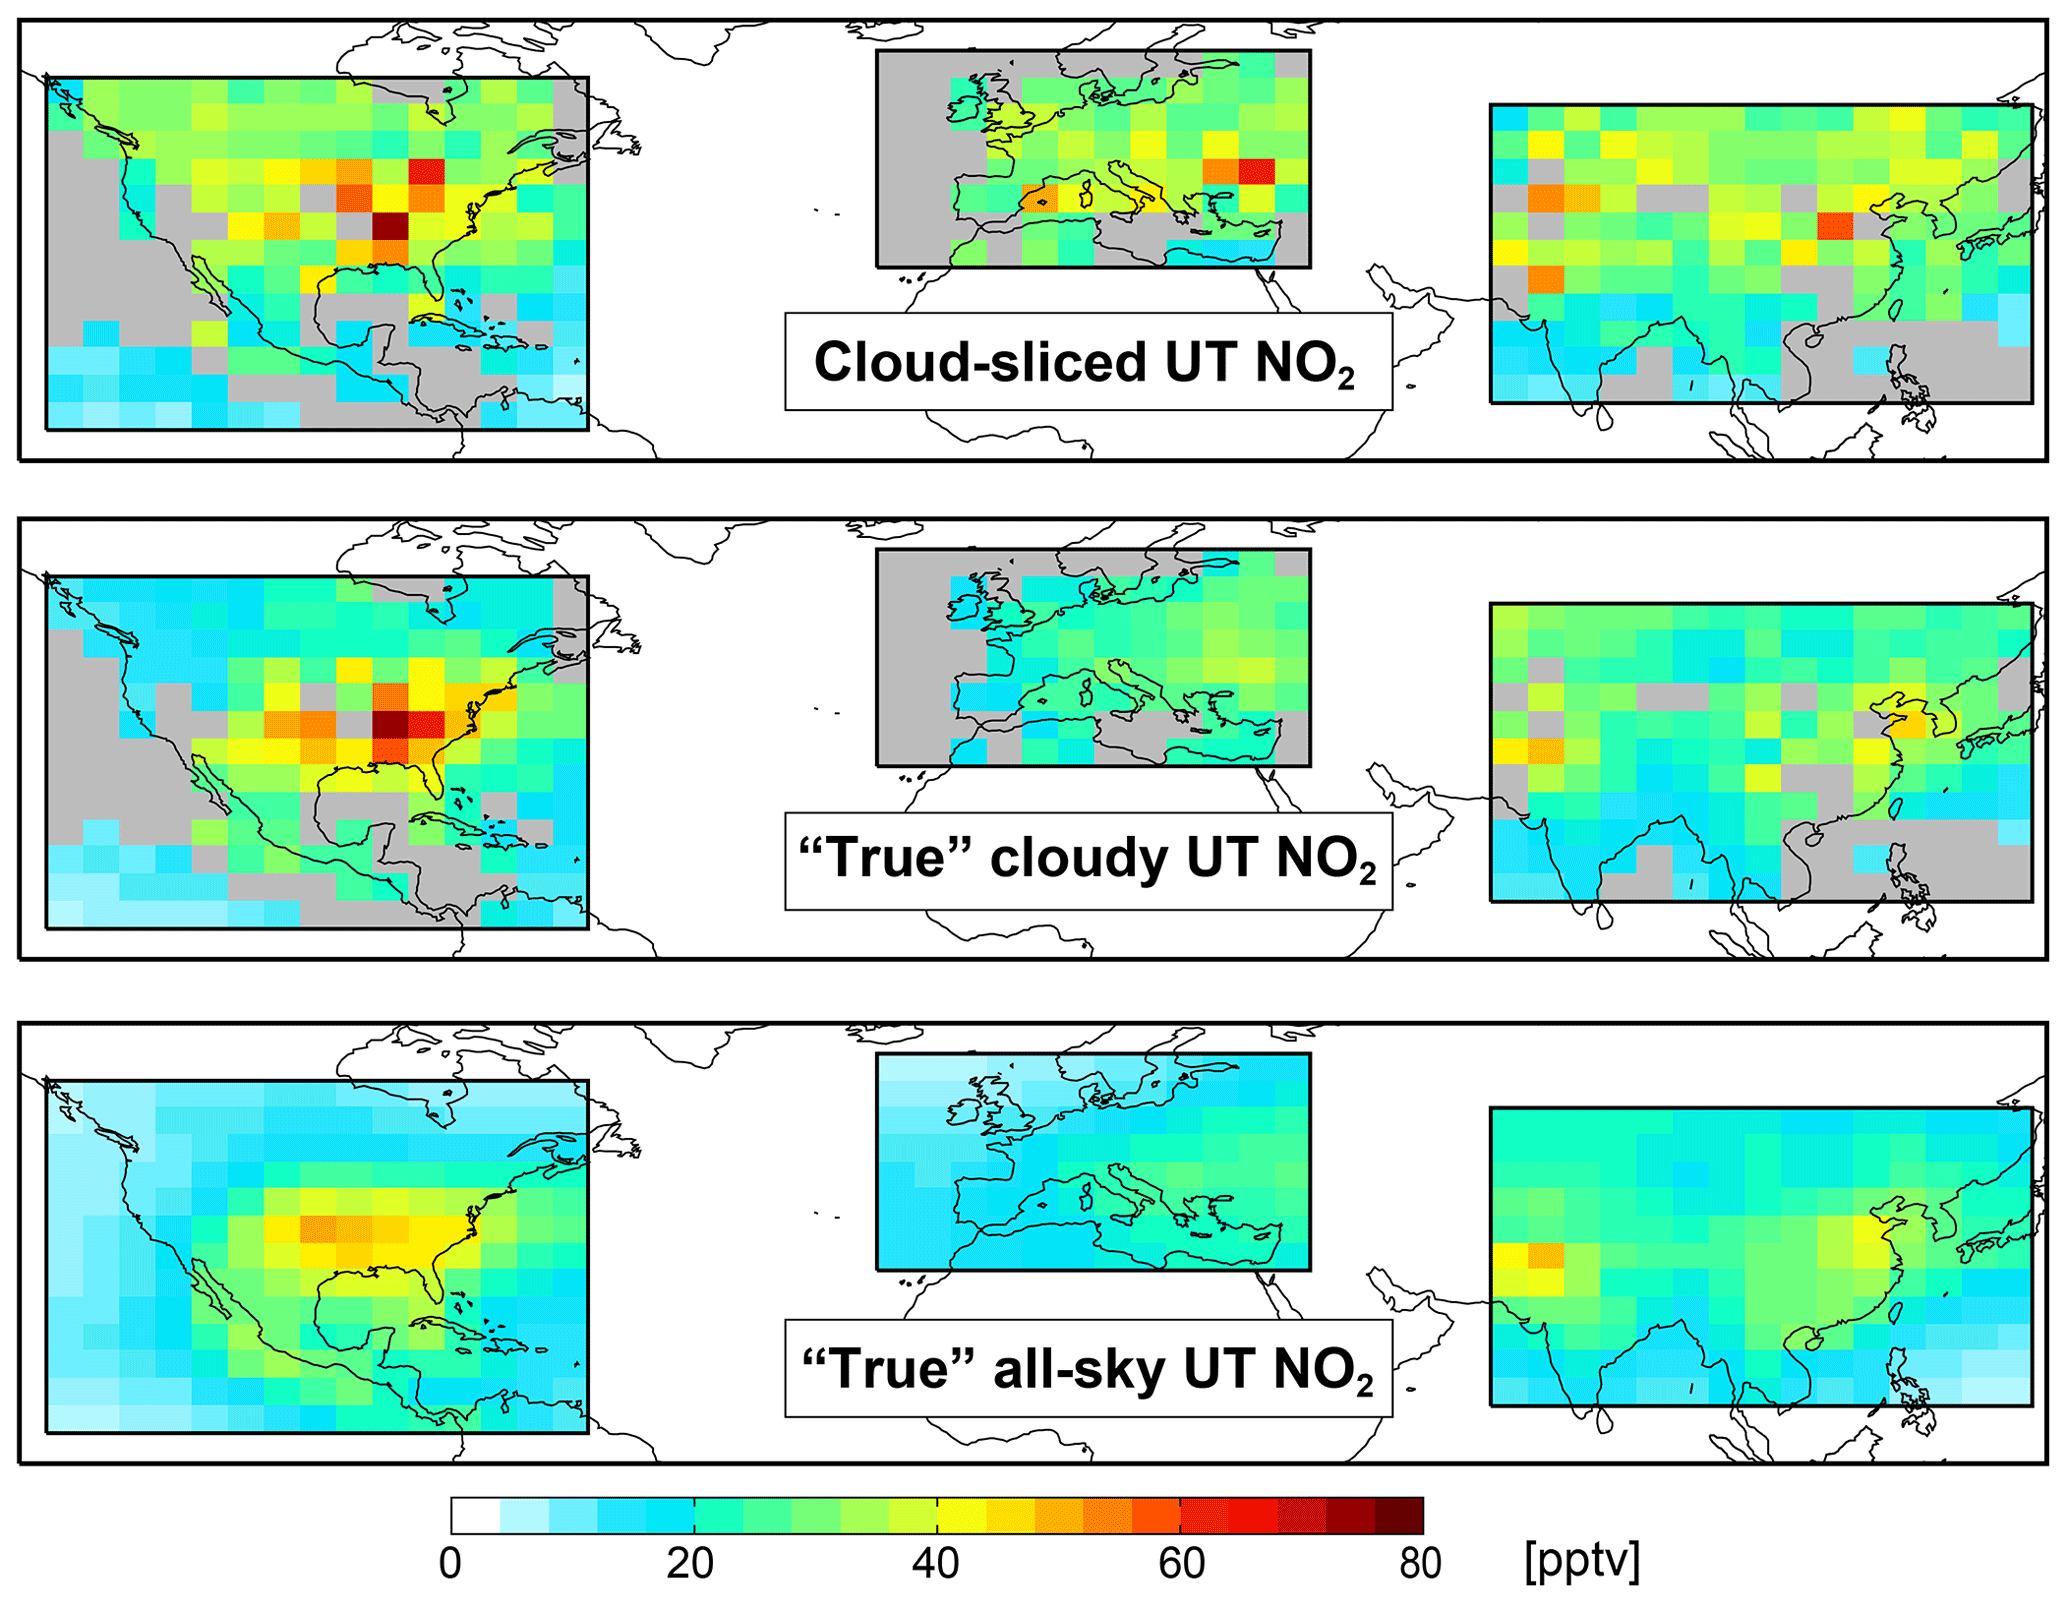
Figure 1Comparison of synthetic cloud-sliced and true NO2 in the upper troposphere (UT) for June–August 2016–2017. Maps show UT NO2 at from cloud-slicing GEOS-Chem partial columns above all clouds with cloud-top pressures at 450–180 hPa (top), as grid-average mixing ratios from GEOS-Chem for the same scenes as are cloud-sliced (middle), and for all-sky (clear and cloudy) scenes (bottom). Data are Gaussian-weighted to the pressure centre (315 hPa). Grey grids have <5 data points.
Also shown in Fig. 1 is the true all-sky UT NO2 obtained for all (cloudy and clear) scenes across 450–180 hPa. Model grids with stratospheric influence are identified and removed using GEOS-FP tropopause heights that are updated hourly in the model. The true cloudy UT NO2 is 17 % more than the true all-sky UT NO2. Spatial resolution influences the size of this difference, increasing from 11 % at to 22 % at . This suggests that isolating cloudy scenes induces a 11 %–22 % bias in seasonal mean NO2 that could be due to a combination of poor data retention (low sampling frequency of cloudy scenes), the influence of clouds on NOx photochemistry (Pour-Biazar et al., 2007; Holmes et al., 2019), and local enhancements in NOx from events like lightning and deep convective uplift of surface pollution that accompany clouds (Crawford et al., 2000; Ridley et al., 2004; Bertram et al., 2007).

Figure 2Scatter plot of synthetic cloud-sliced versus true cloudy NO2 in the upper troposphere (UT). Points are seasonal means from Fig. 1 (top and middle panels) coloured by the number of successful cloud-sliced retrievals. Values inset are the RMA regression statistics and Pearson's correlation coefficient (R). Slope and intercept errors are from bootstrap resampling.
Cloud-slicing applied to GEOS-Chem considers all cloudy scenes, whereas cloud-slicing of satellite observations is applied to partial columns above optically thick clouds, so that the clouds shield against contamination of NO2 from below the cloud. If we only consider synthetic partial columns above clouds with a physical (geometric) cloud fraction across 450–180 hPa of at least 0.7, the cloud-sliced UT NO2 positive difference is similar (18 %) to that obtained for all cloudy scenes, but half the number of data are retained. Cloud fractions retrieved with TROPOMI are effective or radiometric cloud fractions that are systematically more than the physical cloud fraction from the model (Bucsela et al., 2013; Laughner et al., 2018). Our results suggest that representation error is not sensitive to the cloud fraction threshold. Another distinction in GEOS-Chem and TROPOMI cloud variables is that the model provides the physical cloud-top height, whereas TROPOMI cloud retrievals that use models that assume clouds are uniform reflective boundaries retrieve cloud-top heights that can be ∼1 km lower than the physical cloud top (Joiner et al., 2012; Choi et al., 2014; Loyola et al., 2018a). We again apply the cloud-slicing algorithm to the simulated partial columns, but with the altitude of the cloud-top heights artificially lowered by 1 km. This approach assumes that the difference in altitudes of effective (radiometric) clouds and physical clouds is systematic and vertically and horizontally uniform. The difference between the resultant cloud-sliced UT NO2 and the true cloudy UT NO2 increases from 17 % to 24 %. This is because a 1 km decrease in cloud-top altitude leads to a larger relative increase in the column above high-altitude clouds than low-altitude clouds, leading to steeper regression slopes and larger UT NO2.
Pandora spectrometer systems provide observations of total and free-tropospheric columns of NO2 using direct sun, direct moon, and sky radiance observations (Herman et al., 2009; Cede et al., 2019). Those at high-altitude sites (>2 km or <800 hPa) have limited influence from the planetary boundary layer (typically extending to 1–2 km altitude) and so are used here to evaluate TROPOMI NO2 total columns of the free troposphere (middle and upper troposphere) and stratosphere. These include long-term Pandora instruments at Mauna Loa, Hawaii (19.48∘ N, 155.60∘ W, 4.2 km above sea level or a.s.l., ∼600 hPa); Izaña, Tenerife, Canary Islands (28.31∘ N, 16.50∘ W, 2.4 km a.s.l., ∼760 hPa); and Altzomoni, Mexico (19.12∘ N, 98.66∘ W, 4.0 km a.s.l., ∼620 hPa). Mauna Loa and Izaña are remote and have limited anthropogenic influence (Toledano et al., 2018), whereas Altzomoni is ∼70 km southeast of Mexico City and is often within the mixed layer of the city in the afternoon (Baumgardner et al., 2009) after the TROPOMI overpass. On average, multiyear mean tropospheric NO2 columns from OMI are molec. cm−2 lower over Altzomoni ( molec. cm−2) than the city ( molec. cm−2) (Rivera et al., 2013). At Izaña, there is also a MAX-DOAS instrument that we use to retrieve free-tropospheric columns of NO2 to assess these from Pandora and TROPOMI. MAX-DOAS offers vertical sensitivity in the troposphere and has been used extensively to determine free-tropospheric concentrations of NO2 at high-altitude sites (Gomez et al., 2014; Gil-Ojeda et al., 2015; Schreier et al., 2016). There are also Pandora instruments at remote sites in the northern middle and high latitudes in Eureka, Canada, and Ny-Ålesund, Norway, but the total columns of these sample the planetary boundary layer. The Eureka site is at 617 m altitude and the Ny-Ålesund site is at 18 m.
Pandora level 2 total and tropospheric columns are from the Pandonia Global Network (PGN, 2020). We use version 1.7 “nvs1” retrieval of total columns and “nvh1” retrieval of tropospheric columns (described below). Observations are for a full year (1 June 2019 to 31 May 2020) at Izaña. The data record is shorter at Mauna Loa (ends 29 March 2020) and Altzomoni (ends 9 March 2020). Total slant columns (NO2 abundances along the instrument viewing path) are retrieved by fitting a fourth-order polynomial to spectra at 400–440 nm using an NO2 effective temperature of 254.4 K. These are then converted to total vertical column densities by accounting for the geometry of the viewing path (Cede et al., 2019). The Pandora tropospheric NO2 columns have not yet been validated against other observations. Retrieval of these involves simultaneous retrieval of slant columns of NO2 and the O2−O2 dimer at multiple elevation angles (typically 0, 60, 75, 88, and 89∘). The O2−O2 dimer slant columns are used to calculate a representative air mass factor (AMF) that is applied to the difference in NO2 slant columns at multiple pointing elevation angles to calculate a tropospheric vertical column. The data also include estimates of the uncertainty on the total and tropospheric columns due to instrument noise and atmospheric variability (Cede et al., 2019). The NO2 effective temperature used in the total NO2 column retrieval is greater than the column average ambient temperature at high-altitude sites. This induces a positive bias in the total columns estimated by Verhoelst et al. (2021) to be ∼10 % that we address by decreasing the Pandora total columns and associated errors by 10 %. No correction is applied to the tropospheric columns, due to variable contribution of the troposphere to the total column.
MAX-DOAS vertical tropospheric columns of NO2 at Izaña are from RASAS-II sky radiance spectra for June 2019 to February 2020. The spectra are fitted for NO2 and O2−O2 in the wavelength range 425–490 nm, and slant columns are calculated as the difference between these spectra at high-sun (90∘ instrument elevation angle) and multiple elevation angles (1, 2, 3, 5, 10, 30, and 70∘) (Hönninger et al., 2004; Gil et al., 2008; Puentedura et al., 2012; Gomez et al., 2014; Gil-Ojeda et al., 2015). Vertical columns are estimated using optimal estimation that solves an ill-constrained problem by introducing prior information (Rodgers, 2000). Prior information for Izaña includes fixed (with altitude) aerosol extinction of 0.01 km−1 and NO2 of 20 pptv from the surface to the tropopause. Aerosol abundances at Izaña are sometimes influenced by windblown dust from the Sahara Desert, but are typically low (aerosol optical depth or AOD <0.05) (Gomez et al., 2014; Gil-Ojeda et al., 2015). The prior NO2 profile is within the range of background NO2 in the UT (10–20 pptv) (Marais et al., 2018) and MAX-DOAS NO2 concentrations previously retrieved at Izaña (20–40 pptv) (Gomez et al., 2014). Filtering is applied to remove vertical column retrievals with limited independent information (degrees of freedom for signal <1) and significant light path attenuation by aerosols (AOD >0.1) and clouds (effective cloud fraction >0.5). AOD is derived with MAX-DOAS O2−O2 dimer differential slant columns retrieved over the same wavelength range as NO2 (Frieß et al., 2006), and cloud fraction is from the Fast Retrieval Scheme for Clouds from the Oxygen A band version S (FRESCO-S) product provided with the TROPOMI NO2 product. Filtering removes 40 % of the retrieved vertical tropospheric NO2 columns at Izaña.
TROPOMI data are from the Sentinel-5P Pre-Operations Data Hub (S5P Data Hub, 2020). We use a year of NO2 data (1 June 2019 to 31 May 2020) from the level-2 offline (OFFL) product version 01-03-02. The data product includes NO2 abundances along the optical path from the sun to the instrument (the total slant column or SCDtot), NO2 vertical column densities in the stratosphere (VCDstrat), and the stratospheric air mass factor (AMFstrat). A detailed description of retrieval of SCDtot and VCDstrat is described in the product Algorithm Theoretical Basis Document (van Geffen et al., 2019) and by van Geffen et al. (2020). In brief, SCDtot values are obtained by spectral fitting of TROPOMI top-of-atmosphere radiances at 405–465 nm by accounting for light absorption by NO2 and other relevant gases. VCDstrat are from assimilation of TROPOMI and modelled total slant columns over locations diagnosed by the model to have limited tropospheric influence (predominantly remote oceans) (Boersma et al., 2004; Dirksen et al., 2011; van Geffen et al., 2019). The modelled slant columns are the product of vertical columns from the TM5-MP CTM (Williams et al., 2017) and AMFs calculated using TROPOMI viewing geometries and surface reflectivities. The CTM is simulated at and driven with ECMWF meteorology updated every 3-hourly. SCDtot values are separated into a stratospheric (SCDstrat) and tropospheric (SCDtrop) component, and a tropospheric AMF (AMFtrop) is applied to SCDtrop to obtain tropospheric vertical columns (VCDtrop). AMFtrop accounts for viewing geometry, surface reflectivity, atmospheric absorption and scattering of light by trace gases and aerosols, and sensitivity to the vertical distribution of NO2. A vertically resolved correction is also applied to the AMFtrop to correct for the fixed NO2 effective temperature (220 K) used to retrieve SCDtot. The light path in the UT is relatively unobstructed by aerosols and, for cloud-slicing, would mostly be impacted by treatment of the reflectivity of optically thick clouds. We choose to use an AMF that only accounts for viewing geometry (AMFtrop, geo) due to uncertainties in the modelled vertical distribution of NO2 in the UT (Stavrakou et al., 2013; Travis et al., 2016) and representation errors from a model at coarser resolution (∼100 km) than TROPOMI (<10 km at nadir). Choi et al. (2014) found that OMI partial NO2 columns calculated with AMFtrop, geo above optically thick clouds in the mid-troposphere (650 hPa) were at most 14 % more than those calculated with a detailed AMF that assumed clouds are near-Lambertian surfaces with albedo of 0.8 and NO2 is constant with altitude. The effect of not including a temperature correction will be small in the UT where temperatures are ∼220 K anyway. To confirm this, we find that GEOS-Chem cloud-sliced UT NO2 values calculated with the TROPOMI AMF temperature correction expression in van Geffen et al. (2019) are only 6 % less than those in Figs. 1 and 2.
We calculate VCDtrop by first obtaining SCDtrop as the difference between SCDtot from the data product and SCDstrat calculated as the product of the reported VCDstrat and AMFstrat:
This we use to estimate the above-cloud VCDtrop using AMFtrop, geo that we calculate with the reported solar zenith angle (SZA) and viewing zenith angle (VZA) values:
The TROPOMI VCDtot values we compare to Pandora are calculated as the sum of reported VCDstrat and our calculated VCDtrop (Eq. 2). Only data with quality flags (“qa_value” in the data product) of at least 0.45 are used. This removes data affected by sun glint, poor precision in the retrieval and radiances, and SZA (van Geffen et al., 2019). Similarly, good-quality Pandora retrievals of total and tropospheric columns are identified as those with data quality flags of 0, 1, 10, or 11 (Cede et al., 2019), consistent with Ialongo et al. (2020). Coincident satellite and ground-based data are identified as TROPOMI pixels within a 0.2∘ radius (∼20 km) of the station and ground-based data ±30 min around the TROPOMI overpass.
Figure 3a–c compare collocated daily mean Pandora and TROPOMI total columns. This compares predominantly clear-sky observations from Pandora and all-sky observations from TROPOMI, as the larger sampling footprint of TROPOMI will include influence from clouds. TROPOMI cloud fractions from the FRESCO-S product coincident with Pandora range from cloud free (<0.1) to cloudy (0.8 for Mauna Loa and Izaña, 0.5 for Altzomoni) and average 0.3 at Mauna Loa and Izaña and 0.2 at Altzomoni. Errors on the daily means, obtained by adding in quadrature reported uncertainties of individual columns, are small at all sites. These vary from 0.1 % to 19 % for Pandora and 1.5 % to 16 % for TROPOMI. TROPOMI and Pandora total columns are temporally consistent (R=0.69 at Mauna Loa, R=0.87 at Izaña, R=0.67 at Altzomoni), but there is a systematic positive offset in TROPOMI (intercepts in Fig. 3a–c) ranging from 6.6×10¹⁴ molec. cm−2 at Mauna Loa to 9.3×10¹⁴ molec. cm−2 at Altzomoni. TROPOMI is on average 18 % higher than Pandora at Mauna Loa, 26 % at Izaña, and 38 % at Altzomoni. Verhoelst et al. (2021) also report a positive bias in TROPOMI total columns at the same Pandora sites of 6 % at Mauna Loa, 19 % at Izaña, and 28 % at Altzomoni for April 2018 to February 2020. Our higher values compared to Verhoelst et al. (2021) is because of the 10 % downward adjustment we apply to Pandora total columns. The difference in sampling footprints of space- and ground-based instruments can influence agreement between the two (Pinardi et al., 2020). We find though that the difference between TROPOMI and Pandora at Mauna Loa and Izaña is relatively insensitive to the choice of sampling coincidence. The difference is 17 %–20 % at Mauna Loa and 25 %–26 % at Izaña for a TROPOMI sampling radius range of 0.05–0.3∘ and for a Pandora sampling time window range of ±15–60 min. The comparison at Altzomoni, though, is very sensitive to the sampling radius due to proximity to Mexico City. There the difference increases from 22 % at 0.05∘ for 45 coincident points to 48 % at 0.3∘ for 76 coincident points.
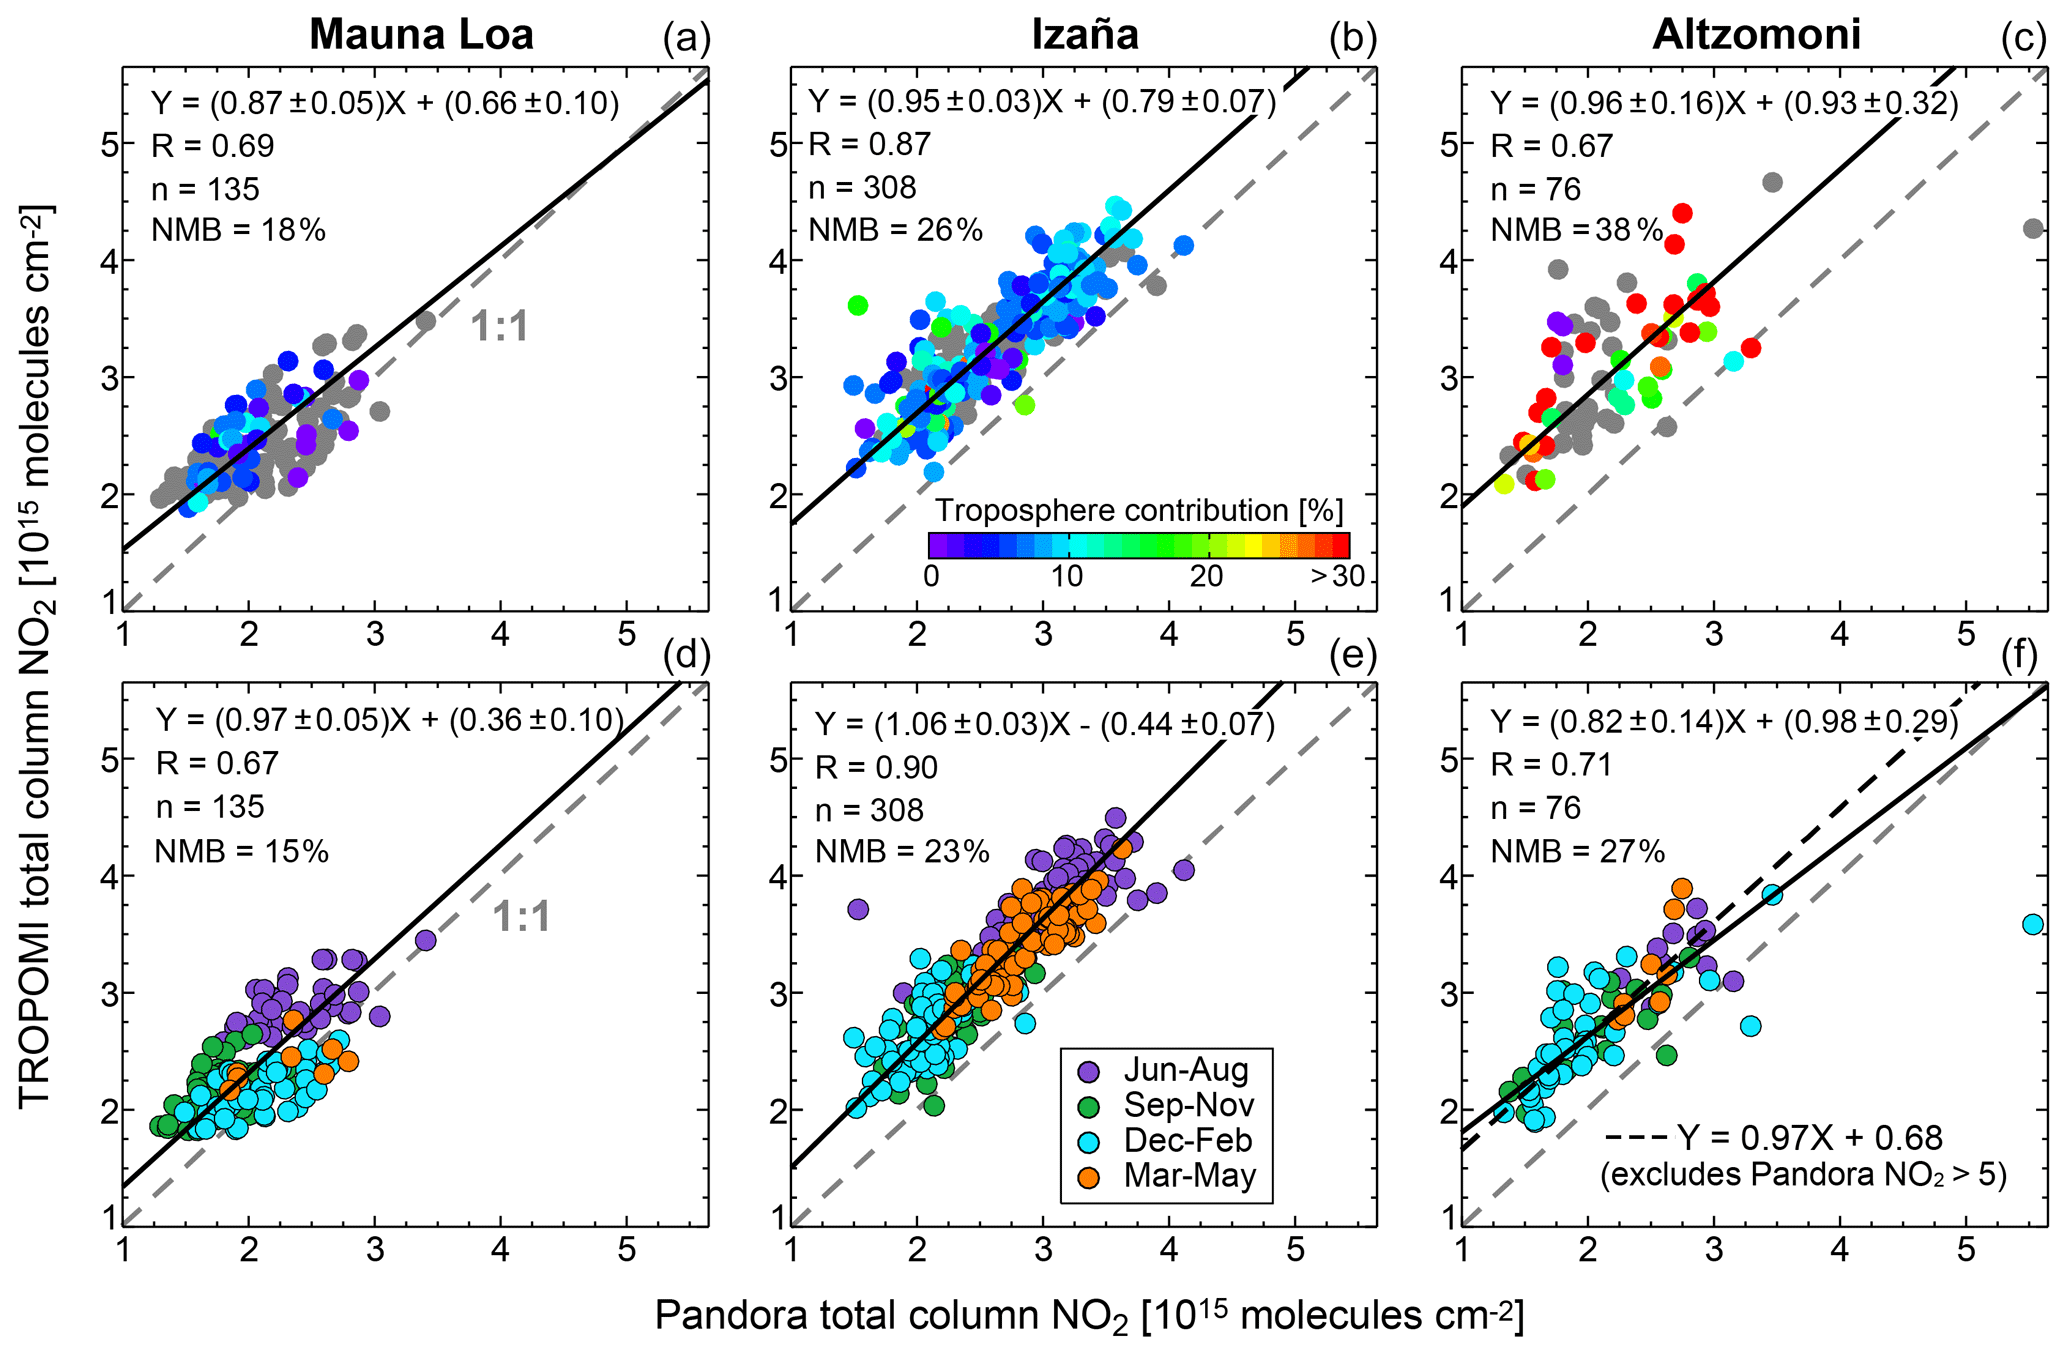
Figure 3Comparison of TROPOMI and Pandora total NO2 columns at high-altitude sites located in the free troposphere (>2 km altitude). Points are daily means with at least five coincident observations at Mauna Loa (a, d), Izaña (b, e), and Altzomoni (c, f) before (a, b, c) and after (d, e, f) applying correction factors to TROPOMI stratospheric and tropospheric columns (see text for details). Colours in (a, b, c) are the relative contribution of the free troposphere to the total column according to Pandora where available and grey otherwise. Data in (d, e, f) row are coloured by season. Lines are the 1:1 relationship (grey dashed) and RMA regression (black solid). Inset values are Pearson's correlation coefficients, RMA regression statistics, number of data points (n), and the TROPOMI normalized mean bias (NMB). Also shown for Altzomoni (f) is the RMA regression without the Pandora molec. cm−2 observation (black dashed line). Axes do not start at the origin.
At Mauna Loa, the free-tropospheric column contribution to the total averages 5.1 % (range of 0.2 %–16 %), according to Pandora. This is likely an overestimate, as few (33 %) Pandora tropospheric daily means could be estimated, as indicated by the grey points in Fig. 3a. The contribution of the free troposphere to the total column at the other sites is 8.3 % (0.2 %–38 %) at Izaña and 31 % (8 %–91 %) at Altzomoni. Due to the small contribution of the free troposphere to the total at Mauna Loa, we use the comparison of Pandora and TROPOMI at this site to evaluate the TROPOMI stratospheric column, as has been done previously (Verhoelst et al., 2021). At Mauna Loa, TROPOMI underestimates stratospheric NO2 variance by 13 % (slope ). A regression slope less than unity suggests that higher-resolution features are smoothed by the coarser spatial resolution of the TM5-TMP model () and time resolution of the meteorology (3-hourly). The underestimate in stratospheric NO2 variance would lead to an overestimate in the relative contribution of the stratosphere to the total column for small column densities and vice versa. This would result in an overall overestimate in cloud-sliced UT NO2, increasing with decline in UT NO2 values, as the relative overestimate in column densities will be greater for high-altitude clouds than for low-altitude clouds. The 18 % higher TROPOMI than Pandora total columns at Mauna Loa are larger than and opposite in sign to the <10 % ( molec. cm−2) meridional difference in TROPOMI stratospheric columns from the near-real-time (NRTI) NO2 product and those obtained with twilight measurements from the near-global Système d'Analyse par Observation Zénitale (SAOZ) network of zenith-scattered-light differential optical absorption spectroscopy (ZSL-DOAS) instruments (Lambert et al., 2019). The implied difference between SAOZ and Pandora stratospheric columns coincident with TROPOMI (Pandora < SAOZ) may be due to the need to account for time differences between the SAOZ measurements (twilight) and TROPOMI (midday) (Verhoelst et al., 2021). This difference warrants further investigation, as these ground-based measurements are crucial for validating space-based sensors that measure NO2.
We apply a variance correction to TROPOMI stratospheric columns by dividing these by 0.87 (the slope of the TROPOMI versus Pandora total columns at Mauna Loa in Fig. 3a) and subtracting the resultant mean increase in TROPOMI stratospheric columns of 3×10¹⁴ molec. cm−2. This reduces the intercepts in Fig. 3a–c to 4.4×10¹⁴ molec. cm−2 for Mauna Loa, 7.9×10¹⁴ molec. cm−2 for Izaña, and 7.3×10¹⁴ molec. cm−2 for Altzomoni (not shown). Likely causes for the remaining discrepancy between TROPOMI and Pandora could be a positive offset in the TROPOMI radiance intensity that is estimated to be 5 % of the total column or 0.1–1×10¹⁵ molec. cm−2 (van Geffen et al., 2020), challenges obtaining a Pandora reference measurement (atmospheric column without NO2) (Herman et al., 2009), and an overestimate in TROPOMI free-tropospheric NO2. The radiance intensity offset has been shown to mostly affect retrievals over open oceans (van Geffen et al., 2020), and an overestimate in free-tropospheric NO2 would have a larger effect on the total column comparison at Izaña and Altzomoni than at Mauna Loa.
Figure 4 compares time series of free-tropospheric column densities of NO2 at Izaña from Pandora, MAX-DOAS, and TROPOMI. As with the total columns, Pandora and MAX-DOAS are sampled 30 min around the satellite overpass and TROPOMI 0.2∘ around the site. We impose a modest threshold to only use TROPOMI tropospheric columns molec. cm−2 to mimic the detection limits of the instruments (Gomez et al., 2014) and mitigate the influence of TROPOMI data that would be susceptible to errors in distinguishing the stratosphere from the troposphere. This brings the lower-end TROPOMI values into better agreement with the ground-based values and has no effect on TROPOMI columns molec. cm−2. On average, Pandora is 14 % more than MAX-DOAS for coincident midday daily means, and the temporal correlation is modest (R=0.4). Temporal inconsistencies between Pandora and MAX-DOAS are due to challenges retrieving tropospheric columns routinely close to instrument detection limits (Gomez et al., 2014), lack of dynamic variability in the retrieved columns, and differences in the sampling extent of the two instruments. The MAX-DOAS sampling footprint, for example, shifts by at least 4∘ in latitude between its most northerly extent in winter solstices to its most southerly extent in summer solstices (Robles-Gonzalez et al., 2016). Most MAX-DOAS and Pandora data are at 1–4×10¹⁴ molec. cm−2, whereas the range for TROPOMI calculated using Eqs. (1) and (2) extends to molec. cm−2. The range is the same as the comparison of TROPOMI and shipborne MAX-DOAS tropospheric columns by P. Wang et al. (2020). In that study, TROPOMI was on average 4×10¹⁴ molec. cm−2 more than MAX-DOAS. In our comparison, TROPOMI free-tropospheric columns (red crosses in Fig. 4) are 77 % more than Pandora and 84 % more than MAX-DOAS. The overestimate is similar if the reported detailed tropospheric AMF is used instead of AMFtrop, geo (Eq. 2) to calculate TROPOMI tropospheric columns.
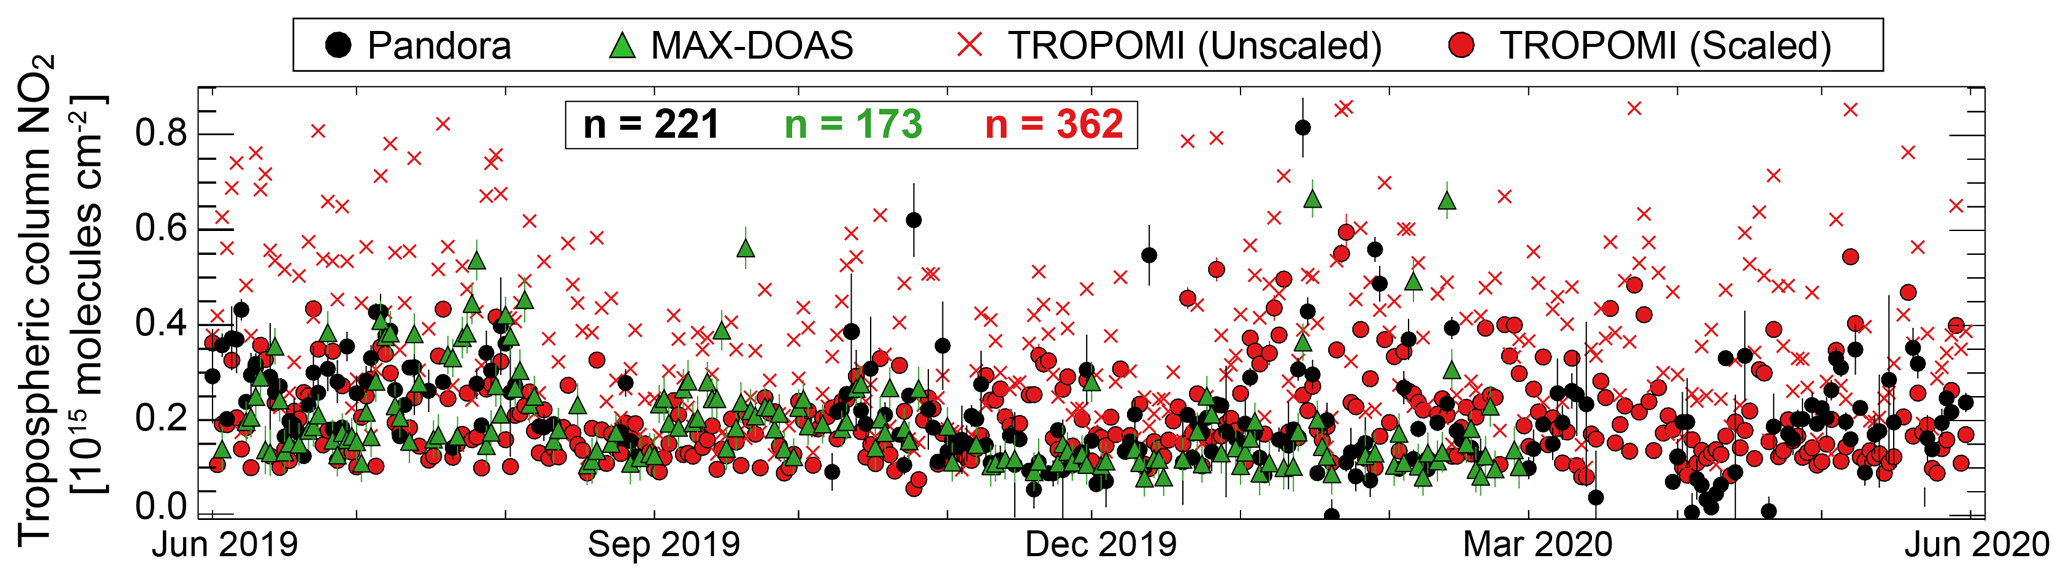
Figure 4Time series of free-tropospheric column densities of NO2 at Izaña. Points are daily midday means from Pandora (black circles), MAX-DOAS (green triangles), and TROPOMI (red) before (crosses) and after (circles) applying scaling factors to the stratospheric and tropospheric columns (see text for details). Error bars are individual retrieval uncertainties added in quadrature. Inset values are the number of midday daily means from each instrument.
The stratospheric variance correction reduces the difference between TROPOMI and coincident ground-based measurements to 40 % compared to Pandora and 47 % compared to MAX-DOAS (not shown). This is due to an increase in the relative contribution of the stratosphere to total columns molec. cm−2 following the stratospheric column variance correction. A 40 %–47 % overestimate in free-tropospheric columns would induce a systematic positive bias in cloud-sliced UT NO2. To address the remaining difference between TROPOMI free-tropospheric columns and the ground-based observations, we decrease TROPOMI free-tropospheric columns by 50 % (red circles in Fig. 4), leading to a difference of −4 % with Pandora and 1 % with MAX-DOAS. There is no temporal correlation between daily coincident observations of TROPOMI and the ground-based measurements (R<0.1), consistent with the comparison of TROPOMI to shipborne MAX-DOAS (P. Wang et al., 2020).
Figure 3d–f compare Pandora to TROPOMI total columns after increasing TROPOMI stratospheric column variance by 13 % and reducing TROPOMI free-tropospheric columns by 50 %. This correction reduces the difference between TROPOMI and Pandora by just 3 percentage points at Mauna Loa and Izaña and 11 percentage points at Altzomoni. The variance at Altzomoni degrades from 0.96±0.16 to 0.82±0.14, but this is because the relatively few coincident points (76 compared to 308 at Izaña) are influenced by the single Pandora observation molec. cm−2 (coincident corrected TROPOMI is molec. cm−2) that may be detecting NO2 from fires that typically occur in December–February in the National Park where the instrument is located (Bravo et al., 2002; Baumgardner et al., 2009). The TROPOMI free-tropospheric column contribution at Mauna Loa and Izaña is more consistent with that from Pandora after applying the stratospheric and free-tropospheric column corrections, decreasing from 8 % to 6 % at Mauna Loa and 12 % to 7 % at Izaña. This is not the case for Altzomoni (decrease from 14 % to 9 %), due to anthropogenic influence from Mexico City that the coarser TROPOMI sampling footprint is not able to resolve. Points in Fig. 3 are coloured by season to show that all sites experience a modest decline in NO2 from summer (purple) to winter (cyan) due to the influence of solar variability on photochemical production of NOx in the stratosphere (Gil et al., 2008; Robles-Gonzalez et al., 2016) and seasonality in long-range transport and subsidence in the free troposphere (Gil-Ojeda et al., 2015). The distinct distribution of points in December–February compared to June–August and September–November at Mauna Loa suggests there may be seasonality in the size of the discrepancy between TROPOMI and Pandora stratospheric columns. The remaining TROPOMI positive offset of molec. cm−2 is consistent with the 2–4×10¹⁴ molec. cm−2 positive offset in TROPOMI stratospheric columns reported by P. Wang et al. (2020) from comparison to shipborne MAX-DOAS measurements. If the remaining offset is exclusively due to the stratospheric column, this would cancel in the cloud-slicing retrieval for clusters of partial columns with uniform stratospheric NO2.
In what follows, we use TROPOMI total columns with a 13 % increase in stratospheric column variance and a 50 % decrease in free-tropospheric columns that are based on comparison to Pandora and MAX-DOAS.
Seasonal mean UT NO2 values are obtained from TROPOMI for June 2019 to May 2020 at . The same cloud-slicing retrieval and data-filtering steps applied to synthetic spectra from GEOS-Chem (Sect. 2) are applied to corrected TROPOMI total columns. The corrections include a 13 % adjustment to the stratospheric column variance and 50 % decrease in tropospheric columns based on comparison to the three high-altitude Pandora sites (Sect. 3). The degradation in resolution of TROPOMI nadir pixels from 5.6 km × 3.5 km to the target resolution () is 400-fold compared to 250-fold for the synthetic experiment in Sect. 2 and a much greater (1300-fold) degradation in OMI nadir pixel resolution (13 km × 24 km) for the product (Marais et al., 2018). The finer relative resolution we choose for TROPOMI cloud-sliced UT NO2 compared to OMI is informed by the synthetic experiment applied to GEOS-Chem and the superior cloud-resolving capability of TROPOMI than OMI. Cloud-slicing is applied to partial columns above optically thick clouds, diagnosed with an effective cloud fraction ≥0.7, as in Marais et al. (2018), to limit contamination from light transmitted through clouds. Though the cloud-slicing retrieval steps applied to GEOS-Chem and TROPOMI are the same, there are differences in the modelled and retrieved cloud parameters that we discuss below.
Two TROPOMI cloud-sliced UT NO2 products are derived using cloud-top heights and cloud fractions from distinct cloud products. The first are FRESCO-S cloud fractions and cloud-top pressures from the same data file as TROPOMI NO2. These are determined by minimizing the difference between measured and simulated spectra in the O2 A-band (758–766 nm) using lookup tables and assuming clouds are single layer Lambertian reflectors with an albedo of 0.8 (Wang et al., 2008; van Geffen et al., 2019). The second is the Optical Cloud Recognition Algorithm (OCRA) cloud fractions and Retrieval of Cloud Information using Neural Networks (ROCINN) cloud-top heights. OCRA cloud fractions are retrieved by determining the difference, in colour space, between cloudy and clear reflectances (Loyola et al., 2007, 2018a, b). ROCINN cloud-top heights are retrieved in kilometres by minimizing the difference between measured O2 A-band radiances and neural-network-trained radiances modelled using OCRA cloud fractions (Loyola et al., 2007, 2018b). In ROCINN, clouds are modelled as multiple optically uniform layers of light-scattering water droplets (the clouds-as-layers or CAL model). We convert the ROCINN-clouds-as-layers (ROCINN-CAL) cloud-top heights to pressures for cloud-slicing and comparison to FRESCO-S. FRESCO-S data are quality screened using the same qa_value threshold (0.45) as NO2. A qa_value threshold of 0.5 is used for OCRA and ROCINN-CAL. Snow and/or ice scenes potentially misclassified as clouds by FRESCO-S are identified as differences in reported scene and surface pressures >2 %, as in van der A et al. (2020), as having snow cover >80 % or classified as permanent ice cover. In what follows, we distinguish the two cloud-sliced TROPOMI UT NO2 products as FRESCO-S and ROCINN-CAL.
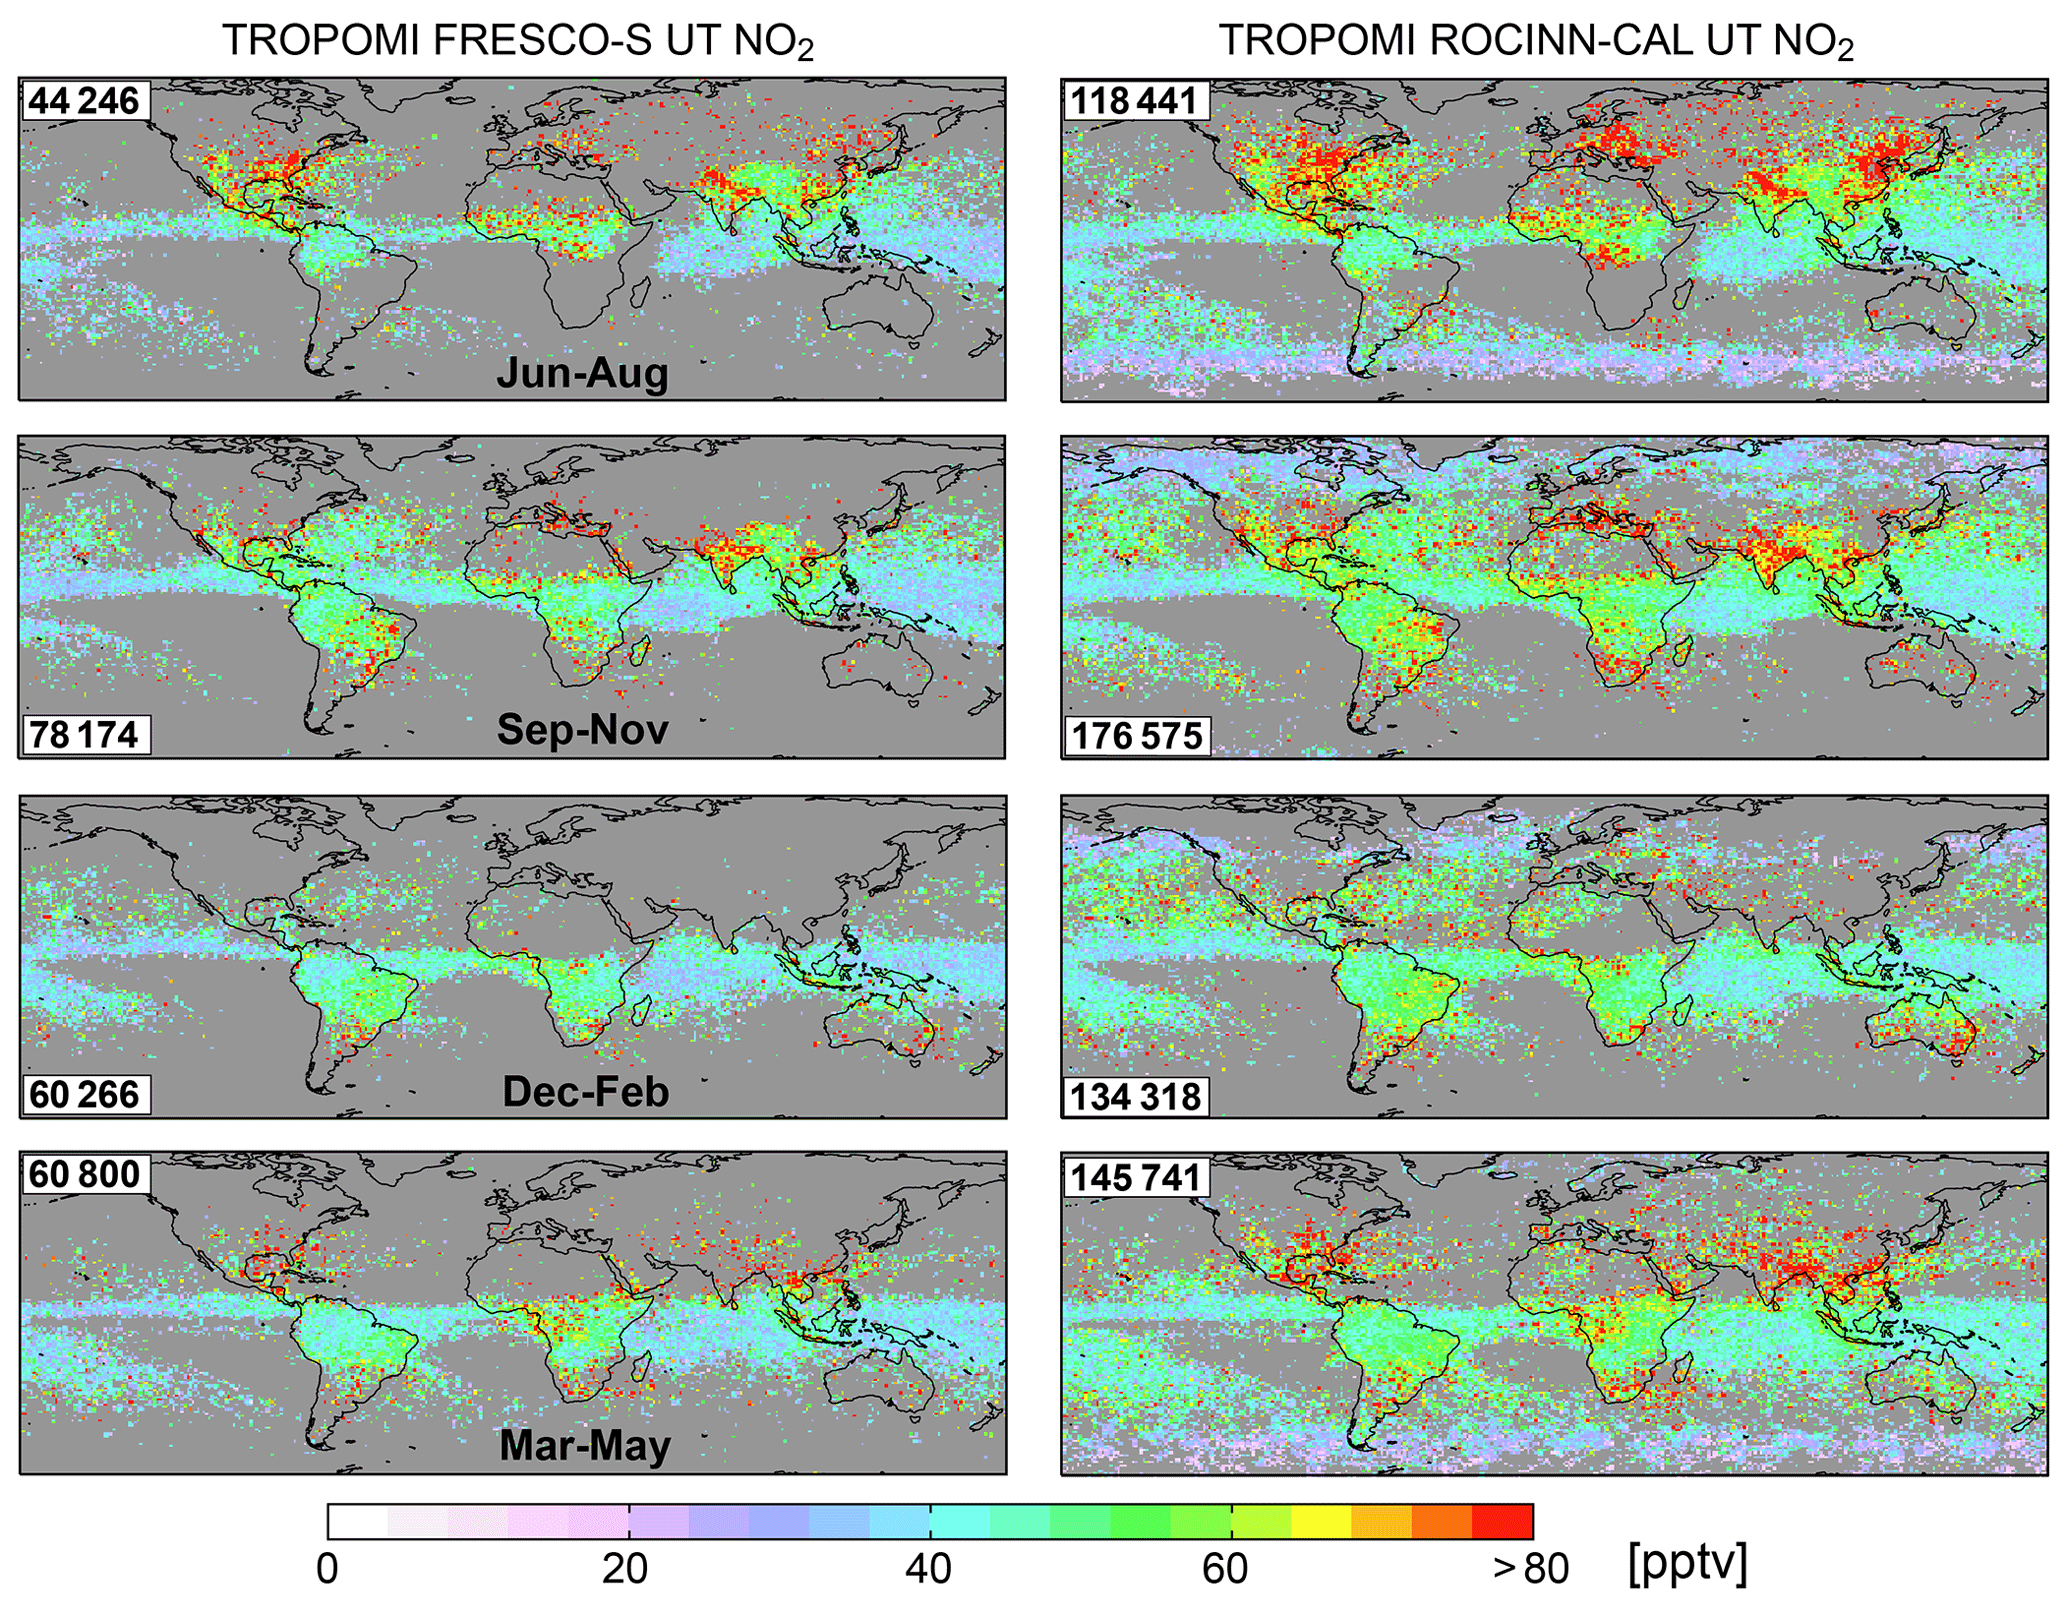
Figure 5Seasonal mean NO2 in the upper troposphere from TROPOMI. Maps are UT NO2 at in June–August 2019 (first row), September–November 2019 (second), December 2019 to February 2020 (third), and March–May 2020 (fourth) using FRESCO-S (left) or ROCINN-CAL (right) cloud information and with corrections applied to TROPOMI stratospheric and tropospheric columns (see text for details). Inset numbers give total successful cloud-sliced retrievals. Grey grid squares have fewer than five cloud-sliced retrievals.
Figure 5 shows maps of seasonal mean FRESCO-S and ROCINN-CAL UT NO2 at . The spatial features are consistent with a combination of the density of lightning flashes (Cecil et al., 2014) and lightning properties such as flash footprint, duration, and energy (Beirle et al., 2014). These include elevated concentrations (>80 pptv) over Northern Hemisphere land masses in June–August, the year-round 40–60 pptv band over tropical landmasses that shifts meridionally with the Intertropical Convergence Zone (ITCZ), and relatively low concentrations (<30 pptv) over the remote Pacific Ocean. We find reasonable spatial correlation (R=0.4–0.6) between seasonal mean TROPOMI UT NO2 and lightning flash densities from the Lightning Imaging Sensor–Optical Transient Detector (LIS–OTD) in all seasons, except September–November for FRESCO-S (R=0.34). Seasonal LIS–OTD lightning flash densities at are calculated from version 2.3 of the monthly climatology (OPeNDAP, 2020). RMA slopes from regressing TROPOMI UT NO2 against LIS–OTD lightning flash densities range from 0.3 to 0.6 pptv (106 flashes km−2 min−1)−1, and UT NO2 in the absence of lightning flashes in the tropics and subtropics (RMA intercepts) is very similar, 37–41 pptv, for both products in all seasons. In the cold polar regions in Fig. 5, UT NO2 values, limited to ROCINN-CAL, are near background (<30 pptv) as NO2 is preferentially present as NOx reservoir compounds such as peroxyacetyl nitrates (PANs) (Bottenheim et al., 1986). Large enhancements (NO2>80 pptv) over northern China and the northeast US in June–August and Australia in December–February most prevalent in the ROCINN-CAL product likely reflect contamination from surface pollution below clouds. These result from intense anthropogenic activity in North China and the northeast US (Zhao et al., 2013; Jiang et al., 2018; Z. Wang et al., 2020) and routine pyrocumulonimbus injection of fire plumes into the free troposphere and lower stratosphere during the extreme 2019–2020 fire season in Australia (Kablick et al., 2020).
FRESCO-S and ROCINN-CAL UT NO2 are spatially consistent for coincident grid squares (R of 0.82 to 0.88), though ROCINN-CAL UT NO2 are 4.2–9.1 pptv more than FRESCO-S UT NO2. As with the synthetic experiment, UT NO2 increases with degradation in resolution due to the relative increase in tropospheric columns with steep vertical gradients in NO2. Depending on the season, cloud-sliced UT NO2 values are 2 %–4 % more at and 3 %–9 % more at than at . Good quality retrievals and optically thick clouds with cloud-top pressures at 450–180 hPa account for ∼2 % of TROPOMI pixels using FRESCO-S and ∼3 % using ROCINN-CAL. Of these, 44 000–78 000 cloud-slicing retrievals are retained in each season for FRESCO-S and 118 000–177 000 for ROCINN-CAL (Fig. 5). Most data loss in the cloud-slicing retrieval is because of too few points (clusters <10) or a cloud-top pressure range <140 hPa. Discarded extreme values of cloud-sliced NO2>200 pptv are only 0.1 %–0.5 % of retained data. More cloud-sliced retrievals with ROCINN-CAL are due to greater abundance of optically thick clouds and clusters with greater cloud height range.
Figure 6 compares the meridional abundance of optically thick clouds in the UT from the two cloud products for June–August and December–February. The same information for the other two seasons is in Fig. S2. Both products retrieve effective (radiometric) cloud fractions. These are systematically more than the physical (geometric) cloud fractions from GEOS-Chem, though the two converge for optically thick clouds with physical cloud fractions approaching 1 (Stammes et al., 2008; Laughner et al., 2018). The number of OCRA optically thick clouds is always more (often double) than that of FRESCO-S in all seasons and across all latitudes. The greatest difference in the number of optically thick clouds tracks the ITCZ and is also typically at 45∘ N/S. The majority (61 %–62 %) of OCRA cloud fractions exceed 0.975 compared to 42 %–45 % for FRESCO-S. Loyola et al. (2018a) determined that OCRA cloud fractions retrieved over oceans are 0.1 unit more than those from retrievals like FRESCO-S that assume fixed cloud albedo. Differences over land are not as systematic and vary from negligible in the tropics and subtropics to >0.1 unit more in the Arctic (Loyola et al., 2018a). ROCINN-CAL retrieves cloud optical thicknesses alongside cloud heights. These exceed 20 for most (84 %–93 %) grid squares used to cloud-slice TROPOMI, confirming that a cloud fraction threshold of 0.7 is sufficient to isolate optically thick clouds. The number of pixels in each cloud fraction threshold in Fig. 6 suggests that a stricter cloud fraction threshold of 1.0 applied to the ROCINN-CAL product might lead to a more consistent spatial distribution of UT NO2 to that from FRESCO-S in Fig. 5. The resultant ROCINN-CAL UT NO2 values using a cloud fraction threshold of 1.0 are in Fig. S3. Half the number of cloud-sliced retrievals are obtained, as expected, and there are fewer retrievals over Northern Hemisphere high latitudes than in Fig. 5. Those over the Southern Ocean in austral autumn and winter persist and may reflect enhanced occurrence of high-altitude clouds in these seasons over Antarctica (Verlinden et al., 2011). The average difference between ROCINN-CAL and FRESCO-S decreases from 5 %–8 % for the same cloud fraction threshold of 0.7 to 0.2 %–1.6 % using a cloud fraction threshold of 1.0 for ROCINN-CAL and 0.7 for FRESCO-S, likely due to reduced contamination of NO2 from below clouds with the stricter cloud fraction threshold.
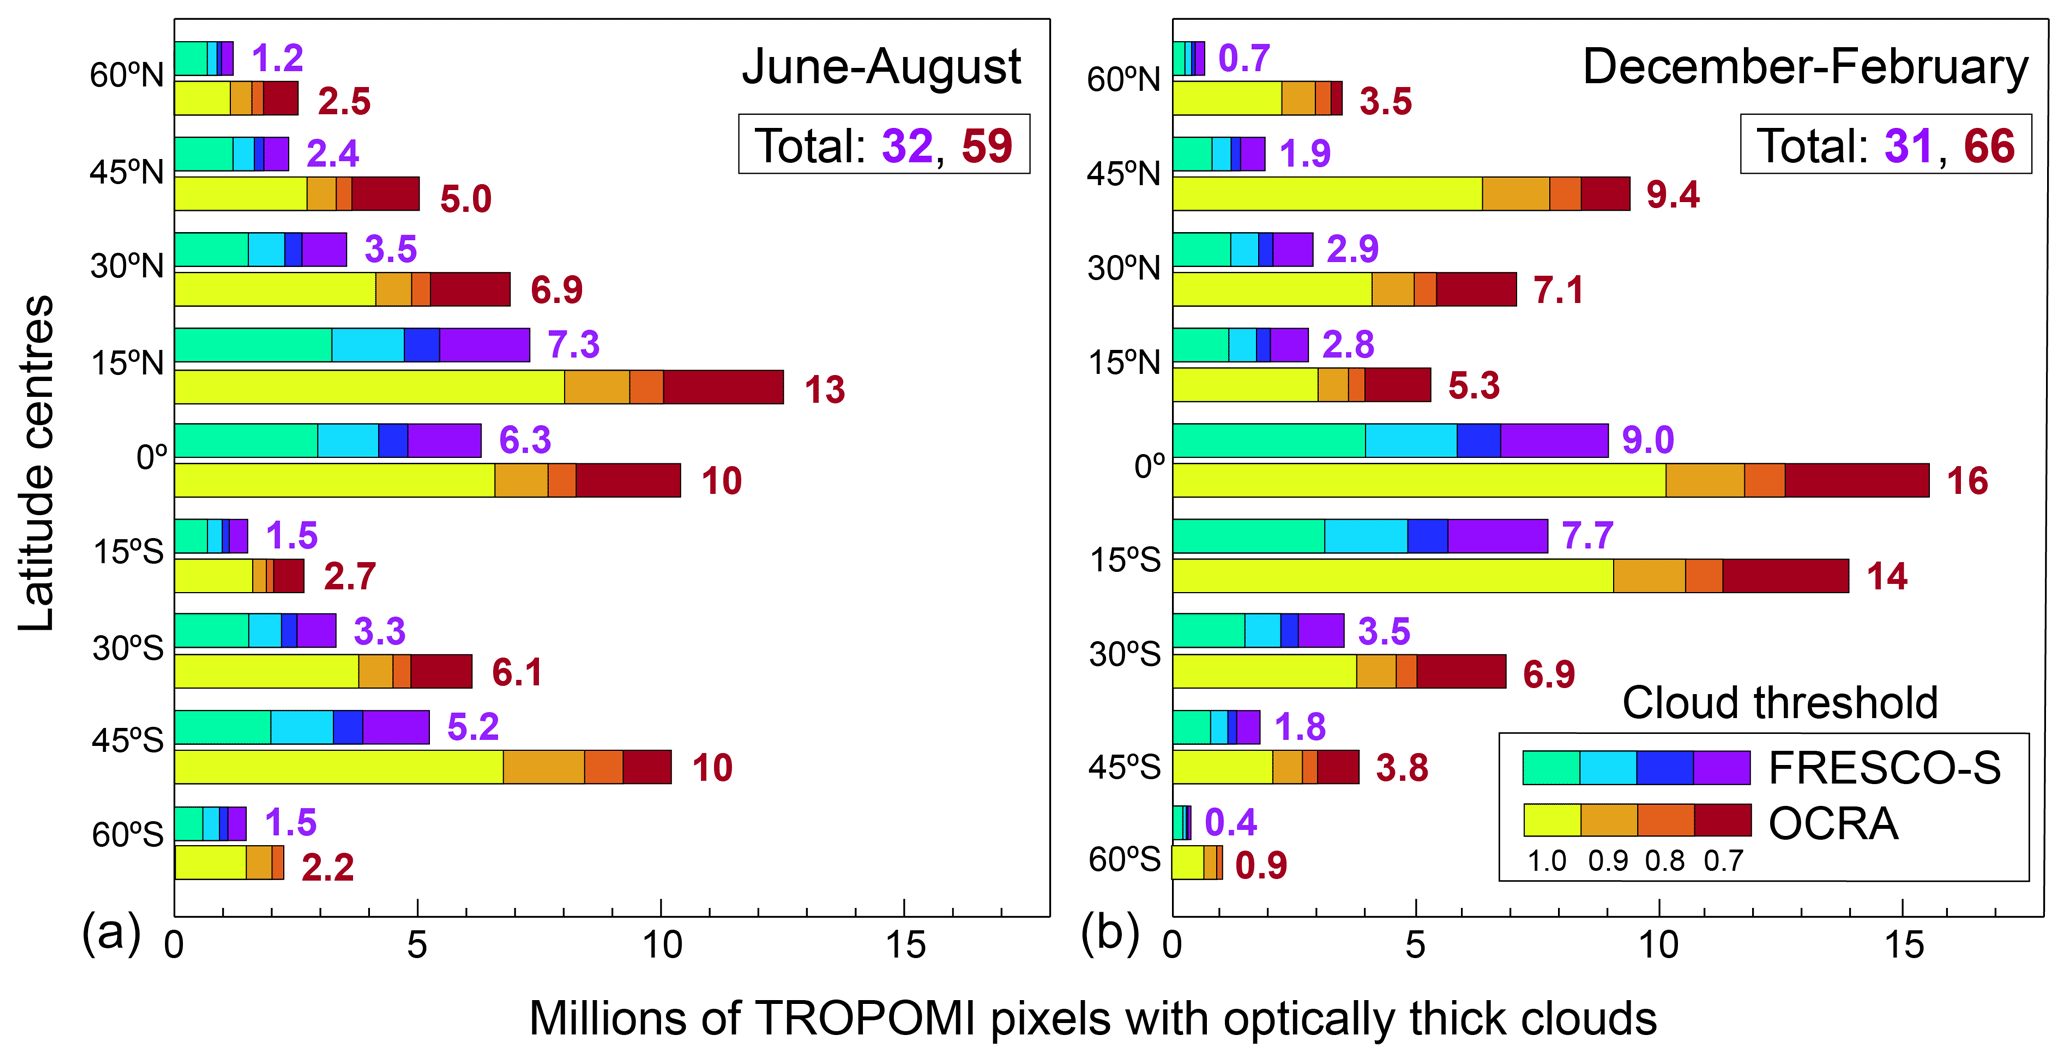
Figure 6Meridional distribution of FRESCO-S and OCRA optically thick clouds in the upper troposphere. Bars count the occurrence of native TROPOMI pixels with cloud fractions ≥1.0, 0.9, 0.8, and 0.7 binned into 15∘ latitude bands in June–August (a) and December–February (b) for FRESCO-S (cool colours) where FRESCO-S cloud-top pressures are at 450–180 hPa and OCRA (warm colours) where ROCINN-CAL cloud-top pressures are at 450–180 hPa. Inset values are latitude band and global totals of TROPOMI pixels with cloud fraction ≥0.7.
Figure 7 compares gridded cloud product cloud-top pressures for June–August sampled where FRESCO-S cloud-top pressures are at 450–180 hPa and cloud fractions are at least 0.7. Cloud-top pressures are spatially consistent in the tropics (R=0.62 at 0–35∘ N, R=0.85 at 0–35∘ N) and midlatitudes (R=0.58 at 35–70∘ N, R = 0.63 at 35–70∘ S) but degrade north of 70∘ N (R=0.31). Variability in cloud-top pressures is similar for the two products in the tropics (regional mean standard deviation of 28–33 hPa at 0–35∘ N and 30–31 hPa at 0–35∘ S) but deviates in the subtropics and midlatitudes (18 hPa for FRESCO-S, 24–30 hPa for ROCINN-CAL) and more so in the Arctic (13 hPa for FRESCO-S, 54 hPa for ROCINN-CAL). There are no coincident data south of 70∘ S in June–August. In December–February (Fig. S4) south of 70∘ S there is a similarly weak correlation (R<0.1) and large difference in variability (19 hPa for FRESCO-S, 80 hPa for ROCINN-CAL). FRESCO-S does not account for scattering within and below clouds and so estimates the height as the optical centroid of the cloud (Joiner et al., 2012). The optical centroid is systematically lower in altitude (higher in pressure) than the physical cloud top, though FRESCO-S appears to be more consistent with ground-based observations than ROCINN-CAL for high-altitude cloud-top heights (Compernolle et al., 2020). Loyola et al. (2018a) determined that cloud-top altitudes from ROCINN-CAL were ∼1 km (range: 0.6 to >2 km) higher than those from a FRESCO-S-type approach that assumes clouds are single layers with fixed albedo. Our test of the effect of an artificial decrease in cloud-top altitude of 1 km for cloud-slicing synthetic GEOS-Chem partial columns (Sect. 2) suggests that 1 km lower altitude cloud tops in FRESCO-S should lead to larger UT NO2 than those from ROCINN-CAL, but the opposite is observed (Fig. 5). This suggests that the effect of other differences between the cloud products on the cloud-sliced UT NO2 must dominate. Regression slopes in Fig. 7 are less than unity, indicating that the difference in cloud-top pressures between the two products decreases with pressure (increases with altitude). The implication for cloud-sliced UT NO2 is greater global coverage with ROCINN-CAL, as clusters of TROPOMI pixels using ROCINN-CAL cloud-top pressures in the midlatitudes and polar regions overcome the 140 hPa cloud-top pressure range threshold imposed in the cloud-slicing algorithm. In the tropics and subtropics, ROCINN-CAL has less cloud-top pressure range than FRESCO-S for the same scenes. This leads to steeper cloud-slicing regression slopes for ROCINN-CAL and contributes to the 4–9 pptv greater UT NO2 than FRESCO-S in Fig. 5.
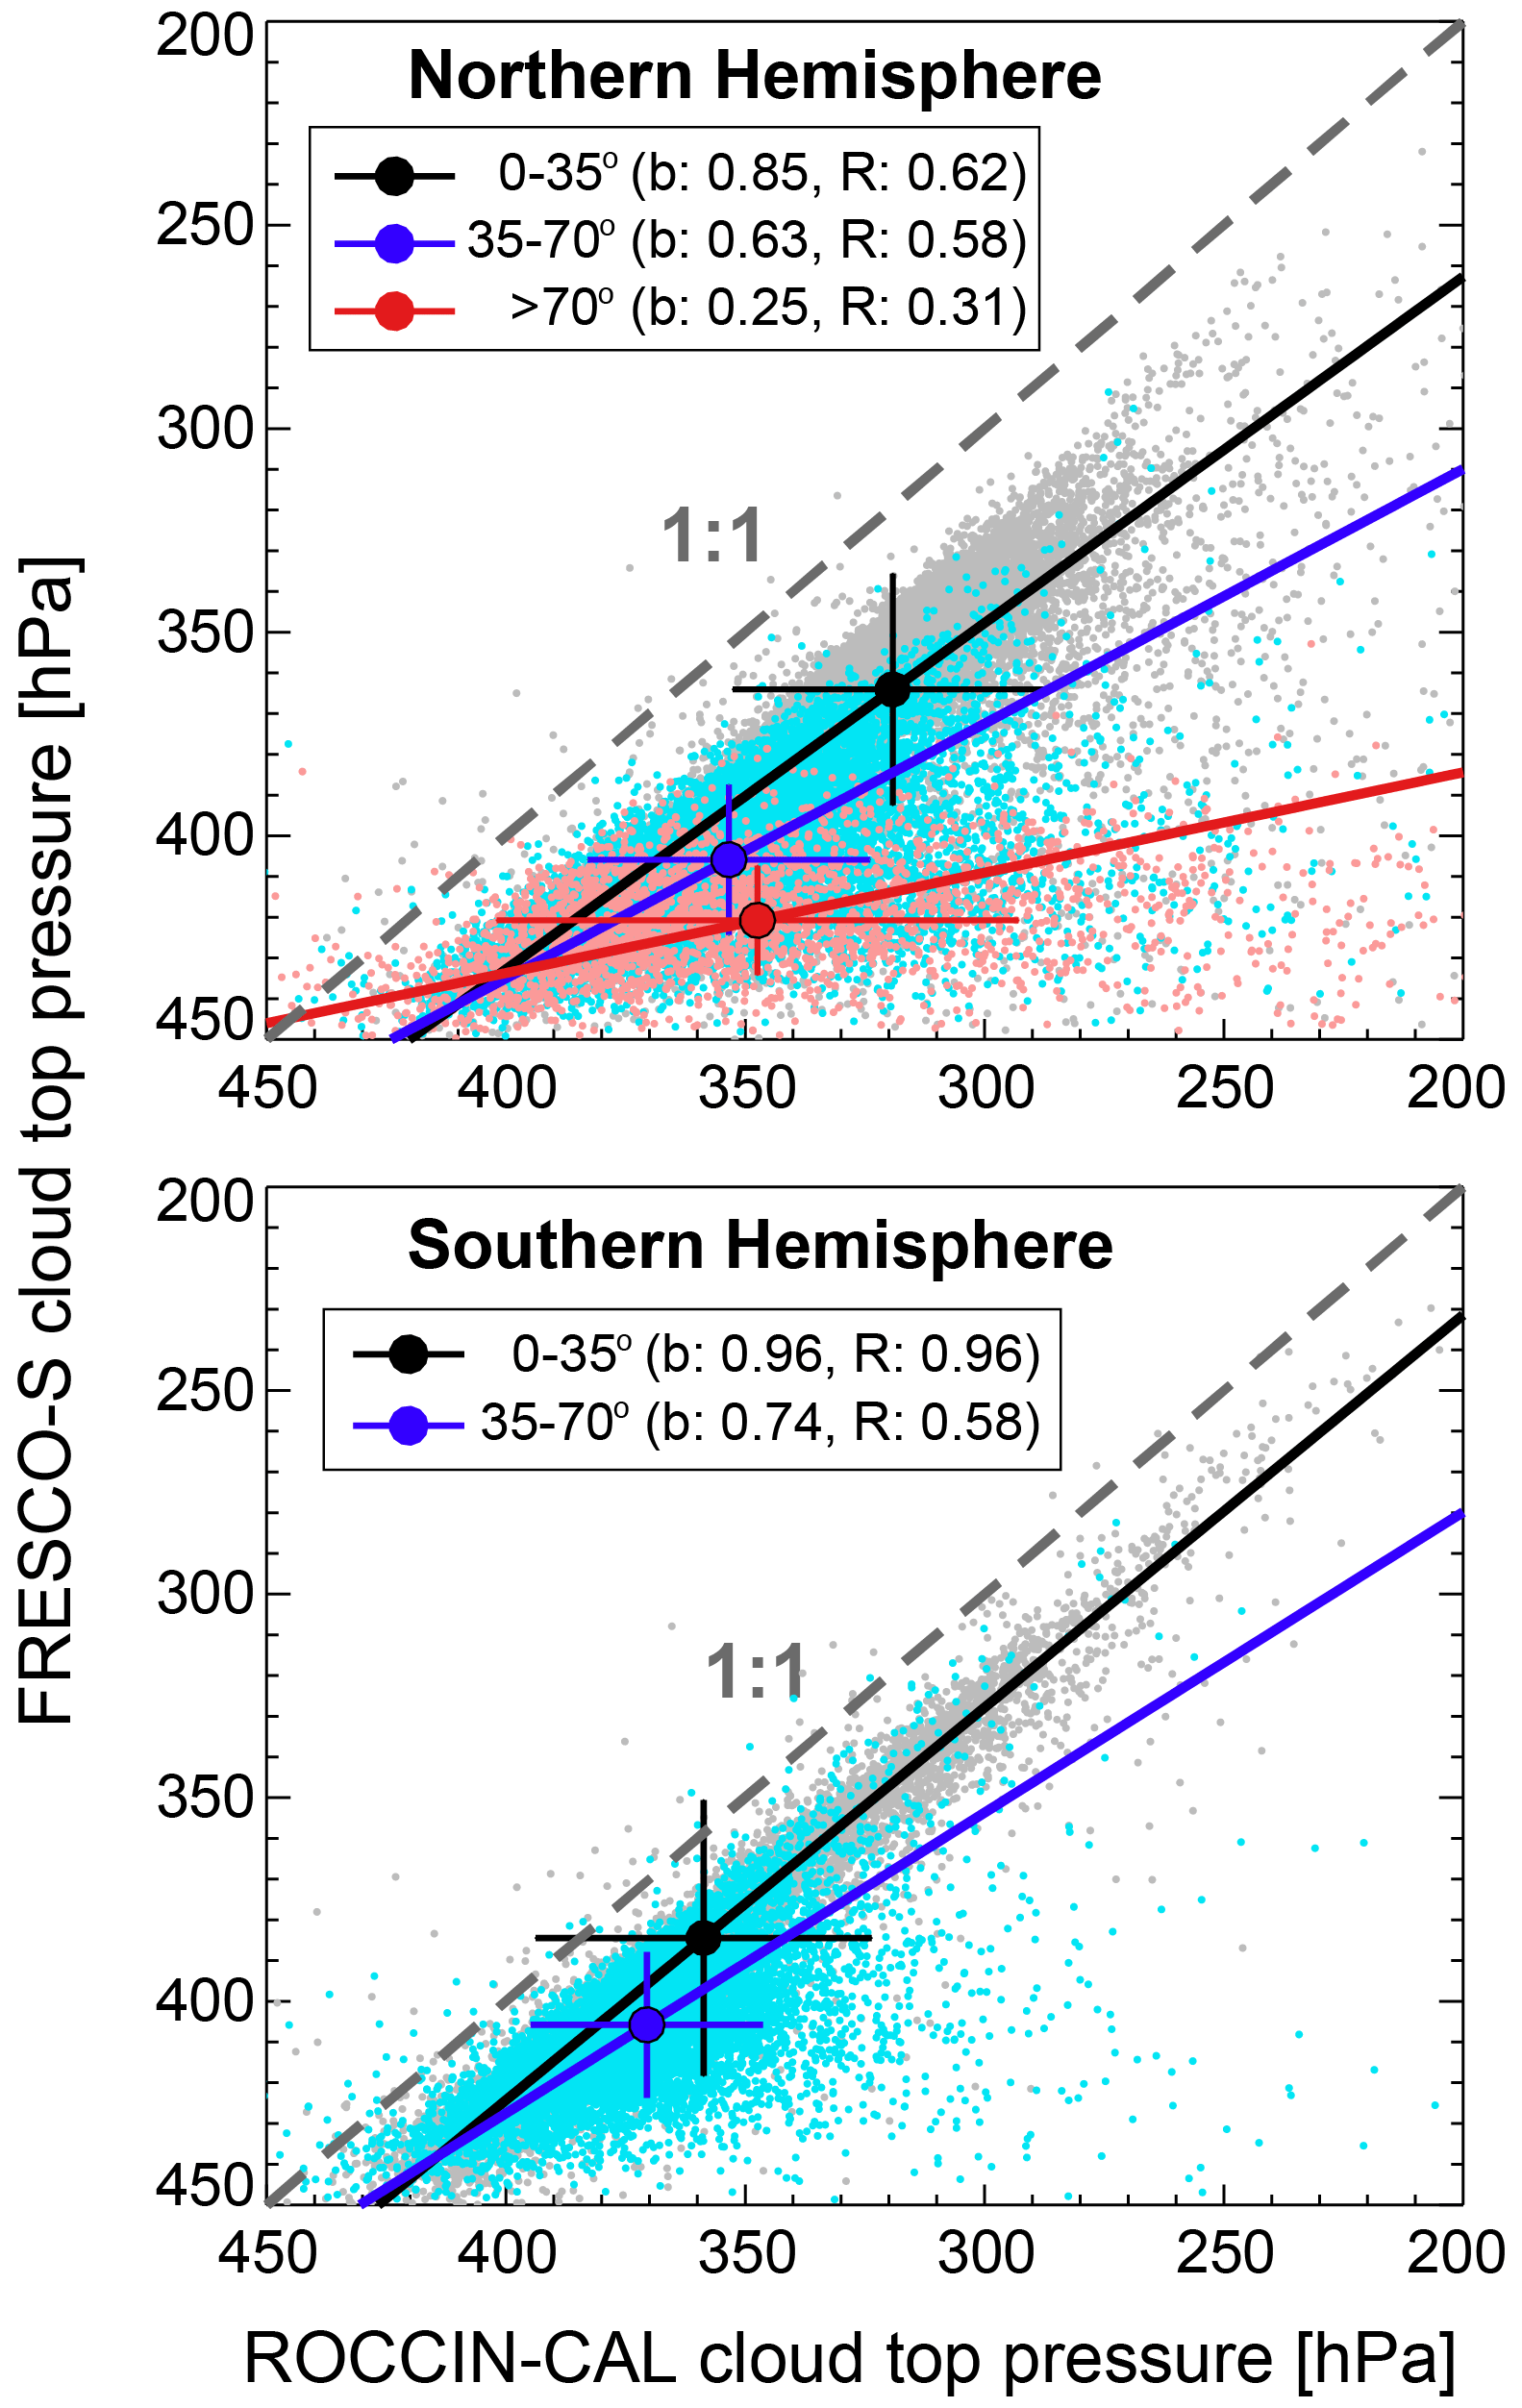
Figure 7Comparison of FRESCO-S and ROCINN-CAL cloud-top pressures from optically thick clouds in the upper troposphere for June–August 2019. Data are gridded to for TROPOMI pixels with FRESCO-S cloud fractions ≥0.7 and cloud-top pressures at 450–180 hPa. Small points are gridded seasonal means, and lines are RMA regressions for the tropics (grey points, black regression line), subtropics and midlatitudes (cyan, blue), and the Arctic (pink, red). Large points are latitude band means, and error bars are corresponding standard deviations. Grey dashed lines show the 1:1 relationship. Values in the legend are RMA regression slopes (b) and Pearson's correlation coefficients (R).
We evaluate TROPOMI UT NO2 with multiyear (2005–2007) seasonal mean cloud-sliced UT NO2 from OMI at (Marais et al., 2018). OMI data are for 2005–2007, as this predates the substantial data loss caused by the row anomaly (Schenkeveld et al., 2017; Torres et al., 2018). The OMI product is retrieved in a similar manner to TROPOMI, except that the GMI CTM is used to diagnose and remove steep gradients in NO2 (≥0.33 pptv hPa−1), and the OMI retrieval ceiling is lower (280 hPa, ∼10 km) than TROPOMI (180 hPa, ∼12.5 km). In regions where lightning is prevalent, the vertical distribution of NO2 increases with altitude by 10–50 pptv across 280–180 hPa, as is observed with vertical profiles of NO2 from spring–summer research aircraft campaign measurements over the US (Boersma et al., 2011; Silvern et al., 2018). Strict filtering applied to cloud-slicing removes most scenes where the increase in NO2 with altitude exceeds 33 pptv across 280–180 hPa, based on the synthetic experiment with GEOS-Chem. The influence of more than a 10-year gap between the OMI and TROPOMI UT NO2 datasets on the comparison is challenging to quantify, due to paucity of routine measurements of NO2 in the UT. The contribution of changes in lightning activity should be small, as interannual variability is small (<5 %), and there is no discernible trend in the long-term record of satellite observations of lightning flashes (Schumann and Huntrieser, 2007). According to most climate models, there is an increase in lightning flashes due to global warming (Romps et al., 2014; Finney et al., 2016), though almost all of these models use the same positive relationship between lightning flashes and cloud-top heights first proposed by Price and Rind (1992). The few models that consider lightning flash dependence on upward mass flux predict a decline in lightning flashes (Finney et al., 2014, 2018).

Figure 8Comparison of TROPOMI and OMI cloud-sliced UT NO2. Points are seasonal means in June 2019 to May 2020 for TROPOMI and January 2005 to December 2007 for OMI gridded to the same (latitude × longitude) grid for FRESCO-S vs. OMI (upper panel, red) and ROCINN-CAL vs. OMI (lower panel, blue). Values give the number of points, Pearson's correlation coefficients (R), RMA regression coefficients, and, in parentheses, bootstrap resampling slope and intercept errors.
Figure 8 evaluates spatial consistency between TROPOMI and OMI seasonal mean UT NO2 on the OMI grid () for TROPOMI cloud-sliced UT NO2 grid squares with at least 10 cloud-sliced retrievals. TROPOMI is spatially consistent with OMI in all seasons for both products (R=0.6–0.8). The TROPOMI background is 12–25 pptv more than OMI for FRESCO-S and 20–26 pptv more than OMI for ROCINN-CAL, based on the intercepts in Fig. 8. This may be due to the observed increase in NO2 with altitude across the sampling pressure ceilings of the two products (280 hPa for OMI, 180 hPa for TROPOMI), but other differences between the products may contribute. The OMI UT NO2 product uses cloud information derived from OMI O2−O2 slant columns. The signal from the O2−O2 dimer declines with altitude, increasing uncertainty in the retrieval with altitude (Veefkind et al., 2016). High-altitude clouds from OMI would have to be higher in altitude than TROPOMI to contribute to the positive offset in TROPOMI UT NO2 in Fig. 8, based on results from the synthetic test of lowering GEOS-Chem cloud-top heights by 1 km. The direction of the bias in OMI high-altitude cloud-top heights compared to lidar–radar measurements also does not appear to be systematic (Veefkind et al., 2016). The retrieval approaches of the TROPOMI (DOMINO product) and OMI (NASA Standard Product) slant columns are also distinct. DOMINO-retrieved NO2 column densities are typically greater than those from NASA (Hains et al., 2010; Dirksen et al., 2011). The regression slopes in Fig. 8 are closest to unity for June–August and March–May for FRESCO-S and September–November for ROCINN-CAL. The weaker variance in December–February in both TROPOMI products compared to OMI could reflect the need to account for seasonality in the stratospheric variance correction but also could be because we derive a stratospheric variance correction for a single site. The discrepancy between OMI and TROPOMI UT NO2 is much greater than in Fig. 8 if no correction factors are applied to TROPOMI (Fig. S5). TROPOMI UT NO2 background concentrations (intercepts from RMA regression of TROPOMI versus OMI) are 16–35 pptv more than OMI for FRESCO-S and 27–36 pptv more for ROCINN-CAL, and slopes exceed unity in all seasons (1.3–1.7 for FRESCO-S, 1.2–1.5 for ROCINN-CAL).
We have developed new products of NO2 in the upper troposphere (UT; ∼8–12 km) by cloud-slicing partial columns of NO2 from the space-based TROPOMI instrument. This involves regressing partial NO2 columns against cloud-top pressures and converting regression slopes to UT NO2 mixing ratios.
We first refined and tested representativeness of cloud-sliced UT NO2 by applying cloud-slicing to synthetic partial columns from the GEOS-Chem model. Synthetic cloud-sliced UT NO2 values are spatially consistent (R=0.64) with the synthetic truth, but preferentially sampling cloudy scenes and substantial data loss contribute to a resolution-dependent positive bias in cloud-sliced UT NO2 of 11 %–22 %.
Before applying cloud-slicing to TROPOMI, we evaluated TROPOMI with Pandora total columns at high-altitude sites (Mauna Loa, Izaña, Altzomoni) and Pandora and MAX-DOAS free-tropospheric columns at Izaña. We identified discrepancies between TROPOMI and ground-based NO2 measurements that include a 13 % underestimate in TROPOMI stratospheric NO2 variance and 50 % overestimate in TROPOMI tropospheric columns that would lead to an overestimate in cloud-sliced UT NO2.
We retrieved UT NO2 from TROPOMI by applying the refined cloud-slicing algorithm to corrected TROPOMI partial columns above optically thick clouds with cloud-top heights at 450–180 hPa using two alternate cloud products, FRESCO-S and ROCINN-CAL. ROCINN-CAL UT NO2 has more extensive coverage (0–70∘ N/S) than FRESCO-S (0–45∘ N/S) due to its greater abundance of optically thick clouds. Coincident UT NO2 values from the two products exhibit similar spatial distribution, but background UT NO2 from ROCINN-CAL is 4–9 pptv more than FRESCO-S. This is due to greater contamination from NO2 below clouds in ROCINN-CAL but also steeper cloud-slicing regression slopes for ROCINN-CAL, as cloud-top heights between the two products deviate with increasing cloud-top pressure. Ongoing validation studies are needed to resolve these differences.
Both products are spatially correlated with the existing coarse resolution (5∘ latitude × 8∘ longitude) Ozone Monitoring Instrument (OMI) product, except that TROPOMI is 16–36 pptv more than OMI, which we reason is due to the widely documented increase in NO2 with altitude from the OMI pressure ceiling (280 hPa) to that for TROPOMI (180 hPa) and differences in NO2 column density retrievals.
TROPOMI UT NO2 products presented here have the potential to provide routine, extensive, and consistent measurements of NOx in the UT and, as TROPOMI observations accumulate, aid in characterizing interannual and long-term variability in NOx in the undersampled UT.
Python code used to process TROPOMI data is available at https://doi.org/10.5281/zenodo.4058442 (Marais and Roberts, 2020).
Data can be requested from Eloise A. Marais for TROPOMI UT NO2, Sungyeon Choi for OMI UT NO2, Monica Navarro-Comas for MAX-DOAS slant columns, and Robert G. Ryan for MAX-DOAS vertical columns.
The supplement related to this article is available online at: https://doi.org/10.5194/amt-14-2389-2021-supplement.
EAM led the analysis and writing, simulated GEOS-Chem, and cloud-sliced TROPOMI UT NO2 and GEOS-Chem. JFR refined and documented the Python processing code. RGR retrieved MAX-DOAS vertical tropospheric columns. HE and FKB provided guidance on best use and evaluation of TROPOMI NO2. SC and JJ retrieved OMI UT NO2 and provided guidance on cloud-slicing. NA and AR are Pandora site PIs, and AC is PI of PGN. MNC maintains the RASAS-II instrument and retrieved the MAX-DOAS slant columns at Izaña. LG conducted MAX-DOAS geospatial sampling sensitivity tests for Izaña.
The authors declare that they have no conflict of interest.
The authors are grateful to Piet Stammes and colleagues for retrieval of the FRESCO-S cloud product and Diego Loyola and colleagues for retrieval of the OCRA and ROCINN-CAL cloud product. The PGN is a bilateral project supported with funding from NASA and ESA. The Pandora measurements in Altzomoni were possible thanks to technical assistance from Alejandro Bezanilla.
This research has been supported by the European Research Council under the European Union's Horizon 2020 research and innovation programme (through the Starting Grant awarded to Eloise A. Marais, UpTrop (grant no. 851854)). The Pandora measurements in Altzomoni were possible thanks to financial support of Conacyt-AEM (grant no. 275239). Robert G. Ryan has received financial support from the Australian Research Council Centre of Excellence for Climate Extremes and the Albert Shimmins Memorial Fund through the University of Melbourne.
This paper was edited by Gerrit Kuhlmann and reviewed by two anonymous referees.
Allen, D., Pickering, K., Duncan, B., and Damon, M.: Impact of lightning NO emissions on North American photochemistry as determined using the Global Modeling Initiative (GMI) model, J. Geophys. Res.-Atmos., 115, 1–24, https://doi.org/10.1029/2010jd014062, 2010.
Amedro, D., Bunkan, A. J. C., Berasategui, M., and Crowley, J. N.: Kinetics of the OH + NO2 reaction: rate coefficients (217–333 K, 16–1200 mbar) and fall-off parameters for N2 and O2 bath gases, Atmos. Chem. Phys., 19, 10643–10657, https://doi.org/10.5194/acp-19-10643-2019, 2019.
Argyrouli, A., Sneep, M., and Lambert, J.-C.: S5P Mission Performance Centre CLOUD [L2_CLOUD] Readme, available at: https://sentinel.esa.int/documents/247904/3541451/Sentinel-5P-Cloud-Level-2-Product-Readme-File (last accessed: 20 January 2020), 2019.
Baumgardner, D., Grutter, M., Allan, J., Ochoa, C., Rappenglueck, B., Russell, L. M., and Arnott, P.: Physical and chemical properties of the regional mixed layer of Mexico's Megapolis, Atmos. Chem. Phys., 9, 5711–5727, https://doi.org/10.5194/acp-9-5711-2009, 2009.
Beirle, S., Koshak, W., Blakeslee, R., and Wagner, T.: Global patterns of lightning properties derived by OTD and LIS, Nat. Hazards Earth Syst. Sci., 14, 2715–2726, https://doi.org/10.5194/nhess-14-2715-2014, 2014.
Belmonte Rivas, M., Veefkind, P., Eskes, H., and Levelt, P.: OMI tropospheric NO2 profiles from cloud slicing: constraints on surface emissions, convective transport and lightning NOx, Atmos. Chem. Phys., 15, 13519–13553, https://doi.org/10.5194/acp-15-13519-2015, 2015.
Bertram, T. H., Perring, A. E., Wooldridge, P. J., Crounse, J. D., Kwan, A. J., Wennberg, P. O., Scheuer, E., Dibb, J., Avery, M., Sachse, G., Vay, S. A., Crawford, J. H., McNaughton, C. S., Clarke, A., Pickering, K. E., Fuelberg, H., Huey, G., Blake, D. R., Singh, H. B., Hall, S. R., Shetter, R. E., Fried, A., Heikes, B. G., and Cohen, R. C.: Direct measurements of the convective recycling of the upper troposphere, Science, 315, 816–820, https://doi.org/10.1126/science.1134548, 2007.
Boersma, K. F., Eskes, H. J., and Brinksma, E. J.: Error analysis for tropospheric NO2 retrieval from space, J. Geophys. Res.-Atmos., 109, 1–26, https://doi.org/10.1029/2003jd003962, 2004.
Boersma, K. F., Eskes, H. J., Dirksen, R. J., van der A, R. J., Veefkind, J. P., Stammes, P., Huijnen, V., Kleipool, Q. L., Sneep, M., Claas, J., Leitão, J., Richter, A., Zhou, Y., and Brunner, D.: An improved tropospheric NO2 column retrieval algorithm for the Ozone Monitoring Instrument, Atmos. Meas. Tech., 4, 1905–1928, https://doi.org/10.5194/amt-4-1905-2011, 2011.
Bottenheim, J. W., Gallant, A. G., and Brice, K. A.: Measurements of NOy species and O3 at 82∘N latitude, Geophys. Res. Lett., 13, 113–116, https://doi.org/10.1029/GL013i002p00113, 1986.
Bradshaw, J., Davis, D., Grodzinsky, G., Smyth, S., Newell, R., Sandholm, S., and Liu, S.: Observed distributions of nitrogen oxides in the remote free troposphere from the NASA global tropospheric experiment programs, Rev. Geophys., 38, 61–116, https://doi.org/10.1029/1999rg900015, 2000.
Bravo, A. H., Sosa, E. R., Sánchez, A. P., Jaimes, P. M., and Saavedra, R. M. I.: Impact of wildfires on the air quality of Mexico City, 1992–1999, Environ. Pollut., 117, 243–253, https://doi.org/10.1016/S0269-7491(01)00277-9, 2002.
Brogniez, C., Bazureau, A., Lenoble, J., and Chu, W. P.: Stratospheric Aerosol and Gas Experiment (SAGE) III measurements: A study on the retrieval of ozone, nitrogen dioxide, and aerosol extinction coefficients, J. Geophys. Res., 107, 1–21, https://doi.org/10.1029/2001jd001576, 2002.
Brohede, S. M., Haley, C. S., McLinden, C. A., Sioris, C. E., Murtagh, D. P., Petelina, S. V., Llewellyn, E. J., Bazureau, A., Goutail, F., Randall, C. E., Lumpe, J. D., Taha, G., Thomasson, L. W., and Gordley, L. L.: Validation of Odin/OSIRIS stratospheric NO2 profiles, J. Geophys. Res.-Atmos., 112, 1–22, https://doi.org/10.1029/2006JD007586, 2007.
Browne, E. C., Perring, A. E., Wooldridge, P. J., Apel, E., Hall, S. R., Huey, L. G., Mao, J., Spencer, K. M., Clair, J. M. St., Weinheimer, A. J., Wisthaler, A., and Cohen, R. C.: Global and regional effects of the photochemistry of CH3O2NO2: evidence from ARCTAS, Atmos. Chem. Phys., 11, 4209–4219, https://doi.org/10.5194/acp-11-4209-2011, 2011.
Bucsela, E. J., Krotkov, N. A., Celarier, E. A., Lamsal, L. N., Swartz, W. H., Bhartia, P. K., Boersma, K. F., Veefkind, J. P., Gleason, J. F., and Pickering, K. E.: A new stratospheric and tropospheric NO2; retrieval algorithm for nadir-viewing satellite instruments: applications to OMI, Atmos. Meas. Tech., 6, 2607-2626, https://doi.org/10.5194/amt-6-2607-2013, 2013.
Cecil, D. J., Buechler, D. E., and Blakeslee, R. J.: Gridded lightning climatology from TRMM-LIS and OTD: Dataset description, Atmos. Res., 135, 404–414, https://doi.org/10.1016/j.atmosres.2012.06.028, 2014.
Cede, A., Tiefengraber, M., Gebetsberger, M., and Kreuter, A.: Fiducial reference measurements for air quality: TN on PGN products “correct use” guidelines, version 1, LuftBlick, Innsbruck, Austria, available at: https://www.pandonia-global-network.org/wp-content/uploads/2020/01/LuftBlick_FRM4AQ_PGNUserGuidelines_RP_2019009_v1.pdf (last access: 4 February 2020), 2019.
Chang, W. L., Bhave, P. V., Brown, S. S., Riemer, N., Stutz, J., and Dabdub, D.: Heterogeneous atmospheric chemistry, ambient measurements, and model calculations of N2O5: A review, Aerosol Sci. Tech., 45, 665–695, https://doi.org/10.1080/02786826.2010.551672, 2011.
Choi, S., Joiner, J., Choi, Y., Duncan, B. N., Vasilkov, A., Krotkov, N., and Bucsela, E.: First estimates of global free-tropospheric NO2 abundances derived using a cloud-slicing technique applied to satellite observations from the Aura Ozone Monitoring Instrument (OMI), Atmos. Chem. Phys., 14, 10565–10588, https://doi.org/10.5194/acp-14-10565-2014, 2014.
Compernolle, S., Argyrouli, A., Lutz, R., Sneep, M., Lambert, J.-C., Fjæraa, A. M., Hubert, D., Keppens, A., Loyola, D., O'Connor, E., Romahn, F., Stammes, P., Verhoelst, T., and Wang, P.: Validation of the Sentinel-5 Precursor TROPOMI cloud data with Cloudnet, Aura OMI O2-O2, MODIS and Suomi-NPP VIIRS, Atmos. Meas. Tech. Discuss. [preprint], https://doi.org/10.5194/amt-2020-122, in review, 2020.
Crawford, J., Davis, D., Olson, J., Chen, G., Liu, S., Fuelberg, H., Hannan, J., Kondo, Y., Anderson, B., Gregory, G., Sachse, G., Talbot, R., Viggiano, A., Heikes, B., Snow, J., Singh, H., and Blake, D.: Evolution and chemical consequences of lightning-produced NOx observed in the North Atlantic upper troposphere, J. Geophys. Res.-Atmos., 105, 19795–19809, https://doi.org/10.1029/2000JD900183, 2000.
Crutzen, P. J.: The influence of nitrogen oxides on the atmospheric ozone content, Q. J. Roy. Meteor. Soc., 96, 320–325, https://doi.org/10.1002/qj.49709640815, 1970.
Dahlmann, K., Grewe, V., Ponater, M., and Matthes, S.: Quantifying the contributions of individual NOx sources to the trend in ozone radiative forcing, Atmos. Environ., 45, 2860–2868, https://doi.org/10.1016/j.atmosenv.2011.02.071, 2011.
Dirksen, R. J., Boersma, K. F., Eskes, H. J., Ionov, D. V., Bucsela, E. J., Levelt, P. F., and Kelder, H. M.: Evaluation of stratospheric NO2 retrieved from the Ozone Monitoring Instrument: Intercomparison, diurnal cycle, and trending, J. Geophys. Res., 116, 1–22, https://doi.org/10.1029/2010jd014943, 2011.
Dubé, K., Bourassa, A., Zawada, D., Degenstein, D., Damadeo, R., Flittner, D., and Randel, W.: Accounting for the photochemical variation in stratospheric NO2 in the SAGE III/ISS solar occultation retrieval, Atmos. Meas. Tech., 14, 557–566, https://doi.org/10.5194/amt-14-557-2021, 2021.
Ehhalt, D. H., Rohrer, F., and Wahner, A.: Sources and distribution of NOx in the upper troposphere at northern midlatitudes, J. Geophys. Res.-Atmos., 97, 3725–3738, https://doi.org/10.1029/91JD03081, 1992.
Finney, D. L., Doherty, R. M., Wild, O., Huntrieser, H., Pumphrey, H. C., and Blyth, A. M.: Using cloud ice flux to parametrise large-scale lightning, Atmos. Chem. Phys., 14, 12665–12682, https://doi.org/10.5194/acp-14-12665-2014, 2014.
Finney, D. L., Doherty, R. M., Wild, O., Young, P. J., and Butler, A.: Response of lightning NOx emissions and ozone production to climate change: Insights from the Atmospheric Chemistry and Climate Model Intercomparison Project, Geophys. Res. Lett., 43, 5492–5500, https://doi.org/10.1002/2016gl068825, 2016.
Finney, D. L., Doherty, R. M., Wild, O., Stevenson, D. S., MacKenzie, I. A., and Blyth, A. M.: A projected decrease in lightning under climate change, Nat. Clim. Change, 8, 210–213, https://doi.org/10.1038/s41558-018-0072-6, 2018.
Frieß, U., Monks, P. S., Remedios, J. J., Rozanov, A., Sinreich, R., Wagner, T., and Platt, U.: MAX-DOAS O4 measurements: A new technique to derive information on atmospheric aerosols: 2. Modeling studies, J. Geophys. Res.-Atmos., 111, 1–20, https://doi.org/10.1029/2005JD006618, 2006.
Gil, M., Yela, M., Gunn, L. N., Richter, A., Alonso, I., Chipperfield, M. P., Cuevas, E., Iglesias, J., Navarro, M., Puentedura, O., and Rodríguez, S.: NO2 climatology in the northern subtropical region: diurnal, seasonal and interannual variability, Atmos. Chem. Phys., 8, 1635–1648, https://doi.org/10.5194/acp-8-1635-2008, 2008.
Gil-Ojeda, M., Navarro-Comas, M., Gómez-Martín, L., Adame, J. A., Saiz-Lopez, A., Cuevas, C. A., González, Y., Puentedura, O., Cuevas, E., Lamarque, J.-F., Kinninson, D., and Tilmes, S.: NO2 seasonal evolution in the north subtropical free troposphere, Atmos. Chem. Phys., 15, 10567–10579, https://doi.org/10.5194/acp-15-10567-2015, 2015.
Gomez, L., Navarro-Comas, M., Puentedura, O., Gonzalez, Y., Cuevas, E., and Gil-Ojeda, M.: Long-path averaged mixing ratios of O3 and NO2 in the free troposphere from mountain MAX-DOAS, Atmos. Meas. Tech., 7, 3373–3386, https://doi.org/10.5194/amt-7-3373-2014, 2014.
Gruzdev, A. N. and Elokhov, A. S.: Variability of stratospheric and tropospheric nitrogen dioxide observed by the visible spectrophotometer at Zvenigorod, Russia, Int. J. Remote Sens., 32, 3115–3127, https://doi.org/10.1080/01431161.2010.541524, 2011.
Hains, J. C., Boersma, K. F., Kroon, M., Dirksen, R. J., Cohen, R. C., Perring, A. E., Bucsela, E., Volten, H., Swart, D. P. J., Richter, A., Wittrock, F., Schoenhardt, A., Wagner, T., Ibrahim, O. W., van Roozendael, M., Pinardi, G., Gleason, J. F., Veefkind, J. P., and Levelt, P.: Testing and improving OMI DOMINO tropospheric NO2 using observations from the DANDELIONS and INTEX-B validation campaigns, J. Geophys. Res., 115, 1–20, https://doi.org/10.1029/2009jd012399, 2010.
Henderson, B. H., Pinder, R. W., Crooks, J., Cohen, R. C., Hutzell, W. T., Sarwar, G., Goliff, W. S., Stockwell, W. R., Fahr, A., Mathur, R., Carlton, A. G., and Vizuete, W.: Evaluation of simulated photochemical partitioning of oxidized nitrogen in the upper troposphere, Atmos. Chem. Phys., 11, 275–291, https://doi.org/10.5194/acp-11-275-2011, 2011.
Henderson, B. H., Pinder, R. W., Crooks, J., Cohen, R. C., Carlton, A. G., Pye, H. O. T., and Vizuete, W.: Combining Bayesian methods and aircraft observations to constrain the HO. + NO2 reaction rate, Atmos. Chem. Phys., 12, 653–667, https://doi.org/10.5194/acp-12-653-2012, 2012.
Herman, J., Cede, A., Spinei, E., Mount, G., Tzortziou, M., and Abuhassan, N.: NO2 column amounts from ground-based Pandora and MFDOAS spectrometers using the direct-sun DOAS technique: Intercomparisons and application to OMI validation, J. Geophys. Res.-Atmos., 114, 1–20, https://doi.org/10.1029/2009jd011848, 2009.
Holmes, C. D., Bertram, T. H., Confer, K. L., Graham, K. A., Ronan, A. C., Wirks, C. K., and Shah, V.: The role of clouds in the tropospheric NOx cycle: A new modeling approach for cloud chemistry and its global implications, Geophys. Res. Lett., 46, 4980–4990, https://doi.org/10.1029/2019GL081990, 2019.
Hönninger, G., von Friedeburg, C., and Platt, U.: Multi axis differential optical absorption spectroscopy (MAX-DOAS), Atmos. Chem. Phys., 4, 231–254, https://doi.org/10.5194/acp-4-231-2004, 2004.
Ialongo, I., Virta, H., Eskes, H., Hovila, J., and Douros, J.: Comparison of TROPOMI/Sentinel-5 Precursor NO2 observations with ground-based measurements in Helsinki, Atmos. Meas. Tech., 13, 205–218, https://doi.org/10.5194/amt-13-205-2020, 2020.
Jaeglé, L., Jacob, D. J., Wang, Y., Weinheimer, A. J., Ridley, B. A., Campos, T. L., Sachse, G. W., and Hagen, D. E.: Sources and chemistry of NOx in the upper troposphere over the United States, Geophys. Res. Lett., 25, 1705–1708, https://doi.org/10.1029/97gl03591, 1998.
Jiang, Z., McDonald, B. C., Worden, H., Worden, J. R., Miyazaki, K., Qu, Z., Henze, D. K., Jones, D. B. A., Arellano, A. F., Fischer, E. V., Zhu, L., and Boersma, K. F.: Unexpected slowdown of US pollutant emission reduction in the past decade, P. Natl. Acad. Sci. USA, 115, 5099, https://doi.org/10.1073/pnas.1801191115, 2018.
Joiner, J., Vasilkov, A. P., Gupta, P., Bhartia, P. K., Veefkind, P., Sneep, M., de Haan, J., Polonsky, I., and Spurr, R.: Fast simulators for satellite cloud optical centroid pressure retrievals; evaluation of OMI cloud retrievals, Atmos. Meas. Tech., 5, 529–545, https://doi.org/10.5194/amt-5-529-2012, 2012.
Jones, A., Walker, K. A., Jin, J. J., Taylor, J. R., Boone, C. D., Bernath, P. F., Brohede, S., Manney, G. L., McLeod, S., Hughes, R., and Daffer, W. H.: Technical Note: A trace gas climatology derived from the Atmospheric Chemistry Experiment Fourier Transform Spectrometer (ACE-FTS) data set, Atmos. Chem. Phys., 12, 5207–5220, https://doi.org/10.5194/acp-12-5207-2012, 2012.
Kablick III, G. P., Allen, D. R., Fromm, M. D., and Nedoluha, G. E.: Australian PyroCb smoke generates synoptic-scale stratospheric anticyclones, Geophys. Res. Lett., 47, 1–9, https://doi.org/10.1029/2020GL088101, 2020.
Lamarque, J. F., Brasseur, G. P., Hess, P. G., and Müller, J. F.: Three-dimensional study of the relative contributions of the different nitrogen sources in the troposphere, J. Geophys. Res.-Atmos., 101, 22955–22968, https://doi.org/10.1029/96JD02160, 1996.
Lambert, J.-C., Keppens, A., Hubert, D., Langerock, B., Eichmann, K.-U., Kleipool, Q., Sneep, M., Verhoelst, T., Wagner, T., Weber, M., Ahn, C., Argyrouli, A., Balis, D., Chan, K. L., Compernolle, S., Smedt, I. D., Eskes, H., Fjæraa, A. M., Garane, K., Gleason, J. F., Goutail, F., Granville, J., Hedelt, P., Heue, K.-P., Jaross, G., Koukouli, M., Landgraf, J., Lutz, R., Niemejer, S., Pazmiño, A., Pinardi, G., Pommereau, J.-P., Richter, A., Rozemeijer, N., Sha, M. K., Zweers, D. S., Theys, N., Tilstra, G., Torres, O., Valks, P., Vigouroux, C., and Wang, P.: S5P Mission Performance Centre Routine Operations Consolidated Validation Report series, Issue 2, Version 02.0.2, available at: http://www.tropomi.eu/sites/default/files/files/publicS5P-MPC-IASB-ROCVR-02.0.2-20190411_FINAL.pdf (last access: 3 February 2020), 2019.
Laughner, J. L., Zhu, Q., and Cohen, R. C.: The Berkeley High Resolution Tropospheric NO2 product, Earth Syst. Sci. Data, 10, 2069–2095, https://doi.org/10.5194/essd-10-2069-2018, 2018.
Levelt, P. F., Joiner, J., Tamminen, J., Veefkind, J. P., Bhartia, P. K., Stein Zweers, D. C., Duncan, B. N., Streets, D. G., Eskes, H., van der A, R., McLinden, C., Fioletov, V., Carn, S., de Laat, J., DeLand, M., Marchenko, S., McPeters, R., Ziemke, J., Fu, D., Liu, X., Pickering, K., Apituley, A., González Abad, G., Arola, A., Boersma, F., Chan Miller, C., Chance, K., de Graaf, M., Hakkarainen, J., Hassinen, S., Ialongo, I., Kleipool, Q., Krotkov, N., Li, C., Lamsal, L., Newman, P., Nowlan, C., Suleiman, R., Tilstra, L. G., Torres, O., Wang, H., and Wargan, K.: The Ozone Monitoring Instrument: overview of 14 years in space, Atmos. Chem. Phys., 18, 5699–5745, https://doi.org/10.5194/acp-18-5699-2018, 2018.
Loyola, D. G., Thomas, W., Livschitz, Y., Ruppert, T., Albert, P., and Hollmann, R.: Cloud properties derived from GOME/ERS-2 backscatter data for trace gas retrieval, IEEE T. Geosci. Remote, 45, 2747–2758, https://doi.org/10.1109/TGRS.2007.901043, 2007.
Loyola, D. G., Gimeno García, S., Lutz, R., Argyrouli, A., Romahn, F., Spurr, R. J. D., Pedergnana, M., Doicu, A., Molina García, V., and Schüssler, O.: The operational cloud retrieval algorithms from TROPOMI on board Sentinel-5 Precursor, Atmos. Meas. Tech., 11, 409–427, https://doi.org/10.5194/amt-11-409-2018, 2018a.
Loyola, D. G., Lutz, R., Argyrouli, A., and Spurr, R.: S5P/TROPOMI ATBD Cloud Products, available at: https://sentinel.esa.int/documents/247904/2476257/Sentinel-5P-TROPOMI-ATBD-Clouds (last access: 20 January 2020), 2018b.
Marais, E. A. and Roberts, J. F.: eamarais/erc-uptrop: tropomi-ut-no2-1.1.0, Version 1.1.0, Zenodo, https://doi.org/10.5281/zenodo.4058442, 2020.
Marais, E. A., Jacob, D. J., Choi, S., Joiner, J., Belmonte-Rivas, M., Cohen, R. C., Beirle, S., Murray, L. T., Schiferl, L. D., Shah, V., and Jaeglé, L.: Nitrogen oxides in the global upper troposphere: interpreting cloud-sliced NO2 observations from the OMI satellite instrument, Atmos. Chem. Phys., 18, 17017–17027, https://doi.org/10.5194/acp-18-17017-2018, 2018.
Mickley, L. J., Murti, P. P., Jacob, D. J., Logan, J. A., Koch, D. M., and Rind, D.: Radiative forcing from tropospheric ozone calculated with a unified chemistry-climate model, J. Geophys. Res.-Atmos., 104, 30153–30172, https://doi.org/10.1029/1999JD900439, 1999.
Murray, L. T., Jacob, D. J., Logan, J. A., Hudman, R. C., and Koshak, W. J.: Optimized regional and interannual variability of lightning in a global chemical transport model constrained by LIS/OTD satellite data, J. Geophys. Res.-Atmos., 117, D20307, https://doi.org/10.1029/2012jd017934, 2012.
Murray, L. T., Logan, J. A., and Jacob, D. J.: Interannual variability in tropical tropospheric ozone and OH: The role of lightning, J. Geophys. Res.-Atmos., 118, 11468–11480, https://doi.org/10.1002/jgrd.50857, 2013.
Nault, B. A., Garland, C., Wooldridge, P. J., Brune, W. H., Campuzano-Jost, P., Crounse, J. D., Day, D. A., Dibb, J., Hall, S. R., Huey, L. G., Jimenez, J. L., Liu, X. X., Mao, J. Q., Mikoviny, T., Peischl, J., Pollack, I. B., Ren, X. R., Ryerson, T. B., Scheuer, E., Ullmann, K., Wennberg, P. O., Wisthaler, A., Zhang, L., and Cohen, R. C.: Observational constraints on the oxidation of NOx in the upper troposphere, J. Phys. Chem. A, 120, 1468–1478, https://doi.org/10.1021/acs.jpca.5b07824, 2016.
Newchurch, M. J., Allen, M., Gunson, M. R., Salawitch, R. J., Collins, G. B., Huston, K. H., Abbas, M. M., Abrams, M. C., Chang, A. Y., Fahey, D. W., Gao, R. S., Irion, F. W., Loewenstein, M., Manney, G. L., Michelsen, H. A., Podolske, J. R., Rinsland, C. P., and Zander, R.: Stratospheric NO and NO2 abundances from ATMOS solar-occultation measurements, Geophys. Res. Lett., 23, 2373–2376, https://doi.org/10.1029/96GL01196, 1996.
OPeNDAP: Open-source Project for a Network Data Access Protocol, available at: https://ghrc.nsstc.nasa.gov/opendap/lis/climatology/LIS-OTD/HRMC/data/nc/contents.html, last access: 31 December 2020.
Ott, L. E., Pickering, K. E., Stenchikov, G. L., Allen, D. J., DeCaria, A. J., Ridley, B., Lin, R. F., Lang, S., and Tao, W. K.: Production of lightning NOx and its vertical distribution calculated from three-dimensional cloud-scale chemical transport model simulations, J. Geophys. Res.-Atmos., 115, 1–19, https://doi.org/10.1029/2009jd011880, 2010.
Pavelin, E. G., Johnson, C. E., Rughooputh, S., and Toumi, R.: Evaluation of pre-industrial surface ozone measurements made using Schönbein's method, Atmos. Environ., 33, 919–929, https://doi.org/10.1016/S1352-2310(98)00257-X, 1999.
PGN (Pandonia Global Network): Pandonia data archive, available at: http://data.pandonia-global-network.org/, last access: 1 June 2020.
Pinardi, G., Van Roozendael, M., Hendrick, F., Theys, N., Abuhassan, N., Bais, A., Boersma, F., Cede, A., Chong, J., Donner, S., Drosoglou, T., Dzhola, A., Eskes, H., Frieß, U., Granville, J., Herman, J. R., Holla, R., Hovila, J., Irie, H., Kanaya, Y., Karagkiozidis, D., Kouremeti, N., Lambert, J.-C., Ma, J., Peters, E., Piters, A., Postylyakov, O., Richter, A., Remmers, J., Takashima, H., Tiefengraber, M., Valks, P., Vlemmix, T., Wagner, T., and Wittrock, F.: Validation of tropospheric NO2 column measurements of GOME-2A and OMI using MAX-DOAS and direct sun network observations, Atmos. Meas. Tech., 13, 6141–6174, https://doi.org/10.5194/amt-13-6141-2020, 2020.
Pour-Biazar, A., McNider, R. T., Roselle, S. J., Suggs, R., Jedlovec, G., Byun, D. W., Kim, S., Lin, C. J., Ho, T. C., Haines, S., Dornblaser, B., and Cameron, R.: Correcting photolysis rates on the basis of satellite observed clouds, J. Geophys. Res.-Atmos., 112, 1–17, https://doi.org/10.1029/2006JD007422, 2007.
Price, C. and Rind, D.: A simple lightning parameterization for calculating global lightning distributions, J. Geophys. Res.-Atmos., 97, 9919–9933, https://doi.org/10.1029/92JD00719, 1992.
Puentedura, O., Gil, M., Saiz-Lopez, A., Hay, T., Navarro-Comas, M., Gómez-Pelaez, A., Cuevas, E., Iglesias, J., and Gomez, L.: Iodine monoxide in the north subtropical free troposphere, Atmos. Chem. Phys., 12, 4909–4921, https://doi.org/10.5194/acp-12-4909-2012, 2012.
Randall, C. E., Rusch, D. W., Bevilacqua, R. M., Hoppel, K. W., and Lumpe, J. D.: Polar Ozone and Aerosol Measurement (POAM) II stratospheric NO2, 1993–1996, J. Geophys. Res.-Atmos., 103, 28361–28371, https://doi.org/10.1029/98jd02092, 1998.
Reed, C., Evans, M. J., Di Carlo, P., Lee, J. D., and Carpenter, L. J.: Interferences in photolytic NO2 measurements: explanation for an apparent missing oxidant?, Atmos. Chem. Phys., 16, 4707–4724, https://doi.org/10.5194/acp-16-4707-2016, 2016.
Ridley, B., Ott, L., Pickering, K., Emmons, L., Montzka, D., Weinheimer, A., Knapp, D., Grahek, F., Li, L., Heymsfield, G., McGill, M., Kucera, P., Mahoney, M. J., Baumgardner, D., Schultz, M., and Brasseur, G.: Florida thunderstorms: A faucet of reactive nitrogen to the upper troposphere, J. Geophys. Res.-Atmos., 109, 1–19, https://doi.org/10.1029/2004JD004769, 2004.
Rivera, C., Stremme, W., and Grutter, M.: Nitrogen dioxide DOAS measurements from ground and space: Comparison of zenith scattered sunlight ground-based measurements and OMI data in Central Mexico, Atmósfera, 26, 401–414, https://doi.org/10.1016/S0187-6236(13)71085-3, 2013.
Robles-Gonzalez, C., Navarro-Comas, M., Puentedura, O., Schneider, M., Hase, F., Garcia, O., Blumenstock, T., and Gil-Ojeda, M.: Intercomparison of stratospheric nitrogen dioxide columns retrieved from ground-based DOAS and FTIR and satellite DOAS instruments over the subtropical Izana station, Atmos. Meas. Tech., 9, 4471–4485, https://doi.org/10.5194/amt-9-4471-2016, 2016.
Rodgers, C. D.: Inverse Methods for Atmospheric Sounding: Theory and Practice, Series on Atmospheric, Oceanic and Planetary Physics, Vol. 2, World Scientific Publishing Co., Singapore, 2000.
Romps, D. M., Seeley, J. T., Vollaro, D., and Molinari, J.: Projected increase in lightning strikes in the United States due to global warming, Science, 346, 851–854, https://doi.org/10.1126/science.1259100, 2014.
S5P (Sentinel-5P Pre-Operations) Data Hub: availale at: https://s5phub.copernicus.eu/dhus/, last access: 15 June 2020.
Schenkeveld, V. M. E., Jaross, G., Marchenko, S., Haffner, D., Kleipool, Q. L., Rozemeijer, N. C., Veefkind, J. P., and Levelt, P. F.: In-flight performance of the Ozone Monitoring Instrument, Atmos. Meas. Tech., 10, 1957–1986, https://doi.org/10.5194/amt-10-1957-2017, 2017.
Schreier, S. F., Richter, A., Wittrock, F., and Burrows, J. P.: Estimates of free-tropospheric NO2 and HCHO mixing ratios derived from high-altitude mountain MAX-DOAS observations at midlatitudes and in the tropics, Atmos. Chem. Phys., 16, 2803–2817, https://doi.org/10.5194/acp-16-2803-2016, 2016.
Schumann, U.: The impact of nitrogen oxides emissions from aircraft upon the atmosphere at flight altitudes – results from the AERONOX project, Atmos. Environ., 31, 1723–1733, https://doi.org/10.1016/S1352-2310(96)00326-3, 1997.
Schumann, U. and Huntrieser, H.: The global lightning-induced nitrogen oxides source, Atmos. Chem. Phys., 7, 3823–3907, https://doi.org/10.5194/acp-7-3823-2007, 2007.
Silvern, R. F., Jacob, D. J., Travis, K. R., Sherwen, T., Evans, M. J., Cohen, R. C., Laughner, J. L., Hall, S. R., Ullmann, K., Crounse, J. D., Wennberg, P. O., Peischl, J., and Pollack, I. B.: Observed NO/NO2 ratios in the upper troposphere imply errors in NO-NO2-O3 cycling kinetics or an unaccounted NOx reservoir, Geophys. Res. Lett., 45, 4466–4474, https://doi.org/10.1029/2018GL077728, 2018.
Silvern, R. F., Jacob, D. J., Mickley, L. J., Sulprizio, M. P., Travis, K. R., Marais, E. A., Cohen, R. C., Laughner, J. L., Choi, S., Joiner, J., and Lamsal, L. N.: Using satellite observations of tropospheric NO2 columns to infer long-term trends in US NOx emissions: the importance of accounting for the free tropospheric NO2 background, Atmos. Chem. Phys., 19, 8863–8878, https://doi.org/10.5194/acp-19-8863-2019, 2019.
Sioris, C. E., Kurosu, T. P., Martin, R. V., and Chance, K.: Stratospheric and tropospheric NO2 observed by SCIAMACHY: First results, Adv. Spac Res., 34, 780–785, https://doi.org/10.1016/j.asr.2003.08.066, 2004.
Stammes, P., Sneep, M., de Haan, J. F., Veefkind, J. P., Wang, P., and Levelt, P. F.: Effective cloud fractions from the Ozone Monitoring Instrument: Theoretical framework and validation, J. Geophys. Res.-Atmos., 113, 1–12, https://doi.org/10.1029/2007JD008820, 2008.
Stavrakou, T., Müller, J.-F., Boersma, K. F., van der A, R. J., Kurokawa, J., Ohara, T., and Zhang, Q.: Key chemical NOx sink uncertainties and how they influence top-down emissions of nitrogen oxides, Atmos. Chem. Phys., 13, 9057–9082, https://doi.org/10.5194/acp-13-9057-2013, 2013.
Stettler, M. E. J., Eastham, S., and Barrett, S. R. H.: Air quality and public health impacts of UK airports. Part I: Emissions, Atmos. Environ., 45, 5415–5424, https://doi.org/10.1016/j.atmosenv.2011.07.012, 2011.
Stratmann, G., Ziereis, H., Stock, P., Brenninkmeijer, C. A. M., Zahn, A., Rauthe-Schoch, A., Velthoven, P. V., Schlager, H., and Volz-Thomas, A.: NO and NOy in the upper troposphere: Nine years of CARIBIC measurements onboard a passenger aircraft, Atmos. Environ., 133, 93–111, https://doi.org/10.1016/j.atmosenv.2016.02.035, 2016.
The International GEOS-Chem User Community: GEOS-Chem Version 12.1.0, Zenodo, https://doi.org/10.5281/zenodo.1553349, 2018.
Thomas, K., Berg, M., Boulanger, D., Houben, N., Gressent, A., Nedelec, P., Patz, H. W., Thouret, V., and Volz-Thomas, A.: Climatology of NOy in the troposphere and UT/LS from measurements made in MOZAIC, Tellus B, 67, 1–16, https://doi.org/10.3402/tellusb.v67.28793, 2015.
Toledano, C., González, R., Fuertes, D., Cuevas, E., Eck, T. F., Kazadzis, S., Kouremeti, N., Gröbner, J., Goloub, P., Blarel, L., Román, R., Barreto, Á., Berjón, A., Holben, B. N., and Cachorro, V. E.: Assessment of Sun photometer Langley calibration at the high-elevation sites Mauna Loa and Izaña, Atmos. Chem. Phys., 18, 14555–14567, https://doi.org/10.5194/acp-18-14555-2018, 2018.
Torres, O., Bhartia, P. K., Jethva, H., and Ahn, C.: Impact of the ozone monitoring instrument row anomaly on the long-term record of aerosol products, Atmos. Meas. Tech., 11, 2701–2715, https://doi.org/10.5194/amt-11-2701-2018, 2018.
Tost, H., Jöckel, P., and Lelieveld, J.: Lightning and convection parameterisations – uncertainties in global modelling, Atmos. Chem. Phys., 7, 4553–4568, https://doi.org/10.5194/acp-7-4553-2007, 2007.
Travis, K. R., Jacob, D. J., Fisher, J. A., Kim, P. S., Marais, E. A., Zhu, L., Yu, K., Miller, C. C., Yantosca, R. M., Sulprizio, M. P., Thompson, A. M., Wennberg, P. O., Crounse, J. D., St. Clair, J. M., Cohen, R. C., Laughner, J. L., Dibb, J. E., Hall, S. R., Ullmann, K., Wolfe, G. M., Pollack, I. B., Peischl, J., Neuman, J. A., and Zhou, X.: Why do models overestimate surface ozone in the Southeast United States?, Atmos. Chem. Phys., 16, 13561–13577, https://doi.org/10.5194/acp-16-13561-2016, 2016.
van der A, R. J., de Laat, A. T. J., Ding, J., and Eskes, H. J.: Connecting the dots: NOx emissions along a West Siberian natural gas pipeline, NPJ Clim. Atmos. Sci., 3, 16, https://doi.org/10.1038/s41612-020-0119-z, 2020.
van Geffen, J., Eskes, H. J., Boersma, K. F., Maasakkers, J. D., and Veefkind, J. P.: TROPOMI ATBD of the total and tropospheric NO2 data products, available at: https://sentinel.esa.int/documents/247904/2476257/Sentinel-5P-TROPOMI-ATBD-NO2-data-products (last access: 20 January 2020), 2019.
van Geffen, J., Boersma, K. F., Eskes, H., Sneep, M., ter Linden, M., Zara, M., and Veefkind, J. P.: S5P TROPOMI NO2 slant column retrieval: method, stability, uncertainties and comparisons with OMI, Atmos. Meas. Tech., 13, 1315–1335, https://doi.org/10.5194/amt-13-1315-2020, 2020.
Veefkind, J. P., de Haan, J. F., Sneep, M., and Levelt, P. F.: Improvements to the OMI O2–O2 operational cloud algorithm and comparisons with ground-based radar–lidar observations, Atmos. Meas. Tech., 9, 6035–6049, https://doi.org/10.5194/amt-9-6035-2016, 2016.
Verhoelst, T., Compernolle, S., Pinardi, G., Lambert, J.-C., Eskes, H. J., Eichmann, K.-U., Fjæraa, A. M., Granville, J., Niemeijer, S., Cede, A., Tiefengraber, M., Hendrick, F., Pazmiño, A., Bais, A., Bazureau, A., Boersma, K. F., Bognar, K., Dehn, A., Donner, S., Elokhov, A., Gebetsberger, M., Goutail, F., Grutter de la Mora, M., Gruzdev, A., Gratsea, M., Hansen, G. H., Irie, H., Jepsen, N., Kanaya, Y., Karagkiozidis, D., Kivi, R., Kreher, K., Levelt, P. F., Liu, C., Müller, M., Navarro Comas, M., Piters, A. J. M., Pommereau, J.-P., Portafaix, T., Prados-Roman, C., Puentedura, O., Querel, R., Remmers, J., Richter, A., Rimmer, J., Rivera Cárdenas, C., Saavedra de Miguel, L., Sinyakov, V. P., Stremme, W., Strong, K., Van Roozendael, M., Veefkind, J. P., Wagner, T., Wittrock, F., Yela González, M., and Zehner, C.: Ground-based validation of the Copernicus Sentinel-5P TROPOMI NO2 measurements with the NDACC ZSL-DOAS, MAX-DOAS and Pandonia global networks, Atmos. Meas. Tech., 14, 481–510, https://doi.org/10.5194/amt-14-481-2021, 2021.
Verlinden, K. L., Thompson, D. W. J., and Stephens, G. L.: The three-dimensional distribution of clouds over the southern hemisphere high latitudes, J. Climate, 24, 5799–5811, https://doi.org/10.1175/2011JCLI3922.1, 2011.
Wang, P., Stammes, P., van der A, R., Pinardi, G., and van Roozendael, M.: FRESCO+: an improved O2 A-band cloud retrieval algorithm for tropospheric trace gas retrievals, Atmos. Chem. Phys., 8, 6565–6576, https://doi.org/10.5194/acp-8-6565-2008, 2008.
Wang, P., Piters, A., van Geffen, J., Tuinder, O., Stammes, P., and Kinne, S.: Shipborne MAX-DOAS measurements for validation of TROPOMI NO2 products, Atmos. Meas. Tech., 13, 1413–1426, https://doi.org/10.5194/amt-13-1413-2020, 2020.
Wang, Z., Zhang, X., Liu, L., Cheng, M., and Xu, J.: Spatial and seasonal patterns of atmospheric nitrogen deposition in North China, Atmos. Ocean. Sci. Lett., 13, 188–194, https://doi.org/10.1080/16742834.2019.1701385, 2020.
Wendisch, M., Pöschl, U., Andreae, M. O., Machado, L. A. T., Albrecht, R., Schlager, H., Rosenfeld, D., Martin, S. T., Abdelmonem, A., Afchine, A., Araùjo, A. C., Artaxo, P., Aufmhoff, H., Barbosa, H. M. J., Borrmann, S., Braga, R., Buchholz, B., Cecchini, M. A., Costa, A., Curtius, J., Dollner, M., Dorf, M., Dreiling, V., Ebert, V., Ehrlich, A., Ewald, F., Fisch, G., Fix, A., Frank, F., Fütterer, D., Heckl, C., Heidelberg, F., Hüneke, T., Jäkel, E., Järvinen, E., Jurkat, T., Kanter, S., Kästner, U., Kenntner, M., Kesselmeier, J., Klimach, T., Knecht, M., Kohl, R., Kölling, T., Krämer, M., Krüger, M., Krisna, T. C., Lavric, J. V., Longo, K., Mahnke, C., Manzi, A. O., Mayer, B., Mertes, S., Minikin, A., Molleker, S., Münch, S., Nillius, B., Pfeilsticker, K., Pöhlker, C., Roiger, A., Rose, D., Rosenow, D., Sauer, D., Schnaiter, M., Schneider, J., Schulz, C., de Souza, R. A. F., Spanu, A., Stock, P., Vila, D., Voigt, C., Walser, A., Walter, D., Weigel, R., Weinzierl, B., Werner, F., Yamasoe, M. A., Ziereis, H., Zinner, T., and Zöger, M.: ACRIDICON-CHUVA campaign: Studying tropical deep convective clouds and precipitation over Amazonia using the new German research aircraft HALO, B. Am. Meteorol. Soc., 97, 1885–1908, https://doi.org/10.1175/BAMS-D-14-00255.1, 2016.
Williams, J. E., Boersma, K. F., Le Sager, P., and Verstraeten, W. W.: The high-resolution version of TM5-MP for optimized satellite retrievals: description and validation, Geosci. Model Dev., 10, 721–750, https://doi.org/10.5194/gmd-10-721-2017, 2017.
Worden, H. M., Bowman, K. W., Kulawik, S. S., and Aghedo, A. M.: Sensitivity of outgoing longwave radiative flux to the global vertical distribution of ozone characterized by instantaneous radiative kernels from Aura-TES, J. Geophys. Res.-Atmos., 116, 1–15, https://doi.org/10.1029/2010jd015101, 2011.
Zhao, B., Wang, S. X., Liu, H., Xu, J. Y., Fu, K., Klimont, Z., Hao, J. M., He, K. B., Cofala, J., and Amann, M.: NOx emissions in China: historical trends and future perspectives, Atmos. Chem. Phys., 13, 9869–9897, https://doi.org/10.5194/acp-13-9869-2013, 2013.
Ziemke, J. R., Chandra, S., and Bhartia, P. K.: “Cloud slicing”: A new technique to derive upper tropospheric ozone from satellite measurements, J. Geophys. Res.-Atmos., 106, 9853–9867, https://doi.org/10.1029/2000jd900768, 2001.
- Abstract
- Introduction
- Cloud-slicing of GEOS-Chem synthetic partial columns
- Evaluation of TROPOMI with ground-based instruments at high-altitude sites
- Retrieval of TROPOMI NO2 in the upper troposphere
- Comparison of TROPOMI and OMI UT NO2
- Conclusions
- Code availability
- Data availability
- Author contributions
- Competing interests
- Acknowledgements
- Financial support
- Review statement
- References
- Supplement