the Creative Commons Attribution 4.0 License.
the Creative Commons Attribution 4.0 License.
 | 12 Apr 2021
Validation of wind measurements of two mesosphere–stratosphere–troposphere radars in northern Sweden and in Antarctica
Evgenia Belova
Peter Voelger
Sheila Kirkwood
Susanna Hagelin
Magnus Lindskog
Heiner Körnich
Sourav Chatterjee
Karathazhiyath Satheesan
Two atmospheric VHF radars: ESRAD (Esrange MST radar) located near Kiruna in the Swedish Arctic and MARA (Moveable Atmospheric Radar for Antarctica) at the Indian research station Maitri in Antarctica perform wind measurements in the troposphere and lower stratosphere on a regular basis. We compared horizontal winds at altitudes between about 0.5 and 14 km derived from the radar data using the full correlation analysis (FCA) technique with radiosonde observations and models. The comparison with 28 radiosondes launched from January 2017 to August 2019 showed that ESRAD underestimates the zonal and meridional winds by about 8 % and 25 %, respectively. This is likely caused by the receiver group arrangement used for the FCA together with a high level of non-white noise. A similar result was found when comparing with the regional numerical weather prediction model HARMONIE-AROME (Bengtsson et al., 2017) for the period September 2018–May 2019. The MARA winds were compared with winds from radiosondes for the period February–October 2014 (291 occasions). In contrast to ESRAD, there is no indication that MARA underestimates the winds compared to the sondes. The mean difference between the radar and radiosonde winds is close to zero for both zonal and meridional components. The comparison of MARA with the ECMWF ERA5 reanalysis for January–December 2019 reveals good agreement with the mean difference between 0.1 and −0.5 m/s depending on the component and season. The random errors in the wind components (standard deviations over all estimates in 1 h averages) are typically 2–3 m/s for both radars. Standard deviation of the differences between radars and sondes are 3–5 m/s.
- Article
(1250 KB) - Full-text XML
- BibTeX
- EndNote


Atmospheric winds are an essential part of weather and climate; however, atmospheric measurements are skewed towards temperature, moisture or pressure (WMO, 2012). This skewness results from the fact that winds are more difficult to measure remotely. Atmospheric radars have been used for wind measurements since the 1950s. The history, design, methods and applications of atmospheric radars are described in the comprehensive book by Hocking et al. (2016). The mesosphere–stratosphere–troposphere (MST) radar ESRAD (Esrange MST radar) located near Kiruna in the Swedish Arctic has been in operation since 1996 (Chilson et al., 1999). It has run continuously (with the exception of a few short breaks due to technical problems) and delivers three components of wind. Another wind profiler MARA (Moveable Atmospheric Radar for Antarctica) has been operated at various locations in Antarctica since 2006 (Kirkwood et al., 2007). In some years MARA was able to run for only a few months (due to stations being closed or experiencing severe weather conditions), and in other years 12 months of operations have been possible. In August 2018 ESA launched the Earth explorer satellite Aeolus with the main objective to provide wind profiles in the troposphere and lower stratosphere (0–30 km altitudes) with global coverage (ESA, 2018; Straume et al., 2020). The satellite mission was specifically designed to address the lack of wind profile observations in many parts of the globe, such as the tropics and over the oceans. Both radars, ESRAD and MARA, are involved in the Aeolus calibration and validation activities, and scarcity of data at high latitudes makes these radar observations very valuable for validation of Aeolus wind products in these regions. Before making a validation of Aeolus winds, we need to evaluate carefully the accuracy of the wind measurements made with the radars themselves. This can be done in comparison with other measurements and with established models. In this paper we aim to validate the ESRAD and MARA winds in the troposphere and lower stratosphere by comparison with winds observed with radiosondes, with the regional HARMONIE-AROME model and with the ECMWF ERA5 reanalysis for the period following the Aeolus launch.
2.1 Wind measurements
ESRAD is an atmospheric radar located at Esrange (68∘ N, 21∘ E) in northern Sweden. It is a joint venture between the Swedish Institute of Space Physics (IRF) and the Swedish Space Corporation (SSC) Esrange Space Center. ESRAD began operations in July 1996 and had two major upgrades in 2004 and 2015. The purpose of the radar is to provide information on the dynamic state of the atmosphere – winds, waves, turbulence and layering, from the troposphere up to the mesopause (ca. 0.5–90 km altitude). It operates at 52 MHz and the nominal peak transmit power is 72 kW; however, only 30 kW is available at present due to progressive failure of several power blocks. The ESRAD main antenna array, consisting of 288 five-element Yagis, is divided into 12 identical groups each connected to one power block and to a separate receiver. The receivers have 1 MHz bandwidth and separate detection of in-phase and quadrature components. This allows for post-detection beam steering and full spectral analysis of the return signal. The radar transmits vertically with the whole main antenna array, but for reception one can use 12 segments in different combinations. In 2015 a small, separate receive-only array (three sub-arrays of four Yagis, each with three elements) was constructed about 30 m away from the south-east corner of the main array. In combination with transmitting on only part of the main array, this allows for measurements at the lowest altitudes starting at about 0.5 km. However, due to intermittent time synchronization errors, we do not use the data from this array in the present paper. The parameters of ESRAD are presented in Table 1, and a diagram of the antenna array is shown in Fig. 1.

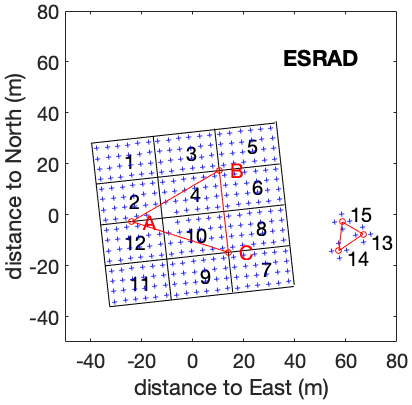
Figure 1Configuration of the ESRAD antenna field. Each blue cross marks the position of a Yagi antenna in the main array (groups 1–12) and in the “remote” groups (13–15). Each group, 1–15, is connected to a separate receiver. Groups 1–12 are also connected to transmitters.
Vertical wind is derived from the Doppler shift of the return signal by combining (coherently) the data from all receivers in groups 1–12. The concept behind the radar horizontal wind measurements is the following. A radar transmits electromagnetic waves that are scattered or reflected from inhomogeneities in the atmospheric refractive index. An ensemble of such inhomogeneities in an atmospheric layer works as a diffraction filter that creates a diffraction pattern of return signal on the ground which can be measured by spaced receivers (antenna segments). Scatterers of the radar wave are advected by wind, and it has been shown that the diffraction pattern moves along the ground with double the wind velocity (Briggs, 1980).
Horizontal winds are derived by using the cross-correlation technique to find the time it takes for the diffraction pattern of the irregularities to pass the different antenna sub-arrays, corrected for the irregularity decay time. This method is known as full correlation analysis (FCA) and was developed by Briggs et al. (1950) and Briggs (1984). For ESRAD, we adopted the FCA algorithm as described by Holdsworth (1995). The FCA is one of two commonly used radar techniques for atmospheric horizontal wind estimation (Hocking et al., 2016). The other is the Doppler beam-swinging (DBS) method, which is not technically applicable for our radar.
Table 2Parameters of the ESRAD experiments used in the paper.
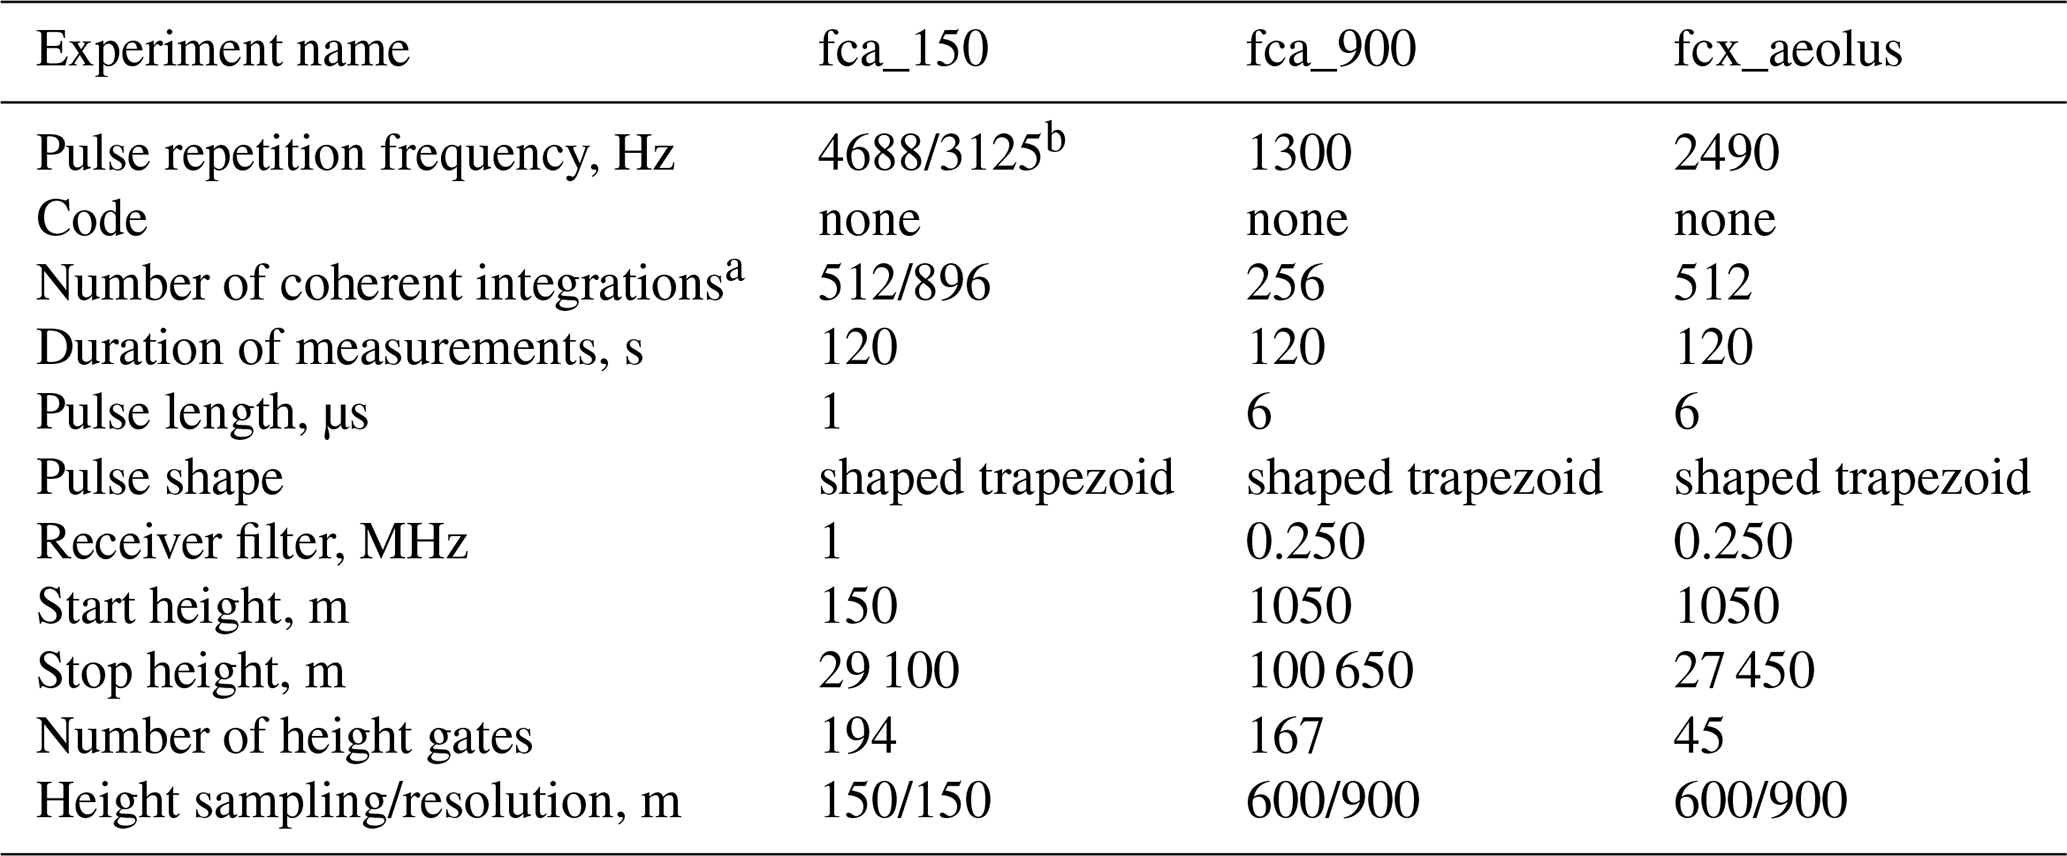
a This is the total number of integrations, including those applied in analysis, for heights up to 16 km. b summer/winter
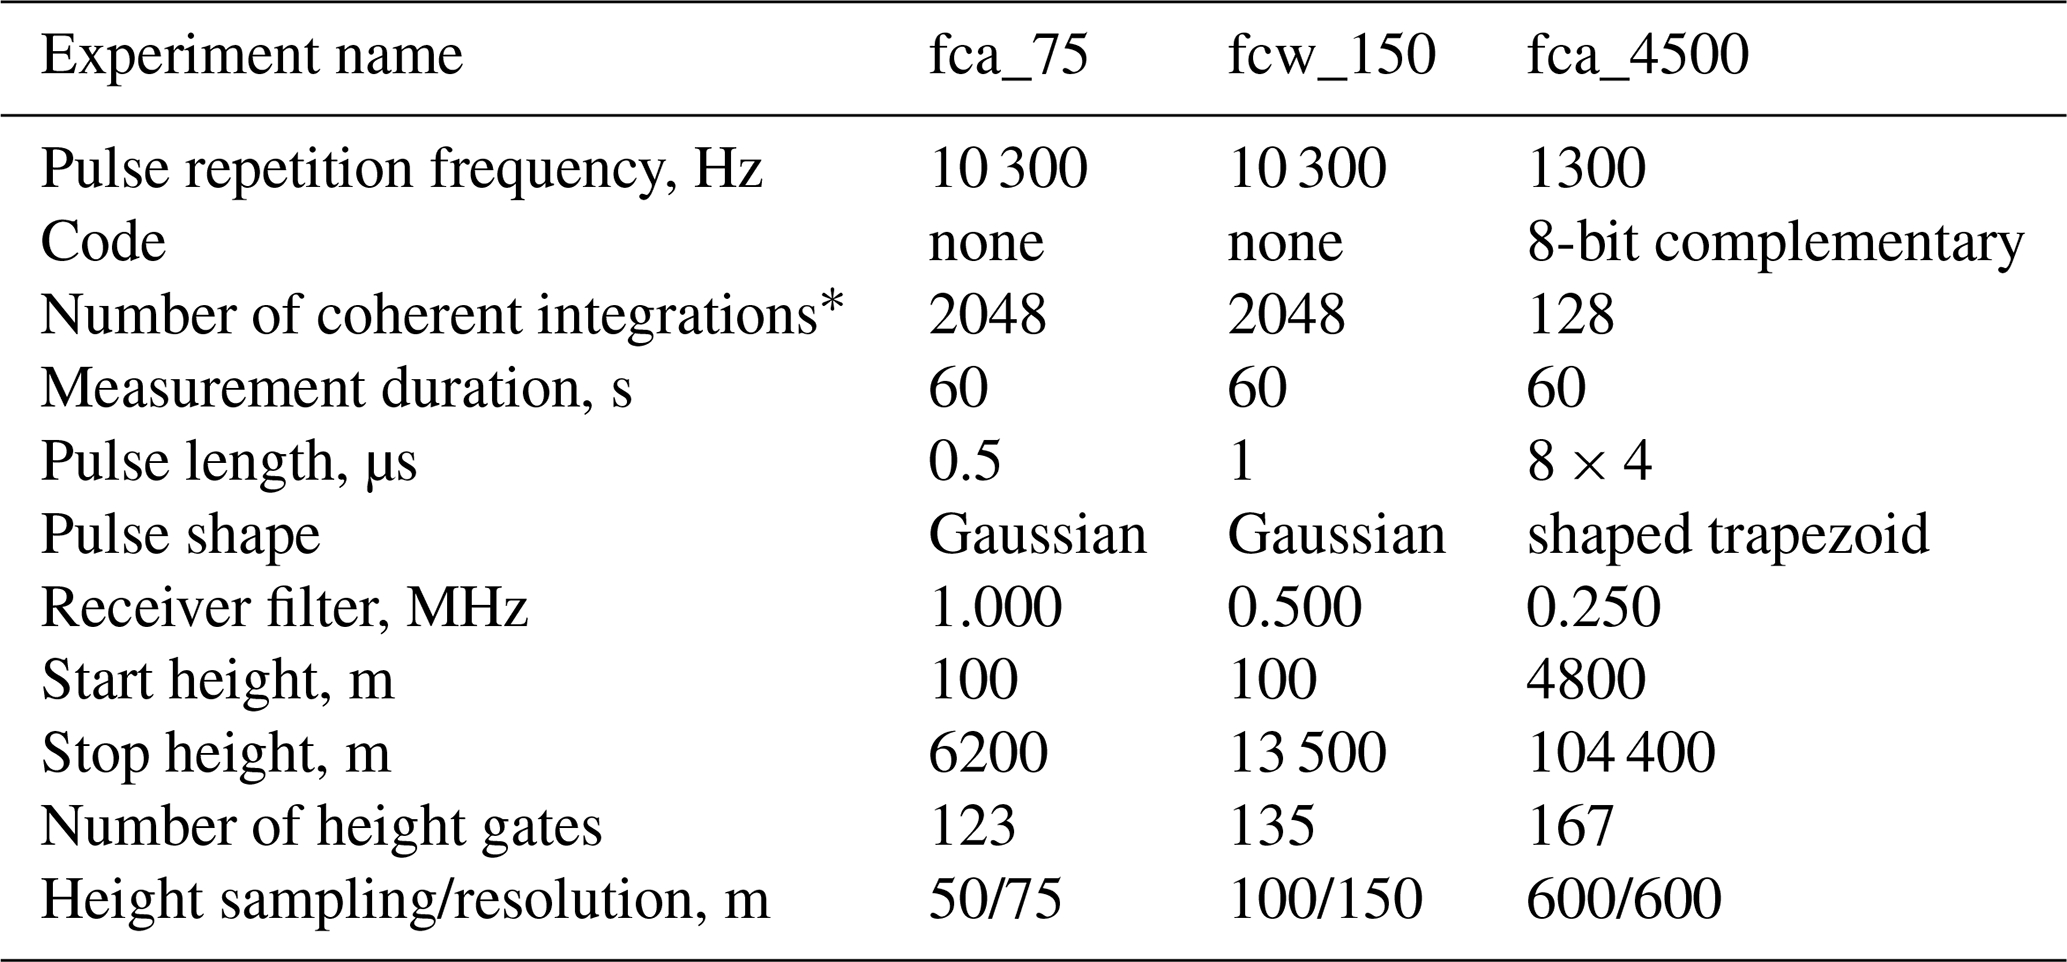
Basic software for radar control and data acquisition from the radar manufacturer Genesis Software Pty and our own software for analysis run in real time. The radar runs continuously, cycling between experiments optimized for the lower troposphere, troposphere/stratosphere, or mesosphere. A typical cycle measures for 1–2 min in each mode, repeating every 3–6 min. Special cycles, optimized for specific goals, may be run from time to time; for example, in this paper we use data from a special experiment fcx_aeolus designed in support of the ESA Aeolus satellite mission in addition to two common experiments fca_150 and fca_900. We run a sequence of four experiments (one of them is not used in the paper) for 2 min each, thus providing wind data every 8 min. The parameters of the experiments are listed in Table 2, and the arrangement of the receivers is shown in Fig. 1. For the full correlation analysis from the main array, digitized data from sets of four groups are added coherently in software to improve the signal-to-noise ratio to make “supergroups” with centres at A (groups 1, 2, 11, 12), B (groups 2, 4, 5, 6) and C (groups 7, 8, 9, 10). The red triangle ABC indicates the corresponding baselines for the full correlation analysis. More detailed descriptions of ESRAD can be found in Chilson et al. (1999) and Kirkwood et al. (2010).
2.2 ESRAD versus radiosondes
We use the wind data from 28 radiosondes (ascents) that were launched from Esrange during the period of January 2017–August 2019. The radiosondes have been launched as support for different balloon and rocket campaigns held at Esrange. Standard GPS radiosondes from the Vaisala company were used, typically reaching 20–30 km heights. The raw data were sampled at 2 s intervals, resulting in an uneven vertical interval, which varies from 6 to 9 m.

Figure 2Vertical profiles of the zonal U and meridional V components of wind measured by the ESRAD radar and radiosonde on 15 August 2018. Shading indicates 1 standard deviation of the ESRAD winds.
An example of the zonal and meridional wind profiles as measured by the ESRAD radar and by a radiosonde on 15 August 2018 is shown in Fig. 2. The ESRAD data for three experiments listed in Table 2 were averaged over the 1 h interval centred on the radiosonde launch time. The radar and sonde wind data were averaged to the same altitude bins starting from 300 m with 600 m resolution. We see that for the altitude range from about 1.5 km to about 13 km the radar winds are in good agreement with radiosonde ones, at least within 1 standard deviation (the standard deviation refers to the distribution of individual radar estimates for all of the times, heights and experiments in the averaging bins).
We did the same averaging for all 28 occasions when radiosondes were launched, and the results for zonal and meridional winds are presented in Fig. 3. Our comparisons are focused on U and V components, because they will be further used for evaluation of the Aeolus horizontal line-of-sight winds. We also plot in Fig. 3 two linear fits: the fit of the radar measurements on the sonde measurements is in blue, and the fit of the sonde measurements on the radar measurements is in green. A robust fitting with bi-square weights was used in order to reduce the contribution of outliers. Two fits were done, because the radar and sondes both measure winds with different uncertainties that we do not know absolutely (e.g. additional errors can be due to temporal and spatial separations of the instruments). Then the “best fit” between data from these instruments will be somewhere between these two fits. We do not determine its exact parameters as proposed by Hocking et al. (2001) because both regression lines lie rather close to each other.
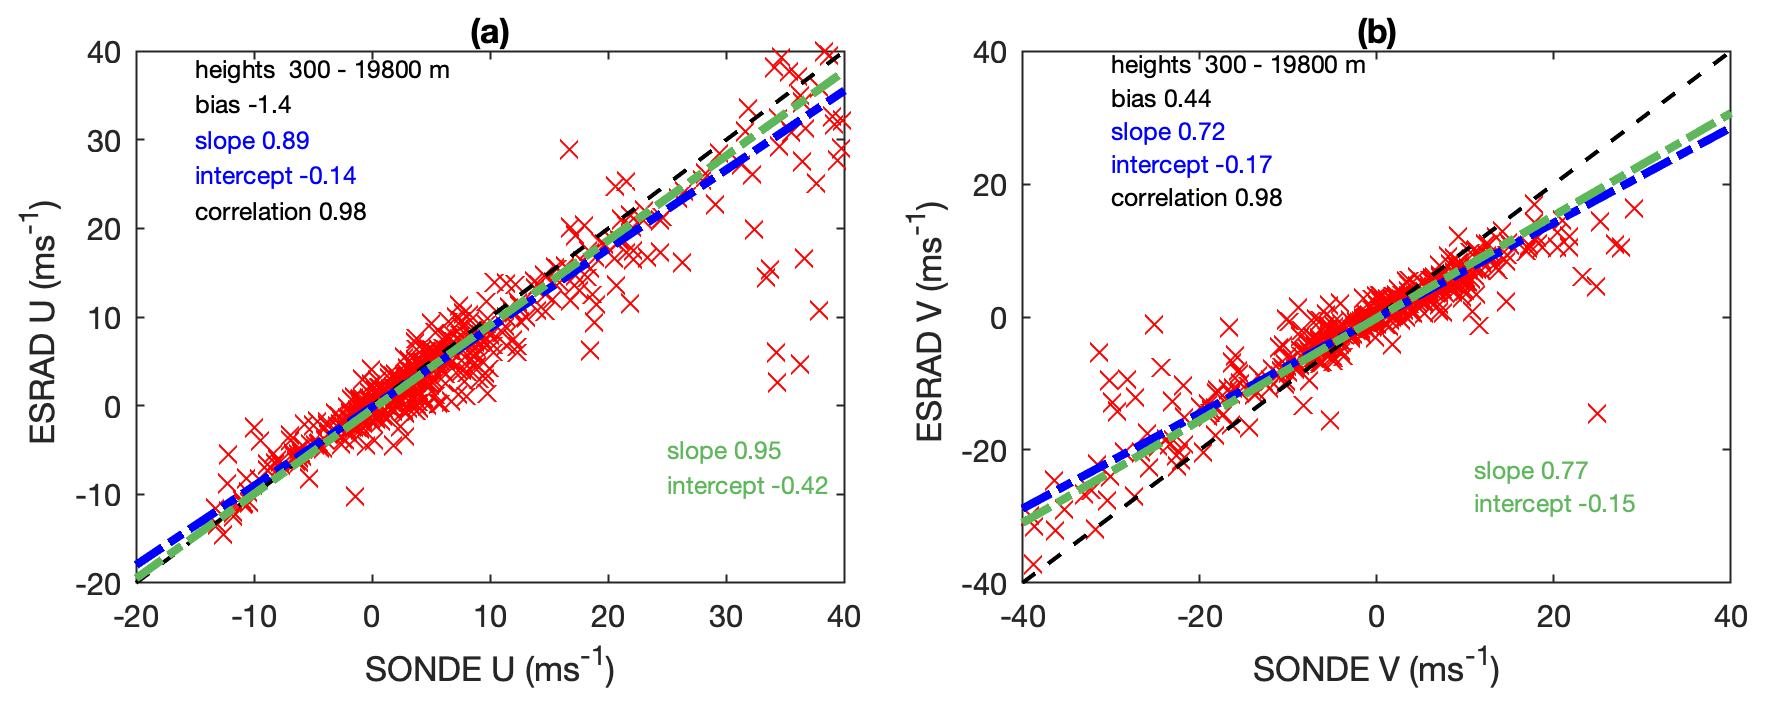
Figure 3Comparison of the ESRAD and radiosonde (a) zonal and (b) meridional winds. The linear fits are shown as dashed–dotted lines: the fit of the radar on the sonde winds is in blue, and the fit of the sonde on the radar winds is in green. The black dashed straight line corresponds to the case when the radar velocity is equal to the sonde velocity. More details on the information in the inserts are in the text.
The parameters of the linear fits such as slope and intercept are shown in Fig. 3 with the same colour as the corresponding lines. The slope is significantly closer to 1 for the zonal wind fit than for meridional one; all intercepts are smaller than 0.5 m/s. We also calculated a mean difference between the radar and radiosonde winds, and it is denominated as “bias” and shown in the inserts in the figure. The mean difference for U and V wind components is −1.4 and 0.4 m/s, respectively, and the slopes are less than 1, which implies that the radar underestimates wind compared to the radiosonde. The correlation coefficient between radar and sonde data is 0.98 for both zonal and meridional winds. Behaviour of the inter-comparison parameters as a function of height is shown in Fig. 4. From this figure, we see that the parameters vary irregularly with height; however, the correlation coefficient and slope of fit tend to decrease with increasing heights, while absolute values of the mean difference for both wind components increase with height. The largest differences between the radar and radiosondes are observed at the lowest and highest altitudes. The former can be explained by poor radar performance at the lower heights, and the latter may be due to increased spatial separation between the radar and radiosonde sampling volumes. These higher altitudes will also show larger deviations for the same percent underestimate as winds are stronger there, as seen in Fig. 3. For altitudes above about 2 km and below about 12 km, where there is a high enough number of data for comparison, the agreement between the radar and radiosondes is good, similarly to what was shown for 1 d in Fig. 2. The random errors do not vary significantly with altitude (not shown).
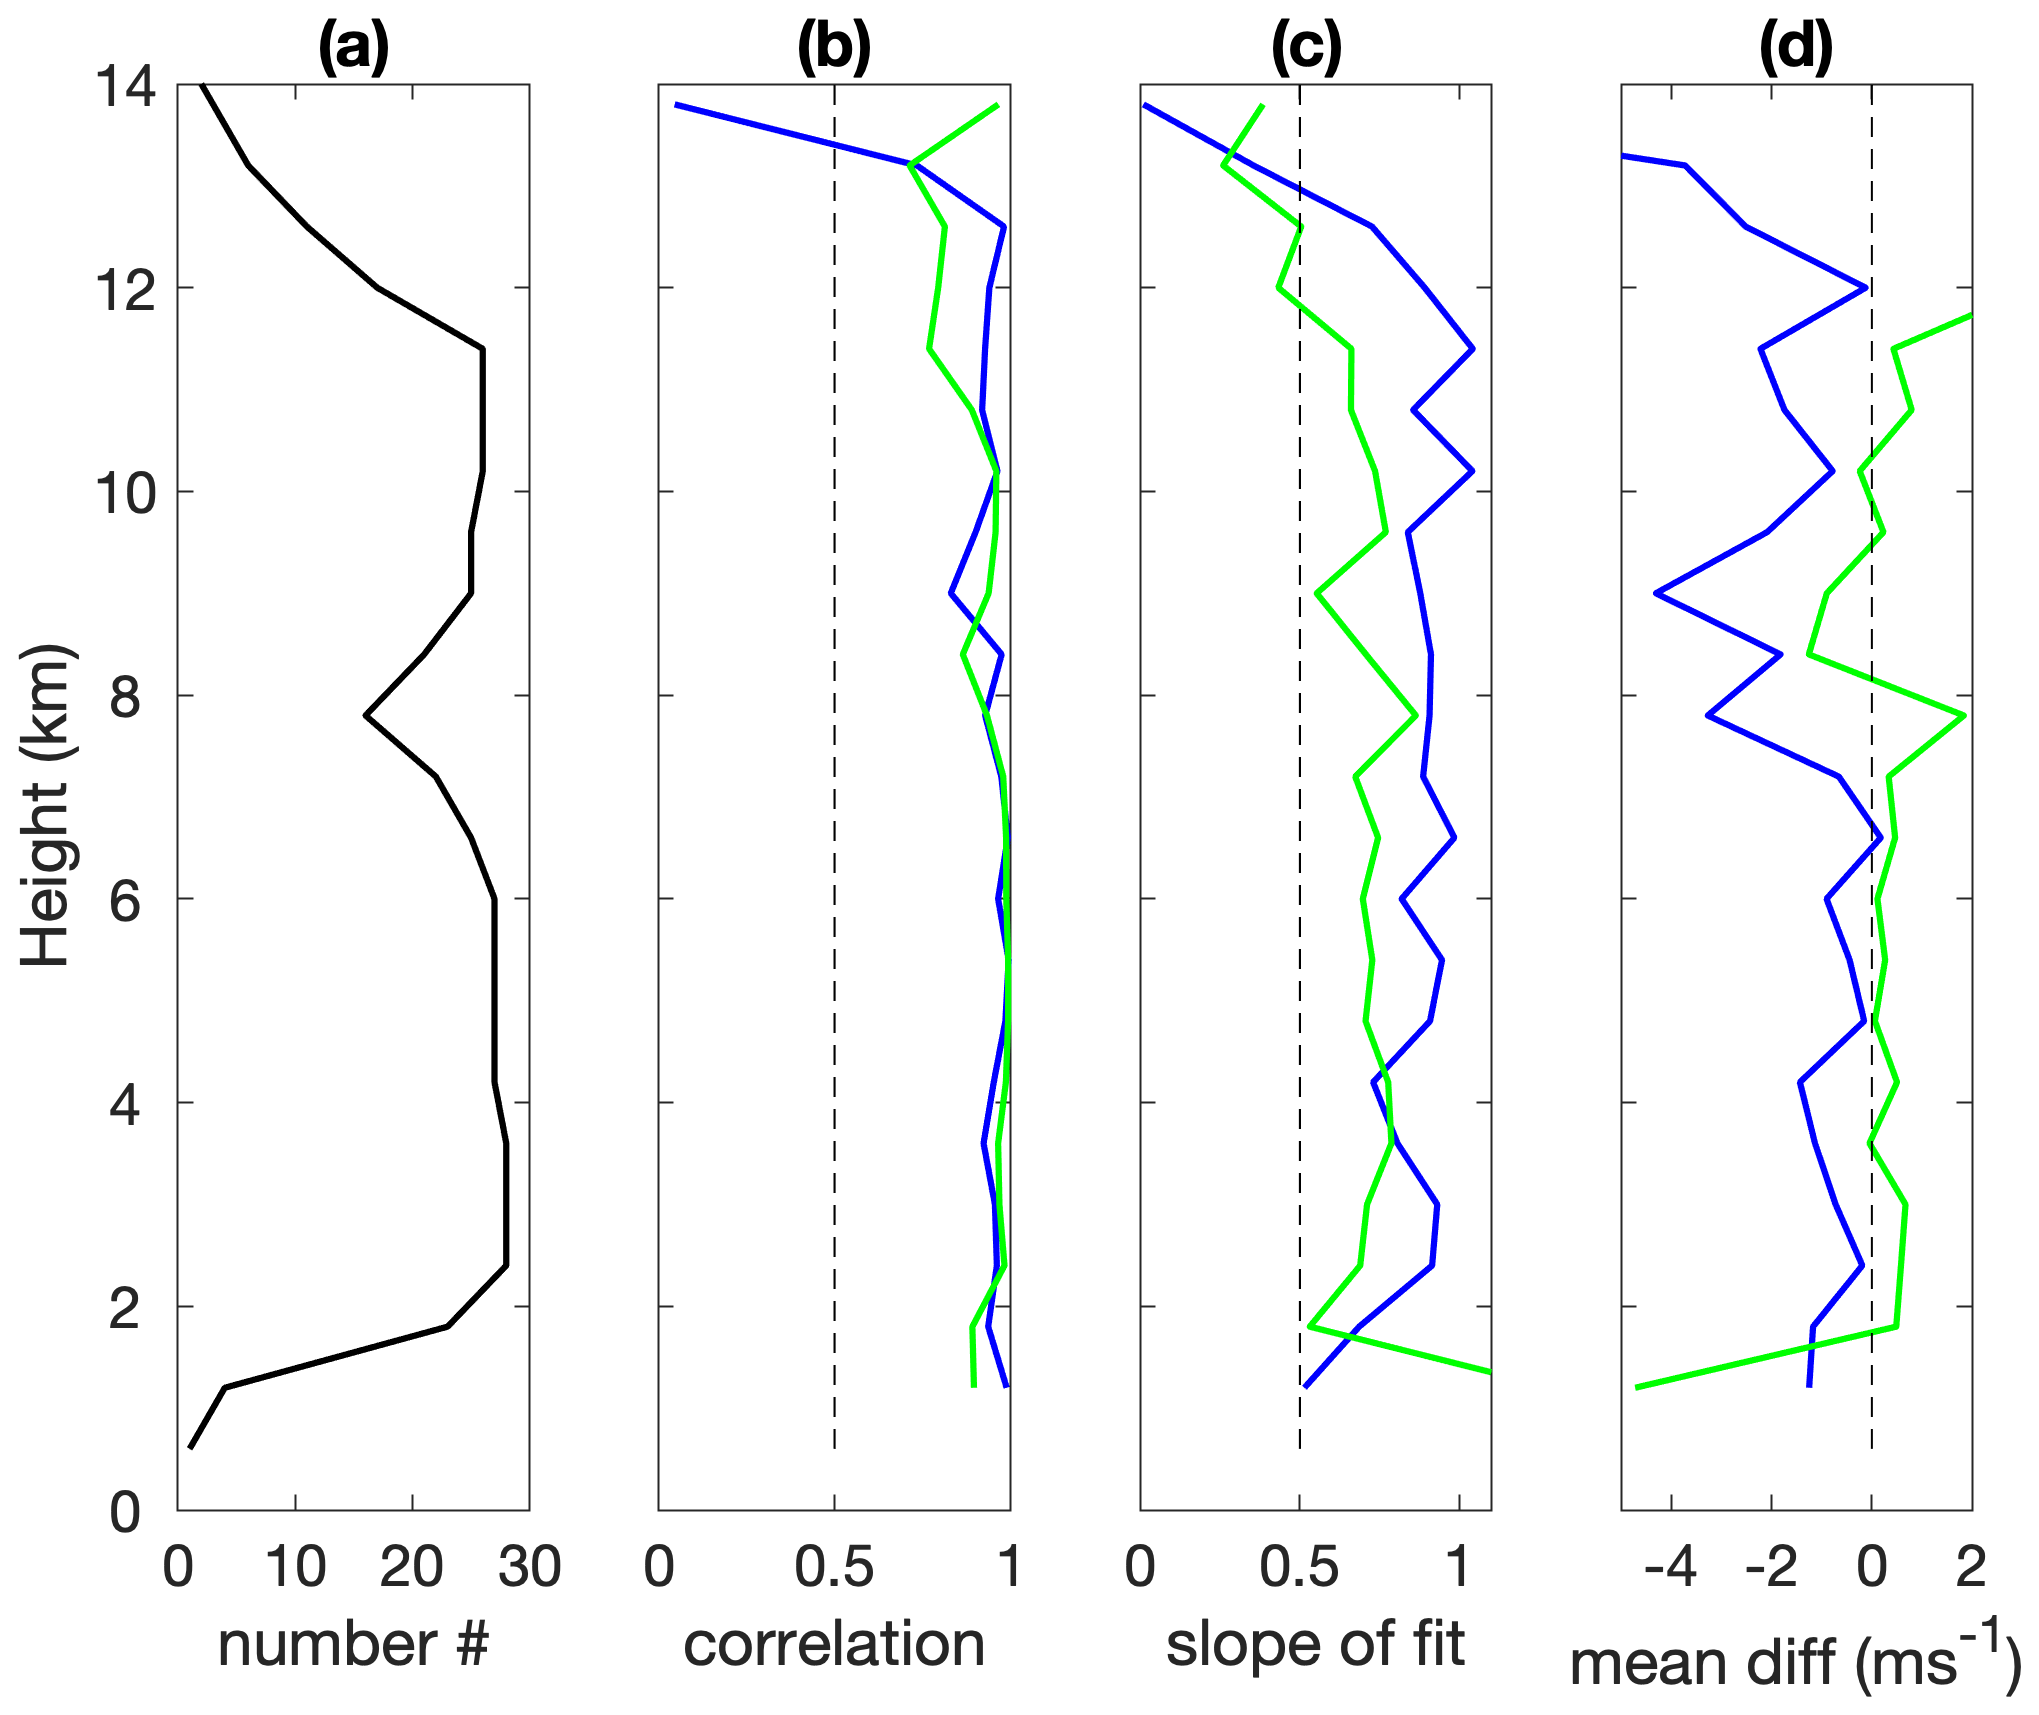
Figure 4Altitude profiles of (a) the number of ESRAD and radiosonde velocities available for the comparison, (b) correlation coefficient between them, (c) slope of the radar-on-sondes linear fits and (d) mean difference between the radar and radiosonde winds. Blue and green colours indicate zonal and meridional winds, respectively.
The mean standard deviation of the radar winds (from the distributions of individual wind estimates in each averaging bin) is 2.3 (2.0) m/s for zonal (meridional) component. To quantify the random error in the differences between sonde and radar winds, we first correct the ESRAD winds for the systematic underestimate in wind components (by 25 % in meridional and 8 % in zonal components). The standard deviation of the difference between radar (corrected) and sonde winds is 4.4 (4.8) m/s. This is a combination of uncertainties in both radar and sonde measurements, differences due to the differing locations of the measurements, and differences between instantaneous (sonde) measurements and 1 h averaged radar measurements.
2.3 ESRAD versus the HARMONIE model
In order to validate the radar wind over an extended, continuous period of time, we made the comparisons with winds produced using the HARMONIE-AROME kilometre-scale numerical weather prediction (NWP) model (Bengtsson et al., 2017). It is one configuration of the shared Aire Limitée Adaptation dynamique Développement InterNational (ALADIN) and High Resolution Limited Area Model (HIRLAM) NWP system, developed jointly by 26 countries in Europe and northern Africa. HARMONIE-AROME is comprised of a data assimilation system for the surface and upper air together with an atmospheric forecast model, including the SURFEX surface scheme (Masson et al., 2013). To provide the best possible initial model state for the surface and atmosphere, a data assimilation is applied. The surface data assimilation is based on optimal interpolation (Giard and Bazile, 2000), while a three-dimensional variational data assimilation scheme is used for the upper atmosphere (Fischer et al., 2005). Operational ensemble forecasts are produced within the collaboration MetCoOp (Meteorological Co-operation on Operational Numeric Weather Prediction), including the national meteorological services of Sweden, Norway, Finland and Estonia (Müller et al., 2017). The operational domain covers Fenno-Scandinavia and has 960×1080 horizontal grid points with a resolution of 2.5 km for each of the 65 vertical levels. The model top is at approximately 10 hPa and the vertical model level separation is about 50 m close to the surface and up to 1 km in the stratosphere.
We looked at the period from 1 September 2018 to 31 May 2019. The choice was motivated by changes in operation of the Aeolus satellite – during this interval the Doppler lidar on board the Aeolus satellite used laser A (it was switched to laser B in June 2019). Again, the ESRAD winds were averaged over three experiments; over 1 h centred on 00:00, 06:00, 12:00, and 18:00 UT, which are the times of the model output; and over 1 km altitude gates starting from the ground. Then model winds at the grid point closest to ESRAD were interpolated for the same altitudes.
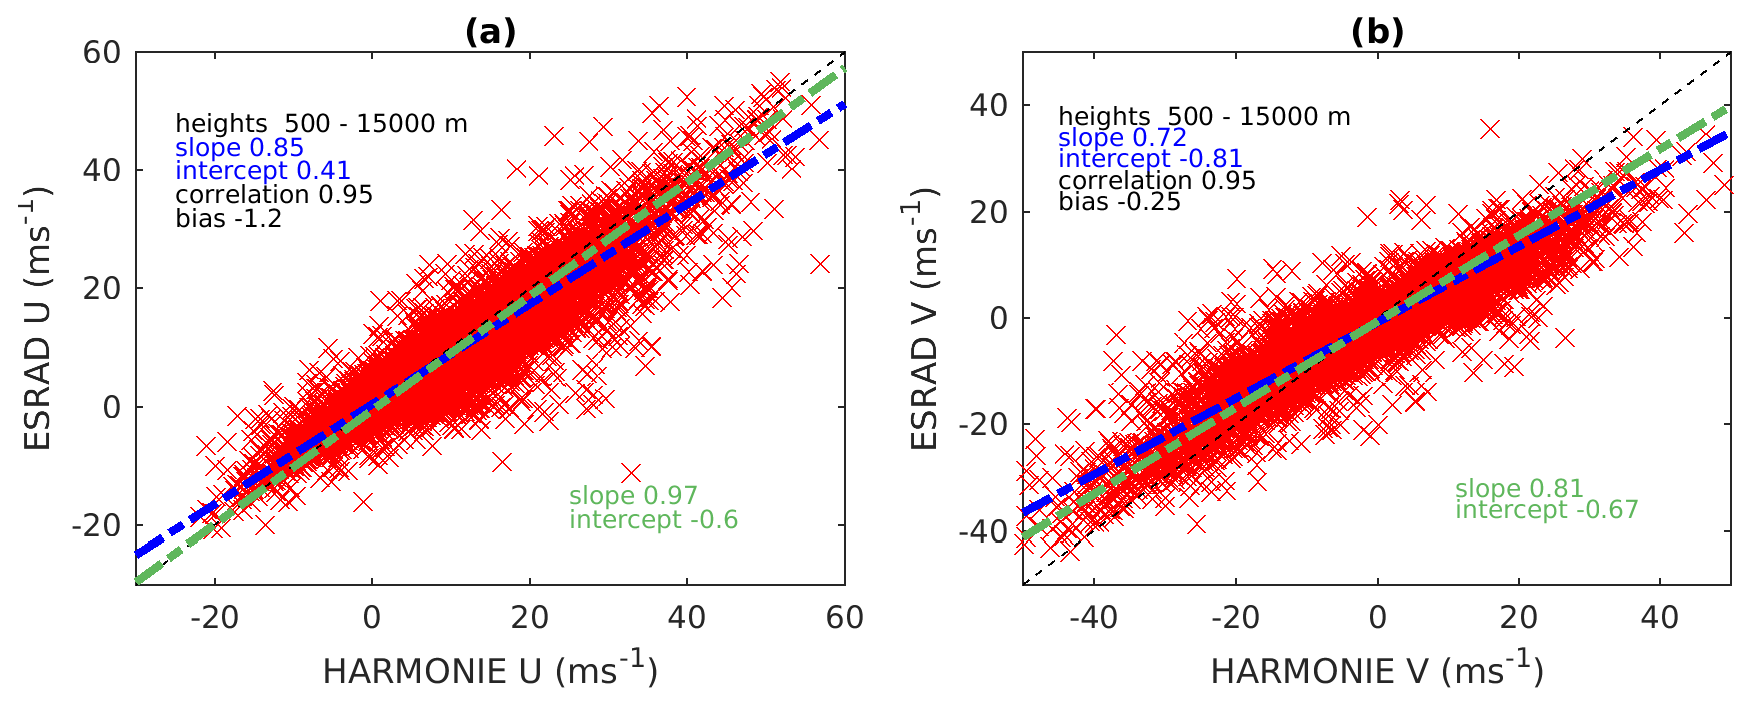
Figure 5Comparison of the ESRAD and HARMONIE model (a) zonal and (b) meridional winds for the period of September 2018–May 2019. The designations are the same as for Fig. 3.
Before making a comparison for all 9 months, we looked at seasonal behaviour of winds at altitudes from 5 to 15 km at the ESRAD site using the European Centre for Medium-Range Weather Forecasts (ECMWF) reanalysis. On the basis of the horizontal wind speed and direction averaged over 2005–2016 (not shown), we can distinguish two seasons when winds show different behaviour: from September to April and from May to August. We decided to group our data altogether because only 1 month (May) belongs to another season. The ESRAD zonal and meridional winds versus the HARMONIE corresponding winds are shown in Fig. 5, where all data for 9 months are presented and the linear fits are drawn. In general, there is a good agreement between the radar and model winds; however, it is better for the zonal component than for the meridional one. As in comparison with radiosondes, ESRAD underestimates both wind components compared to HARMONIE: the slopes for the zonal wind fits are 0.85/0.97, and the mean difference is −1.2 m/s, whereas they are 0.72/0.81 and −0.3 m/s, respectively, for the meridional wind. We also computed the slope of fit of the radar on the model, their correlation values and mean difference as a function of height, which are presented in Fig. 6. At altitudes above about 2 km, the agreement between the radar and the model is very good with an average correlation of 0.95. Below 2 km the ESRAD winds appear to be poorly correlated with the HARMONIE winds, similarly to the comparison with the radiosondes (Fig. 4). The radar random error variation with height is 1.9–3.3 m/s for the meridional wind and 2.3–3.7 m/s for the zonal wind (not shown). The mean standard deviation of the radar winds (from the distributions of individual wind estimates in each averaging bin) is 2.8 (2.4) m/s for zonal (meridional) component. The radar standard deviation variation with height is 1.9–3.3 m/s for the meridional wind and 2.3–3.7 m/s for the zonal wind (not shown). The standard deviation of the difference between (corrected) radar and HARMONIE winds is slightly higher, 4.3 (4.9) m/s, but very close to the values found in the comparison with radiosondes.
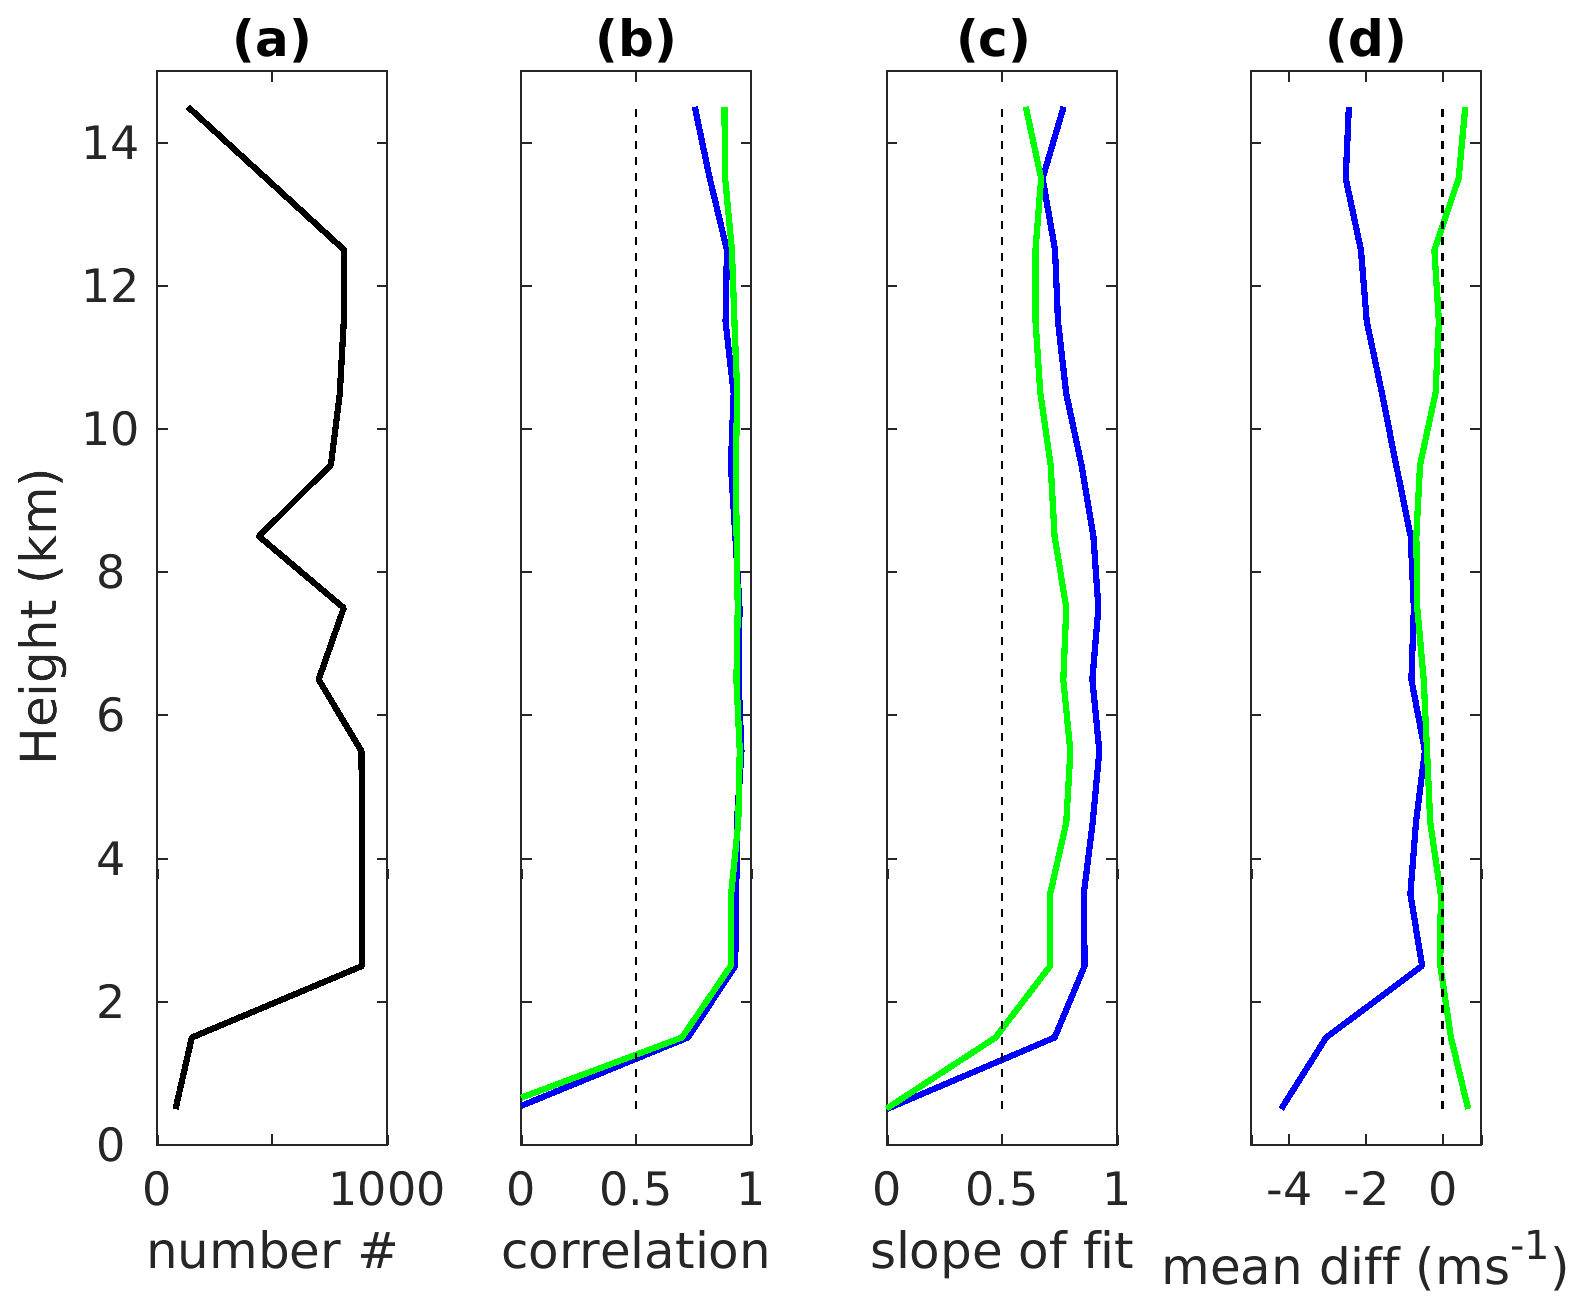
Figure 6Altitude profiles of (a) the number of ESRAD and HARMONIE velocities available for the comparison, (b) correlation coefficient between them, (c) slope of the radar-on-model linear fits and (d) mean difference between the radar and model winds for the period of September 2018–May 2019. Blue and green colours indicate zonal and meridional winds, respectively.
3.1 Description of the radar
MARA is a 54.5 MHz wind-profiler-type radar. It is in many ways a smaller, movable clone of ESRAD (Kirkwood et al., 2007). MARA is less powerful than ESRAD, having a peak power of 20 kW. The antenna consists of three adjacent square arrays, each with 16 tuned dipoles with reflectors (see Table 1 for the main parameters of MARA). The arrangement of the antenna array is shown in Fig. 7. There, the red triangle 123 indicates the baselines for the full correlation analysis for the main array. The remote groups 4, 5 and 6 are used for very low heights where useful data cannot be obtained from transmitting groups. Common experimental modes and analysis are the same or very similar for the ESRAD and MARA radars. In Table 3 the parameters of the MARA experiments used in this study are presented. Starting in 2006, MARA has been operated at various locations in Antarctica. Since 2014 it has been located at the Indian research station Maitri (71∘ S, 12∘ E) (http://www.ncaor.gov.in/antarcticas/display/376-maitri-, last access: 5 April 2021), and in November 2017 IRF transferred the ownership of MARA to the National Centre for Polar and Ocean Research, India. Weather conditions at Maitri so far have been very harsh for MARA's antenna hardware, which leads to interruptions in the MARA observations, with sometimes long breaks since repairs are only possible during the Antarctic summer.
Table 3Parameters of the MARA experiments used in the paper.
* This is the total number of integrations, including those applied in analysis, for heights up to 40 km.

Figure 7Configuration of the MARA antenna field at Maitri station, Antarctica. Each blue cross marks the position of an antenna, which are single-polarization dipoles with reflectors in the main array (groups 1–3) and three-element Yagis in the remote groups (4–6). Each group is connected to a separate receiver. Groups 1–3 are also connected to transmitters. The red triangles indicate the baselines for the FCA.
3.2 MARA versus radiosondes
After MARA was deployed at Maitri in 2014, the radar winds were validated using radiosondes launched from the nearby (4 km to the east) Russian Novolazarevskaya Station. However, since July 2018 the radio soundings have been interrupted and have not started again so far. We present here a comparison of MARA with radiosondes launched between 8 February and 30 October 2014 (291 occasions). Radiosonde winds were retrieved from the international database at University of Wyoming (http://weather.uwyo.edu/upperair/sounding.html, last access: 20 November 2014). On average, radiosonde winds were available at 21 heights between the limits (700–11 000 m) suitable for comparison with MARA. Sondes were usually launched at 00:00 UT each day, occasionally also at 12:00 UT and are compared with 1 h wind averages 00:00–01:00 UT (or 12:00–13:00 UT) from MARA, including all estimates where the height of the sonde wind was within the height resolution of the radar wind. Full correlation analysis “true” winds from each of the three experiments (Table 3) and both main and remote antenna groups are used, with usual acceptance criteria applied, providing on average 38 comparison points per sonde. The results are presented in Fig. 8. We also plot there the linear fits as in Fig. 3, and the parameters of the fits together with the bias and correlation are provided in the inserts. In contrast to ESRAD, there is no indication that MARA underestimates the winds compared to the sondes (the slopes of the fits for MARA on sonde are slightly less than 1 and for sonde on MARA slightly more than 1). The bias, defined as the mean difference between the radar and radiosonde winds, is close to zero for both zonal and meridional components. The mean standard deviation of the radar winds (from the distributions of individual wind estimates in each averaging bin) is 2.1 (1.5) m/s for the zonal (meridional) component. The standard deviation of the difference between radar and sonde winds is higher at 3.7 (2.9) m/s. This can be due to random errors in the sonde winds, the differing locations of the measurements, and differences between instantaneous winds (sondes) and height/time averages (radar). The parameters of the inter-comparison do not vary significantly with height (not shown).
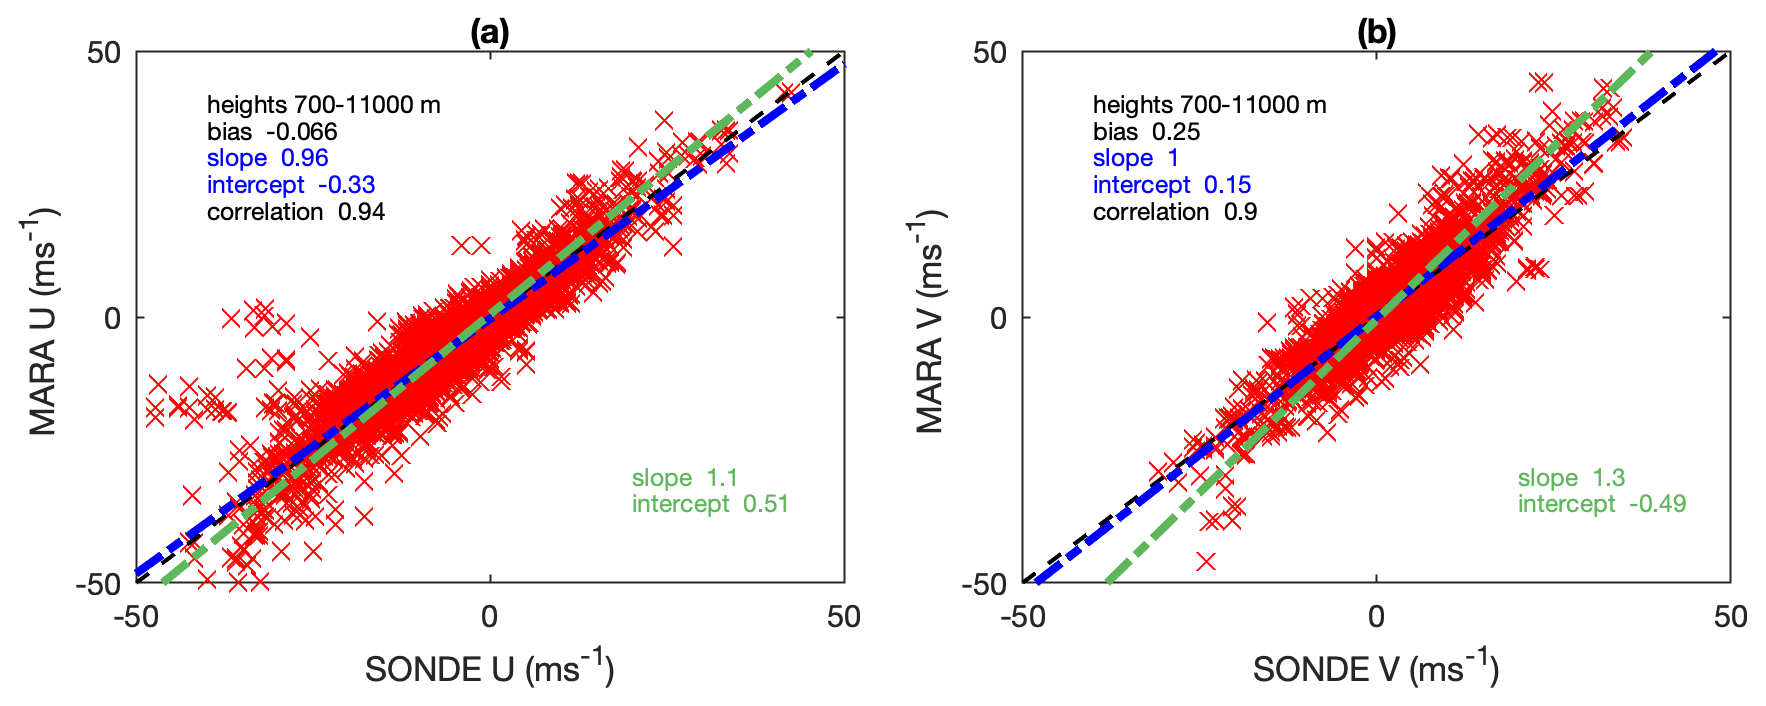
Figure 8Comparison of the MARA and radiosonde (a) zonal and (b) meridional winds. The linear fits are shown as dashed–dotted lines: the radar-on-sondes fit is in blue, and the sondes-on-radar fit is in green. The black dashed straight line corresponds to the case when the radar velocity is equal to the sonde velocity.
3.3 MARA versus ECMWF ERA5
Because of a lack of the most recent radiosonde data close to Maitri, we also compare the MARA winds with those from the ECMWF reanalysis ERA5 (Hersbach et al., 2020) for 2019 when the Aeolus satellite had been in orbit. The data cover the Earth on a 30 km grid and resolve the atmosphere using 137 levels unequally spread from the surface up to 1 Pa pressure level at about 80 km altitude. We use 1-hourly data for the altitude range 0–20 km at the grid point closest to the Maitri location, from January until December 2019, when the MARA data were available. We divided the data into two groups: the first from March to September and the second covering January, February, October, November and December. This corresponds to generally different behaviours of winds over Maitri as seen from the ECMWF data (not shown here). Plots of MARA versus ERA5 for the zonal and meridional winds as well as the linear fits for these two intervals are presented in Figs. 9 and 10. In general, there is good agreement between the radar and model for both intervals. The best linear fits, which lie somewhere between the green and blue lines, have likely a slope close to or less than 1. This implies that the radar slightly underestimates horizontal wind compared to the model. The correlation is high (92 %–95 %) and the biases are small (< 0.5 m/s) and negative (with one exception). The correlation is higher and the slope is closer to 1 for the zonal component compared to the meridional one. There are no essential distinctions between the statistics for the two intervals, while the range of velocity values changes from one period to another, and the bias of the meridional wind changes the value from small positive to small negative. Additionally, there are visually more outliers for data from March to September 2019. The mean standard deviation of the radar winds (from the distributions of individual wind estimates in each averaging bin) is 2.6 (2.1) m/s for zonal (meridional) component, and they are about the same for both intervals. The standard deviation of the difference between radar and ERA5 winds is higher: 4.0 (3.2) m/s for October–February and 4.5 (4.2) m/s for March–September. This is also slightly higher than for the comparison with sondes in Sect. 3.2, particularly for the meridional wind during the winter period March–September. This likely points to limitations in ERA5 at the MARA location.
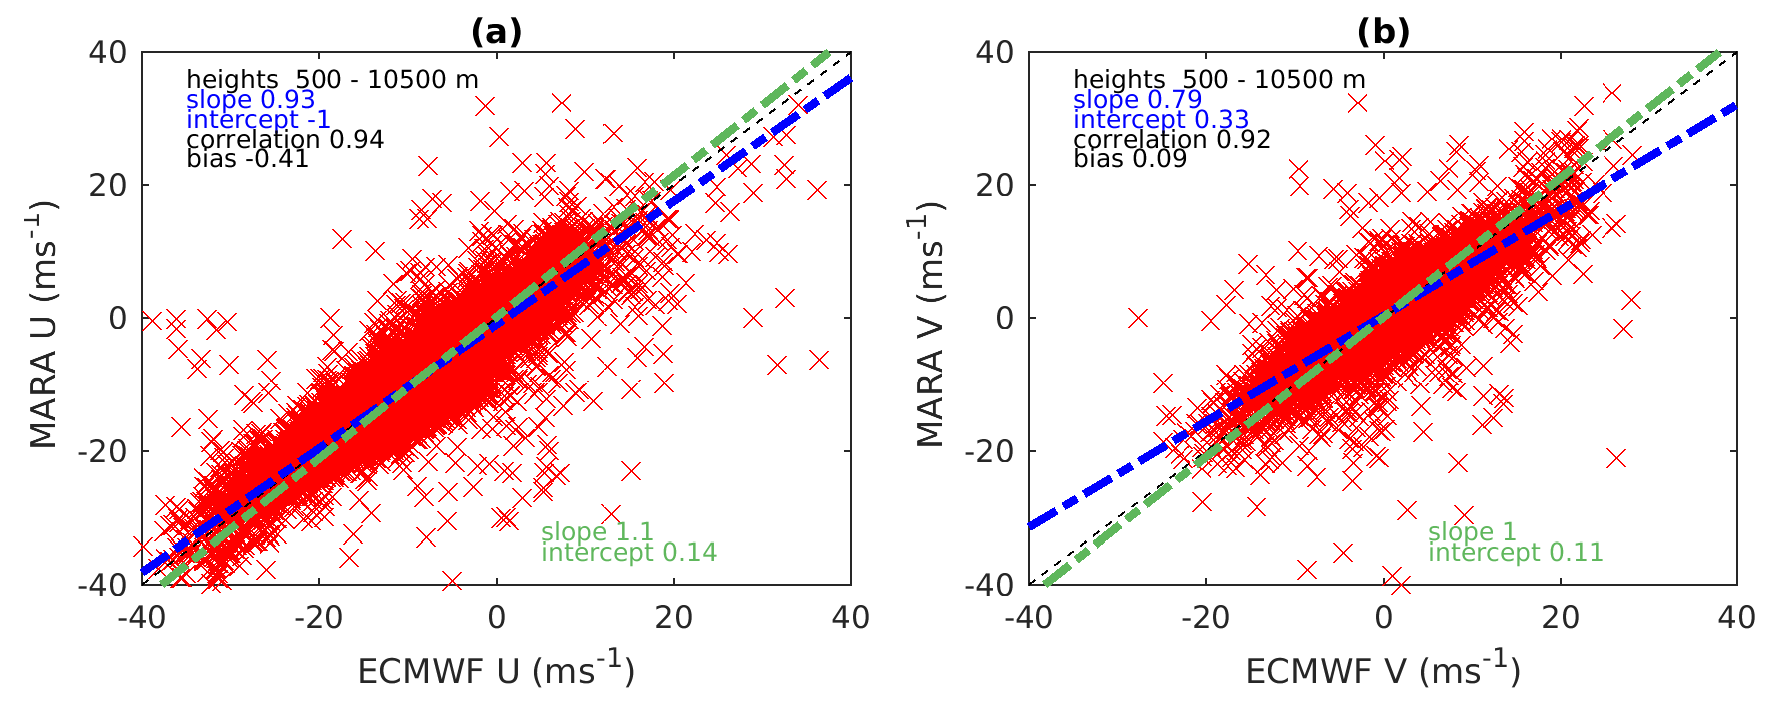
Figure 9Comparison of the MARA and ECMWF ERA5 model (a) zonal and (b) meridional winds for the period of January, February, October–December 2019. The designations are the same as for Fig. 3.

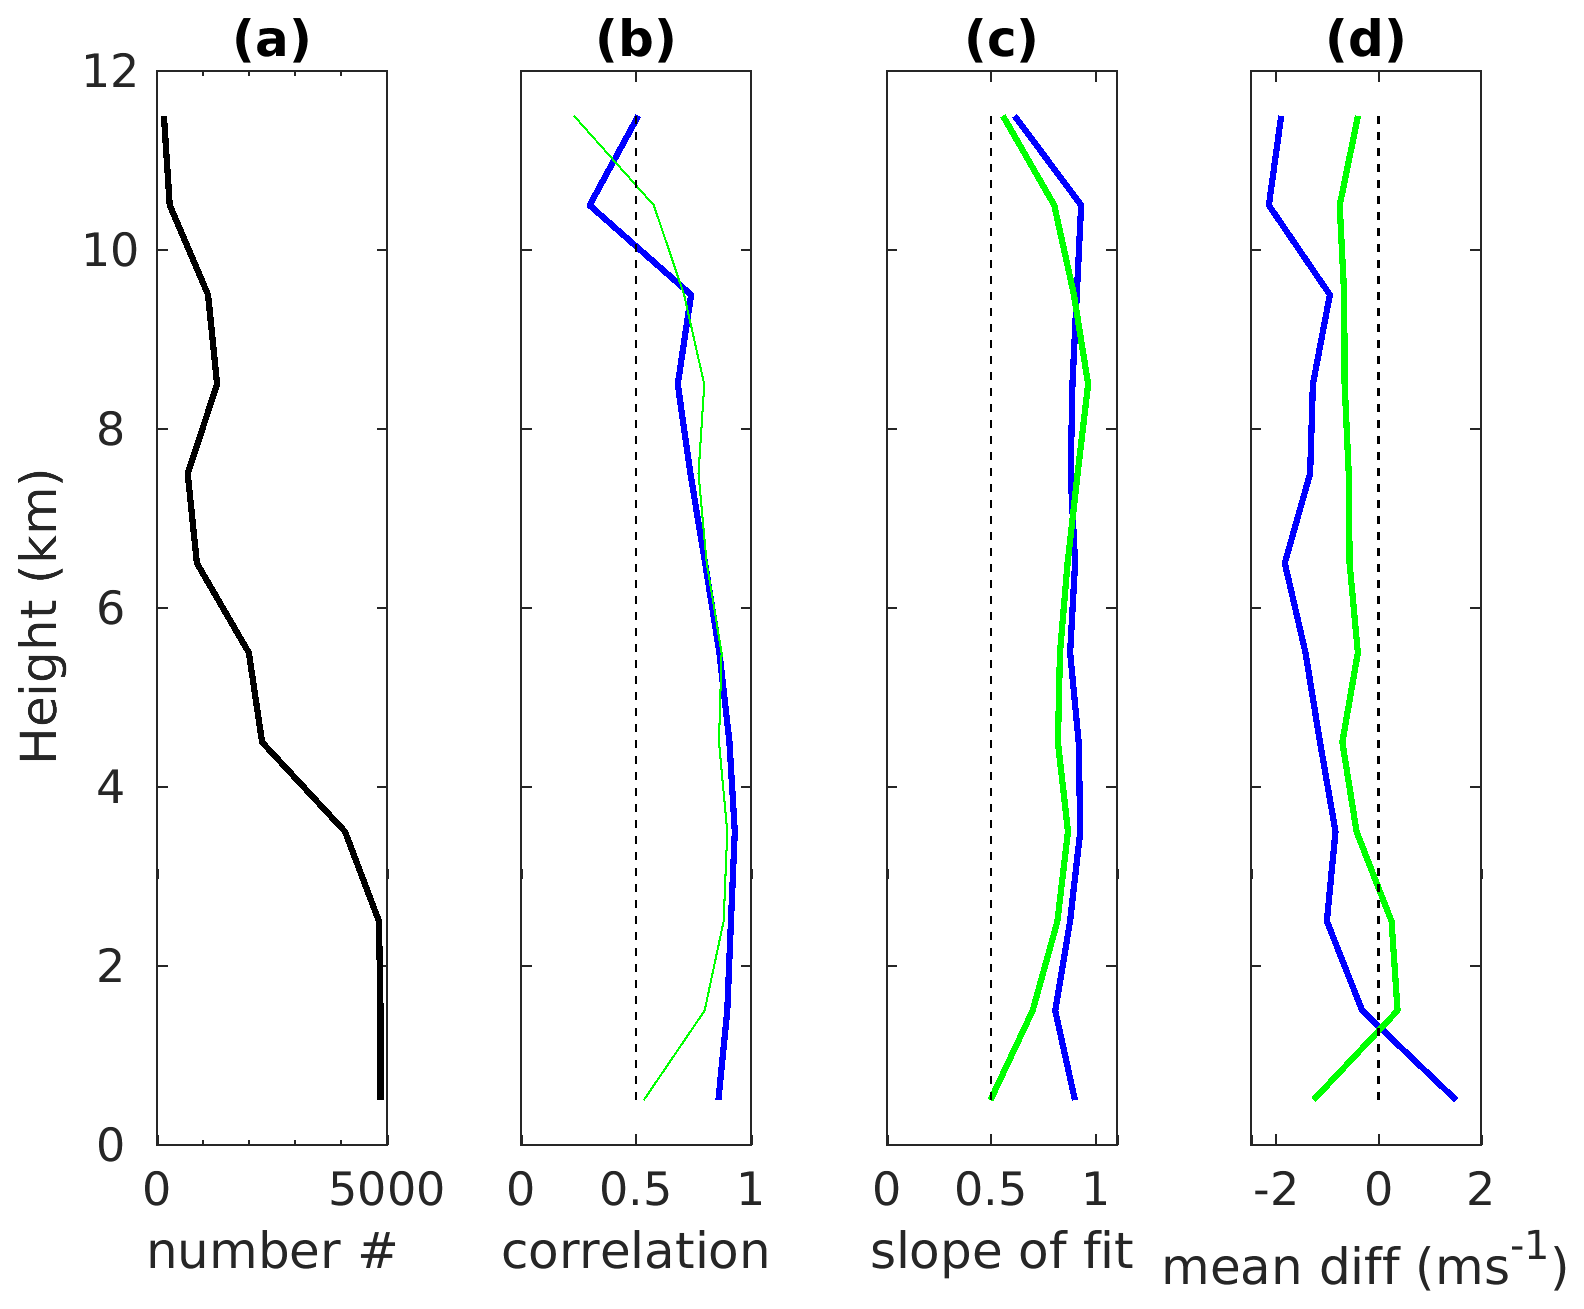
In Figs. 11 and 12, we present the vertical profiles of the inter-comparison statistics for two periods. The agreement between the radar and model is good for all heights from 500 m until 10.5 km, above which there are not so many radar data, radar-model correlation weakens and absolute values of biases increase. The difference between the two periods under consideration is only seen in the altitude profiles of the radar-model biases: they vary from negative to positive for the first period and are negative (with a few exceptions) for the second period. The standard deviation of the MARA wind (of the samples averaged in each height bin) varies between a maximum of 3.4 m/s at 0.5 km to a minimum of 2 m/s at 6 km attitude (not shown). Significantly more wind data for the lower heights (< 2 km) are available for MARA than for ESRAD.
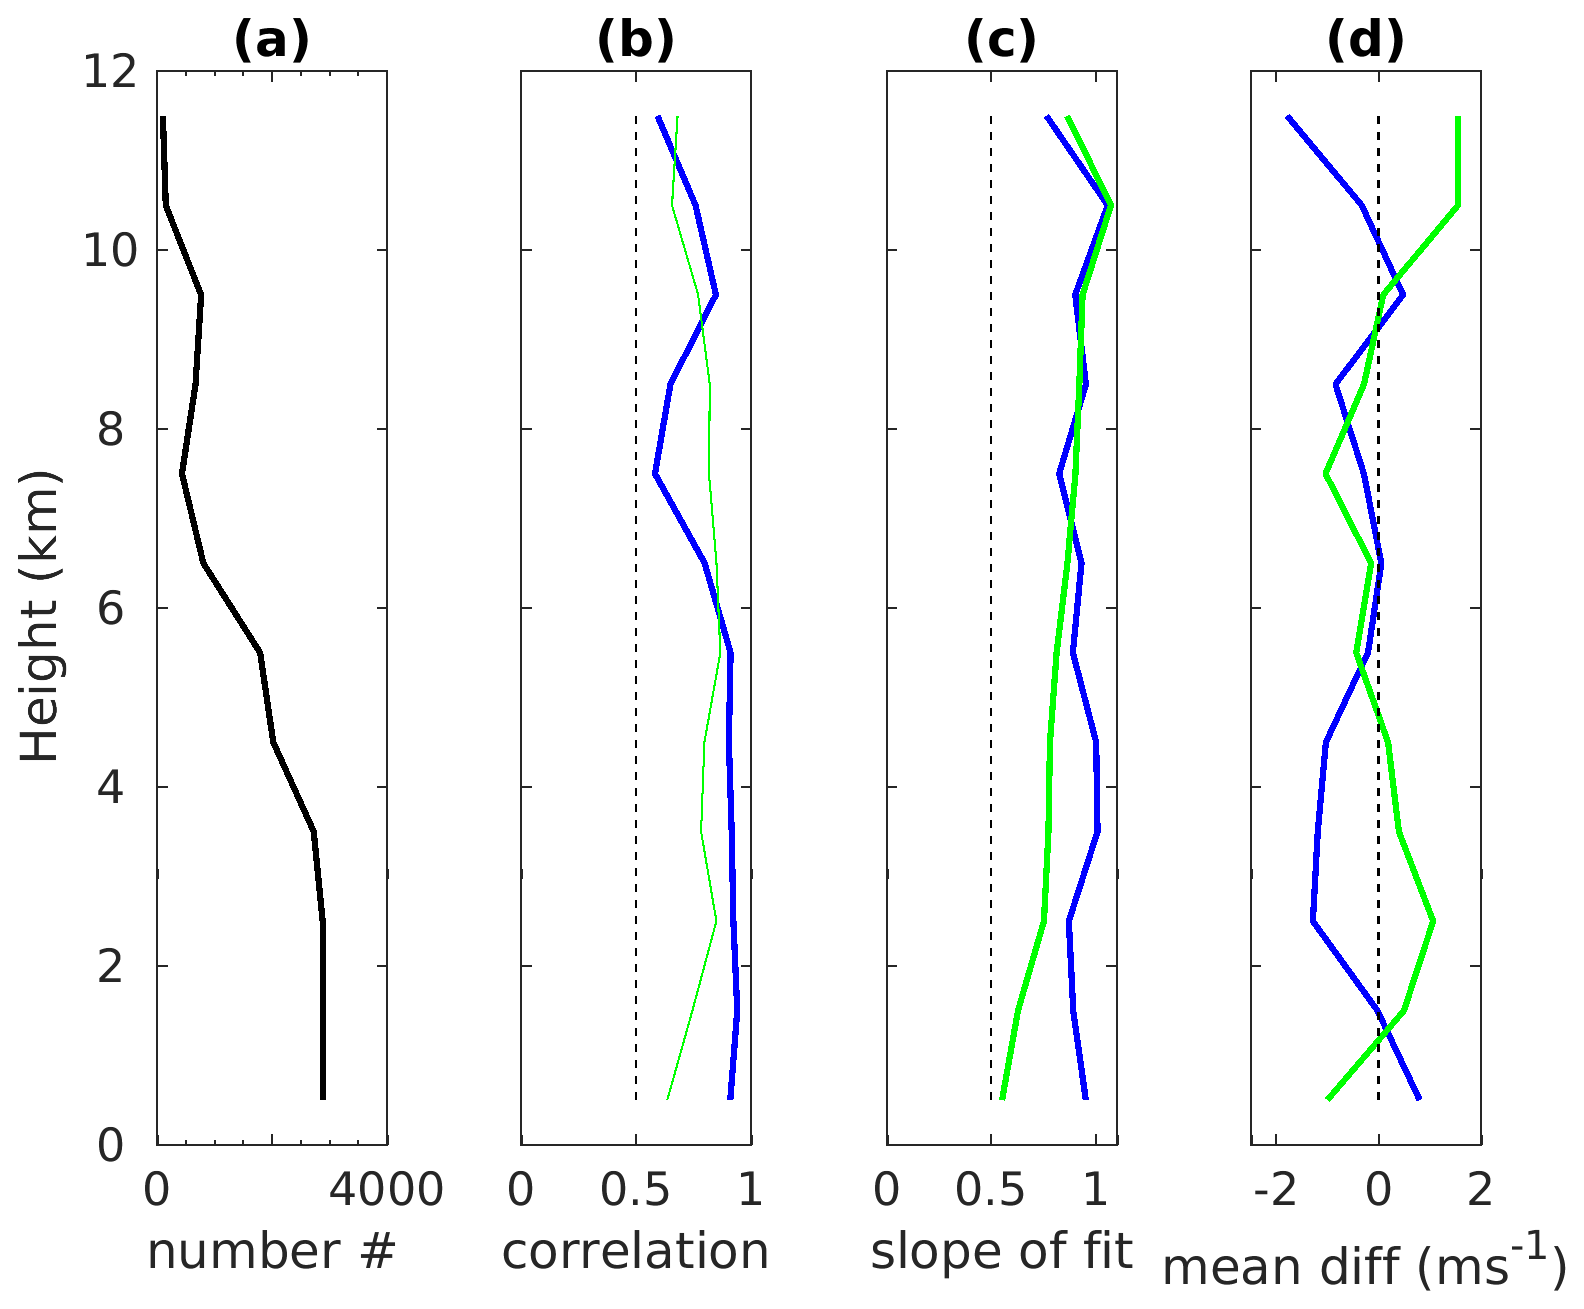
Figure 11Altitude profiles of (a) the number of MARA and ERA5 velocities available for the comparison, (b) correlation coefficient between them, (c) slope of the radar-on-model linear fits, and (d) mean difference between the radar and model winds for January, February, October–December 2019. Blue and green colours indicate zonal and meridional winds, respectively.
Several studies have been published on the inter-comparison of wind profilers and radiosondes, models, and different radar techniques for deriving winds (e.g. Vincent et al., 1987; Gage et al., 1988; Kudeki et al., 1993; MacKinnon, 2001; Stober et al., 2012). Some of them were reviewed by Reid et al. (2005), where the authors also presented their own comparison of the Mount Gambier wind-profiling radar in Australia using FCA with 3000 radiosondes. The authors confirmed the other studies and found that the FCA winds underestimate in magnitude by about 3 %–7 % relative to the radiosonde winds in the planetary boundary layer, troposphere and lower stratosphere. The reasons given for this bias in the FCA technique are that noise and antenna coupling tend to reduce cross-correlation values and hence estimated wind speeds (Holdsworth, 1999). Other possible reasons for differences between profiler winds and other techniques are spatial and temporal separation between measurements (e.g. Jasperson, 1982) as well as faults and errors in all instruments (e.g. Rust et al., 1990). Belu et al. (2001) explain better correlation between the radar and radiosonde zonal winds than meridional ones due to the latter usually being smaller than the former, and the same absolute errors for the two components results in more significant relative errors for the meridional component. The authors also compared the winds measured with the CLOVAR (Belu et al., 2001) wind profiler near London, Canada, using the DBS technique with winds from the Canadian Meteorological Centre operational model for 8 months. Very good agreement was shown in general; however, the radar overestimated the winds relative to the model by 5 %–20 % (more for the meridional than for the zonal component). Comparisons of wind profilers with other models have been carried out. For example, Gage et al. (1988) found very good correspondence between winds measured with the VHF radar on Christmas Island in the central Pacific and the ECMWF analysis. Schafer et al. (2003) compared winds between 1.5 and 12 km measured by the wind profilers at four sites in the tropical Pacific between 8 and 13 years to the NCEP/NCAR Reanalysis. Closer agreement was found for the sites where radar data and/or data of nearby rawinsondes were assimilated by the model.
Our results of inter-comparison of the ESRAD FCA winds and winds from radiosondes reveal systematic underestimation by the radar that is larger for the meridional component (∼ 25 %) than for the zonal one (∼ 8 %). We also found that ESRAD underestimates the total wind magnitude by ∼ 11 %, which is somewhat higher than that found by Reid et al. (2005). Similar underestimates were found in the comparison between ESRAD and HARMONIE. An analysis of the ability of the full correlation analysis technique to determine true winds, using synthetic data, has been reported by Holdsworth and Reid (1995). One part of that study addressed the so-called “triangle effect” whereby winds could be underestimated by an amount which increased with decreasing size of the triangle between the spaced antenna groups used for the analysis. This was found to be due to noise in the detected signals and could be largely corrected by renormalizing the cross-correlation functions between the antenna groups. Renormalization is applied in the FCA analysis at both ESRAD and MARA. At ESRAD, analyses using smaller spacings between antenna groups are also made routinely. These show larger underestimates of wind speed than the results shown in Figs. 3 and 5, so the triangle effect is clearly present despite the renormalization. The renormalization can be applied correctly only if the noise is random (i.e. all of the noise appears in the zero lag of the autocorrelation functions), and it appears that this is not the case at ESRAD, which is in an environment with high levels of radio frequency interference, which also vary over time. Since the baseline BC (32 m) in Fig. 1 is shorter than AB and AC (each 39.4 m), the underestimate in wind speed is most in that direction (BC), which is very close to meridional. The noise levels at MARA are lower and dominated by galactic noise, which is random, so that triangle size effects should be avoidable. Indeed, the comparison of MARA winds with radiosondes in Fig. 8 shows no systematic underestimate of either wind component for MARA winds.
When MARA is compared with the ECMWF ERA5 reanalysis over a period of several months, there is some indication that the radar mostly measures slightly smaller winds in the troposphere and lower stratosphere. This might result from limitations in the ability of the model to provide a good description of wind at that particular location which, in turn, might depend on how many local wind data, e.g. from radiosondes, were assimilated in the model. Neither radar's winds have been assimilated by ECMWF during the comparison periods. Wind information in Antarctica used in the ECMWF model is obtained by application of an advanced four-dimensional variational data assimilation methodology (Rabier et al., 1998) in combination with use of radiosondes, satellite-based atmospheric motion vectors and radiances from polar orbiting satellites. The data from radiosondes at only few coastal Antarctic stations are available on a regular basis (http://weather.uwyo.edu/upperair/sounding.html, last access: 5 April 2021). Novolazarevskaya Station located 4 km from MARA is just one of them and has not provided radiosoundings since June 2018. Nevertheless, we found surprisingly very good agreement between the MARA and ECMWF model winds (correlation of 92 %–95 % and bias less than 0.5 m/s). In the Arctic a lot of different types of observations, including radiosondes, are used within the MetCoOp HARMONIE-AROME modelling system (Müller et al., 2017). Three radiosonde stations, Luleå (69.32∘ N, 16.13∘ E), Sodankylä (67.37∘ N, 26.65∘ E) and Andøya (69.31∘ N, 16.13∘ E), are located within 300 km from Kiruna. Again, ESRAD and HARMONIE winds above 2 km height show good agreement (correlation of 95 % and small biases), especially after allowing for the “triangle size” underestimate by the radar.
In the altitude-resolved comparison between ESRAD and the HARMONIE model as well as radiosondes (Figs. 3 and 5), we found that below about 2 km the agreement is not good. This is due to the technical limitation of ESRAD and other radars, which use the same antenna array for transmission and reception, for measurements at the lowest heights where a received signal from lower heights can be contaminated by low-level “ringing” after the pulse transmission and by echoes from nearby objects through antenna side lobes. For MARA, we used a small additional receiving-only array that allows for accurate derivation of winds at the lower altitudes too that are in good agreement with the ECMWF model (Figs. 11 and 12). The ESRAD remote receive-only array deployed for the same purpose has had time synchronization problem during the period of interest, and these data were not included in our analysis.
The performance of two MST radars (ESRAD in Kiruna, Swedish Arctic, and MARA at Maitri, Antarctica) in measuring horizontal winds in the troposphere and lower stratosphere has been evaluated by comparison with radiosondes and NWP models. The inter-comparison with 28 radiosondes launched from January 2017 to August 2019 showed that the ESRAD FCA method underestimates zonal and meridional winds by about 8 % and 25 %, respectively. We argue that the ESRAD receiver group arrangement used for the FCA together with a high level of non-white noise is the likely cause of this difference. At ESRAD, the standard deviation of radar winds in 1 h averaging bins was 2–2.5 m/s in each component and, after correcting for the systematic underestimate, the standard deviation of differences between radar and sonde winds was 4.4 m/s (4.8 m/s) for the zonal (meridional) component. The ESRAD winds were also compared with the winds computed using the regional NWP model HARMONIE-AROME for the period September 2018–May 2019. We found again that ESRAD winds are underestimated by 9 % and 24 % compared to the model while showing a very high correlation between ESRAD and model winds.
The MARA winds were compared with 291 radiosondes launched from February to October 2014 at Novolazarevskaya Station located 4 km from Maitri. We found a good agreement for both zonal and meridional components, with the biases, defined as the mean difference between the radar and sonde winds, close to 0. The MARA random errors (standard deviation within 1 h averaging bins) are estimated to be ∼ 2 m/s in each component. The standard deviation of differences between radar and sonde winds was 3.7 m/s (2.9 m/s) for the zonal (meridional) component. The MARA horizontal wind components have been compared with those from the ECMWF ERA5 reanalysis for the period January–December 2019. In general, the MARA FCA winds are in a good agreement with the model winds. However, the radar zonal winds can be, on average, a bit larger (2 %) as well as smaller (6 %) than the model ones, varying by height and season. In turn, the radar meridional winds are generally 8 %–11 % smaller. On the other hand, we would not expect complete agreement since there are no close-by radiosondes assimilated by ECMWF during the comparison period.
On the basis of this analysis, we conclude that both radars (ESRAD and MARA) provide measurements of horizontal winds in the troposphere and lower stratosphere of a good quality with reasonably well-known bias and uncertainty. We plan to use the radars for validation of winds measured by Doppler lidar on board the Aeolus satellite in a forthcoming study.
ESRAD data are available from Peter Voelger upon motivated request. MARA data can be obtained on reasonable request from Sourav Chatterjee. HARMONIE historical forecasts can be ordered via SMHI's open-data service: https://www.smhi.se/en/services/open-data/search-smhi-s-open-data-1.81004 (SMHI, 2021).
ERA5 is taken from the Copernicus Climate Change Service (C3S) (2017).
SK, EB and PV developed the codes and conducted the data analysis. SH, MK and HK provided the HARMONIE model outputs. SC and KS provided the MARA data. All co-authors discussed the results. EB prepared the article with contribution from all co-authors.
The authors declare that they have no conflict of interest.
This work was supported by Swedish National Space Agency (grant numbers 125/18, 279/18). ESRAD operation and maintenance is provided by Esrange Space Center of Swedish Space Corporation. The team members at Maitri station for the 38th Indian scientific expedition to Antarctica (ISEA) are acknowledged for making the year-round data possible from MARA. The Antarctic logistics division at NCPOR (National Centre for Polar and Ocean Research, India) is also acknowledged for providing necessary support.
This research has been funded by Swedish National Space Agency (grant nos. 125/18, 279/18).
This paper was edited by Markus Rapp and reviewed by two anonymous referees.
Belu, R. G., Hocking, W. K., Donaldson, N., and Thayaparan, T.: Comparisons of CLOVAR windprofiler horizontal winds with radiosondes and CMC regional analyses, Atmos. Ocean, 39, 107–126, https://doi.org/10.1080/07055900.2001.9649669, 2001.
Bengtsson, L., Andrae, U., Aspelien, T., Batrak, Y., Calvo, J., de Rooy, W., Gleeson, E., Hansen-Sass, B., Homleid, M., Hortal, M., Ivarsson, K., Lenderink, G., Niemelä, S., Pagh Nielsen, K., Onvlee, J., Rontu, L., Samuelsson, P., Santos Muñoz, D., Subias, A., Tijm, S., Toll, V., Yang, X., and Ødegaard Køltzow, M.: The HARMONIE-AROME model configuration in the ALADIN-HIRLAM NWP system, Mon. Weather Rev., 145, 1919–1935, https://doi.org/10.1175/MWR-D-16-0417.1, 2017.
Briggs, B. H.: Radar observations of atmospheric winds and turbulence: a comparison of techniques, J. Atmos. Terr. Phys., 42, 823–833, https://doi.org/10.1016/0021-9169(80)90086-0, 1980.
Briggs, B. H.: The analysis of spaced sensor records by correlation technique, in: Middle Atmosphere Program, Handbook for MAP, 13: Ground-based Techniques, edited by: Vincent, R. A., NASA, Washington, USA, 166–186, 1984.
Briggs, B. H., Phillips, G. J., and Shinn, D. H.: The analysis of observations on spaced receivers of the fading of radio signals, Proc. Phys. Soc. B, 63, 106–121, https://doi.org/10.1088/0370-1301/63/2/305, 1950.
Chilson, P. B., Kirkwood, S., and Nilsson, A.: The Esrange MST radar: a brief introduction and procedure for range validation using balloons, Radio Sci., 34, 427–436, https://doi.org/10.1029/1998RS900023, 1999.
Copernicus Climate Change Service: ERA5: Fifth generation of ECMWF atmospheric reanalyses of the global climate. Climate Data Store (CDS), https://cds.climate.copernicus.eu/cdsapp#!/home (last access: 20 December 2019), 2017.
ESA: Applications: Aeolus, available at: http://www.esa.int/Applications/Observing_the_Earth/Aeolus (last access: 19 September 2020), 2018.
Fischer, C., Montmerle, T., Berre, L., Auger, L., and Stefanescu, S.: An overview of the variational assimilation in the ALADIN/France numerical weather-prediction system, Q. J. Roy. Meteor. Soc., 131, 3477–3492, https://doi.org/10.1256/qj.05.115, 2005.
Gage, K. S., McAfee, J. R., and Carter, D. A.: A Comparison of Winds Observed at Christmas island using a Wind-Profiling Doppler Radar with NMC and ECMWF Analyses, B. Am. Meteorol. Soc., 69, 1041–1047, https://doi.org/10.1175/1520-0477(1988)069<1041:ACOWOA>2.0.CO;2, 1988.
Giard, D. and Bazile, E.: Implementation of a new assimilation scheme for soil and surface variables in a global NWP model, Mon. Weather Rev., 128, 997–1015, https://doi.org/10.1175/1520-0493(2000)128<0997:IOANAS>2.0.CO;2, 2000.
Hersbach, H., Bell, B., Berrisford, P., Hirahara, S., Horányi, A., Muñoz‐Sabater, J., Nicolas, J., Peubey, C., Radu, R., Schepers, D., Simmons, A., Soci, C., Abdalla, S., Abellan, X., Balsamo, G., Bechtold, P., Biavati, G., Bidlot, J., Bonavita, M., De Chiara, G., Dahlgren, P., Dee, D., Diamantakis, M., Dragani, R., Flemming, J., Forbes, R., Fuentes, M., Geer, A., Haimberger, L., Healy, S., Hogan, R. J., Hólm, E., Janisková, M., Keeley, S., Laloyaux, P., Lopez, P., Lupu, C., Radnoti, G., de Rosnay, P., Rozum, I., Vamborg, F., Villaume, S., and Thépaut, J.‐N.: The ERA5 global reanalysis, Q. J. Roy. Meteor. Soc., 146, 1999–2049, https://doi.org/10.1002/qj.3803, 2020.
Hocking, W. K., Kelley, M., Rogers, R., Brown, W. O. J., Moorcroft, D., and St. Maurice, J.-P.: Resolute Bay VHF radar: A multipurpose tool for studies of tropospheric motions, middle atmosphere dynamics, meteor physics, and ionospheric physics, Radio Sci., 36, 1839–1857, https://doi.org/10.1029/2000RS001005, 2001.
Hocking, W. K., Röttger, J., Palmer, R. D., Sato, T., and Chilson, P. B.: Atmospheric radar: application and science of MST radars in the Earth's mesosphere, stratosphere, troposphere, and weakly ionized regions, Cambridge University Press, Cambridge, UK, and New York, USA, 2016.
Holdsworth, D. A.: Signal analysis with applications to atmospheric radars, PhD thesis, University of Adelaide, Adelaide, Australia, 371 pp., 1995.
Holdsworth, D. A.: Influence of instrumental effects upon the full correlation analysis, Radio Sci., 34, 643–655, https://doi.org/10.1029/1999RS900001, 1999.
Holdsworth, D. A. and Reid, I. M.: A simple model of atmospheric radar backscatter: description and application to the full correlation analysis of spaced antenna data, Radio Sci., 30, 1263–1280, https://doi.org/10.1029/95RS00645, 1995.
Jasperson, W. H.: Mesoscale time and space wind variability, J. Appl. Meteorol., 21, 831–839, https://doi.org/10.1175/1520-0450(1982)021%3C0831:MTASWV%3E2.0.CO;2, 1982.
Kirkwood, S., Wolf, I., Nilsson, H., Dalin, P., Mikhaylova, D., and Belova, E.: Polar mesosphere summer echoes at Wasa, Antarctica (73∘S): First observations and comparison with 68∘N, Geophys. Res. Lett., 34, L15803, https://doi.org/10.1029/2007GL030516, 2007.
Kirkwood, S., Mihalikova, M., Rao, T. N., and Satheesan, K.: Turbulence associated with mountain waves over Northern Scandinavia – a case study using the ESRAD VHF radar and the WRF mesoscale model, Atmos. Chem. Phys., 10, 3583–3599, https://doi.org/10.5194/acp-10-3583-2010, 2010.
Kudeki, E., Rastogi, P. K., and Sürücü, F.: Systematic Errors in Radar Wind Estimation: Implications for Comparative Measurements, Radio Sci., 28, 169–179, https://doi.org/10.1029/92RS01931, 1993.
MacKinnon, A. D.: VHF boundary layer radar and RASS, PhD thesis, University of Adelaide, Adelaide, Australia, 286 pp., 2001.
Masson, V., Le Moigne, P., Martin, E., Faroux, S., Alias, A., Alkama, R., Belamari, S., Barbu, A., Boone, A., Bouyssel, F., Brousseau, P., Brun, E., Calvet, J.-C., Carrer, D., Decharme, B., Delire, C., Donier, S., Essaouini, K., Gibelin, A.-L., Giordani, H., Habets, F., Jidane, M., Kerdraon, G., Kourzeneva, E., Lafaysse, M., Lafont, S., Lebeaupin Brossier, C., Lemonsu, A., Mahfouf, J.-F., Marguinaud, P., Mokhtari, M., Morin, S., Pigeon, G., Salgado, R., Seity, Y., Taillefer, F., Tanguy, G., Tulet, P., Vincendon, B., Vionnet, V., and Voldoire, A.: The SURFEXv7.2 land and ocean surface platform for coupled or offline simulation of earth surface variables and fluxes, Geosci. Model Dev., 6, 929–960, https://doi.org/10.5194/gmd-6-929-2013, 2013.
Müller, M., Homleid, M., Ivarsson, K., Køltzow, M. Ø., Lindskog, M., Midtbø, K., Andrae, U., Aspelien, T., Berggren, L., Bjørge, D., Dahlgren, P., Kristiansen, J., Randriamampianina, R., Ridal, M., and Vignes, O.: AROME-MetCoOp: A Nordic Convective-Scale Operational Weather Prediction Model, Weather Forecast., 32, 609–627, https://doi.org/10.1175/WAF-D-16-0099.1, 2017.
Rabier, F., Thepaut, J.-N., and Courtier, P.: Extended assimilation and forecast experiments with a four-dimensional variational assimilation system, Q. J. Roy. Meteor. Soc., 124, 1861–1888, https://doi.org/10.1002/qj.49712455005, 1998.
Reid, I. M., Holdsworth, D. A., Kovalam, S., Vincent, R. A., and Stickland, J.: Mount Gambier (38∘ S, 141∘ E) prototype VHF wind profiler, Radio Sci., 40, RS5007, https://doi.org/10.1029/2004RS003055, 2005.
Rust, D. W., Burgess, D. W., Madox, R. A., Showell, L. C., Marshall, T. C., and Lauritsen, D. K.: Testing a mobile version of a cross-chain LORAN atmospheric (M-CLASS) sounding system, B. Am. Meteorol. Soc., 71, 173–181, https://doi.org/10.1175/1520-0477(1990)071<0173:TAMVOA>2.0.CO;2, 1990.
Schafer, R., Avery, S. K., and Gage, K. S.: A Comparison of VHF Wind Profiler Observations and the NCEP–NCAR Reanalysis over the Tropical Pacific, J. Appl. Meteor., 42, 873–889, https://doi.org/10.1175/1520-0450(2003)042<0873:ACOVWP>2.0.CO;2, 2003.
Stober, G., Latteck, R., Rapp, M., Singer, W., and Zecha, M.: MAARSY – the new MST radar on Andøya: first results of spaced antenna and Doppler measurements of atmospheric winds in the troposphere and mesosphere using a partial array, Adv. Radio Sci., 10, 291–298, https://doi.org/10.5194/ars-10-291-2012, 2012.
Straume, A. G., Rennie, M., Isaksen, L., de Kloe, J., Marseille, G.-J., Stoffelen, A., Flament, T., Stieglitz, H., Dabas, A., Huber, D., Reitebuch, O., Lemmerz, C., Lux, O., Marksteiner, U., Weiler, F., Witschas, B., Meringer, M., Schmidt, K., Nikolaus, I., Geiß, A., Flamant, P., Kanitz, T., Wernham, D., von Bismarck, J., Bley, S., Fehr, T., Floberghagen, R., and Parrinello, T.: ESA's space-based Doppler wind lidar mission Aeolus – First wind and aerosol product assessment results, EPJ Web Conf., 237, 01007, https://doi.org/10.1051/epjconf/202023701007, 2020.
Vincent, R. A., May, P. T., Hocking, W. K., Elford, W. G., Candy, B. H., and Briggs, B. H.: First results with the Adelaide VHF radar: spaced antenna studies of tropospheric winds, J. Atmos. Terr. Phys., 49, 353–366, https://doi.org/10.1016/0021-9169(87)90030-4, 1987.
WMO: WIGOS: WMO Integrated Global Observing System, Final report of the Fifth WMO Workshop on the Impact of Various Observing Systems on Numerical Weather Prediction, WMO Tech. Report 2012-1, World Meteorological Organization, Geneva, Switzerland, 23 pp., 2012.