the Creative Commons Attribution 4.0 License.
the Creative Commons Attribution 4.0 License.
 | 15 Jan 2021
ModIs Dust AeroSol (MIDAS): a global fine-resolution dust optical depth data set
Emmanouil Proestakis
Vassilis Amiridis
Stelios Kazadzis
Enza Di Tomaso
Alexandra Tsekeri
Eleni Marinou
Nikos Hatzianastassiou
Carlos Pérez García-Pando
Monitoring and describing the spatiotemporal variability in dust aerosols is crucial for understanding their multiple effects, related feedbacks, and impacts within the Earth system. This study describes the development of the ModIs Dust AeroSol (MIDAS) data set. MIDAS provides columnar daily dust optical depth (DOD) at 550 nm at a global scale and fine spatial resolution (0.1∘ × 0.1∘) over a 15-year period (2003–2017). This new data set combines quality filtered satellite aerosol optical depth (AOD) retrievals from MODIS-Aqua at swath level (Collection 6.1; Level 2), along with DOD-to-AOD ratios provided by the Modern-Era Retrospective analysis for Research and Applications version 2 (MERRA-2) reanalysis to derive DOD on the MODIS native grid. The uncertainties of the MODIS AOD and MERRA-2 dust fraction, with respect to the AEronet RObotic NETwork (AERONET) and LIdar climatology of vertical Aerosol Structure for space-based lidar simulation (LIVAS), respectively, are taken into account for the estimation of the total DOD uncertainty. MERRA-2 dust fractions are in very good agreement with those of LIVAS across the dust belt in the tropical Atlantic Ocean and the Arabian Sea; the agreement degrades in North America and the Southern Hemisphere, where dust sources are smaller. MIDAS, MERRA-2, and LIVAS DODs strongly agree when it comes to annual and seasonal spatial patterns, with colocated global DOD averages of 0.033, 0.031, and 0.029, respectively; however, deviations in dust loading are evident and regionally dependent. Overall, MIDAS is well correlated with AERONET-derived DODs (R=0.89) and only shows a small positive bias (0.004 or 2.7 %). Among the major dust areas of the planet, the highest R values (>0.9) are found at sites of North Africa, the Middle East, and Asia. MIDAS expands, complements, and upgrades the existing observational capabilities of dust aerosols, and it is suitable for dust climatological studies, model evaluation, and data assimilation.
- Article
(18178 KB) - Full-text XML
-
Supplement
(3584 KB) - BibTeX
- EndNote


Among tropospheric and stratospheric aerosol species, dust aerosol is the most abundant component in terms of mass, contributing more than half of the global aerosol amount (Textor et al., 2006; Zender et al., 2011). Preferential sources of dust aerosols are located in areas where precipitation is low, thus favoring aridity, whereas a significant contributing factor is the accumulation of alluvial sediments. Such regions comprise deserts, dry lake beds, and ephemeral channels (e.g., Middleton and Goudie, 2001; Prospero et al., 2002; Ginoux et al., 2012). Previous studies (Prospero et al., 2002; Ginoux et al., 2012) have shown that the major portion of the global dust burden originates from the Sahara, which hosts the most intense dust source of the planet, the Bodélé Depression located in the northern Lake Chad Basin. In North Africa, large amounts of mineral particles are also emitted in the western Sahara, while other noticeable sources of smaller spatial extension are located in the eastern Libyan Desert, in the Nubian Desert (Egypt), and Sudan (Engelstaedter et al., 2006).
One of the major dust sources of the planet, following North Africa, is the Middle East, with several active regions (Pease et al., 1998; Hamidi et al., 2013; Yu et al., 2013) in which wind-blown dust is emitted from alluvial plains (Tigris–Euphrates river system) and sandy deserts (Rub' al Khali desert). Important dust sources are also recorded in the Asian continent, particularly in the Taklamakan Desert (Ge et al., 2014), in the Gobi Desert (Chen et al., 2017), in the central parts of Asia (Karakum Desert; Li and Sokolik, 2018), in the Sistan Basin (Alizadeh Choobari et al., 2013), and in the Thar Desert (Hussain et al., 2005). In North America, mineral particles emitted from the Mojave and Sonoran deserts (Hand et al., 2017) have mainly natural origins, while in the Chihuahuan Desert as well as in the Southern Great Plains the anthropogenic interference on soil can favor emissions of dust particles and, subsequently, their entrainment in the atmosphere (Hand et al., 2016). Overall, the major portion of the global dust budget arises from the deserts of the Northern Hemisphere (Ginoux et al., 2012) while mineral aerosols are also emitted in Australia (Ekström et al., 2004), Southern Africa (Bryant et al., 2007; Vickery et al., 2013), and South America (Gassó and Torres, 2019) but to a lesser extent. At a global scale, most of the entrained dust loads in the atmosphere originate from tropical and subtropical arid regions; however, about 5 % of the global dust budget consists of particles emitted from high-latitude sources (Bullard et al., 2016).
Dust plays a key role in several aspects of the Earth system, such as climate (e.g., Lambert et al., 2013; Nabat et al., 2015) and weather (Pérez et al., 2006; Gkikas et al., 2018, 2019). The key role of dust consists in the perturbation of the Earth–atmosphere system radiation budget (Sokolik and Toon, 1996; Haywood and Bucher, 2000) by mineral particles, the productivity of oceanic waters (Jickells et al., 2005) and terrestrial ecosystems (Okin et al., 2004), and the effects on human health (Kanatani et al., 2010; Kanakidou et al., 2011; Pérez García-Pando et al., 2014; Du et al., 2016; Querol et al., 2019). Dust is characterized by a pronounced temporal and spatial variability due to the heterogeneity of the emission, transport, and deposition processes governing its life cycle (Schepanski, 2018). A variety of atmospheric circulation mechanisms, spanning from local to planetary scales, are responsible for the uplifting of erodible particles from bare soils (Koch and Renno, 2005; Knippertz et al., 2007; Klose and Shao, 2012; Fiedler et al., 2013) and their subsequent transport (Husar et al., 2001; Prospero and Mayol-Bracero, 2013; Yu et al., 2015; Flaounas et al., 2015; Gkikas et al., 2015), accumulation, and removal (Zender et al., 2003; Ginoux et al., 2004) from the atmosphere.
Given the scientific importance of dust in the Earth system and the numerous socioeconomic impacts (Stefanski and Sivakumar, 2009; Weinzierl et al., 2012; Kosmopoulos et al., 2018), there is a need to monitor and forecast dust loads at different spatiotemporal scales. Contemporary satellite observations, available over long-term periods, have proven to be a powerful tool in such efforts as they provide wide spatial coverage, relatively high sampling frequency, and considerably high accuracy. Spaceborne retrievals have been widely applied in aerosol research for the description of dust load features and their evolution (e.g., Kaufman et al., 2005; Liu et al., 2008; Peyridieu et al., 2013; Rashki et al., 2015; Gkikas et al., 2013, 2016; Marinou et al., 2017; Proestakis et al., 2018). Even more accurate aerosol observations, although locally restricted, are derived by ground-based platforms consisting of Sun photometers, lidars, and in situ instruments. Based on these measurements, the columnar optical and microphysical properties of mineral particles have been analyzed extensively (Giles et al., 2012), altitude-resolved information of optical properties has provided insight about the dust vertical distribution (Mamouri and Ansmann, 2014), and a comprehensive description of dust optical, microphysical, and chemical properties has been achieved from surface and aircraft in situ instruments (Rodríguez et al., 2012; Liu et al., 2018). Finally, through the deployment of atmospheric–dust models (e.g., Pérez et al., 2011; Haustein et al., 2012), global (e.g., Ginoux et al., 2004) and regional (e.g., Basart et al., 2012) displays of the dust burden are provided.
Traditionally, observations have been utilized to evaluate and eventually constrain model performance. Observations are increasingly used in data assimilation (DA) schemes for aerosol forecast initialization (Di Tomaso et al., 2017) and the development of reanalysis data sets (Benedetti et al., 2009; Lynch et al., 2016; Gelaro et al., 2017). The most exploited reanalysis data sets in dust-related studies are the Modern Era Retrospective analysis for Research and Applications aerosol reanalysis (MERRAero; Buchard et al., 2015) and its evolution to the Modern-Era Retrospective analysis for Research and Applications version 2 (MERRA-2; Gelaro et al., 2017), and the Copernicus Atmosphere Monitoring Service Reanalysis (CAMSRA; Inness et al., 2019) and its predecessor monitoring atmospheric composition and climate (MACC; Inness et al., 2013). Current reanalysis data sets provide information about dust aerosols at high temporal resolution and decadal timescales. However, even though AOD observations are assimilated, the performance of the simulated outputs is partly model driven, and their resolution is relatively coarse.
The overarching goal of the present study is to describe the development of the ModIs Dust AeroSol (MIDAS) data set, providing dust optical depth (DOD) over a 15-year period (2003–2017). The powerful element of this product is its availability at fine spatial resolution (0.1∘ × 0.1∘) and on a daily basis and the provision of full global coverage (i.e., both over land and ocean). Ginoux et al. (2012) analyzed DOD at the same spatial resolution and for a long-term period but restricted the analysis to continental surfaces as the scientific focus was put on the identification of natural and anthropogenic dust sources. Voss and Evan (2020) combined satellite (MODIS; Advanced Very High Resolution Radiometer – AVHRR) aerosol retrievals and MERRA-2 winds to analyze DOD at a coarse spatial resolution (1∘ × 1∘) for extended time periods. Cloud–Aerosol LIdar with Orthogonal Polarization (CALIOP)-based vertical dust backscatter and extinction profiles, along with the respective column integrated DODs at 1∘ × 1∘ spatial resolution, are distributed via the LIdar climatology of vertical Aerosol Structure for space-based lidar simulation (LIVAS) database (Amiridis et al., 2015). Taking advantage of the spectral signature of dust at thermal infrared (TIR) wavelengths, DOD is also provided by an Infrared Atmospheric Sounding Interferometer (IASI; Vandenbussche et al., 2013; Capelle et al., 2018; Clarisse et al., 2019) and Spinning Enhanced Visible and Infrared Imager (SEVIRI; Ackerman, 1997) instruments aboard the polar-orbiting Meteorological Operational (METOP) satellites and the geostationary Meteosat Second Generation (MSG) satellite, respectively. In this case, the conversion of DOD from TIR to the mid-visible spectrum range is subjected to several assumptions related to size and other properties. Dust observations from IASI are provided at a global scale twice per day, and those of SEVIRI cover the hemisphere centered at the prime meridian over the Equator every 15 min (Schepanski et al., 2012). Thanks to their high sampling frequency, fine spatial resolution, and long-term availability, the aforementioned data sets have been used for the identification of dust source activation across North Africa (Schepanski et al., 2007; Vandenbussche et al., 2020). Based on the current status described above, MIDAS data set expands, complements, and upgrades existing observational capabilities of dust aerosols, being suitable for research studies related to climatology, model evaluation, and data assimilation.
For the development of the fine-resolution MIDAS DOD, a synergy of MODIS-Aqua (Sect. 2.1), MERRA-2 (Sect. 2.2), LIVAS (Sect. 2.3), and AEronet RObotic NETwork (AERONET; Sect. 2.4) aerosol products has been deployed by exploiting the strong capabilities of each data set. Based on the applied methodology (Sect. 3.1), the DOD is calculated by the product of MODIS-Aqua Level 2 AOD and the colocated DOD-to-AOD ratio from MERRA-2. The uncertainty of the DOD is calculated by combining the uncertainties of MODIS AOD and MERRA-2 dust fraction (MDF), using AERONET and LIVAS, respectively, as a reference (Sect. 3.2). We thoroughly compare MDF against the LIVAS dust portion in Sect. 4.1. The MIDAS DOD is evaluated against AERONET in Sect. 4.2 and compared with MERRA-2 and LIVAS DODs in Sect. 4.3. In Sect. 4.4, we provide the annual and seasonal global geographical distributions of the MIDAS DOD as a demonstration of the developed product. Finally, the main findings are summarized and the conclusions are drawn in Sect. 5.
2.1 MODIS
The MODerate resolution Imaging Spectroradiometer (MODIS) is a passive sensor measuring the top of atmosphere (TOA) reflectance in order to retrieve aerosol optical depth (AOD), among other aerosol optical properties, at various wavelengths spanning from the visible to the near-infrared spectrum range. MODIS, mounted on the NASA's twin polar satellites of Terra and Aqua, has acquired high-quality aerosol data since 2000 and 2002, respectively, while, thanks to its wide swath (∼2330 km), providing near-global observations almost on a daily basis. The derivation of AOD is achieved through the implementation of two retrieval algorithms based on the Dark Target (DT) approach, valid over oceans (Remer et al., 2002, 2005, 2008) and vegetated continental areas (Levy et al., 2007a, b, 2010) but relying on different assumptions and bands, and the Deep Blue (DB) approach (Hsu et al., 2004; Sayer et al., 2013), providing retrievals over all cloud-free and snow-free land surfaces, including arid and semi-arid surfaces. MODIS data sets are organized into various collections, depending on the version of the retrieval algorithms, and into a number of levels, depending on their spatial and temporal resolution. For our purposes, we are utilizing Collection 6.1 (C061) MODIS-Aqua Level 2 (L2) retrievals over the period 2003–2017, which are reported at 5 min swath granules (Levy et al., 2013) and are accessible from the Level 1 and Atmosphere Archive and Distribution System (LAADS) Distributed Active Archive Center (DAAC) (https://ladsweb.modaps.eosdis.nasa.gov/, last access: 17 December 2020). All the updates applied in the latest version of MODIS DB and DT retrievals, with respect to Collection 6, are provided in the relevant technical documents available at the Atmosphere Discipline Team Imager Products web page (https://atmosphere-imager.gsfc.nasa.gov/documentation/collection-61, last access: 17 December 2020).
Each MODIS swath is composed of 203 × 135 retrievals, with increasing pixel size from the nadir view (10 km × 10 km) towards the edge of the satellite scan (48 km × 20 km) and to which a quality assurance (QA) flag is assigned (Hubanks et al., 2018). More specifically, these bit values represent the reliability of the algorithm output and are equal to 0 (no confidence), 1 (marginal), 2 (good), and 3 (very good). MODIS AOD retrievals are acquired based on different algorithms according to the underlying surface type. In order to fill observational gaps attributed to the assumptions or limitations of the applied MODIS algorithms, the DT ocean (QA ≥ 1), DT land (QA = 3), and DB land (QA ≥ 2) AOD retrievals are merged based on the normalized difference vegetation index (NDVI) and the highest accuracy criterion (Sayer et al., 2014). This merged AOD is stored in the scientific data set (SDS) named AOD_550_Dark_Target_Deep_Blue_Combined, which is extracted and processed for the needs of the current work. Finally, two quality filtering criteria are applied to the raw MODIS AODs for eliminating observations which may be unreliable. AODs associated with cloud fraction (CF) higher than 0.8, and those with no adjacent retrievals, are masked out, following the recommendations of previous studies (Anderson et al., 2005; Zhang and Reid, 2006; Hyer et al., 2011; Shi et al., 2011). The first criterion is associated with the potential cloud contamination on AODs while the second one discards suspicious retrievals from the data set.
2.2 MERRA-2
The Modern-Era Retrospective Analysis for Research and Applications version 2 (MERRA-2), developed by the NASA Global Modeling and Assimilation Office (GMAO), is the first atmospheric reanalysis spanning over the new modern satellite era (1980 onward) in which aerosol–radiation interactions and the two-way feedbacks with atmospheric processes are taken into account (Gelaro et al., 2017). The key components of MERRA-2 (Buchard et al., 2017) are the Goddard Earth Observing System (GEOS-5; Molod et al., 2015), which is radiatively coupled to the Goddard Chemistry Aerosol Radiation and Transport model (GOCART; Chin et al., 2002; Colarco et al., 2010) and the 3D variational (3DVar) Gridpoint Statistical Interpolation (GSI) analysis system (Wu et al., 2002).
The GOCART aerosol module simulates emission, sinks, removal mechanisms (dry deposition and gravitational settling, large-scale wet removal and convective scavenging), and the chemical processes of five aerosol species, namely dust, sea salt, sulfate, and black and organic carbon. Their optical properties are based on the updated Optical Properties of Aerosols and Clouds (OPAC) database (Hess et al., 1998), incorporating dust nonspherical shape (Meng et al., 2010; Colarco et al., 2014), and are calculated according to Colarco et al. (2010). For coarse particles (i.e., dust and sea salt), five noninteracting size bins are considered for which the emissions are driven by the wind speed, based on the parameterizations of Marticorena and Bergametti (1995), for dust and on the modified version of Gong (2003) for sea salt. Both hydrophobic and hydrophilic black carbon (BC) and organic carbon (OC) emitted from anthropogenic activities (i.e., fossil fuel combustion) and natural processes (i.e., biomass burning) are considered. Regarding sulfate aerosols (SO4), these are either primarily emitted or are formed by the chemical oxidation of sulfur dioxide gas (SO2) and dimethyl sulfide (DMS). Until 2010, daily emissions of eruptive and degassing volcanoes were derived from the AeroCom Phase II project (Diehl et al., 2012; http://aerocom.met.no/, last access: 17 December 2020) and afterwards only a repeating annual cycle of degassing volcanoes was included in MERRA-2. The hygroscopic growth of sea salt, sulfate, and hydrophilic carbonaceous aerosols is determined by the simulated relative humidity (RH), and the subsequent modification of particles' shape and composition is taken into account in computations of particles' fall velocity and optical parameters (Randles et al., 2017). A detailed description of the emission inventories, along with the global climatological maps representative for the period 2000–2014, are given in Randles et al. (2017).
MERRA-2 is a multidecadal reanalysis in which a variety of meteorological and aerosol observations are jointly assimilated (Gelaro et al., 2017). The former group of observations consists of ground-based and spaceborne atmospheric measurements/retrievals summarized in Table 1 of Gelaro et al. (2017), while the full description is presented in McCarty et al. (2016). For aerosol data assimilation, the core of the utilized satellite data is coming from the MODIS instrument multichannel radiances in addition to observational geometry parameters, cloud fraction, and ancillary wind data. Over oceans, AVHRR radiances, from January 1980 to August 2002, are used as well, and over bright surfaces (albedo > 0.15), the non-bias-corrected AOD retrieved for the Multiangle Imaging SpectroRadiometer (MISR; Kahn et al., 2005) is assimilated from February 2000 to June 2014. Apart from spaceborne radiances and retrievals, the Level 2 (L2) quality-assured AERONET measurements (1999–October 2014; Holben et al., 1998) are integrated in the MERRA-2 assimilation system (Goddard Aerosol Assimilation System – GAAS), which is presented in Randles et al. (2017; Sect. 3). The cloud-free MODIS radiances (DT algorithm; Collection 5) and AVHRR radiances (above oceanic regions) are used for the derivation of bias-corrected AODs, via a neural net retrieval (NNR), adjusted to the log-transformed AERONET AODs. It must be clarified that only the MERRA-2 AOD is directly constrained by the observations, while the model's performance (background forecast) and data assimilation structure (parameterization of error covariances) are responsible for the aerosol speciation, among other aerosol diagnostics (Buchard et al., 2017).
In the present study, we use the columnar MERRA-2 total and dust AOD at 550 nm in order to calculate the contribution, in optical terms, of mineral particles to the overall load. The computed dust-to-total AOD ratio (i.e., MDF) is evaluated against LIVAS and then used for the derivation of MIDAS DOD. MERRA-2 products (M2T1NXAER files; V5.12.4; aerosol diagnostics) have been downloaded from the NASA Goddard Earth Sciences (GES) Data and Information Services Center (DISC) server (https://disc.gsfc.nasa.gov/, last access: 17 December 2020) and are provided as hourly averages at 0.5∘ × 0.625∘ lat–long spatial resolution.
2.3 LIVAS
The European Space Agency (ESA) LIVAS database (Amiridis et al., 2015) contains a pure dust satellite-based product spanning from 2007 to 2015, which has been derived from the Cloud–Aerosol Lidar with Orthogonal Polarization (CALIOP) sensor on board the Cloud–Aerosol Lidar and Infrared Pathfinder Satellite Observation (CALIPSO) satellite. This active sensor has acquired altitude-resolved observations of aerosols and clouds since mid-June 2006 (Winker et al., 2010). CALIPSO, flying in the A-Train constellation (Stephens et al., 2002), provides almost simultaneous observations with Aqua, thus making their synergistic implementation for aerosol research feasible and powerful. CALIOP, an elastic backscatter two-wavelength polarization-sensitive Nd:YAG lidar in a near-nadir-viewing geometry (since 28 November 2007; 3∘ off nadir), emits linearly polarized light at 532 and 1064 nm and detects the copolar components at 532 and 1064 nm and the cross-polar component at 532 nm, relative to the laser polarization plane (Hunt et al., 2009). Based on the attenuated backscatter profiles (Level 1B) and the implementation of retrieval algorithms (Winker et al., 2009), aerosol and/or cloud profiles and layer products are provided at various processing levels (Tackett et al., 2018). CALIOP Level 2 (L2) aerosol and cloud products are provided at a uniform spatial resolution along horizontal (5 km) and vertical (60 m) dimensions. Detectable atmospheric features are first categorized to aerosols or clouds and are then further discriminated into specific subtypes according to Vaughan et al. (2009). For aerosols, in Version 3 used here, six subtypes are considered, consisting of clean marine, dust, polluted continental, clean continental, polluted dust, and smoke (Omar et al., 2009). Based on the aerosol subtype classification, specific extinction-to-backscatter ratios (lidar ratio – LR) are applied for the provision of extinction coefficient profiles along the CALIPSO orbit track (Young and Vaughan, 2009).
In this study, we use the CALIOP pure dust product available in the aforementioned LIVAS database (hereafter called the LIVAS data set), which has been developed according to the methodology described in Amiridis et al. (2013) and updated in Marinou et al. (2017). The aforementioned technique relies on the incorporation of aerosol backscatter coefficient profiles and a depolarization ratio, providing a strong evidence of dust presence, due to mineral particles' irregular shape (Freudenthaler et al., 2009; Burton et al., 2015; Mamouri and Ansmann, 2017), thus allowing the separation of the dust component from aerosol mixtures. The LIVAS data set is obtained by applying appropriate regionally dependent LR values (see Fig. S1; Marinou et al., 2017; Proestakis et al., 2018 and references within), instead of the raw universal CALIOP dust LR (40 sr; Version 3), which are multiplied with the dust backscatter coefficient profiles at 532 nm in order to calculate the corresponding extinction coefficient profiles. After a series of strict quality screening filters (Marinou et al., 2017), the columnar total, dust, and nondust optical depths, as well as the DOD-to-AOD ratio over the period 2007–2015, are aggregated at 1∘ × 1∘ grid cells covering the whole globe. The performance of the LIVAS pure DOD product has been assessed against AERONET over North Africa and Europe (Amiridis et al., 2013) revealing a substantial improvement when the abovementioned methodological steps are applied. The LIVAS pure DOD product has been utilized in a variety of research studies, such as the assessment of dust outbreaks (Kosmopoulos et al., 2017; Solomos et al., 2018) and phytoplankton growth (Li et al., 2018), the 4D description of mineral loads over long-term periods (Marinou et al., 2017; Proestakis et al., 2018), the evaluation of dust models (Tsikerdekis et al., 2017; Georgoulias et al., 2018; Konsta et al., 2018), as well as the evaluation of new satellite products (Georgoulias et al., 2016).
2.4 AERONET
Ground-based observations acquired from the AEronet RObotic NETwork (AERONET; Holben et al., 1998) have been used as reference in this work in order to evaluate the accuracy of the MIDAS DOD product. The evaluation analysis has been performed by utilizing the almucantar (inversion) retrievals, providing information for the total aerosol amount (AOD) and for other microphysical (e.g., volume size distribution) and optical (e.g., single scattering albedo) properties (Dubovik and King, 2000; Dubovik et al., 2006). In the present study, focus is put on the aerosol optical properties retrieved at four wavelengths (440, 675, 870, and 1020 nm), utilizing spectral AODs and sky (diffuse) radiances as inputs. More specifically, we used Version 3 (V3) AERONET data (Giles et al., 2019; Sinyuk et al., 2020) of AOD (for total and coarse aerosols), the Ångström exponent (α), and single scattering albedo (SSA). For the amount (AOD) and size (α)-related optical parameters, only quality assured retrievals (i.e., Level 2; L2) are used, whereas for the SSA, the L2 and Level 1.5 (L1.5) observations are merged in order to ensure maximum availability. Unfavorable atmospheric conditions or restrictions on solar geometry result in a reduced amount of inversion outputs compared to the availability of Sun-direct measurements or the spectral deconvolution algorithm (SDA; O'Neill et al., 2003) retrievals. Even though the aforementioned AERONET data provide information about aerosol size (i.e., Ångström exponent) or coarse AOD (from SDA retrievals), the optimum approach for identifying dust particles and discriminating them from other coarse particles (i.e., sea salt) requires the use of SSA, as discussed in the next paragraph.
Through the combination of the selected optical properties from almucantar retrievals, we achieved the spectral matching between ground-based and spaceborne observations and the determination of DOD on AERONET retrievals. Regarding the first part, the α440–870 nm and AOD870 nm values are applied in the Ångström formula in order to interpolate the AERONET AOD at a common wavelength (i.e., 550 nm) with MODIS. For the evaluation of DOD, a special treatment of AERONET retrievals is required in order to identify conditions where dust particles either only exist in or clearly dominate over other aerosol species. The vast majority of previous studies (e.g., Fotiadi et al., 2006; Toledano et al., 2007; Basart et al., 2009) have relied on the combination of AOD and α for aerosol characterization, associating the presence of mineral particles with low α levels and considerable AODs. Here, we are keeping records where the α440–870 nm≤0.75 and SSA675 nm−SSA440 nm>0, without taking into account the aerosol optical depth. The first criterion ensures the predominance of coarse aerosols, while the second one serves as an additional filter for discriminating dust from sea salt particles, taking advantage of the specific spectral signature of SSA (i.e., decreasing absorptivity for increasing wavelengths in the visible spectrum) in pure or dust-rich environments (Giles et al., 2012).
Then, from the coarse AODs at 440, 675, and 870 nm we calculate the corresponding α, which is applied in order to obtain the AERONET coarse AOD at 550 nm. This constitutes the AERONET-derived DOD, assuming that the contribution of fine dust particles (particles with radii less than the inflection point in the volume size distribution) is small. Likewise, through this consideration, any potential contamination from small-size particles of anthropogenic or natural origin (e.g., biomass burning), which is likely far away from the sources, is tempered or avoided.
3.1 Derivation of dust optical depth on MODIS swaths
The core concept of our approach is to derive DOD on MODIS L2 retrievals, provided at a fine spatial resolution, via the synergy with the MERRA-2 products. More specifically, the MERRA-2 dust fraction (MDF) to total AOD550 nm (Eq. 1) is multiplied with the MODIS AOD550 nm in order to calculate DOD550 nm at swath level (Eq. 2).
To achieve that, the data sets are colocated temporally and spatially. MERRA-2 outputs are provided at a coarse spatial resolution (0.5∘ × 0.625∘), in contrast to MODIS-Aqua observations (10 km × 10 km). MODIS swaths are composed by 203 × 135 retrievals, and for each one of them, we compute the nearest distance from the MERRA-2 grid points, considering the closest hourly time step to the MODIS overpass time. Then, the MDF is used to calculate the DOD from the AOD on MODIS swath native grid. Our approach purposely avoids the inclusion of additional optical properties providing information on aerosol size (α), available from MODIS, and absorptivity (Aerosol Index; Torres et al., 1998), available from Ozone Monitoring Instruments (OMIs), that are characterized by inherent limitations. Previous evaluation studies (Levy et al., 2013; Sayer et al., 2013) have shown that size parameters acquired by MODIS are highly uncertain, particularly over land and at low AOD conditions. In addition, since early 2008, the OMI sensor has lost half of its swath due to the row anomaly issue (Torres et al., 2018), thus hampering the MODIS–OMI colocation when it is attempted at a fine spatial resolution.
3.2 Uncertainty estimation
As expressed in Eq. (2), the MIDAS DOD results from the product of MODIS AOD and MDF. The uncertainty of the DOD product (Δ(DOD)) accounts for the corresponding uncertainties in the AOD and MDF, which are calculated using AERONET and LIVAS, respectively, as a reference. The mathematical expression of the Δ(DOD), given in Eq. (3), as follows, results from the implementation of the product rule on Eq. (2).
The term Δ(AOD) defines the expected error (EE) confidence envelope within which ∼68 % of the MODIS–AERONET AOD differences are expected to fall. This term varies, depending on the applied MODIS aerosol retrieval algorithm.
For each of the two DT retrieval algorithms, we use the corresponding linear equations expressing Δ(AOD) with respect to AERONET AOD over the ocean (Levy et al., 2013; Eq. 4) and land (Levy et al., 2010; Eq. 5). For the DB AOD land retrievals (Eq. 6), we use the formula for prognostic uncertainty estimates given in Sayer et al. (2013) but with updated coefficients a and b for C061 data varying between vegetated and arid surface types (https://atmosphere-imager.gsfc.nasa.gov/sites/default/files/ModAtmo/modis_deep_blue_c61_changes2.pdf, last access: 17 December 2020). More specifically, over vegetated land, a and b are equal to 0.079 and 0.67, respectively, while the corresponding values over barren soils are equal to 0.12 and 0.61. The land cover classes have been extracted from the International Geosphere–Biosphere Programme (IGBP) database available via the MCD12C1 data (https://lpdaac.usgs.gov/products/mcd12c1v006/, last access: 17 December 2020). For the merged (DB and DT) land AOD, the uncertainty is estimated via the square root of the quadrature sum of the DT land and DB land uncertainties divided by two (Eq. 7).
Before proceeding with the calculation of the Δ(DOD), a few key aspects must be highlighted for the sake of clarity. In Eqs. (4) and (5), the AOD uncertainty is defined as a diagnostic error, since it is calculated utilizing AERONET as a reference. Here, we are using the same equations, replacing AERONET AODs with those given by MODIS. This relies on the fact (results not shown here) that their averages from a global perspective are almost unbiased; however, at regional level, small negative or positive offsets (lower than 0.05 in absolute terms) are recorded in the vast majority of AERONET sites, thus supporting our argument. For the ocean AOD uncertainty, the defined EE margins (Levy et al., 2013) have been modified in order to sustain symmetry by keeping the upper bound (i.e., thus including more than 68 % of expected MODIS–AERONET pairs within the EE). Sayer et al. (2013) estimated the uncertainty of DB AOD by taking into account the geometric air mass factor (AMF) resulting from the sum of the reciprocal cosines of the solar and viewing zenith angles (Eq. 6).
The LIVAS dust fraction is our reference for estimating the MDF uncertainty. The analysis is performed at 1∘ × 1∘ spatial resolution, considering only grid cells in which both MERRA-2 and LIVAS DODs are higher than or equal to 0.02. According to this criterion, more than 450 000 LIVAS–MERRA-2 colocated pairs have been found that are sorted (ascending order) based on MDF (ranging from 0 to 1) and are then grouped in equal size bins containing 20 000 data for each subsample. For every group, we computed the median MDF (x axis) and the 68th percentile of the absolute MERRA-2–LIVAS dust fraction (y axis), and then we found the best polynomial fit (Eq. 8).
Depending on the selected MODIS algorithm, the appropriate combination between AOD (Eqs. 4, 5, 6, and 7) and MDF (Eq. 8) uncertainties is applied to calculate the Δ(DOD; Eq. 3) on each daily measurement (i.e., DOD) at each grid cell. These pixel-level DOD uncertainties are averaged over the entire study period and for each season, and the obtained findings will be discussed along with the global spatial patterns (Sect. 4.5) of dust optical depth in order to provide a measure of the reliability of the derived MIDAS DOD product.
In the following sections, a series of analyses, including the evaluation of MDF with respect to LIVAS (Sect. 4.1), the evaluation of MIDAS DOD versus AERONET observations (Sect. 4.2), and an intercomparison among MIDAS, LIVAS, and MERRA-2 DODs (Sect. 4.3) is presented. All the aforementioned steps are performed in order to justify the validity of the applied methodology and to understand its limitations. In the last section (Sect. 4.4), the global annual and seasonal DOD patterns are presented as a demonstration of the MIDAS data set, and the obtained spatiotemporal features are briefly discussed. The detailed climatological study is provided in a companion paper.
4.1 Evaluation of MERRA-2 dust fraction versus LIVAS
The evaluation of the MDF is a critical step in our analysis since it is used as the scaling factor of the MODIS AOD for the derivation of the MIDAS DOD. For this reason, the corresponding columnar parameter provided by LIVAS (see Sect. 2.3) is used as reference. It must be highlighted that the only existing evaluation studies of MERRA-2 aerosol products have been performed either for specific aerosol species or limited time periods (e.g., Buchard et al., 2017; Veselovskii et al., 2018) or for the total load (e.g., Mukkavilli et al., 2019; Sun et al., 2019) in specific regions showing the ability of MERRA-2 to reproduce the integrated aerosol fields. Nevertheless, the speciation of the suspended particles, which is, to a large extent, determined by the model physics assumptions (Gelaro et al., 2017), has not been thoroughly evaluated. Therefore, the present analysis complements and further expands the existing works providing insight about the performance of MERRA-2 in terms of discriminating among aerosol types (particularly for dust) and subsequently estimating their contribution to the total atmospheric load.
Figure 1 depicts the geographical distributions of the dust-to-total AOD ratio, based on MERRA-2 (a) and LIVAS (b) averaged over the time frame (2007–2015) of the LIVAS data set. The corresponding maps of mean bias, fractional bias (FB), fractional gross error (FGE), and correlation coefficient (R) are given in Fig. 2. For consistency, we regridded the MERRA-2 data to 1∘ × 1∘ spatial resolution and selected the closest output to the CALIOP overpass time only during daytime hours when aerosol retrievals obtained by passive sensors at visible wavelengths are assimilated. At first glance, the spatial patterns are very similar, particularly in areas where the presence of dust is predominant. Across the dust belt (Prospero et al., 2002), the most evident deviations (MDF underestimation by ∼0.1 or 10 %) are recorded at the borders of Afghanistan and Pakistan (Dasht-e Margo and Kharan deserts) and in the Taklamakan Desert (Fig. 2a). However, the FB (Fig. 2b) and FGE (Fig. 2c) metrics (Yu et al., 2006), which are less affected by outliers compared to the bias, are close to zero (ideal score) in most of the aforementioned regions, thus indicating a very good performance of MERRA-2. In terms of temporal covariation (Fig. 2d), moderate R values (0.5–0.6) are obtained in land areas where the presence of dust is predominant, with the exception of the western parts of Sahara where the correlation levels are slightly higher than zero. Due to the complex and highly variable nature of the emission processes and, therefore, the poorer behavior of the model, the correlation tends to be smaller over the main dust sources throughout the year (right column in Fig. S2). In downwind regions of the Northern Hemisphere, particularly over the main transport pathways (i.e., Atlantic Ocean, Mediterranean and Arabian seas, and East Asia), correlation substantially increases (up to 0.9). In addition, FB and FGE metrics reveal a good performance by MERRA-2, which, however, downgrades for increasing distances from the sources due to the weaker dust contribution to the total aerosol load. An exception is observed for the mean bias along the tropical Atlantic Ocean, where the MDF is overestimated by up to 10 % in the eastern parts, in contrast to longitudes westward of 45∘ W, where zero biases or slight underestimations (∼5 %; Caribbean Sea) are obtained.
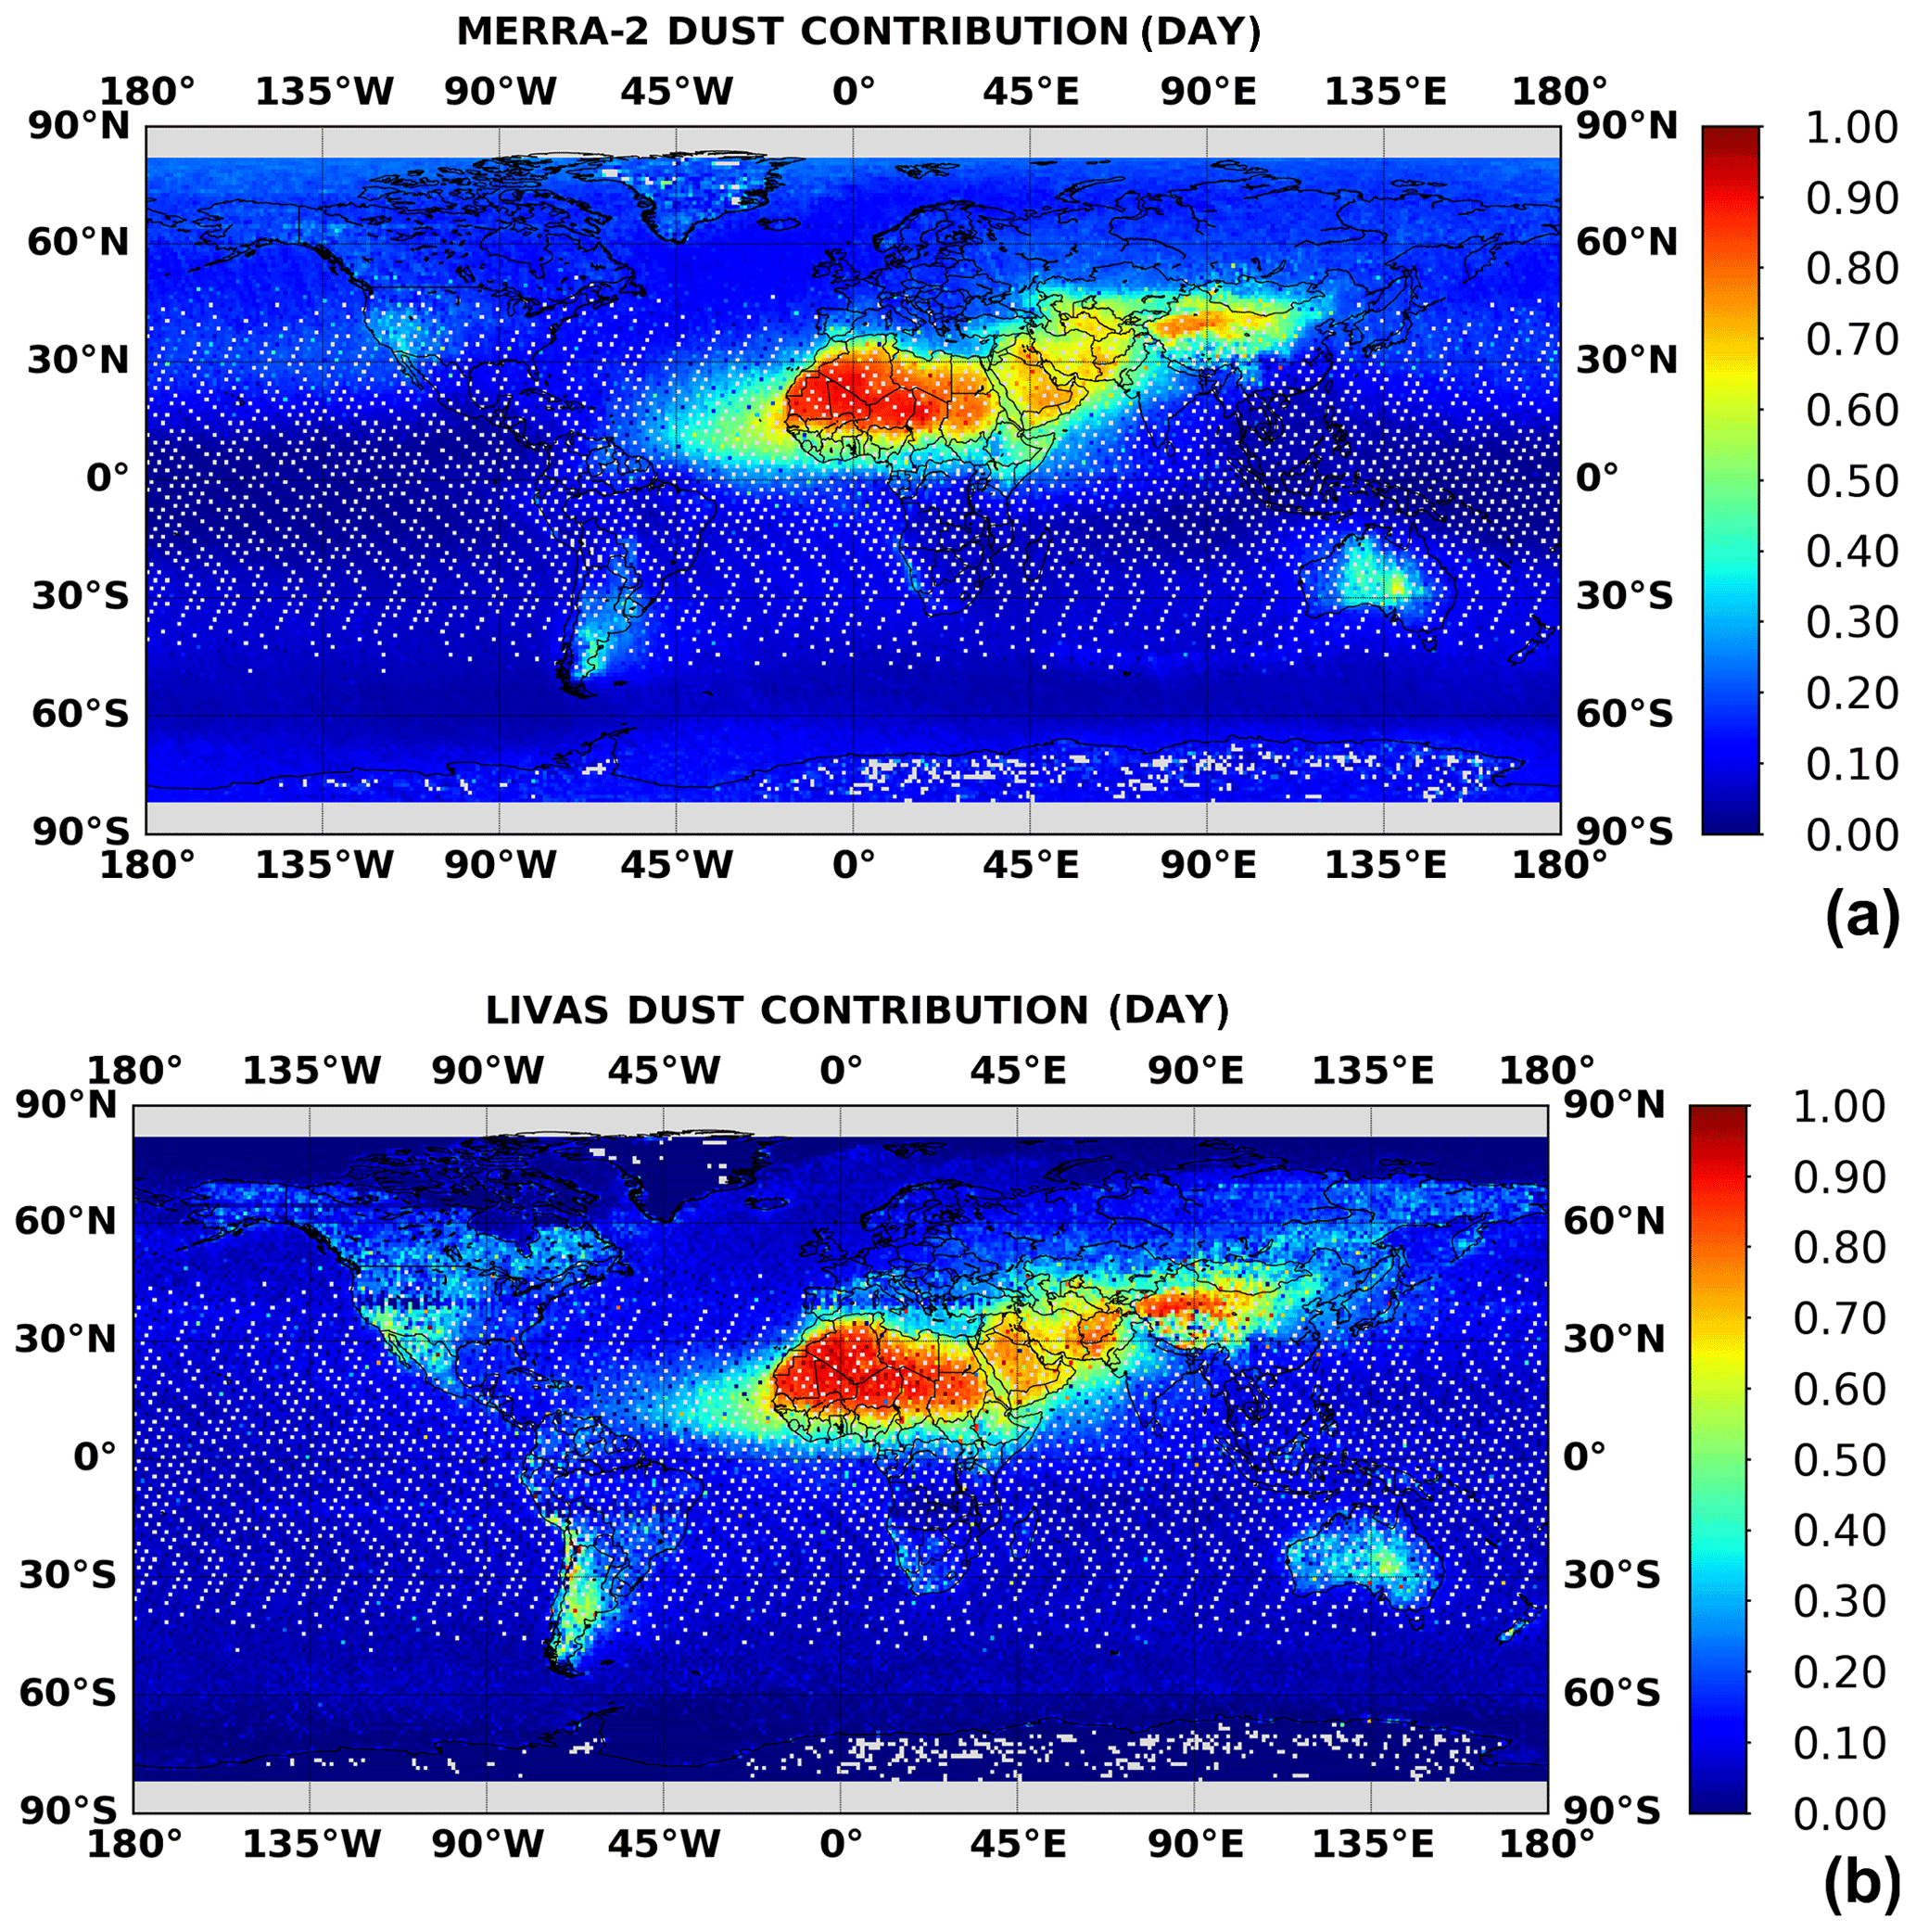
Figure 1Annual geographical distributions of dust contribution to total aerosol optical depth at 1∘ × 1∘ spatial resolution based on (a) MERRA-2 at 550 nm and (b) LIVAS at 532 nm, during daytime conditions, over the period 2007–2015.
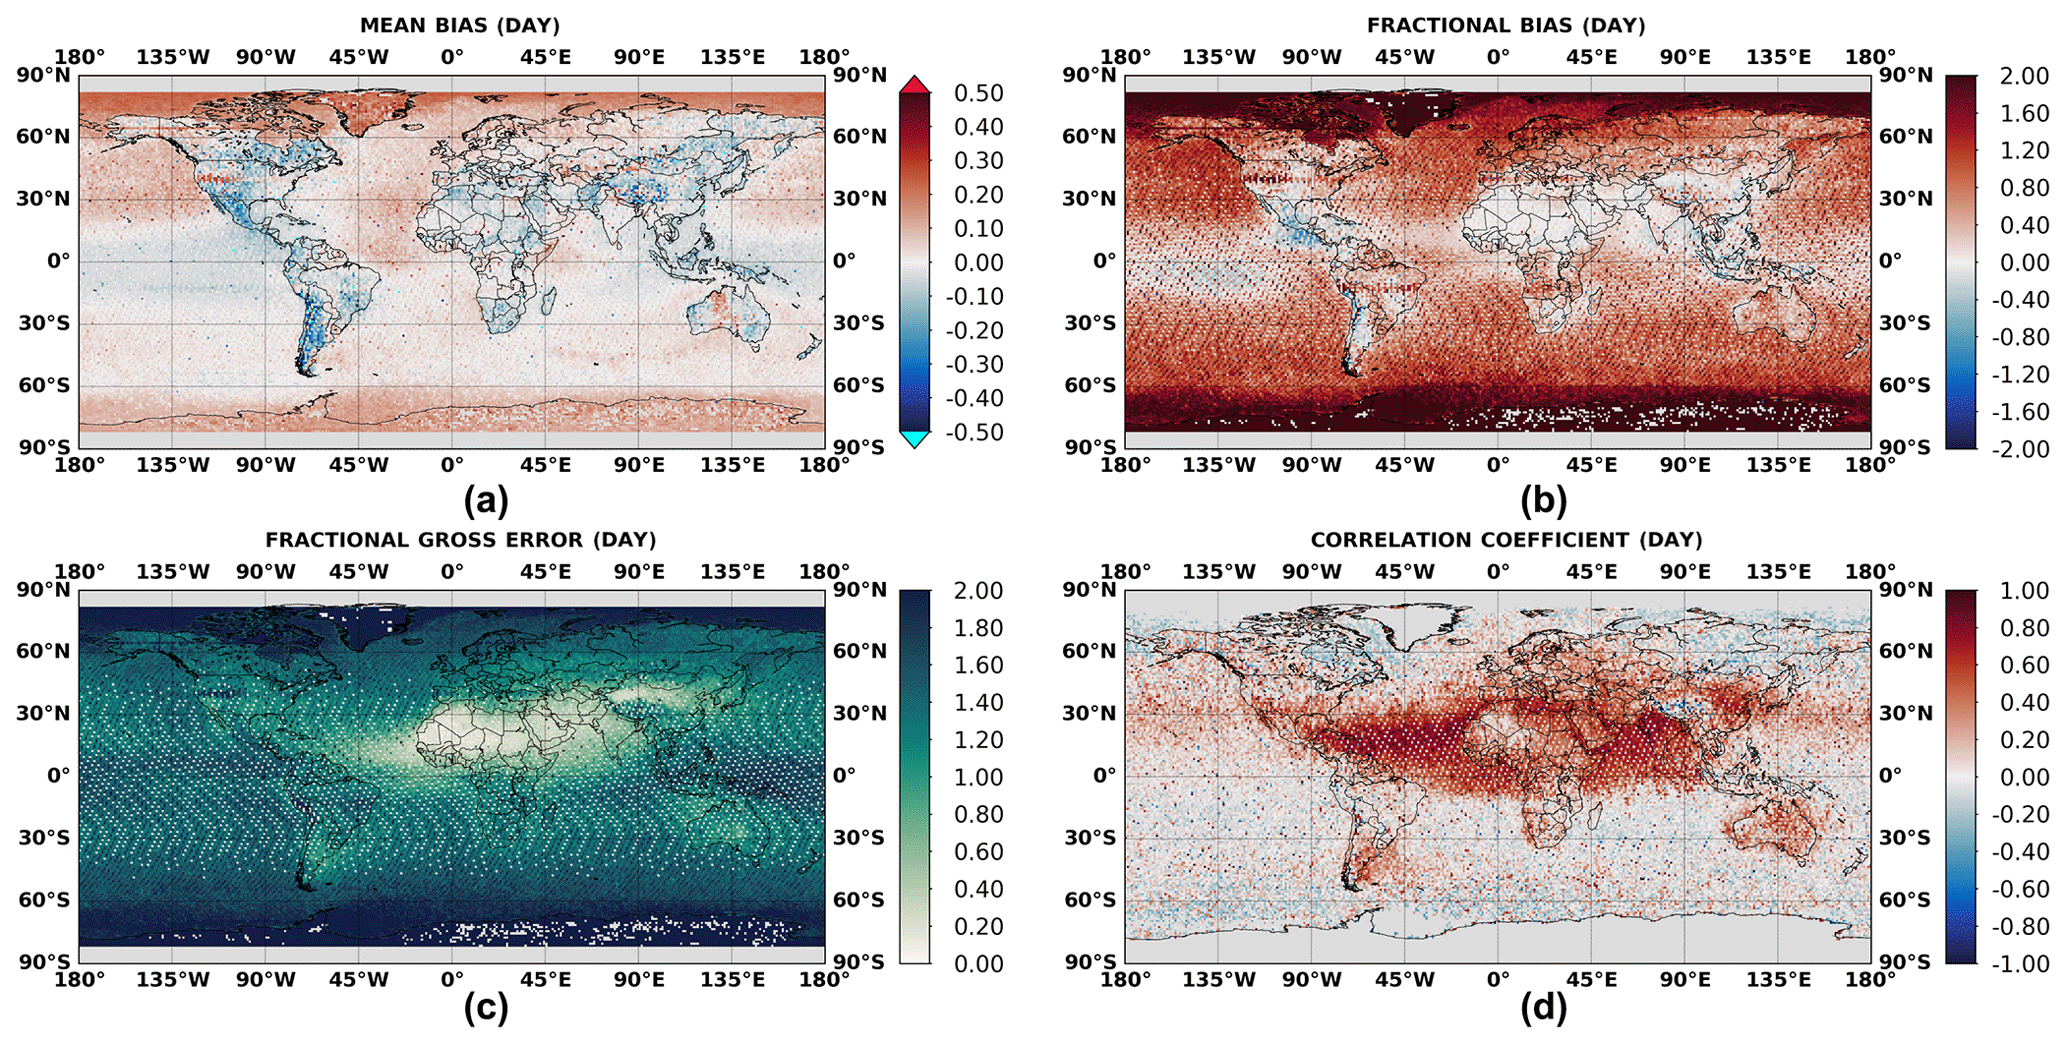
Figure 2Annual geographical distributions illustrating the assessment of MDF versus LIVAS dust fraction, during daytime conditions, at 1∘ × 1∘ spatial resolution, according to the primary skill metrics of (a) mean bias, (b) fractional bias, (c) fractional gross error, and (d) correlation coefficient representative for the period 2007–2015.
A discrepancy between the LIVAS and MERRA-2 dust portion is found in the Mojave, Sonoran, Chihuahuan desert areas extending between southwestern US and northern Mexico. As shown in Fig. 1, the dust contribution given by LIVAS in those areas is more widespread and stronger in contrast to MERRA-2, which simulates lower dust amounts over the sources (Mojave Desert) and the surrounding regions (maximized during December, January, and February, DJF, and March, April, and May, MAM; Fig. S2). According to the evaluation metrics in those areas (Fig. 2), the MDF underestimation ranges between 20 % and 50 %, negative FB (down to −1), and high FGE values (locally exceeding 1) are evident while the correlation levels are low, particularly over Mexico. In the Southern Hemisphere, the deficiency of MERRA-2 is pronounced along the western coasts of South America and in the Patagonian and Monte deserts, particularly during June, July, and August (JJA) and September, October, and November (SON; Fig. S2), with both being situated in Argentina. Similar results are found in Southern Africa, while in Australia a contrast between its western, eastern, and central parts, with slight MDF underestimations and overestimations of up to 20 % in absolute terms, respectively, is recorded (Fig. 2a). Nevertheless, the agreement between MERRA-2 and LIVAS in temporal terms is supported by the moderate-to-high R values over the hot spot regions (Fig. 2d). Outside of the main dust-affected regions, an obvious discrepancy is found in the eastern Canada and northeastern Russia, where MDF yields very low values (<20 %) in contrast to LIVAS reaching values of dust fraction up to 50 %. Due to their geographical position, the occurrence of dust loads might not be frequent there; however, their contribution to the total load can be significant under low AOD conditions, which are mainly recorded in the region. This might indicate a poor representation by MERRA-2. However, potential cloud contaminations in the lidar signals, affecting LIVAS reliability, must also be taken into account.
The obtained discrepancies are mainly driven by the partial representation of dust sources in MERRA-2, resulting in potentially underestimated dust emissions and, subsequently, lower dust contribution to the total burden. Dust is originated either from natural (arid lands, salt lakes, and glacial lakes) or from anthropogenic sources (Ginoux et al., 2012). Nevertheless, dust sources in MERRA-2 are based on Ginoux et al. (2001), accounting mostly for natural dust emission areas. This could partly explain the higher LIVAS dust contribution levels that are also evident in the seasonal distributions where the interannual variability in dust fraction is illustrated (Fig. S2). Interestingly, most of the MDF underestimations (i.e., bluish colors in Fig. 2a) are recorded in mountainous areas. Depending on the homogeneity of the atmospheric scene over regions characterized by complex topography, variations in the optical paths of subsequent CALIPSO L2 profiles considered in the LIVAS product may result in unrealistic DOD and AOD values. Previous evaluation studies (e.g., Omar et al., 2013) have shown that CALIOP underestimates AOD with respect to ground-based AERONET retrievals, particularly over desert areas (Amiridis et al., 2015), which is attributed, primarily, to the incorrect assumption of the lidar ratio (LR; Wandinger et al., 2010) and, secondarily, to the inability of the lidar to detect thin aerosol layers (particularly during daytime conditions due to the low signal-to-noise ratio). The former factor is related to aerosol type, and for Saharan dust particles, the necessary increase in LR (from 40 to 58 sr) substantially improved the level of agreement with AERONET and MODIS (Amiridis et al., 2013). Similar adjustments (increments) to the raw LR values, which are highly variable (Müller et al., 2007; Baars et al., 2016), considered in the CALIOP retrieval algorithm have been applied in the LIVAS product over other source areas of mineral particles (see Sect. 2.3; Fig. S1). An additional factor that must be taken into account is the number of MERRA-2–LIVAS pairs that are used for the metrics calculation. The corresponding global geographical distribution (Fig. S3i), calculated over the period 2007–2015, shows that in areas where the model–satellite agreement is good (Fig. 2), the number of common samples is high (>100) in contrast to regions with a low number of common samples (<50) and where the computed metrics are degraded.
In order to complete the evaluation of the MDF versus LIVAS, the dependency of the level of agreement on the spatial representativeness within the 1∘ × 1∘ LIVAS grid cell has also been investigated. Figure S3ii displays the long-term averaged geographical distribution of the number of CALIOP L2 profiles (up to 24) aggregated for the derivation of the LIVAS 1∘ × 1∘ grid cell. According to the global map, the maximum number is recorded in the latitudinal band extending from 45∘ S to 45∘ N, while the impact of extended clouds around the Equator is apparent. Outside this zone, the number of profiles used is mainly less than 14 and decreases towards the poles due to the enhanced cloudiness. The same evaluation metrics presented in Fig. 2 have also been computed at a planetary scale for individual classes of CALIOP L2 profiles (Fig. S4) aggregated for the derivation of the LIVAS 1∘ × 1∘ grid cells. Overall, about 3.4 million pairs (ALL tick named ALL in Fig. S4a) have been found over the period 2007–2015 and are almost equally distributed for bins spanning from 8 to 20, while the number of colocated data is higher in the lowermost (≤7) and uppermost (≥21) tails of the distribution. The FB (Fig. S4c), FGE (Fig. S4d), and correlation (Fig. S4e) results reveal that the consistency between MDF and LIVAS gradually improves for higher grid cell representativeness. At a global scale, MERRA-2 overestimates the dust fraction by up to 1.5 % with respect to LIVAS (Fig. S4b; ALL sample). Among the bin classes, the MDF–LIVAS differences are mostly positive and lower than ∼3 % and decrease further when at least 12 CALIOP profiles are aggregated for the derivation of the LIVAS grid cell.
4.2 Evaluation of MIDAS DOD versus AERONET
In the present section, we provide an evaluation of the MIDAS DOD against the corresponding AERONET product (Sect. 2.4). An illustration of the MODIS–AERONET colocation method (an example from aerosol optical depth without applying the criteria for DOD) is shown in Fig. S5. The obtained results at global and station level are presented in Figs. 3 and 4, respectively. As expected, the number of coincident spaceborne and ground-based DODs collected at 436 AERONET stations (red circles in Fig. 3a) is low (10 478 pairs) due to the limited amount of almucantar retrievals and the implementation of filters for the determination of DOD in AERONET data. According to the global scatterplot metrics (Fig. 3b), a very good performance of the MIDAS DOD is revealed since both data sets are well correlated (R=0.89), with MIDAS only slightly overestimating DOD compared to AERONET (0.004 or 2.7 %). Only AERONET AODs associated with α lower to or equal than 0.75 are kept for the evaluation procedure. While this threshold is higher compared to previously applied cut-off levels (e.g., Dey et al., 2004; Tafuro et al., 2006; Reid et al., 2008; Kim et al., 2011; Gkikas et al., 2016), our global scatterplot metrics are very similar when reducing α from 0.75 to 0.25 (results not shown here).
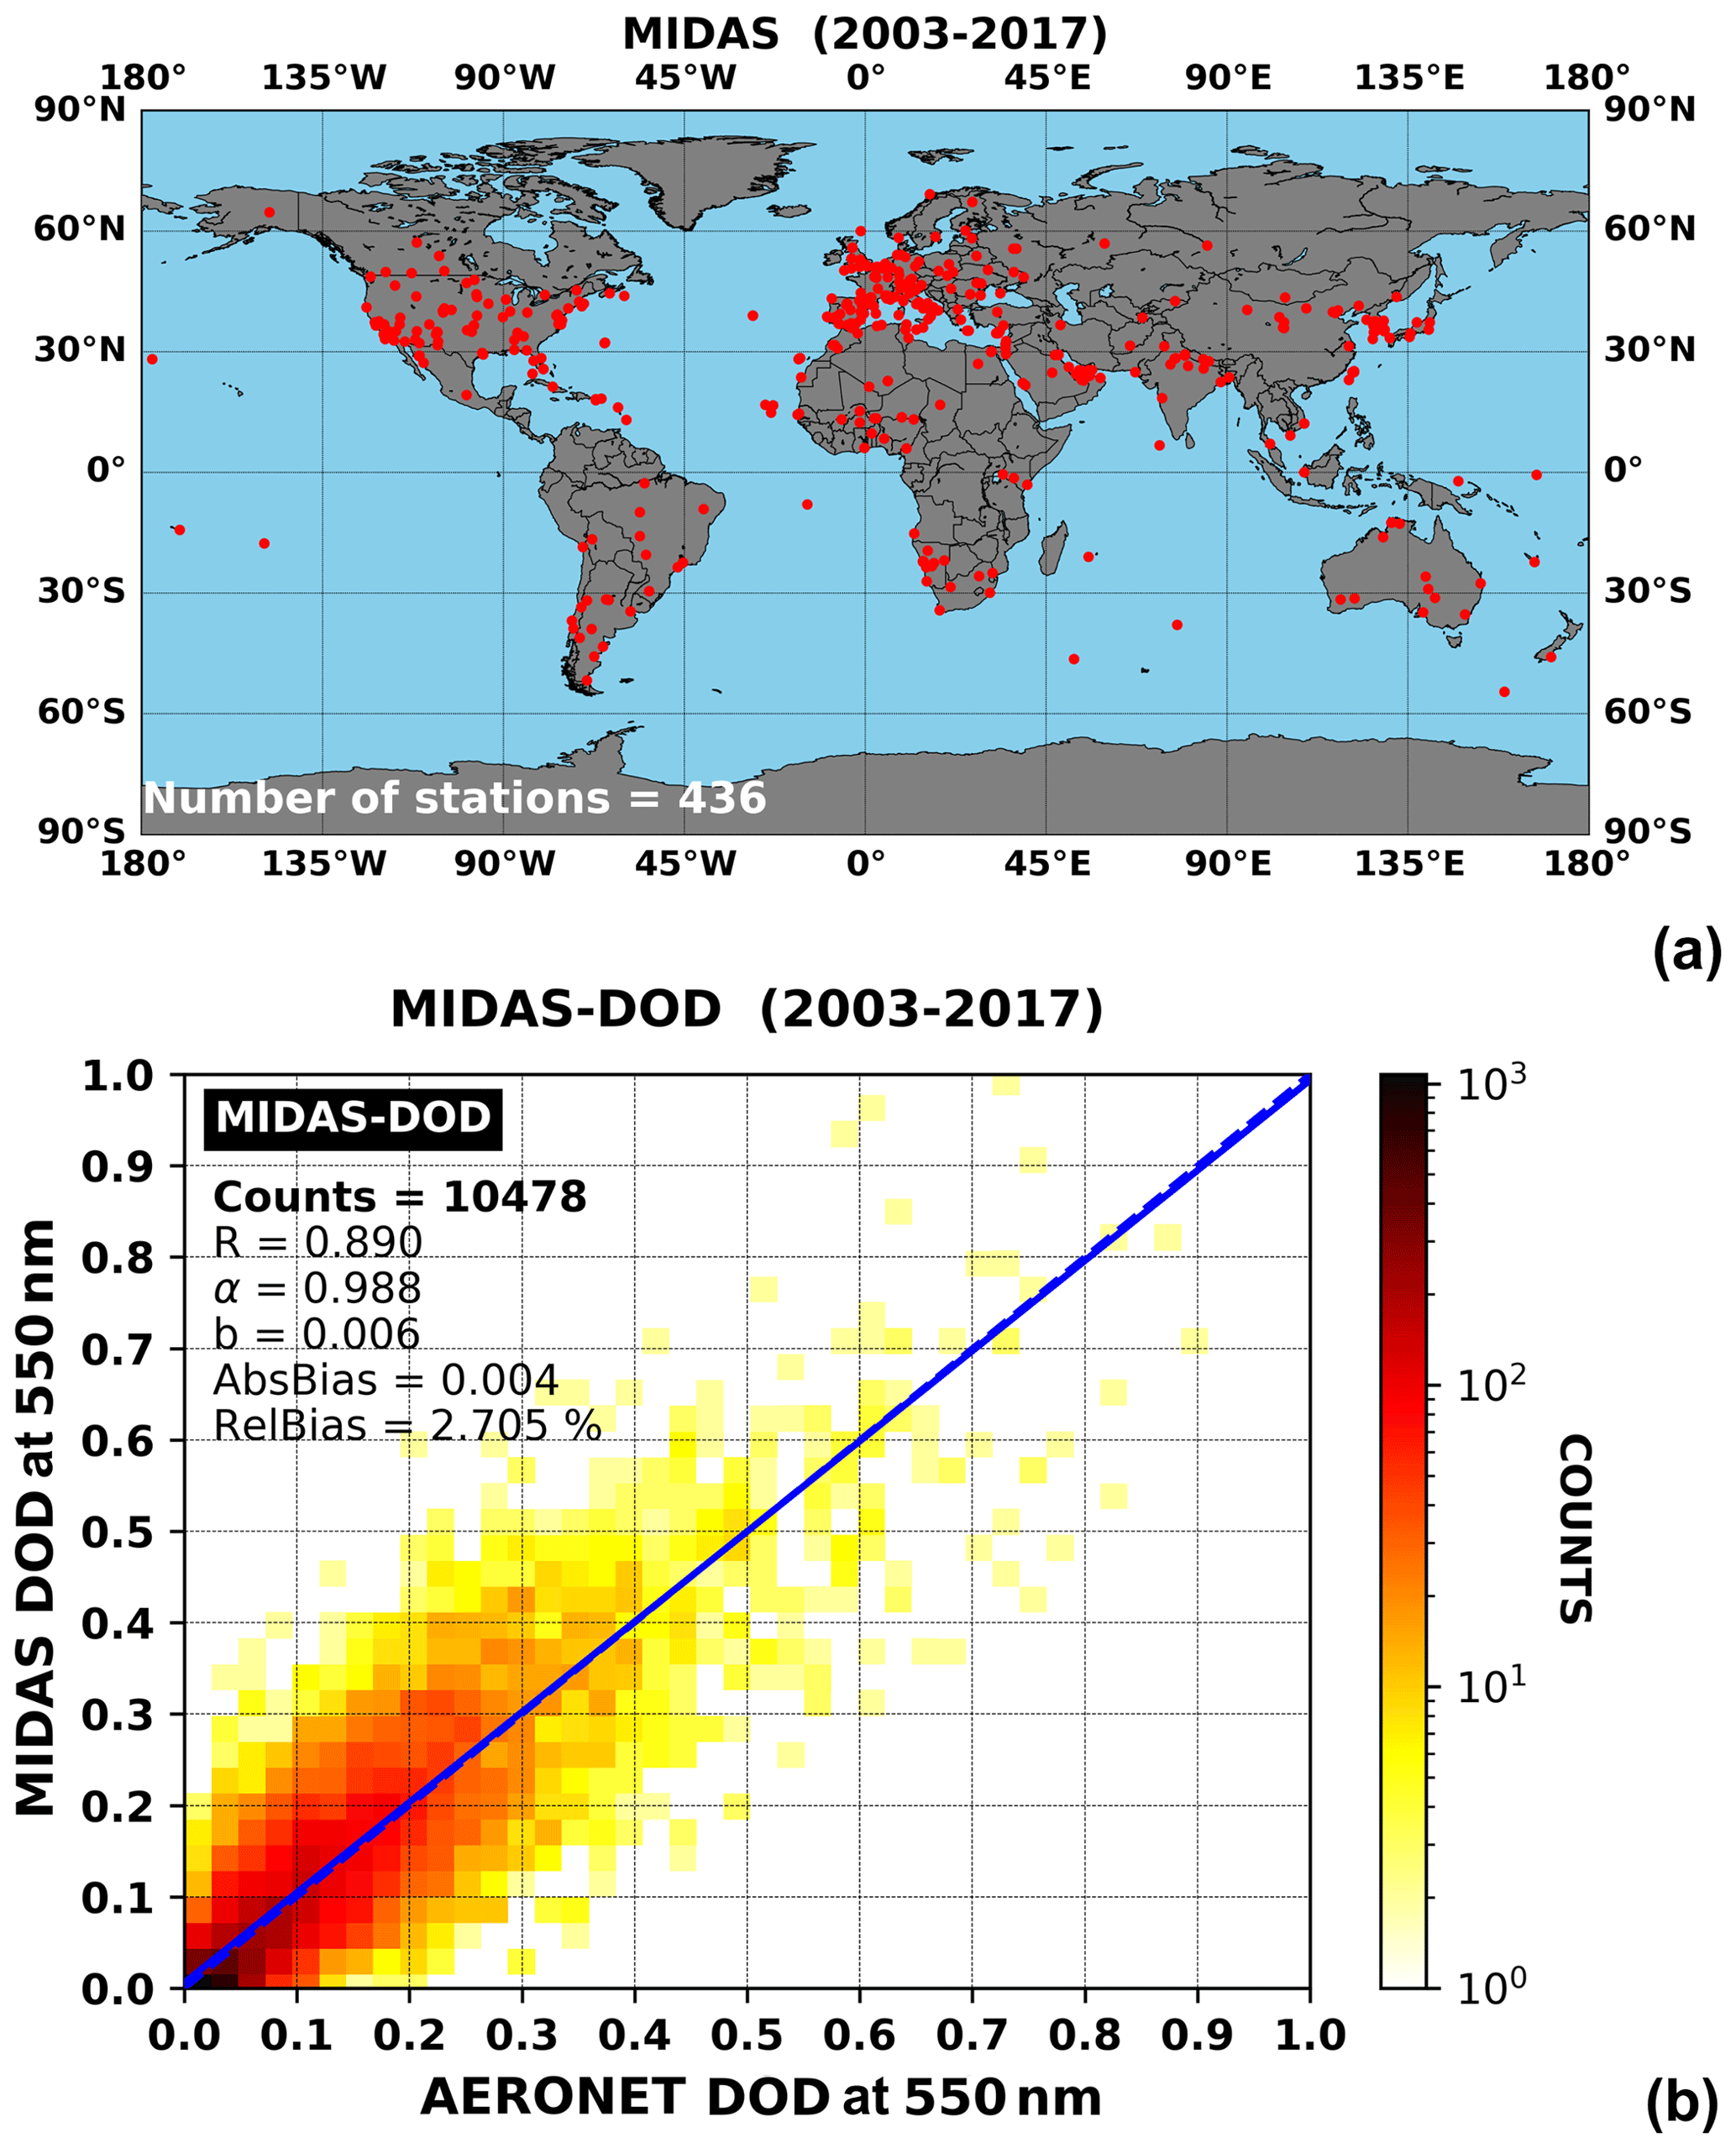
Figure 3(a) AERONET sites where at least one pair of ground-based and spaceborne retrievals has been recorded according to the defined colocation criteria during the period 2003–2017. (b) Density scatterplot between MIDAS (y axis) and AERONET (x axis) dust optical depth at 550 nm. The solid and dashed lines stand for the linear regression fit and equal line (y=x), respectively.

Figure 4Scatterplot metrics between MIDAS and AERONET DOD550 nm, at station level, during the period 2003–2017. (a) Number of concurrent MIDAS–AERONET observations, (b) correlation coefficient, (c) root mean square error, and (d) bias defined as spaceborne minus ground-based retrievals. The obtained scores are presented only for sites with at least 30 MIDAS–AERONET matchups.
The evaluation analysis was also performed for each station individually. Figure 4 only depicts sites with at least 30 coincident MIDAS–AERONET observations, thus making meaningful the comparison at station level. This criterion is satisfied in 86 stations, which comprise 77 % (or 8095) of the total population of coincident DODs overall and are mostly located over dust sources and in areas affected by dust transport. Figure 4a shows the station-by-station variability in the number of common MIDAS–AERONET observations ranging from 100 to 457 (Banizoumbou, Niger) across North Africa and the Middle East, whereas in the remaining sites it is mainly lower than 70. Between the two data sets, very high R values (up to 0.98) are found in North Africa, the Middle East, outflow regions (Cabo Verde, Canary Islands, and the Mediterranean) and at distant areas (Caribbean Sea) affected by long-range transport. Across the Sahel, maximum root mean square error (RMSE) levels (up to 0.26) are recorded (Fig. 4c) due to the intense loads and strong variability in the Saharan dust plumes. Regarding biases, positive deviations of up to 0.08 are computed in most AERONET sites in the area, while the largest negative offsets (down to −0.14) are recorded at the stations of Ilorin and Djougou (near to the coasts of the Gulf of Guinea), in agreement with Wei et al. (2019b). Several reasons may explain the obtained MIDAS–AERONET differences over the abovementioned stations, taking into account that the MDF is generally well reproduced. The first one is related to the MODIS retrieval algorithm itself and, more specifically, to the applied aerosol models, surface reflectance, and cloud-screening procedures (Sayer et al., 2013). The second factor is the omission of fine DOD in AERONET data, which would likely reduce the positive biases. However, its contribution to the total dust AOD is difficult and probably impossible to be accurately quantified. Similar tendencies are found for RMSE and bias in the Middle East, where the satellite and ground-based DODs are well correlated in general. In the Mediterranean, the temporal covariation between the two data sets is quite consistent (R>0.8), with the MIDAS DOD being slightly underestimated probably due to the MDF underestimation (mainly recorded in JJA; Fig. S2).
In Asia, few stations are available with sufficient number of MIDAS–AERONET matchups in which the slight positive and the negative DOD biases (Fig. 4d) are generally consistent with those of AOD (results not shown here). This indicates that the MODIS AOD offsets are transferred to MIDAS DOD, which is also affected by the MDF underestimation (Fig. 2a). In the southwestern United States, the evaluation scores at 12 AERONET sites show a moderate performance of the derived DOD (R – 0.28–0.94; bias – −0.034–0.003; RMSE – 0.02–0.04) attributed to the inability of MERRA-2 to adequately reproduce the contribution of dust particles to the total aerosol load in optical terms. Finally, our assessment analysis in the Southern Hemisphere for stations located in Argentina, Namibia, and Australia reveals MIDAS–AERONET deviations, spanning from −0.03 (Cordoba-CETT) to 0.02 (Gobabeb), and correlations, ranging from 0.14 (Fowlers_Gap) to 0.96 (Canberra).
4.3 Intercomparison of MIDAS, MERRA-2, and LIVAS DOD products
Following the evaluation of MIDAS DOD against AERONET, the MIDAS, MERRA-2, and LIVAS DOD products are investigated in parallel. For this purpose, the MERRA-2 and MIDAS data have been regridded to 1∘ × 1∘ grid cells between 2007 and 2015 to match the spatial resolution and availability of LIVAS. Then, the three data sets have been colocated spatially and temporarily. The intercomparison has been performed only during daytime conditions, and the obtained findings are presented through geographical distributions (Sect. 4.3.1) and averaged monthly time series of regional, hemispherical, and planetary averages (Sect. 4.3.2). Finally, it must be clarified that our focus in this part of the analysis is on the intercomparison among the DOD products and not on interpreting their spatiotemporal features. The latter will be discussed thoroughly in a companion paper analyzing the MIDAS fine-resolution DOD data set.
4.3.1 Geographical distributions
The annual geographical distributions of LIVAS, MERRA-2, and MIDAS DODs are depicted in Fig. 5a, b, and c, respectively, while the corresponding global seasonal maps are provided in Fig. S6. Among the three data sets, both for annual and seasonal geographical distributions, it is apparent that there is a very good agreement in spatial terms, in contrast to the magnitude of the simulated (MERRA-2) and retrieved (MIDAS and LIVAS) DODs. The most evident differences in MERRA-2 (Fig. 5b) and MIDAS (Fig. 5c), with respect to LIVAS (Fig. 5a), are encountered across North Africa, forming clear patterns with positive and negative deviations over the Sahara and the Sahel, respectively. In particular, MERRA-2 DOD positive offsets mostly range from 0.04 to 0.20, while those of MIDAS–LIVAS are lower, placing our DOD product between active remote sensing retrievals and reanalysis data set. Previous studies relying on satellite (Yu et al., 2010; Kittaka et al., 2011; Ma et al., 2013) and ground-based (Schuster et al., 2012; Omar et al., 2013) observations have reported that CALIOP underestimates AOD over the Sahara. Konsta et al. (2018), who utilized higher and more realistic dust lidar ratio (55 sr; adopted also for the region in the current study) compared to the aforementioned works (40 sr), reported similar tendencies in lower magnitude against MODIS. Therefore, additional factors might contribute to the lower lidar-derived DODs over the arid regions in North Africa. For example, it has been observed that CALIOP can misclassify very intense dust layers as clouds, which, on the other hand, can attenuate the emitted laser beam significantly or totally (Yu et al., 2010; Konsta et al., 2018). All these aspects, most likely met over dust sources, act towards reducing DOD (resulting from the vertical integration of the extinction coefficient profiles) and might explain the missing hot spot by LIVAS in and around the Bodélé Depression in contrast to single-view, multi-angle, and geostationary passive satellite sensors (e.g., Banks and Bridley, 2013; Wei et al., 2019a). Across the Sahel, LIVAS provides higher DODs (mainly up to 0.2) against both simulated and satellite products. These differences might be attributed to the misrepresentation of dust sources in MERRA-2 along this zone where vegetation cover has a prominent seasonal cycle (Kergoat et al., 2017). An inaccurate representation of vegetation also impacts the surface reflectance, which, in turn, can introduce critical errors in the MODIS retrieval algorithm. Wei et al. (2019b) showed that MODIS underestimates AOD with respect to AERONET in that region, which is in agreement with the fact that the maximum MIDAS–AERONET negative DOD differences are found at Ilorin and Djougou sites (Fig. 4d).
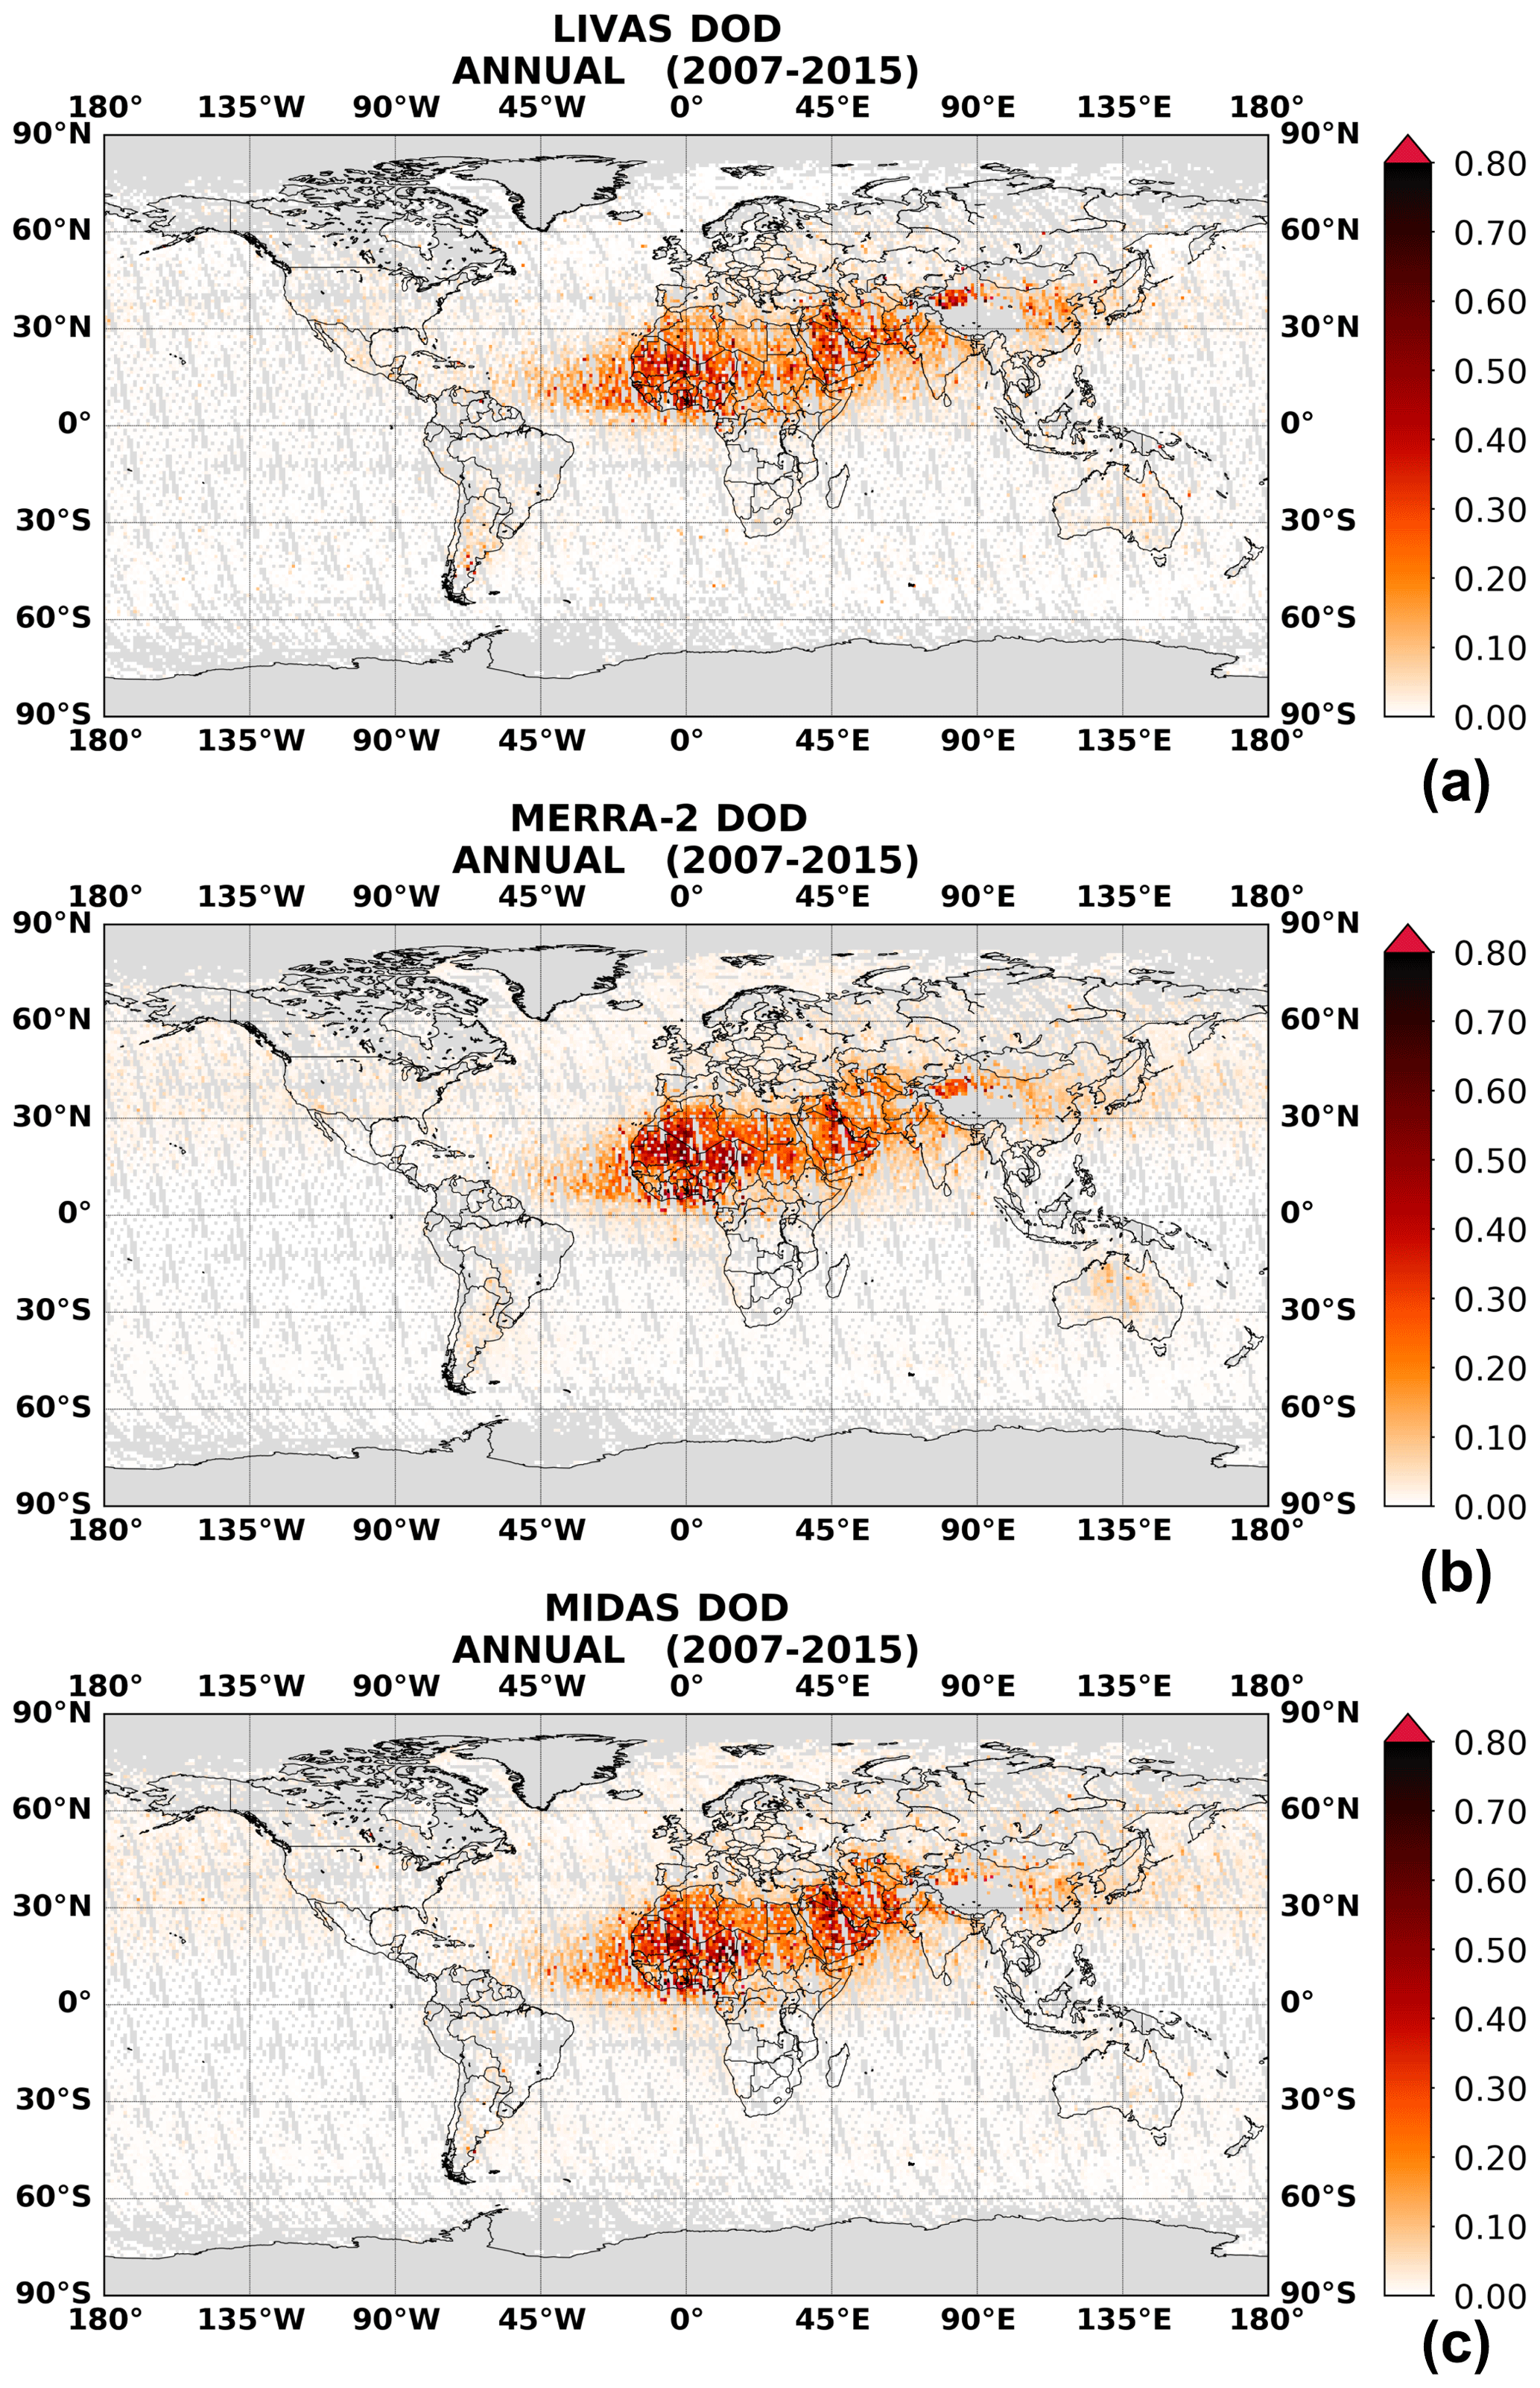
Figure 5Long-term (2007–2015) average geographical colocated distributions at 1∘ × 1∘ spatial resolution during daytime for (a) LIVAS DOD532 nm, (b) MERRA-2 DOD550 nm, and (c) MIDAS DOD550 nm.
Over the eastern tropical Atlantic Ocean, the difference between LIVAS and MIDAS is negligible, whereas MERRA-2 gives lower DODs by up to 0.08. In the Middle East, MERRA-2 and MIDAS DODs are higher than in LIVAS over the Tigris–Euphrates basin, while an opposite tendency for MERRA-2 is found in the interior parts of Saudi Arabia. Lower DODs are also given by LIVAS over the arid and semi-arid regions eastwards of the Caspian Sea, including also the Aral Sea. This area of the planet is one of the most challenging for spaceborne passive observations due to the terrain complexity prohibiting the accurate characterization of the surface reflectance and type, resulting in unrealistically high MODIS AODs (Klingmüller et al., 2016; see the interactive comment posted by Andrew Sayer) that may also affect MERRA-2 via assimilation. The largest negative MIDAS–LIVAS differences (exceeding 0.2) worldwide are recorded in the Taklamakan Desert, whereas the corresponding results between MERRA-2 and LIVAS are somewhat lower. This might be attributed to an inappropriate selection (overestimation) of the lidar ratio, taking into account that over the region CALIOP mainly underestimates AOD, dust contribution to the total AOD exceeds 70 % (Proestakis et al., 2018) throughout the year and MDF shows robust consistency (Fig. 2). Eastwards of the Asian continent, the situation is reversed, and the LIVAS DODs are lower by up to 0.2 when compared to MERRA-2 and MIDAS, indicating a weaker trans-Pacific transport, predominant during the boreal spring (second row in Fig. S6), being in agreement with the findings of Yu et al. (2010) and Ma et al. (2013). In the Southern Hemisphere, negative MERRA-2–LIVAS and MIDAS–LIVAS differences are computed in Patagonia, attributed to the underperformance of MDF, which are not, however, spatially coherent. On the contrary, in the desert areas of the inland parts of Australia, there is a clear signal of positive MERRA-2–LIVAS deviations, not seen between MIDAS and LIVAS, most likely attributed to the overestimation of aerosol (dust) optical depth by MERRA-2, as recently presented by Mukkavilli et al. (2019). For a global and long-term perspective, based on ∼440 000 colocated data, MERRA-2 agrees slightly better with LIVAS than MIDAS as revealed by the correlation (R=0.74 vs. 0.71) and bias (8.2 % vs. 13.3 %) metrics.
4.3.2 Planetary, hemispherical, and regional intra-annual variability
We compared the monthly variability of the planetary (Fig. 6a) and hemispherical (Fig. 6b, c) averages of LIVAS (black curve), MERRA-2 (red curve), and MIDAS (blue curve) DODs. We note that, for each considered timescale, the averaging has been made following the upper branch shown in Fig. 5 of Levy et al. (2009), where each grid cell is first temporally averaged, and the resulting field is spatially averaged. In the Northern Hemisphere, the annual cycle of DOD is reproduced by the three data sets with maximum levels in June (0.118 for LIVAS–MERRA-2 and ∼0.126 for MIDAS) and minimum ones in November–December (0.034–0.040). Nevertheless, the most evident deviations in terms of magnitude are recorded during the high-dust seasons, with MIDAS giving slightly higher DODs than MERRA-2 and even higher than LIVAS, particularly during the boreal spring. On an annual basis (Table 1), the averaged MERRA-2 and MIDAS DODs for the Northern Hemisphere are equal to 0.056 and 0.060, respectively, and higher than the LIVAS climatological value (0.051). In the Southern Hemisphere (Fig. 6c), DODs range at very low levels (up to ∼0.011), attributed to the low amounts of mineral particles emitted from spatially restricted desert areas and the limited dust transport over oceanic regions. Despite the low annual levels (0.008; Table 1) there is an intra-annual cycle pattern not entirely commonly reproduced by the three data sets. In particular, MIDAS and MERRA-2 DODs are maximized in February, while the highest levels for LIVAS are recorded in September. For all DOD products, the minimum values are found in May, which are slightly lower than those observed during April–July (austral winter). At a global scale (Fig. 6a), the seasonal patterns of DODs are mainly driven by those of the Northern Hemisphere, particularly for LIVAS, and to a lesser degree for MIDAS and MERRA-2. More specifically, there are two peaks (∼0.055; March and June) for MIDAS and flat maximum levels (∼0.05) between March and June for MERRA-2, while there is a primary (∼0.05) and a secondary (∼0.04) maximum in June and March, respectively, in LIVAS. Even though there are month-by-month differences, the LIVAS (0.029), MERRA-2 (0.031), and MIDAS (0.033) global annual DODs are relatively close, indicating a sufficient level of agreement among the three data sets (Table 1). The obtained value for MIDAS is 10 % higher and within the uncertainty estimate of the global DOD average (0.030 ± 0.005) reported by Ridley et al. (2016).
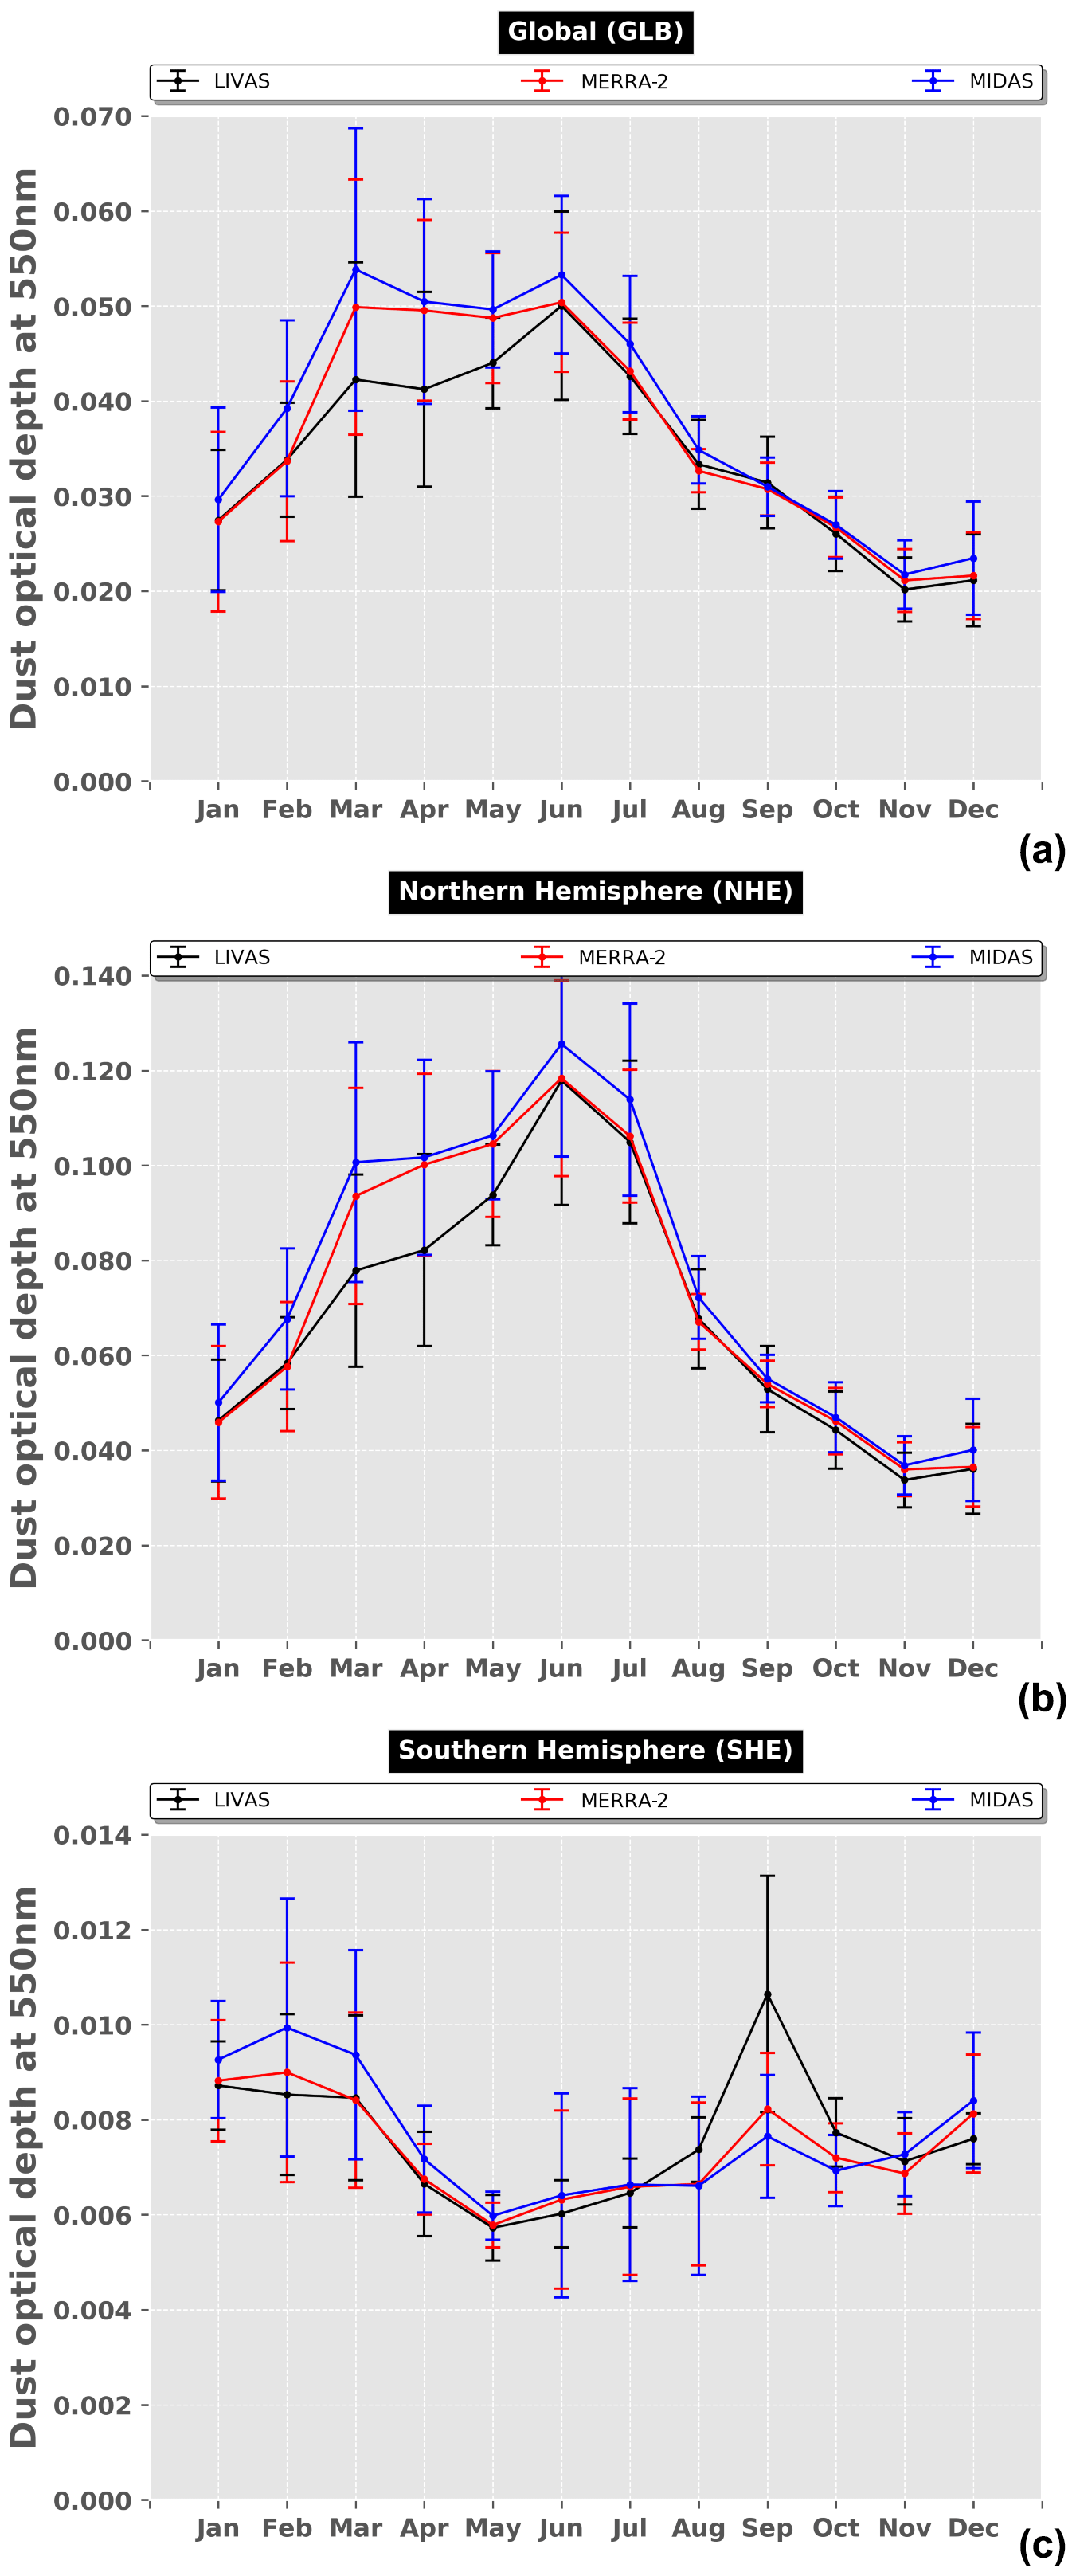
Figure 6Monthly variability in LIVAS (black curve), MERRA-2 (red curve), and MIDAS (blue curve) DODs, regionally averaged over (a) the whole globe (GLB), (b) the Northern Hemisphere (NHE), and (c) the Southern Hemisphere (SHE). The error bars correspond to the monthly interannual standard deviation computed during the period 2007–2015.
Table 1Planetary (GLB), hemispherical (NHE and SHE), and regional DOD averages representative for the period 2007–2015, based on colocated LIVAS, MERRA-2, and MIDAS 1∘ × 1∘ data. Within the parentheses, the minimum and maximum annual values are given. The regional averages have been calculated following the upper branch (first temporal averaging and then spatial averaging) in Fig. 5 of Levy et al. (2009). The full names of the acronyms for each subregion are given in the caption of Fig. 7.

The consistency among the three DOD data sets, in terms of magnitude and temporal covariation, is highly dependent on the region of interest. Figure 7 shows the defined subdomains considered in this study, Fig. S7 depicts the corresponding intra-annual DOD time series, while Table 1 lists the computed annual averages and their minimum or maximum values between 2007 and 2015. The best agreement among MIDAS, LIVAS, and MERRA-2 is found along the tropical Atlantic Ocean. In the nearby outflow regions (i.e., ETA), considerably high DODs (>0.1) are found between January–August, with a maximum in June, as indicated by the three data sets, with slight underestimations in MERRA-2 (Fig. S7k). Over the western tropical Atlantic Ocean, the sharp increase in DOD from May to June indicates the arrival of considerable amounts of Saharan particles, which are sustained at high levels in summer and diminish during autumn and winter (Fig. S7q). This seasonal fluctuation is almost identically reproduced by the three products. Nevertheless, when the dust activity is well established in the area (i.e., boreal summer), LIVAS shows higher values than MERRA-2 and MIDAS.

Figure 7Regional domains of the east tropical Atlantic (ETA), west tropical Atlantic (WTA), Mediterranean (MED), Gulf of Guinea (GOG), western Sahara (WSA), sub-Sahel (SSA), Bodélé Depression (BOD), northern Middle East (NME), southern Middle East (SME), central Asia (CAS), Thar Desert (THA), Taklamakan Desert (TAK), Gobi Desert (GOB), East Asia (EAS), western North Pacific (WNP), eastern North Pacific (ENP), and southwestern United States (SUS).
Across North Africa, and particularly in the Bodélé (Fig. S7a) and western Sahara (Fig. S7h), the LIVAS DODs are substantially lower when compared to MIDAS and MERRA-2. In the Bodélé, this is evident for the entire year, and in western Sahara it can be clearly seen between March and June. Similar findings are drawn, either for other source areas, such as central Asia (Fig. S7c), or outflow regions, such as the Mediterranean (Fig. S7m). In southwestern United States (SUS; Fig. S7e), the seasonal variation in DODs is in a very good agreement between MERRA-2 and MIDAS, but a positive offset is seen for the reanalysis data. On the contrary, LIVAS does not reproduce the secondary maximum in July, while it gives very high DODs in November–December, which are not reliable. Over the Taklamakan (Fig. S7f), the LIVAS DODs are higher than the corresponding MIDAS and MERRA-2 regional averages in the high-dust months (i.e., April–May) and in July. On the contrary, in the Gobi Desert, residing eastwards, the LIVAS–MIDAS agreement is very good, while MERRA-2 DODs are less variable, within the course of the year with respect to the observed values (Fig. S7b). Among the three DOD products, a very good temporal agreement is found in the Thar Desert (Fig. S7g), but there are deviations regarding the peak of July, which is higher in LIVAS (0.88) than in MIDAS (0.75) and MERRA-2 (0.48), respectively. Over downwind continental areas of East Asia (Fig. S7i), only a few exceptions break down the consistency between MIDAS and LIVAS, whereas MERRA-2 is able to reproduce the annual cycle, but underestimates the intensity of dust loads. In the southern Middle East (Fig. S7n), the reanalysis and the spaceborne lidar DODs are very well correlated within the course of the year and lower than MIDAS during February–May. In the northern parts (Fig. S7d), MIDAS gives substantially higher DODs against the well-correlated and matched values of LIVAS and MERRA-2. Over the Northern Pacific, Asian dust is transported eastwards during spring, affecting nearby (Fig. S7p) and distant (Fig. S7j) oceanic areas. The signal of this mechanism is clearly evident in MIDAS and MERRA-2 time series, in contrast to LIVAS, which exhibits substantially lower DOD maxima. Moreover, these maxima appear in the western North Pacific Ocean earlier (March) with respect to the other two data sets (April). Based on MERRA-2 and MIDAS in the sub-Sahel (Fig. S7o), a primary maximum and a secondary maximum are recorded in March and October, in agreement with ground-based visibility records (N'Tchayi Mbourou et al., 1997). LIVAS reproduces both peaks but with a weaker intensity in March compared to MIDAS and MERRA-2. However, throughout the year, the maximum LIVAS DOD is observed in June (a local maximum is also recorded in MIDAS), which might be attributed to the strong convection activity favoring the occurrence of haboobs. Saharan dust aerosols, under the impact of the northeasterly harmattan winds, are carried over the Gulf of Guinea (Fig. S7l) during the boreal winter, although DODs among the three data sets reveal a noticeable variability in terms of intensity.
4.4 MIDAS DOD global climatology
The annual and seasonal DOD patterns, representative for the period 2003–2017, are illustrated in Figs. 8 and 9, respectively. Among the desert areas of the planet, the most intense dust loads (DODs up to ∼1.2; Fig. 8a) are observed in the Bodélé Depression located in the northern Lake Chad basin (Washington et al., 2003). Over the region, these high DODs are sustained throughout the year (Fig. 9), while, due to the prevailing meteorological conditions, during MAM (Fig. 9b) and JJA (Fig. 9c), mineral particles are transported westwards, along the Sahel, contributing to the locally emitted anthropogenic dust (Ginoux et al., 2012). Substantial high climatological DODs (up to 0.6; Fig. 8a) are recorded in the western sector of Sahara, in contrast to the eastern parts, and are attributed to the accumulation of dust aerosols, primarily in JJA (Fig. 9c) and secondarily in MAM (Fig. 9b), under the impact of the Saharan heat low (Schepanski et al., 2017). Saharan dust is subjected to short-range transport, frequently affecting the nearby maritime areas of the Gulf of Guinea (Ben-Ami et al., 2009), the Mediterranean Sea (Gkikas et al., 2015), and the Red Sea (Banks et al., 2017). Nevertheless, the strongest signal of Saharan dust transport appears over the tropical Atlantic Ocean, with massive loads of mineral particles confined within the Saharan air layer (SAL; Kanitz et al., 2014), reaching the Caribbean Sea (Prospero, 1999), under the impact of the trade winds. The characteristics of the trans-Atlantic dust transport reveal a remarkable intra-annual variation (Fig. 9) as it concerns the plumes' latitudinal position, longitudinal extension, and intensity, which is at maximum levels during the boreal summer (Fig. 9c).
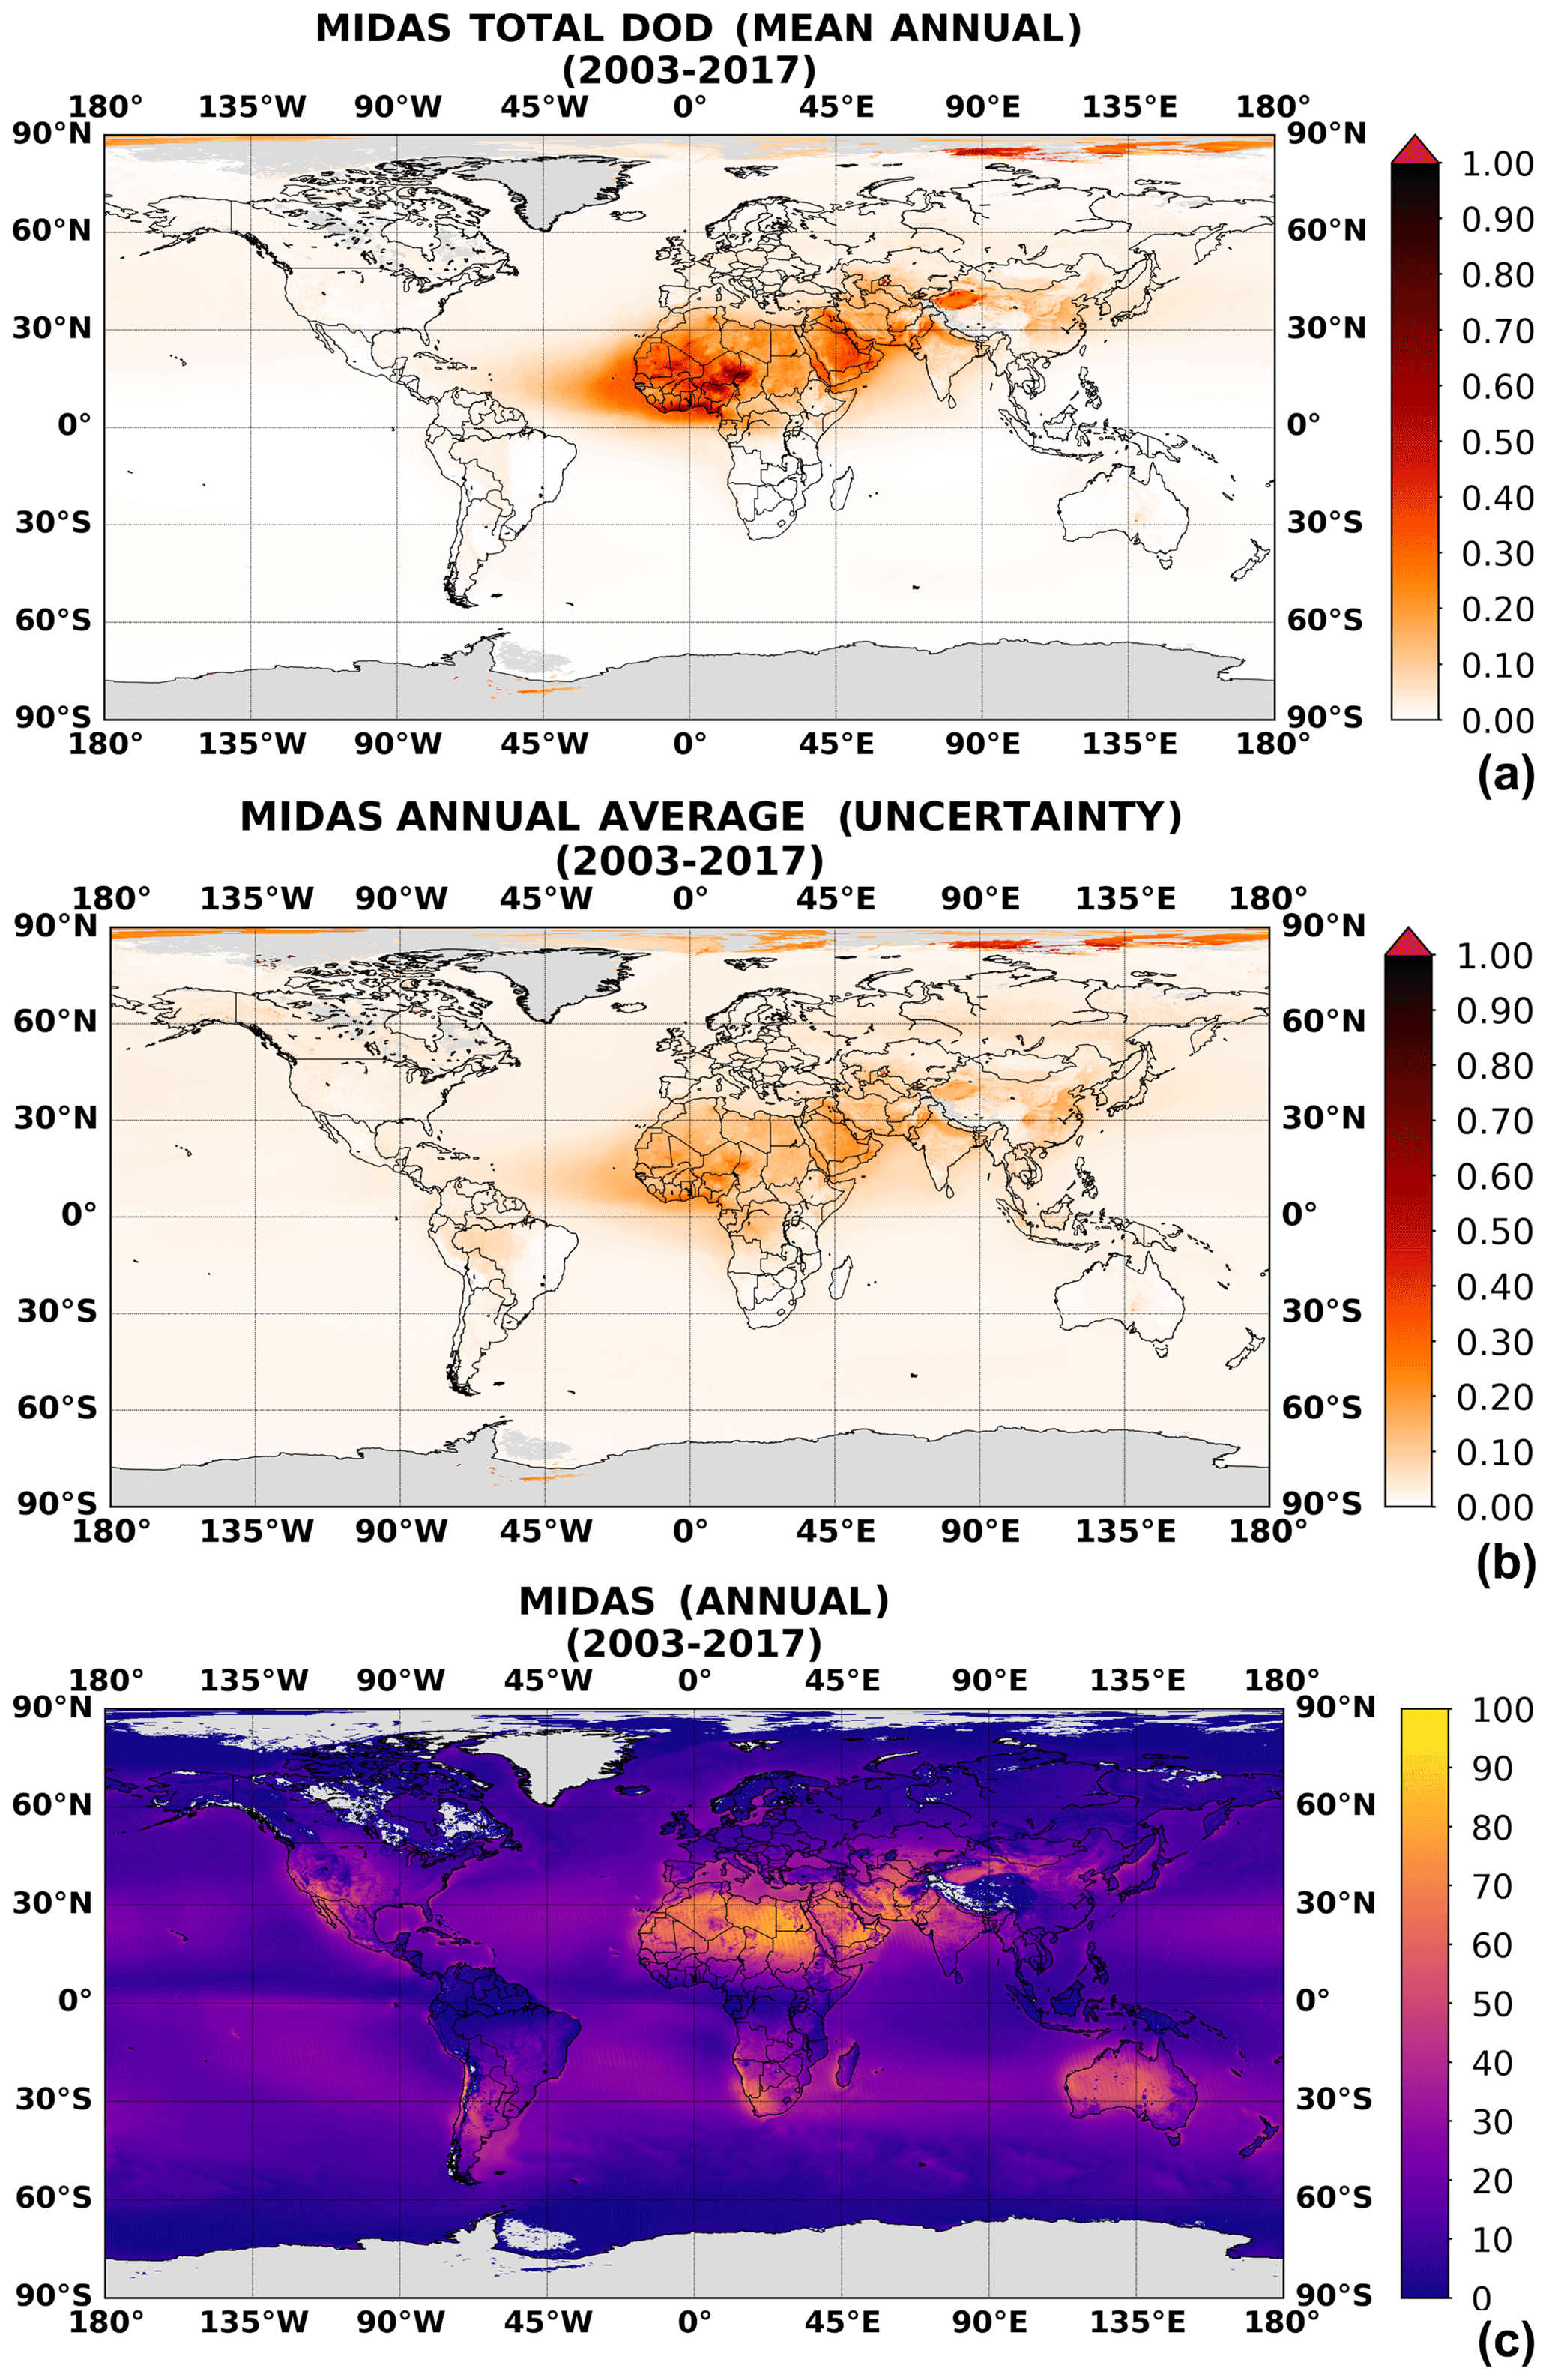
Figure 8Annual geographical distributions, at 0.1∘ × 0.1∘ spatial resolution, of (a) the climatological DODs, (b) the average of the daily DOD uncertainties, and (c) the percentage availability of MIDAS data with respect to the entire study period spanning from 1 January 2003 to 31 December 2017. Gray coloring represents areas with an absence of data.
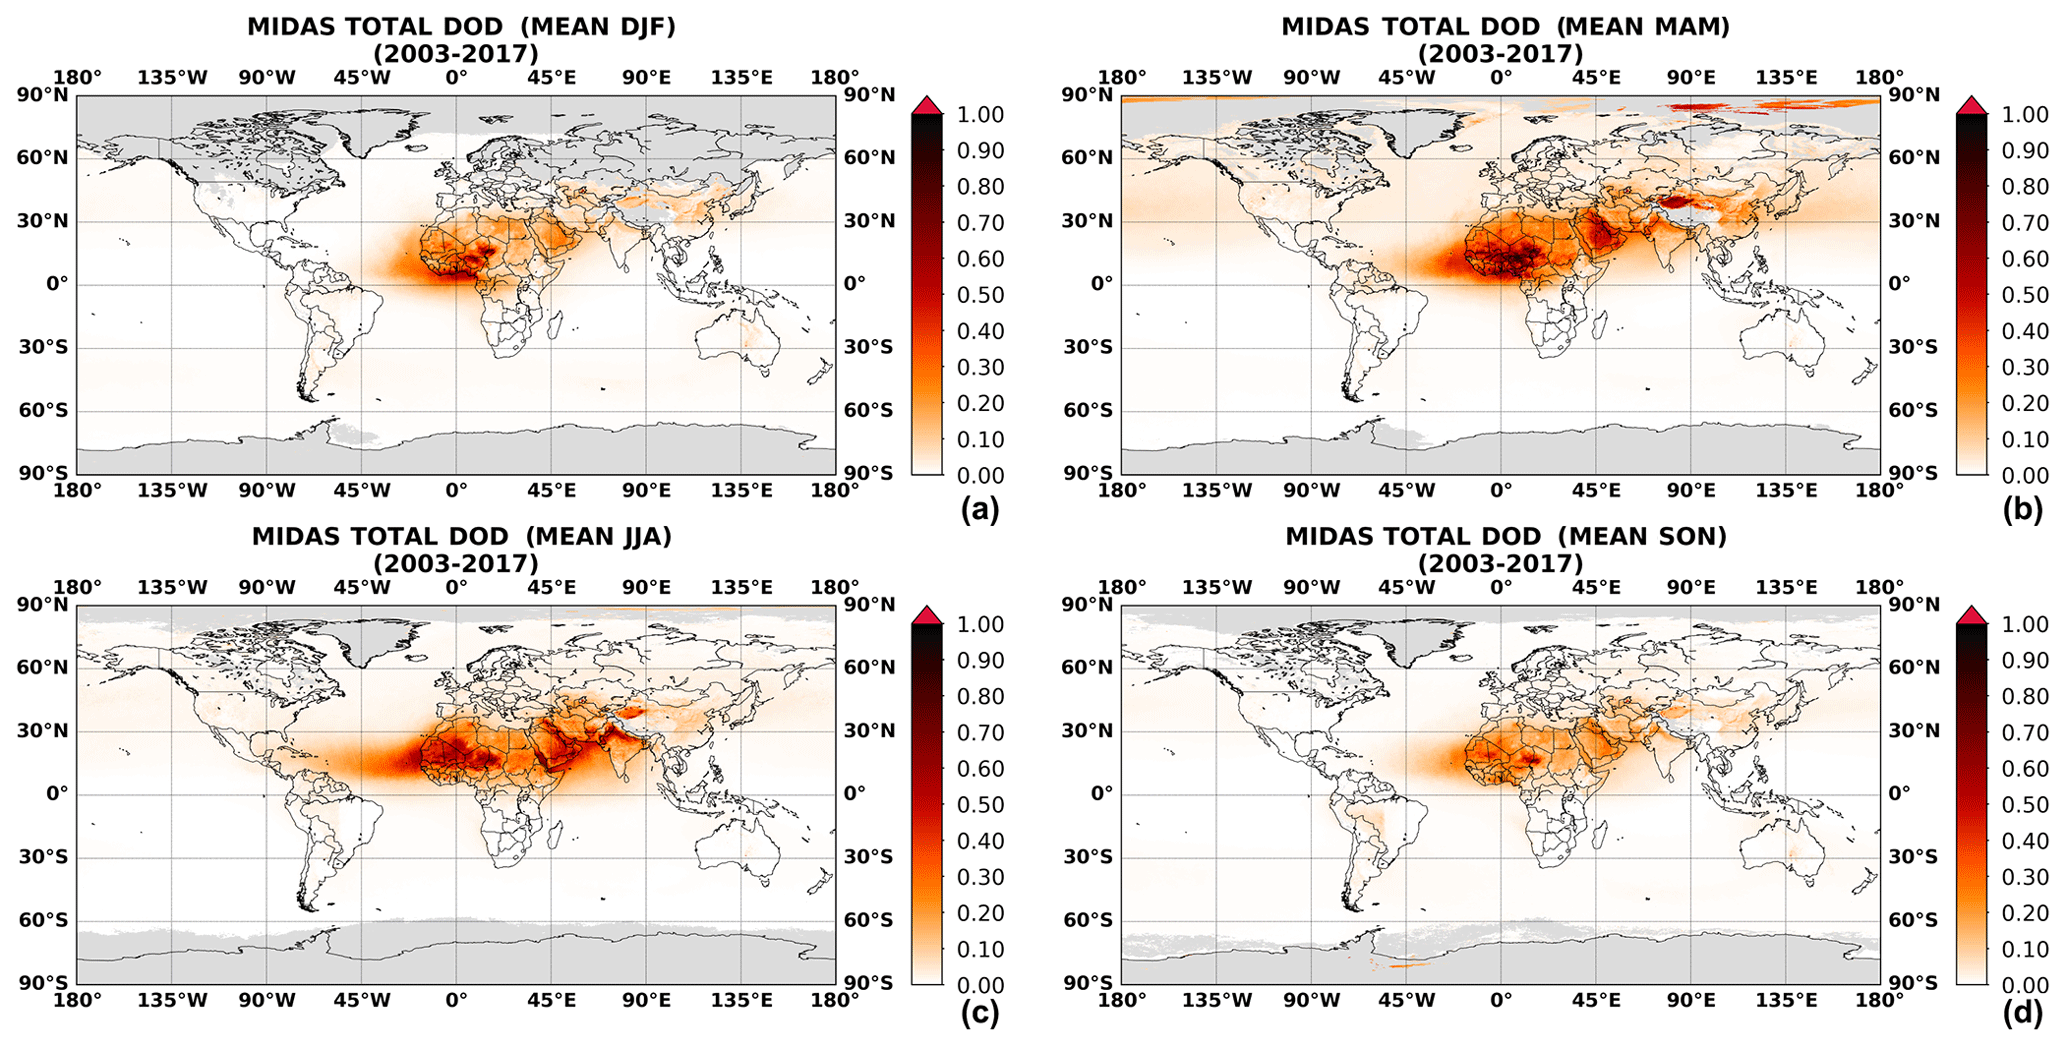
Figure 9As in Fig. 8a but for (a) December–January–February (DJF), (b) March–April–May (MAM), (c) June–July–August (JJA), and (d) September–October–November (SON).
Dust activity over the Middle East is more pronounced in a zone extending from the alluvial plain of the Tigris–Euphrates river system to the southern parts of the Arabian Peninsula (Fig. 8), through the eastern flatlands of Saudi Arabia (Hamidi et al., 2013). Mineral particles emitted from these sources also affect the Persian Gulf (Giannakopoulou and Toumi, 2011) and the Red Sea (Banks et al., 2017); however, the major transport pattern is recorded across the northern Arabian Sea in JJA (Fig. 9c), when dust plumes can reach the western coasts of India (Ramaswamy et al., 2018). In the Asian continent, the Taklamakan Desert (Ge et al., 2014), situated in the Tarim Basin (northwestern China), is one of the strongest dust sources of the planet, yielding DODs up to 1 during spring (Fig. 9b). These intensities are substantially higher than those recorded in the Gobi Desert, located eastwards in the same latitudinal band, due to the different composition of the erodible soils (Sun et al., 2013). Midlatitude cyclones propagating eastwards during springtime (Fig. 9b) mobilize dust emissions from both sources, inducing uplifting and, subsequently, advection of mineral particles towards the continental East Asia (Yu et al., 2019), over the northern Pacific Ocean (Yu et al., 2008), and exceptionally over the United States (Husar et al., 2001). Other hot spots of dust activity in Asia are recorded in the central parts (Li and Sokolik, 2018) and in the Sistan Basin (Alizadeh Choobari et al., 2013). Dust aerosols originating from agricultural activities along the Indus River basin (Ginoux et al., 2012) and natural processes in the Thar Desert (Proestakis et al., 2018) result in the accumulation of mineral particles at the Pakistan–India borders, while, under favorable meteorological conditions, these loads are carried towards the Indo-Gangetic Plain mainly during the premonsoon season (Dey et al., 2004). In North America, dust production becomes more evident in the southwestern United States and northwest Mexico in regional terms and during spring within the course of the year (Fig. 9b). However, DODs are mostly lower than 0.2, with a few local exceedances, indicating relatively weak dust emissions from the natural (Mojave and Sonoran deserts; Hand et al., 2017) and anthropogenic (Chihuahuan Desert and Southern Great Plains; Hand et al., 2016) dust sources of the region. Between the two hemispheres, there is a clear contrast in DODs, which are substantially lower in the Southern Hemisphere, attributed to the weaker processes triggering dust emission from the spatially restricted deserts located in Southern Africa (Bryant et al., 2007), South America (Gassó and Torres, 2019), and in the interior parts of Australia (Prospero et al., 2002).
In addition to the global climatological DOD pattern in Fig. 8a, the average of the daily DOD uncertainties provided within the data set (not to be confused with the uncertainty of the average DOD) and the temporal availability of the MIDAS data set are shown in Fig. 8b and c, respectively. More than 70 % of daily satellite retrievals with respect to the full period are included in the calculation of the mean DODs (Fig. 8a) over the cloud-free desert areas. Over dust-affected downwind regions, the corresponding percentages range from 30 % to 60 % (Fig. 8c). As expected from Eqs. (4) to (7), daily DOD uncertainties (Fig. 8b) scale with DOD and reach up to a 0.4 annual average and 0.5 when averaged over MAM and JJA (Fig. S8) in the regions with strongest DODs.
In the current study, we presented the MIDAS (ModIs Dust AeroSol) dust optical depth (DOD) data set, developed via the synergistic implementation of MODIS-Aqua AOD and dust fraction extracted from colocated MERRA-2 reanalysis outputs. The derived fine-resolution (0.1∘ × 0.1∘) global data set between 2003 and 2017 provides DOD both over continental and oceanic areas, in contrast to similar available satellite products restricted over land surfaces (Ginoux et al., 2012), thus making a thorough and consistent description of dust loads, not only over the sources but also over downwind regions, feasible. Reanalysis data sets, spanning through decades and available at a high temporal frequency, can fulfill such tasks; however, their coarser spatial resolution imposes a restriction when investigating the mineral loads' features at finer spatial scales. Our developed DOD product aims at complementing existing observational gaps and can be exploited in a variety of studies (e.g., climatology, trends, evaluation of atmospheric–dust models, radiative effects, and data assimilation).
The core concept of the applied methodology relies on the utilization of MODIS AOD and MERRA-2 dust fraction (MDF) for the derivation of DOD on MODIS swaths. The validity of MDF has been justified through its evaluation against reference values obtained by the LIVAS database. Over dust-abundant areas extending across the dust belt, MERRA-2 adequately reproduces the magnitude of dust portion, as indicated by the calculated primary statistics (bias, FB, and FGE), with the maximum underestimations (up to 10 %) being observed in Asian deserts. The agreement between MDF and LIVAS is reduced in the main dust regions of North America and in the Southern Hemisphere. Regarding the temporal covariation of the observed and simulated dust portions, over the period 2007–2015 moderate R values (up to 0.5) are computed above the sources and are attributed to the high spatiotemporal variability of the emission processes. On the contrary, the correlation increases substantially (up to 0.9) over maritime downwind regions (tropical Atlantic Ocean, North Pacific Ocean, Arabian Sea, and Mediterranean Sea) where the main dust transport pathways are recorded. Apart from the geographical dependency of the level of agreement between MDF and LIVAS dust fraction, we also investigated the impact of the spatial representativeness of the CALIOP observations. Through this analysis, we revealed that, for an increasing number of CALIOP L2 profiles (ranging from 1 to 23), that are aggregated for the derivation of the 1∘ × 1∘ LIVAS grid cell, the computed metrics converge towards the ideal scores.
Finally, the obtained MIDAS DOD was evaluated against AERONET retrievals and compared with LIVAS and MERRA-2 DODs. AERONET observations were processed to minimize the contribution of other aerosol species, making also the assumption that dust loads mainly consist of coarse particles (their radii are larger than the defined inflection point). Overall, the agreement between ∼10 500 MIDAS–AERONET pairs is very high (R=0.89), whereas the satellite DODs are higher by 2.7 % with respect to the ground-based ones. At station level, the R values are mainly above 0.8 at most sites in the Northern Hemisphere (except western US), while they are mostly lower than 0.5 in the Southern Hemisphere. Moreover, positive MIDAS–AERONET deviations (up to 0.2) are mainly encountered in North Africa and the Middle East, in contrast to negative values (down to −0.14) recorded at the remaining sites. Based on the annual and seasonal global DOD patterns corresponding to the period 2007–2015, the locations with the maximum DODs are in a good agreement among the three data sets. Nevertheless, in many regions (e.g., Bodélé, sub-Sahel, and northern Pacific Ocean) there are deviations in the intensity of dust loads, attributed to the inherent weaknesses of DOD derivation techniques based on different approaches. Despite the regional dependency of deviations among the three data sets, the colocated global long-term averaged DOD is very similar (0.029 for LIVAS, 0.031 for MERRA-2, and 0.033 for MIDAS) and close to that reported (0.030) in Ridley et al. (2016). In the Southern Hemisphere, the corresponding levels are equal to 0.008 for the three data sets, whereas in the Northern Hemisphere, LIVAS DODs (0.051) are lower with respect to MIDAS (0.060) and MERRA-2 (0.056).
As a demonstration of the MIDAS data set, a brief discussion about dust load regime at global scale is made by analyzing the annual and seasonal DOD patterns. The most pronounced dust activity recorded in the Bodélé Depression (DODs up to ∼1.2), across the Sahel (DODs up to 0.8), in western parts of the Sahara (DODs up to 0.6), in the eastern parts of the Arabian Peninsula (DODs up to ∼1), along the Indus River basin (DODs up to 0.8), and in the Taklamakan Desert (DODs up to ∼1). On the contrary, the weaker emission mechanisms triggering dust mobilization over the spatially limited sources of Patagonia, Southern Africa, and the interior arid areas of Australia do not favor the accumulation of mineral particles at large amounts (DODs up to 0.4 at local hot spots), even during high-dust seasons. Over oceans, the main pathways of long-range dust transport are observed along the tropical Atlantic and the northern Pacific, revealing a remarkable variation, within the course of the year, in terms of intensity, latitudinal position, and range. Finally, the Mediterranean and the Arabian seas are affected by advected dust plumes originating from North Africa and the Middle East, respectively. Based on the performed uncertainty analysis, the MIDAS DOD product is highly reliable over dust-rich regions and becomes more uncertain in areas where the existence of dust loads is not frequent.
The exploitation of the MIDAS DOD product will be expanded on in other studies. At present, focus is given to (a) the DOD climatology over dust sources and downwind regions, (b) the implementation of the MIDAS data set in the DA scheme of the MONARCH model (Di Tomaso et al., 2017), (c) the estimation of dust radiative effects and the associated impacts on solar energy production, in North Africa and Middle East, upgrading the work of Kosmopoulos et al. (2018), and (d) the analysis of global and regional trends of dust loads.
The MIDAS data set is available at https://doi.org/10.5281/zenodo.4244106 (Gkikas et al., 2020).
The supplement related to this article is available online at: https://doi.org/10.5194/amt-14-309-2021-supplement.
AG was responsible for the design of the study and the whole analysis, with support from SK and CPGP. EP processed the CALIPSO data and had an advisory role in the relevant parts of the study. VA, EDT, EM, and NH provided feedback on the analysis conduction, together with AT, who contributed also to the part of the paper relating to AERONET data. All authors contributed to editing the paper. AG prepared the replies to the two anonymous reviewers, including feedback from SK, CPGP, and EDT.
The authors declare that they have no conflict of interest.
This article is part of the special issue “Dust aerosol measurements, modeling and multidisciplinary effects (AMT/ACP inter-journal SI)”. It is not associated with a conference.
Antonis Gkikas acknowledges support from the European Union's Horizon 2020 Research and Innovation programme under the Marie Skłodowska-Curie Actions (grant no. 749461; DUST-GLASS). We would like to thank the principal investigators maintaining the AERONET sites used in the present work. We thank the NASA CALIPSO team and NASA/LaRC/ASDC for making the CALIPSO products available, which have been used to build the LIVAS products, and ESA, who funded the LIVAS project (contract no. 4000104106/11/NL/FF/fk). We are grateful to the AERIS/ICARE Data and Services Center for providing access to the CALIPSO data and their computational center (http://www.icare.univ-lille1.fr/, last access: 8 August 2019). Vassilis Amiridis acknowledges support from the European Research Council (grant no. 725698; D-TECT). Eleni Marinou was funded by a DLR VO-Ryoung investigator group and the Deutscher Akademischer Austauschdienst (grant no. 57370121). Carlos Pérez García-Pando acknowledges support from the European Research Council (grant no. 773051; FRAGMENT), the AXA Research Fund, and the Spanish Ministry of Science, Innovation and Universities (grant nos. RYC-2015-18690 and CGL2017-88911-R). The authors acknowledge support from the DustClim project as part of ERA4CS, an ERA-NET project initiated by JPI Climate and funded by FORMAS (SE), DLR (DE), BMWFW (AT), IFD (DK), MINECO (ES), and ANR (FR), with cofunding by the European Union (grant no. 690462). PRACE (Partnership for Advanced Computing in Europe) is acknowledged for awarding access to the MareNostrum Supercomputer in the Barcelona Supercomputing Center. We acknowledge support of this work by the PANhellenic infrastructure for Atmospheric Composition and climatE chAnge (PANACEA) project (grant no. MIS 5021516), which is implemented under the Horizon 2020 Action of “Reinforcement of the Research and Innovation Infrastructure”, funded by the Operational Programme Competitiveness, Entrepreneurship, and Innovation (NSRF 2014–2020) and cofinanced by Greece and the European Union (under the European Regional Development Fund). NOA members acknowledge support from the Stavros Niarchos Foundation (SNF). The authors would like to thank Andrew Mark Sayer for his valuable and constructive comments. The authors would like also to thank Thanasis Georgiou for developing the ftp server on which the MIDAS data set is stored. We would like to thank the two anonymous reviewers, who were very helpful and who provided constructive comments that improved the paper.
This research has been supported by the COST Action “InDust” (grant no. CA16202), supported by COST (European Cooperation in Science and Technology). This research has been supported by the European Commission H2020 Marie Skłodowska-Curie Actions (grant no. 749461; DUST-GLASS).
This paper was edited by Thomas Eck and reviewed by two anonymous referees.
Ackerman, S. A.: Remote sensing aerosols using satellite infrared observations, J. Geophys. Res., 102, 17069–17079, https://doi.org/10.1029/96JD03066, 1997.
Alizadeh Choobari, O., Zawar-Reza, P., and Sturman, A.: Low level jet intensification by mineral dust aerosols, Ann. Geophys., 31, 625–632, https://doi.org/10.5194/angeo-31-625-2013, 2013.
Amiridis, V., Wandinger, U., Marinou, E., Giannakaki, E., Tsekeri, A., Basart, S., Kazadzis, S., Gkikas, A., Taylor, M., Baldasano, J., and Ansmann, A.: Optimizing CALIPSO Saharan dust retrievals, Atmos. Chem. Phys., 13, 12089–12106, https://doi.org/10.5194/acp-13-12089-2013, 2013.
Amiridis, V., Marinou, E., Tsekeri, A., Wandinger, U., Schwarz, A., Giannakaki, E., Mamouri, R., Kokkalis, P., Binietoglou, I., Solomos, S., Herekakis, T., Kazadzis, S., Gerasopoulos, E., Proestakis, E., Kottas, M., Balis, D., Papayannis, A., Kontoes, C., Kourtidis, K., Papagiannopoulos, N., Mona, L., Pappalardo, G., Le Rille, O., and Ansmann, A.: LIVAS: a 3-D multi-wavelength aerosol/cloud database based on CALIPSO and EARLINET, Atmos. Chem. Phys., 15, 7127–7153, https://doi.org/10.5194/acp-15-7127-2015, 2015.
Anderson, T. L., Wu, Y., Chu, D. A., Schmid, B., Redemann, J., and Dubovik, O.: Testing the MODIS satellite retrieval of aerosol fine-mode fraction, J. Geophys. Res., 110, D18204, https://doi.org/10.1029/2005JD005978, 2005.
Baars, H., Kanitz, T., Engelmann, R., Althausen, D., Heese, B., Komppula, M., Preißler, J., Tesche, M., Ansmann, A., Wandinger, U., Lim, J.-H., Ahn, J. Y., Stachlewska, I. S., Amiridis, V., Marinou, E., Seifert, P., Hofer, J., Skupin, A., Schneider, F., Bohlmann, S., Foth, A., Bley, S., Pfüller, A., Giannakaki, E., Lihavainen, H., Viisanen, Y., Hooda, R. K., Pereira, S. N., Bortoli, D., Wagner, F., Mattis, I., Janicka, L., Markowicz, K. M., Achtert, P., Artaxo, P., Pauliquevis, T., Souza, R. A. F., Sharma, V. P., van Zyl, P. G., Beukes, J. P., Sun, J., Rohwer, E. G., Deng, R., Mamouri, R.-E., and Zamorano, F.: An overview of the first decade of PollyNET: an emerging network of automated Raman-polarization lidars for continuous aerosol profiling, Atmos. Chem. Phys., 16, 5111–5137, https://doi.org/10.5194/acp-16-5111-2016, 2016.
Banks, J. R. and Brindley, H. E.: Evaluation of MSG-SEVIRI mineral dust retrieval products over Africa and the Middle East, Remote Sens. Environ., 128, 58–73, https://doi.org/10.1016/j.rse.2012.07.017, 2013.
Banks, J. R., Brindley, H. E., Stenchikov, G., and Schepanski, K.: Satellite retrievals of dust aerosol over the Red Sea and the Persian Gulf (2005–2015), Atmos. Chem. Phys., 17, 3987–4003, https://doi.org/10.5194/acp-17-3987-2017, 2017.
Basart, S., Pérez, C., Cuevas, E., Baldasano, J. M., and Gobbi, G. P.: Aerosol characterization in Northern Africa, Northeastern Atlantic, Mediterranean Basin and Middle East from direct-sun AERONET observations, Atmos. Chem. Phys., 9, 8265–8282, https://doi.org/10.5194/acp-9-8265-2009, 2009.
Basart, S., Pérez, C., Nickovic, S., Cuevas, E., and Baldasano, J. M.: Development and evaluation of the BSC-DREAM8b dust regional model over Northern Africa, the Mediterranean and the Middle East, Tellus B, 64, 18539, https://doi.org/10.3402/tellusb.v64i0.18539, 2012.
Ben-Ami, Y., Koren, I., and Altaratz, O.: Patterns of North African dust transport over the Atlantic: winter vs. summer, based on CALIPSO first year data, Atmos. Chem. Phys., 9, 7867–7875, https://doi.org/10.5194/acp-9-7867-2009, 2009.
Benedetti, A., Morcrette, J.-J., Boucher, O., Dethof, A., Engelen, R. J., Fisher, M., Flentje, H., Huneeus, N., Jones, L., Kaiser, J. W., Kinne, S., Mangold, A., Razinger, M., Simmons, A. J., Suttie, M., and the GEMS-AER team: Aerosol analysis and forecast in the European Centre for Medium-Range Weather Forecasts Integrated Forecast System: 2. Data assimilation, J. Geophys. Res., 114, D13205, https://doi.org/10.1029/2008JD011115, 2009.
Bryant, R. G., Bigg, G. R., Mahowald, N. M., Eckardt, F. D., and Ross S. G.: Dust emission response to climate in southern Africa, J. Geophys. Res., 112, D09207, https://doi.org/10.1029/2005JD007025, 2007.
Buchard, V., da Silva, A. M., Colarco, P. R., Darmenov, A., Randles, C. A., Govindaraju, R., Torres, O., Campbell, J., and Spurr, R.: Using the OMI aerosol index and absorption aerosol optical depth to evaluate the NASA MERRA Aerosol Reanalysis, Atmos. Chem. Phys., 15, 5743–5760, https://doi.org/10.5194/acp-15-5743-2015, 2015.
Buchard, V., Randles, C. A., da Silva, A. M., Darmenov, A., Colarco, P. R., Govindaraju, R., Ferrare, R., Hair, J., Beyersdorf, A. J., Ziemba, L. D. and Yu, H.: The MERRA-2 aerosol reanalysis, 1980 onward. Part II: Evaluation and case studies, J. Climate, 30, 6851–6872, https://doi.org/10.1175/JCLI-D-16-0613.1, 2017.
Bullard, J. E., Baddock, M., Bradwell, T., Crusius, J., Darlington, E., Gaiero, D., Gassó, S., Gisladottir, G., Hodgkins, R., McCulloch, R., McKenna-Neuman, C., Mockford, T., Stewart, H., and Thorsteinsson, T.: High-latitude dust in the Earth system, Rev. Geophys., 54, 447–485, https://doi.org/10.1002/2016RG000518, 2016.
Burton, S. P., Hair, J. W., Kahnert, M., Ferrare, R. A., Hostetler, C. A., Cook, A. L., Harper, D. B., Berkoff, T. A., Seaman, S. T., Collins, J. E., Fenn, M. A., and Rogers, R. R.: Observations of the spectral dependence of linear particle depolarization ratio of aerosols using NASA Langley airborne High Spectral Resolution Lidar, Atmos. Chem. Phys., 15, 13453–13473, https://doi.org/10.5194/acp-15-13453-2015, 2015.
Capelle, V., Chédin, A., Pondrom, M., Crevoisier, C., Armante, R., Crépeau, L., and Scott, N. A.: Infrared dust aerosol optical depth retrieved daily from IASI and comparison with AERONET over the period 2007–2016, Remote Sens. Environ., 206, 15–32, https://doi.org/10.1016/j.rse.2017.12.008, 2018.
Chen, S., Huang, J., Kang, L., Wang, H., Ma, X., He, Y., Yuan, T., Yang, B., Huang, Z., and Zhang, G.: Emission, transport, and radiative effects of mineral dust from the Taklimakan and Gobi deserts: comparison of measurements and model results, Atmos. Chem. Phys., 17, 2401–2421, https://doi.org/10.5194/acp-17-2401-2017, 2017.
Chin, M., Ginoux, P., Kinne, S., Torres, O., Holben, B. N., Duncan, D. N., Martin, R. V., Logan, J. A., Higurashi, H., and Nakajima, T.: Tropospheric aerosol optical thickness from the GOCART model and comparisons with satellite and Sun photometer measurements, J. Atmos. Sci., 59, 451–483, https://doi.org/10.1175/1520-0469(2002)059<0461:TAOTFT>2.0.CO;2, 2002.
Clarisse, L., Clerbaux, C., Franco, B., Hadji-Lazaro, J., Whitburn, S., Kopp, A. K., Hurtmans, D., and Coheur, P.-F.: A Decadal Data Set of Global Atmospheric Dust Retrieved From IASI Satellite Measurements, J. Geophys. Res.-Atmos., 124, 1618–1647, https://doi.org/10.1029/2018JD029701, 2019.
Colarco, P., da Silva, A., Chin, M., and Diehl, T.: Online simulations of global aerosol distributions in the NASA GEOS-4 model and comparisons to satellite and ground-based aerosol optical depth, J. Geophys. Res., 115, D14207, https://doi.org/10.1029/2009JD012820, 2010.
Colarco, P. R., Nowottnick, E. P., Randles, C. A., Yi, B., Yang, P., Kim, K.-M., Smith, J. A., and Bardeen, C. G.: Impact of radiatively interactive dust aerosols in the NASA GEOS-5 climate model: Sensitivity to dust particle shape and refractive index, J. Geophys. Res.-Atmos., 119, 753–786, https://doi.org/10.1002/2013JD020046, 2014.
Dey, S., Tripathi, S. N., Singh, R. P., and Holben, B. N.: Influence of dust storms on the aerosol optical properties over the Indo-Gangetic basin, J. Geophys. Res.-Atmos., 109, 1–10, https://doi.org/10.1029/2004jd004924, 2004.
Diehl, T., Heil, A., Chin, M., Pan, X., Streets, D., Schultz, M., and Kinne, S.: Anthropogenic, biomass burning, and volcanic emissions of black carbon, organic carbon, and SO2 from 1980 to 2010 for hindcast model experiments, Atmos. Chem. Phys. Discuss., 12, 24895–24954, https://doi.org/10.5194/acpd-12-24895-2012, 2012.
Di Tomaso, E., Schutgens, N. A. J., Jorba, O., and Pérez García-Pando, C.: Assimilation of MODIS Dark Target and Deep Blue observations in the dust aerosol component of NMMB-MONARCH version 1.0, Geosci. Model Dev., 10, 1107–1129, https://doi.org/10.5194/gmd-10-1107-2017, 2017.
Du, Y., Xu, X., Chu, M., Guo, Y., and Wang, J.: Air particulate matter and cardiovascular disease: the epidemiological, biomedical and clinical evidence, J. Thorac. Dis., 8, E8, https://doi.org/10.3978/j.issn.2072-1439.2015.11.37, 2016.
Dubovik, O. and King, M. D.: A flexible inversion algorithm for retrieval of aerosol optical properties from Sun and sky radiance measurements, J. Geophys. Res., 105, 20673–20696, https://doi.org/10.1029/2000JD900282, 2000.
Dubovik, O., Sinyuk, A., Lapyonok, T., Holben, B. N., Mishchenko, M., Yang, P., Eck, T. F., Volten, H., Munoz, O., Veihelmann, B., and Van der Zande, W. J.: Application of spheroid models to account for aerosol particle nonsphericity in remote sensing of desert dust, J. Geophys. Res.-Atmos., 111, D11208, https://doi.org/10.1029/2005JD006619, 2006.
Ekström, M., McTainsh, G. H., and Chappell, A.: Australian dust storms: temporal trends and relationships with synoptic pressure distributions (1960–99), Int. J. Climatol., 24, 1581–1599, https://doi.org/10.1002/joc.1072, 2004.
Engelstaedter, S., Tegen, I., and Washington, R.: North African dust emissions and transport, Earth-Sci. Rev., 79, 73–100, https://doi.org/10.1016/j.earscirev.2006.06.004, 2006.
Fiedler, S., Schepanski, K., Heinold, B., Knippertz, P., and Tegen, I.: Climatology of nocturnal low-level jets over North Africa and implications for modeling mineral dust emission, J. Geophys. Res.-Atmos., 118, 6100–6121, 2013.
Flaounas, E., Kotroni, V., Lagouvardos, K., Kazadzis, S., Gkikas, A., and Hatzianastassiou, N.: Cyclone contribution to dust transport over the Mediterranean region, Atmos. Sci. Lett., 16, 473–478, https://doi.org/10.1002/asl.584, 2015.
Fotiadi, A., Hatzianastassiou, N., Drakakis, E., Matsoukas, C., Pavlakis, K. G., Hatzidimitriou, D., Gerasopoulos, E., Mihalopoulos, N., and Vardavas, I.: Aerosol physical and optical properties in the Eastern Mediterranean Basin, Crete, from Aerosol Robotic Network data, Atmos. Chem. Phys., 6, 5399–5413, https://doi.org/10.5194/acp-6-5399-2006, 2006.
Freudenthaler, V., Esselborn, M., Wiegner, M., Heese, B., Tesche, M., Ansmann, A., Mueller, D., Althausen, D., Wirth, M., Fix, A., Ehret, G., Knippertz, P., Toledano, C., Gasteiger, J., Garhammer, M., and Seefeldner, A.: Depolarization ratio profiling at several wavelengths in pure Saharan dust during SAMUM 2006, Tellus B, 61, 165–179, https://doi.org/10.1111/j.1600-0889.2008.00396.x, 2009.
Gassó, S. and Torres, O.: Temporal characterization of dust activity in the Central Patagonia desert (years 1964–2017), J. Geophys. Res.-Atmos., 124, 3417–3434, https://doi.org/10.1029/2018JD030209, 2019.
Ge, J. M., Huang, J. P., Xu, C. P., Qi, Y. L., and Liu, H. Y.: Characteristics of Taklimakan dust emission and distribution: a satellite and reanalysis field perspective, J. Geophys. Res.-Atmos., 119, 11772–11783, https://doi.org/10.1002/2014JD022280, 2014.
Gelaro, R, McCarty, W., Suárez, M. J., Todling, R., Molod, A., Takacs, L., Randles, C. A., Darmenov, A., Bosilovich, M. G., Reichle, R., Wargan, K., Coy, L., Cullather, R., Draper, C., Akella, S., Buchard, V., Conaty, A., da Silva, A. M., Gu, W., Kim, G., Koster, R., Lucchesi, R., Merkova, D., Nielsen, J. E., Partyka, G., Pawson, S., Putman, W., Rienecker, M., Schubert, S. D., Sienkiewicz, M., and Zhao, B.: The Modern-Era Retrospective Analysis for Research and Applications, Version 2 (MERRA-2), J. Climate, 30, 5419–5454, https://doi.org/10.1175/JCLI-D-16-0758.1, 2017.
Georgoulias, A. K., Alexandri, G., Kourtidis, K. A., Lelieveld, J., Zanis, P., Pöschl, U., Levy, R., Amiridis, V., Marinou, E., and Tsikerdekis, A.: Spatiotemporal variability and contribution of different aerosol types to the aerosol optical depth over the Eastern Mediterranean, Atmos. Chem. Phys., 16, 13853–13884, https://doi.org/10.5194/acp-16-13853-2016, 2016.
Georgoulias, A. K., Tsikerdekis, A., Amiridis, V., Marinou, E., Benedetti, A., Zanis, P., Alexandri, G., Mona, L., Kourtidis, K. A., and Lelieveld, J.: A 3-D evaluation of the MACC reanalysis dust product over Europe, northern Africa and Middle East using CALIOP/CALIPSO dust satellite observations, Atmos. Chem. Phys., 18, 8601–8620, https://doi.org/10.5194/acp-18-8601-2018, 2018.
Giannakopoulou, E. M. and Toumi, R.: The Persian Gulf summertime low-level jet over sloping terrain, Q. J. Roy. Meteor. Soc., 138, 145–157, https://doi.org/10.1002/qj.901, 2011.
Giles, D. M., Holben, B. N., Eck, T. F., Sinyuk, A., Smirnov, A., Slutsker, I., Dickerson, R. R., Thompson, A. M., and Schafer, J. S.: An analysis of AERONET aerosol absorption properties and classifications representative of aerosol source regions, J. Geophys. Res., 117, D17203, https://doi.org/10.1029/2012JD018127, 2012.
Giles, D. M., Sinyuk, A., Sorokin, M. G., Schafer, J. S., Smirnov, A., Slutsker, I., Eck, T. F., Holben, B. N., Lewis, J. R., Campbell, J. R., Welton, E. J., Korkin, S. V., and Lyapustin, A. I.: Advancements in the Aerosol Robotic Network (AERONET) Version 3 database – automated near-real-time quality control algorithm with improved cloud screening for Sun photometer aerosol optical depth (AOD) measurements, Atmos. Meas. Tech., 12, 169–209, https://doi.org/10.5194/amt-12-169-2019, 2019.
Ginoux, P., Chin, M., Tegen, I., Prospero, J. M., Holben, B., Dubovik, O., and Lin, S. J.: Sources and distributions of dust aerosols simulated with the GOCART model, J. Geophys. Res.-Atmos., 106, 20255–20273, https://doi.org/10.1029/2000jd000053, 2001.
Ginoux, P., Prospero, J. M., Torres, O., and Chin, M.: Longterm simulation of global dust distribution with the GOCART model: correlation with North Atlantic Oscillation, Environ. Modell. Softw., 19, 113–128, https://doi.org/10.1016/S1364-8152(03)00114-2, 2004.
Ginoux, P., Prospero, J. M., Gill, T. E., Hsu, N. C., and Zhao, M.: Global-scale attribution of anthropogenic and natural dust sources and their emission rates based on MODIS Deep Blue aerosol products, Rev. Geophys., 50, RG3005, https://doi.org/10.1029/2012RG000388, 2012.
Gkikas, A., Hatzianastassiou, N., Mihalopoulos, N., Katsoulis, V., Kazadzis, S., Pey, J., Querol, X., and Torres, O.: The regime of intense desert dust episodes in the Mediterranean based on contemporary satellite observations and ground measurements, Atmos. Chem. Phys., 13, 12135–12154, https://doi.org/10.5194/acp-13-12135-2013, 2013.
Gkikas, A., Houssos, E. E., Lolis, C. J., Bartzokas, A., Mihalopoulos, N., and Hatzianastassiou, N.: Atmospheric circulation evolution related to desert-dust episodes over the Mediterranean, Q. J. Roy. Meteor. Soc., 141, 1634–1645, https://doi.org/10.1002/qj.2466, 2015.
Gkikas, A., Basart, S., Hatzianastassiou, N., Marinou, E., Amiridis, V., Kazadzis, S., Pey, J., Querol, X., Jorba, O., Gassó, S., and Baldasano, J. M.: Mediterranean intense desert dust outbreaks and their vertical structure based on remote sensing data, Atmos. Chem. Phys., 16, 8609–8642, https://doi.org/10.5194/acp-16-8609-2016, 2016.
Gkikas, A., Obiso, V., Pérez García-Pando, C., Jorba, O., Hatzianastassiou, N., Vendrell, L., Basart, S., Solomos, S., Gassó, S., and Baldasano, J. M.: Direct radiative effects during intense Mediterranean desert dust outbreaks, Atmos. Chem. Phys., 18, 8757–8787, https://doi.org/10.5194/acp-18-8757-2018, 2018.
Gkikas, A., Giannaros, T. M., Kotroni, V., and Lagouvardos, K.: Assessing the radiative impacts of an extreme desert dust outbreak and the potential improvements on short-term weather forecasts: The case of February 2015, Atmos. Res., 226, 152–170, https://doi.org/10.1016/j.atmosres.2019.04.020, 2019.
Gkikas, A., Proestakis, E., Amiridis, V., Kazadzis, S., Di Tomaso, E., Tsekeri, A., Marinou, E., Hatzianastassiou, N., and Pérez García-Pando, C.: ModIs Dust AeroSol (MIDAS): A global fine resolution dust optical depth dataset, Zenodo, https://doi.org/10.5281/zenodo.4244106, 2020.
Gong, S. L.: A parameterization of sea-salt aerosol source function for sub- and super-micron particles, Global Biogeochem. Cy., 17, 1097, https://doi.org/10.1029/2003GB002079, 2003.
Hamidi, M., Kavianpour, M. R., and Shao, Y.: Synoptic analysis of dust storms in the Middle East, Asia-Pac. J. Atmos. Sci., 49, 279–286, 2013.
Hand, J. L., White, W. H., Gebhart, K. A., Hyslop, N. P., Gill, T. E., and Schichtel, B. A.: Earlier onset of the spring fine dust season in the southwestern United States, Geophys. Res. Lett., 43, 4001–4009, https://doi.org/10.1002/2016gl068519, 2016.
Hand, J. L., Gill, T. E., and Schichtel, B. A.: Spatial and seasonal variability in fine mineral dust and coarse aerosol mass at remote sites across the United States, J. Geophys. Res.-Atmos.,122, 3080–3097, https://doi.org/10.1002/2016jd026290, 2017.
Haustein, K., Pérez, C., Baldasano, J. M., Jorba, O., Basart, S., Miller, R. L., Janjic, Z., Black, T., Nickovic, S., Todd, M. C., Washington, R., Müller, D., Tesche, M., Weinzierl, B., Esselborn, M., and Schladitz, A.: Atmospheric dust modeling from meso to global scales with the online NMMB/BSC-Dust model – Part 2: Experimental campaigns in Northern Africa, Atmos. Chem. Phys., 12, 2933–2958, https://doi.org/10.5194/acp-12-2933-2012, 2012.
Haywood, J. and Boucher, O.: Estimates of the direct and indirect radiative forcing due to tropospheric aerosols: A review, Rev. Geophys., 38, 513–543, https://doi.org/10.1029/1999RG000078, 2000.
Hess, M., Koepke, P., and Schult, I.: Optical Properties of Aerosols and Clouds: The Software Package OPAC, B. Am. Meteorol. Soc., 79, 831–844, https://doi.org/10.1175/1520-0477(1998)079<0831:OPOAAC>2.0.CO;2, 1998.
Holben, B. N., Eck, T. F., Slutsker, I., Tanre, D., Buis, J. P., Setzer, A., Vermote, E., Reagan, J. A., Kaufman, Y., Nakajima, T., Lavenue, F., Jankowiak, I., and Smirnov, A.: AERONET – A federated instrument network and data archive for aerosol characterization, Remote Sens. Environ., 66, 1–16, https://doi.org/10.1016/S0034-4257(98)00031-5, 1998.
Hsu, N. C., Tsay, S. C., King, M. D., and Herman, J. R.: Aerosol Properties Over Bright-Reflecting Source Regions, IEEE T. Geosci. Remote, 42, 557–569, https://doi.org/10.1109/TGRS.2004.824067, 2004.
Hubanks, P. A., Platnick, S., King, M., and Ridgway, R.: MODIS Atmosphere L3 Gridded Product Algorithm Theoretical Basis Document (ATBD) & Users Guide, ATBD Reference Number: L3_ATBD_C6_2018_04_11, 2018.
Hunt, W. H., Winker, D. M., Vaughan, M. A., Powell, K. A., Lucker, P. L., and Weimer, C.: CALIPSO Lidar Description and Performance Assessment, J. Atmos. Ocean. Tech., 26, 1214–1228, https://doi.org/10.1175/2009JTECHA1223.1, 2009.
Husar, R. B., Tratt, D. M., Schichtel, D. M., Falke, S. R., Li, F., Jaffe, D., Gassó, S., Gill, T., Laulainen, N. S., Lu, F., Reheis, M. C., Chun, Y., Westphal, D., Holben, B. N., Gueymard, C., McKendry, I., Kuring, N., Feldman, G. C., McClain, C., Frouin, R. J., Merrill, J., DuBois, D., Vignola, F., Murayama, T., Nickovic, S., Wilson, W. E., Sassen, K., Sugimoto, N., and Malm, W. C.: Asian dust events of April 1998, J. Geophys. Res., 106, 18317–18330, https://doi.org/10.1029/2000JD900788, 2001.
Hussain, A., Mir, H., and Afzal, M.: Analysis of dust storms frequency over Pakistan during (1961–2000), Pakistan J. Meteorol., 2, 49–68, 2005.
Hyer, E. J., Reid, J. S., and Zhang, J.: An over-land aerosol optical depth data set for data assimilation by filtering, correction, and aggregation of MODIS Collection 5 optical depth retrievals, Atmos. Meas. Tech., 4, 379–408, https://doi.org/10.5194/amt-4-379-2011, 2011.
Inness, A., Baier, F., Benedetti, A., Bouarar, I., Chabrillat, S., Clark, H., Clerbaux, C., Coheur, P., Engelen, R. J., Errera, Q., Flemming, J., George, M., Granier, C., Hadji-Lazaro, J., Huijnen, V., Hurtmans, D., Jones, L., Kaiser, J. W., Kapsomenakis, J., Lefever, K., Leitão, J., Razinger, M., Richter, A., Schultz, M. G., Simmons, A. J., Suttie, M., Stein, O., Thépaut, J.-N., Thouret, V., Vrekoussis, M., Zerefos, C., and the MACC team: The MACC reanalysis: an 8 yr data set of atmospheric composition, Atmos. Chem. Phys., 13, 4073–4109, https://doi.org/10.5194/acp-13-4073-2013, 2013.
Inness, A., Ades, M., Agustí-Panareda, A., Barré, J., Benedictow, A., Blechschmidt, A.-M., Dominguez, J. J., Engelen, R., Eskes, H., Flemming, J., Huijnen, V., Jones, L., Kipling, Z., Massart, S., Parrington, M., Peuch, V.-H., Razinger, M., Remy, S., Schulz, M., and Suttie, M.: The CAMS reanalysis of atmospheric composition, Atmos. Chem. Phys., 19, 3515–3556, https://doi.org/10.5194/acp-19-3515-2019, 2019.
Jickells, T. D., An, Z. S., Andersen, K. K., Baker, A. R., Bergametti, G., Brooks, N., Cao, J. J., Boyd, P. W., Duce, R. A., Hunter, K. A., Kawahata, H., Kubilay, N., la Roche, J., Liss, P. S., Mahowald, N., Prospero, J. M., Ridgwell, A. J., Tegen, I., and Torres, R.: Global iron connections between desert dust, ocean biogeochemistry, and climate, Science, 308, 67–71, 2005.
Kahn, R. A., Gaitley, B. J., Martonchik, J. V., Diner, D. J., Crean, K. A., and Holben, B.: Multiangle Imaging Spectroradiometer (MISR) global aerosol optical depth validation based on 2 years of coincident Aerosol Robotic Network (AERONET) observations, J. Geophys. Res., 110, D10S04, https://doi.org/10.1029/2004JD004706, 2005.
Kanakidou, M., Mihalopoulos, N., Kindap, T., Im, U., Vrekoussis, M., Gerasopoulos, E., Dermitzaki, E., Unal, A., Kocak, M., Markakis, K., Melas, D., Kouvarakis, G., Youssef, A. F., Richter, A., Hatzianastassiou, N., Hilboll, A., Ebojie, F., Wittrock, F., von Savigny, C., Burrows, J. P., Ladstaetter-Weissenmayer, A., and Moubasher, H.: Megacities as hot spots of air pollution in the East Mediterranean, Atmos. Environ., 45, 1223–1235, https://doi.org/10.1016/j.atmosenv.2010.11.048, 2011.
Kanatani, K. T., Ito, I., Al-Delaimy, W. K., Adachi, Y., Mathews, W. C., and Ramsdell, J. W.: Toyama Asian Desert Dust, and Asthma Study Team: Desert dust exposure is associated with increased risk of asthma hospitalization in children, Am. J. Respir. Crit. Care Med., 182, 1475–1481, https://doi.org/10.1164/rccm.201002-0296OC, 2010.
Kanitz, T., Engelmann, R., Heinold, B., Baars, H., Skupin, A., and Ansmann, A.: Tracking the Saharan Air Layer with shipborne lidar across the tropical Atlantic, Geophys. Res. Lett., 41, 1044–1050, https://doi.org/10.1002/2013GL058780, 2014.
Kaufman, Y. J., Koren, I., Remer, L. A., Tanré, D., Ginoux, P., and Fan, S.: Dust transport and deposition observed from the Terra-Moderate Resolution Imaging Spectroradiometer (MODIS) spacecraft over the Atlantic Ocean, J. Geophys. Res.-Atmos., 110, 1–16, https://doi.org/10.1029/2003JD004436, 2005.
Kergoat, L., Guichard, F., Pierre, C., and Vassal, C.: Influence of dry-season vegetation variability on Sahelian dust during 2002–2015, Geophys. Res. Lett., 44, 5231–5239, https://doi.org/10.1002/2016GL072317, 2017.
Kim, D., Chin, M., Yu, H., Eck, T. F., Sinyuk, A., Smirnov, A., and Holben, B. N.: Dust optical properties over North Africa and Arabian Peninsula derived from the AERONET dataset, Atmos. Chem. Phys., 11, 10733–10741, https://doi.org/10.5194/acp-11-10733-2011, 2011.
Kittaka, C., Winker, D. M., Vaughan, M. A., Omar, A., and Remer, L. A.: Intercomparison of column aerosol optical depths from CALIPSO and MODIS-Aqua, Atmos. Meas. Tech., 4, 131–141, https://doi.org/10.5194/amt-4-131-2011, 2011.
Klingmüller, K., Pozzer, A., Metzger, S., Stenchikov, G. L., and Lelieveld, J.: Aerosol optical depth trend over the Middle East, Atmos. Chem. Phys., 16, 5063–5073, https://doi.org/10.5194/acp-16-5063-2016, 2016.
Klose, M. and Shao, Y.: Stochastic parameterization of dust emission and application to convective atmospheric conditions, Atmos. Chem. Phys., 12, 7309–7320, https://doi.org/10.5194/acp-12-7309-2012, 2012.
Knippertz, P., Deutscher, C., Kandler, K., Müller, T., Schulz, O., and Schütz, L.: Dust mobilization due to density currents in the Atlas region: Observations from the Saharan Mineral Dust Experiment 2006 field campaign, J. Geophys. Res.-Atmos., 112, 1–14, https://doi.org/10.1029/2007JD008774, 2007.
Koch, J. and Renno, N. O.: The role of convective plumes and vortices on the global aerosol budget, Geophys. Res. Lett., 32, L18806, https://doi.org/10.1029/2005GL023420, 2005.
Konsta, D., Binietoglou, I., Gkikas, A., Solomos, S., Marinou, E., Proestakis, E., Basart, S., Pérez García-Pando, C., El-Askary, H., and Amiridis, V.: Evaluation of the BSC-DREAM8b regional dust model using the 3D LIVAS-CALIPSO, Atmos. Environ., 195, 46–62, https://doi.org/10.1016/j.atmosenv.2018.09.047, 2018.
Kosmopoulos, P. G., Kazadzis, S., Taylor, M., Athanasopoulou, E., Speyer, O., Raptis, P. I., Marinou, E., Proestakis, E., Solomos, S., Gerasopoulos, E., Amiridis, V., Bais, A., and Kontoes, C.: Dust impact on surface solar irradiance assessed with model simulations, satellite observations and ground-based measurements, Atmos. Meas. Tech., 10, 2435–2453, https://doi.org/10.5194/amt-10-2435-2017, 2017.
Kosmopoulos, P. G., Kazadzis, S., El-Askary, H., Taylor, M., Gkikas, A., Proestakis, E., Kontoes, C., and El-Khayat, M. M.: Earth-Observation-Based Estimation and Forecasting of Particulate Matter Impact on Solar Energy in Egypt, Remote Sens., 10, 1870, https://doi.org/10.3390/rs10121870, 2018.
Lambert, F., Kug, J.-S., Park, R. J., Mahowald, N., Winckler, G., Abe-Ouchi, A., O'ishi, R., Takemura, T., and Lee, J.-H.: The role of mineral-dust aerosols in polar temperature amplification, Nat. Clim. Change, 3, 487–491, https://doi.org/10.1038/nclimate1785, 2013.
Levy, R. C., Remer, L. A., and Dubovik, O.: Global aerosol optical properties and application to Moderate Resolution Imaging Spectroradiometer aerosol retrieval over land, J. Geophys. Res.-Atmos., 112, D13210, https://doi.org/10.1029/2006JD007815, 2007a.
Levy, R. C., Remer, L. A., Mattoo, S., Vermote, E. F., and Kaufman, Y. J.: Second-generation operational algorithm: Retrieval of aerosol properties over land from inversion of Moderate Resolution Imaging Spectroradiometer spectral reflectance, J. Geophys. Res.-Atmos., 112, D13211, https://doi.org/10.1029/2006JD007811, 2007b.
Levy, R. C., Leptoukh, G. G., Kahn, R., Zubko, V., Gopalan, A., and Remer, L. A.: A critical look at deriving monthly aerosol optical depth from satellite data, IEEE T. Geosci. Remote, 47, 2942–2956, https://doi.org/10.1109/TGRS.2009.2013842, 2009.
Levy, R. C., Remer, L. A., Kleidman, R. G., Mattoo, S., Ichoku, C., Kahn, R., and Eck, T. F.: Global evaluation of the Collection 5 MODIS dark-target aerosol products over land, Atmos. Chem. Phys., 10, 10399–10420, https://doi.org/10.5194/acp-10-10399-2010, 2010.
Levy, R. C., Mattoo, S., Munchak, L. A., Remer, L. A., Sayer, A. M., Patadia, F., and Hsu, N. C.: The Collection 6 MODIS aerosol products over land and ocean, Atmos. Meas. Tech., 6, 2989–3034, https://doi.org/10.5194/amt-6-2989-2013, 2013.
Li, L. and Sokolik, I.: Analysis of Dust Aerosol Retrievals Using Satellite Data in Central Asia, Atmosphere-Basel, 9, 288, 2018.
Li, W., El-Askary, H., Qurban, M. A, Proestakis E., Garay M. J., Kalashnikova, O. V., Amiridis, V., Gkikas, A., Marinou, E., Piechota, T., and ManiKandan, K. P.: An Assessment of Atmospheric and Meteorological Factors Regulating Red Sea Phytoplankton Growth, Remote Sens., 10, 673, https://doi.org/10.3390/rs10050673, 2018.
Liu, D., Wang, Z., Liu, Z., Winker, D., and Trepte, C.: A height resolved global view of dust aerosols from the first year CALIPSO lidar measurements, J. Geophys. Res.-Atmos., 113, D16214, https://doi.org/10.1029/2007JD009776, 2008.
Liu, D., Taylor, J. W., Crosier, J., Marsden, N., Bower, K. N., Lloyd, G., Ryder, C. L., Brooke, J. K., Cotton, R., Marenco, F., Blyth, A., Cui, Z., Estelles, V., Gallagher, M., Coe, H., and Choularton, T. W.: Aircraft and ground measurements of dust aerosols over the west African coast in summer 2015 during ICE-D and AER-D, Atmos. Chem. Phys., 18, 3817–3838, https://doi.org/10.5194/acp-18-3817-2018, 2018.
Lynch, P., Reid, J. S., Westphal, D. L., Zhang, J., Hogan, T. F., Hyer, E. J., Curtis, C. A., Hegg, D. A., Shi, Y., Campbell, J. R., Rubin, J. I., Sessions, W. R., Turk, F. J., and Walker, A. L.: An 11-year global gridded aerosol optical thickness reanalysis (v1.0) for atmospheric and climate sciences, Geosci. Model Dev., 9, 1489–1522, https://doi.org/10.5194/gmd-9-1489-2016, 2016.
Ma, X., Bartlett, K., Harmon, K., and Yu, F.: Comparison of AOD between CALIPSO and MODIS: significant differences over major dust and biomass burning regions, Atmos. Meas. Tech., 6, 2391–2401, https://doi.org/10.5194/amt-6-2391-2013, 2013.
Mamouri, R. E. and Ansmann, A.: Fine and coarse dust separation with polarization lidar, Atmos. Meas. Tech., 7, 3717–3735, https://doi.org/10.5194/amt-7-3717-2014, 2014.
Mamouri, R.-E. and Ansmann, A.: Potential of polarization/Raman lidar to separate fine dust, coarse dust, maritime, and anthropogenic aerosol profiles, Atmos. Meas. Tech., 10, 3403–3427, https://doi.org/10.5194/amt-10-3403-2017, 2017.
Marinou, E., Amiridis, V., Binietoglou, I., Tsikerdekis, A., Solomos, S., Proestakis, E., Konsta, D., Papagiannopoulos, N., Tsekeri, A., Vlastou, G., Zanis, P., Balis, D., Wandinger, U., and Ansmann, A.: Three-dimensional evolution of Saharan dust transport towards Europe based on a 9-year EARLINET-optimized CALIPSO dataset, Atmos. Chem. Phys., 17, 5893–5919, https://doi.org/10.5194/acp-17-5893-2017, 2017.
McCarty, W., Coy, L., Gelaro, R., Huang, A., Merkova, D., Smith, E. B., Sienkiewicz, M., and Wargan, K.: MERRA-2 input observations: Summary and initial assessment, Technical Report Series on Global Modeling and Data Assimilation, Vol. 46, NASA Tech. Rep. NASA/TM–2016–104606, 61 pp., 2016.
Meng, Z. K., Yang, P., Kattawar, G. W., Bi, L., Liou, K. N., and Laszlo, I.: Single-scattering properties of tri-axial ellipsoidal mineral dust aerosols: A database for application to radiative transfer calculations, J. Aerosol Sci., 41, 501–512, https://doi.org/10.1016/j.jaerosci.2010.02.008, 2010.
Middleton, N. J. and Goudie, A. S.: Saharan dust: sources and trajectories, T. I. Brit. Geogr., 26, 165–181, https://doi.org/10.1111/1475-5661.00013, 2001.
Molod, A., Takacs, L., Suarez, M., and Bacmeister, J.: Development of the GEOS-5 atmospheric general circulation model: evolution from MERRA to MERRA2, Geosci. Model Dev., 8, 1339–1356, https://doi.org/10.5194/gmd-8-1339-2015, 2015.
Mukkavilli, S. K., Prasad, A. A., Taylor, R. A., Huang, J., Troccoli, A., and Kay, M. J.: Assessment of atmospheric aerosols from two reanalysis products over Australia, Atmos. Res., 215, 149–164, 2019.
Müller, D., Ansmann, A., Mattis, I., Tesche, M., Wandinger, U., Althausen, D., and Pisani, G.: Aerosol-type-dependent lidar ratios observed with Raman lidar, J. Geophys. Res.-Atmos., 112, D16202, https://doi.org/10.1029/2006JD008292, 2007.
Nabat, P., Somot, S., Mallet, M., Michou, M., Sevault, F., Driouech, F., Meloni, D., di Sarra, A., Di Biagio, C., Formenti, P., Sicard, M., Léon, J.-F., and Bouin, M.-N.: Dust aerosol radiative effects during summer 2012 simulated with a coupled regional aerosol–atmosphere–ocean model over the Mediterranean, Atmos. Chem. Phys., 15, 3303–3326, https://doi.org/10.5194/acp-15-3303-2015, 2015.
N'Tchayi Mbourou, G., Berrand, J. J., and Nicholson, S. E.: The diurnal and seasonal cycles of wind-borne dust over Africa north of the equator, J. Appl. Meteorol., 36, 868–882, 1997.
Okin, G. S., Mahowald, N., Chadwick, O. A., and Artaxo, P.: Impact of desert dust on the biogeochemistry of phosphorus in terrestrial ecosystems, Global Biogeochem. Cy., 18, GB2005, https://doi.org/10.1029/2003GB002145, 2004.
Omar, A. H., Winker, D. M., Vaughan, M. A., Hu, Y., Trepte, C. R., Ferrare, R. A., Lee, K. P., Hostetler, C. A., Kittaka, C., Rogers, R. R., and Kuehn, R. E.: The CALIPSO Automated Aerosol Classification and Lidar Ratio Selection Algorithm, J. Atmos. Ocean. Tech., 26, 1994–2014, https://doi.org/10.1175/2009JTECHA1231.1, 2009.
Omar, A. H., Winker, D. M., Tackett, J. L., Giles, D. M., Kar, J., Liu, Z., Vaughan, M. A., Powell, K. A., and Trepte, C. R., CALIOP and AERONET aerosol optical depth comparisons: One size fits none, J. Geophys. Res.-Atmos., 118, 4748–4766, https://doi.org/10.1002/jgrd.50330, 2013.
O'Neill, N. T., Eck, T. F., Smirnov, A., Holben, B. N., and Thulasiraman, S.: Spectral discrimination of coarse and fine mode optical depth, J. Geophys. Res., 108, 4559–4573, https://doi.org/10.1029/2002JD002975, 2003.
Pease, P. P., Tchakerian, V. P., and Tindale, N. W.: Aerosols over the Arabian Sea: geochemistry and source areas for Aeolian desert dust, J. Arid Environ., 39, 477–496, https://doi.org/10.1006/jare.1997.0368, 1998.
Pérez, C., Nickovic, S., Pejanovic, G., Baldasano, J. M., and Özsoy, E.: Interactive dust-radiation modeling: A step to improve weather forecasts, J. Geophys. Res., 111, 1–17, 2006.
Pérez, C., Haustein, K., Janjic, Z., Jorba, O., Huneeus, N., Baldasano, J. M., Black, T., Basart, S., Nickovic, S., Miller, R. L., Perlwitz, J. P., Schulz, M., and Thomson, M.: Atmospheric dust modeling from meso to global scales with the online NMMB/BSC-Dust model – Part 1: Model description, annual simulations and evaluation, Atmos. Chem. Phys., 11, 13001–13027, https://doi.org/10.5194/acp-11-13001-2011, 2011.
Pérez García-Pando, C., Stanton, M. C., Diggle, P. J., Trzaska, S., Miller, R. L., Perlwitz, J. P., Baldasano, J. M., Cuevas, E., Ceccato, P., Yaka, P., and Thomson, M. C.: Soil Dust Aerosols and Wind as Predictors of Seasonal Meningitis Incidence in Niger, Environ. Health Perspect., 122, 679–686, https://doi.org/10.1289/ehp.1306640, 2014.
Peyridieu, S., Chédin, A., Capelle, V., Tsamalis, C., Pierangelo, C., Armante, R., Crevoisier, C., Crépeau, L., Siméon, M., Ducos, F., and Scott, N. A.: Characterisation of dust aerosols in the infrared from IASI and comparison with PARASOL, MODIS, MISR, CALIOP, and AERONET observations, Atmos. Chem. Phys., 13, 6065–6082, https://doi.org/10.5194/acp-13-6065-2013, 2013.
Proestakis, E., Amiridis, V., Marinou, E., Georgoulias, A. K., Solomos, S., Kazadzis, S., Chimot, J., Che, H., Alexandri, G., Binietoglou, I., Daskalopoulou, V., Kourtidis, K. A., de Leeuw, G., and van der A, R. J.: Nine-year spatial and temporal evolution of desert dust aerosols over South and East Asia as revealed by CALIOP, Atmos. Chem. Phys., 18, 1337–1362, https://doi.org/10.5194/acp-18-1337-2018, 2018.
Prospero, J. M.: Long-range transport of mineral dust in the global atmosphere: Impact of African dust on the environment of the southeastern United States, P. Natl. Acad. Sci. USA, 96, 3396–3403, 1999.
Prospero, J. M. and Mayol-Bracero, O. L.: Understanding the transport and impact of African dust on the Caribbean Basin, B. Am. Meteorol. Soc., 94, 1329–1335, 2013.
Prospero, J. M., Ginoux, P., Torres, O., Nicholson, S. E., and Gill, T. E.: Environmental characterization of global sources of atmospheric soil dust identified with the Nimbus 7 Total Ozone Mapping Spectrometer (TOMS) absorbing aerosol product, Rev. Geophys., 40, 2-1–2-31, 2002.
Querol, X., Tobías, A., Pérez, N., Karanasiou, A., Amato, F., Stafoggia, M., Pérez García-Pando, C., Ginoux, P., Forastiere, F., Gumy, S., P., and Alastuey, A.: Monitoring the impact of desert dust outbreaks for air quality for health studies, Environ. Int., 130, 104867, https://doi.org/10.1016/j.envint.2019.05.061, 2019.
Ramaswamy, V. P., Muraleedharan, M., and Prakash Babu, C.: Mid-troposphere transport of Middle-East dust over the Arabian Sea and its effect on rainwater composition and sensitive ecosystems over India, Sci. Rep.-UK, 7, 13676, https://doi.org/10.1038/s41598-017-13652-1, 2018.
Randles, C. A., da Silva, A. M., Buchard, V., Colarco, P. R., Darmenov, A., Govindaraju, R., Smirnov, A., Holben, B., Ferrare, R., Hair, J., Shinozuka, Y., Flynn, C. J., Randles, C. A., Silva, A. M. da, Buchard, V., Colarco, P. R., Darmenov, A., Govindaraju, R., Smirnov, A., Holben, B., Ferrare, R., Hair, J., Shinozuka, Y., and Flynn, C. J.: The MERRA-2 Aerosol Reanalysis, 1980 Onward. Part I: System Description and Data Assimilation Evaluation, J. Climate, 30, 6823–6850, https://doi.org/10.1175/JCLI-D-16-0609.1, 2017.
Rashki, A., Kaskaoutis, D. G., Francois, P., Kosmopoulos, P. G., and Legrand, M.: Dust-storm dynamics over Sistan region, Iran: seasonality, transport characteristics and affected areas, Aeol. Res., 16, 35–48, 2015.
Reid, J. S., Reid, E. A., Walker, A., Piketh, S., Cliff, S., Al Mandoos, A., Tsay, S.-C., and Eck, T. F.: Dynamics of southwest Asian dust particle size characteristics with implications for global dust research, J. Geophys. Res., 113, D14212, https://doi.org/10.1029/2007JD009752, 2008.
Remer, L. A., Tanre, D., Kaufman, Y. J., Ichoku, C., Mattoo, S., Levy, R., Chu, D. A., Holben, B., Dubovik, O., Smirnov, A., Martins, J. V., Li, R. R., and Ahmad, Z.: Validation of MODIS aerosol retrieval over ocean, Geophys. Res. Lett., 29, MOD3.1–MOD3.4, https://doi.org/10.1029/2001GL013204, 2002.
Remer, L. A., Kaufman, Y. J., Tanre, D., Mattoo, S., Chu, D. A., Martins, J. V., Li, R. R., Ichoku, C., Levy, R. C., Kleidman, R. G., Eck, T. F., Vermote, E., and Holben, B. N.: The MODIS aerosol algorithm, products, and validation, J. Atmos. Sci., 62, 947–973, https://doi.org/10.1175/JAS3385.1, 2005.
Remer, L. A., Kleidman, R. G., Levy, R. C., Kaufman, Y. J., Tanré, D., Mattoo, S., Martins, J. V., Ichoku, C., Koren, I., Yu, H. and Holben, B. N.: Global aerosol climatology from the MODIS satellite sensors, J. Geophys. Res.-Atmos., 113, D14S07, https://doi.org/10.1029/2007JD009661, 2008.
Ridley, D. A., Heald, C. L., Kok, J. F., and Zhao, C.: An observationally constrained estimate of global dust aerosol optical depth, Atmos. Chem. Phys., 16, 15097–15117, https://doi.org/10.5194/acp-16-15097-2016, 2016.
Rodríguez, S., Alastuey, A., and Querol, X.: A review of methods for long term in situ characterization of aerosol dust, Aeolian Res., 6, 55–74, https://doi.org/10.1016/j.aeolia.2012.07.004, 2012.
Sayer, A. M., Hsu, N. C., Bettenhausen, C., and Jeong, M.-J.: Validation and uncertainty estimates for MODIS Collection 6 “Deep Blue” aerosol data, J. Geophys. Res., 118, 7864–7873, https://doi.org/10.1002/jgrd.50600, 2013.
Sayer, A. M., Munchak, L. A., Hsu, N. C., Levy, R. C., Bettenhausen, C., and Jeong, M.-J.: MODIS Collection 6 aerosol products: comparison between aqua's e-deep blue, dark target, and “merged” data sets, and usage recommendations, J. Geophys. Res.-Atmos., 119, 13965–13989, https://doi.org/10.1002/2014JD022453, 2014.
Schepanski, K., Tegen, I., Laurent, B., Heinold, B., and Macke, A.: A new Saharan dust source activation frequency map derived from MSG-SEVIRI IR-channels, Geophys. Res. Lett., 34, L18803, https://doi.org/10.1029/2007GL030168, 2007.
Schepanski, K., Tegen, I., and Macke, A.: Comparison of satellite based observations of Saharan dust source areas, Remote Sens. Environ., 123, 90–97, 2012.
Schepanski, K., Heinold, B., and Tegen, I.: Harmattan, Saharan heat low, and West African monsoon circulation: modulations on the Saharan dust outflow towards the North Atlantic, Atmos. Chem. Phys., 17, 10223–10243, https://doi.org/10.5194/acp-17-10223-2017, 2017.
Schepanski, K.: Transport of Mineral Dust and Its Impact on Climate, Geosciences, 8, 151, https://doi.org/10.3390/geosciences8050151, 2018.
Schuster, G. L., Vaughan, M., MacDonnell, D., Su, W., Winker, D., Dubovik, O., Lapyonok, T., and Trepte, C.: Comparison of CALIPSO aerosol optical depth retrievals to AERONET measurements, and a climatology for the lidar ratio of dust, Atmos. Chem. Phys., 12, 7431–7452, https://doi.org/10.5194/acp-12-7431-2012, 2012.
Shi, Y., Zhang, J., Reid, J. S., Holben, B., Hyer, E. J., and Curtis, C.: An analysis of the collection 5 MODIS over-ocean aerosol optical depth product for its implication in aerosol assimilation, Atmos. Chem. Phys., 11, 557–565, https://doi.org/10.5194/acp-11-557-2011, 2011.
Sinyuk, A., Holben, B. N., Eck, T. F., Giles, D. M., Slutsker, I., Korkin, S., Schafer, J. S., Smirnov, A., Sorokin, M., and Lyapustin, A.: The AERONET Version 3 aerosol retrieval algorithm, associated uncertainties and comparisons to Version 2, Atmos. Meas. Tech., 13, 3375–3411, https://doi.org/10.5194/amt-13-3375-2020, 2020.
Sokolik, I. N. and Toon, O. B.: Direct radiative forcing by anthropogenic airborne mineral aerosols, Nature, 381, 681–683, https://doi.org/10.1038/381681a0, 1996.
Solomos, S., Kalivitis, N., Mihalopoulos, N., Amiridis, V., Kouvarakis, G., Gkikas, A., Binietoglou, I., Tsekeri, A., Kazadzis, S., Kottas, M., Pradhan, Y., Proestakis, E., Nastos, P. T., and Marenco, F.: From Tropospheric Folding to Khamsin and Foehn Winds: How Atmospheric Dynamics Advanced a Record-Breaking Dust Episode in Crete, Atmosphere-Basel, 9, 240, https://doi.org/10.3390/atmos9070240, 2018.
Stefanski, R. and Sivakumar, M. V. K.: Impacts of sand and dust storms on agriculture and potential agricultural applications of a SDSWS, IOP Conf. Ser.: Earth Environ. Sci., 7, 012016, https://doi.org/10.1088/1755-1307/7/1/012016, 2009.
Stephens, G. L., Vane, D. G., Boain, R. J., Mace, G. G., Sassen, K., Wang, Z. E., Illingworth, A. J., O'Connor, E. J., Rossow, W. B., Durden, S. L., Miller, S. D., Austin, R. T., Benedetti, A., and Mitrescu, C.: The cloudsat mission and the a-train – A new dimension of space-based observations of clouds and precipitation, B. Am. Meteorol. Soc., 83, 1771–1790, https://doi.org/10.1175/BAMS-83-12-1771, 2002.
Sun, E., Xu, X., Che, H., Tang, Z., Gui, K., An, L., Lu, C., and Shi, G.: Variation in MERRA-2 aerosol optical depth and absorption aerosol optical depth over China from 1980 to 2017, J. Atmos. Sol.-Terr. Phys., 186, 8–19, https://doi.org/10.1016/j.jastp.2019.01.019, 2019.
Sun, Y., Chen, H., Tada, R., Weiss, D., Lin, M., Toyoda, S., Yan, Y., and Isozaki, Y.: ESR signal intensity and crystallinity of quartz from Gobi and sandy deserts in East Asia and implication for tracing Asian dust provenance, Geochem. Geophys. Geosys., 14, 2615–2627, https://doi.org/10.1002/ggge.20162, 2013.
Tackett, J. L., Winker, D. M., Getzewich, B. J., Vaughan, M. A., Young, S. A., and Kar, J.: CALIPSO lidar level 3 aerosol profile product: version 3 algorithm design, Atmos. Meas. Tech., 11, 4129–4152, https://doi.org/10.5194/amt-11-4129-2018, 2018.
Tafuro, A. M., Barnaba, F., De Tomasi, F., Perrone, M. R., and Gobbi, G. P.: Saharan dust particle properties over the central Mediterranean, Atmos. Res., 81, 67–93, 2006.
Textor, C., Schulz, M., Guibert, S., Kinne, S., Balkanski, Y., Bauer, S., Berntsen, T., Berglen, T., Boucher, O., Chin, M., Dentener, F., Diehl, T., Easter, R., Feichter, H., Fillmore, D., Ghan, S., Ginoux, P., Gong, S., Grini, A., Hendricks, J., Horowitz, L., Huang, P., Isaksen, I., Iversen, I., Kloster, S., Koch, D., Kirkevåg, A., Kristjansson, J. E., Krol, M., Lauer, A., Lamarque, J. F., Liu, X., Montanaro, V., Myhre, G., Penner, J., Pitari, G., Reddy, S., Seland, Ø., Stier, P., Takemura, T., and Tie, X.: Analysis and quantification of the diversities of aerosol life cycles within AeroCom, Atmos. Chem. Phys., 6, 1777–1813, https://doi.org/10.5194/acp-6-1777-2006, 2006.
Toledano, C., Cachorro, V. E., Berjon, A., De Frutos, A. M., Sorribas, M., De la Morena, B. A., and Goloub, P.: Aerosol optical depth and Ångström exponent climatology at El Arenosillo AERONET site (Huelva, Spain), Q. J. Roy. Meteor. Soc., 133, 795–807, 2007.
Torres, O., Bhartia, P. K., Herman, J. R., Ahmad, Z., and Gleason, J.: Derivation of aerosol properties from satellite measurements of backscattered ultraviolet radiation: Theoretical basis, J. Geophys. Res., 103, 17099–17110, https://doi.org/10.1029/98JD00900, 1998.
Torres, O., Bhartia, P. K., Jethva, H., and Ahn, C.: Impact of the ozone monitoring instrument row anomaly on the long-term record of aerosol products, Atmos. Meas. Tech., 11, 2701–2715, https://doi.org/10.5194/amt-11-2701-2018, 2018.
Tsikerdekis, A., Zanis, P., Steiner, A. L., Solmon, F., Amiridis, V., Marinou, E., Katragkou, E., Karacostas, T., and Foret, G.: Impact of dust size parameterizations on aerosol burden and radiative forcing in RegCM4, Atmos. Chem. Phys., 17, 769–791, https://doi.org/10.5194/acp-17-769-2017, 2017.
Vandenbussche, S., Kochenova, S., Vandaele, A. C., Kumps, N., and De Mazière, M.: Retrieval of desert dust aerosol vertical profiles from IASI measurements in the TIR atmospheric window, Atmos. Meas. Tech., 6, 2577–2591, https://doi.org/10.5194/amt-6-2577-2013, 2013.
Vandenbussche, S., Callewaert, S., Schepanski, K., and De Mazière, M.: North African mineral dust sources: new insights from a combined analysis based on 3D dust aerosols distributions, surface winds and ancillary soil parameters, Atmos. Chem. Phys. Discuss., https://doi.org/10.5194/acp-2020-130, in review, 2020.
Vaughan, M. A., Powell, K. A., Kuehn, R. E., Young, S. A., Winker, D. M., Hostetler, C. A., Hunt, W. H., Liu, Z., McGill, M. J., and Getzewich, B. J.: Fully Automated Detection of Cloud and Aerosol Layers in the CALIPSO Lidar Measurements, J. Atmos. Ocean. Technol., 26, 2034–2050, https://doi.org/10.1175/2009JTECHA1228.1, 2009.
Veselovskii, I., Goloub, P., Podvin, T., Tanre, D., da Silva, A., Colarco, P., Castellanos, P., Korenskiy, M., Hu, Q., Whiteman, D. N., Pérez-Ramírez, D., Augustin, P., Fourmentin, M., and Kolgotin, A.: Characterization of smoke and dust episode over West Africa: comparison of MERRA-2 modeling with multiwavelength Mie–Raman lidar observations, Atmos. Meas. Tech., 11, 949–969, https://doi.org/10.5194/amt-11-949-2018, 2018.
Vickery, K. J., Eckardt, F. D., and Bryant, R. G.: A sub-basin scale dust plume source frequency inventory for south-ern Africa, 2005–2008, Geophys. Res. Lett., 40, 5274–5279, https://doi.org/10.1002/grl.50968, 2013.
Voss, K. K. and Evan, A. T.: A new satellite-based global climatology of dust aerosol optical depth, J. Appl. Meteorol. Climatol., 59, 83–120, https://doi.org/10.1175/jamc-d-19-0194.1, 2020.
Wandinger, U., Tesche, M., Seifert, P., Ansmann, A., Müller, D., and Althausen, D.: Size matters: Influence of multiple scattering on CALIPSO light-extinction profiling in desert dust, Geophys. Res. Lett., 37, L10801, https://doi.org/10.1029/2010GL042815, 2010.
Washington, R., Todd, M., Middleton, N. J., and Goudie, A. S.: Dust-storm source areas determined by the total ozone monitoring spectrometer and surface observations, Ann. Assoc. Am. Geogr., 93, 297–313, https://doi.org/10.1111/1467-8306.9302003, 2003.
Wei, J., Peng, Y., Mahmood, R., Sun, L., and Guo, J.: Intercomparison in spatial distributions and temporal trends derived from multi-source satellite aerosol products, Atmos. Chem. Phys., 19, 7183–7207, https://doi.org/10.5194/acp-19-7183-2019, 2019a.
Wei, J., Li, Z., Peng, Y., and Sun, L.: MODIS Collection 6.1 aerosol optical depth products over land and ocean: validation and comparison, Atmos. Environ., 201, 428–440, 2019b.
Weinzierl, B., Sauer, D., Minikin, A., Reitebuch, O., Dahlkotter, F., Mayer, B., Emde, C., Tegen, I., Gasteiger, J., Petzold, A., Veira, A., Kueppers, U., and Schumann, U.: On the visibility of airborne volcanic ash and mineral dust from the pilot's perspective in flight, Phys. Chem. Earth, 45–46, 87–102, 10.1016/j.pce.2012.04.003, 2012.
Winker, D. M., Vaughan, M. A., Omar, A., Hu, Y., Powell, K. A., Liu, Z., Hunt, W. H., and Young, S. A.: Overview of the CALIPSO Mission and CALIOP Data Processing Algorithms, J. Atmos. Oceanic Technol., 26, 2310–2323, https://doi.org/10.1175/2009JTECHA1281.1, 2009.
Winker, D. M., Pelon, J., Coakley, J. A., Ackerman, S. A., Charlson, R. J., Colarco, P. R., Flamant, P., Fu, Q., Hoff, R. M., Kittaka, C., Kubar, T. L., Le Treut, H., McCormick, M. P., Megie, G., Poole, L., Powell, K., Trepte, C., Vaughan, M. A., and Wielicki, B. A.: THE CALIPSO MISSION A Global 3D View of Aerosols and Clouds, B. Am. Meteorol. Soc., 91, 1211–1229, https://doi.org/10.1175/2010BAMS3009.1, 2010.
Wu, W. S., Purser, R. J., and Parrish, D. F.: Three-dimensional variational analysis with spatially inhomogeneous covariances, Mon. Weather Rev., 130, 2905–2916, https://doi.org/10.1175/1520-0493(2002)130<2905:TDVAWS>2.0.CO;2, 2002.
Young, S. A. and Vaughan, M. A.: The retrieval of profiles of particulate extinction from Cloud Aerosol Lidar Infrared Pathfinder Satellite Observations (CALIPSO) data: Algorithm description, J. Atmos. Ocean. Technol., 26, 1105–1119, https://doi.org/10.1175/2008JTECHA1221.1, 2009.
Yu, H., Remer, L. A., Chin, M., Bian, H., Kleidman, R. G., and Diehl, T.: A satellite-based assessment of transpacific transport of pollution aerosol, J. Geophys. Res.-Atmos., 113, D14S12, https://doi.org/10.1029/2007JD009349, 2008.
Yu, H. B., Chin, M., Winker, D. M., Omar, A. H., Liu, Z. Y., Kittaka, C., and Diehl, T.: Global view of aerosol vertical distributions from CALIPSO lidar measurements and GOCART simulations: Regional and seasonal variations, J. Geophys. Res.-Atmos., 115, D00H30, https://doi.org/10.1029/2009jd013364, 2010.
Yu, H. B., Chin, M., Yuan, T. L., Bian, H. S., Remer, L. A., Prospero, J. M., Omar, A., Winker, D., Yang, Y. K., Zhang, Y., Zhang, Z. B., and Zhao, C.: The fertilizing role of African dust in the Amazon rainforest: A first multiyear assessment based on data from Cloud-Aerosol Lidar and Infrared Pathfinder Satellite Observations, Geophys. Res. Lett., 42, 1984–1991, https://doi.org/10.1002/2015gl063040, 2015.
Yu, S., Eder, B., Dennis, R., Chu, S. H., and Schwartz, S. E.: New unbiased symmetric metrics for evaluation of air quality models, Atmos. Sci. Lett., 7, 26–34, 2006.
Yu, Y., Notaro, M., Liu, Z., Kalashnikova, O., Alkolibi, F., Fadda, E., and Bakhrjy, F.: Assessing temporal and spatial variations in atmospheric dust over Saudi Arabia through satellite, radiometric, and station data, J. Geophys. Res.-Atmos., 118, 13253–13264, https://doi.org/10.1002/2013JD020677, 2013.
Yu, Y., Kalashnikova, O. V., Garay, M. J., and Notaro, M.: Climatology of Asian dust activation and transport potential based on MISR satellite observations and trajectory analysis, Atmos. Chem. Phys., 19, 363–378, https://doi.org/10.5194/acp-19-363-2019, 2019.
Zender, C. S., Huisheng, B., and Newman, D.: Mineral Dust Entrainment and Deposition (DEAD) model: Description and 1990s dust climatology, J. Geophys. Res., 108, 4416, https://doi.org/10.1029/2002JD002775, 2003.
Zender, C. S., Miller, R. L. L., and Tegen, I.: Quantifying mineral dust mass budgets: Terminology, constraints, and current estimates, Eos, Transactions American Geophysical Union, 85, 509–512, https://doi.org/10.1029/2004EO480002, 2011.
Zhang, J. and Reid, J. S.: MODIS aerosol product analysis for data assimilation: Assessment of over-ocean level 2 aerosol optical thickness retrievals, J. Geophys. Res.-Atmos., 111, D22207, https://doi.org/10.1029/2005JD006898, 2006.