the Creative Commons Attribution 4.0 License.
the Creative Commons Attribution 4.0 License.
 | 30 Apr 2021
Intercomparison and characterization of 23 Aethalometers under laboratory and ambient air conditions: procedures and unit-to-unit variabilities
Griša Močnik
Luka Drinovec
Thomas Müller
Sascha Pfeifer
María Cruz Minguillón
Björn Briel
Paul Buckley
Vadimas Dudoitis
Javier Fernández-García
María Fernández-Amado
Joel Ferreira De Brito
Veronique Riffault
Harald Flentje
Eimear Heffernan
Nikolaos Kalivitis
Athina-Cerise Kalogridis
Hannes Keernik
Luminita Marmureanu
Krista Luoma
Angela Marinoni
Michael Pikridas
Gerhard Schauer
Norbert Serfozo
Henri Servomaa
Gloria Titos
Jesús Yus-Díez
Natalia Zioła
Alfred Wiedensohler
Aerosolized black carbon is monitored worldwide to quantify its impact on air quality and climate. Given its importance, measurements of black carbon mass concentrations must be conducted with instruments operating in quality-checked and ensured conditions to generate data which are reliable and comparable temporally and geographically.
In this study, we report the results from the largest characterization and intercomparison of filter-based absorption photometers, the Aethalometer model AE33, belonging to several European monitoring networks. Under controlled laboratory conditions, a total of 23 instruments measured mass concentrations of black carbon from three well-characterized aerosol sources: synthetic soot, nigrosin particles, and ambient air from the urban background of Leipzig, Germany. The objective was to investigate the individual performance of the instruments and their comparability; we analyzed the response of the instruments to the different aerosol sources and the impact caused by the use of obsolete filter materials and the application of maintenance activities.
Differences in the instrument-to-instrument variabilities from equivalent black carbon (eBC) concentrations reported at 880 nm were determined before maintenance activities (for soot measurements, average deviation from total least square regression was −2.0 % and the range −16 % to 7 %; for nigrosin measurements, average deviation was 0.4 % and the range −15 % to 17 %), and after they were carried out (for soot measurements, average deviation was −1.0 % and the range −14 % to 8 %; for nigrosin measurements, the average deviation was 0.5 % and the range −12 % to 15 %). The deviations are in most of the cases explained by the type of filter material employed by the instruments, the total particle load on the filter, and the flow calibration.
The results of this intercomparison activity show that relatively small unit-to-unit variability of AE33-based particle light absorbing measurements is possible with well-maintained instruments. It is crucial to follow the guidelines for maintenance activities and the use of the proper filter tape in the AE33 to ensure high quality and comparable black carbon (BC) measurements among international observational networks.
- Article
(5699 KB) - Full-text XML
-
Supplement
(1839 KB) - BibTeX
- EndNote


The impact of black carbon (BC) on climate, health, and human activities prioritizes the observation of BC mass concentration and its optical properties in different environments. In the atmosphere, BC absorbs solar radiation from the visible to the infrared optical spectrum, causing visibility degradation and making it the second most important radiative forcer (Ramanathan and Carmichael, 2008). Black carbon particles modify the lifetime, distribution, and formation processes of clouds because they can act as cloud condensation nuclei, ice nuclei (predominantly in the cirrus temperature range), and modify clouds' internal mixing state; they therefore alter cloud albedo (Koch et al., 2011; Bond et al., 2013; Chen et al., 2018; Wex et al., 2019). BC is also well-known as an air pollutant, affecting human health since it serves as a carrier of multiple toxic substances, which are harmful for the respiratory system, cardiac function, and the immune system (Janssen et al., 2011; WHO, 2012). In consequence, networks for the observation of atmospheric black carbon are growing and need to be maintained worldwide. BC measurements provide base information to develop and track strategies aimed to reduce and manage air pollution and climate change.
The understanding of the spatial and temporal variability of BC and its collateral effects requires reliable, highly time-resolved, and long-term observations. To achieve this, three main aspects must be fulfilled during BC monitoring: (i) appropriate performance and quality check of the monitoring instruments, (ii) standardized use and maintenance by the operators, and (iii) reliable transmission and validation of data. The non-compliance of these requirements challenges the accuracy and comparability of BC observations.
Defined as the most refractory portion of particles produced in combustion processes, with a strong light absorption capacity (Petzold et al., 2013), diverse techniques are available to measure black carbon in the atmosphere. Depending on the measurement technique, BC may be addressed by different terminologies. When thermal methods are used, black carbon is measured as the non-volatilized carbon remaining after applying specific high temperature to the sample; therefore BC is called elemental carbon (EC). In laser-induced incandescence techniques, the sample is heated to vaporization temperatures using an infrared laser and the thermal radiation emitted by incandescent black carbon is measured and then converted to mass concentration; here, we measure BC as refractory black carbon (rBC). When optical methods are used, the mass concentration of black carbon is indirectly retrieved from optical measurements of light attenuation caused by the aerosol particles – the determined quantity is equivalent to the mass concentration and therefore called equivalent black carbon (eBC; see Petzold et al., 2013). This method employs an external conversion factor known as the mass absorption cross section (MAC) to estimate the eBC mass concentrations. Other techniques used to measure black carbon include chemical oxidation and Raman spectroscopy (Bond et al., 2013; Lack et al., 2014).
In optical methods, the aerosol particle light absorption is measured either on the particles collected on a filter (filter-based absorption photometers) or measured directly in the aerosols suspended in a sample of air (photo-thermal spectrometers). In field monitoring, the filter-based absorption photometers (named FBAPs in this document) are widely used to perform long-term BC measurements because these are robust, they require relatively low human intervention, and no laboratory analysis is needed to process the sample. The Aethalometer (Hansen et al., 1982), an instrument quantifying the transmission of light through a filter where the aerosol particles are collected, is one of the commonly used FBAP instruments. The difference between the light from an internal source transmitted through the sample-laden filter relative to the clean part of the filter is used to calculate the attenuation coefficient. The attenuation is transformed to absorption and later to eBC mass concentration using the black carbon mass absorption cross section and filter properties; these two lasts steps involve the use of fixed correction factors and a compensation algorithm. Further description about the functioning of the instrument is given in Sect. 2.1.
According to EBAS database (Tørseth et al., 2012), in the last 10 years (2011–2020) a total of 57 European stations or sites have reported data from particle light absorption measurements using filter-based photometers, including Aethalometers. These measurements contribute to networks and projects such as ACTRIS (41 sites) and EMEP (European Monitoring and Evaluation Programme, five sites) among others, and some stations may contribute to more than one network at the time. Data from stations using FBAP in 29 non-European countries are also available in EBAS. The COST Action CA16109 Chemical On-Line cOmpoSition and Source Apportionment of fine aerosoL COLOSSAL, reports in its catalogue the cooperation with 49 sites using FBAP in Europe.
Despite their wide use, the FBAPs, and particularly the Aethalometers, feature inherent artifacts increasing the uncertainty in the measurements (Collaud Coen et al., 2010; Müller et al., 2011; Saturno et al., 2017). In the first place, these instruments do not quantify directly either the absorption or the eBC mass concentration; these are instead estimated from the measurements of light attenuation caused by the aerosol particles. The absorption coefficients and concentrations are calculated based on different parametrizations and corrections for the absorption enhancement due to light scattering in the sample-laden filter matrix. In fact, the filter material used in the Aethalometer and the particles collected in it scatter a portion of the incident light reducing the transmission of it through the filter (Weingartner et al., 2003). Therefore, a reduction in the light transmitted may be taken as a higher absorption, with an additional small cross-sensitivity to scattering. A second artifact is caused by the loading effect produced by the aerosol particles accumulated in the filter matrix (Weingartner et al., 2003; Virkkula et al., 2007). After particles are deposited, the detection of changes in the attenuation decreases, causing an underestimation of black carbon absorption and, in consequence, lower eBC concentrations (Drinovec et al., 2015, 2017).
The characterization of Aethalometers is therefore required to understand and reduce the variability and uncertainty in the measurements of BC, and this can be done by comparison experiments (EEA, 2013; WMO, 2016). The intercomparison consists of placing two or more instruments to measure the same sample under equal conditions and time. By intercomparing, it is possible to study the instrument sensitivities to different aerosol sources and concentrations, the deviations caused by the type of filter material and numerical corrections used by the instruments, and the effects from different operational and maintenance procedures.
One of the first documented Aethalometer intercomparisons was performed by Ruoss et al. (1993), contrasting ambient air measurements performed by the DLR Aethalometer (DLR Research Centre) and the Hansen-type Aethalometer (Magee Scientific); the authors found a significant variability of up to 50 % among both instruments. In 1999, Hitzenberger et al. (1999) intercompared the absorption measurements carried out by an integrating sphere and one Aethalometer (Hansen et al., 1984) using different filter materials; the Aethalometer underestimated the absorption coefficients in the range of −26 % to −66 % when using quartz fiber filters; while using glass fiber and membrane filters, the Aethalometer overestimated the absorption by up to 34 %. Hitzenberger et al. (2006) compared a wide range of optical and thermal methods measuring ambient air aerosols. The Aethalometer AE9 reported higher eBC concentrations when compared against a multiangle absorption photometer (MAAP) (11.5 %) and a thermal–optical transmission (TOT) method (19 %). In the same study, when compared against an integrating sphere, the Aethalometer showed lower concentrations (−5 %). Collaud Coen et al. (2010) compared the absorption coefficients reported by Aethalometers (AE10, AE16, and AE31) and MAAP in four different locations; depending on the algorithms used to correct the loading effect in the Aethalometers, these instruments overestimated the absorption coefficients reported by the MAAP by 1 % to 33 %.
Although widely used, few experiments have been performed in order to characterize and compare the most recent generation of filter-based absorption photometers used in BC monitoring (Drinovec et al., 2015). Extensive intercomparisons are fundamental to determine the variability among instruments from stations supporting international collaborative projects. They contribute to identifying and quantifying the factors influencing the instruments' performance.
In this investigation, the authors present the results from the largest intercomparison of Aethalometer model AE33, where 23 instruments were characterized and measured BC mass concentrations from three different aerosol sources. The main goal is to determine the unit-to-unit variabilities and their tendencies throughout the spectral range covered by the AE33. Also, we studied the influence of the maintenance activities and accessories used by the instruments on the reported eBC concentrations. In the end, we provide a series of recommendations for the instrument operation and maintenance.
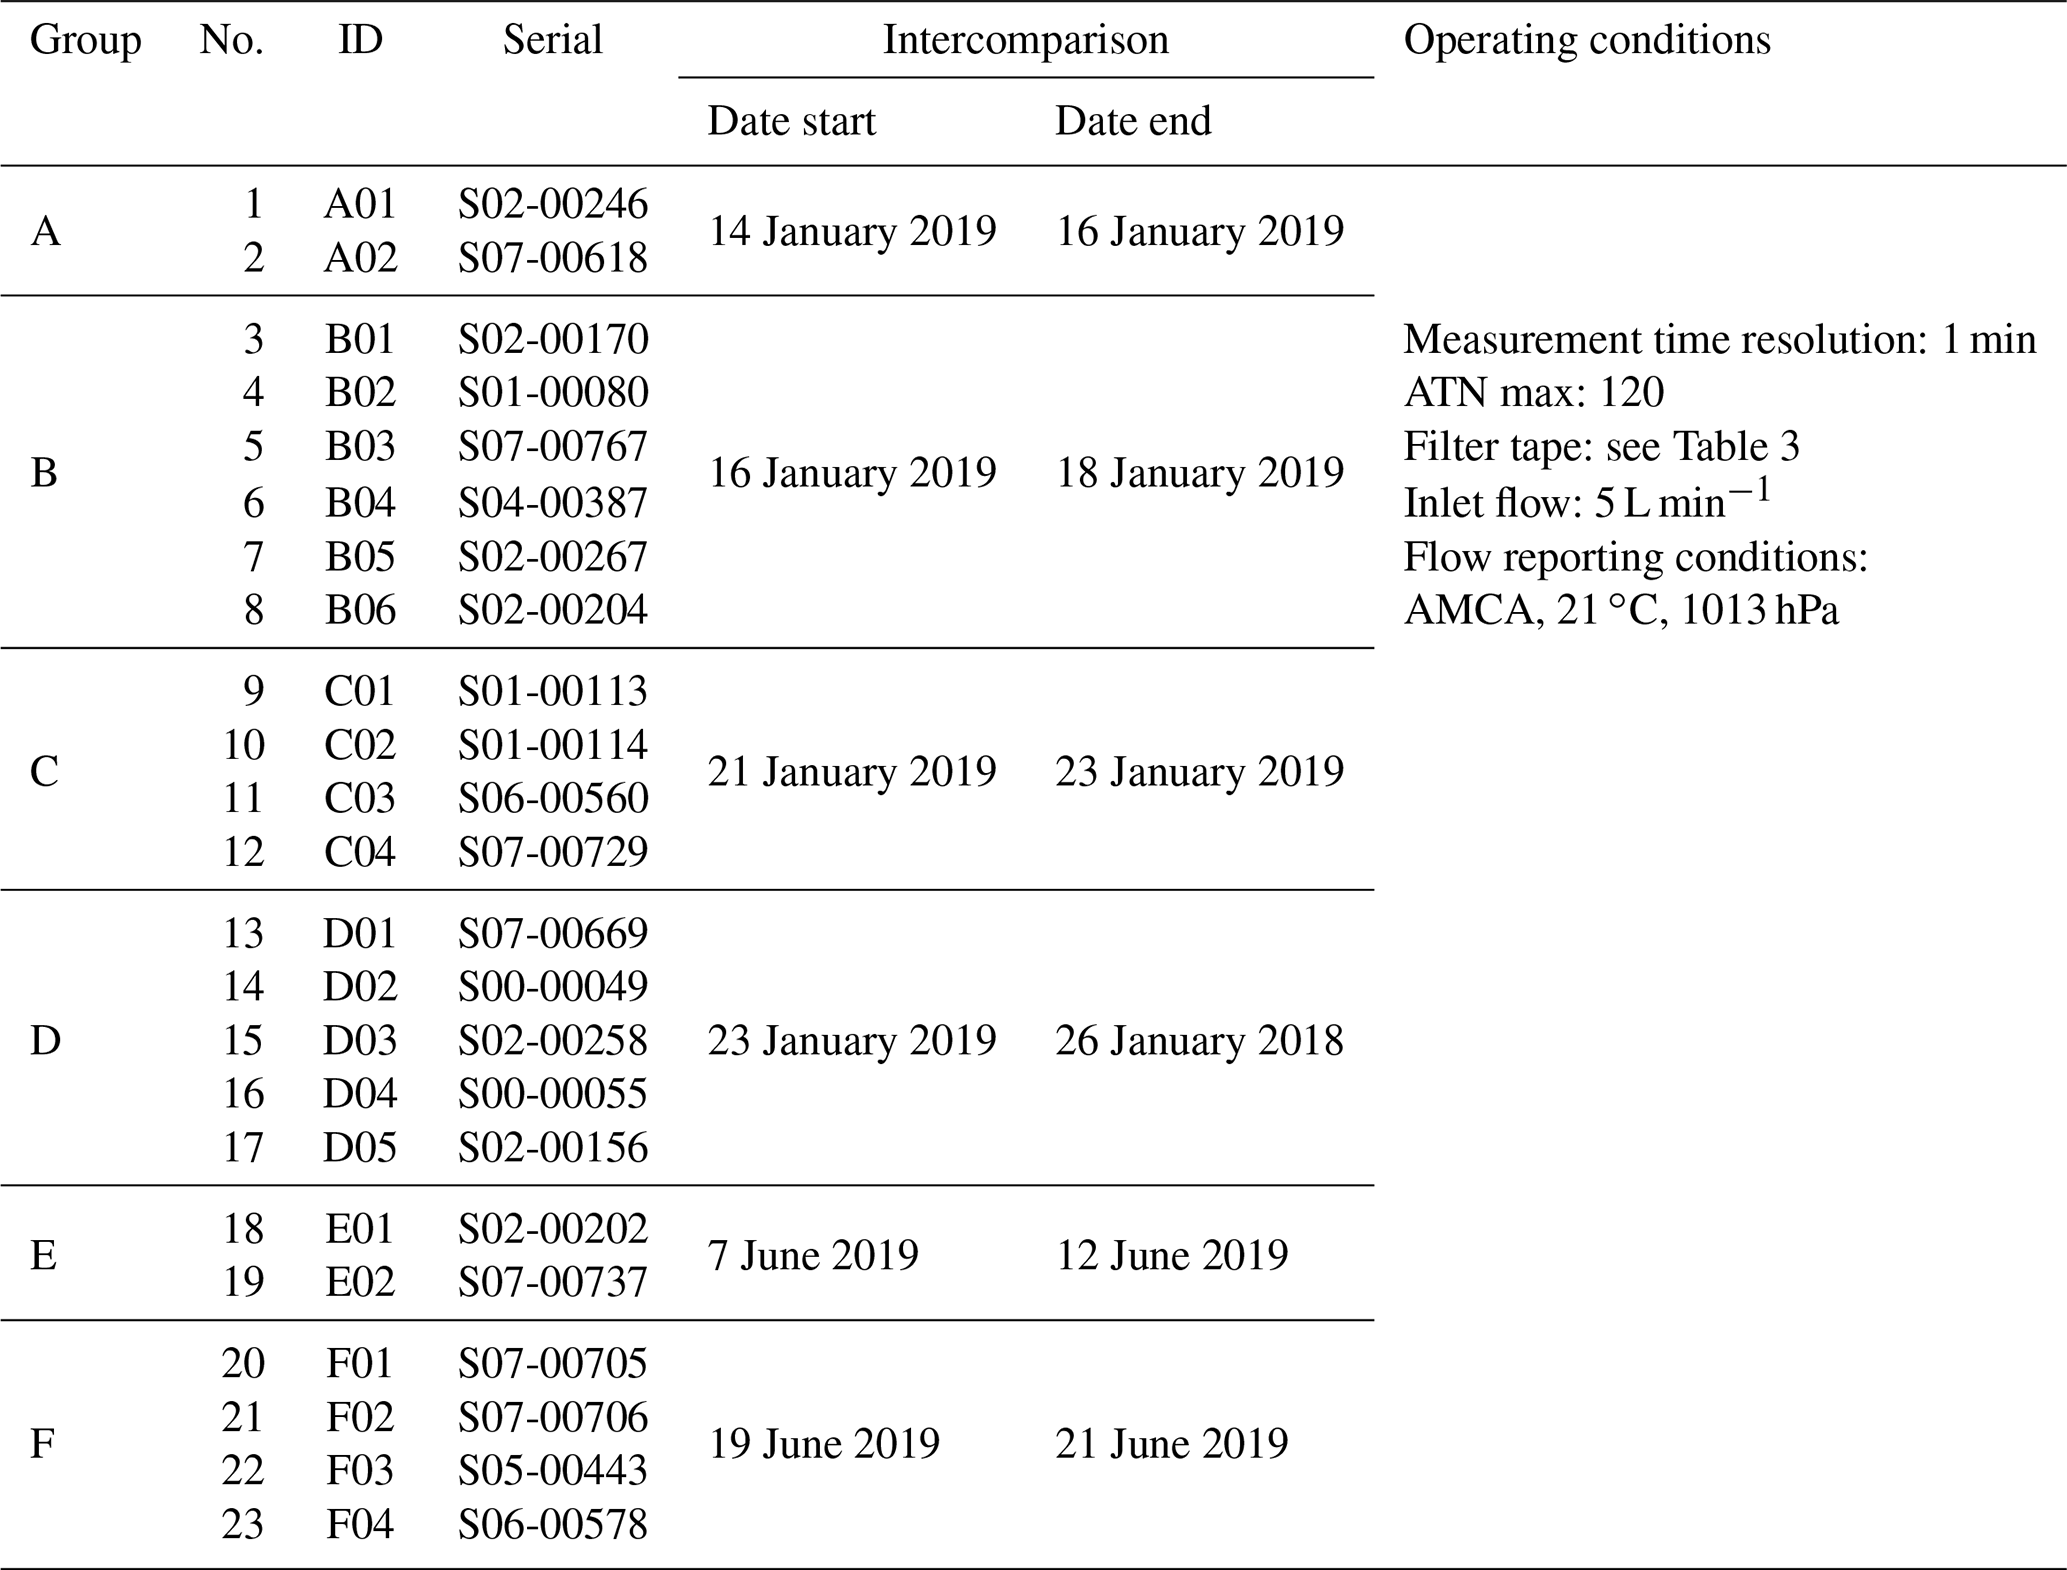
The intercomparisons of Aethalometers were conducted in three laboratory workshops at the World Calibration Centre for Aerosol Physics (WCCAP) in Leipzig, Germany. During the first workshop (14 to 25 January 2019), the characterization of 17 AE33 part of the COST action CA16109 COLOSSAL and ACTRIS (Table 1) was performed. In this first experiment, the instruments were divided into four separated groups (A, B, C, D), due to space limitations in the laboratory which did not permit us to perform a simultaneous intercomparison. The instruments from each group completed 2.5 to 3 d of measurements. In the second workshop (7 to 12 June 2019), two Aethalometers AE33, designated as group E, were intercompared. Finally, four Aethalometers, comprising group F, were intercompared during the third workshop (18 to 20 June 2019). Instruments in groups E and F do not form part of COLOSSAL; they belong to German research and regional monitoring organizations. The same WCCAP reference instrumentation setup was used in all three workshops.
2.1 The Aethalometer AE33 and the compensation of eBC concentrations
The Aethalometer AE33 (Drinovec et al., 2015) uses a dual spot system to compensate for the loading effect artifact. It calculates the absorption and the compensated for eBC concentrations from measurements of light transmission at seven wavelengths from the near-UV to the near-IR (370, 470, 520, 590, 660, 880, and 950 nm).
The operation principle of the Aethalometer consists of the continuous collection of aerosols on a filter, forming a sample-laden spot. A light source illuminates the spot on the filter and, on the opposite side, a sensor measures the intensity of light transmitted through it (signal I). The light transmission is also measured through a sample-free area on the filter and is used as reference (signal I0). By using both signals, it is possible to calculate an attenuation (ATN; Eq. 1).
where the factor 100 is present for convenience only and ATN/100 should be used in further calculations. In the Aethalometer, the change in the attenuation with time is assumed to be caused by the increase in black carbon mass deposited on the filter. However, it was demonstrated that the correlation between the attenuation and the aerosol load on the filter is not linear at high attenuations (Gundel et al., 1984). Over time, the particles accumulated on the filter “shadow” each other, reducing the optical path length, saturating the signal and therefore the measurement of light transmission. This condition is known as the loading effect and causes an underestimation of eBC concentrations. It is a cumulative property that needs to be calculated in real time to accurately report eBC mass concentrations (Drinovec et al., 2015).
To overcome the loading effect, the AE33 collects the aerosol sample in two spots (S1 and S2) on the filter. Each spot is collected with a different airflow rate, and the spot with higher flow becomes more loaded with sample (Fig. 1). The instrument measures the light transmission through both spots and calculates two attenuations (ATN1 and ATN2, using Eq. 1) for the seven wavelengths of the instrument light source. The dual system allows us to estimate a compensation parameter (k), based on the proportionality from the loading of both spots to their airflows (F1 from S1 and F2 from S2), as shown in Eq. (2):
where the compensation parameter k, representing the loading effect, will be equivalent for both spots as they are loaded with the same sample of aerosols. Equation (2) is used to calculate the instantaneous compensation for each wavelength k(λ).

The calculation of the absorption coefficient is the intermediate step between the measured ATN and the calculated eBC mass. The absorption coefficient that is non-compensated for loading (babs(λ)non comp.) is calculated as shown in Eq. (3):
where s is the spot area (constant, 0.785 cm2), F1 is the air flow through spot 1 (measured), ζ is the leakage factor (constant adjustable, depends on the filter material and the leakage test), ATN1(λ) is the attenuation calculated for spot 1, ΔATN1(λ) is the change in the attenuation at each wavelength in a given time step Δt, and C is the correction parameter for the multiple-scattering enhancement. The particles and the filter may scatter a portion of light incident from the light source, increasing the optical path of the light in the filter and increasing the probability of light being absorbed, i.e., a light absorption enhancement. In the AE33 the user sets a constant value of C; there are specific values available for each type of filter tape (Magee Scientific, 2018); nevertheless, multiple studies have shown this C factor depends also on the source of the aerosols measured (Collaud Coen et al., 2010; Ajtai et al., 2019), but this topic is beyond the scope of this investigation.
The compensation parameter k is used to correct the loading effect and calculate the compensated absorption coefficient (babs(λ)comp.) as follows:
Finally, the compensated absorption coefficient and the BC mass absorption cross section (σair(λ), external fixed constants in the instrument) are used to calculate the compensated eBC mass concentrations at seven wavelengths (eBC(λ)comp.), as shown in Eq. (4):
2.2 Intercomparison procedure
The workshops were performed in three sessions (Fig. 2):
-
Initial comparison. During the first day the instruments were connected to the mixing chamber and started the measurements of urban background aerosols from Leipzig conserving the internal configuration and accessories provided by the operators. The instrument time was synchronized, and only the measurement time resolution (1 min), the flow reporting standard (AMCA: 21.1 ∘C, 1013 hPa), and the maximum attenuation limit (ATN =120) were modified. After approximately 1 h of ambient air measurements, synthetic soot produced with a miniCAST 5203 (Table 2) was supplied to the mixing chamber, followed by nigrosin particles (see Sect. 2.4), particle-free air, and ambient air. The initial comparison was performed with the aim to (i) allow the adjustment of the internal compensation parameters k(λ) to the local conditions and (ii) determine the initial variability and deviation of the Aethalometers before the maintenance and calibration procedures.
-
Maintenance and calibration. The maintenance included a series of procedures performed by following the instructions given in the AE33 user manual – version 1.57 (Magee Scientific, 2018):
-
flow verification test, using an externally calibrated flowmeter (Table 2);
-
cleaning of the optical chamber;
-
flow calibration, performed only in those instruments with non-acceptable results from the flow verification test (deviations >10 %);
-
leakage test;
-
replacement of the filter tape, performed for instruments using a different filter tape to the one recommended currently (M8060).
-
-
Final comparison. The Aethalometers measured the same three aerosol sources used in the initial comparison (synthetic soot, nigrosin particles, ambient) and particle-free air. The goal was to determine the new instrument-to-instrument variabilities after maintenance.
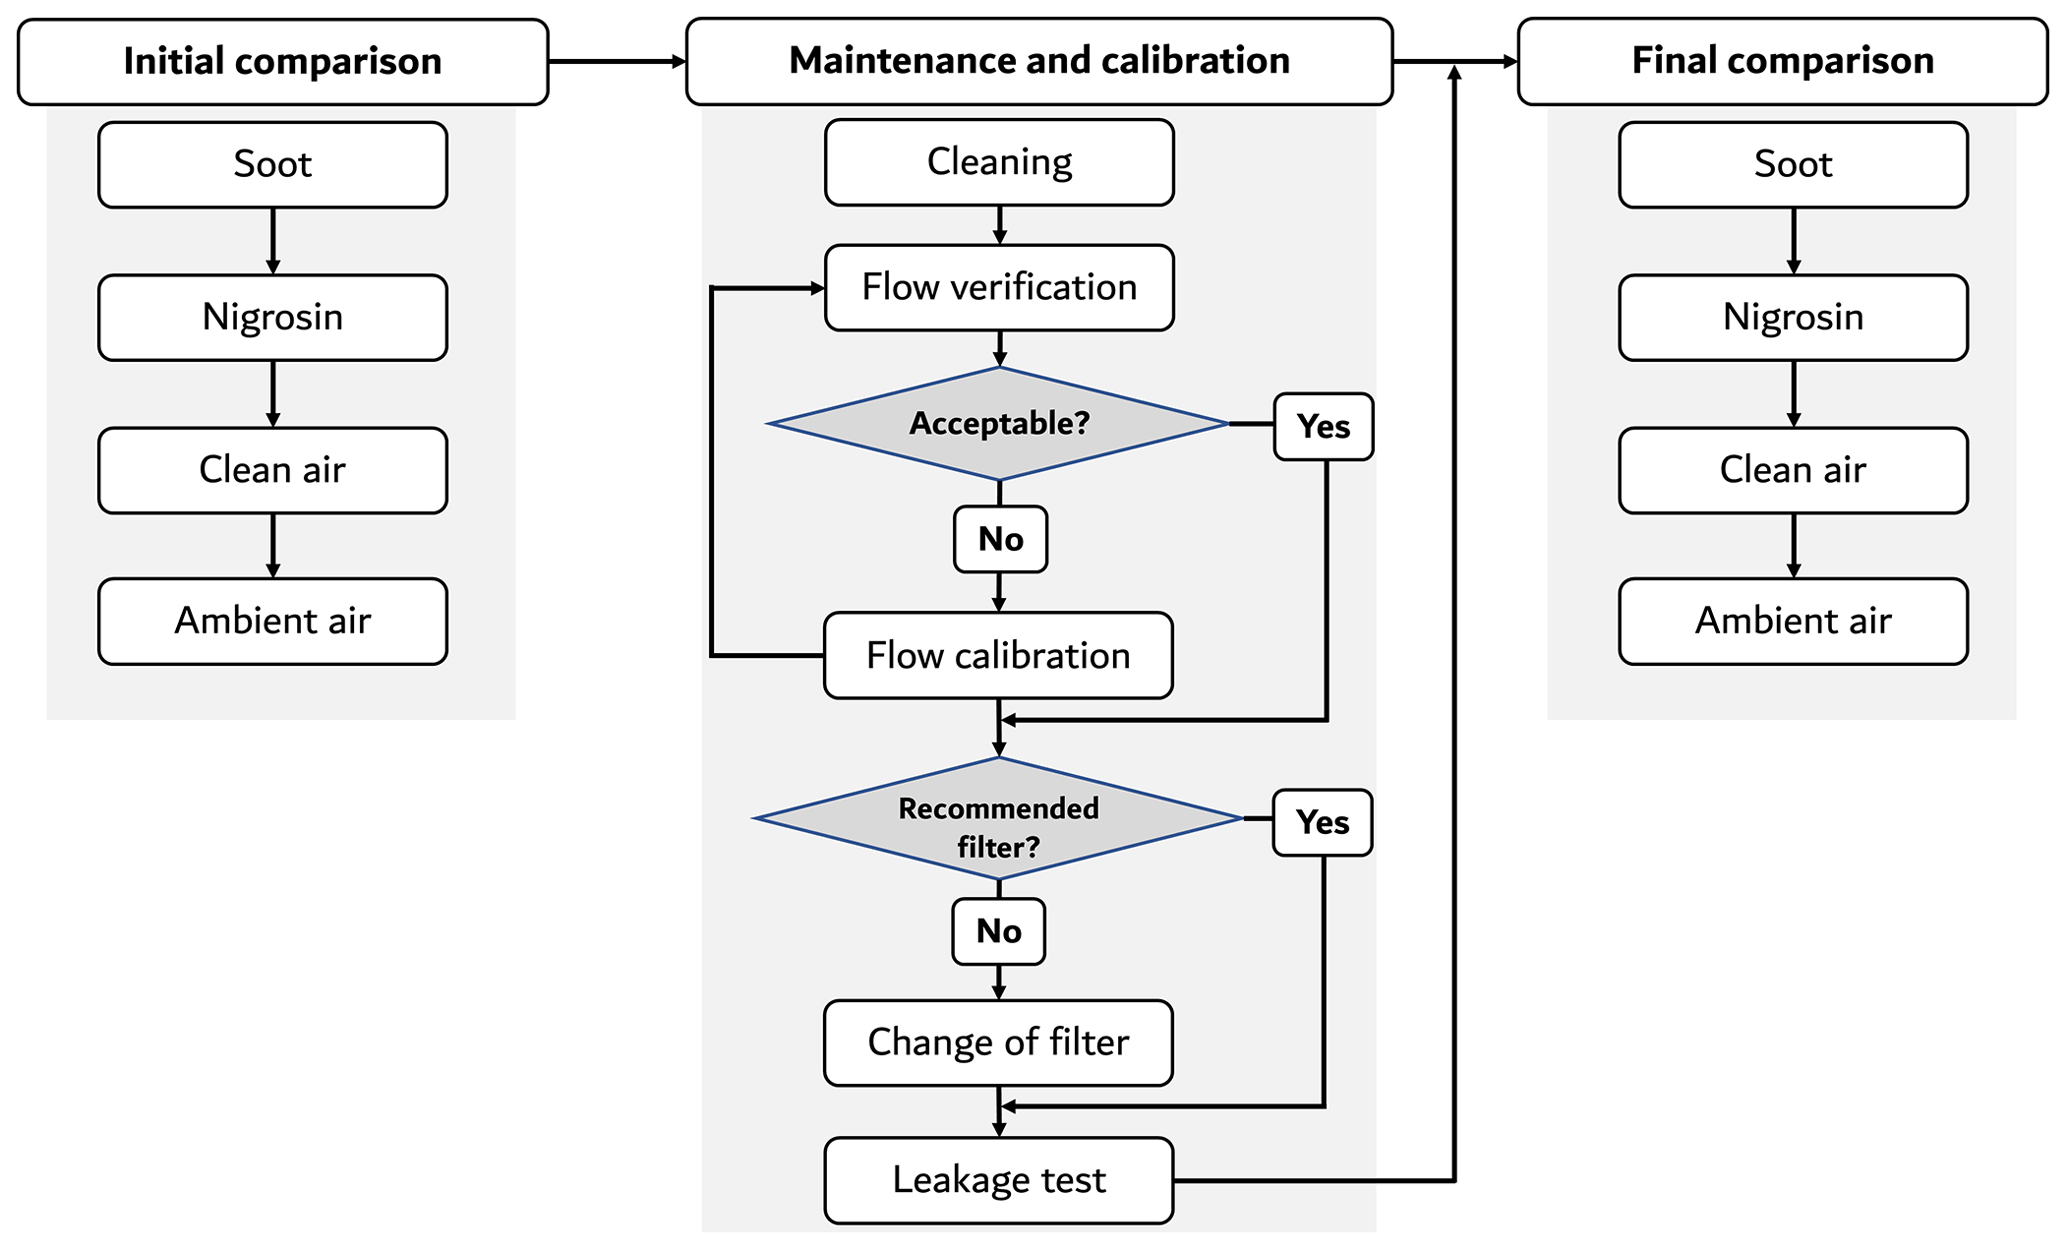
Table 2Instruments employed during the workshops.
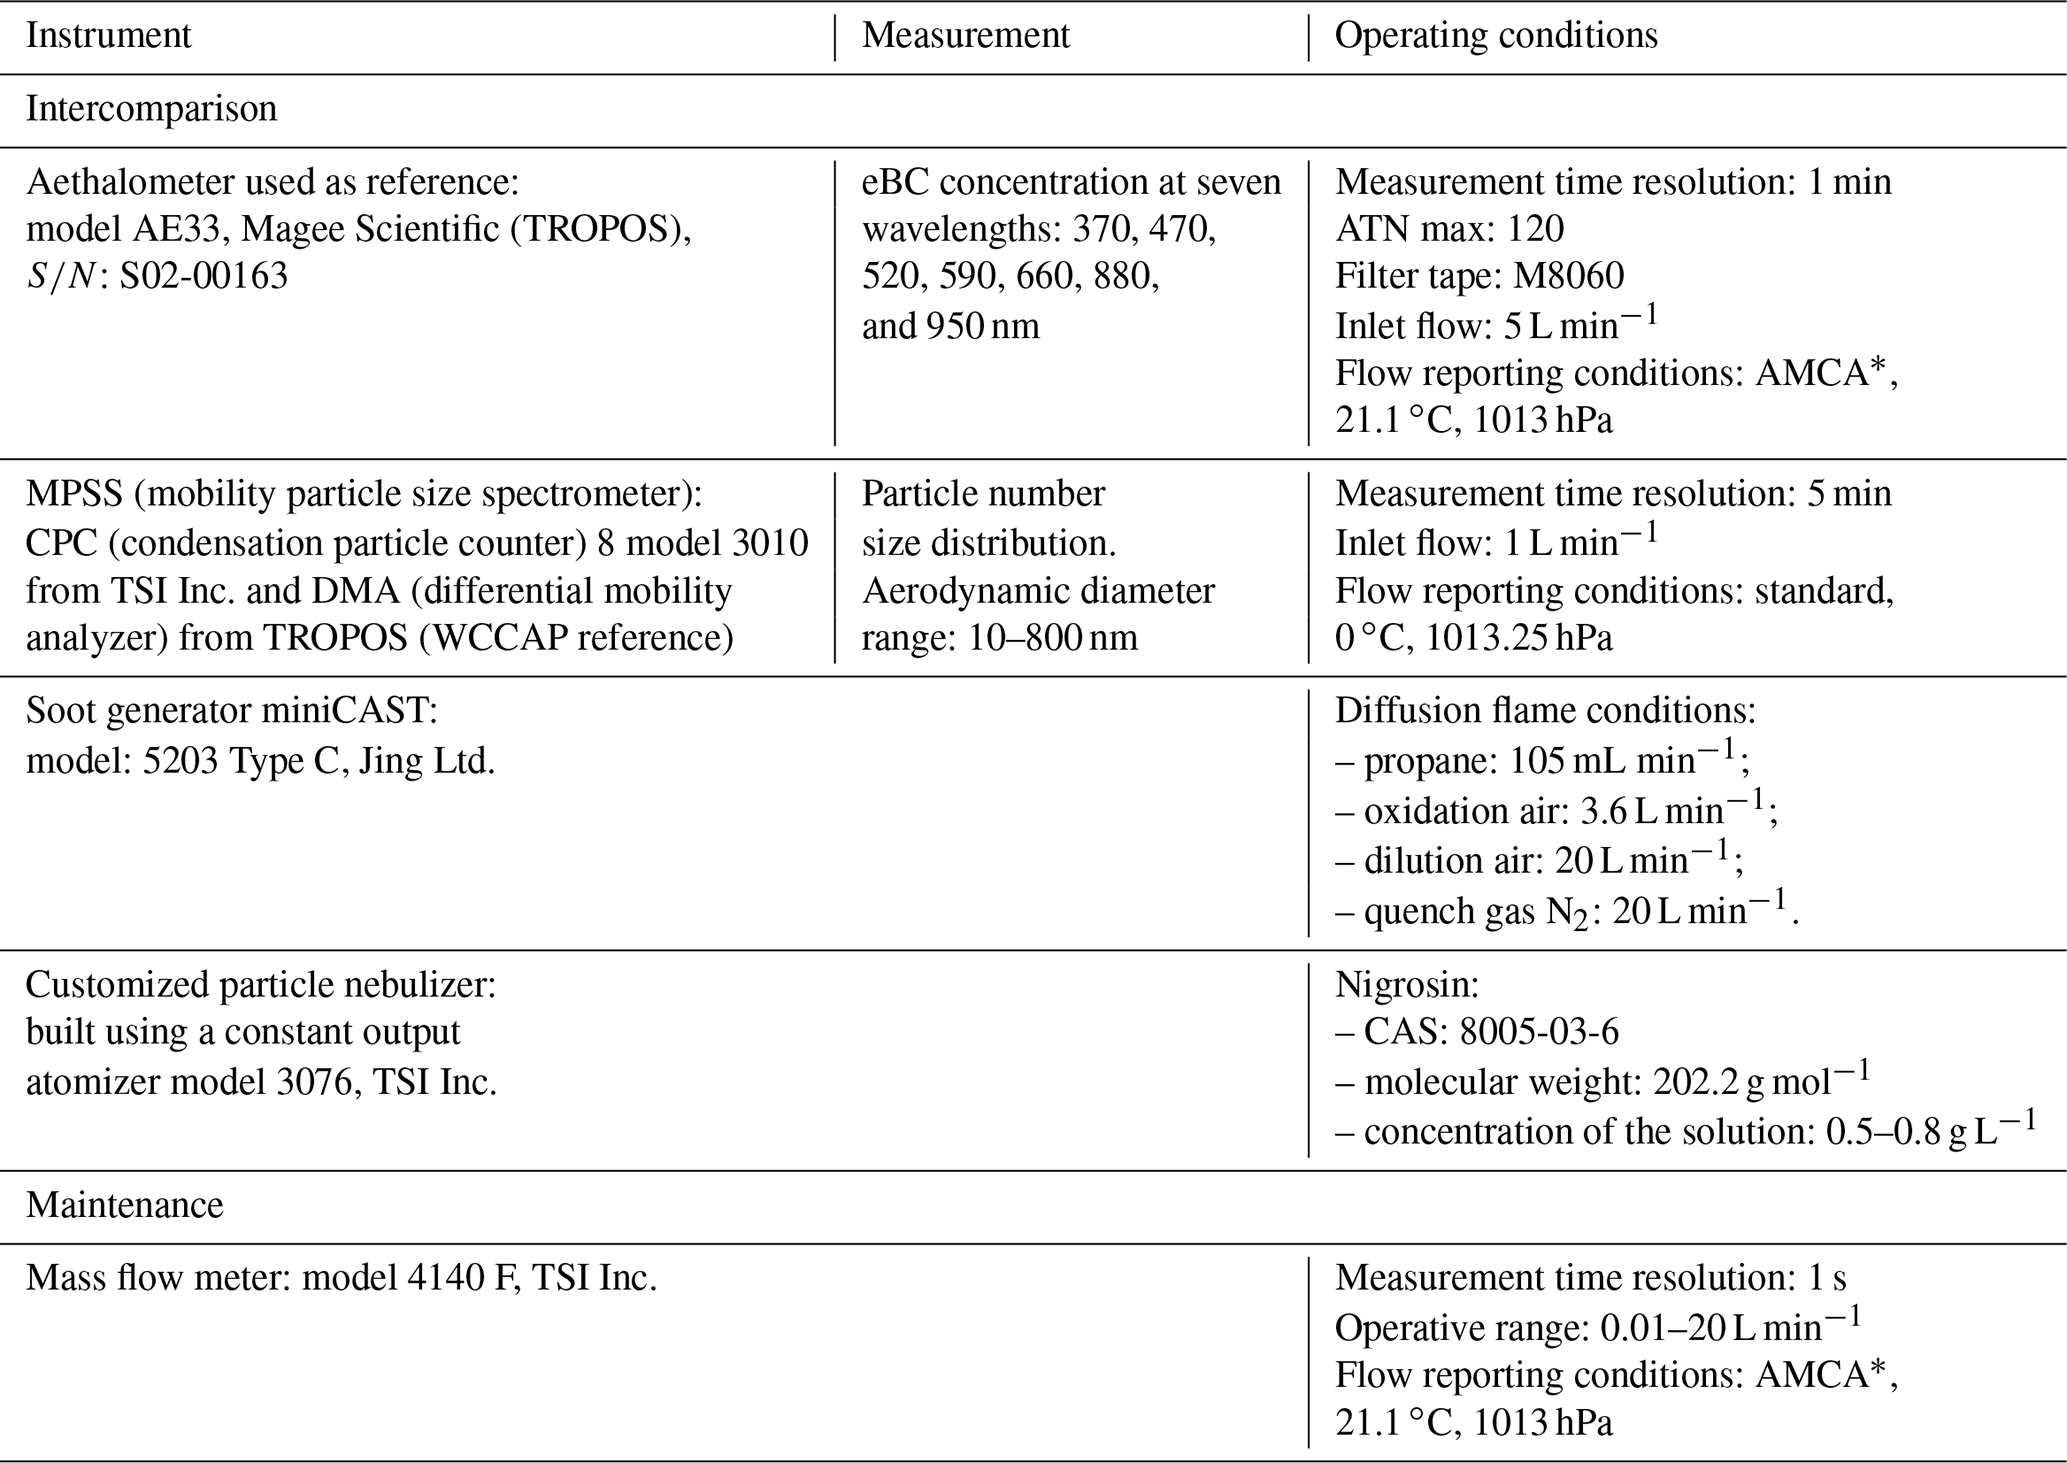
*AMCA (Air Movement and Control Association International) are the default standard conditions used by the flow sensors in the AE33 to report the measured mass flow (Magee Scientific, 2018).
2.3 Experimental setup
A mixing chamber (0.5 m3) with an internal fan was used to distribute well-mixed samples of aerosols to the Aethalometers (Fig. 3). The instruments intercompared measured eBC mass concentrations from ambient air, synthetic soot, and nigrosin particles.
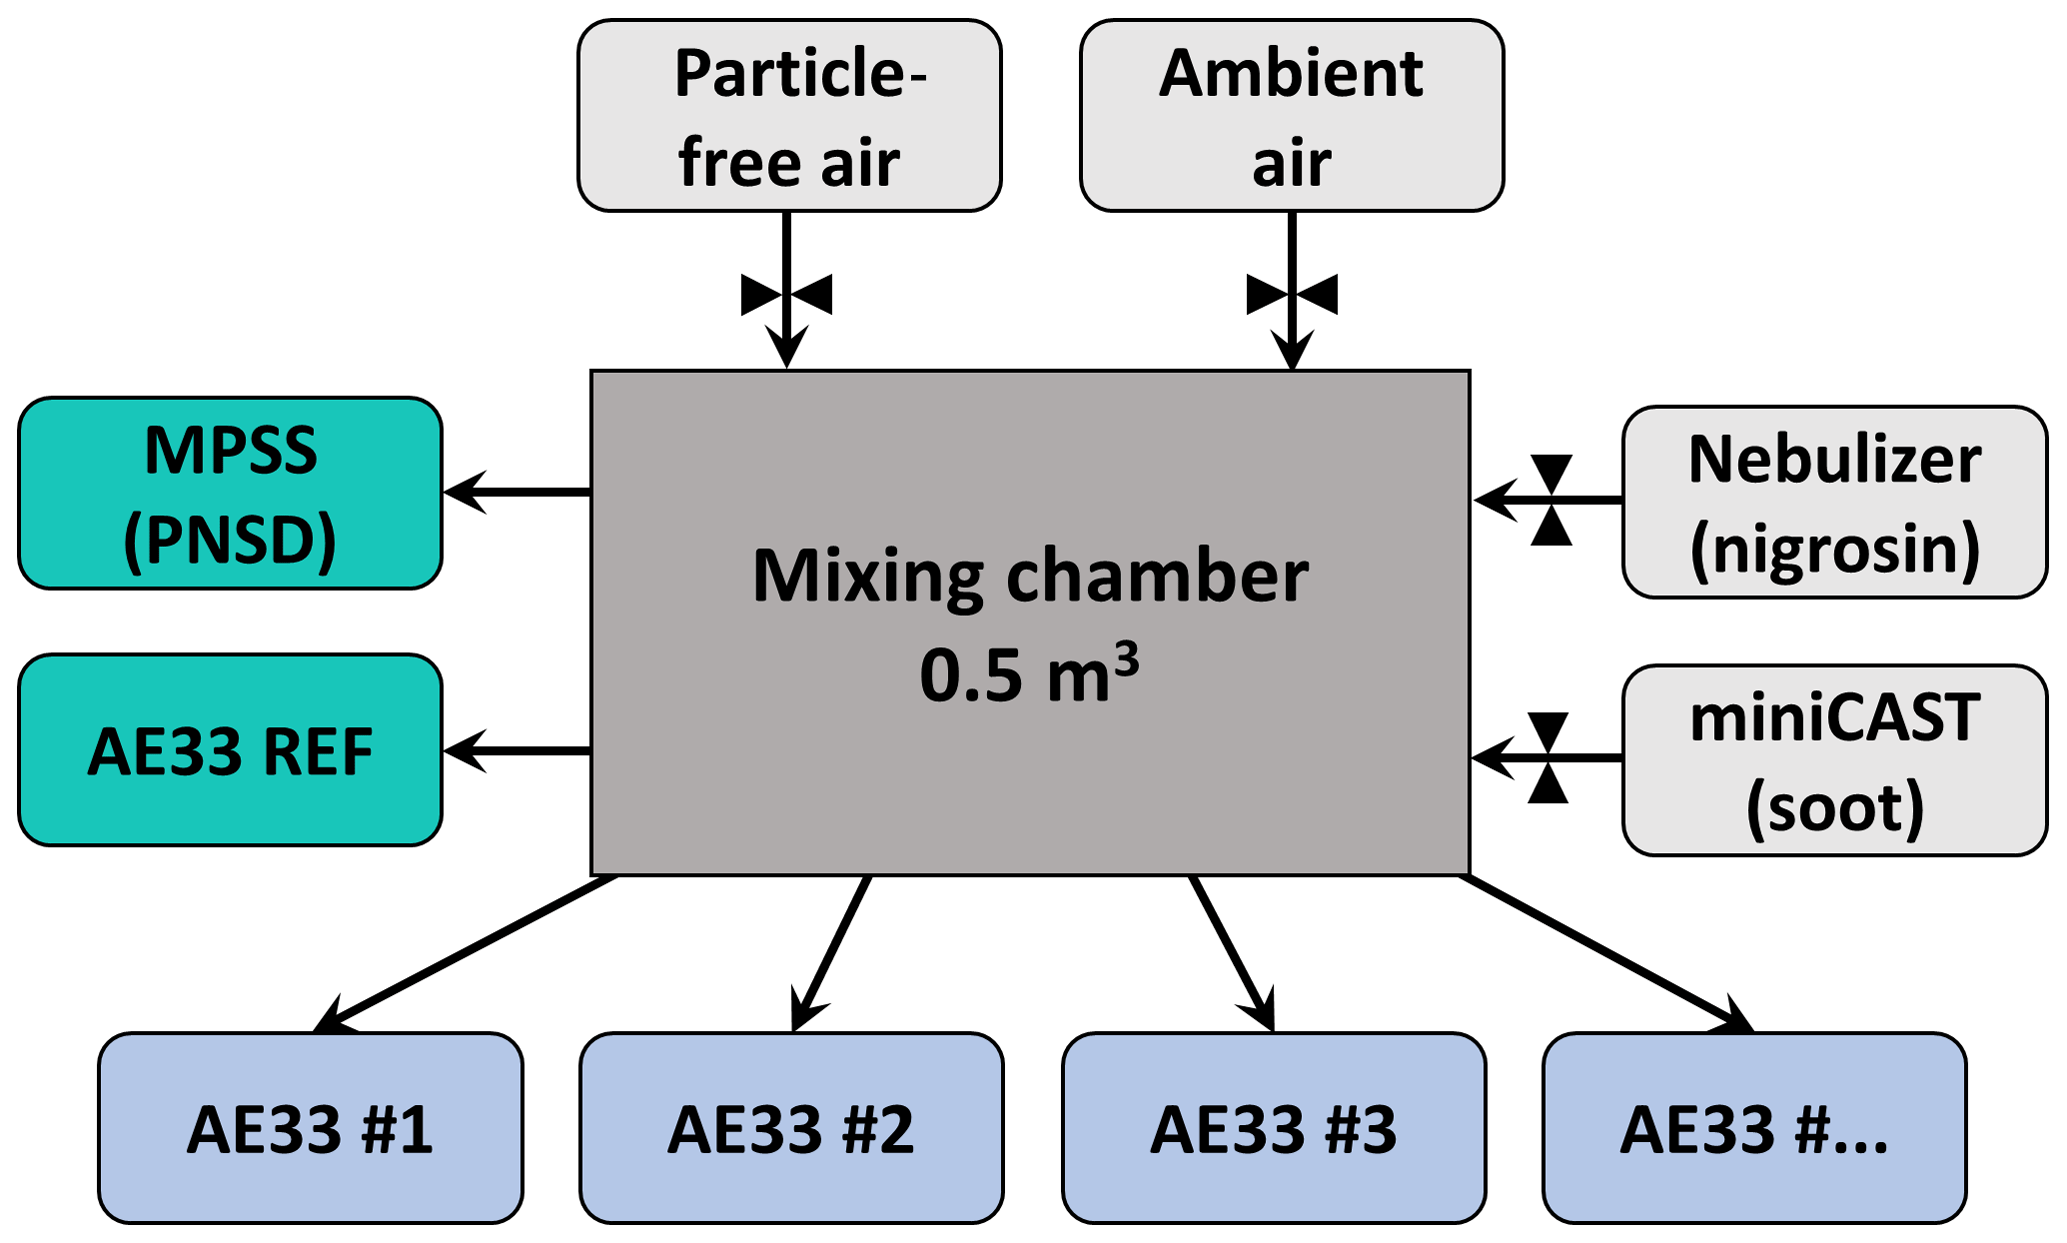
The Aethalometer AE33 used as reference belongs to the WCCAP; it receives frequent maintenance and is operated with the correct accessories (filter tape M8060). The flow of this AE33 is calibrated with an externally calibrated flowmeter model 4140 F, TSI Inc. The reported absorption coefficients of this reference AE33 have been compared with the absorption calculated by a reference setup from the WCCAP, consisting of one nephelometer Aurora 3000, EcoTech, measuring the aerosol light-scattering coefficients, and one CAPS PMex Monitor, Aerodyne Research, Inc, which measures the aerosol optical extinction. The absorption from the reference setup is calculated as , at 450, 525, and 635 nm; the measurements at 450 and 635 nm are extrapolated to 470 and 660 nm, respectively. The results from this comparison are shown in Fig. S1 in the Supplement.
A mobility particle size spectrometer was used to quantify the particle number size distribution of the different aerosol samples used during the workshops. Table 2 presents a list of the auxiliary instruments used during the intercomparisons.
2.4 Aerosol sources
The Aethalometers measured eBC concentrations from three aerosol sources:
-
synthetic soot particles produced with a miniCAST (Jing Ltd, 2013), using a fuel-lean mixture (fuel-to-air equivalence ratio, φ<1); Table 2 shows the operating conditions used in the miniCAST during the intercomparisons;
-
black particles created by the nebulization of a nigrosin solution (Table 2);
-
ambient air aerosols from the urban background in the city of Leipzig, Germany; concentrations correspond to early-morning periods (03:00 to 09:00), during winter (workshop 1) and summer time (workshop 2 and 3).
Figure 4 presents the average particle number size distributions of the aerosol sources measured during the workshops.
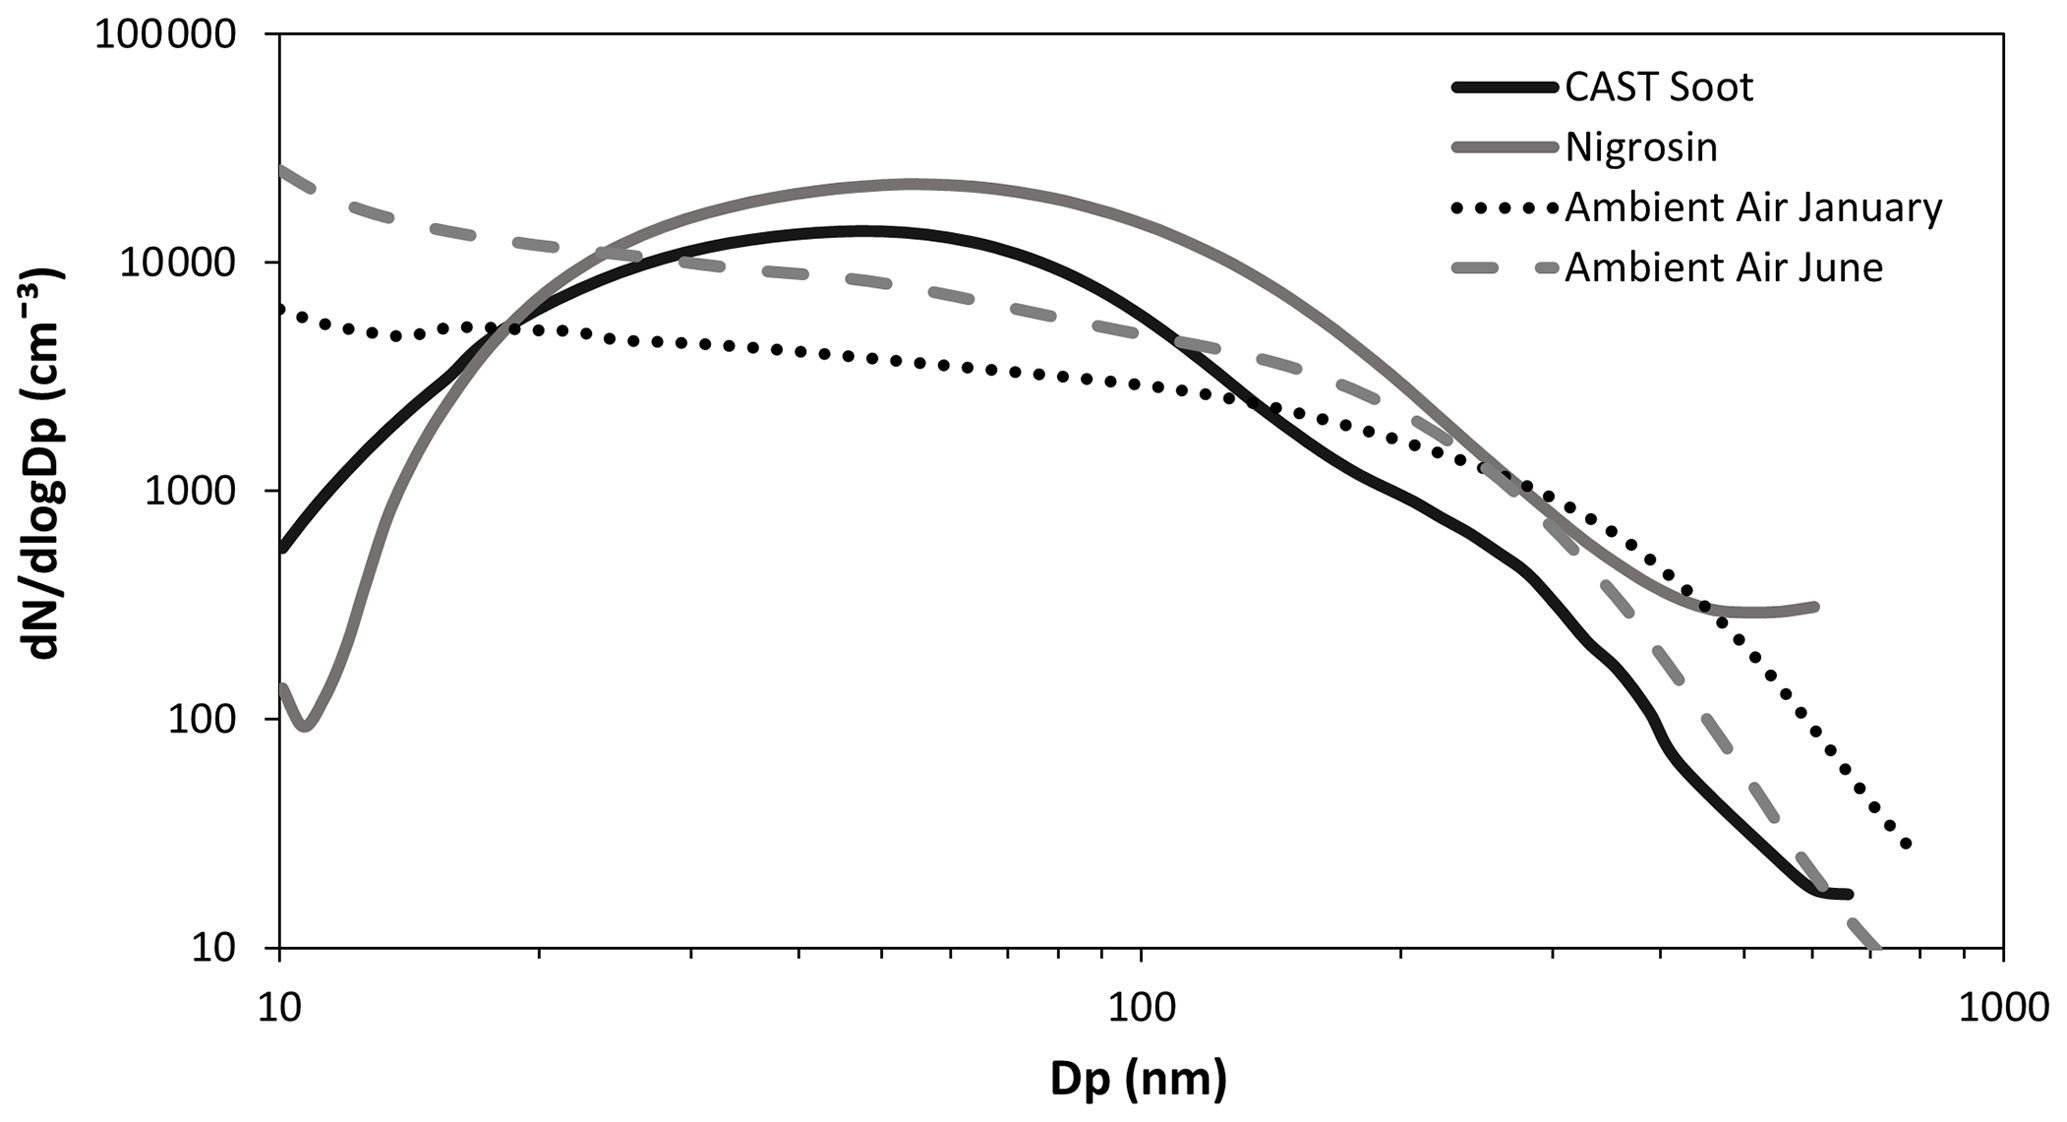
Figure 4Particle number size distributions of the aerosol sources used in the intercomparison.
2.5 Data processing and analysis
Equivalent black carbon concentrations were measured every minute. Subsequent to the workshops, the data from the Aethalometers were cleaned based on the instrument status codes. The AE33 reports a series of status codes representing the operational state, internal procedures in progress, and warning alerts or errors in the instrument, e.g., 0 for normal measurements, 1 for filter tape advance, 8 to check flow status history, and 384 for tape error (tape not moving, end of tape) (Magee Scientific, 2018). As more than one condition may occur at the same time, these statuses are built under a binary system; therefore they may be numerically combined, e.g., 9 to check flow status history (warning) + tape advance (procedure) and 387 for tape error (tape not moving, end of tape) + stopped. Therefore, data from the few valid statuses available were kept and then used in the data analysis (see Table S1 in the Supplement containing the list of valid statuses used in this study). Invalid data were removed for data analysis.
To compare the measurements made by the Aethalometers and the reference AE33, we used Deming total least squares regression analysis (R package “Deming”; Therneau, 2018) to account for the independent observational errors from each instrument and the reference. Deming regression finds the best fitting line by minimizing the sum of the distances in both x and y directions, simultaneously (Cornbleet and Gochman, 1979). The processes of data cleaning and analysis were performed in the software R, version 4.0.0.
Section 3.1 presents a detailed analysis of the instruments characterized in group D, as a case of study illustrating the wide range of deviations observed in real monitoring networks. In this group we have intercompared Aethalometers using three different filter materials, and one of them presented unacceptable results from the flow verification test before maintenance. A summary and analysis of the results obtained for the total of 23 units intercompared is given in Sect. 3.2; additionally, Figs. S2 to S11, present the time series of the measurements performed by the instruments in groups A, B, C, E, and F before and after maintenance.
3.1 Unit-to-unit variability for study case group D
The experiments for instruments in group D were divided into three sections: an initial comparison before maintenance, an intermediate comparison after a partial maintenance, and a final comparison after filter tape change.
3.1.1 Initial comparison
Figure 5 presents the time series of the 1 min eBC mass concentrations measured in the initial comparison by the Aethalometers within group D. The gray areas represent the periods when the different aerosol sources and particle-free air were supplied in to the mixing chamber; the red bars indicate times when tape advances occurred in more than one instrument at the same time.
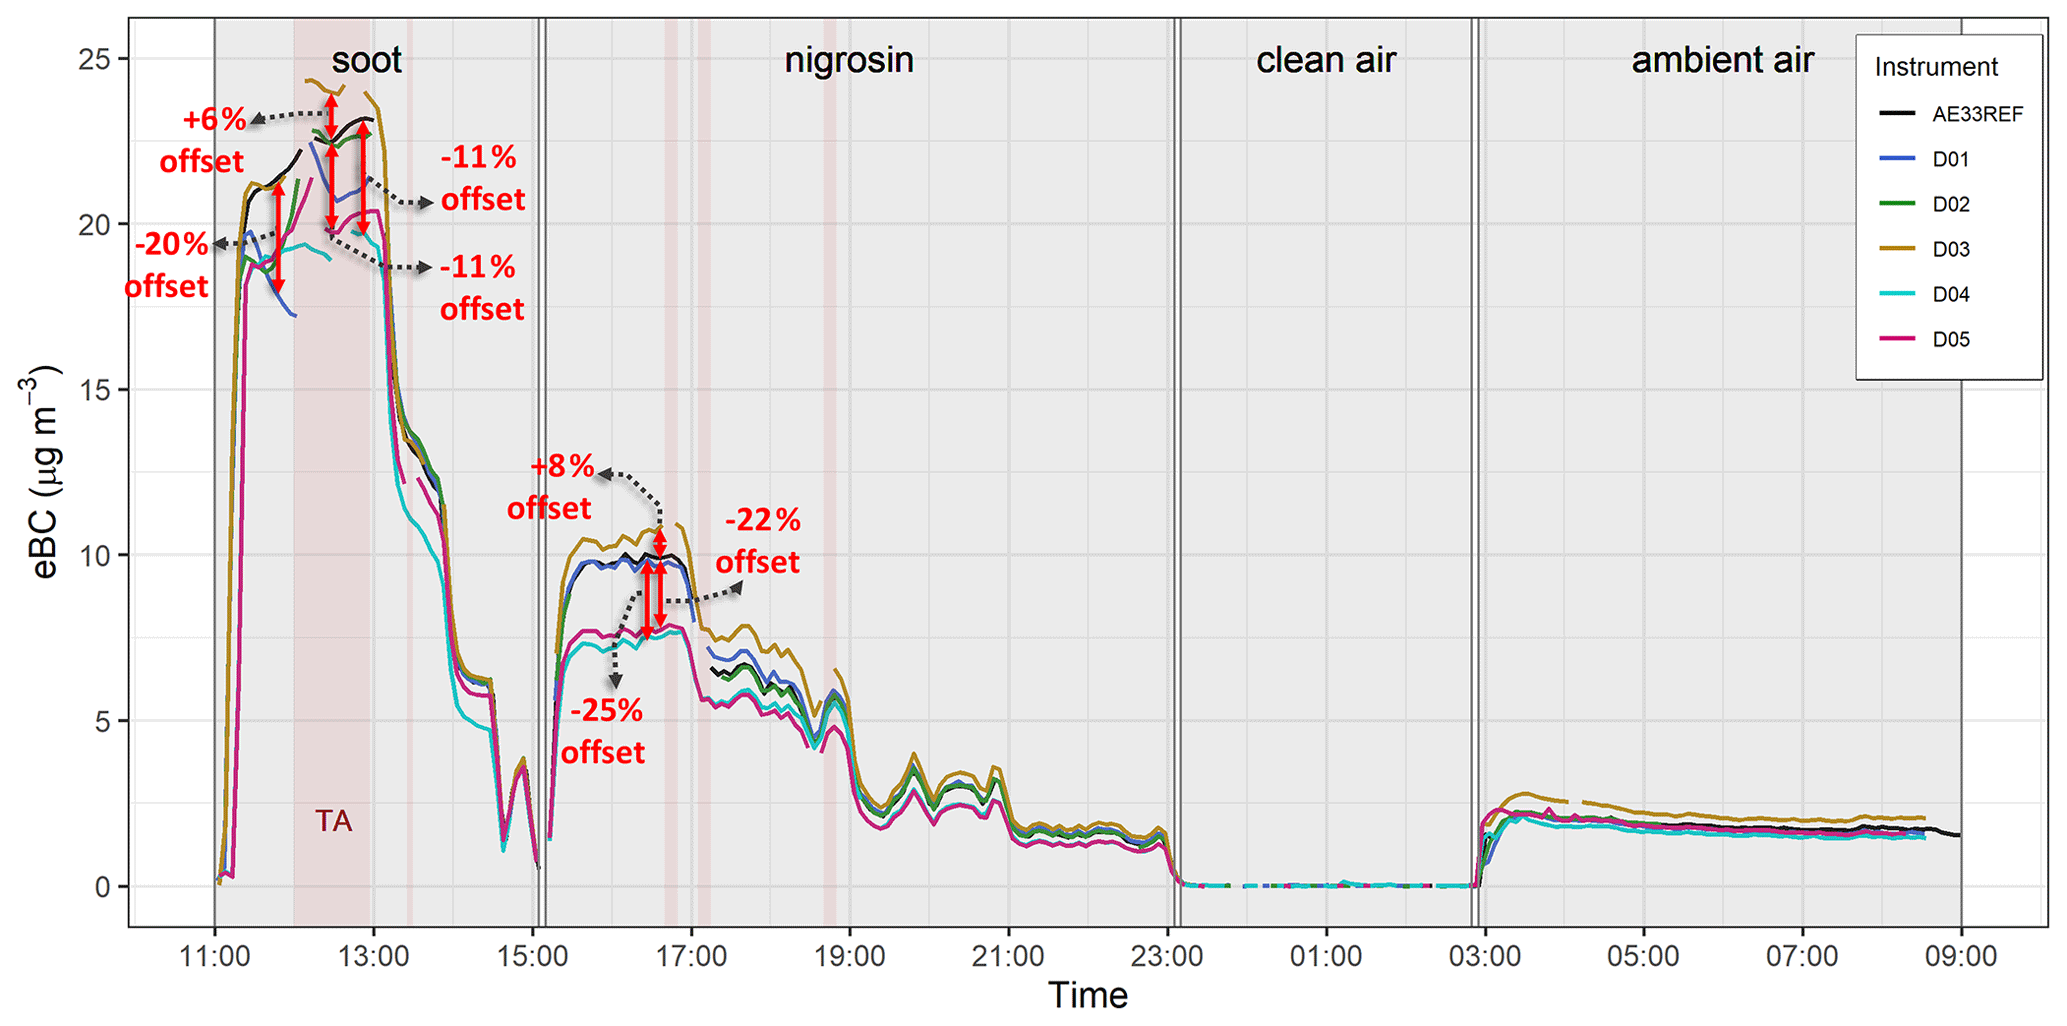
Figure 5Time series of eBC mass concentrations at 880 nm before maintenance in group D. Areas outlined in gray show the periods of clean air and aerosol supply; red bars indicate times when tape advances occurred in more than one instrument simultaneously.
The variability in the measurements of eBC observed in group D, and in general in the six groups, were significantly higher a few minutes before and after a tape advance (TA). Continuous supply of CAST soot with concentrations above 15 to 20 µg m−3 led to the instrument reaching the maximum attenuation limit (ATNTA=120) after ∼30 min, inducing a TA in the majority of the instruments. The differences in the reported eBC mass concentrations close to the TAs reached up to 25 % among the AE33. During nigrosin measurements, constant concentrations of 10 µg m−3 led to the maximum attenuation limit after ∼120 min. Offsets in the concentrations measured by the Aethalometers were up to 25 % during the nigrosin supply.
Before the maintenance and calibration, the highest deviations in group D were seen in three Aethalometers (Fig. 5): D03, D04, and D05. The instruments D04 and D05 underestimated the eBC concentrations by 11 % and 20 % with respect to the reference, respectively. These two instruments used an older version of filter tape M8050 (also known as TX40), a glass fiber filter on a woven backing. The M8050 filter tape was distributed during a short period from 2016 to 2017, and according to the manufacturer it was substituted because of evidence of unsatisfactory performance. On the other hand, the instrument D03 reported slightly higher concentrations than our reference Aethalometer, overestimating the eBC concentrations by up to 6 % and 8 %, while measuring soot and nigrosin particles, respectively. The Aethalometer D03 used the T60A20 filter tape (also known as M8020 or AE33-FT), made from TFE-coated glass fibers; this was the first filter used in the AE33 (Drinovec et al., 2015) and was available from 2014 to 2016.
The different materials used and the structure of the filters give them specific light-scattering properties responsible for light absorption enhancement (Petzold et al., 1997). Therefore, the correction factor C accounting for the light-scattering effects of the filter and the particles collected in it takes different values for each type of filter tape. It has been demonstrated that the apparent C correction factor is in addition susceptible to the type of aerosols measured (Collaud Coen et al., 2010). However, the estimation of a source-dependent C factor was not within the scope of this study; our interest is limited to the correct use of the C factors associated with each filter tape. The standard C factor for the filters previously available, M8050 and T60A20, is 1.57, relative to the value 2.14 determined in Weingartner et al. (2003). To guarantee the comparability within monitoring stations, these two filter tapes are no longer recommended for use in the AE33 (Magee Scientific, 2018). The new filter M8060 must be used instead, and its corresponding multiple-scattering parameter C has to be set as the internal parameter of the instrument (CM8060=1.39).
3.1.2 General maintenance and intermediate comparison
In group D the maintenance was divided into two phases to observe separately the influence of the essential servicing activities, i.e., cleaning of the optical chamber, flow verification and calibration, and leakage test, all performed in the first phase, and the replacement of the older filter tapes, which comprises the second phase. An intermediate intercomparison was performed in the middle of both maintenance phases.
During the first phase of maintenance, the instrument D03 showed unsatisfactory results from the flow verification and leakage tests. On average, the flow sensors detected 30 % less airflow than the reference flowmeter (see Table 3), requiring a flow calibration. In the Aethalometer AE33, if the flow verification test indicates a deviation of ±10 % in any of the three flow rates (flow through spot 1, spot 2, and common flow), a flow calibration must be carried out (Magee Scientific, 2018). From the leakage test, this instrument reported a leakage of 9 %. This result indicates that almost 10 % of the inlet air flow in the Aethalometer (Fin) is being tangentially lost across the edges of the filter tape. The results from the flow verification and leakage tests for the other instruments in group D were satisfactory (Table 3).
Table 3Summary of results from maintenance tests.

1 Flow reporting standard: AMCA (21 ∘C, 1013 hPa). 2 This filter tape was not replaced because of operational reasons. BM: before maintenance. AM: after maintenance. ND: no data.
After the first maintenance phase, the instrument D03 went from overestimating eBC to underestimating the mass concentration by 33 % and 18 % during soot and nigrosin measurements, respectively (Fig. 6a). During the same period, the instruments D04 and D05 continued underestimating the eBC concentrations while measuring soot (25 %) and nigrosin (27 %).
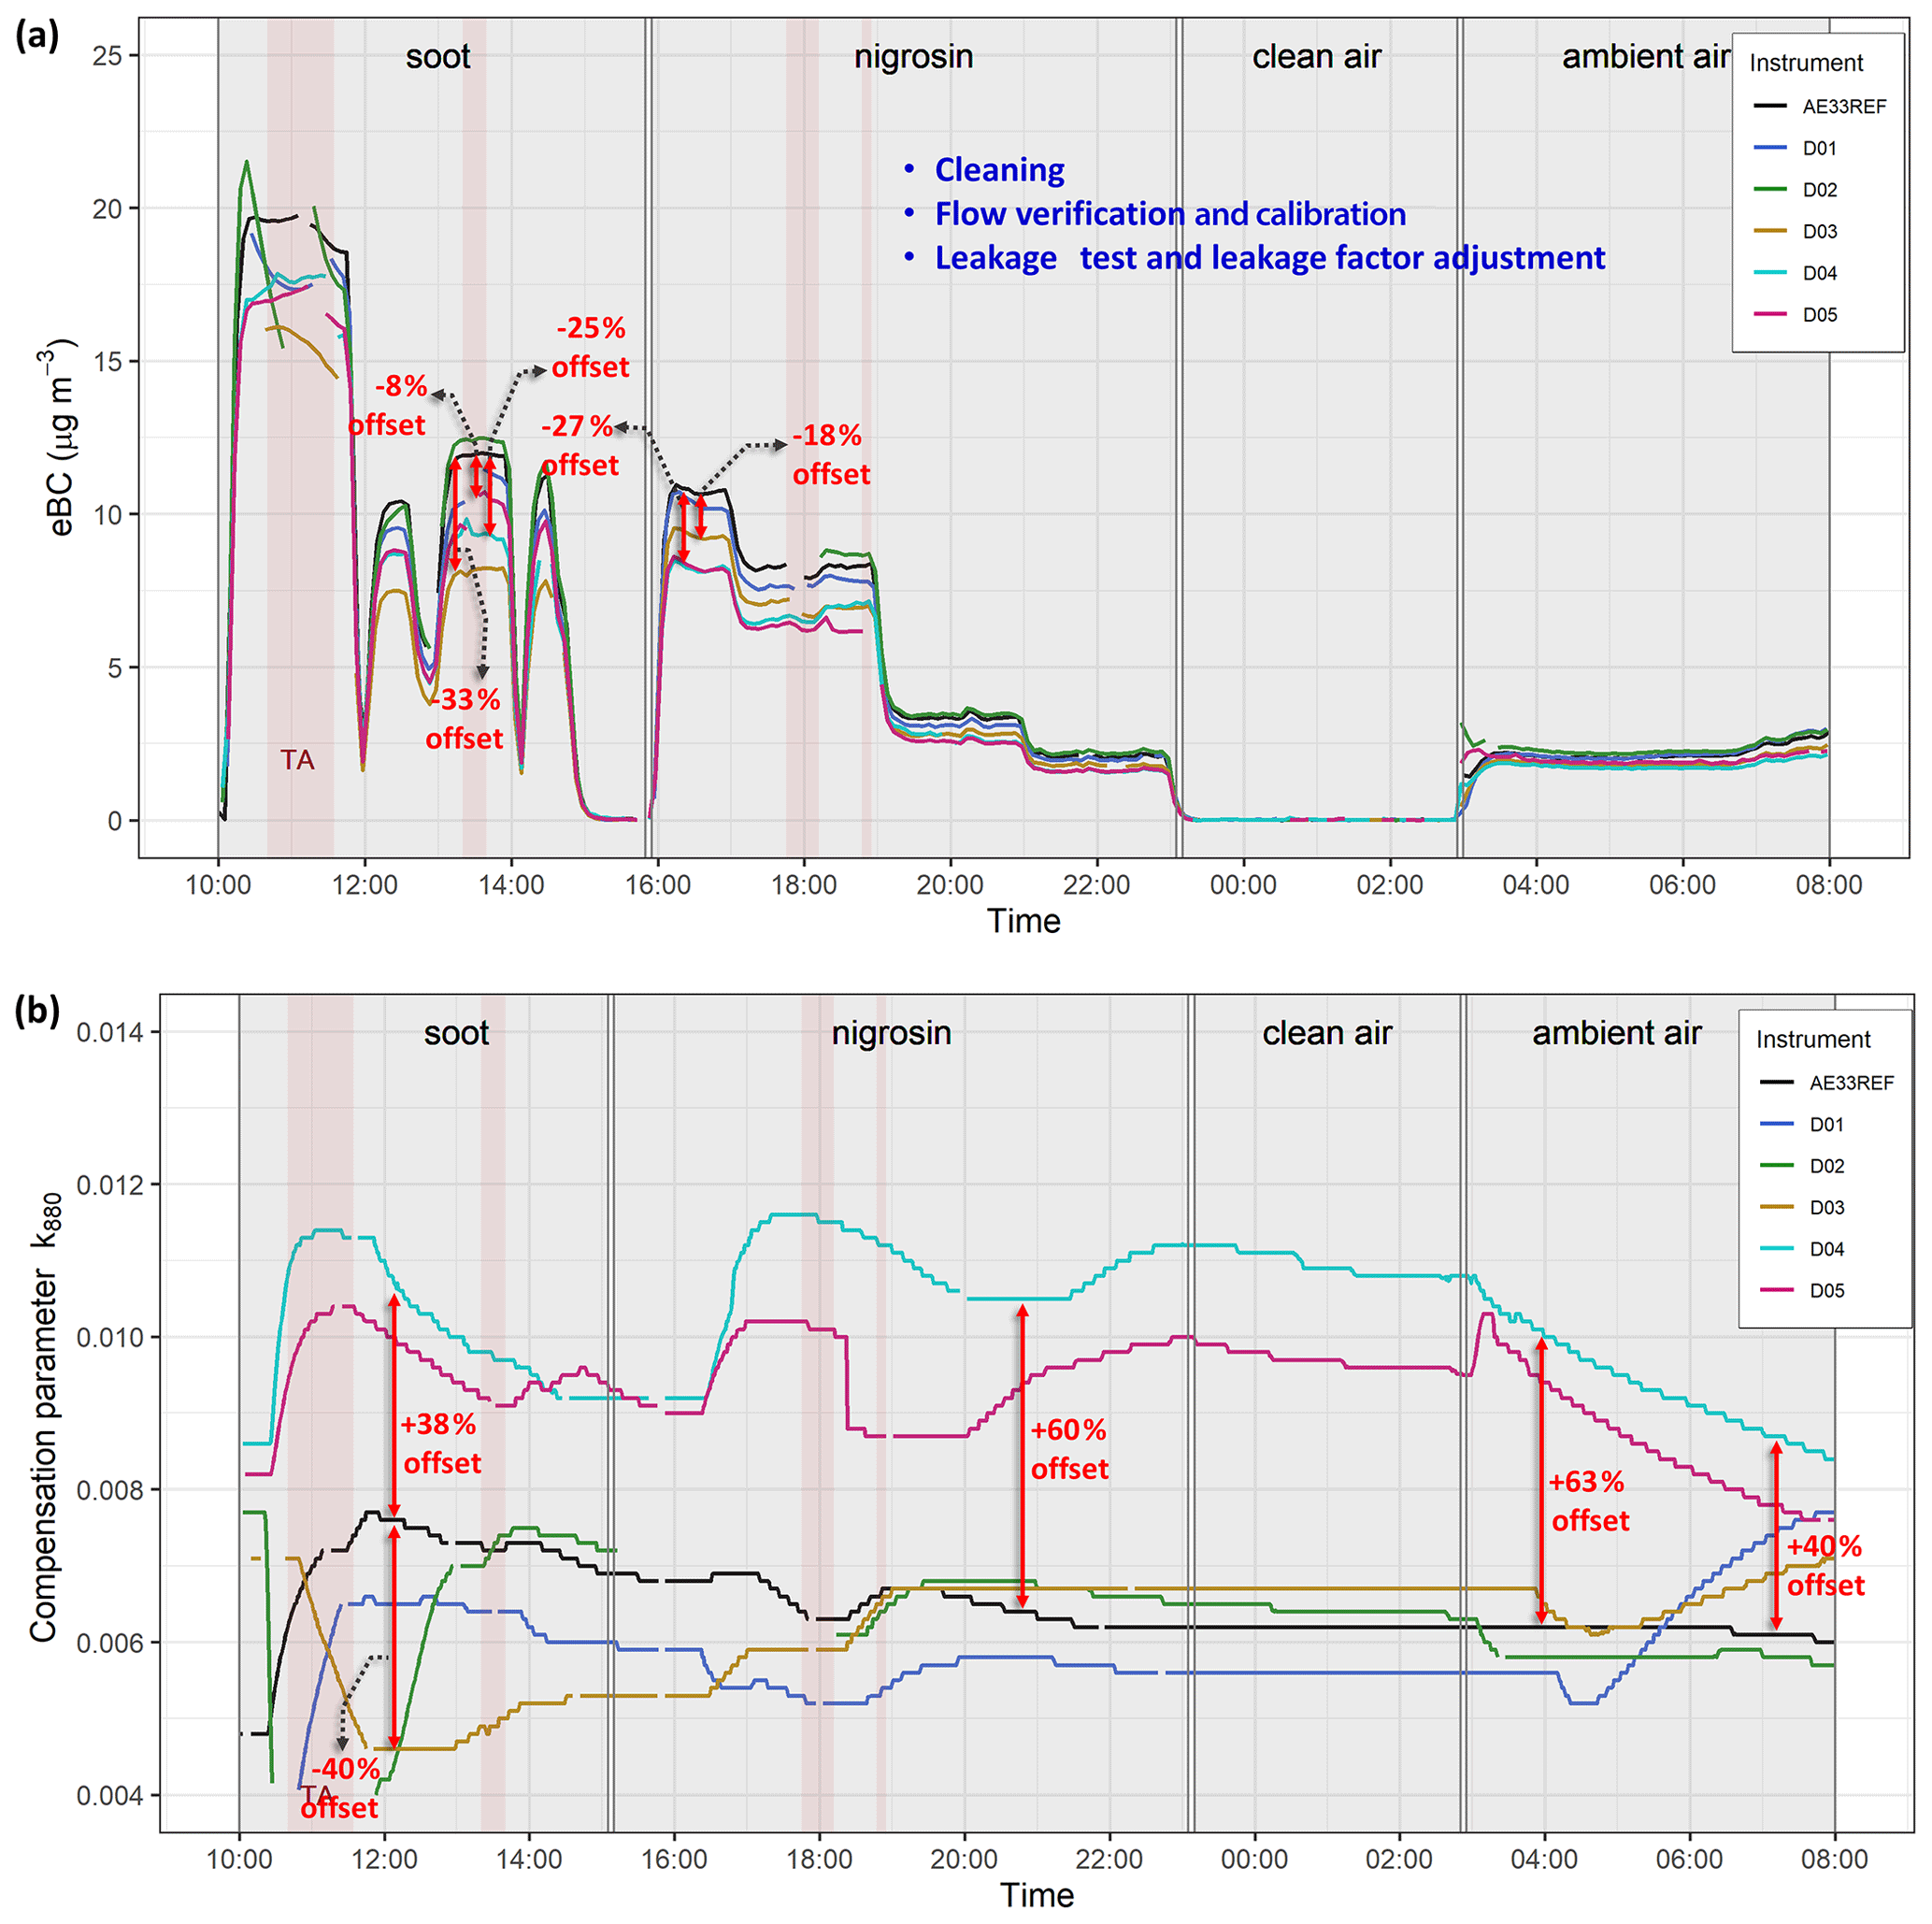
Figure 6Time series of (a) eBC mass concentrations at 880 nm and (b) compensation parameters k880 after the initial phase of maintenance in group D. Areas outlined in gray show the periods of clean air and aerosol supply; red bars indicate times when tape advances occurred in more than one instrument simultaneously.
The shape of the sample spots also demonstrates problems in an Aethalometer. This was evident in the instrument D03 whose sample spots presented an irregular shape with heterogeneous saturations or streaks (Fig. 7a); under optimal operating conditions the spots formed on the filter tape have a circular and well-defined shape which ensures a correct measurement of the attenuation change (Fig. 7b). However, it was shown that the streaks (Fig. 7a) do not impact the measurement (John Ogren, personal communication, 2019).
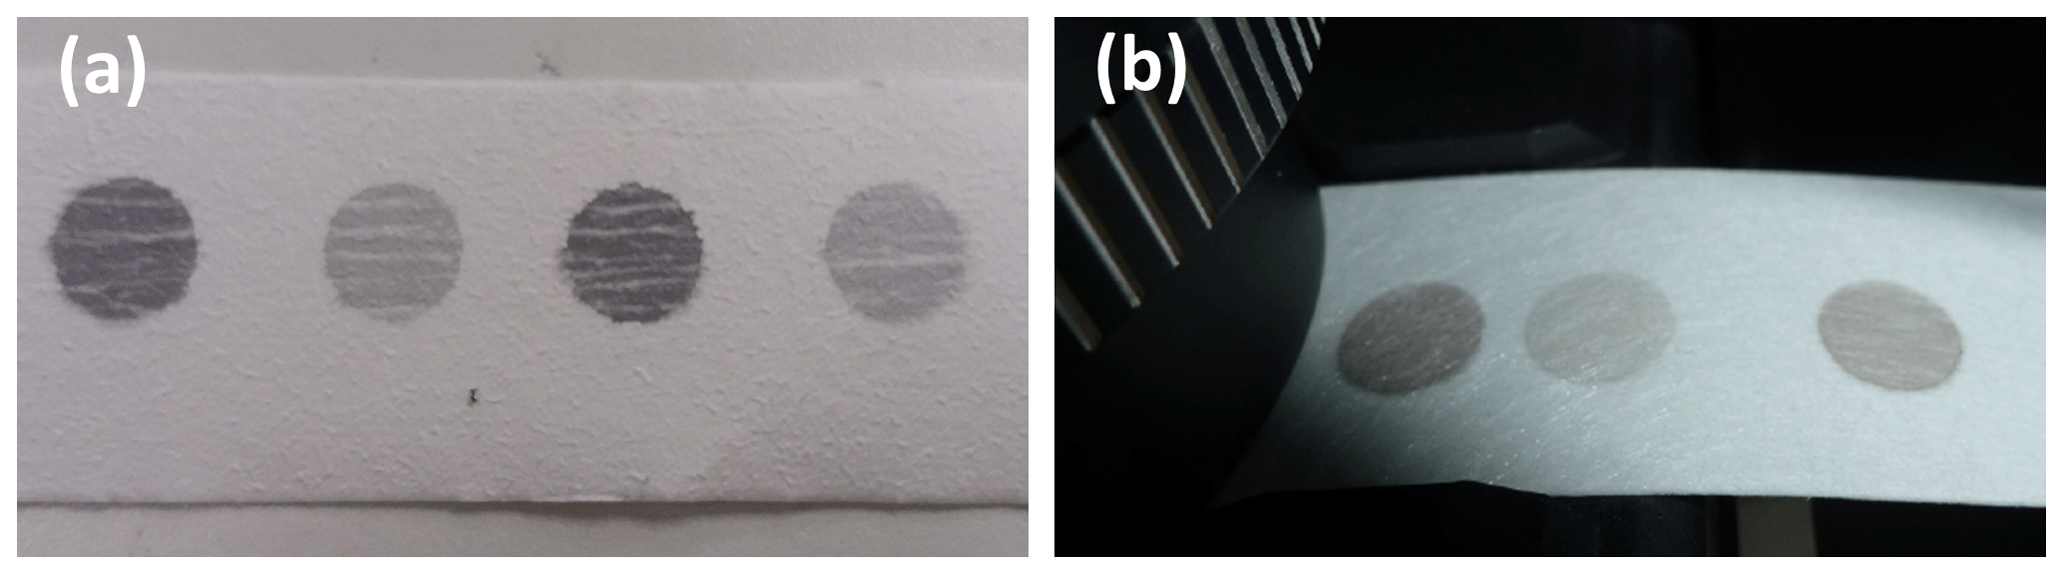
Figure 7Shapes of sample spots observed during maintenance in group D. (a) Instrument D03; (b) instrument D01. These instruments used different filter tapes (D03: T60A20; D01: M8060). The spot size was not measured during the workshops. Irregular or diffuse edges of the filter spot can indicate leakage.
The real time calculation of the eBC mass concentrations in the AE33 is based on the compensation parameters k. Figure 6b illustrates the time series of the k880 values during the intermediate comparison (after flow and leakage adjustments). The comparison of the compensation parameters is significant as these respond to the changes in aerosol sources and concentrations in the experiments, independently of instrument correction factors. Once the flow verification and calibration were implemented, it would be expected to have similar k values among the instruments. Nevertheless, as evidenced in Fig. 6b, the differences in k from the reference Aethalometer and the instruments in group D ranged from −40 % until %. The main reasons explaining these deviations are the time at which the TAs occurred in the instruments and the filter materials they used. Although the instantaneous k values are calculated using Eq. (2), the instrument uses a specific k depending on a weighting method based on the values of the attenuation as follows (Supplement, Drinovec et al., 2015):
-
ATN1<30. Under low BC concentrations as well as after one tape advance, a low attenuation change will take place in the Aethalometers. While ATN1<30 (attenuation from in spot 1, channel 1), the last k values from the previous spot (kold) will be used to compensate for the eBC mass concentrations. Accordingly,
-
30<ATN1<120. For this attenuation range, k is calculated using kold, and the instantaneous k is calculated from Eq. (2):
where ATNTA is the maximum limit of attenuation triggering a tape advance and ATNf2 is the upper limit of attenuation for the fitting range; ATNf2=30.
-
ATN. Once spot 1 is completely loaded and the threshold attenuation is reached, k becomes equals to the instantaneous k calculated with Eq. (2).
The k values also depend on the filter type as the different materials determine the filter loading rate and thus the time when the threshold attenuation (ATNTA) is attained. In addition, the k values are susceptible to the type of aerosols measured (composition and size) and their mixing state (Drinovec et al., 2017). If Eq. (4) is rearranged and expressed in terms of eBC, the k values could be defined as a function of the non-compensated and compensated black carbon mass concentration:
According to Eq. (8), for a given attenuation, if the compensated eBC is larger than the uncompensated one, k will be positive and inversely proportional to the eBC mass. This was observed for the instruments D04 and D05, with higher and positive deviations from our reference Aethalometer (Fig. 6b). Through this last period, the k from both instruments decreased constantly, meaning this couple of Aethalometers detected a different attenuation range (between 30 and 120) instead of a low attenuation associated with low ambient air concentrations taking place. Along the intermediate comparison, the compensation parameters exhibited a significant variability in group D, ranging from 0.0045 to 0.0115. When performing an intercomparison, the change in the sample requires a “conditioning run” of a sample spot up to ATNTA to obtain the source-specific value of the parameter k. Alternatively, all data need to be manually reprocessed.
3.1.3 Final maintenance and comparison
In the final step of maintenance, the filter tape was replaced in three instruments from group D: D03, D04, and D05, which were using older versions of filter tapes which are no longer recommended for the AE33. The final comparison was performed during 2 d. As observed in Fig. 8a, the deviations among the eBC mass concentrations reported by the instruments reduced significantly for all aerosol sources (<10 %), in comparison with the initial and intermediate comparisons performed in group D. Significant deviations (>10 %) were observed only at the beginning of this final stage after the first tape advance while the instruments measured BC mass from the soot source; these higher deviations are associated with the initial adjustment required by the compensation algorithm to a new aerosol source and the effect of a filter tape advance, as mentioned earlier. The internal algorithm uses the previous spot compensation parameter, and, if this parameter was determined from measurements of a completely different sample, the value does not apply for measurements of the new sample (Drinovec et al., 2015). Figure 8b shows the time series of the compensation parameters k at 880 nm corresponding to the final comparison. The new k ranged now from 0.005 to 0.008, and their deviations from the reference Aethalometer ranged from −20 % to −10 % during soot and nigrosin. However, substantial differences took place during ambient air measurements mainly in the Aethalometer D05; once the supply in the mixing chamber changed from clean air to ambient air at midnight, the compensation parameters from D05 jumped abruptly between >0.012 to negative values within 1 h. This situation is associated with the response of the instrument to changes in pressure: the airflow pressure in the mixing chamber affects the flow rates, which is directly related to the instantaneous k. During maintenance, the Aethalometer D05 presented unusual behavior associated with the flow ratio appearing to a certain extent even after flow calibration. As recommended by the manufacturer, the ratio of F1 (higher sample airflow through spot 1) to F2 (lower sample airflow through spot 2) should be about 1.75 to 2.5; however this relation was not always accomplished in this instrument. As result, it was recommended to the operator to send the instrument to the manufacturer for advanced maintenance.
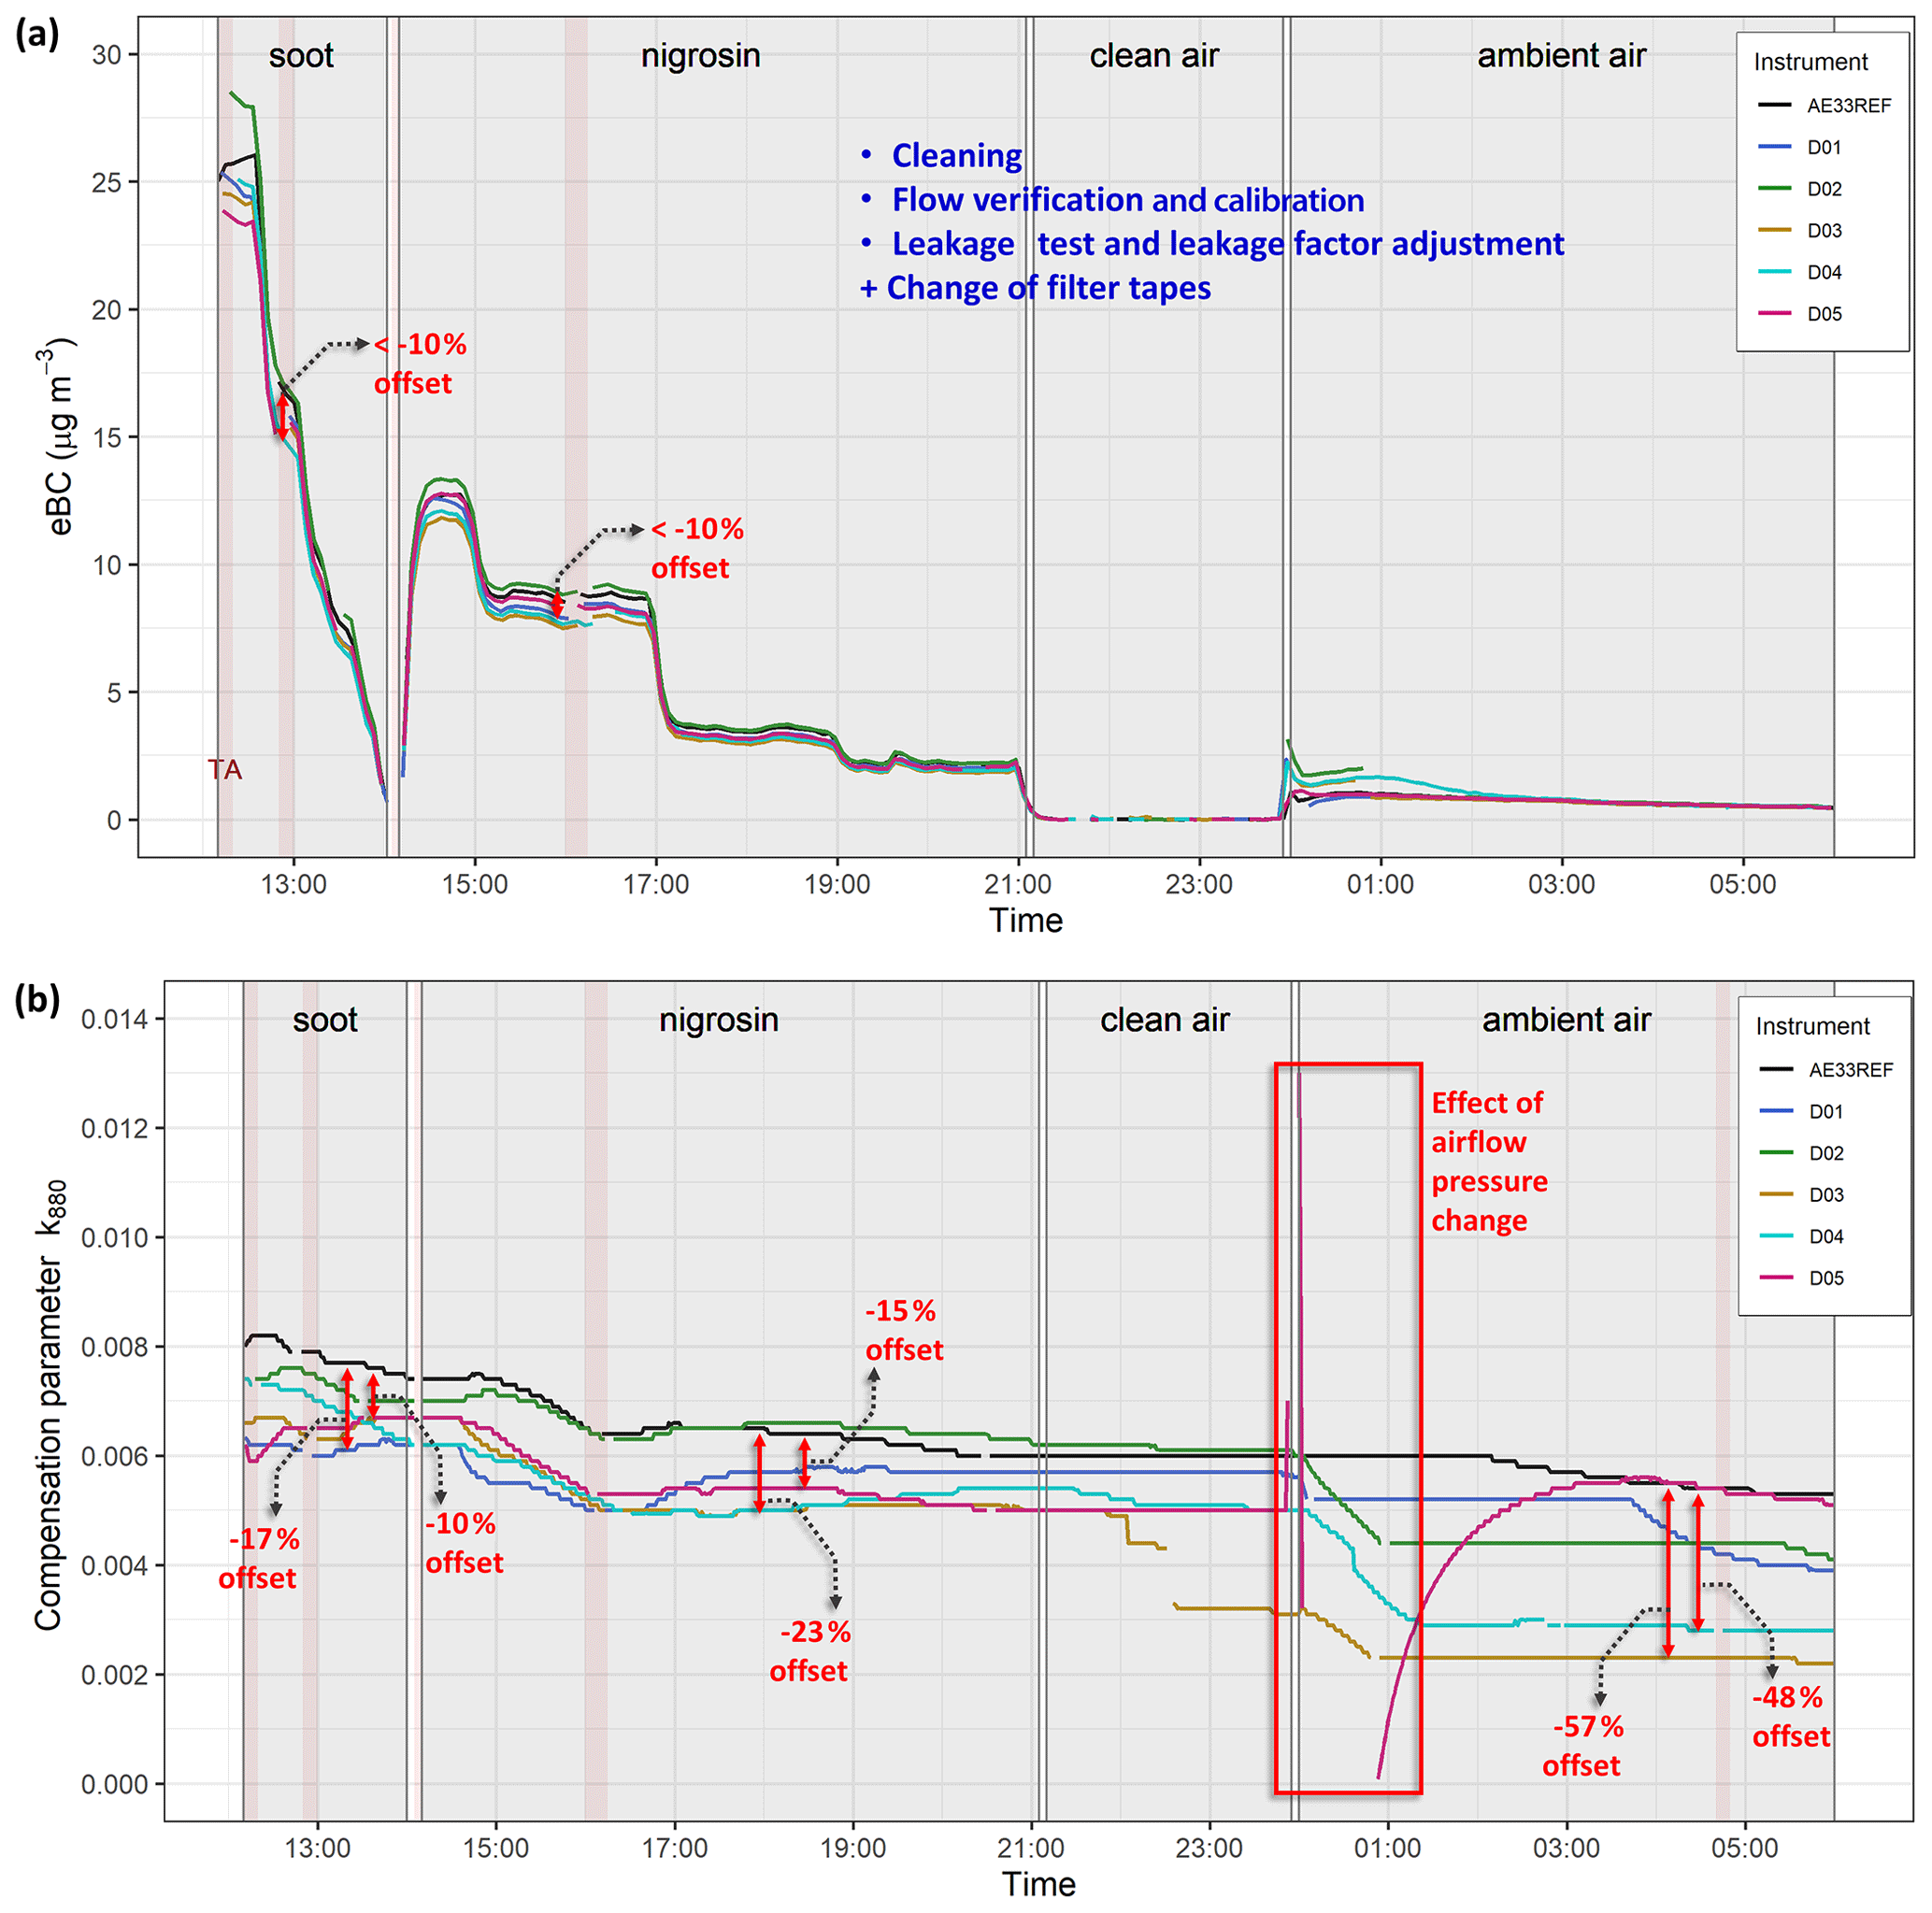
Figure 8Time series of (a) eBC mass concentrations at 880 nm and (b) compensation parameters k880 after the final phase of maintenance in group D. Areas outlined in gray show the periods of clean air and aerosol supply; red bars indicate times when tape advances occurred in more than one instrument simultaneously.
3.1.4 Statistical summary
The numerical unit-to-unit variabilities were calculated using data from measurements at 880 nm before and after maintenance, via total least squares regression with intercepts forced through zero. In the case of group D, maintenance includes flow, leakages, and filter tape adjustments.
Figures 9, 10, and 11 present the scatterplots from the comparison of the five instruments in group D against our reference Aethalometer, while measuring soot, nigrosin, and ambient air, respectively. For soot and nigrosin, the correlations were built using measurements after the majority of the instruments performed one or two tape advances to avoid the bias caused by the effects previously described in this section. In the case of ambient air, the measurements were averaged to 5 min as the ambient concentrations of BC were low (<1 µg m−3) after maintenance.
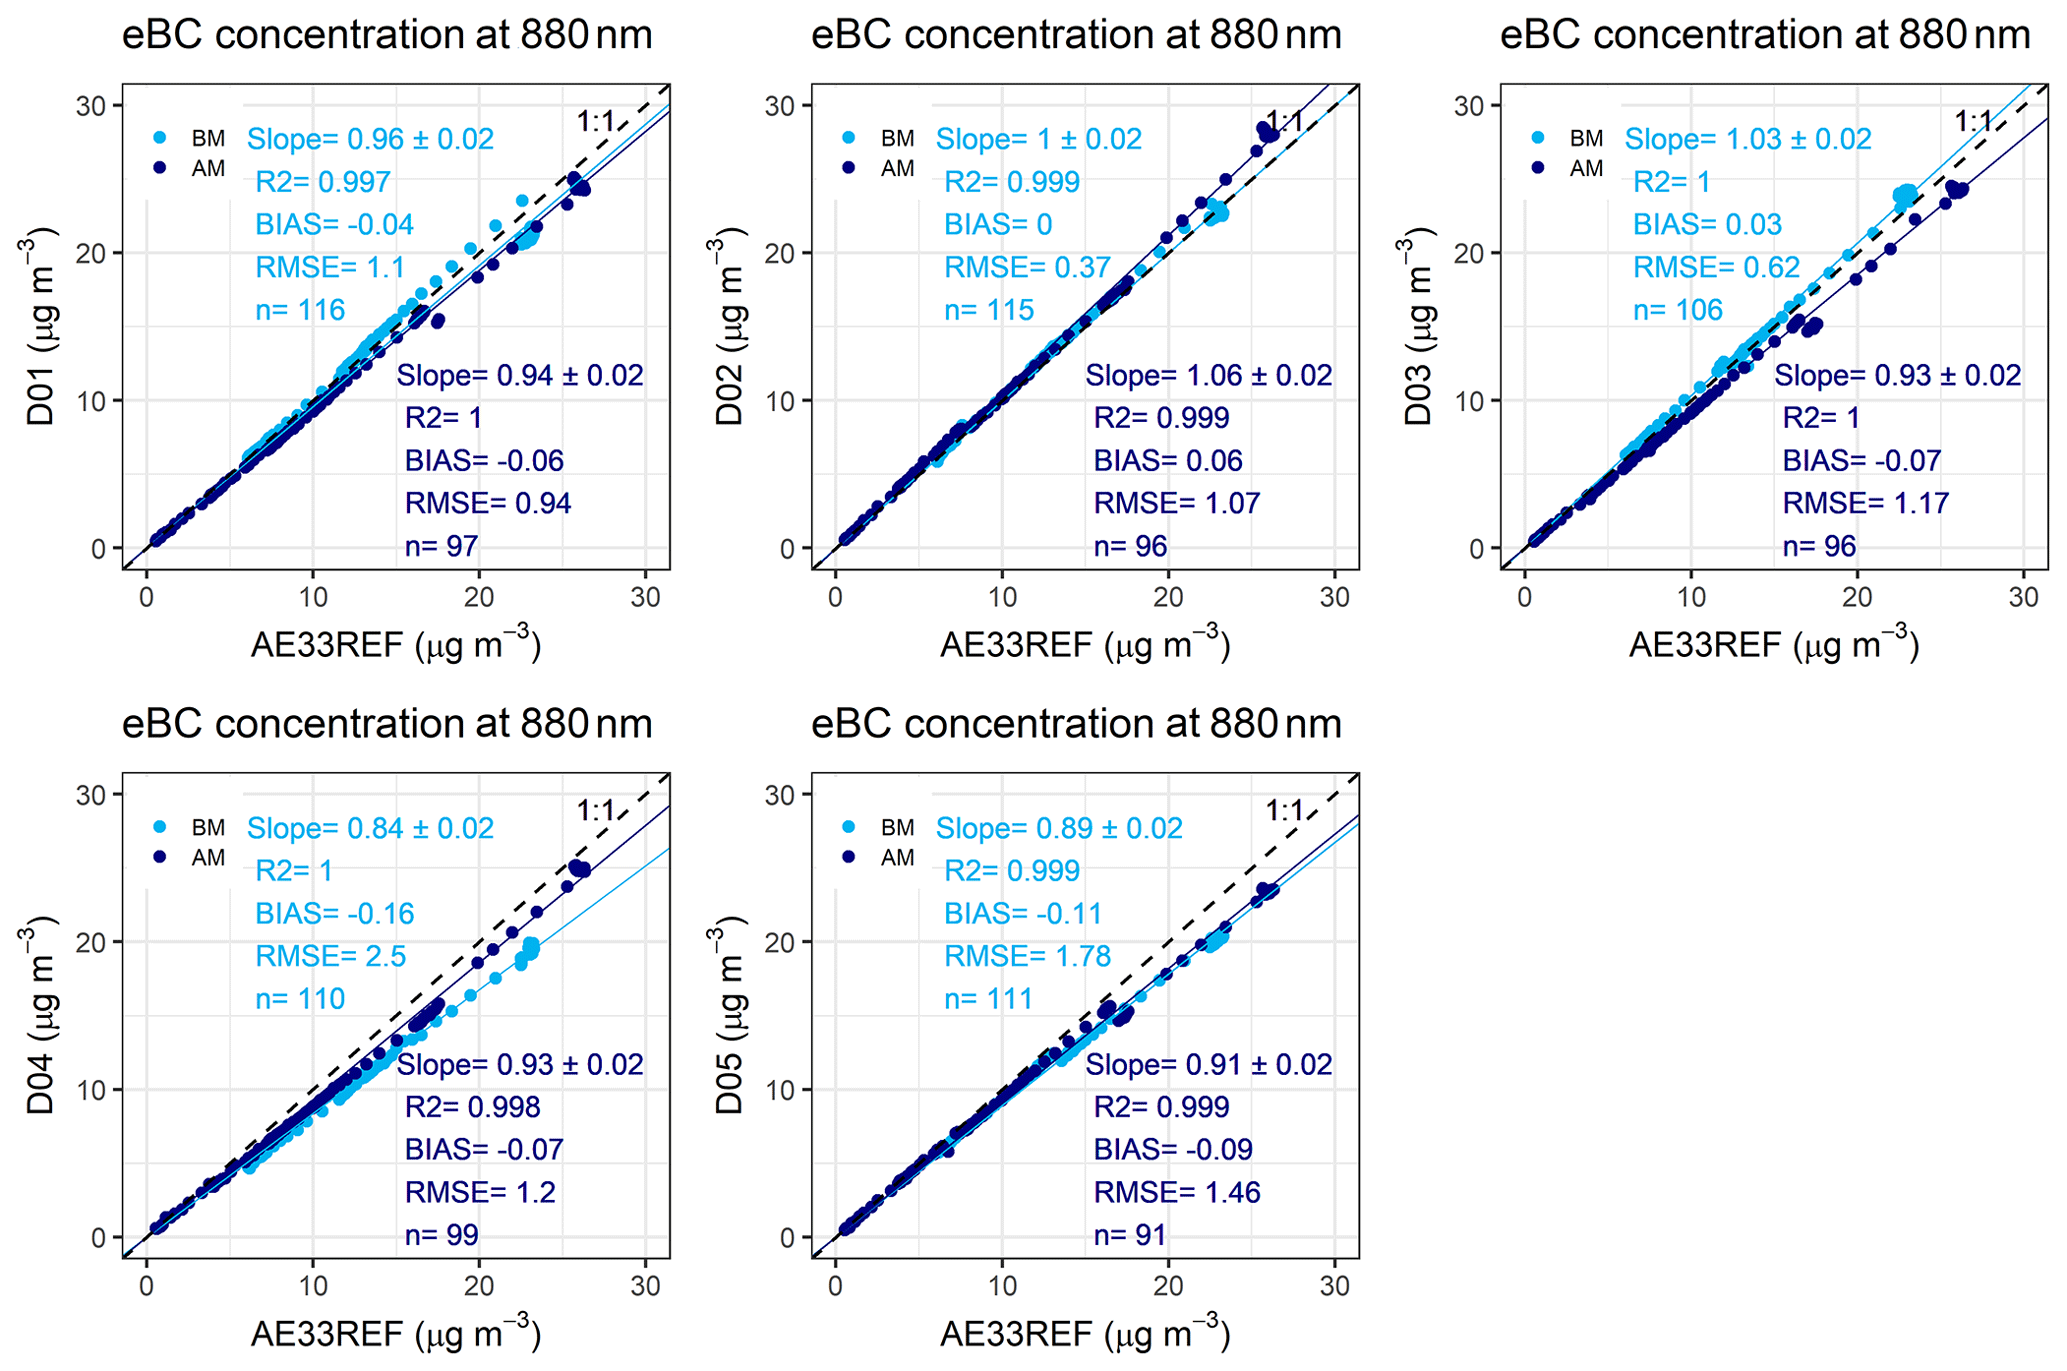
Figure 9Regression for the comparison of the instruments in group D and the reference Aethalometer before and after maintenance during soot measurements. The intercept was forced through zero. BM: before maintenance. AM: after maintenance.
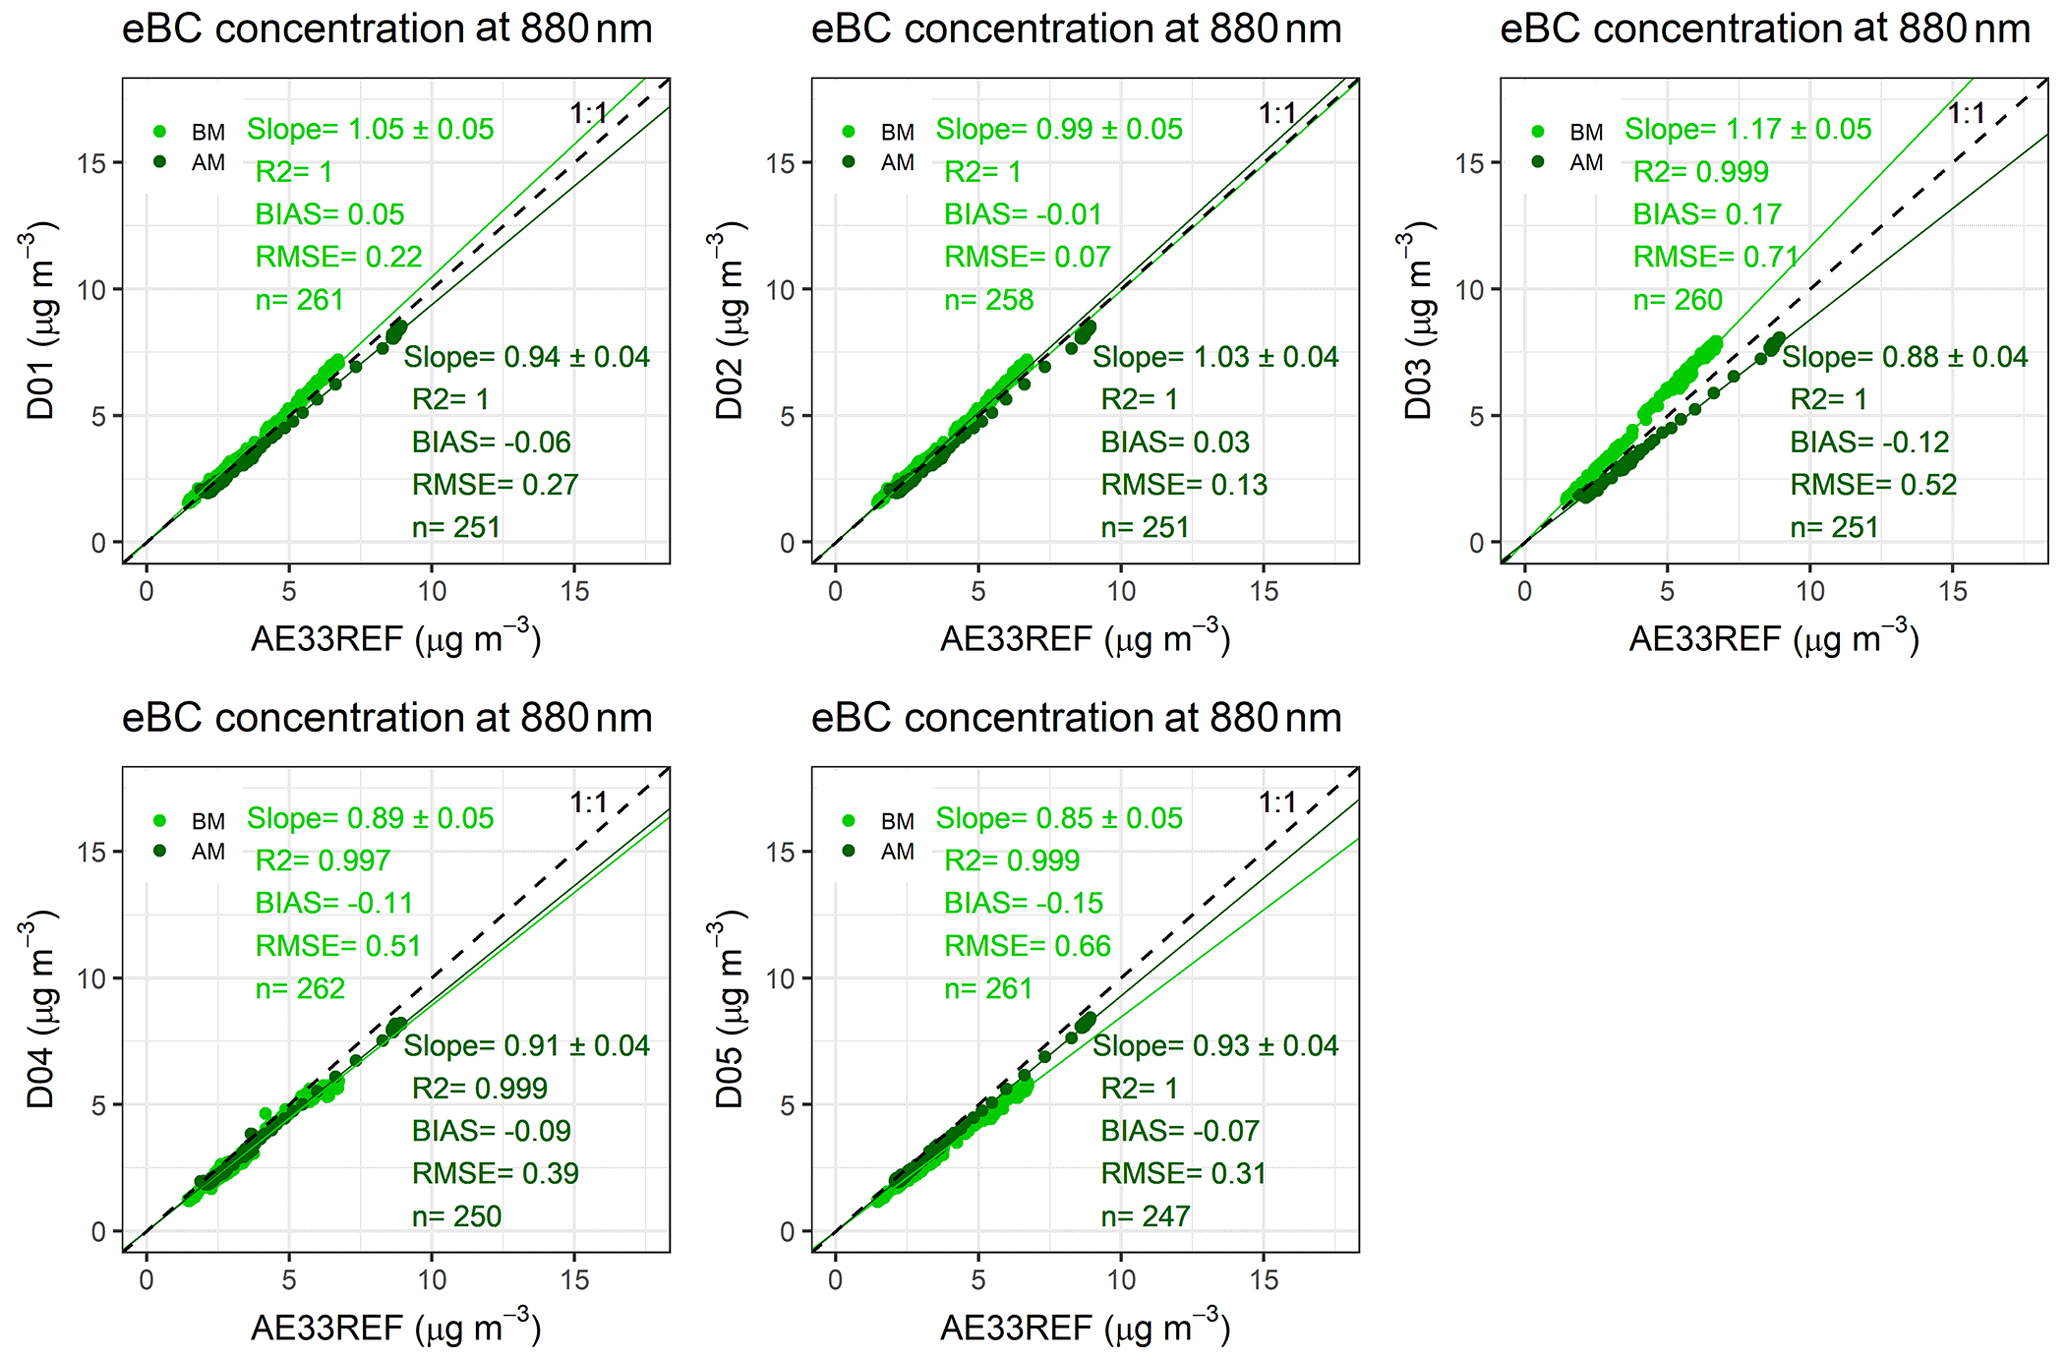
Figure 10Regression for the comparison of the instruments in group D and the reference Aethalometer before and after maintenance during nigrosin measurements. The intercept was forced through zero. BM: before maintenance. AM: after maintenance.
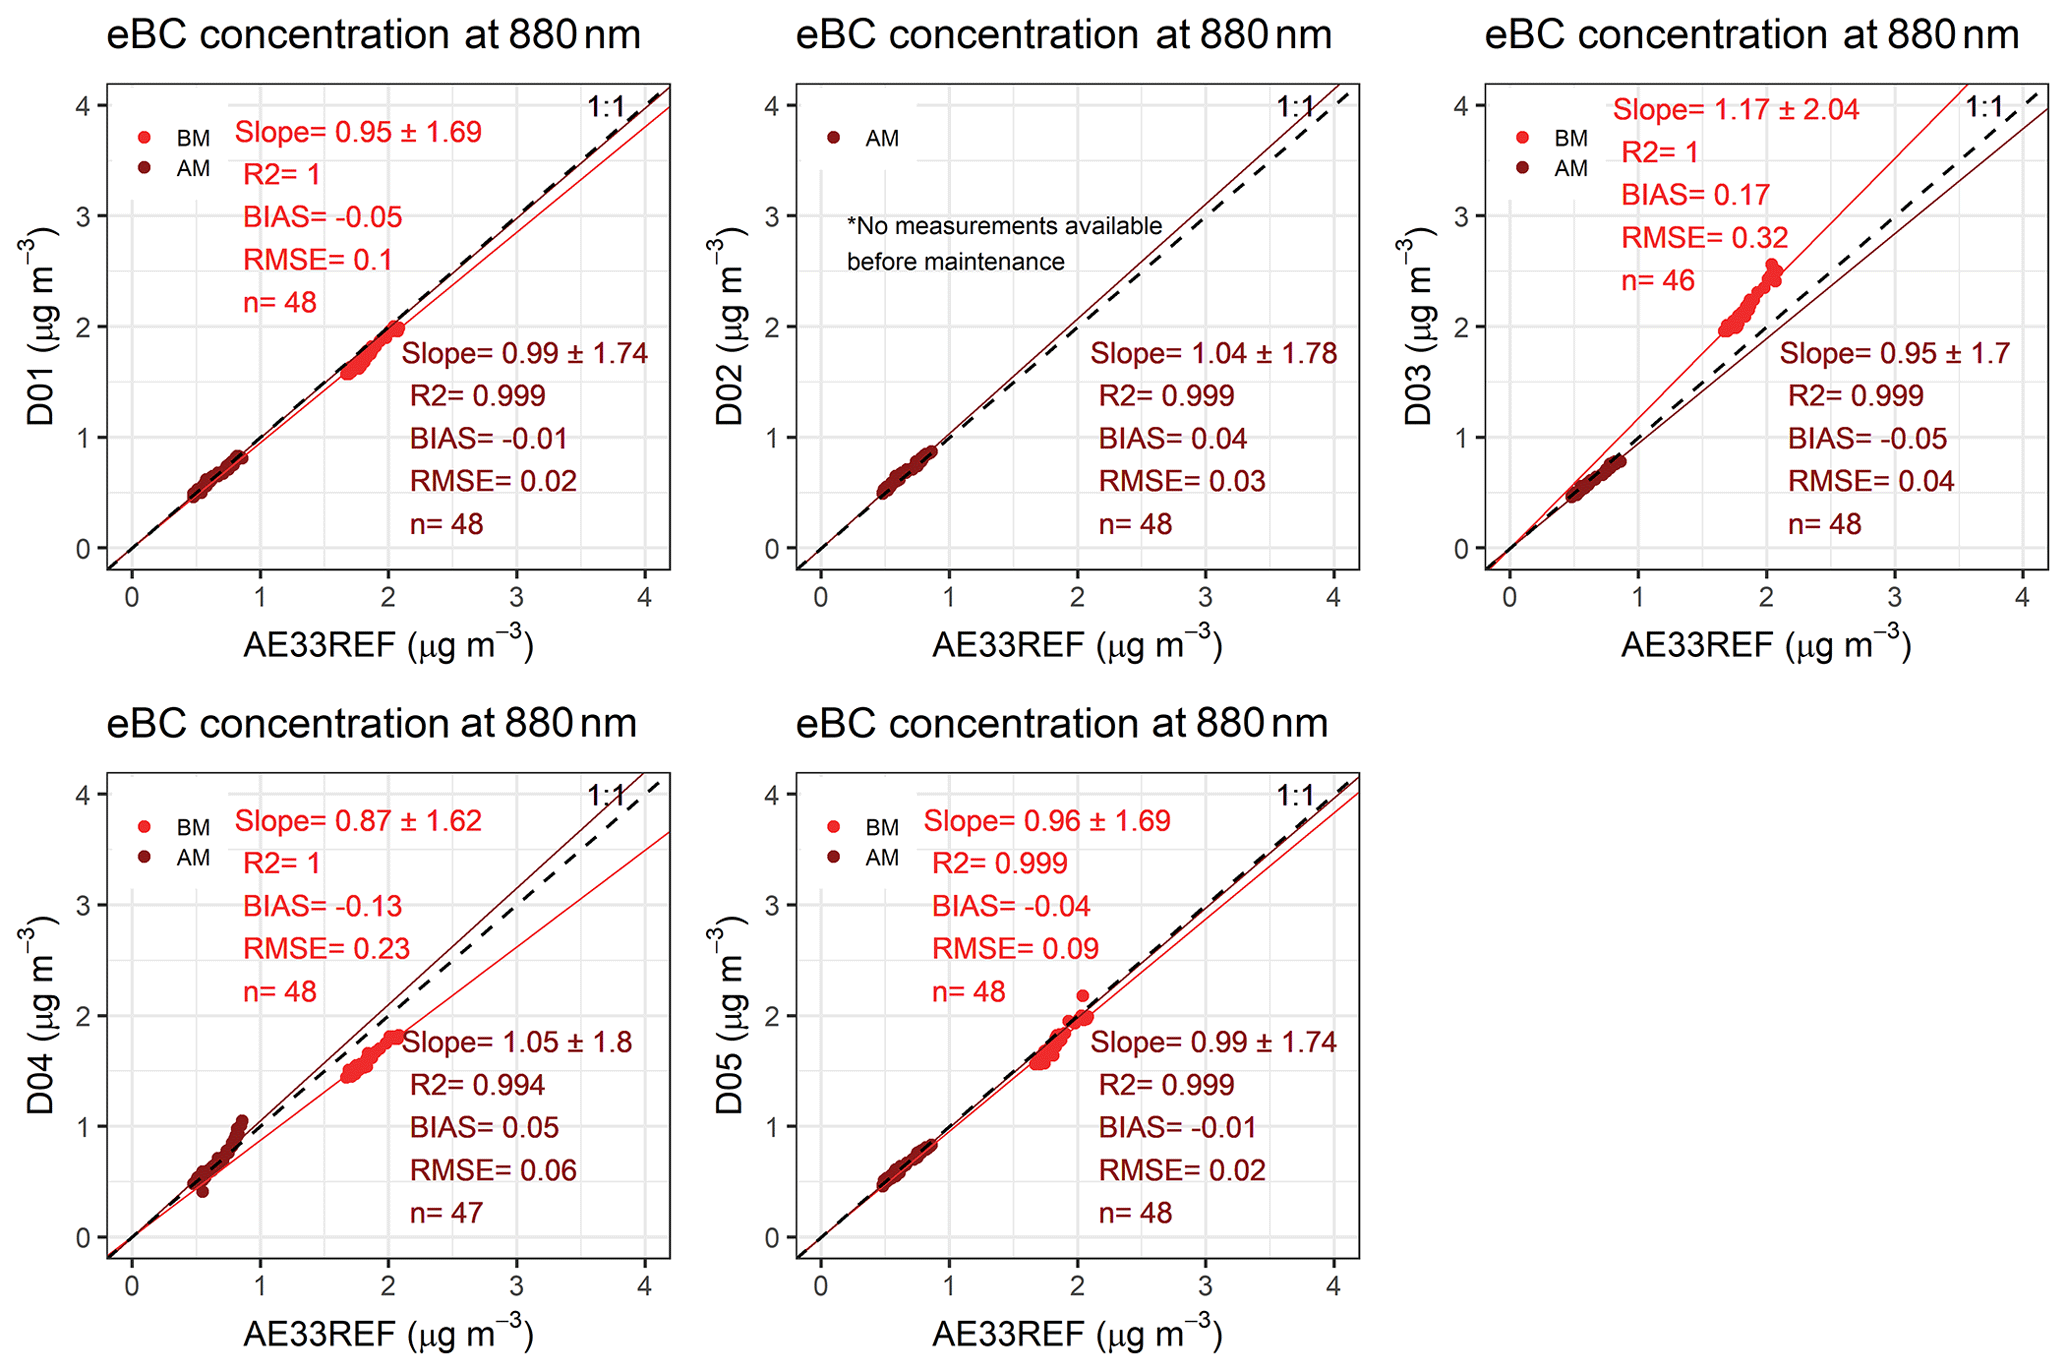
Figure 11Regression for the comparison of the instruments in group D and the reference Aethalometer before and after maintenance during ambient air measurements. The intercept was forced through zero. BM: before maintenance. AM: after maintenance.
The results from the regressions demonstrate acceptable agreement between the Aethalometers in group D, in general improved after maintenance activities. In soot measurements, the total average slope ranged from 0.94 (6 % deviation) before service to 0.95 (5 % deviation) after service. According to Fig. 9, the Aethalometers D01, D02, and D03 performed better before maintenance. The deviations of these three instruments (how much the slopes differ from 1, bias) are certainly higher after service, even if these deviations are all relatively low (<10 %). As mentioned earlier, the scatterplots and the Deming regressions were calculated using measurements performed after one or two tape advances to avoid the effects produced by the filter advance and the initial adjustment of the compensation algorithm. To evaluate the agreements among the instruments, it is fundamental to also observe the complete time series (Figs. 5, 6, and 8), which give a broader perspective of the performance of the instruments; from this observation it is evident that offsets and deviations are significantly higher before maintenance, more remarkable in the case of the instruments D03, D04, and D05.
In the case of nigrosin, the total average slope was 0.99 (1 % deviation) before service to 0.94 (6 % deviation) after service.
From the ambient air observations, low variabilities were estimated in group D; however, it is inaccurate to state that there is an improvement or not regarding the measurements before and after maintenance, as these concentrations were very low and rather stable, making the interpretation of the regression imprecise. In ambient air measurements, the instrumental noise (described in Sect. 3.3) becomes critical in sites with low BC concentrations. Before maintenance in group D, the 1 min average eBC concentration measured at 880 nm by the reference Aethalometer in the early morning time was 1.82 µg m−3, and the average noise calculated in this group was 0.038 µg m−3, representing 2 % of the reported eBC concentration. After maintenance, the average eBC was 0.65 µg m−3 (880 nm), and the average noise (see Sect. 3.3 below) was 0.037 µg m−3, representing 6 % of the average eBC.
Table 4 presents a summary for the regression analysis in group D and the other 18 Aethalometers intercompared showing the relative slope (AE33 vs. AE33 REF) and the determination coefficient R2 before and after maintenance.
Table 4Relative slope and correlation coefficients for total least squares regression forced through the origin for eBC mass concentrations (880 nm) before and after maintenance.
BM: before maintenance. AM: after maintenance. ND: no data.
Figures S12, S13, and S14 present the scatterplots from the intercomparison among the instruments D01 to D05 for soot, nigrosin, and ambient air, respectively.
3.2 Total unit-to-unit variability of the 23 Aethalometers
In general, the Aethalometers in groups A to F showed acceptable agreement when compared against our reference Aethalometer, and this improved in most of the cases after the maintenance activities. Out of the 23 Aethalometers intercompared, five instruments from groups B and D exhibited the highest unit-to-unit deviation. Regarding the eBC concentrations (880 nm), the total average deviation from the 23 instruments was −2.0 % before maintenance and −1.0 % after maintenance, for soot measurements. In nigrosin, the total average deviation changed from 0.4 % to 0.5 % before and after maintenance, respectively. It is not possible to calculate a fair comparison for ambient air measurements, considering the significantly low and stable concentrations measured during some days in the urban background in Leipzig and the fluctuations of concentrations in the workshops. The deviations calculated for the 23 Aethalometers at 880 nm are summarized in Table 4.
Flow verification and leakage test results were acceptable for most of the 23 instruments and are listed in Table 2; both results from the flow verification before and after maintenance are shown only for those instruments whose initial results were unsatisfactory and whose tests had to be repeated after maintenance. The flow calibration procedure was applied to five instruments; these presented an initially higher deviation in the lower flow tested (1 L min−1; 16 % on average), followed by the high flow (3 L min−1, 9 % on average) and the total flow (5 L min−1; 7 % on average). After maintenance the new results from the flow verification tests showed average deviations of 1.8 %, 0.9 %, and 0.1 % for the airflows of 1, 3, and 5 L min−1, respectively.
From the six groups, only three required a change in filter tape: D03, D04, and D05 (Table 2).
Wavelength dependency of the unit-to-unit variability
The change in the unit-to-unit variabilities according to wavelength was analyzed by calculating total least squares regressions of BC concentrations measured at the seven channels of the 23 Aethalometers intercompared against the reference AE33. The influence of the maintenance in these variabilities was also investigated. Figure 12 shows the boxplots representing the range of the deviations calculated for the 23 instruments; the figure includes the average values of the slope, bias, RMSE, and the coefficient of determination R2 before and after maintenance. A slope equaling 1 (red line) indicates the instruments are 1:1 in respect to the reference (0 % of deviation).
Figure 12Statistics from the unit-to-unit variabilities of the 23 units intercompared with the reference AE33, as a function of wavelength for soot, nigrosin, and ambient air: (a) slope, (b) R2, (c) bias, (d) RMSE. The black horizontal line inside the boxes represents the median value of the slope, R2, bias, and RMSE (statistical variables); the lower and upper borders of the boxes are the first and third quartiles, on which the middle 50 % of the statistical variables are located; the whiskers correspond to ranges for the bottom 25 % and the top 25 % without outliers (black points). The red line represents the slope and R2 equaling 1 (0 % of deviation) in the subplots (a, b) and the bias and RMSE equaling 0 in the subplots (b, c). BM: before maintenance. AM: after maintenance.
As seen in Fig. 12, no significant changes in the variabilities throughout the spectral range was seen during soot measurements, but slightly negative deviations were observed at 660 nm. The total range of variabilities also had a slight reduction after maintenance and the median slope values were closer to 1 during this period. A reduction in the values of RMSE was remarked at wavelengths 660, 880, and 950 nm. For nigrosin measurements, no significant changes were observed in the slopes with wavelength, but the spread of the values of slope increased after maintenance. A significant reduction in the values of RMSE was observed at wavelengths 880 and 950 nm during nigrosin measurements. The variabilities from measurements of eBC from ambient air showed a slightly reduced range after maintenance. No clear trend was observed with wavelengths, but negative deviations were seen at 590, 660, and 880 nm for ambient air data.
3.3 Instrumental noise
The instrumental noise defined as the single standard deviation of the eBC mass concentration was calculated with measurements of dry filtered air (particle-free, RH<40 %), reported with a time resolution of 1 min. Measurements were performed during 4±1 h on average. The noise dependency on the wavelength was also studied for each one of the 23 instruments, as well as the influence of the maintenance activities. The results from this analysis are summarized in Fig. 13 and Table S2.
Figure 13Average instrument noise at the measurement wavelengths at 1 min time resolution. The black horizontal line inside the boxes represents the median noise value; the lower and upper borders of the boxes are the first and third quartiles, on which the middle 50 % of the noise values are located; the whiskers correspond to ranges for the bottom 25 % and the top 25 % of the noise without outliers, which are represented by the black points. The red dashed line represents the noise equaling zero. BM: before maintenance. AM: after maintenance.
In general, the instrumental noise decreased after service, with more significant changes in the lower and middle wavelengths. The average noise at 1 min time resolution calculated at 370 nm ranged from 0.030 µg m−3 before maintenance to 0.023 µg m−3 after maintenance, which means a decrease of 32 %. At 660 nm, the average value of the instrumental noise dropped from 0.046 to 0.033 µg m−3, implying a reduction of 40 %, which is the highest average reduction for the seven wavelengths of the AE33. In the near-IR wavelengths the noise remained almost constant; at 880 nm the average noise did not change, passing from 0.032 to 0.031 µg m−3 before and after service, respectively; at 950 nm the average noise was 0.032 µg m−3 before and after maintenance. Larger noise values in the near-UV in multi-wavelength Aethalometers have been also found in previous intercomparison exercises when Aethalometers AE31 were intercompared (Müller et al., 2011).
From the average concentrations of ambient eBC (880 nm) measured every minute, the calculated instrumental noise represented between 1 % and 10 % of the concentrations measured in the urban background in Leipzig.
3.4 Wavelength dependency of the light absorption
The absorption Ångström exponents (α) were calculated for soot and ambient air measurements by applying a power law fitting describing the wavelength (λ) dependency of the aerosol light absorption (babs):
where A is a constant. The absorption coefficients babs were first determined from Eq. (5), using the 5 min averaged eBC mass concentrations and the default values of the mass absorption cross sections (σair) used by the AE33 for each wavelength (370 nm: 18.47 m2 g−1; 470 nm: 14.54 m2 g−1; 520 nm: 13.14 m2 g−1; 590 nm: 11.58 m2 g−1; 660 nm: 10.35 m2 g−1; 880 nm: 7.77 m2 g−1; 950 nm: 7.19 m2 g−1; Magee Scientific, 2018).
Figure 14 shows the histograms of α estimated for each instrument in group D and the reference Aethalometer before and after maintenance. During soot measurements (Fig. 14a), the median absorption Ångström exponents before maintenance ranged from 1.19 to 1.30; after maintenance, the median values fluctuated from 1.21 to 1.29. For ambient air (Fig. 14b), the median α before maintenance varied from 1.43 to 1.77; after maintenance, the median α ranged from 1.34 to 1.4. For both aerosol sources, the variability of the absorption Ångström exponents were reduced after maintenance (soot: interquartile range, IQR, before maintenance =0.08, IQR after maintenance =0.05; ambient air: IQR before maintenance =0.10, IQR after maintenance =0.07). Values of α larger than 1, may indicate the presence of organic compounds in the aerosol particles of soot and ambient air. It has been demonstrated that α is also dependent in the aerosol size and coating (Liu et al., 2018; Virkkula, 2020).
Figure 14Absorption Ångström exponent (α) calculated using power law fitting of the absorption from 370 to 950 nm for the instruments in group D and the reference Aethalometer before and after maintenance during measurements of (a) soot and (b) ambient air. BM: before maintenance. AM: after maintenance.
The values of the absorption Ångström exponents shown in Fig. 14 were calculated using the absorption from channels 1 to 7 (370 to 950 nm); some studies suggest that the omission of babs, 370 nm reduces the uncertainty in the estimation of the absorption Ångström exponent and its use in source apportion models (Zotter et al., 2017). We have revised the impact of calculating α with measurements from six channels (470 to 950 nm), but no significant advantage or improvement was found from the omission of babs, 370 nm while calculating α from the samples measured in this study.
In this study, we presented the methodology and results from a comprehensive characterization and intercomparison workshop for Aethalometer model AE33 (Magee Scientific). Twenty-three instruments were intercompared at the World Calibration Centre for Aerosol Physics (WCCAP) in Germany, measuring and reporting eBC mass concentrations of laboratory-produced aerosols and ambient air at an urban background site. The instruments received maintenance and were compared against the reference WCCAP Aethalometer. The influence of maintenance activities, the filter material, and different aerosol sources on the instrumental variabilities were investigated.
The average unit-to-unit variability in the measurements of eBC mass concentrations (880 nm) reported by the 23 instruments was −2.0 % for soot and 0.4 % for nigrosin before maintenance. After the maintenance activities, the average variabilities were −1.0 % and 0.5 % for soot and nigrosin, respectively. The average variabilities were calculated using data from measurements performed after one or two filter tape advances to stabilize the internal correction algorithm, as variabilities increased a few minutes before a tape advance, when the attenuation is close to 120; in some cases, the offsets among the instruments reached up to >25 %. Tape advances are also crucial since the instruments need to fully adjust to the new aerosol sources and local conditions and calculate appropriate values of the compensation parameters k. The aerosol composition and the filter material exert an influence on the rate of attenuation change and the k values. The combination of these factors directly influences the compensated eBC mass concentrations. Therefore, it is recommended to allow one or two tape advances in the Aethalometers before the valid data are obtained for intercomparison purposes or when the instrument is moved to a new location. For ambient air, the calculation of the total average variability may be biased, as the concentrations measured in the workshops were low (some days <0.30 µg m−3) and stable during the intercomparisons and unequal among the different groups of instruments. Nevertheless, the results within groups were satisfactory even for very low concentrations measured with a time resolution of 1 min.
Scientists performing laboratory experiments need to understand the functioning of the internal compensation algorithm; the compensation parameter used immediately after the tape is advanced and measurements are restarted is the parameter from the previous measurements. If the sample being measured has changed (in our case measurements of soot after measurements of nigrosin, for example), the compensation algorithm will use the wrong compensation parameter, which was determined from the previous sample spot. The users need to wait for a new tape advance before using the automatically compensated data. If the experimental setup does not allow for this, manual compensation is necessary.
One of the most important characteristics of the Aethalometer AE33 is the reporting of eBC mass concentrations at seven wavelengths. From the intercomparison data analysis, no significant influence of the wavelength in the unit-to-unit variabilities was seen. This fact is important as the spectral range covered by this instrument is usually employed in source apportionment studies. However, the instrumental noise calculated was slightly higher before maintenance in lower (370 nm: 0.030 µg m−3; 470 nm: 0.041 µg m−3) and middle wavelengths (660 nm: 0.046 µg m−3); it improved significantly after maintenance (370 nm: 0.023 µg m−3; 470 nm: 0.031 µg m−3; 660 nm: 0.033 µg m−3). For higher wavelengths, the instrumental noise was lower and remained almost constant before and after maintenance (880 nm: 0.031 µg m−3; 950 nm: 0.032 µg m−3). The instrumental noise was calculated as the single standard deviation of the eBC mass concentrations measured from dry particle-free air; it is important in clean environments with ambient air concentrations similar to those measured during the intercomparisons (0.2 to 3 µg m−3). Noise accounted up to 10 % of the average ambient eBC mass concentration reported. The instrumental noise contributes to the uncertainty of the measurements and must be considered when comparing BC observations intra-site and inter-site in monitoring networks. The unit-to-unit variabilities also contributes to the uncertainties in the reported eBC inside monitoring networks; these will account for uncertainties associated with instrument flow calibration, leakages, internal correction factors, and filter material.
To ensure the measurements of eBC made with filter-based absorption photometers are comparable, reliable, and traceable on time, the performance of intercomparisons and maintenance activities is crucial; the type of filter material employed is also very important, as each filter has specific optical properties affecting the measurements of attenuation, used to calculate black carbon mass concentrations. The utilization of a different filter material may result in differences of up to 30 %, even after completing the standard maintenance activities. In the AE33 it is strongly recommended to use the most recent version of filter tape (M8060) and to avoid the use of older versions. However, if an Aethalometer operates with an older type of filter, it is absolutely necessary to check the use of the corresponding multiple-scattering parameter C in the internal settings. This value needs to be checked and confirmed each time the filter tape is changed. Both the filter type and the correction parameter C should be reported alongside the measurement data when submitting the measurements to databases like EBAS. The change in tape from one (T60A20, also referred to as M8020) type to the current one (M8060) requires the user to change the multiple-scattering parameter C and the leakage factor Zeta. In our experience, this is the most important systematic error in the measurements that the user can make in a field or laboratory measurement campaign. The operators must perform maintenance following the frequencies and instructions given in the user manual. Flow verification, a leakage test, and a check of the spot shape are good starting points to verify the instrument performance. When carrying out a flow verification and calibration, an externally calibrated flowmeter should be used and care should be taken on the flow reporting conditions, otherwise the test and calibration are not reliable. Cleaning the optical chamber and checking the absence of blocking materials in the airflow sample lines is also vital and should be done more frequently in polluted environments.
Experiment data will be available at the Public data repository for experimental aerosol physics from the Leibniz Institute for Tropospheric Research TROPOS, https://exp-aerosol-physics.tropos.de/public/publications/2021/Cuesta_et_al_amt (last access: 31 March 2021, TROPOS, 2021).
The supplement related to this article is available online at: https://doi.org/10.5194/amt-14-3195-2021-supplement.
LD, ACM, TM, GM, SP, and AW planned and designed the study. All co-authors participated in the experiments. ACM processed the data and prepared the paper with inputs from LD, TM, GM, and AW.
Luka Drinovec and Griša Močnik have in the past, but not during the described work or its planning, been employed by the manufacturer of the Aethalometer AE33; they are now employed in part by Haze Instruments d.o.o., Slovenia.
ACTRIS (Aerosols, Clouds and Trace gases Research Infrastructure) and COLOSSAL (COST Action CA16109 Chemical On-Line cOmpoSition and Source Apportionment of fine aerosoL) are thanked for their logistical support in the preparation and execution of the workshops. The WCCAP is thanked for hosting the experiments in their laboratories. Aerosol d.o.o., Slovenia, the manufacturer of the Aethalometer AE33, is thanked for troubleshooting support during the workshops. María Fernández-Amado acknowledges the Ministerio de Ciencia e Innovación (PTA2017-13607-I).
ACTRIS and COLOSSAL provided financial support for the execution of the experiments. Instrument S04-00387 is operated and maintained thanks to the Spanish Ministry of Science and Innovation (project nos. CGL2016-81092-R, CGL2017-42 90884REDT, and RTI2018.101154.A.I00). Gloria Titos is funded by the Juan de la Cierva-Incorporación postdoctoral program (grant no. IJCI-2016-29838). IMT Lille Douai (Joel Ferreira De Brito, Veronique Riffault) received financial support from the Labex CaPPA project, which is funded by the French National Research Agency (ANR) through the PIA (Programme d'Investissement d'Avenir) (contract no. ANR-11-LABX-0005-01), and the CLIMIBIO project; both projects are financed by the Regional Council “Hauts-de-France” and the European Regional Development Fund (ERDF). The operation of instruments S00-00055 and S02-00156 is funded by the projects CRISOL (MINECO/AEI/FEDER, UE; grant no. CGL2017-85344-R) and TIGAS-CM (grant no. Y2018/EMT-5177).
This paper was edited by Hang Su and reviewed by three anonymous referees.
Ajtai, T., Kiss-Albert, G., Utry, N., Tóth, A., Hoffer, A., Szabó, G., and Bozóki, Z.: Diurnal variation of aethalometer correction factors and optical absorption assessment of nucleation events using multi-wavelength photoacoustic spectroscopy, J. Environ. Sci., 83, 96–109, https://doi.org/10.1016/j.jes.2019.01.022, 2019.
Bond, T. C., Doherty, S. J., Fahey, D. W., Foster, P. M., Berntsen, T., DeAngelo, B. J., Flanner, M. G., Ghan, S., Kärcher, B., Koch, D., Kinne, S., Kondo, Y., Quinn, P. K., Sarofim, M. C., Schultz, M. G., Schulz, M., Venkataraman, C., Zhang, H., Zhang, S., Bellouin, N., Guttikunda, S. K., Hopke, P. K., Jacobson, M. Z., Kaiser, J. W., Klimont, Z., Lohmann, U., Schwarz, J. P., Shindell, D., Storelvmo, T., Warren, S. G., and Zender, C. S.: Bounding the role of black carbon in the climate system: A scientific assessment, J. Geophys. Res.-Atmos., 118, 5380–5552, https://doi.org/10.1002/jgrd.50171, 2013.
Chen, J., Wu, Z., Augustin-Bauditz, S., Grawe, S., Hartmann, M., Pei, X., Liu, Z., Ji, D., and Wex, H.: Ice-nucleating particle concentrations unaffected by urban air pollution in Beijing, China, Atmos. Chem. Phys., 18, 3523–3539, https://doi.org/10.5194/acp-18-3523-2018, 2018.
Collaud Coen, M., Weingartner, E., Apituley, A., Ceburnis, D., Fierz-Schmidhauser, R., Flentje, H., Henzing, J. S., Jennings, S. G., Moerman, M., Petzold, A., Schmid, O., and Baltensperger, U.: Minimizing light absorption measurement artifacts of the Aethalometer: evaluation of five correction algorithms, Atmos. Meas. Tech., 3, 457–474, https://doi.org/10.5194/amt-3-457-2010, 2010.
Cornbleet, P. J. and Gochman, N.: Incorrect least-squares regression coefficients in method-comparison analysis, Clin. Chem., 25, 432–438, https://doi.org/10.1093/clinchem/25.3.432, 1979.
Drinovec, L., Močnik, G., Zotter, P., Prévôt, A. S. H., Ruckstuhl, C., Coz, E., Rupakheti, M., Sciare, J., Müller, T., Wiedensohler, A., and Hansen, A. D. A.: The “dual-spot” Aethalometer: an improved measurement of aerosol black carbon with real-time loading compensation, Atmos. Meas. Tech., 8, 1965–1979, https://doi.org/10.5194/amt-8-1965-2015, 2015.
Drinovec, L., Gregorič, A., Zotter, P., Wolf, R., Bruns, E. A., Prévôt, A. S. H., Petit, J.-E., Favez, O., Sciare, J., Arnold, I. J., Chakrabarty, R. K., Moosmüller, H., Filep, A., and Močnik, G.: The filter-loading effect by ambient aerosols in filter absorption photometers depends on the coating of the sampled particles, Atmos. Meas. Tech., 10, 1043–1059, https://doi.org/10.5194/amt-10-1043-2017, 2017.
EEA: Status of black carbon monitoring in ambient air in Europe, EEA Technical report No 18/2013, European Environment Agency, Luxembourg, Luxembourg, 43 pp., 2013.
Gundel, L. A., Dod, R. L., Rosen, H., and Novakov, T.: The relationship between optical attenuation and black carbon, Sci. Total Environ., 36, 197–202, https://doi.org/10.1016/0048-9697(84)90266-3, 1984.
Hansen, A. D. A., Rosen, H., and Novakov, T.: Real-time measurement of the absorption coefficient of aerosol particles, Appl. Optics, 21, 3060–3062, 1982.
Hansen, A. D. A., Rosen, H., and Novakov, T.: The Aethalometer – an instrument for the real-time measurement of optical absorption by aerosol particles, Sci. Total Environment, 36, 191–196, https://doi.org/10.1016/0048-9697(84)90265-1, 1984.
Hitzenberger, R., Jennings, S. G., Larson, S. M., Dillner, A., Cachier, H., Galambos, Z., Rouc, A., and Spain, T. G.: Intercomparison of measurement methods for black carbon aerosols, Atmos. Environ., 33, 2823–2833, https://doi.org/10.1016/S1352-2310(98)00360-4, 1999.
Hitzenberger, R., Petzold, A., Bauer, H., Ctyroky, P., Pouresmaeil, P., Laskus, L., and Puxbaum, H.: Intercomparison of thermal and optical measurement methods for elemental carbon and black carbon at an urban location, Environ. Sci. Technol., 40, 6377–6383, https://doi.org/10.1021/es051228v, 2006.
Janssen, N. A. H., Hoek, G., Simic-Lawson, M., Fischer, P., van Bree, L., Brink, H., Keuken, M., Atkinson, R. W., Ross Anderson, H., Brunekreef, B., and Cassee, F. R.: Black carbon as an additional indicator of the adverse health effects of airborne particles compared with PM10 and PM2.5, Environ. Health Perspect., 119, 1691–1699, https://doi.org/10.1289/ehp.1003369, 2011.
Jing Ltd: Real Soot Generator Model 5203 Type C miniCAST Instruction Manual, Jing Aerosol, Zollikofen, Switzerland, 2013.
Koch, D., Bauer, S. E., Del Genio, A., Faluvegi, G., McConnell, J. R., Menon, S., Miller, R. L., Rind, D., Ruedy, R., Schmidt, G. A., and Shindell, D.: Coupled aerosol-chemistry-climate twentieth-century transient model investigation: trends in short-lived species and climate responses, J. Climate, 24, 2693–2714, https://doi.org/10.1175/2011JCLI3582.1, 2011.
Lack, D. A., Moosmüller, H., McMeeking, G. R., Chakrabarty, R. K., and Baumgardner, D.: Characterizing elemental, equivalent black, and refractory black carbon aerosol particles: A review of techniques, their limitations and uncertainties, Anal. Bioanal. Chem., 406, 99–122, https://doi.org/10.1007/s00216-013-7402-3, 2014.
Liu, C., Chung, C. E., Yin, Y., and Schnaiter, M.: The absorption Ångström exponent of black carbon: from numerical aspects, Atmos. Chem. Phys., 18, 6259–6273, https://doi.org/10.5194/acp-18-6259-2018, 2018.
Magee Scientific: Aethalometer Model AE33 User Manual Version 1.57, Aerosol d.o.o., Ljubljana, Slovenia, 2018.
Müller, T., Henzing, J. S., de Leeuw, G., Wiedensohler, A., Alastuey, A., Angelov, H., Bizjak, M., Collaud Coen, M., Engström, J. E., Gruening, C., Hillamo, R., Hoffer, A., Imre, K., Ivanow, P., Jennings, G., Sun, J. Y., Kalivitis, N., Karlsson, H., Komppula, M., Laj, P., Li, S.-M., Lunder, C., Marinoni, A., Martins dos Santos, S., Moerman, M., Nowak, A., Ogren, J. A., Petzold, A., Pichon, J. M., Rodriquez, S., Sharma, S., Sheridan, P. J., Teinilä, K., Tuch, T., Viana, M., Virkkula, A., Weingartner, E., Wilhelm, R., and Wang, Y. Q.: Characterization and intercomparison of aerosol absorption photometers: result of two intercomparison workshops, Atmos. Meas. Tech., 4, 245–268, https://doi.org/10.5194/amt-4-245-2011, 2011.
Petzold, A., Kopp, C., and Niessner, R.: The dependence of the specific attenuation cross-section on black carbon mass fraction and particle size, Atmos. Environ., 31, 661–672, https://doi.org/10.1016/S1352-2310(96)00245-2, 1997.
Petzold, A., Ogren, J. A., Fiebig, M., Laj, P., Li, S.-M., Baltensperger, U., Holzer-Popp, T., Kinne, S., Pappalardo, G., Sugimoto, N., Wehrli, C., Wiedensohler, A., and Zhang, X.-Y.: Recommendations for reporting “black carbon” measurements, Atmos. Chem. Phys., 13, 8365–8379, https://doi.org/10.5194/acp-13-8365-2013, 2013.
Ramanathan, V. and Carmichael, G.: Global and regional climate changes due to black carbon, Nat. Geosci., 1, 221–227, https://doi.org/10.1038/ngeo156, 2008.
Ruoss, K., Dlugi, R., Weigl, C., and Hänel, G.: Intercomparison of different aethalometers with an absorption technique: laboratory calibrations and field measurements, Atmos. Environ., 27, 1221–1228, https://doi.org/10.1016/0960-1686(92)90472-W, 1993.
Saturno, J., Pöhlker, C., Massabò, D., Brito, J., Carbone, S., Cheng, Y., Chi, X., Ditas, F., Hrabě de Angelis, I., Morán-Zuloaga, D., Pöhlker, M. L., Rizzo, L. V., Walter, D., Wang, Q., Artaxo, P., Prati, P., and Andreae, M. O.: Comparison of different Aethalometer correction schemes and a reference multi-wavelength absorption technique for ambient aerosol data, Atmos. Meas. Tech., 10, 2837–2850, https://doi.org/10.5194/amt-10-2837-2017, 2017.
Therneau, T.: Deming, Theil-Sen, Passing-Bablock and Total Least Squares Regression, R package version 1.4, available at: https://CRAN.R-project.org/package=deming (last access: 18 January 2021), 2018.
Tørseth, K., Aas, W., Breivik, K., Fjæraa, A. M., Fiebig, M., Hjellbrekke, A. G., Lund Myhre, C., Solberg, S., and Yttri, K. E.: Introduction to the European Monitoring and Evaluation Programme (EMEP) and observed atmospheric composition change during 1972–2009, Atmos. Chem. Phys., 12, 5447–5481, https://doi.org/10.5194/acp-12-5447-2012, 2012.
TROPOS: Public data repository for experimental aerosol physics, Leibniz Institute for Tropospheric Research, available at: https://exp-aerosol-physics.tropos.de/public/publications/2021/Cuesta_et_al_amt, last access: 31 March 2021.
Virkkula, A.: Modeled source apportionment of black carbon particles coated with a light-scattering shell, Atmos. Meas. Tech. Discuss. [preprint], https://doi.org/10.5194/amt-2020-438, in review, 2020.
Virkkula, A., Mäkelä, T., Hillamo, R., Yli-Tuomi, T., Hirsikko, A., Hämeri, K., and Koponen, I. K.: A simple procedure for correcting loading effects of aethalometer data, J. Air Waste Manage., 57, 1214–1222, https://doi.org/10.3155/1047-3289.57.10.1214, 2007.
Weingartner, E., Saathoff, H., Schnaiter, M., Streit, N., Bitnar, B., and Baltensperger, U.: Absorption of light by soot particles: Determination of the absorption coefficient by means of aethalometers, J. Aerosol Sci., 34, 1445–1463, https://doi.org/10.1016/S0021-8502(03)00359-8, 2003.
Wex, H., Huang, L., Zhang, W., Hung, H., Traversi, R., Becagli, S., Sheesley, R. J., Moffett, C. E., Barrett, T. E., Bossi, R., Skov, H., Hünerbein, A., Lubitz, J., Löffler, M., Linke, O., Hartmann, M., Herenz, P., and Stratmann, F.: Annual variability of ice-nucleating particle concentrations at different Arctic locations, Atmos. Chem. Phys., 19, 5293–5311, https://doi.org/10.5194/acp-19-5293-2019, 2019.
WHO: Health effects of black carbon, World Health Organization Regional Office for Europe, Copenhagen, Denmark, 86 pp., 2012.
WMO: GAW Report No. 227, WMO/GAW Aerosol Measurement Procedures, Guidelines and Recommendations, World Meteorological Organization and Global Atmosphere Watch, Geneva, Switzerland, 93 pp., 2016.
Zotter, P., Herich, H., Gysel, M., El-Haddad, I., Zhang, Y., Močnik, G., Hüglin, C., Baltensperger, U., Szidat, S., and Prévôt, A. S. H.: Evaluation of the absorption Ångström exponents for traffic and wood burning in the Aethalometer-based source apportionment using radiocarbon measurements of ambient aerosol, Atmos. Chem. Phys., 17, 4229–4249, https://doi.org/10.5194/acp-17-4229-2017, 2017.