the Creative Commons Attribution 4.0 License.
the Creative Commons Attribution 4.0 License.
 | 03 May 2021
Intercomparison of thermal–optical carbon measurements by Sunset and Desert Research Institute (DRI) analyzers using the IMPROVE_A protocol
Xiaolu Zhang
Krystyna Trzepla
Warren White
Sean Raffuse
Nicole Pauly Hyslop
Thermal–optical analysis (TOA) is a class of methods widely used for determining organic carbon (OC) and elemental carbon (EC) in atmospheric aerosols collected on filters. Results from TOA vary not only with differences in operating protocols for the analysis, but also with details of the instrumentation with which a given protocol is carried out. Three models of TOA carbon analyzers have been used for the IMPROVE_A protocol in the past decade within the Chemical Speciation Network (CSN). This study presents results from intercomparisons of these three analyzer models using two sets of CSN quartz filter samples, all analyzed using the IMPROVE_A protocol with reflectance charring correction. One comparison was between the Sunset model 5L (Sunset) analyzers and the Desert Research Institute (DRI) model 2015 (DRI-2015) analyzers using 4073 CSN samples collected in 2017. The other comparison was between the Sunset and the DRI model 2001 (DRI-2001) analyzers using 303 CSN samples collected in 2007.
Both comparisons showed a high degree of inter-model consistency in total carbon (TC) and the major carbon fractions, OC and EC, with a mean bias within 5 % for TC and OC and within 12 % for EC. Relatively larger and diverse inter-model discrepancies (mean biases of 5 %–140 %) were found for thermal subfractions of OC and EC (i.e., OC1–OC4 and EC1–EC3), with better agreement observed for subfractions with higher mass loadings and smaller within-model uncertainties. Optical charring correction proved critical in bringing OC and EC measurements by different TOA analyzer models into agreement. Appreciable inter-model differences in EC between Sunset and DRI-2015 (mean bias ±SD of 21.7 %±12.2 %) remained for ∼5 % of the 2017 CSN samples; examination of these analysis thermograms revealed that the optical measurement (i.e., filter reflectance and transmittance) saturated in the presence of strong absorbing materials on the filter (e.g., EC), leaving an insufficient dynamic range for the detection of carbon pyrolysis and thus no optical charring correction. Differences in instrument parameters and configuration, possibly related to disagreement in OC and EC subfractions, are also discussed.
Our results provide a basis for future studies of uncertainties associated with the TOA analyzer model transition in assessing long-term trends of CSN carbon data. Further investigations using these data are warranted, focusing on the demonstrated inter-model differences in OC and EC subfractions. The within- and inter-model uncertainties are useful for model performance evaluation.
- Article
(2114 KB) - Full-text XML
- BibTeX
- EndNote


Carbonaceous aerosols are a major component of ambient PM2.5 (Zhang et al., 2007), which has important effects on visibility (Watson, 2002), health (Pope and Dockery, 2006), and regional to global climate (IPCC, 2014). Thermal–optical analysis (TOA) is a conventional method employed by long-term monitoring networks to distinguish organic carbon (OC) from elemental carbon (EC) in quartz filter samples of PM2.5. In this method, carbonaceous aerosols are separated into OC and EC by recording carbon evolved under programmed progressive heating, initially in an inert atmosphere, followed by further heating with oxygen present, after making an optically guided correction for the effects of sample charring (Huntzicker et al., 1982). The resulting OC–EC split is sensitive to details of the heating sequence and atmosphere, as well as the optical correction procedure.
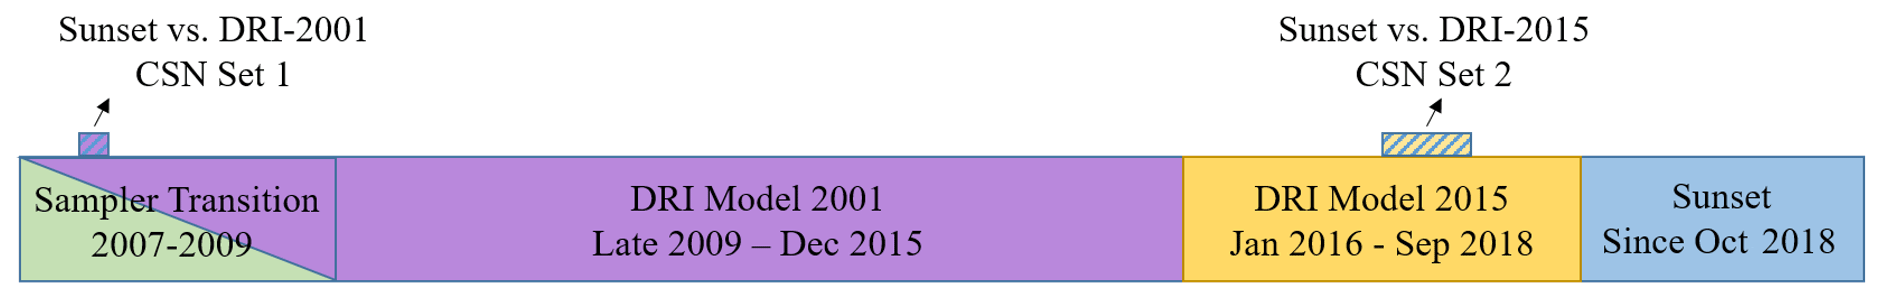
Figure 1Timeline of CSN-wide changes in carbon analysis from 2007 to present, including changes in sample collection and analytical protocol during the “sampler transition” period from 2007–2009, as well as two instrumentation changes in 2016 and late 2018. The approximate sample date ranges of the CSN 2007 (Set 1) and 2017 (Set 2) filter sets used in the inter-model comparisons are marked on the timeline.
The Chemical Speciation Network (CSN) was created to support implementation of the 1997 PM2.5 National Ambient Air Quality Standards (NAAQS) (EPA, 1997). Within the network, 24 h PM2.5 samples are collected on different filter media (e.g., PTFE, nylon, and quartz) at approximately 160 sites across the US, most of which are located in urban areas, and analyzed for PM2.5 chemical components. Since its inception, CSN has been using the TOA method for carbon analysis on quartz filters but with evolving sample collection methods, thermal–optical analytical protocols, and instrumentation (Spada and Hyslop, 2018). Prior to 2007, CSN used varied sampler designs for collecting carbon samples on 47 mm diameter quartz filters, from which OC and EC were determined by Sunset analyzers that implemented the NIOSH thermal–optical transmittance (TOT) protocol (Birch and Cary, 1996). During the years 2007–2009, the network transitioned to using URG-3000N samplers to collect carbon samples on 25 mm diameter quartz filters, coinciding with the change in the analytical protocol from NIOSH TOT to IMPROVE_A thermal–optical reflectance (TOR) (Chow et al., 2007), to be more consistent with the US Interagency Monitoring of PROtected Visual Environments (IMPROVE) network. Since late 2009, no change has occurred in the analytical protocol or sample collection, but there were two TOA analyzer model transitions. As shown in Fig. 1, at the beginning of 2016, TOA carbon analysis for CSN transitioned from using Desert Research Institute (DRI) model 2001 analyzers (termed “DRI-2001” hereinafter) to DRI model 2015 multiwavelength analyzers (termed “DRI-2015” hereinafter) as a result of instrument upgrade. Again in October 2018, CSN TOA transitioned from using DRI-2015 analyzers to Sunset Laboratory model 5L analyzers (termed “Sunset” hereinafter) due to change in the analytical laboratory (from DRI to UC Davis). In addition to the abovementioned changes, the network started blank subtraction on carbon data in November 2015.
While measurement differences among thermal protocols (e.g., IMPROVE_A, NIOSH, EUSAAR) and between optical corrections (e.g., reflectance vs. transmittance) have been extensively studied and documented in the literature (e.g., Conny et al., 2003; Chow et al., 2004; Watson et al., 2005; Khan et al., 2012; Chan et al., 2019), less attention has so far been given to possible differences in OC–EC splits produced by nominally identical analytical protocols carried out on differently designed and manufactured instrument systems. Some comparisons were focused on examining variations between different units of the same model (e.g., Schauer et al., 2003; Ammerlaan et al., 2015). A previous study by Chow et al. (2015) compared results from the 2001 and 2015 models of the DRI analyzers using 67 urban (from Fresno Supersite) samples and 73 rural (from IMPROVE network) samples and concluded that no significant difference was found in EC or OC reported by the two models. Wu et al. (2012) compared a Sunset analyzer and a DRI-2001 analyzer using ∼100 ambient samples collected in the Pearl River Delta in China and reported similar consistency for OC and EC. While these studies provided insights on the inter-model comparison of different TOA analyzers, their sample sizes were limited.
The goal of this study is to characterize the consistency and differences in the results reported from the three TOA models successively deployed in the CSN running the same protocol, IMPROVE_A with reflectance charring correction. Two models, the DRI-2001 (manufactured by Atmoslytic, Inc.) and the DRI-2015 (manufactured by Magee Scientific), were designed by DRI. The third model, the Sunset model 5L (designed and manufactured by Sunset Laboratory, Inc.), is equipped with dual optical units and is capable of running multiple protocols, including the NIOSH and IMPROVE_A protocols. For each model type there have been multiple units dedicated for CSN carbon analysis in the past decade, including eight DRI-2001 units (Chow et al., 2007), 13 DRI-2015 units, and five Sunset units. In this study, two sets of 25 mm diameter quartz filter samples from the CSN were analyzed, each by a pair of models, for TC, OC, EC, and thermal subfractions (OC1–OC4, EC1–EC3, and OP). These samples, which were collected during September to October of 2007 (Set 1) and May to September of 2017 (Set 2), covered a great variety of emission sources and meteorological conditions given the wide spatial coverage of the CSN, ensuring statistically robust comparison among the three instrument models. Findings from these two comparisons provide a basis for accounting for TOA model transitions in future studies of CSN carbon long-term trends. Statistics such as within- and inter-model uncertainties between Sunset and DRI analyzers are presented and are useful for studies evaluating model predictions against CSN data (e.g., Emery et al., 2017), as well as source apportionment studies using speciated PM2.5 carbon data (e.g., Kim and Hopke, 2005; Liu et al., 2006).
2.1 Instrumentation in comparison
Table 1 lists the major differences among the three TOA carbon analyzer models used in the intercomparisons. The differences in laser source, carbon detection, and temperature calibration method are discussed in more detail as follows.
Table 1Key attributes of three analyzer models (DRI model 2001, DRI model 2015, and Sunset analyzers) for comparison.
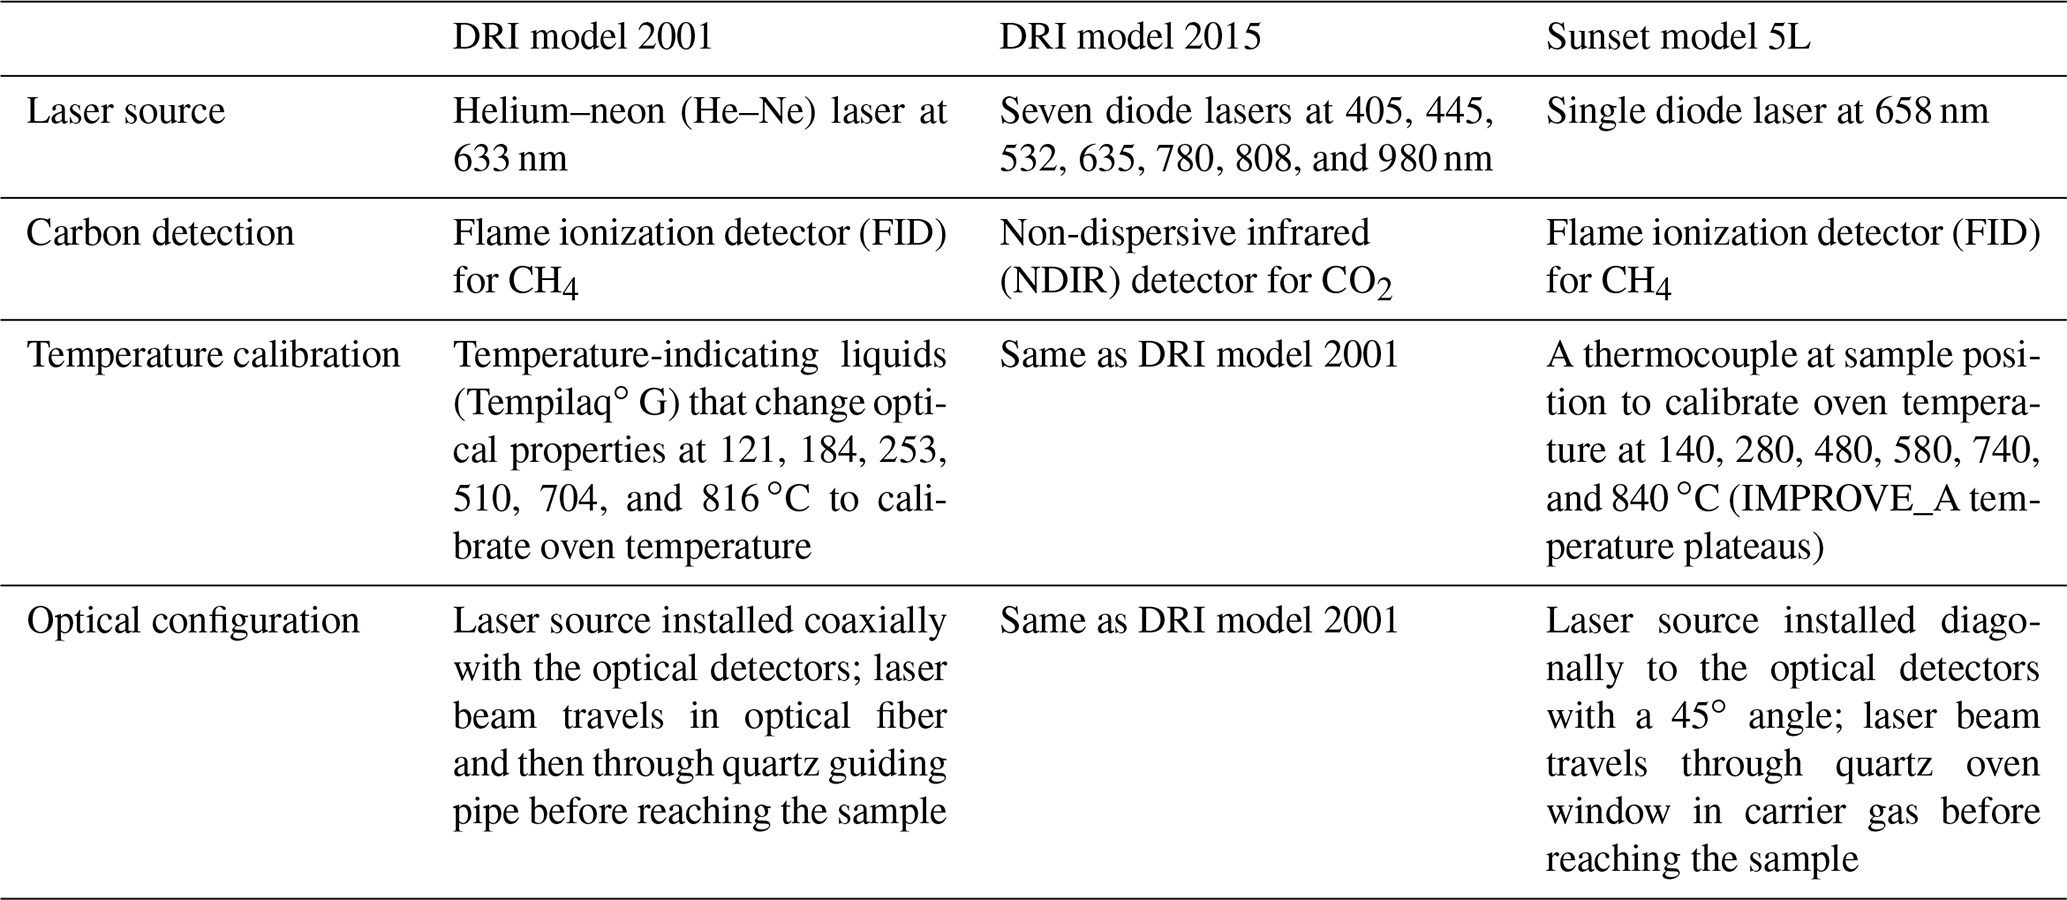
Laser source. The Sunset and DRI-2001 analyzers employ a single-wavelength laser source for measurement of filter reflectance and transmittance. The Sunset analyzer uses a diode laser at 658 nm, whereas DRI-2001 employs a helium–neon (He–Ne) laser at 633 nm. DRI-2015 employs seven diode lasers with differing wavelengths from 405 to 980 nm (Chen et al., 2015). For CSN samples analyzed by DRI-2015, the 635 nm EC data, reported as EC by reflectance, are considered equivalent to the 633 nm data reported by the DRI-2001 analyzer (Chen et al., 2015) and are therefore used in this study for comparison with the Sunset measurements.
Carbon detection. Both DRI-2001 and Sunset analyzers use a flame ionization detector (FID) that quantifies CH4, whereas DRI-2015 uses a non-dispersive infrared (NDIR) detector to quantify CO2. These two types of detectors have distinct responses to interference and noise levels; thus, different signal integration methods are used (further discussed in Sect. 3.2.2).
Temperature calibration. Temperature calibration in TOA refers to the method used to adjust oven temperatures measured by the integrated thermocouple based on the response of an external temperature-indicating device. Sunset and DRI analyzers adopt fundamentally different methods to calibrate the temperature plateaus in the IMPROVE_A protocol. In a Sunset analyzer, a thermocouple, positioned ∼2 cm downstream of the sample filter holder, is used to monitor the sample temperature at each IMPROVE_A temperature set point during an analysis. The distance between the thermocouple and sample punch is accounted for in temperature calibration by placing another thermocouple at the sample punch position, measuring the difference between the readings from the two probes, and adjusting the settings in the thermal analytical protocol accordingly (i.e., temperature offsets). The temperature offsets in Sunset analyzers can vary greatly per temperature step depending on the heat dissipation inside the oven (Panteliadis et al., 2015; Phuah et al., 2009). On the other hand, DRI used Tempilaq∘ G, a type of quick-drying chemical, as temperature indicators in the temperature calibration for both analyzer models (DRI, 2016; Chow et al., 2005). Briefly, six Tempilaq∘ G liquids that change optical properties at 121, 184, 253, 510, 704, and 816 ∘C were used in calibrating the six IMPROVE_A temperature plateaus (140, 280, 480, 580, 740, and 840 ∘C). During the analysis of each Tempilaq∘ G sample, the oven temperature is slowly incremented to a narrow range near the temperature at which the specific Tempilaq∘ G changes color, while the laser reflectance and transmittance are monitored for a sharp rise in response to the change. The sample oven temperature values are regressed on the corresponding Tempilaq∘ G temperatures and are interpolated and/or extrapolated to the IMPROVE_A temperatures based on the linear regression slope and intercept.
2.2 Experimental data
2.2.1 Sample description
Two sets of CSN carbon samples collected on 25 mm diameter quartz filters were respectively analyzed in the two inter-model comparisons. Set 1 consists of 303 CSN filters sampled in September and October 2007 that were previously analyzed by DRI with the DRI-2001 models in the year 2008 (Fig. 1). These filters were retrieved from cold storage and reanalyzed by UC Davis using Sunset analyzers in 2017/18. Set 2 consists of 4073 CSN samples and 622 CSN field blanks collected between May and September 2017, which were sequentially analyzed by the Sunset analyzers at UC Davis and by the DRI-2015 analyzers at DRI within a year after sample collection. Both sets cover a variety of emission sources given the wide spatial coverage of the CSN.
Owing to the destructive nature of the TOA method and the limited sample deposit area of the filter (3.53 cm2), only a maximum of three 0.5–0.6 cm2 circular punches can be taken from one filter sample. No replicate measurements were available in Set 1 due to sample unavailability. A subset of filters within Set 2 were replicated by both Sunset and DRI-2015 analyzers to evaluate the within-model uncertainty (detailed in Sect. 2.2.3).
2.2.2 Thermal–optical analysis with IMPROVE_A protocol
Thermal–optical carbon analysis with the IMPROVE_A protocol was carried out by placing a filter punch in the sample oven of a carbon analyzer. Following the thermal program set by IMPROVE_A, the filter punch is first heated in an inert (100 % He) atmosphere where various OC subfractions volatilize at 140 ∘C (OC1), 280 ∘C (OC2), 480 ∘C (OC3), and 580 ∘C (OC4). The system is then switched to an oxidizing atmosphere (He with a fixed amount of O2) where EC subfractions combust at 580 ∘C (EC1), 740 ∘C (EC2), and 840 ∘C (EC3). The liberated carbon compounds are converted to either carbon dioxide (CO2) or methane (CH4), followed by infrared absorption (CO2) or flame ionization (CH4) detection.
During the thermal analysis, a fraction of OC pyrolyzes or chars under the inert He atmosphere into EC-like substances and is accounted for using optical correction by reflectance. Specifically, sample filter reflectance is monitored throughout the analysis using a laser source (Table 1). The filter reflectance decreased in response to the formation of OP and then increased as the OP was combusted. The split between OC and EC is defined as the point when reflectance returned to its initial reading before the heating started.
Equations (1)–(4) show how carbon fractions are related with and without charring correction applied. The uncorrected OC, termed OC, is the sum of all volatilized carbon under the inert atmosphere, whereas the uncorrected EC, termed EC, is the sum of all oxidized carbon that includes both native EC and charred OC. Unless otherwise noted, the OC and EC data discussed below refer to those corrected by reflectance.
Sunset and DRI-2015 data are reported in mass loadings (µg cm−2). Sunset raw data were processed using a custom R computing package developed by UC Davis (hereinafter referred to as “UCD-Sunset data processing”). The program slightly modifies the algorithms provided by the Sunset calculation software (version 423) in that (1) premature EC evolution was not considered and (2) no correction was made for the dependency of laser reflectance on temperature. DRI-2015 data were calculated by the program supplied by the manufacturer. DRI-2001 data from the archived 2007 CSN samples were downloaded from the EPA Air Quality System (AQS) database (https://aqs.epa.gov/aqsweb/documents/data_api.html, last access: 28 April 2021). The concentration data (µg m−3) were converted to mass loadings (µg cm−2) using a nominal sample volume (33 m3) and filter area (3.53 cm2) for direct comparison against the Sunset data. The use of nominal instead of the actual sample volume adds little uncertainty, given the stringency of CSN operational tolerances for flow rate and sample duration.
2.2.3 Quality control
Blank measurement
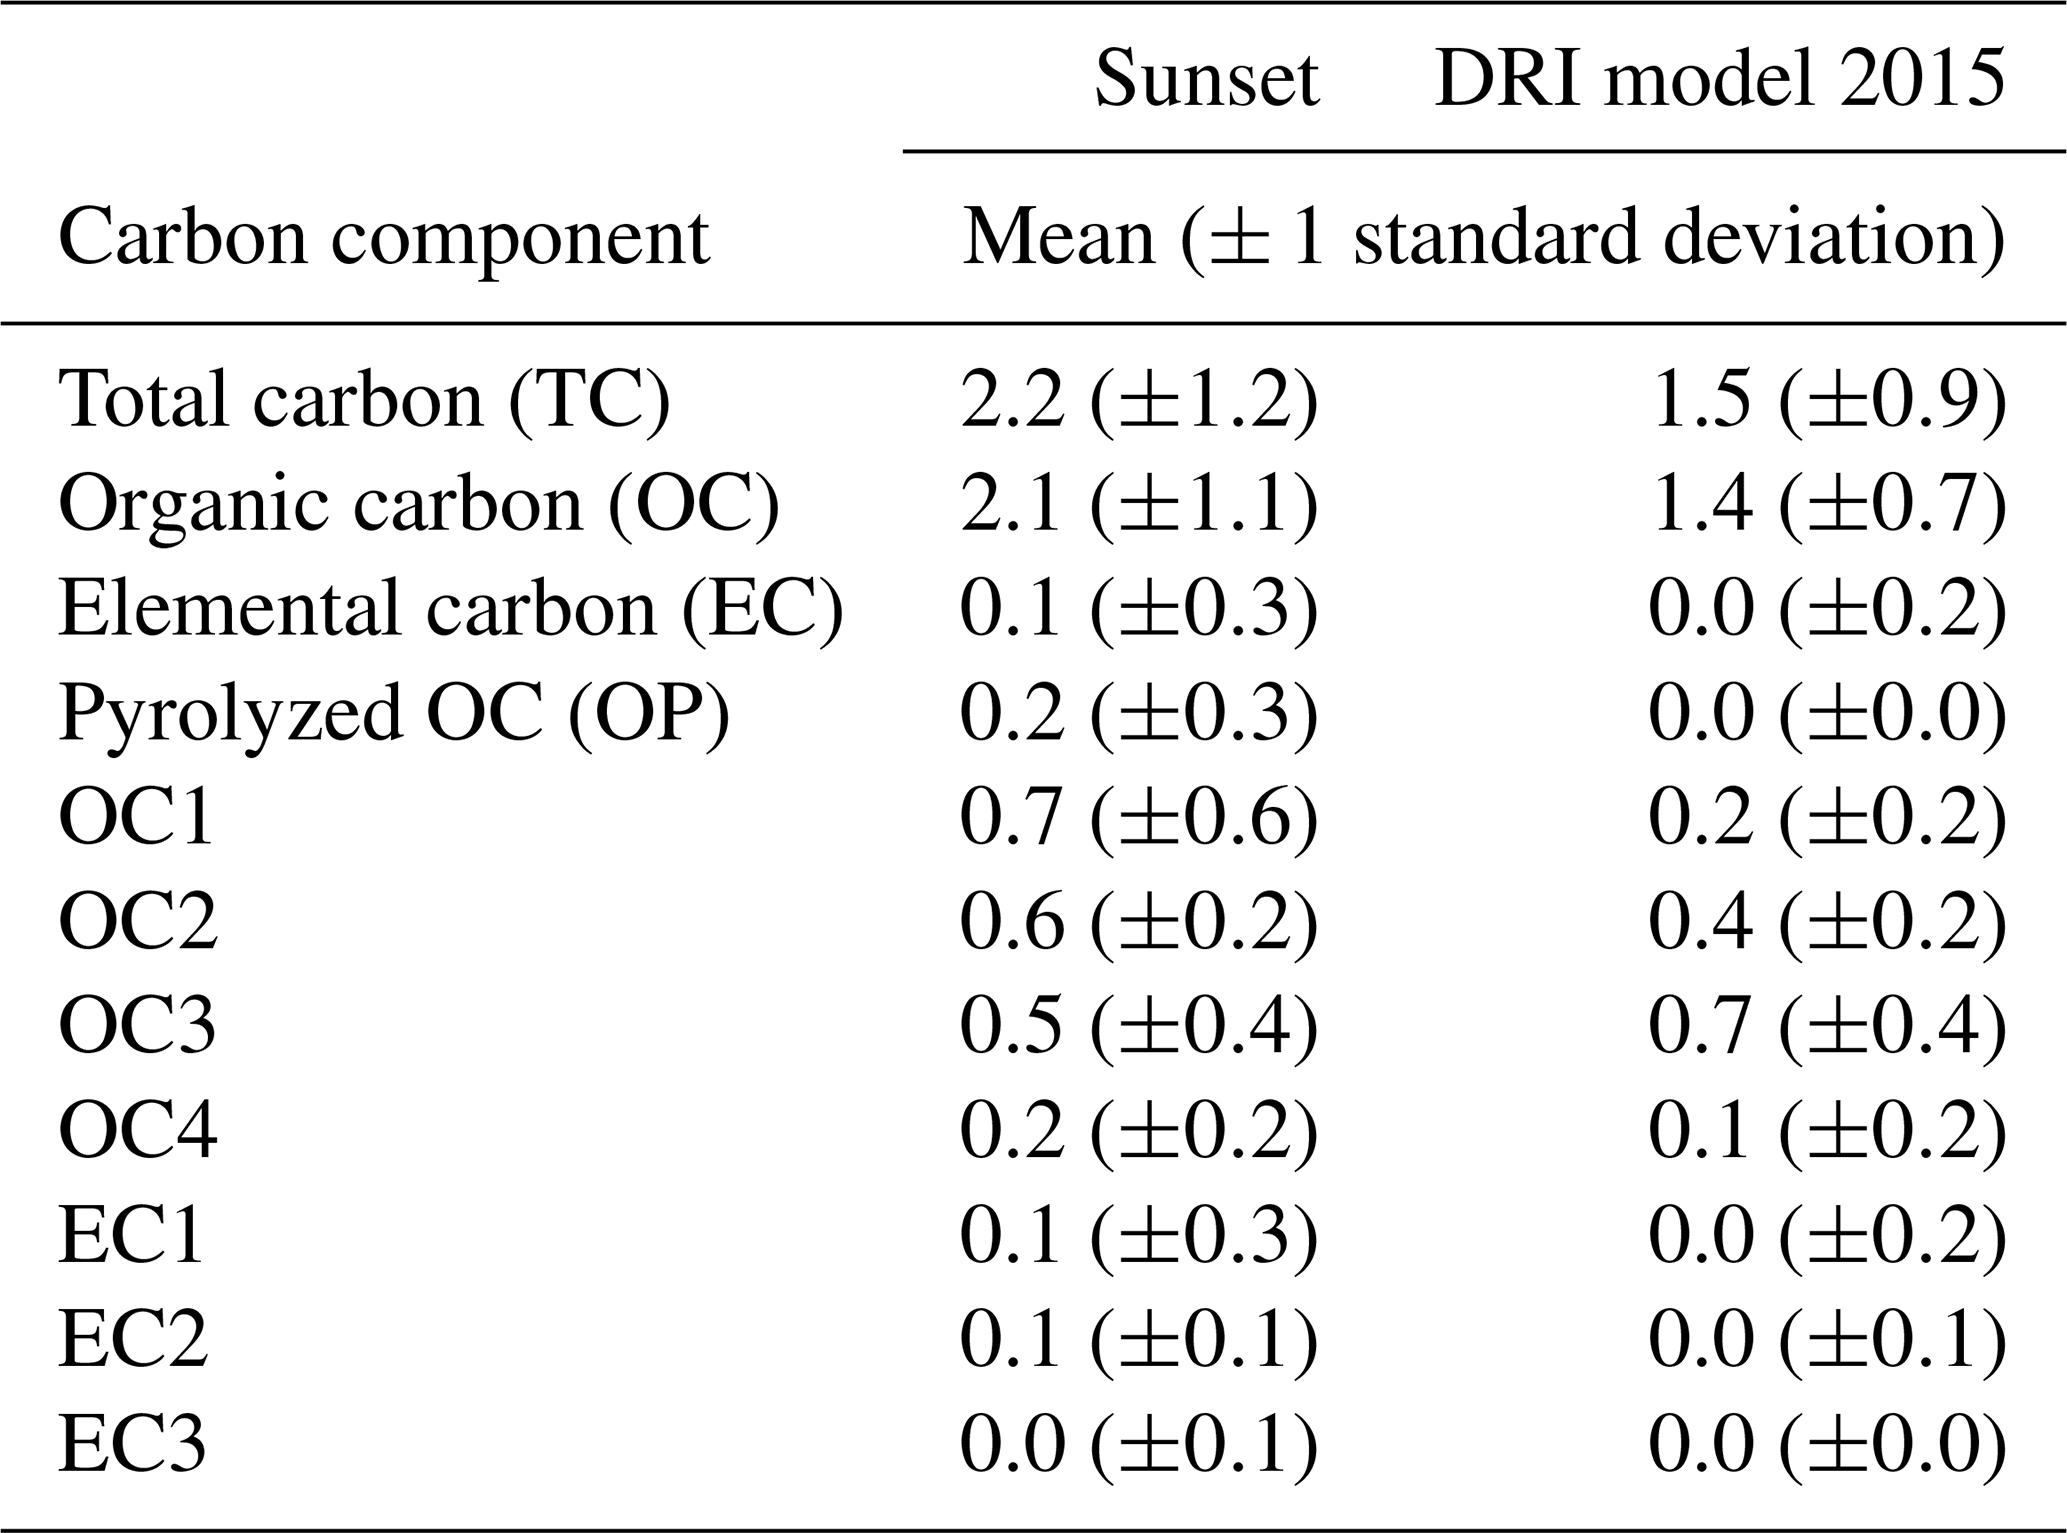
Table 2 summarizes the mean and standard deviation of the carbon mass loadings from measurements of 622 CSN field blanks by the Sunset and DRI-2015 analyzers. OC and EC levels on blank filters are minimal. The difference between analyzers is also trivial. Sunset and DRI-2015 mass loading data were not blank-subtracted to allow for direct comparison with the DRI-2001 data.
Table 2Mean and standard deviation (1σ) of the carbon mass loadings (µg cm−2) from 622 field blank measurements by the Sunset and DRI model 2015 analyzers.
Calibration
The FID and NDIR detector responses are normalized to a known amount of CH4 gas (i.e., 5 % CH4 in helium gas by mixing ratio) that is injected at the end of each sample analysis. In addition, the detector linearity was verified and calibrated by a set of carbon-containing aqueous solutions. Specifically, sucrose (C12H22O11) standards with a concentration spanning from 2 to 210 µ g C cm−2 were used to calibrate the Sunset analyzers (UCD, 2019). The two DRI models were calibrated using 5 to 20 µL of 1800 ppm of sucrose and KHP (C8H5KO4) solution (DRI, 2012, 2016). The split between OC and EC cannot be calibrated or verified due to the lack of reference material for EC (Baumgardner et al., 2012).
Measurement uncertainty
The measurement uncertainty of the Sunset and DRI-2015 analyzers was estimated separately utilizing data from replicate analyses (i.e., two analyses on the same filter sample by the same analyzer model). Within the 2017 sample set, a total of 519 and 518 samples were replicated by Sunset and DRI-2015 analyzers, respectively. Due to the limited sample deposit area of CSN 25 mm diameter quartz filters, the replicate analyses by Sunset and DRI analyzers were performed on different filters.
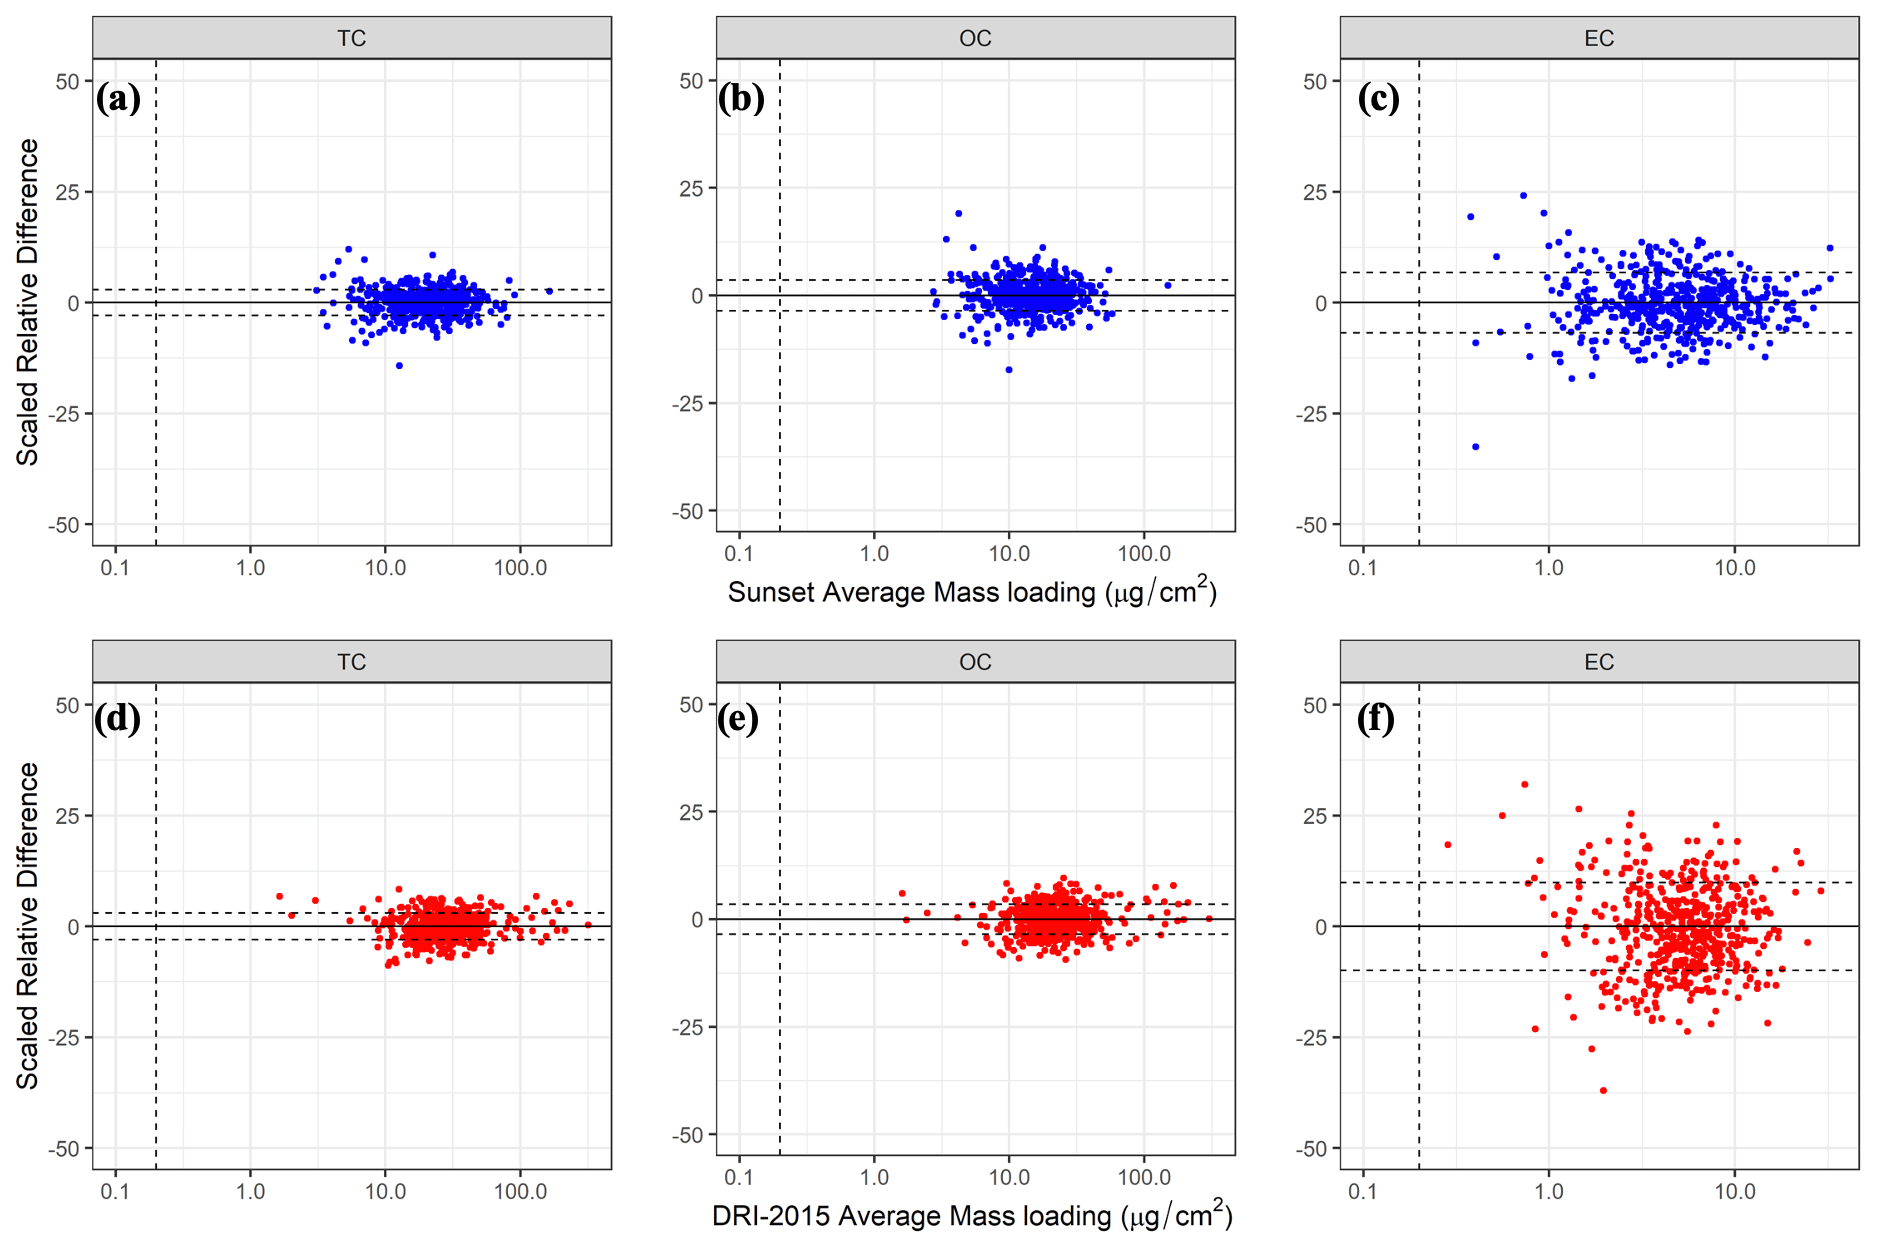
Figure 2Scaled relative difference (Eq. 5, %) of TC, OC, and EC calculated from the original and replicate paired analyses performed on 2017 CSN samples by the Sunset analyzers (a–c, n=519) and the DRI model 2015 analyzers (d–f, n=518) as a function of the average mass loading of the paired analyses. The horizontal dashed lines in each plot represent ±1σ of the SRD determined for each carbon component. The vertical dashed line intercepted at mass loading of 0.2 µg cm−2 indicates the method detection limit (MDL).
The scaled relative difference (SRD) for each sample is calculated using Eq. (5), where [Original]i and [Replicate]i respectively represent the mass loadings of the original and replicate paired analyses on the same filter.
The SRD, which equals the relative difference (RD) divided by , is chosen over RD because it is the normalized relative difference between two measurements, accounting for the presence of equal and independent errors in both original and replicate measurements (Hyslop and White, 2009). The mean value provides an estimate of the within-model replication bias, which was negligible, and the standard deviation (1σ) of SRD provides an estimate for the within-model measurement uncertainty (Unc).
Figure 2 illustrates the relationship between SRD and mass loading for TC, OC, and EC measured by Sunset (Fig. 2a–c) and DRI-2015 (Fig. 2d–f). As expected, the within-model replication bias is close to zero for both Sunset and DRI-2015 because the replicate and original analyses are essentially identical. For all three components, and particularly for EC for which some measurements are near the method detection limit (MDL) (illustrated by the vertical dashed line at 0.2 µg cm−2 in the plots), SRD decreases with increasing mass loading. While all analysis pairs are included in Fig. 2, those with a mean mass loading less than 3 times the MDL are excluded from the calculations of Unc to obtain a stable estimate of measurement uncertainty.
Table 3Within-model replication bias and uncertainty estimated from the scaled relative difference of the replicate analyses by Sunset and DRI model 2015 analyzers, as well as the inter-model uncertainty calculated from the within-model replication uncertainties in the individual models.
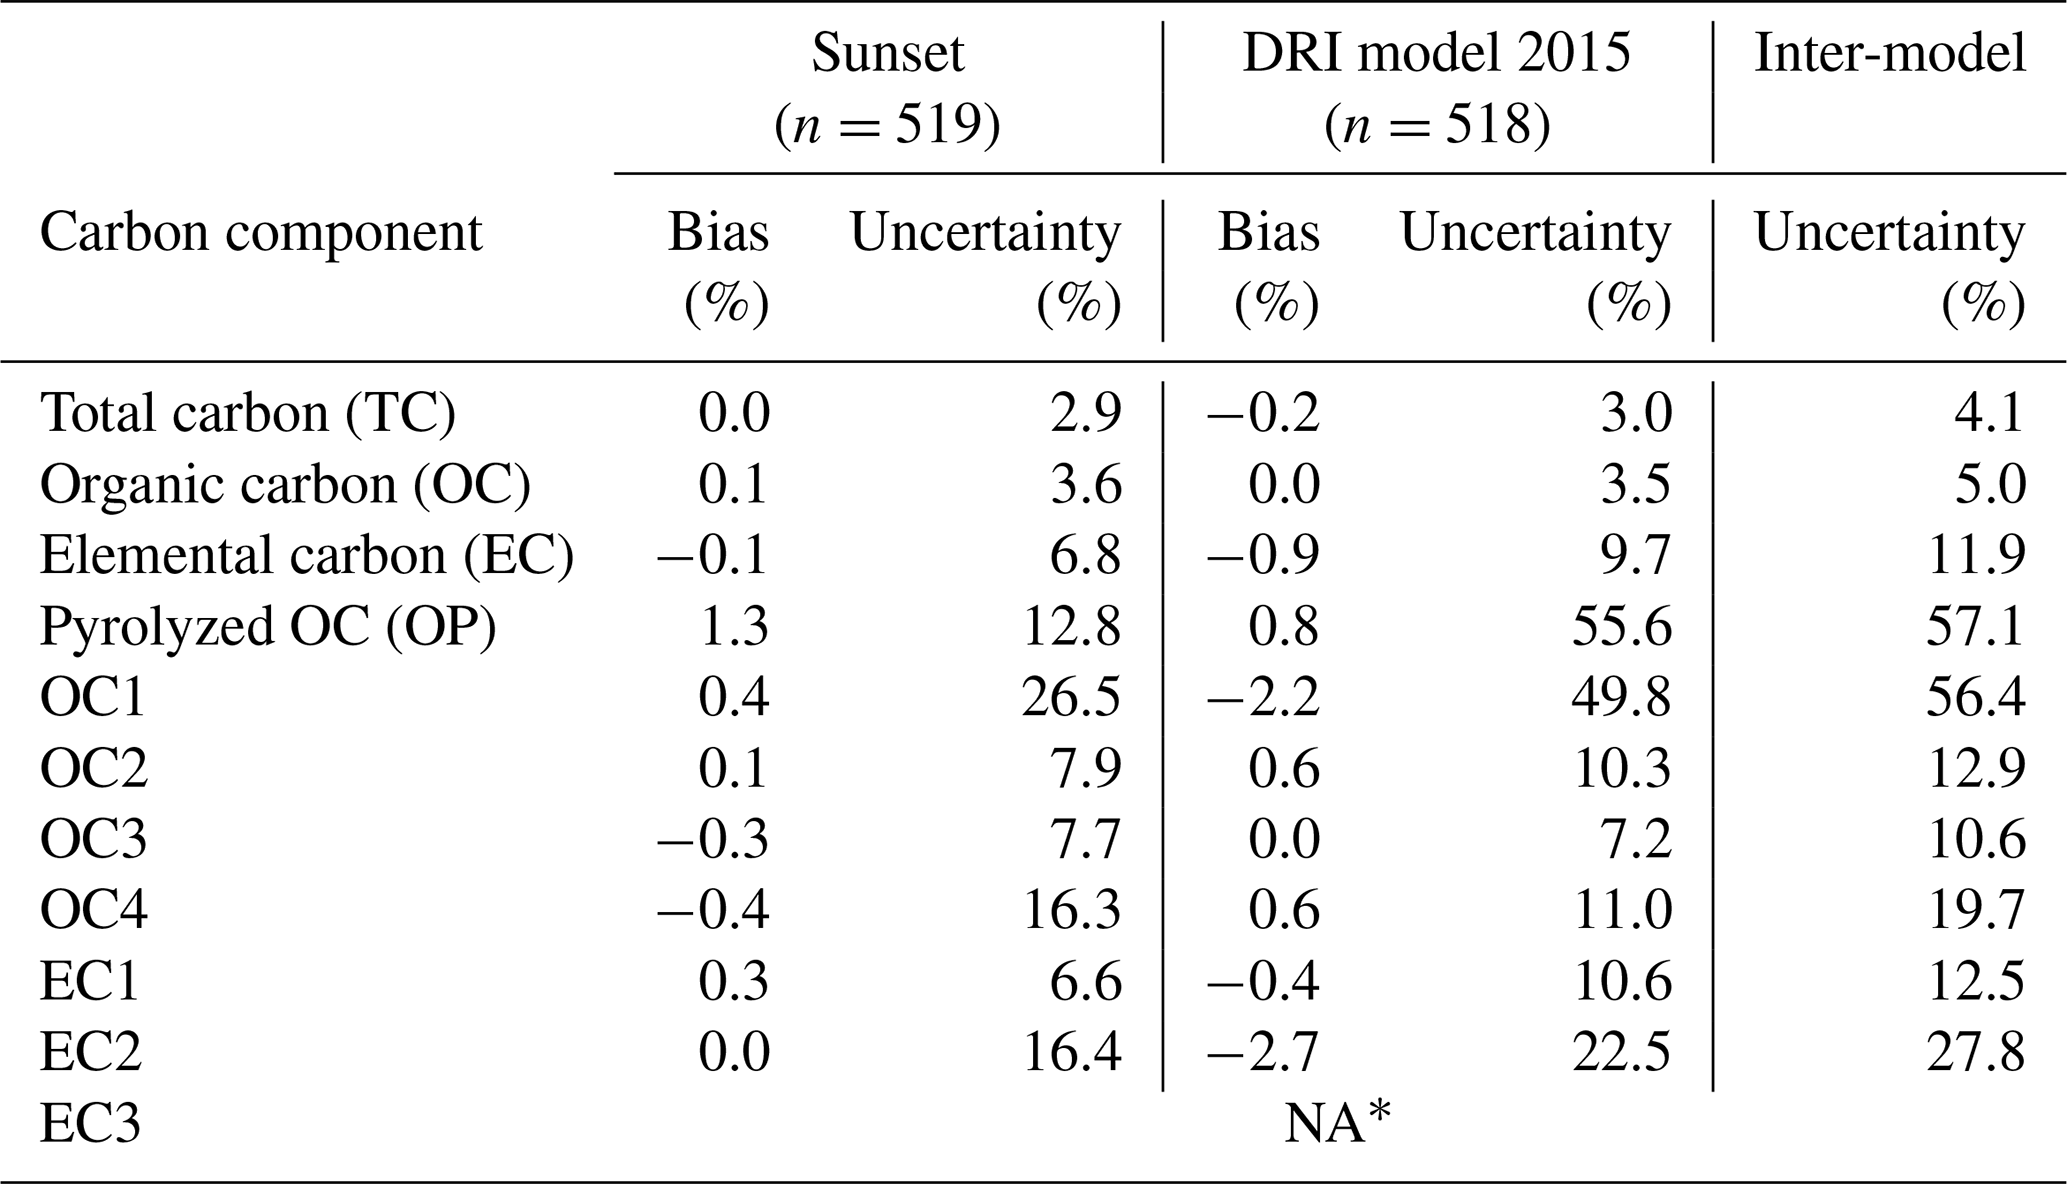
* Too few (less than 20 %) data points have mass loadings that are greater than 3 times the MDL.
Assuming the within-model uncertainties are independent, the combined inter-model uncertainty (Uncinter) can be predicted by Eq. (6a), where UncDRI and UncSunset are the within-model uncertainties determined for DRI-2015 and Sunset analyzers using replicate analyses, respectively.
The overall measurement bias and uncertainty for all carbon components are summarized in Table 3, which provide benchmarks for the inter-model comparison discussed in the following sections. For most components, uncertainties estimated for the Sunset and DRI-2015 analyzers were comparable, except for OP and OC1, for which DRI-2015 uncertainties were a factor of 2–4 larger.
3.1 Inter-model comparison of carbon measurements
This section presents results from the two inter-model comparisons for bulk TC, OC, and EC, as well as for individual thermal subfractions (OC1, OC2, OC3, OC4, OP, EC1, EC2, and EC3). Arithmetic differences (ADs) (Eq. 7) and scaled relative differences (SRDs) (Eq. 8) are calculated between results from Sunset and DRI-2001 analyzers using Set 1 and between results from Sunset and DRI-2015 using Set 2. In calculating SRD, the underlying assumption is that the observed differences are equally allocated to measurements from the two models in comparison; because no standard reference materials are available for the TOA measurement technique, there is no way to allocate the errors to a particular laboratory or analyzer model. In both cases, a positive AD or SRD value occurs if the Sunset measurement is higher than the DRI measurement.
Figure 3 shows the probability density curves of SRDs for Sunset vs. DRI-2001 (purple) and Sunset vs. DRI-2015 (orange). The location of the peak relative to the x-axis center (or as measured by the mean of the SRDs) indicates systematic inter-model bias that occurred for the majority of the data points, while the spread of the curve (or as measured by the standard deviation of the SRDs) represents the variability and coherence of these biases. Also shown in Fig. 3 are the within-model uncertainties determined from replicate analyses (Table 3), although only available for Sunset vs. DRI-2015, to assist in the interpretation of the inter-model SRDs. R2 values are tabulated as an indicator of the degree of linear correlation between the two models. The means and standard deviations of ADs and SRDs are summarized in Table 4.

Figure 3Probability density curves of scaled relative differences (Eq. 8, %) between the Sunset analyzer vs. two DRI analyzers for all carbon components (a–k). Yellow lines (and text) denote the CSN 2017 samples (n=4073) analyzed by DRI model 2015 and Sunset, whereas the purple lines (and text) denote the archived CSN 2007 samples (n=303) analyzed by DRI model 2001 and Sunset. R2 values are derived from linear regression of each dataset. The gray shaded area indicates the inter-model uncertainty (Eq. 6a, %) for each carbon component except for EC3 (Table 3).
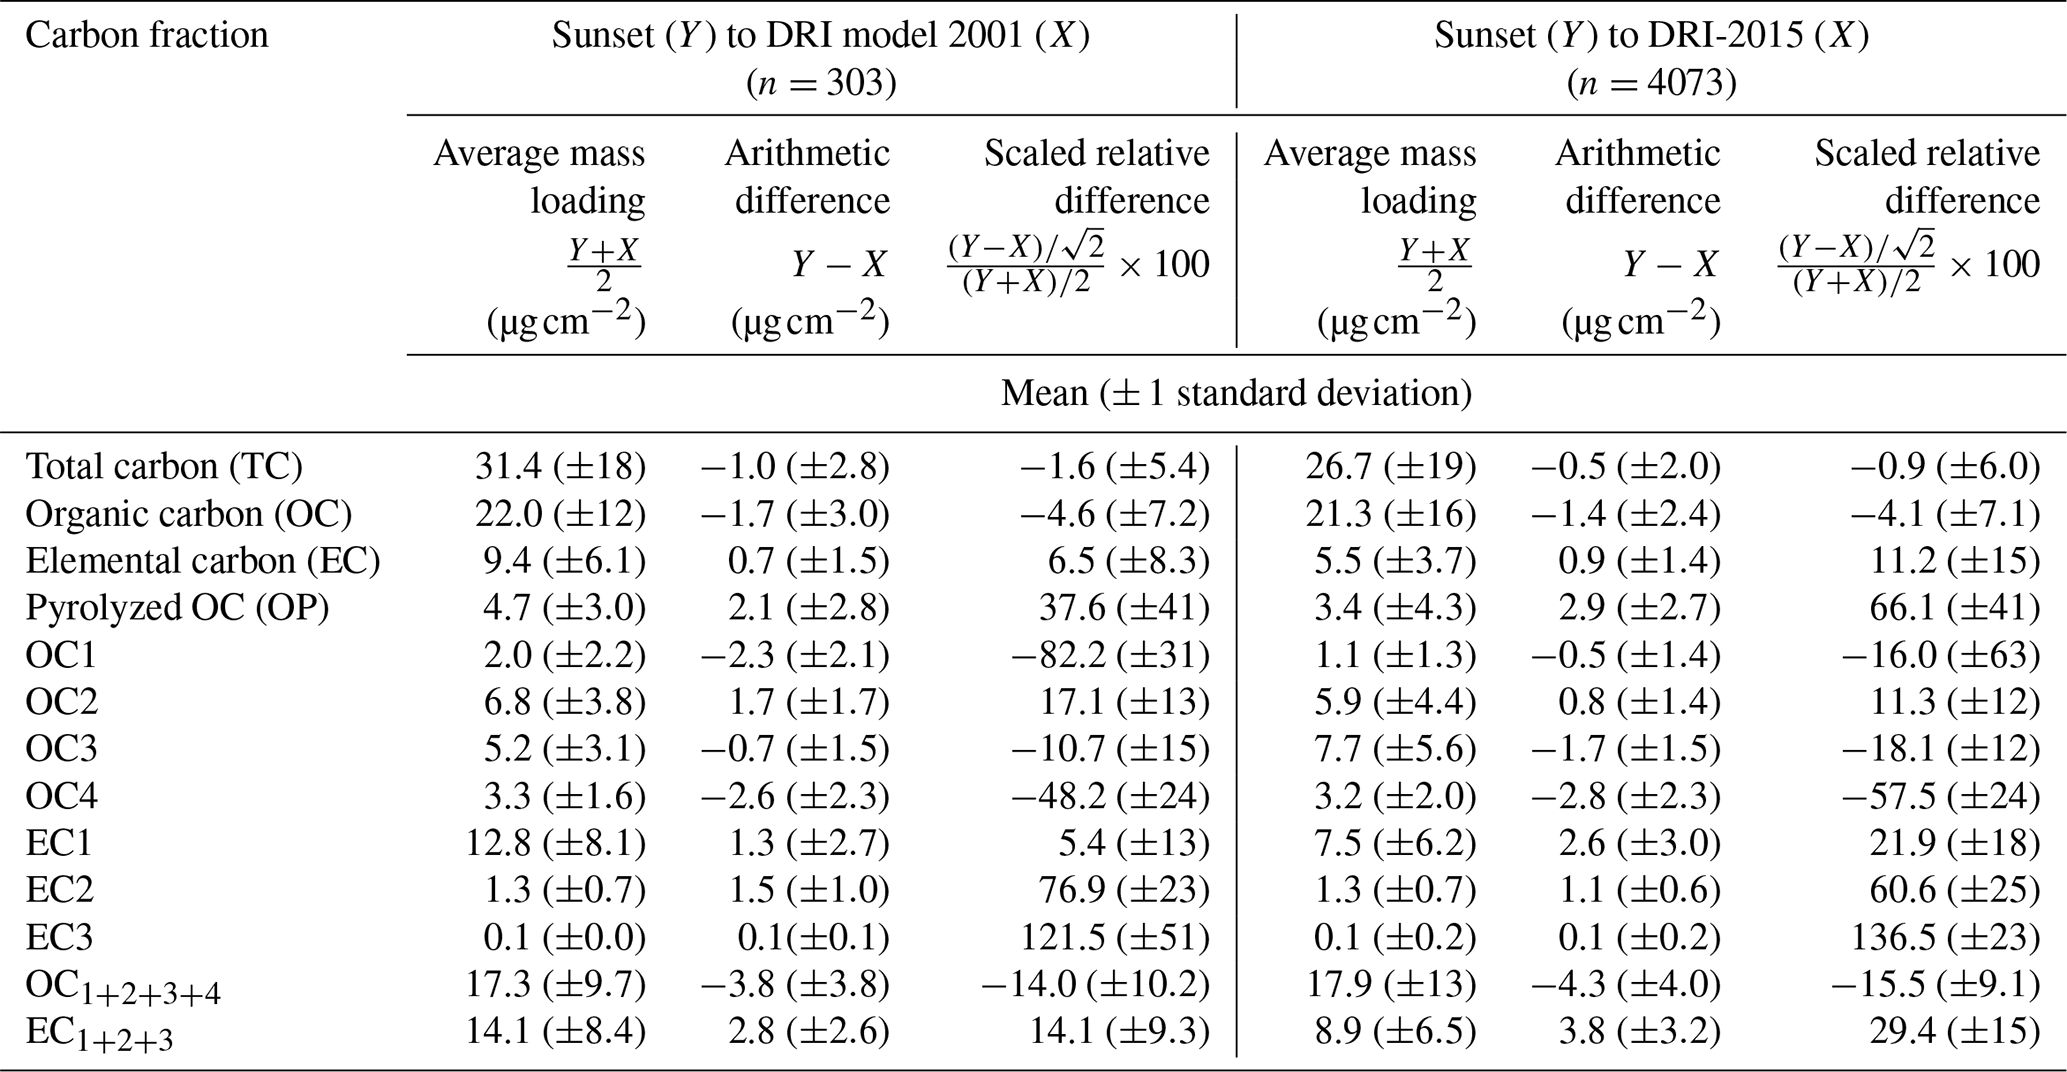
Table 4Mean and standard deviation (1σ) of the average mass loading (µg cm−2), arithmetic mass loading difference (µg cm−2), and scaled relative difference (dimensionless) between the Sunset vs. DRI model 2001 pair (left columns) and the Sunset vs. DRI model 2015 pair (right columns) for bulk carbon components and their thermal fractions.
3.1.1 Bulk TC, OC, and EC
TC and the major carbon fractions, OC and EC, exhibited good agreement in both comparisons, with the smallest SRDs and highest R2 values found for TC ( % and R2=0.98 for Sunset vs. DRI-2001; % and R2=0.99 for Sunset vs. DRI-2015). Between Sunset and DRI-2015, the ADs of TC (e.g., µg cm−2) were comparable to the difference in TC measured from the blank filters (Table 2). The consistency in the TC measurements over a wide temporal range, indicated by the similar TC mass loadings from the original analysis by DRI-2001 and the reanalysis by Sunset 10 years after sample collection, suggests good measurement reproducibility for TC as well as sample stability in long-term cold storage for bulk carbon fractions.
Relative to TC, similar but slightly weaker inter-model correlations were found for OC (R2=0.95 for Sunset vs. DRI-2001 and 0.98 for Sunset vs. DRI-2015) and EC (R2=0.95 for Sunset vs. DRI-2001 and 0.90 for Sunset vs. DRI-2015) (Fig. 3b and c). Sunset OC was lower than those determined by the two DRI analyzers by similar amounts, with an average AD of ∼1.5 µg cm−2 and SRD of ∼4 % (Table 4). Sunset EC was higher when compared to the two DRI analyzers, and the inter-model difference varied by a factor of 2 in terms of SRD (6.5±8.3 % and 11±15 % relative to DRI-2001 and DRI-2015, respectively). Mean SRDs, or the inter-model bias, of all three carbon components did not exceed the combined inter-model uncertainties for Sunset vs. DRI-2015; the mean SRD of EC (11 %) was the largest and closest to its inter-model uncertainty (12 %), suggesting the results are not statistically different. The consistently opposite inter-model biases of OC and EC from the two pairs of comparisons suggested disagreement in the OC–EC split by Sunset and DRI analyzers.
3.1.2 Thermal OC and EC subfractions
An examination of individual thermal OC and EC subfractions revealed large and diverse inter-model differences in these subfractions, a phenomenon referred to as “carbon migration” by some previous studies (e.g., Chow et al., 2007). In general, subfractions with higher mass loadings (e.g., OC2, OC3, and EC1) showed better inter-model agreement, with mean SRDs within ∼20 % and R2 above ∼0.8 (Fig. 3); these subfractions also had smaller within-model uncertainties (Table 3). Relatively larger inter-model SRDs were observed for OC1, OC4, EC2, and EC3, coinciding with their lower mass loadings. EC3, the smallest subfraction in terms of mass loading (Table 4), showed the lowest degree of inter-model agreement among all OC and EC subfractions. DRI analyzers reported many more EC3 data points below the MDL than Sunset, leading to some SRD values far beyond 100 % (Fig. 3k). The most volatile subfraction, OC1, exhibited the largest inter-model SRDs among all four OC subfractions. Evaporative loss during handling and storage of the samples could artificially reduce the mass loading of OC1. Although good sample stability was demonstrated for bulk TC, it is possible that the 82 % bias of Sunset OC1 relative to DRI-2001 was primarily due to evaporation of OC1 during long-term storage.
Systematic inter-model biases (as measured by the mean SRDs) diverged in terms of both magnitude and direction across different thermal subfractions. Relative to DRI analyzers, Sunset measured lower OC1, OC3, and OC4 and higher OC2. Despite the small average mass loadings of OC1 and OC4, they showed much higher ADs than OC2 and OC3 (Table 4). In contrast to the OC subfractions, all three EC subfractions were measured lower by the two DRI analyzers. The degree of inter-model difference varied greatly with subfraction and model pair, from 5.4 % for EC1 between Sunset and DRI-2001 up to 137 % for EC3 between Sunset and DRI-2015.
Collectively, inter-model SRDs of the summed OC subfractions (OC, Eq. 1) were −14 % and −16 % when Sunset was compared to DRI-2001 and DRI-2015, respectively, which are substantially larger than the differences in OC with a charring correction applied (−4.6 % and −4.1 %). The summed EC subfractions (EC, Eq. 2) differed by 14 % and 29 % for Sunset vs. DRI-2001 and Sunset vs. DRI-2015, respectively, which are also much higher than those in the optically corrected EC (6.5 % and 11 %).
OP is the optically derived correction made for OC pyrolysis, which is strongly dependent on thermal parameters and instrument configuration (Cavalli et al., 2010; Yu et al., 2002; Zhi et al., 2009; Nicolosi et al., 2018). In our results, Sunset OP was on average 38 % and 66 % higher than DRI-2001 and DRI-2015, respectively. Arithmetically, the inter-model differences in terms of absolute mass loadings of OP (ADs = 2.1 and 2.9 µg cm−2) corresponded to a large fraction of the observed differences in OC (56 % and 67 %) and EC (75 % and 76 %) for both model pairs (Sunset vs. DRI-2001 and Sunset vs. DRI-2015, respectively). Optical charring correction reduced the inter-model biases in OC and EC relative to those of OC and EC, as discussed in detail below.
3.2 Understanding inter-model differences in TOA results
In this section, we further investigate the causes of the inter-model differences, with a focus on the role of optical charring correction in the final OC-EC split, as well as the instrument differences that are possibly related to the observed migration among carbon subfractions.
3.2.1 Optical charring correction
Optical correction is an essential component of the TOA method to remove measurement artifacts in OC and EC caused by charring of some OC components. As Eqs. (1)–(4) show, without correction, OP, the charred fraction of OC, would be reported as part of EC, leading to an overestimate of EC and an underestimate of OC by the same amount that equals the mass of OP.
Shown in Fig. 4 are distributions of SRDs in uncorrected and corrected OC and EC between Sunset and DRI-2015 measurements as a function of their average mass loadings, binned into 20 groups (5th percentiles). Charring correction brought results into better agreement with reduced SRDs across their whole range of mass loadings for both OC and EC, which is not surprising given the large ADs in OP that were equivalent to 67 % and 76 % of ADs of OC and EC, respectively. The remaining inter-model differences in EC, which are larger than those of OC, and the varying EC SRDs across its mass loading range are worth noting. In particular, the highest (95th percentile and above) EC mass loadings had a median SRD of 19 %, which is almost double the median SRDs in the lower mass loading percentiles. In investigating this anomaly, we found that EC SRDs were larger for samples with no instrumentally detected OP (i.e., OP = 0) by the Sunset and DRI-2015 analyzers (Fig. 5a), with a median value of 20.9 %, which far exceeds the inter-model uncertainty for EC determined from the replicate analyses (Table 3). Figure 5b further revealed that the percentage of samples with OP equaling zero generally increases with increasing EC mass loadings. In the highest EC mass loading bin, approximately 30 % of the samples have no reflectance charring correction on the final reported mass loadings of EC or OC, driving the average EC bias high within that bin. In total, out of the 4073 CSN samples analyzed by Sunset and DRI-2015, 179 samples had no reflectance charring correction determined by either analyzer, with an additional 324 samples having no reflectance charring correction determined by only the DRI-2015 analyzers. As shown in Fig. 5c, for the 179 samples with no charring correction from both models, considerable correlation was found between the inter-model differences of EC and OC. This suggests that, in the absence of charring correction, much of the observed bias in EC between the two models is essentially coming from the inconsistency in the quantified OC subfractions by the two models. In contrast, samples with charring correction (i.e., OP > 0) showed little correlation between the inter-model biases of EC and OC.
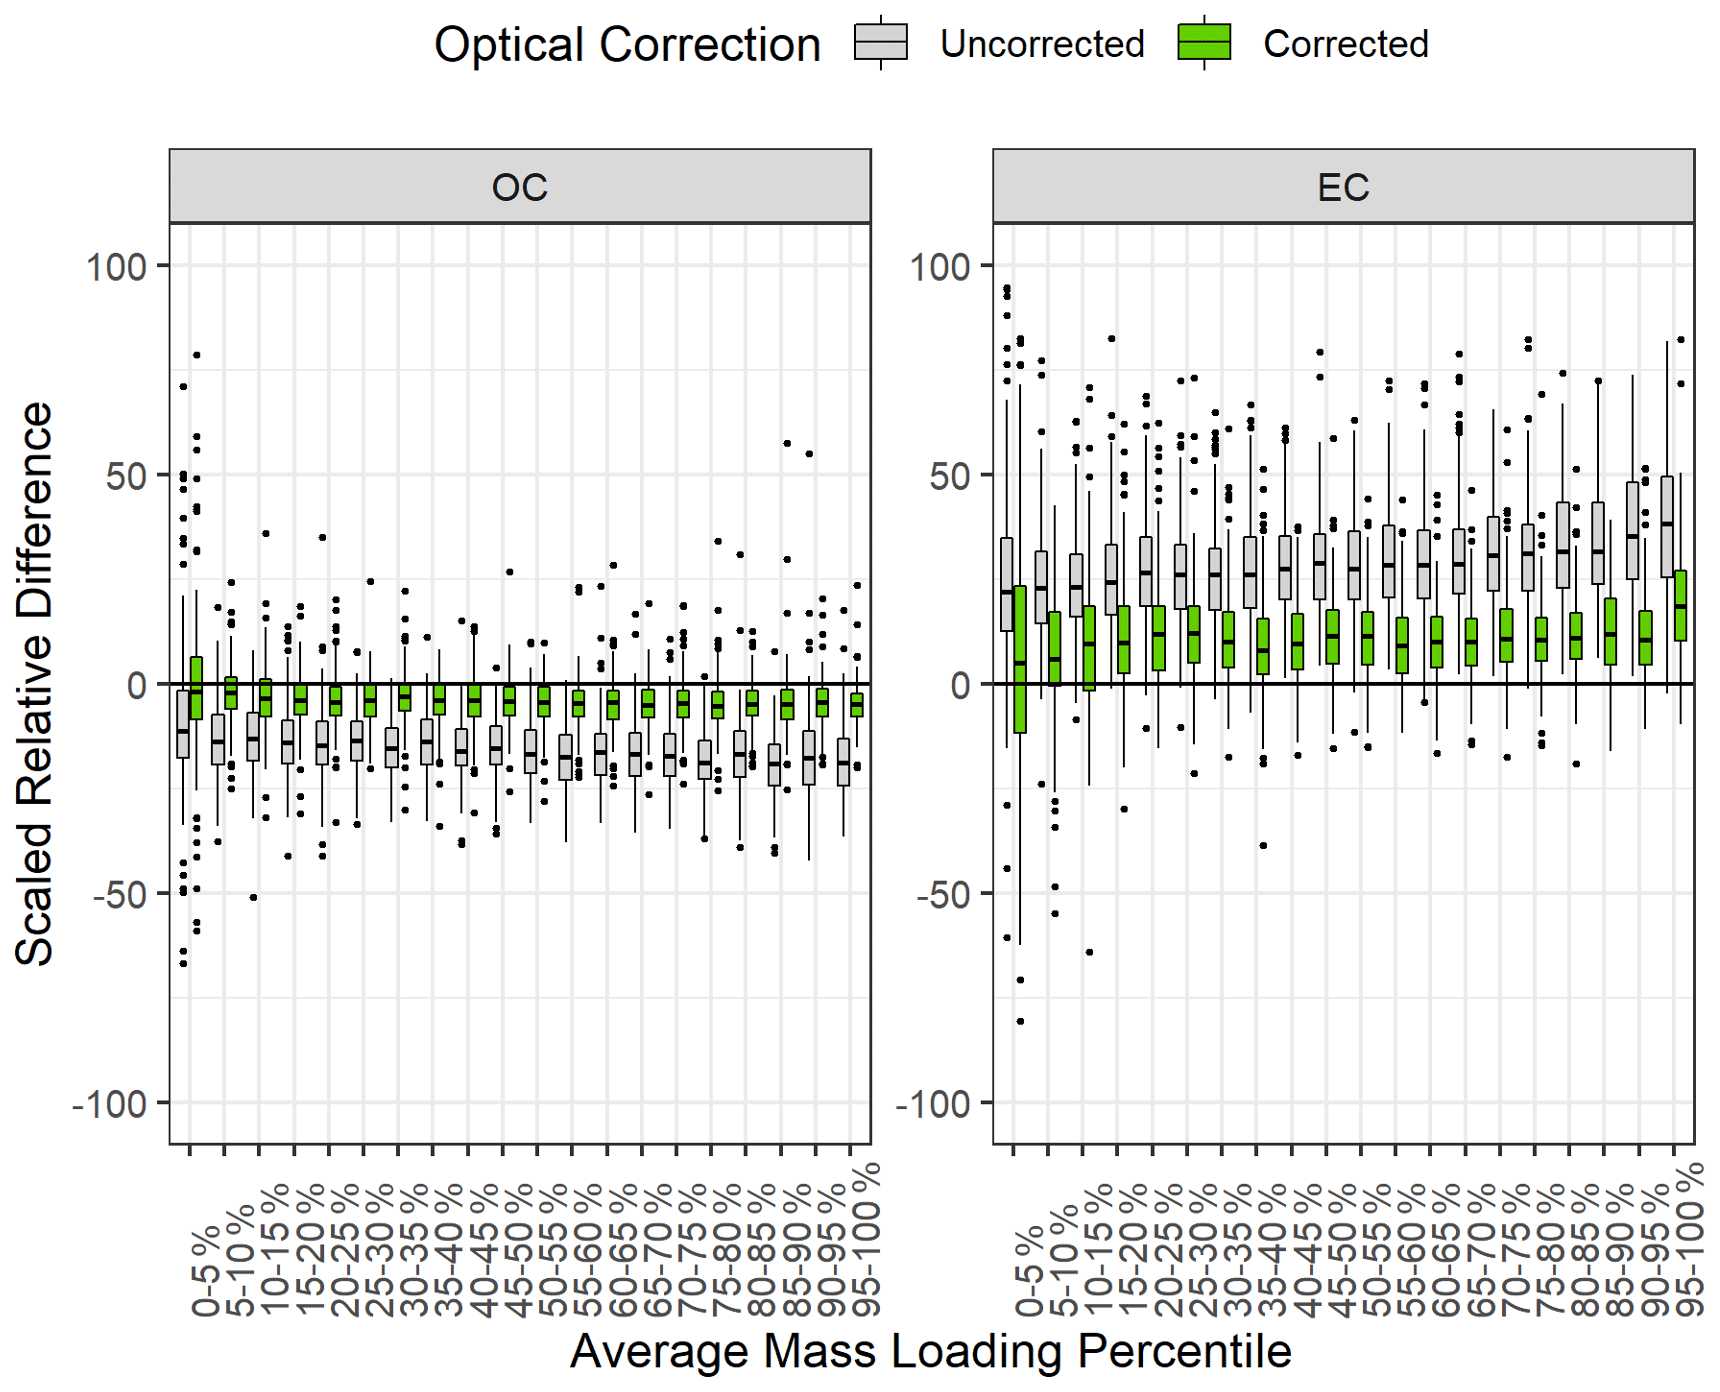
Figure 4Distribution of scaled relative difference between Sunset and DRI model 2015 in uncorrected OC and EC (i.e., OC and EC, gray boxes) and corrected OC and EC (green boxes). SRDs are sorted by the average mass loading between Sunset and DRI-2015 measurements of each parameter and are plotted for each 5th percentile bin. The thick horizontal lines indicate the median, and the upper and lower limits of the boxes represent the 75th and 25th percentile, respectively. The whiskers extend to 1.5 × IQR (IQR is the interquartile range, or the distance between the 25th and the 75th percentiles). Outliers are shown as black dots.
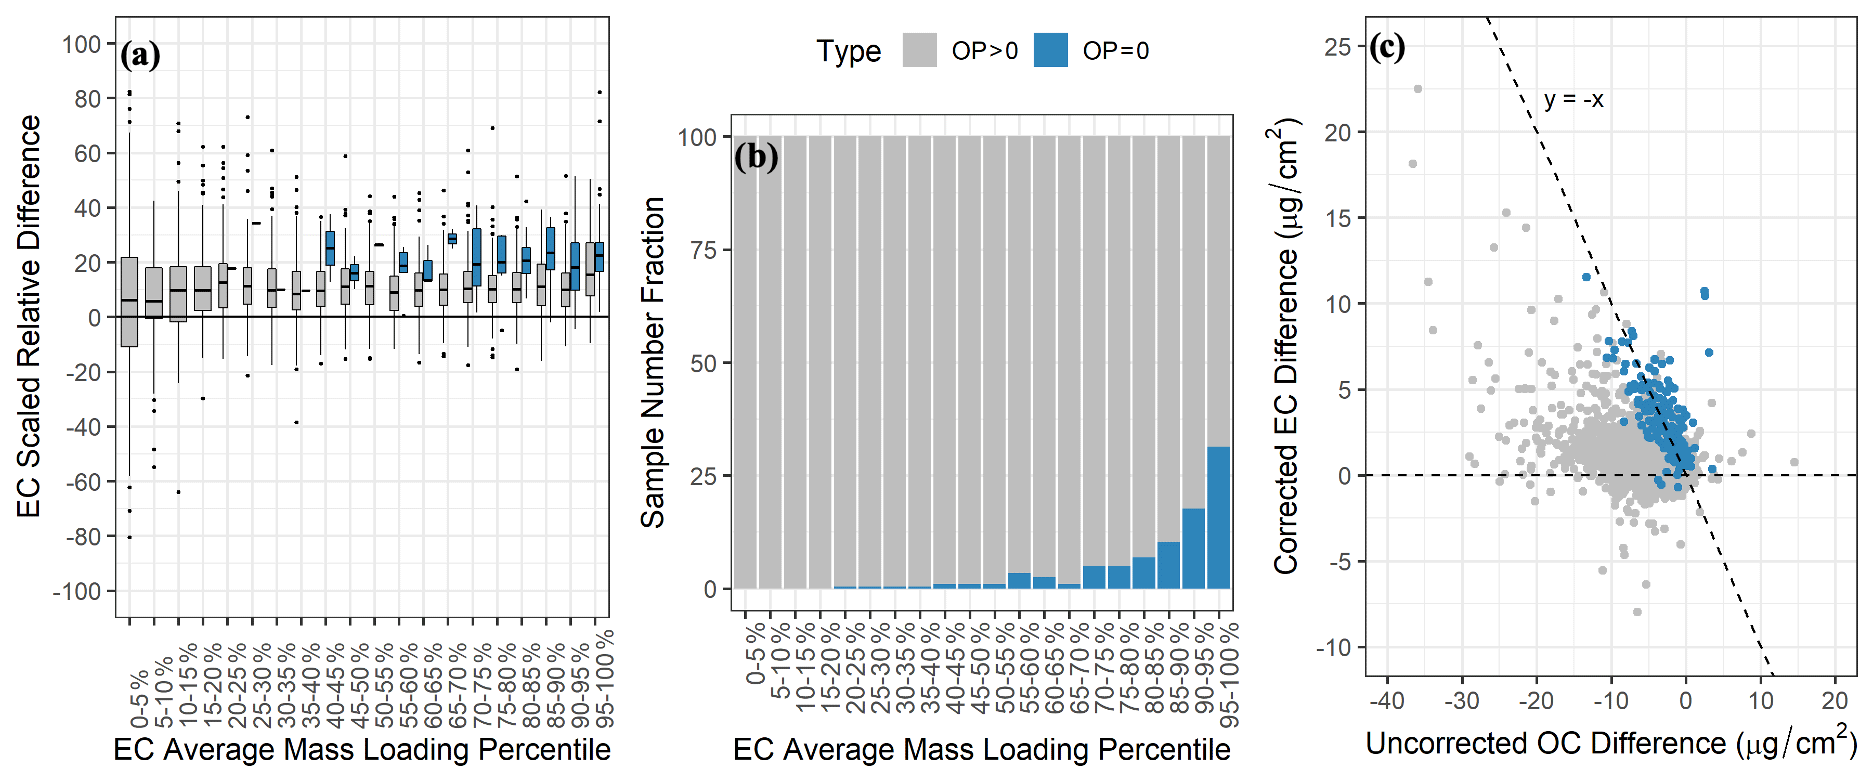
Figure 5(a) Distribution of scaled relative difference in EC between Sunset and DRI model 2015 for samples with (i.e., OP > 0) and without (i.e., OP = 0) reflectance charring correction on both analyzers, (b) number fraction of samples that had no reflectance charring correction (i.e., OP = 0) in each EC mass loading bin, and (c) scatter plot of arithmetic difference in EC vs. arithmetic difference in OC between Sunset and DRI model 2015.
The prevalence of CSN samples with no instrumentally detected OP, especially samples with high EC loadings, is intriguing and was investigated by a close examination of thermograms of all the 2017 CSN samples analyzed by Sunset. Figure 6 illustrates typical thermograms that contain laser reflectance and FID profiles from a Sunset analyzer for a sample with no charring correction (i.e., OP = 0) and a normal sample with charring correction (i.e., OP > 0), along with a blank sample. The blank thermogram shows a constant high laser reflectance and minimal FID signal throughout the course of analysis, indicating the absence of light-absorbing materials on the blank filter. The thermogram of the sample with correction shows a lower starting laser reflectance, indicative of the amount of native light-absorbing materials on the filter, and exhibits a U-shaped trend as OP was formed and accumulated in the inert stage and later liberated in the oxidizing stage; the split between OC and EC was determined as the point when the laser reflectance rose back to its initial level, suggesting complete oxidation of OP. At the end of the analysis, laser reflectance was at a level comparable to that of the blank filter, indicating fully evolved EC from the filter. By comparison, the thermogram of the sample without correction exhibits a number of different attributes. First, the initial reflectance is much lower near the baseline level. As analysis time elapsed and the program advanced to higher temperature set points, the laser signal remained almost unchanged until it started to rise slightly at high oxidizing temperatures (740–840 ∘C). The much lower final laser reflectance level, along with the long tail of the EC3 peak, suggests that there is substantial unevolved EC remaining on the filter. Filters with this type of optical profile are black in color before analysis and remain gray–black after analysis. For the sample without correction, the OC–EC split was determined as the point when the system switched to the oxidizing stage. In these cases, the complete attenuation of the laser signal led to an insufficient dynamic range for it to respond to carbon pyrolysis, regardless of how much OP was formed.
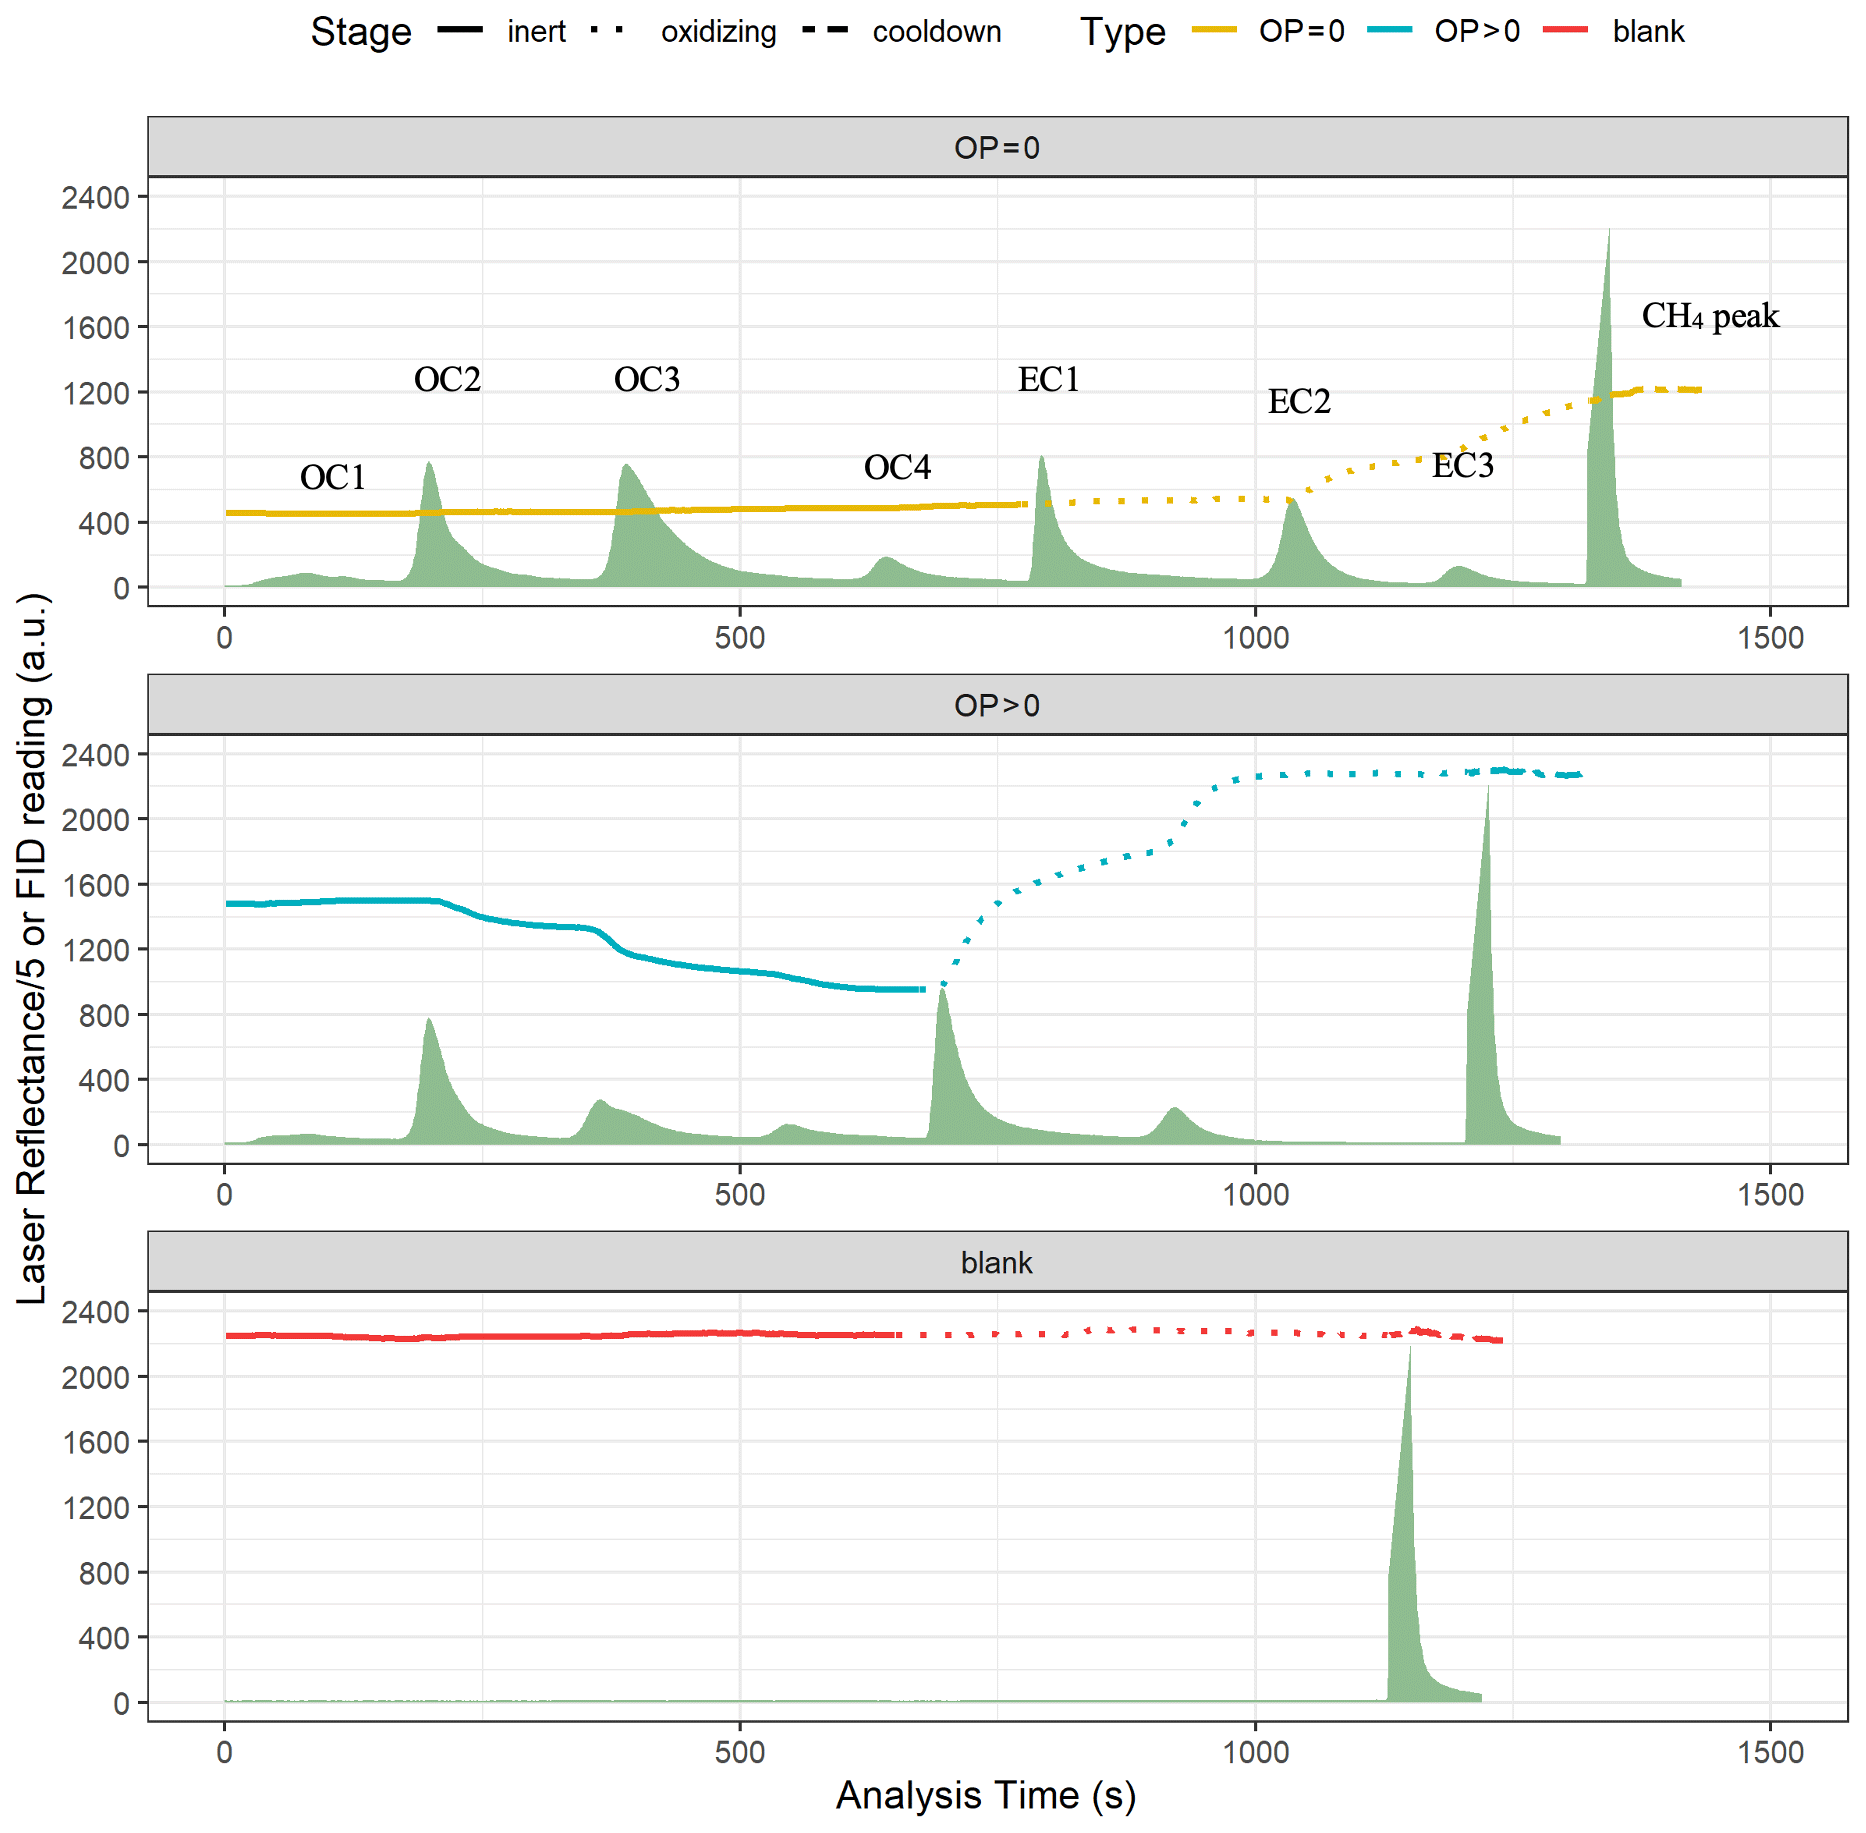
Figure 6Example thermograms that show laser reflectance response and FID signals at different thermal–optical analysis stages (i.e., inert, oxidizing, and cooldown) for a CSN sample with no optical charring correction (i.e., OP = 0), a CSN sample with optical charring correction (i.e., OP > 0), and a blank filter. Laser reflectance readings are divided by 5 for better visualization in all three thermograms. All laser and FID readings are in arbitrary units (a.u.) and are from Sunset analyzers.
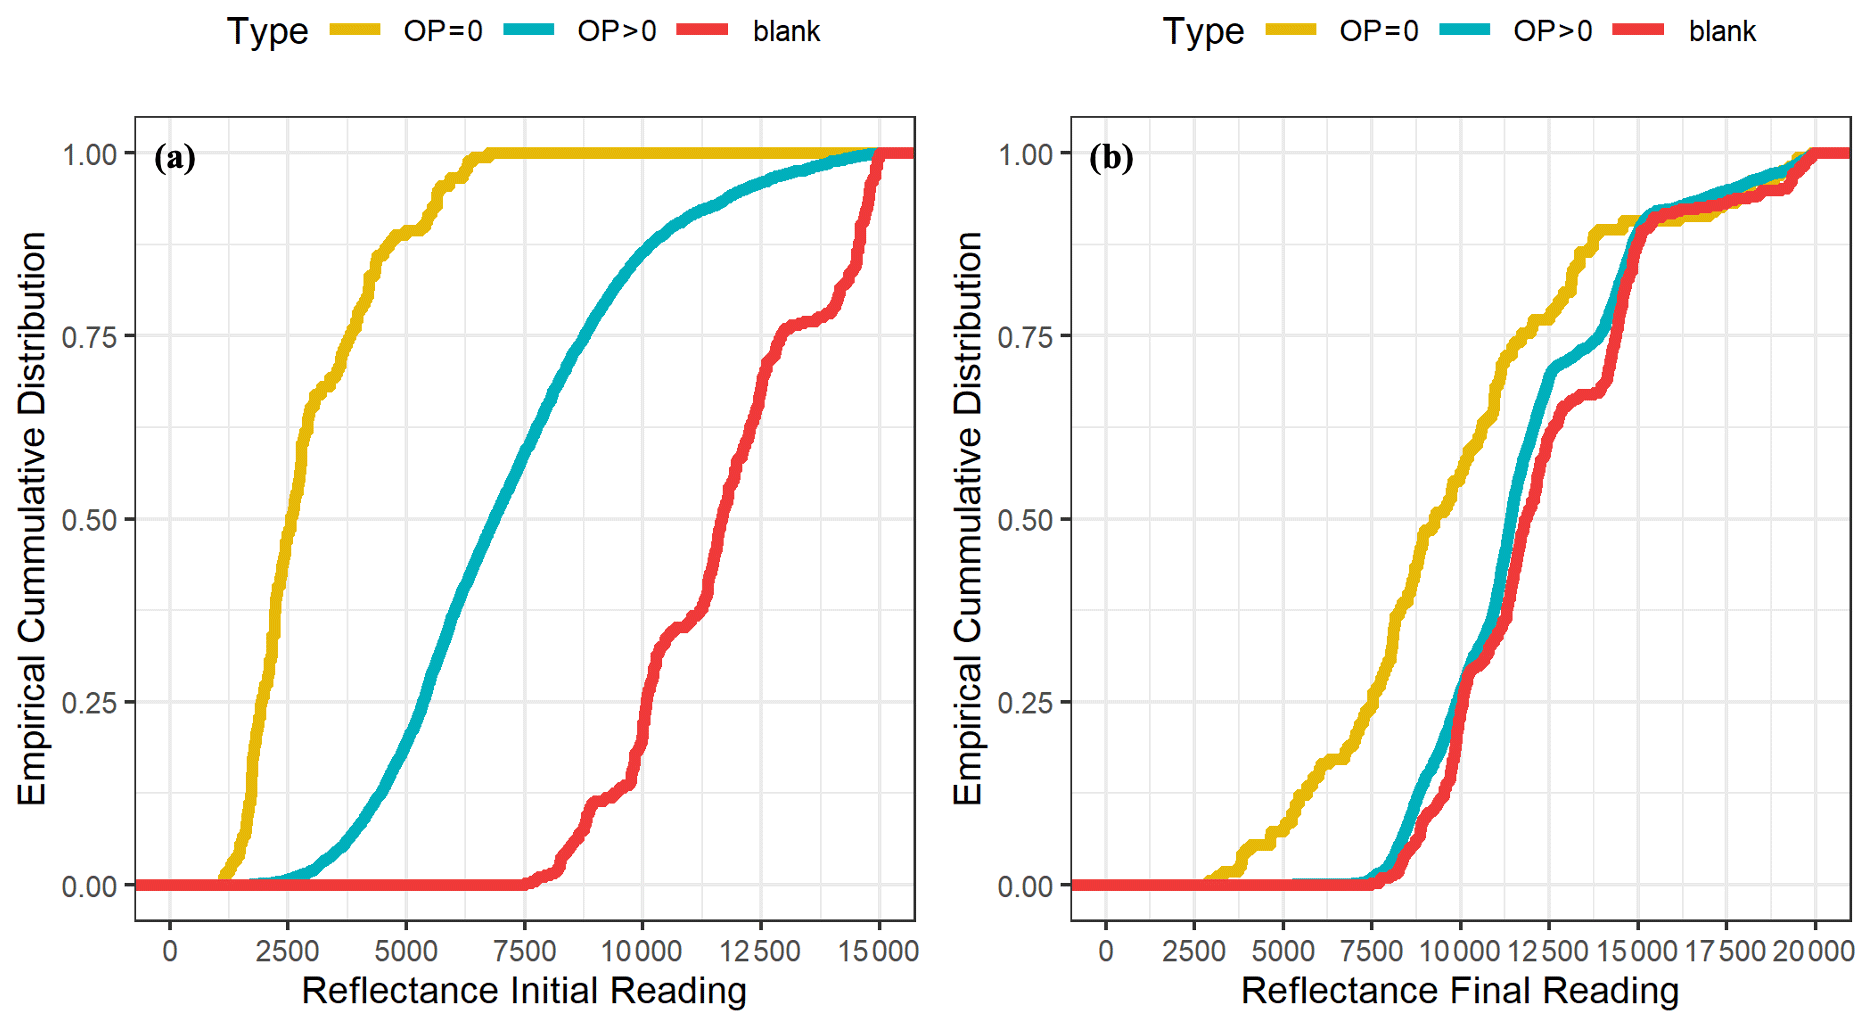
Figure 7Cumulative plots of the laser reflectance initial (a) and final (b) readings for all blanks (n=512) and CSN samples with (n=3894) and without optical charring correction (n=179). All laser readings are in arbitrary units (a.u.) and are from Sunset analyzers.
The initial and final readings of laser reflectance are compared among the three groups of samples, i.e., blank (n=512), OP > 0 (n=3894), and OP = 0 (n=179), in Fig. 7a and b. Despite the variations within each of the three groups due to uncontrollable factors (e.g., different units of the same TOA model), the aforementioned desirable attributes of the analysis thermograms of the OP > 0 and blank groups are statistically evident, including consistency between initial and final laser reflectance for the blank samples, as well as the closeness of the final laser reflectance to the blank levels for the OP > 0 group. Also evident were the distinctly different patterns of both initial and final laser reflectance distributions of the OP = 0 group compared to the OP > 0 group. Low initial and final reflectance readings were observed for the OP = 0 group, with the former close to the laser detector baseline and the latter remaining well below the blank levels.
These results led to the following conclusions. First, for ∼5 % of the CSN quartz filter samples, undetected OP and lack of charring correction resulted from complete attenuation of the laser signal, leading to large inter-model discrepancies in EC between Sunset and DRI-2015. Second, EC mass loadings from these samples were most likely underestimated by both models, as suggested by residual EC unevolved from the filters at 840 ∘C, the highest IMPROVE_A temperature plateau. The high occurrence of samples with OP = 0 in CSN likely results from high sampled air volume, small filter surface area, and the closeness of sampling sites to emission sources, leading to concentrated strong absorbing materials (i.e., EC) on filter samples and posing a challenge for TOA.
3.2.2 Instrument differences causing carbon migration
The results presented in Sect. 3.1.2 show notable inter-model differences in the OC and EC subfractions, or carbon migration, caused by differences in instrument configurations between Sunset and DRI analyzers. Diagnosis and comparisons of these instrumental differences are beyond the scope of this work. In the following, we qualitatively discuss the roles of some possible factors to help formulate targeted experimental studies aimed at probing and reconciling such differences.
Chow et al. (2015) reported similar inconsistencies when comparing the subfractions between the two DRI models and attributed such discrepancies to the variability (up to a factor of 2) in the trace oxygen levels in the oven of the DRI analyzers (Chow et al., 2007), as well as slight differences in the sample temperatures. In our study, when DRI and Sunset analyzers were compared, any difference in the sample temperatures likely resulted not only from the accuracy of the temperature calibration devices, which was typically ±1 %–2 % of the specified temperatures (Chow et al., 2005; Phuah et al., 2009), but also from the different temperature calibration methods used by these models. As detailed in Sect. 2.1, Sunset analyzers use an external thermocouple that measures filter temperature, and DRI analyzers use color-changing chemicals (i.e., Tempilaq∘ G) to adjust the oven temperature readings at the IMPROVE_A temperature set points. Although a previous study by Phuah et al. (2009) demonstrated good comparability between the two temperature calibrations, the external calibration thermocouple in the Sunset analyzer used in that study was modified from the commercially available temperature calibration kit (Sunset Laboratory, Inc., OR, US) used in the present study. Chow et al. (2005) found that lowering sample temperatures by 14 to 22 ∘C in the IMPROVE protocol reduced OC1–OC3 subfractions and increased OC4, OP, and EC subfractions. In our results, the inter-model differences in OC1, OC3, and OC4 were in the same direction, opposite to the differences in OC2 and EC subfractions, suggesting that either the temperature differences between models at each set point were not in the same direction or temperature differences alone cannot fully explain the observed subfraction migration.
In addition, details in instrument configuration and operating parameters set by the analysis control program, often invisible and unalterable to end users, can be distinct among TOA models from different manufacturers. As Chow et al. (2007) explain: “Temperature is ramped to the next step when the FID (or NDIR) response returns to baseline or remains constant for more than 30 s; the residence time at each plateau is longer for more heavily loaded samples.” Unremarked differences in implicit tolerances for temperature ramping rates, and for determining “return to baseline” or “constant”, undoubtedly contribute some of the differences we observe in different models' reported results. Unfortunately, the time profiles of temperature and evolved carbon for individual samples are not routinely reported by DRI and were not available to us for systematic comparison with those from the Sunset instruments at UCD.
A detailed study is performed to assess the inter-model differences among the three models of carbon analyzers used for CSN TOA carbon analysis during the past decade (2010–2019). Two sets of CSN quartz filter samples were used for comparison, each analyzed by a pair of the three analyzer models. Set 1 includes 4073 samples and 622 field blanks collected in 2017, sequentially analyzed by the Sunset and DRI-2015 analyzers within a year. Set 2 consists of 303 archived samples collected in 2007, originally analyzed by the DRI-2001 analyzers in 2008 and reanalyzed by the Sunset analyzers in 2017/18. By using the same IMPROVE_A protocol with reflectance charring correction, these two comparisons allow for a focused examination of instrumentation differences in the Sunset and DRI analyzers.
Our results provide quantitative evidence of desirable consistency in TC and the major carbon fractions (OC and EC), with mean scaled relative differences (SRDs) within 2 % for TC, 5 % for OC, and 12 % for EC, along with high correlation coefficients above 0.95 for TC and OC and above 0.90 for EC. Underlying the consistency in bulk carbon fractions were relatively larger and diverse inter-model differences in OC1–OC4, EC1–EC3, and OP subfractions. Better inter-model agreement was found for subfractions with relatively high mass loading and smaller within-model uncertainties (e.g., OC2, OC3, and EC1). Sunset EC subfractions were consistently higher, with SRDs varying from 5.4 % for EC1 between Sunset and DRI-2001 up to 137 % for EC3 between Sunset and DRI-2015. Pyrolyzed carbon (OP) formation from charring is found to be highly instrument-dependent, differing by 38 % and 66 % in mean SRD between Sunset and DRI-2001 and between Sunset and DRI-2015, respectively. The observed migration among the thermal subfractions is likely related to slight differences in the instrument thermal parameters and configurations, such as sample temperature, baseline selection, and residence time, between Sunset and DRI analyzers. It should also be noted that the IMPROVE_A protocol allows for some play in details such as temperature ramping rates and criteria for advancing to the next stage. A targeted study of such differences between Sunset and DRI analyzers in the future will further refine the understanding of its role in the differences in the analysis results.
Optical charring correction reduced the inter-model biases in OC and EC relative to those for uncorrected OC and EC by 56 %–67 % and 75 %–76 %, respectively. The remaining inter-model discrepancy in EC was found to be substantially larger for ∼5 % of the 2017 CSN samples that had no instrumentally detected OP. Examination of Sunset analysis thermograms suggested that complete laser signal attenuation was the cause; such samples occur more frequently at higher EC mass loadings and were often associated with residual EC that was resistant to the highest IMPROVE_A temperature plateau (840 ∘C), suggesting that both models might underestimate the true ambient EC concentrations for a subset of CSN samples. A previous study by Han et al. (2007) found that EC originating from diesel sources had a higher decomposing temperature than EC from biomass burning. Since the vast majority of CSN sites are located in urban areas (Solomon et al., 2014), where the sampled air is heavily impacted by anthropogenic emissions, it is possible that the samples with no instrumentally detected OP were heavily influenced by diesel fuel combustion. While data used in this study were primarily collected during the summer–fall season, future comparisons with data covering a longer sampling period will paint a fuller picture of all seasons.
Our work offers comprehensive information on TOA instrument uncertainty and inter-model differences necessary for future studies to consider in assessing long-term trends in CSN carbon data. Such information will also assist performance evaluation of chemical transport models using CSN data. Additionally, inter-model differences in thermal subfractions of OC and EC shown here suggest that source apportionment studies on multiyear trends that utilize TOA thermal subfractions as input data in source profiles (e.g., Kim and Hopke, 2005) need to take into consideration the consistency and comparability of data from different carbon analyzer models.
The code used for processing the Sunset OCEC raw data is being submitted to the Dryad repository and will be publicly available via https://doi.org/10.25338/B89G9H (Raffuse, 2021) once published. Before then, the code is downloadable via https://datadryad.org/stash/share/azcEOkoUBaN-dhC5TxL-s2xaSXfktnbOCp7OG-0UPR0 (last access: 29 April 2021).
Processed data collected with the DRI model 2001, DRI model 2015, and Sunset analyzers are being submitted to the Dryad repository and will be publicly available via https://doi.org/10.25338/B8204M (Zhang, 2021) once published. Before then, the data file is downloadable via https://datadryad.org/stash/share/u-Qo5ilgQPGbQx7u8flMsfunGEfP8UhCwHtuzXxOeSU (last access: 29 April 2021). Raw data (i.e. thermograms) from the Sunset analyzers are available upon request from the authors.
XZ and NPH designed the study. XZ collected the Sunset data with help from KT. SR developed the UCD data processing algorithm and wrote the code. XZ analyzed the data and wrote the paper with help from WW and NPH. All authors were involved in the discussion and commented on the paper.
The authors declare that they have no conflict of interest.
The conclusions are those of the authors and do not necessarily reflect the views of the sponsoring agency.
The authors thank Joann Rice and Melinda Beaver at the EPA for their valuable comments on the paper.
This research has been supported by the Environmental Protection Agency (EPA) (grant no. EP-D-15-020).
This paper was edited by Mingjin Tang and reviewed by Cheng Wu and one anonymous referee.
Ammerlaan, B. A. J., Jedynska, A. D., Henzing, J. S., and Holzinger, R.: On a possible bias in elemental carbon measurements with the Sunset thermal/optical carbon analyser caused by unstable laser signal, Atmos. Environ., 122, 571–576, https://doi.org/10.1016/j.atmosenv.2015.09.076, 2015.
Baumgardner, D., Popovicheva, O., Allan, J., Bernardoni, V., Cao, J., Cavalli, F., Cozic, J., Diapouli, E., Eleftheriadis, K., Genberg, P. J., Gonzalez, C., Gysel, M., John, A., Kirchstetter, T. W., Kuhlbusch, T. A. J., Laborde, M., Lack, D., Müller, T., Niessner, R., Petzold, A., Piazzalunga, A., Putaud, J. P., Schwarz, J., Sheridan, P., Subramanian, R., Swietlicki, E., Valli, G., Vecchi, R., and Viana, M.: Soot reference materials for instrument calibration and intercomparisons: a workshop summary with recommendations, Atmos. Meas. Tech., 5, 1869–1887, https://doi.org/10.5194/amt-5-1869-2012, 2012.
Birch, M. E. and Cary, R. A.: Elemental Carbon-Based Method for Monitoring Occupational Exposures to Particulate Diesel Exhaust, Aerosol Sci. Tech., 25, 221–241, https://doi.org/10.1080/02786829608965393, 1996.
Cavalli, F., Viana, M., Yttri, K. E., Genberg, J., and Putaud, J.-P.: Toward a standardised thermal-optical protocol for measuring atmospheric organic and elemental carbon: the EUSAAR protocol, Atmos. Meas. Tech., 3, 79–89, https://doi.org/10.5194/amt-3-79-2010, 2010.
Chan, T. W., Huang, L., Banwait, K., Zhang, W., Ernst, D., Wang, X., Watson, J. G., Chow, J. C., Green, M., Czimczik, C. I., Santos, G. M., Sharma, S., and Jones, K.: Inter-comparison of elemental and organic carbon mass measurements from three North American national long-term monitoring networks at a co-located site, Atmos. Meas. Tech., 12, 4543–4560, https://doi.org/10.5194/amt-12-4543-2019, 2019.
Chen, L.-W. A., Chow, J. C., Wang, X. L., Robles, J. A., Sumlin, B. J., Lowenthal, D. H., Zimmermann, R., and Watson, J. G.: Multi-wavelength optical measurement to enhance thermal/optical analysis for carbonaceous aerosol, Atmos. Meas. Tech., 8, 451–461, https://doi.org/10.5194/amt-8-451-2015, 2015.
Chow, J. C., Watson, J. G., Chen, L.-W. A., Arnott, W. P., Moosmüller, H., and Fung, K.: Equivalence of Elemental Carbon by Thermal/Optical Reflectance and Transmittance with Different Temperature Protocols, Environ. Sci. Technol., 38, 4414–4422, https://doi.org/10.1021/es034936u, 2004.
Chow, J. C., Watson, J. G., Chen, L.-W. A., Paredes-Miranda, G., Chang, M.-C. O., Trimble, D., Fung, K. K., Zhang, H., and Zhen Yu, J.: Refining temperature measures in thermal/optical carbon analysis, Atmos. Chem. Phys., 5, 2961–2972, https://doi.org/10.5194/acp-5-2961-2005, 2005.
Chow, J. C., Watson, J. G., Chen, L.-W. A., Chang, M. C. O., Robinson, N. F., Trimble, D., and Kohl, S.: The IMPROVE_A Temperature Protocol for Thermal/Optical Carbon Analysis: Maintaining Consistency with a Long-Term Database, J. Air Waste Manage., 57, 1014–1023, https://doi.org/10.3155/1047-3289.57.9.1014, 2007.
Chow, J. C., Wang, X., Sumlin, B. J., Gronstal, S. B., Chen, L.-W. A., Trimble, D. L., Kohl, S. D., Mayorga, S. R., Riggio, G., Hurbain, P. R., Johnson, M., Zimmermann, R., and Watson, J. G.: Optical Calibration and Equivalence of a Multiwavelength Thermal/Optical Carbon Analyzer, Aerosol Air Qual. Res., 15, 1145–1159, https://doi.org/10.4209/aaqr.2015.02.0106, 2015.
Conny, J. M., Klinedinst, D. B., Wight, S. A., and Paulsen, J. L.: Optimizing Thermal-Optical Methods for Measuring Atmospheric Elemental (Black) Carbon: A Response Surface Study, Aerosol Sci. Tech., 37, 703–723, https://doi.org/10.1080/02786820300920, 2003.
DRI: SOP 2-216r3: DRI Model 2001 Thermal/Optical Carbon Analysis (TOR/TOT) of Aerosol Filter Samples – Method IMPROVE_A. prepared by Desert Research Institute, Reno, NV, available at: http://vista.cira.colostate.edu/improve/Publications/SOPs/DRI_SOPs/2012/IMPROVEA_2-216r3_20121022small.pdf (last access: 28 April 2021), 2012.
DRI: SOP 2-226r1: DRI Model 2015 Multiwavelength Thermal/Optical Carbon Analysis (TOR/TOT) of Aerosol Filter Samples – Method IMPROVE_A. prepared by Desert Research Institute, Reno, NV, available at: https://www.epa.gov/sites/production/files/2019-11/documents/ucd_sop402_tor_carbon_analysis_final_srsedit.pdf (last access: 28 April 2021), 2016.
Emery, C., Liu, Z., Russell, A. G., Odman, M. T., Yarwood, G., and Kumar, N.: Recommendations on statistics and benchmarks to assess photochemical model performance, J. Air Waste Manage., 67, 582–598, https://doi.org/10.1080/10962247.2016.1265027, 2017.
EPA: National ambient air quality standards for particulate matter: final rule. 40 CFR part 50, July 18, available at: https://www.govinfo.gov/content/pkg/CFR-1997-title40-vol2/pdf/CFR-1997-title40-vol2.pdf (last access: 27 April 2021), 1997.
Han, Y., Cao, J., Chow, J. C., Watson, J. G., An, Z., Jin, Z., Fung, K., and Liu, S.: Evaluation of the thermal/optical reflectance method for discrimination between char- and soot-EC, Chemosphere, 69, 569–574, https://doi.org/10.1016/j.chemosphere.2007.03.024, 2007.
Huntzicker, J. J., Johnson, R. L., Shah, J. J., and Cary, R. A.: Analysis of Organic and Elemental Carbon in Ambient Aerosols by a Thermal-Optical Method, in: Particulate Carbon: Atmospheric Life Cycle, edited by: Wolff, G. T. and Klimisch, R. L., Springer US, Boston, MA, 79–88, 1982.
Hyslop, N. and White, W.: Estimating Precision Using Duplicate Measurements, J. Air Waste Manage., 59, 1032–1039, https://doi.org/10.3155/1047-3289.59.9.1032, 2009.
IPCC: Climate Change 2014: Synthesis Report. Contribution of Working Groups I, II and III to the Fifth Assessment Report of the Intergovernmental Panel on Climate Change, edited by: Core Writing Team, Pachauri R. K., and Meyer, L. A., IPCC, Geneva, Switzerland, 151 pp., 2014.
Khan, B., Hays, M. D., Geron, C., and Jetter, J.: Differences in the OC/EC Ratios that Characterize Ambient and Source Aerosols due to Thermal-Optical Analysis, Aerosol Sci. Tech., 46, 127–137, https://doi.org/10.1080/02786826.2011.609194, 2012.
Kim, E. and Hopke, P. K.: Improving Source Apportionment of Fine Particles in the Eastern United States Utilizing Temperature-Resolved Carbon Fractions, J. Air Waste Manage., 55, 1456–1463, https://doi.org/10.1080/10473289.2005.10464748, 2005.
Liu, W., Wang, Y., Russell, A., and Edgerton, E. S.: Enhanced source identification of southeast aerosols using temperature-resolved carbon fractions and gas phase components, Atmos. Environ., 40, 445–466, https://doi.org/10.1016/j.atmosenv.2005.11.079, 2006.
Nicolosi, E. M. G., Quincey, P., Font, A., and Fuller, G. W.: Light attenuation versus evolved carbon (AVEC) – A new way to look at elemental and organic carbon analysis, Atmos. Environ., 175, 145–153, https://doi.org/10.1016/j.atmosenv.2017.12.011, 2018.
Panteliadis, P., Hafkenscheid, T., Cary, B., Diapouli, E., Fischer, A., Favez, O., Quincey, P., Viana, M., Hitzenberger, R., Vecchi, R., Saraga, D., Sciare, J., Jaffrezo, J. L., John, A., Schwarz, J., Giannoni, M., Novak, J., Karanasiou, A., Fermo, P., and Maenhaut, W.: ECOC comparison exercise with identical thermal protocols after temperature offset correction – instrument diagnostics by in-depth evaluation of operational parameters, Atmos. Meas. Tech., 8, 779–792, https://doi.org/10.5194/amt-8-779-2015, 2015.
Phuah, C., Peterson, M., Richards, M., Turner, J., and Dillner, A.: A Temperature Calibration Procedure for the Sunset Laboratory Carbon Aerosol Analysis Lab Instrument, Aerosol Sci. Tech., 43, 1013–1021, https://doi.org/10.1080/02786820903124698, 2009.
Pope, C. A. and Dockery, D. W.: Health Effects of Fine Particulate Air Pollution: Lines that Connect, J. Air Waste Manage., 56, 709–742, https://doi.org/10.1080/10473289.2006.10464485, 2006.
Raffuse, S.: UCD-Sunset OC/EC Data Processing Package, Dryad [code], https://doi.org/10.25338/B89G9H, 2021 (code available at: https://datadryad.org/stash/share/azcEOkoUBaN-dhC5TxL-s2xaSXfktnbOCp7OG-0UPR0, last access: 29 April 2021).
Schauer, J. J., Mader, B. T., DeMinter, J. T., Heidemann, G., Bae, M. S., Seinfeld, J. H., Flagan, R. C., Cary, R. A., Smith, D., Huebert, B. J., Bertram, T., Howell, S., Kline, J. T., Quinn, P., Bates, T., Turpin, B., Lim, H. J., Yu, J. Z., Yang, H., and Keywood, M. D.: ACE-Asia Intercomparison of a Thermal-Optical Method for the Determination of Particle-Phase Organic and Elemental Carbon, Environ. Sci. Technol., 37, 993–1001, https://doi.org/10.1021/es020622f, 2003.
Solomon, P. A., Crumpler, D., Flanagan, J. B., Jayanty, R. K. M., Rickman, E. E., and McDade, C. E.: U. S. National PM2.5 Chemical Speciation Monitoring Networks – CSN and IMPROVE: Description of networks, J. Air Waste Manage., 64, 1410–1438, https://doi.org/10.1080/10962247.2014.956904, 2014.
Spada, N. J. and Hyslop, N. P.: Comparison of elemental and organic carbon measurements between IMPROVE and CSN before and after method transitions, Atmos. Environ., 178, 173–180, https://doi.org/10.1016/j.atmosenv.2018.01.043, 2018.
UCD: CSN Standard Operating Procedure #402: Thermal/Optical Reflectance (TOR) Carbon Analysis Using a Sunset Carbon Analyzer, prepared by University of California, Davis, CA, available at: https://www.epa.gov/sites/production/files/2019-11/documents/ucd_sop402_tor_carbon_analysis_final_srsedit.pdf (last access: 29 April 2021), 2019.
Watson, J. G.: Visibility: science and regulation, J. Air Waste Manage., 52, 628–713, https://doi.org/10.1080/10473289.2002.10470813, 2002.
Watson, J. G., Chow, J. C., and Chen, L.-W. A.: Summary of Organic and Elemental Carbon/Black Carbon Analysis Methods and Intercomparisons, Aerosol Air Qual. Res., 5, 65–102, https://doi.org/10.4209/aaqr.2005.06.0006, 2005.
Wu, C., Ng, W. M., Huang, J., Wu, D., and Yu, J. Z.: Determination of Elemental and Organic Carbon in PM2.5 in the Pearl River Delta Region: Inter-Instrument (Sunset vs. DRI Model 2001 Thermal/Optical Carbon Analyzer) and Inter-Protocol Comparisons (IMPROVE vs. ACE-Asia Protocol), Aerosol Sci. Tech., 46, 610–621, https://doi.org/10.1080/02786826.2011.649313, 2012.
Yu, J. Z., Xu, J., and Yang, H.: Charring characteristics of atmospheric organic particulate matter in thermal analysis, Environ. Sci. Technol., 36, 754–761, https://doi.org/10.1021/es015540q, 2002.
Zhang, Q., Jimenez, J. L., Canagaratna, M. R., Allan, J. D., Coe, H., Ulbrich, I., Alfarra, M. R., Takami, A., Middlebrook, A. M., Sun, Y. L., Dzepina, K., Dunlea, E., Docherty, K., DeCarlo, P. F., Salcedo, D., Onasch, T., Jayne, J. T., Miyoshi, T., Shimono, A., Hatakeyama, S., Takegawa, N., Kondo, Y., Schneider, J., Drewnick, F., Borrmann, S., Weimer, S., Demerjian, K., Williams, P., Bower, K., Bahreini, R., Cottrell, L., Griffin, R. J., Rautiainen, J., Sun, J. Y., Zhang, Y. M., and Worsnop, D. R.: Ubiquity and dominance of oxygenated species in organic aerosols in anthropogenically-influenced Northern Hemisphere midlatitudes, Geophys. Res. Lett., 34, L13801, https://doi.org/10.1029/2007GL029979, 2007.
Zhang, X.: Processed carbon mass loading data from DRI and Sunset analyzers, Dryad [dataset], https://doi.org/10.25338/B8204M, 2021 (data available at: https://datadryad.org/stash/share/u-Qo5ilgQPGbQx7u8flMsfunGEfP8UhCwHtuzXxOeSU, last access: 29 April 2021).
Zhi, G., Chen, Y., Sheng, G., and Fu, J.: Effects of temperature parameters on thermal-optical analysis of organic and elemental carbon in aerosol, Environ Monit. Assess., 154, 253–261, https://doi.org/10.1007/s10661-008-0393-4, 2009.