the Creative Commons Attribution 4.0 License.
the Creative Commons Attribution 4.0 License.
 | 06 May 2021
Assimilation of DAWN Doppler wind lidar data during the 2017 Convective Processes Experiment (CPEX): impact on precipitation and flow structure
Svetla Hristova-Veleva
Sara Q. Zhang
Ziad S. Haddad
Randy C. Sawaya
An improved representation of 3-D air motion and precipitation structure through forecast models and assimilation of observations is vital for improvements in weather forecasting capabilities. However, there are few independent data to properly validate a model forecast of precipitation structure when the underlying dynamics are evolving on short convective timescales. Using data from the JPL Ku/Ka-band Airborne Precipitation Radar (APR-2) and the 2 µm Doppler Aerosol Wind (DAWN) lidar collected during the 2017 Convective Processes Experiment (CPEX), the NASA Unified Weather Research and Forecasting (WRF) Ensemble Data Assimilation System (EDAS) modeling system was used to quantify the impact of high-resolution sparsely sampled DAWN measurements on the analyzed variables and on the forecast when the DAWN winds were assimilated. Overall, the assimilation of the DAWN wind profiles had a discernible impact on the wind field as well as the evolution and timing of the 3-D precipitation structure. Analysis of individual variables revealed that the assimilation of the DAWN winds resulted in important and coherent modifications of the environment. It led to an increase in the near-surface convergence, temperature, and water vapor, creating more favorable conditions for the development of convection exactly where it was observed (but not present in the control run). Comparison to APR-2 and observations by the Global Precipitation Measurement (GPM) satellite shows a much-improved forecast after the assimilation of the DAWN winds – development of precipitation where there was none, more organized precipitation where there was some, and a much more intense and organized cold pool, similar to the analysis of the dropsonde data. The onset of the vertical evolution of the precipitation showed similar radar-derived cloud-top heights, but delayed in time. While this investigation was limited to a single CPEX flight date, the investigation design is appropriate for further investigation of the impact of airborne Doppler wind lidar observations upon short-term convective precipitation forecasts.
- Article
(10436 KB) - Full-text XML
- BibTeX
- EndNote


Atmospheric convection plays a major role in both weather and climate. However, the initiation of convection and the mechanisms through which it organizes and grows upscale, from isolated convective cells to organized mesoscale convective systems, still remain largely unknown (Houze, 2018). As a result, their representation in numerical weather prediction (NWP) models remains inaccurate (Peters et al., 2019; Prein et al., 2015). At the same time, both of these processes, convective initiation and upscale growth, have very significant consequences for all scales of motion – from the smallest scales of turbulence to individual convective cells, mesoscale convective systems (MCSs), tropical cyclones, planetary waves, and climate (Schumacher and Rasmussen, 2020). The complex multidirectional transfer of energy, momentum, and water between scales and across the atmosphere has an enormous impact on the generation of severe weather.
Convection is driven by complex multi-scale interactions. The key large-scale ingredients include the thermodynamic and dynamic states of the atmosphere, describing the presence of potential instability and the presence or absence of large-scale forcing needed to trigger upward motion, and eventually releasing the potential instability, leading to the initiation of convection. Large-scale and mesoscale convergence and the presence of atmospheric boundaries (in moisture and heat) can play the role of these triggers of convection. Occasionally, these individual storms organize and grow upscale, forming MCSs. But what factors lead to MCS development in the first place? What are the dynamic and thermodynamic mechanisms through which individual isolated convective storms interact with each other (Raymond et al., 2015), organize, and grow upscale?
Cold pool dynamics are an important mechanism thought to facilitate the development of MCSs in the tropical atmosphere (Chen et al., 2015; Zuidema et al., 2017). These atmospheric boundaries can have a significant impact on the initiation of new convection, affecting its intensity, organization, and longevity. While pre-existing boundaries are ubiquitous in the atmosphere, once convection starts it generates its own convergence lines and boundaries as convective overturning results in the creation of surface cold pools – regions that are colder than the surrounding air. These precipitation-generated cold pools create favorable conditions for forcing new convection along their leading edges where the warmer environmental air is being displaced by the horizontally spreading colder air. As the initial convection progresses, these cold pools interact with each other and grow in size and intensity, leading to further system growth given the right environmental conditions – a positive feedback mechanism of self-organization and upscale growth.
The structure of the cold pools is controlled, in turn, by several factors. Two of them include the thermodynamic state of the environment (vertical distribution of temperature and humidity) and the vertical wind shear, affecting turbulent mixing and entrainment near the storm edges. Horizontal transport and mixing of nearby dry air can weaken convection by decreasing buoyancy (Schiro et al., 2020). At the same time, entrainment of dry mid-tropospheric air increases cloud evaporation, resulting in the development of stronger downdrafts and the build-up of surface cold pools. A third factor that strongly impacts the structure and the evolution of the cold pools, and the precipitating systems in general, is the microphysical characteristics of the precipitation (Hristova-Veleva et al., 2021), which strongly affect evaporation rates. Morrison et al. (2012), among others, found that numerical simulations with higher evaporation had stronger cold pools, faster propagation, larger storm size, greater updraft mass flux (but weaker convective updrafts at middle and upper levels), and greater total condensation that compensates for the increased evaporation to give more surface precipitation. In turn, the structure and the intensity of the divergent near-surface cold pools modify the morphology of the convective systems. These joint processes affect the vertical growth and glaciation of water-abundant clouds, as well as further aggregation and organization of individual cumulus clouds into much larger mesoscale convective systems (Rowe et al., 2012; Houze, 2018).
While the overall processes responsible for these interactions have been identified for some time, their precise nature and interactions remain under-constrained by observations; in particular, the uncertainty regarding convection and cloud processes directly results in much of the uncertainty in both weather and climate prediction. Further constraining the uncertainty in convective cloud processes linking 3-D air motion and cloud structure through models and observations is vital for improvements in weather forecasting and understanding limits on atmospheric predictability. To date, there are few independent validation data to properly validate a model forecast of precipitation structure when the underlying dynamics are evolving on convective timescales.
Many years of NASA-sponsored airborne field campaigns have focused on the microphysical processes linking clouds, convection, and precipitation, as well as ground validation, following the deployment of the Tropical Rainfall Measuring Mission (TRMM) satellite in 1997 and the Global Precipitation Measurement (GPM) mission (2014–current). These airborne campaigns featured narrow swath precipitation profiling radars, such as the JPL Ku/Ka-band Airborne Precipitation Radar (APR-2) (Durden et al., 2012). However, the Doppler capability of these radars is intended for estimating the vertical Doppler velocity within precipitating clouds, and they are not capable of capturing vertically resolved observations of three-dimensional wind structure in close proximity (10 km or less) to cloudy regions. A space-based Doppler wind lidar (DWL) capability has been envisioned as one means to overcome this observational shortcoming (Okamoto et al., 2018; Baker et al., 2014). The current Atmospheric Dynamics Mission Aeolus (ADM-Aeolus) wind lidar (Stoffelen et al., 2005) has been successfully collecting satellite-based line-of-sight profiles (Lux et al., 2020) at a synoptic scale suitable for global numerical weather prediction (NWP) data assimilation rather than the spatial scale of cloud-resolving mesoscale models (Šavli et al., 2018; Horányi et al., 2015).
Previous DWL-based airborne campaigns lacked scanning Doppler precipitation radar capabilities on the same aircraft, whose data collection was synchronized with the DWL operations. During the May–June 2017 Convective Processes Experiment (CPEX), joint observations were collected from the APR-2 and the 2 µm Doppler Aerosol Wind (DAWN) lidar (Greco et al., 2020; Kavaya et al., 2014) during approximately 100 flight hours of the NASA DC-8 aircraft (Turk et al., 2020). The APR-2 radar operates at the same frequencies as the GPM Dual-Frequency Precipitation Radar (DPR), proving reflectivity products approximately every 360 m along-track. The multi-beam measurements from the DAWN lidar were processed into high-resolution vertical wind profiles spaced as finely as 3–7 km along-track (Greco et al., 2020), including the environment close to where the clouds develop. Other than the recent analysis by Cui et al. (2020), there has been relatively little analysis of the assimilation impact of airborne Doppler wind lidar data upon the joint evolution of the mesoscale model-forecasted 3-D precipitation structure together with the associated 3-D wind field.
In this paper, the impacts of assimilating high-resolution sparsely sampled airborne DAWN measurements upon the forecasted precipitation structure are examined with the NASA Unified Weather Research and Forecast (NU-WRF) Ensemble Data Assimilation System (EDAS) modeling system (Zhang et al., 2017, 2013). A previous study of the impact of assimilating DAWN data from CPEX was carried out by Cui et al. (2020), who examined how different assimilation methods affected the forecasted wind and 2-D precipitation structure inferred from the gridded GPM IMERG (Tan et al., 2019) precipitation dataset. A unique aspect of this study is that both the horizontal and vertical evolution of the forecasted precipitation field is compared with nearly simultaneous data from APR-2 radar data and from DPR data from overpasses of the GPM. This paper is a direct follow-on to the recently published paper by the authors (Turk et al., 2020), which describes in detail the APR-2 and DAWN data for the 10 June 2017 flight investigated here. In particular, the graphics and discussion in the Turk et al. (2020) paper specifically tailored the DC-8 flight segments on 10 June into four 1 h defined segments. Each of those 1 h segments corresponds to the same assimilation time window used in the NU-WRF data assimilation cycles. The forecast impact is examined with and without (i.e., a control run) the assimilation of the DAWN wind profiles into the model. The role of the data assimilation process is to adjust the model forecast based on any observed data, accounting for errors in the forecast and the observations. The assimilation impact is assessed in two steps. First, the forecasted precipitation field is compared between the NU-WRF control run and the DAWN assimilation run for each of the four 1 h segments. For both runs, the forecasted precipitation field is compared to the observed APR-2 precipitation structure. Times when and areas where the assimilation demonstrated an improved 3-D representation of the precipitation structure are identified. In the second step, the model environmental state fields are compared between the control run and the analysis to determine how the model state (wind, temperature, moisture) changed in the model as a result of the assimilation of DAWN wind profiles. While this investigation and its conclusions are limited to a single CPEX flight date, the investigation design is appropriate for further investigation of the impact of airborne Doppler wind lidar observations upon short-term convective precipitation forecasts.
For the sake of not replicating a large number of figures in this paper, the discussion in this paper will make frequent reference to specific figure numbers from Turk et al. (2020) (full open access, so all can refer to it). To simplify the nomenclature, the term T2020 is used to cite that paper.
During CPEX, NASA DC-8-based airborne observations were collected from the JPL Ku/Ka-band Airborne Precipitation Radar (APR-2) and the 2 µm Doppler Aerosol Wind (DAWN) lidar during approximately 100 flight hours. The performance of DAWN during CPEX is presented by Greco et al. (2020), and the complementary observations of APR-2 and DAWN during CPEX, tailored to this 10 June 2017 case, are presented in T2020. Therefore, only a brief description is provided here.
For CPEX, the APR-2 provided vertical air motion and structure of the cloud systems in nearby precipitating regions where DAWN is unable to sense. Conversely, DAWN sampled vertical wind profiles in aerosol-rich, clear, or broken cloud regions surrounding the convection but is unable to sense the wind field structure within cloud. Figure 1 of T2020 shows the scanning operations of both instruments on board the DC-8 for CPEX. APR-2 acquires simultaneous measurements of multiple parameters at both the Ku and Ka band (14 and 35 GHz), including co- and cross-polarized backscatter, as well as line-of-sight (LOS) Doppler velocities of hydrometeors. APR-2 scans cross-track to resolve the 3-D nature of precipitating clouds (for more recent field campaigns, the APR-2 was modified into APR-3 with the inclusion of a W-band radar at 94 GHz, but this capability was not available for CPEX). The APR-2 range (vertical) resolution of 37 m and cross-beam (horizontal) resolution of ≈800 m at 9 km distance are more than adequate to capture cloud features down to the resolution typical of high-resolution models and appropriate for comparison in the vicinity of DAWN wind profiles.
DAWN is NASA's highly capable airborne wind-profiling lidar with a 2 µm laser that pulses at 10 Hz. DAWN can provide high-resolution (4–12 km in the horizontal and 35–150 m in the vertical) wind measurements in clear and partly cloudy conditions. The lidar scans in a conical pattern at a constant 30∘ off-nadir angle and collects line-of-sight (LOS) wind profiles at up to five azimuth angles located at −45, −22.5, 0, 22.5, and 45∘ relative to the aircraft flight direction. Since these LOS wind profiles view the local wind field from multiple azimuth angles, these LOS profiles are further processed to estimate the profile of the horizontal wind components (u, v) at different pressure levels (Greco et al., 2020). In this presentation, these profile data are used for the data assimilation impact studies.
The NASA Unified Weather Research and Forecasting (NU-WRF) modeling system was used for all cloud-resolving modeling and data assimilation tasks (Zhang et al., 2017). NU-WRF is an observation-driven regional Earth system modeling and assimilation system with physics modules, a satellite data simulation unit (G-SDSU) capable of simulating modern-era NASA satellite observations, including the GPM DPR Ku- and Ka-band ( GHz) equivalent radar reflectivity profiles and the GPM microwave imager (GMI) (Matsui et al., 2014), and an ensemble data assimilation system that can assimilate conventional state variables such as wind, temperature, and moisture, as well as cloud- and precipitation-affected microwave radiances.
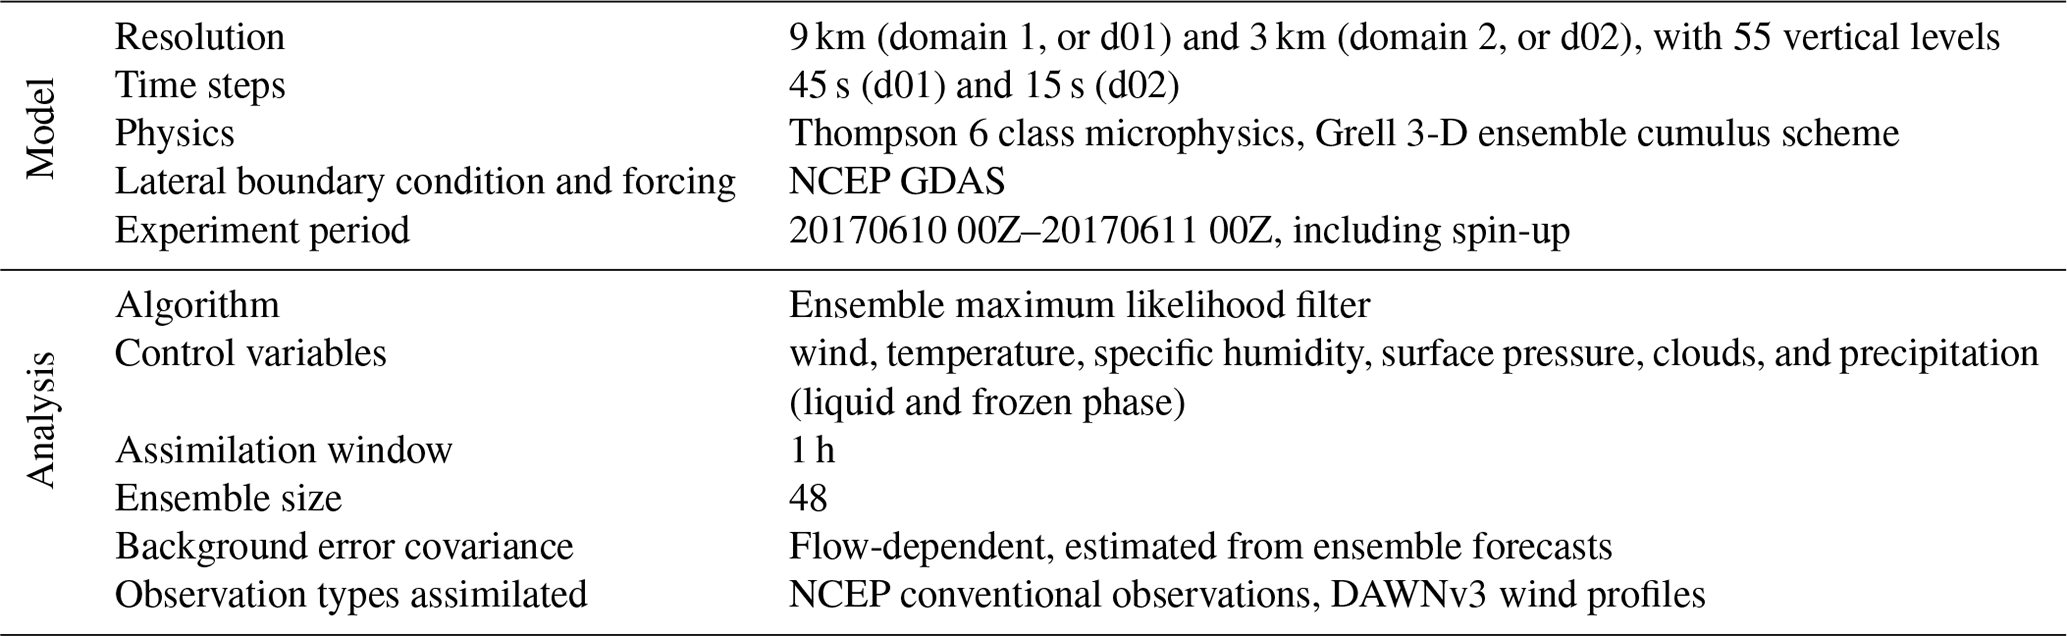
For simulations of this flight date, the NU-WRF EDAS model and analysis were configured as specified in Table 1. Considering the data assimilation approach, the lateral boundary and initial conditions from NCEP already have the conventional data and all other operational data streams assimilated (DAWN data are not part of this). This is a standard and necessary procedure for a regional model to run. It should be pointed out that in this investigation, an additional data assimilation of conventional data is also conducted in the regional system NU-WRF EDAS. This ensemble data assimilation is carried out in domain 1. The reasoning for the additional data assimilation is outlined as follows: the WRF model forward integration is configured as one-way nesting; when the regional model integrates forward, the domain interior states evolve differently and could drift away compared to the global analysis. Thinking this way, the data impact (such as from the conventional data) at the boundary is lost in the domain interior, thus justifying the existence of regional data assimilation in the domain (i.e., no assimilation at or near the boundary). Technically, one could say that the conventional data are thereby assimilated twice. A more meaningful way would be to view this as “a re-enforcement of the data constraint in the regional model interior”.
For this investigation, NU-WRF EDAS was specifically adapted for assimilation of DAWN profile winds also in domain 1 of the regional model. We conducted the DAWN data assimilation to test the impact of these observations – an impact that comes in addition to that of the standard assimilation of the conventional data.
The GPM data and the APR-2 radar data were not assimilated in this study. Both of these datasets were used only for model validation. To support this validation, we used the NU-WRF forward simulations (integrations and forecasts) of the geophysical fields as inputs to instrument simulators to produce the synthetic satellite-like (GPM-specific) observables – the passive microwave (MW) brightness temperature (TB) at the 13 GMI channels (10.7 through 183.31 GHz) and the DPR equivalent radar reflectivity factor profiles at same frequencies as DPR and APR-2 ( GHz). The only assimilated data in this study, in addition to the NCEP conventional observations, were the DAWNv3 wind profiles. Hence, the improved representation of the precipitation structure in the simulations with DAWNv3 data assimilation is solely the results of assimilating the DAWN winds.
In Figs. 4–18 of T2020, the APR-2 flight tracks (overlaid upon near-time GOES-16 visible imagery) and associated APR-2 reflectivity and DAWN profiles are shown for each of the four 1 h assimilation windows centered at 19:00, 20:00, 21:00, and 22:00 UTC. Figure 4 of T2020 shows an example of the DAWN winds subset at one altitude (8 km) for the 10 June 2017 flight during the 18:30–19:30 UTC time period, which was just before the DC-8 entered the main area of interest. The domain and flight area are also shown in Fig. 1.
Table 1Configuration of the NU-WRF EDAS for use in this investigation.
The NU-WRF EDAS consists of ensemble forecasts and a central forecast. The ensemble forecasts are used to estimate the flow-dependent background error covariance. The analysis updates the initial conditions for the subsequent central forecast that is not the ensemble mean though very close to it. The analysis error covariance generates the ensemble perturbations for the ensemble forecasts in the next cycle. The results presented in the paper are from the central analyses and forecasts.
A 3 km inner grid was used for the comparisons with the APR-2 data. In particular, the model assimilation cycle was hourly, incorporating all observations (conventional observations such as radiosondes) and DAWN winds within a ±30 min window centered at the top of the hour. The 1 h forecast was then carried forward for the next hourly assimilation cycle. Precipitation is accumulated over 1 h of model integration and output at hourly intervals. For example, a 06:00 UTC assimilation cycle would incorporate all observations from 05:30–06:30 UTC. The resultant 1 h forecast at 07:00 UTC is used as the background in the next (07:00 UTC) assimilation cycle. The precipitation at 07:00 UTC represents a 1 h integration from 06:00–07:00 UTC.
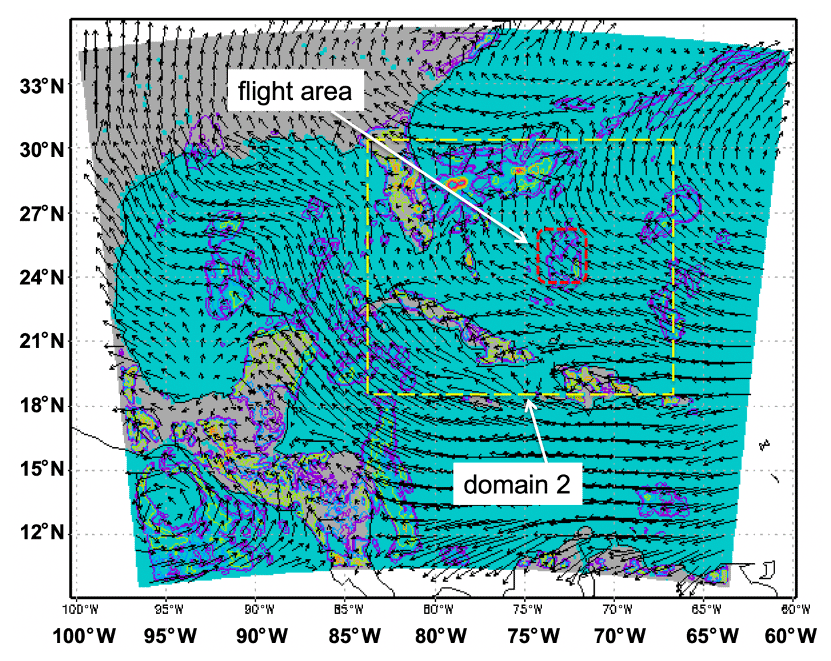
Figure 1Depiction of NU-WRF domain 2; 10 m winds are plotted from the control run at 19:00 UTC. Domain 2 extends ∼18–30∘ N, 84–66∘ W.
The four panels in Fig. 2 show the cross section of the DAWN zonal (u component) vector wind field processed for the 1 h assimilation cycles centered at each of the four 1 h assimilation cycles. In general, the Doppler lidar-derived wind vectors are more abundant near upper levels (higher signal-to-noise ratio) and closer to the surface (more aerosols, larger backscatter), with a general loss of signal and fewer data in the mid-levels. Areas of cloud contamination are shaded in blue. The NU-WRF EDAS was run in two modes: (1) a control run wherein only conventional observations (e.g., radiosondes, clear-sky radiances) are assimilated in the National Center for Environmental Prediction (NCEP) model that provides the initial boundary conditions and (2) a second data assimilation run wherein the DAWN wind profiles were assimilated in addition to the conventional observations.
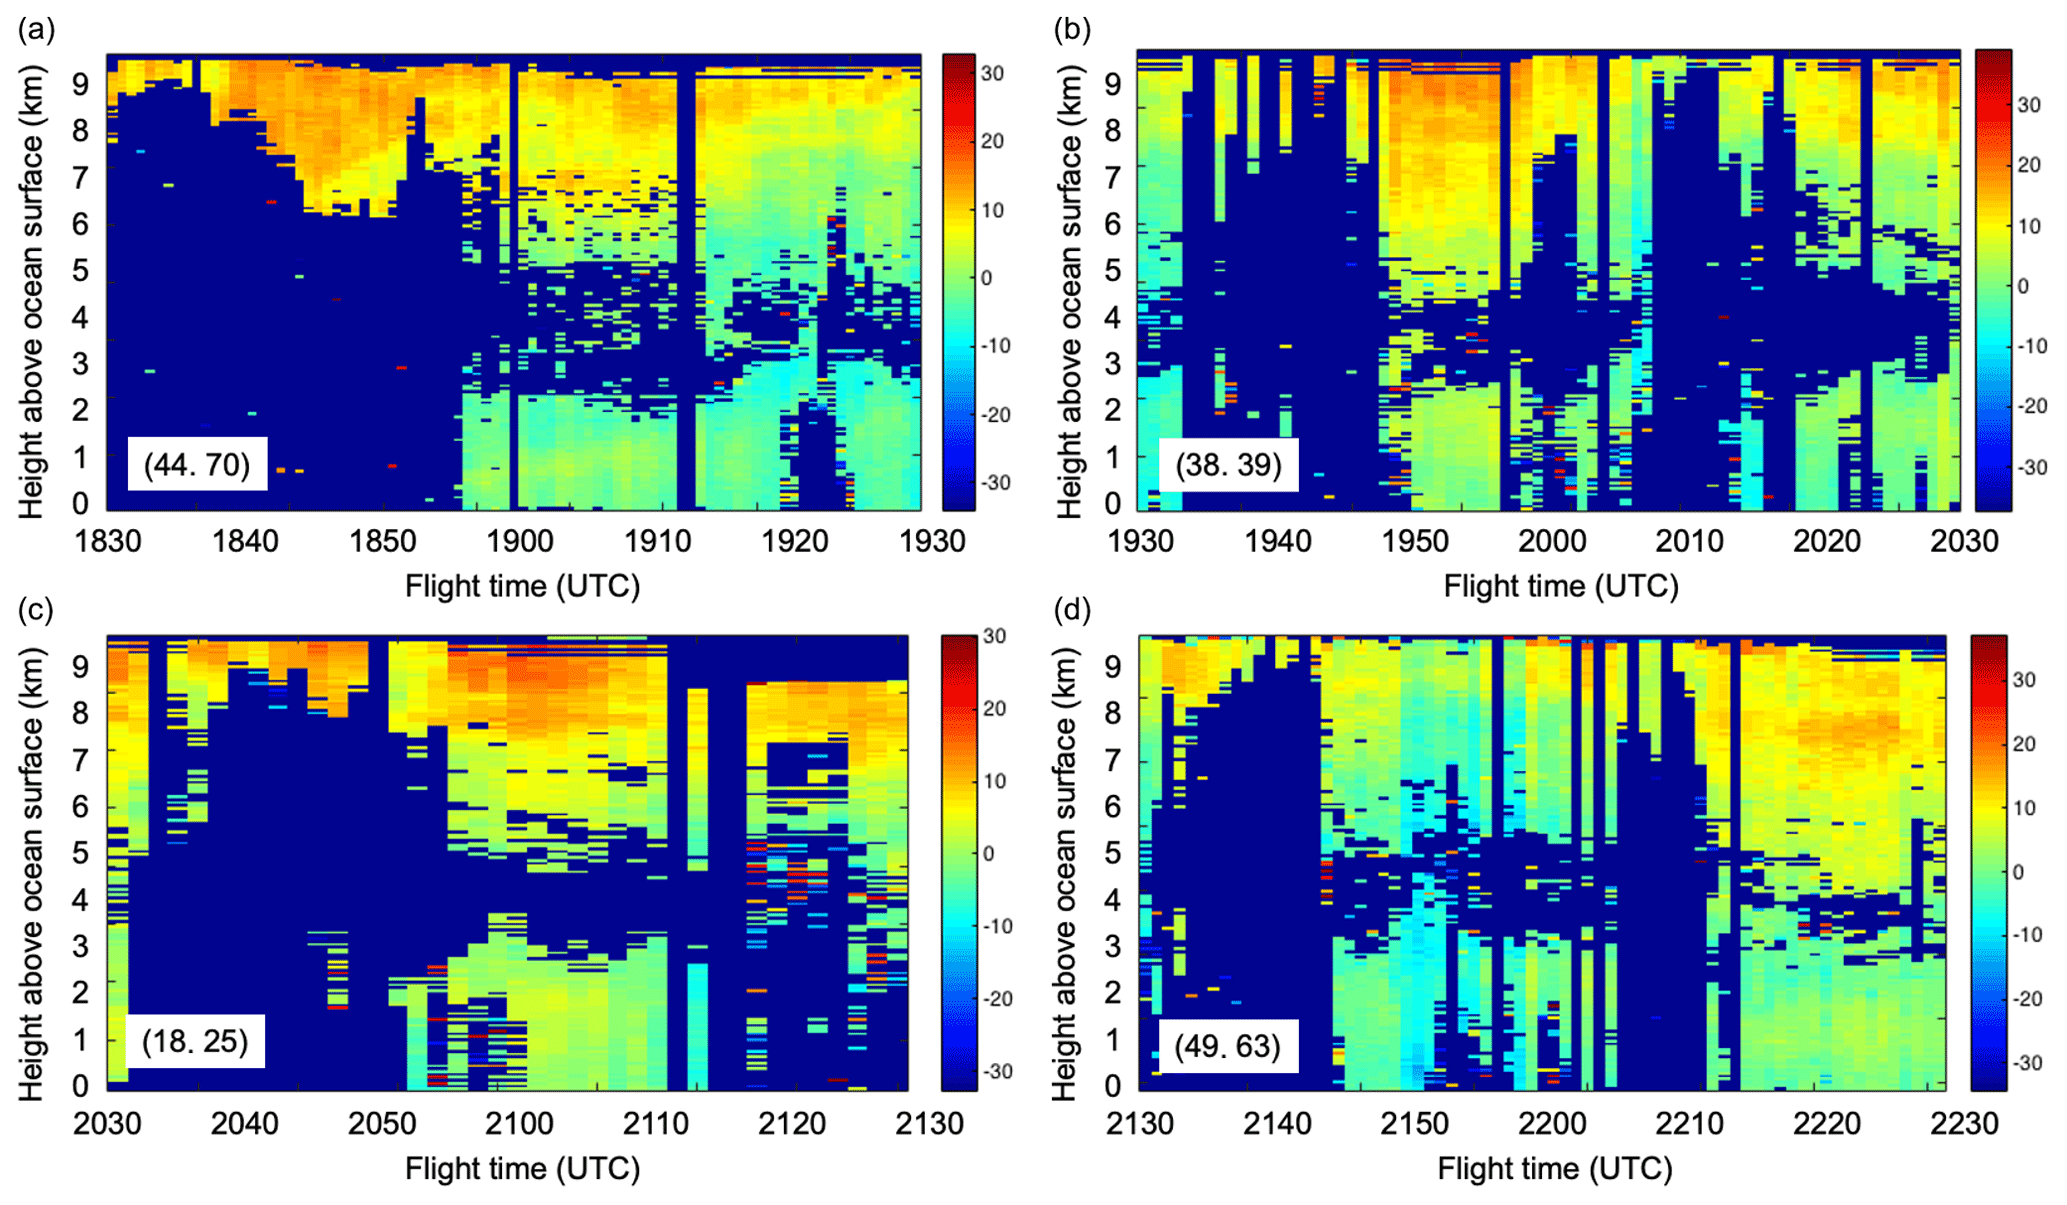
Figure 2Vertical cross section of the zonal (u) component of the DAWN wind profiles preprocessed to (u,v) for the 10 June 2017 NU-WRF model impact study. In all panels, the x axis represents 1 h of DC-8 flight time, and the y axis extends from the ocean surface to ∼9 km of height. (a, b) 19:00 and 20:00 UTC data assimilation interval. (c, d) 21:00 and 22:00 UTC interval. The two numbers in parentheses indicate the number of DAWN wind vectors at 2 and 8 km of height, respectively.
Figure 3 depicts the resulting model precipitation field forecast for the control run, showing the DC-8 flight track during each 1 h period. While some scattered precipitation develops in the periphery of the DC-8 flight patterns, no precipitation develops inside the DC-8 flight track box patterns on this day. Figure 4 shows the same set of figures, but after the DAWN data assimilation. After the first data assimilation cycle (18:30–19:30 UTC), precipitation later develops inside the DC-8 box area between 19:30–20:30 UTC and further intensifies into the 20:30–21:30 period and beyond. How well does this modeled precipitation compare to independent validation in horizontal and vertical structure, as well as in timing?
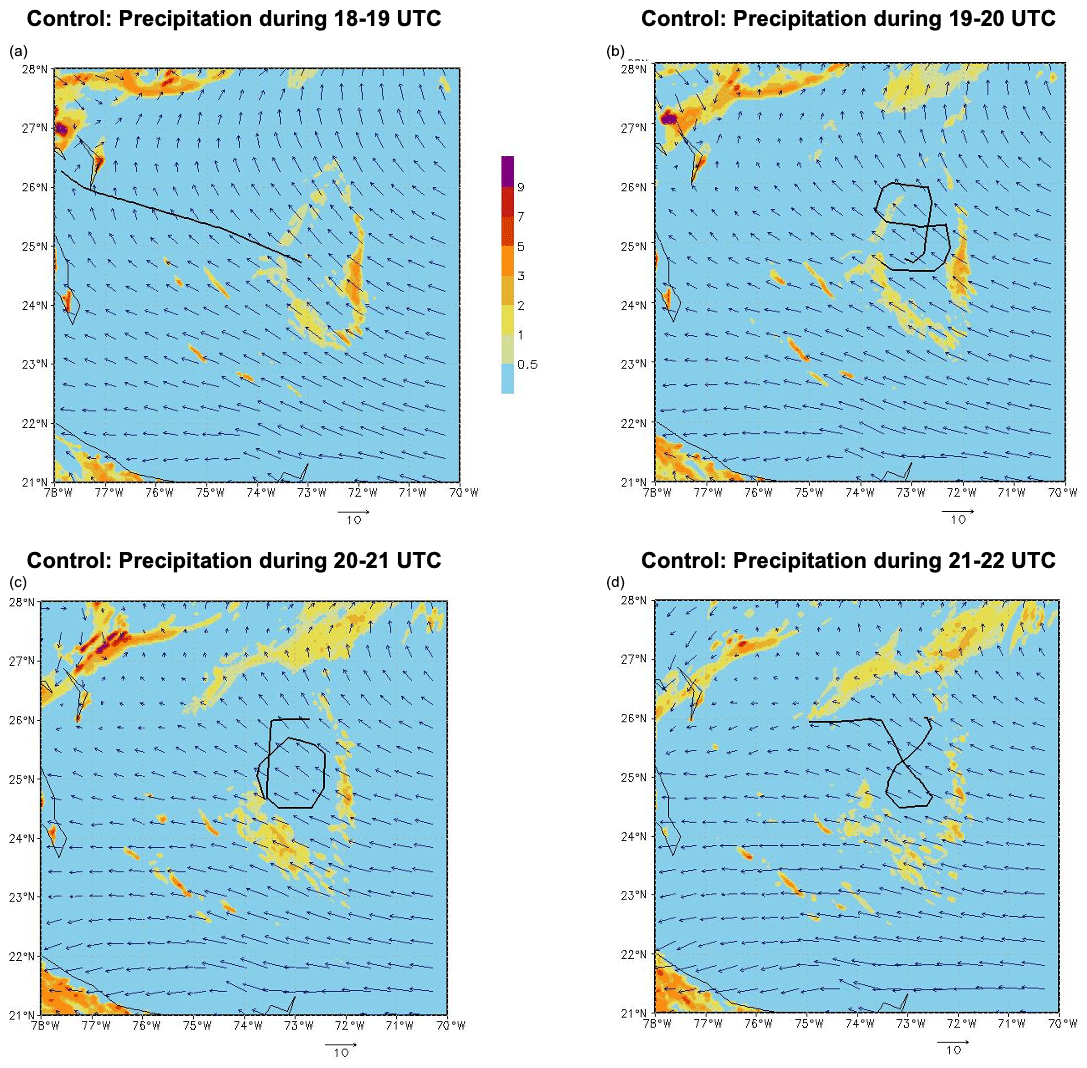
Figure 3Left to right from upper left: precipitation from the control run for the model forecast that was output at 19:00, 20:00, 21:00, and 22:00 UTC. Each period represents a 1 h precipitation average (mm h−1; contoured according to the scale in panel a), and wind at the 500 m level (vector) is shown. The domain is 21–28∘ N, 78–70∘ W. The lines show the DC-8 flight tracks during each 1 h interval.
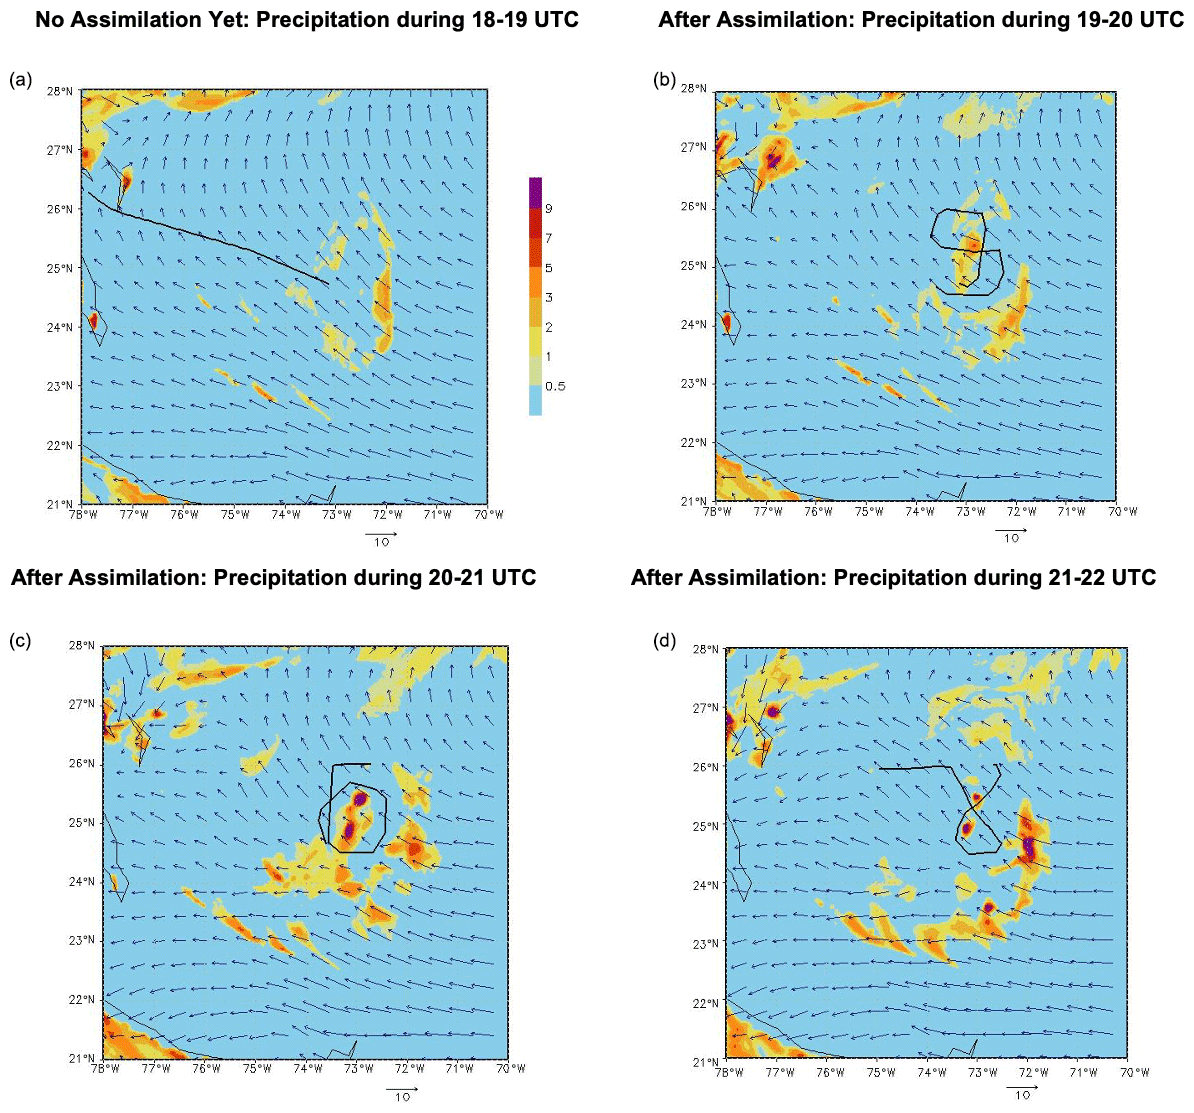
Figure 4Same as Fig. 3, but after the assimilation of DAWN wind vector profiles.
Fortuitously, there was a GPM overpass directly over this region that occurred near 18:52 UTC. Figure 5a shows the GMI 89H GHz image, with well-developed convection (TB < 200 K) to the north of the target area but some indication (only a few pixels in GMI) of developing convection inside the target area (boxed area). In order to provide resolution, Fig. 5b shows the DPR Combined Radar–Radiometer Algorithm (CORRA) (Grecu et al., 2016) precipitation rate inside the boxed area (DPR has 4 km pixel size; individual pixels are plotted for detail). The CORRA product has two variants, a single-frequency (Ku-band-only) product covering the full 245 km swath and a dual-frequency (Ku- and Ka-band) product that encompasses the central 120 km swath area where both radars jointly scan. The dual-frequency product capitalizes upon relationships between the different path-integrated attenuation to mitigate ambiguities in the assumed hydrometeor size distribution. For the purpose of maximizing coverage, the Ku-band product is depicted in Fig. 5b. The developing convection occurs northeast of and near the end of the 18:30–19:30 DC-8 flight tracks (green dashed line). This location corresponds very closely to the location of the modeled precipitation during 19:30–20:30 UTC (upper right panel in Fig. 4). Therefore, location-wise, the modeled precipitation agrees well with independent observations by the GPM GMI, even though it is present in the model ∼1 h later than in the observations, showing in the model following the assimilation of DAWN observations over the previous hour.

Figure 5GPM overpass near 18:52 UTC on 10 June 2017. (a) GMI 89H GHz channel (Kelvin). (b) Zoom-in of the precipitation rate estimated by CORRA (mm h−1) over the box area shown in (a). In both panels, the black lines show the swath of the DPR Ku-band radar. In panel (a), the thin magenta line near the satellite sub-track denotes the DPR cross section shown in Fig. 6. The green and red dashed lines indicate the DC-8 flight tracks between 18:30–19:30 and 19:30–20:30 UTC, respectively.
In Fig. 5a, there is a thin magenta line that runs near the sub-track of the GPM satellite, which lies within the swath coverage of both the DPR Ku- and Ka-band radars. Figure 6 shows the DPR cross section along this line. The resolution of the DPR data has been averaged over a 3×3 area to better match the resolution of the GMI 89 GHz channel (100 scan lines of GMI, corresponding to about 1000 km of along-track distance). The top panel and middle panels in Fig. 6 show the Ku- and Ka-band reflectivity profiles. The lower panel shows the trace of each of the 13 GMI channels under this same cross section. Near GMI scan 20, the radar tops are near 10 km, with significant attenuation of the Ka-band profile relative to the Ku band below the 4.5 km freezing level (blue dashed line). The developing cell in the boxed area in Fig. 5a near 25∘ N, 73∘ W is near scan line 50, and the widespread convection above 28∘ N is near scan line 20. The area near scan line 50 has less developed cloud above the freezing level, but also significant Ka-band attenuation relative to the Ku band. The passive MW TB for channels <89 GHz is not similar for these two areas, but the ice-scattering signatures at the GMI highest-frequency channels (166 and 183.31 GHz) are more evident (significant TB depression) for the developed convection near scans 15–25.
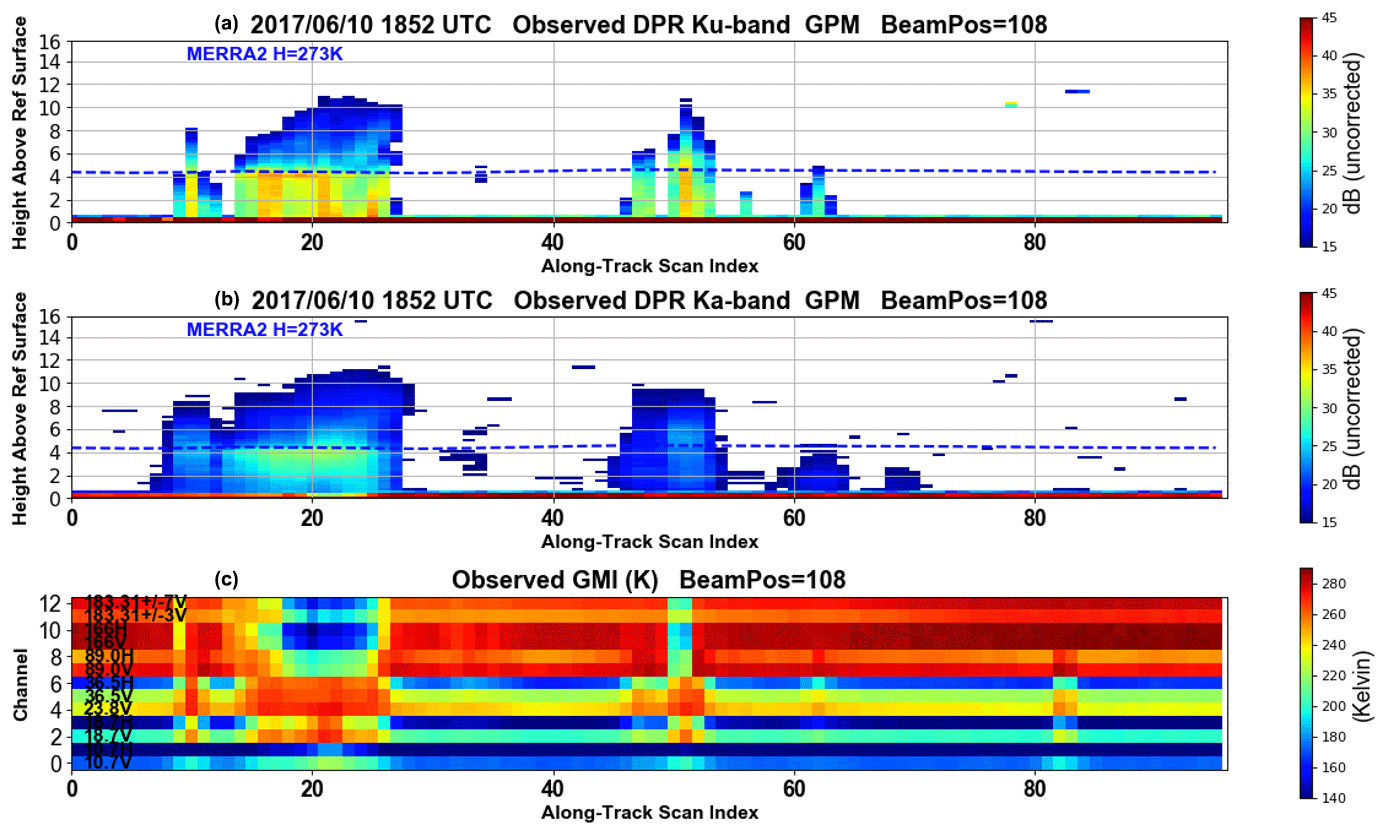
Figure 6GPM overpass near 18:52 UTC on 10 June 2017. (a) DPR Ku-band profile underneath the cross-sectional line indicated in the left panel of Fig. 5. Scan index b0 indicates the northernmost location of the cross section. (b) Same as top panel, but for the DPR Ka-band radar. (c) Trace of each of the 13 GMI channels along this same cross section ordered from the lowest GMI frequency (10.7 GHz) to the highest GMI frequency (183.31 GHz).
These GPM radar and radiometer observations show good agreement with the location of the precipitation after the data assimilation of DAWN profile winds. However, this alone is insufficient to explain what changed in the model state variables as a result of the assimilation. Interpretation of the GPM data implies fairly high liquid water contents below the freezing level, indicative of isolated, growing, small-scale convection. In the next section, the vertical structure of the NU-WRF simulations is analyzed and contrasted with profile characteristics from this DPR and actual APR-2 radar data.
As mentioned, NU-WRF provides post-processing options, including an instrument simulator option, to forward-simulate satellite observations. This option was used to simulate radar observations at DPR frequencies and passive microwave TB at the 13 GMI channels. For the purposes of this study, only the radar simulations derived from the NU-WRF run with DAWN assimilation are shown below.
4.1 Simulated DPR observations from NU-WRF
The simulation of the DPR Ku-band radar observations using the microphysics, water vapor, and temperature structure from the NU-WRF analysis at 20:00 UTC is shown in Fig. 7. The overall extent of the image is the same as the panels in Figs. 3 and 4, and the boxed area corresponds to the geographical area shown in Fig. 5b. The color scale refers to the maximum Ku-band reflectivity (dBZ) encountered in each model grid vertical column. The developing cloud near 25.5∘ N, 72.9∘ W is well-coordinated in location with that shown in Fig. 5b and with peak reflectivity in excess of 30 dBZ. The strong convection along 28∘ N is apparent, similar to what was observed by GMI. To further analyze the simulated DPR vertical structure, the black dashed lines indicate locations for N–S and E–W cross sections from two locations, one in the NE corner near (26.8∘ N, 76.8∘ W) and another in the boxed target area near (25.5∘ N, 72.9∘ W).
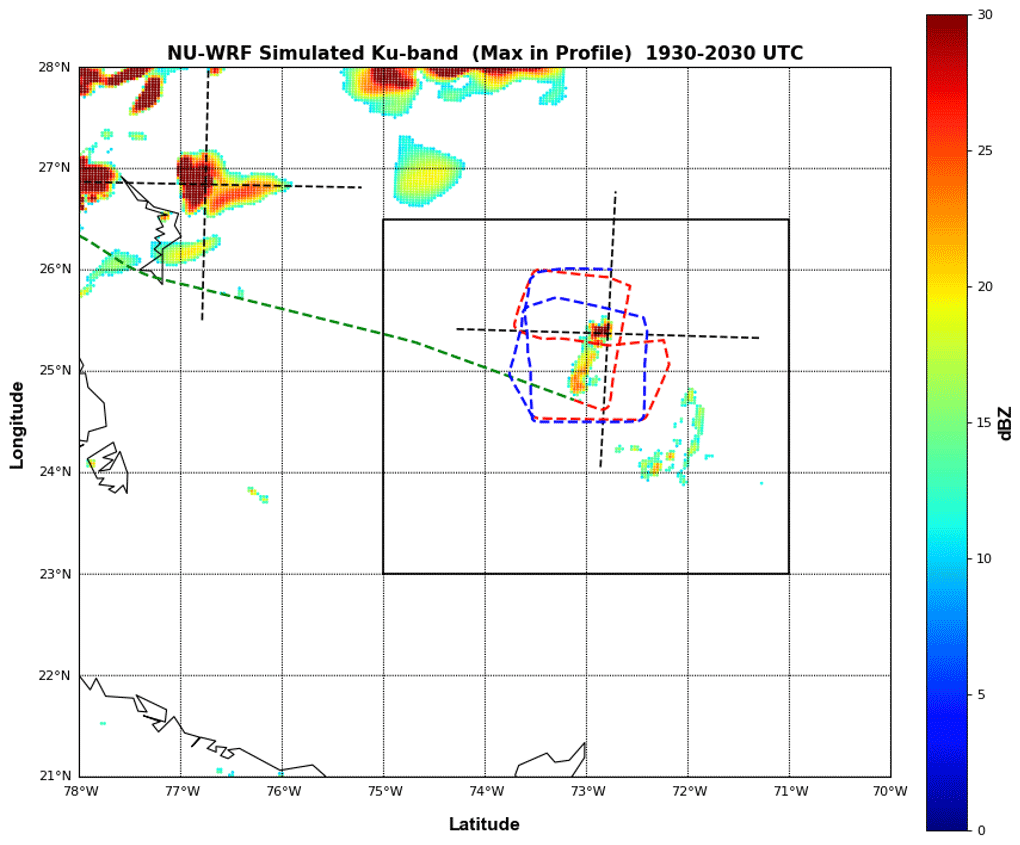
Figure 7Plan view of NU-WRF simulated Ku-band reflectivity (shown as maximum reflectivity in the profile) from the NU-WRF analysis at 20:00 UTC. The dashed lines indicate the locations of the E–W and N–S cross sections shown in Fig. 8, crossing at locations 26.8∘ N, 76.8∘ W and 25.5∘ N, 72.9∘ W. The green, red, and blue dashed lines indicate the DC-8 flight tracks between 18:30–19:30, 19:30–20:30, and 20:30–21:30 UTC, respectively.
Figure 8 shows, from the top down, N–S and E–W cross sections for the simulated Ku-band reflectivity profiles and then the Ka-band reflectivity profile simulations. Figure 8a (the left four panels) is associated with the convection near 26.8∘ N, 76.8∘ W just inside the NU-WRF model domain 2 shown in Fig. 1. Simulated DPR reflectivity tops are near 10–12 km, also with strong Ku- and Ka-band attenuation. The strong Ka-band attenuation is similar to what was noted from actual DPR observations during the earlier (18:52 UTC) GPM overpass (Fig. 6).
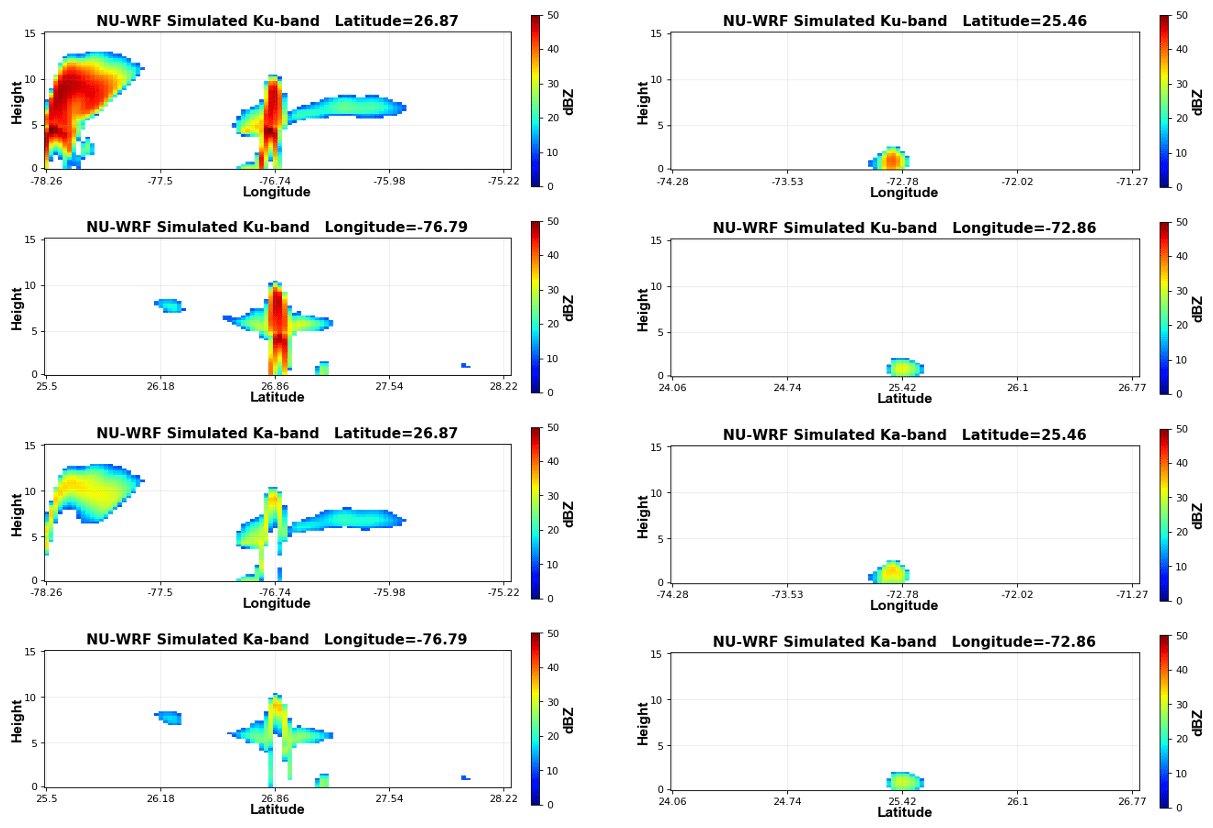
Figure 8Convection in the 20:00 UTC analysis. The left column shows NU-WRF simulated DPR profiles under the black dashed lines crossing at 26.8∘ N, 76.8∘ W in the box in Fig. 7. From top to bottom: vertical profile of Ku-band reflectivity under the E–W line (latitude 26.8∘ N), Ku band under the N–S line (longitude 76.8∘ W), and these same two again but for the Ka-band simulation. The right column is the same as the left, but for the NU-WRF simulated DPR profiles under the black dashed lines crossing at 25.5∘ N, 72.9∘ W in the box in Fig. 7.
Figure 8 (right four panels) is associated with the cross sections through the developing area in the boxed area in Fig. 7 (near 25.5∘ N, 72.9∘ W). While the actual developing convection shows >35 dBZ maximum reflectivity in the N–S Ku-band cross section), NU-WRF modeled these as shallow clouds limited to <3 km vertical extent in simulated DPR cloud tops. For the N–S cross section, even within these very shallow all-liquid clouds, ∼10 dB Ka-band path attenuation is present relative to the Ku band, in accord with the associated DPR overpass, indicating the presence of very high liquid water content.
To compare these simulated profiles with APR-2 observed profiles, Fig. 9 shows an APR-2 cross section (Ku and Ka band) between 20:00–20:10 UTC, about midway through the DC-8 flight segment (red dashed line) in Fig. 7. Essentially, Fig. 9 is a close-up of Fig. 12 of T2020, but showing both radar frequencies. The clouds in this area are more mature and developed than what NU-WRF had forecasted, with the Ku-band cloud top exceeding the 8 km level (owing to the APR-2 radar configuration, the radar was unable to sense in the 1.8 km zone below the DC-8 flight altitude). Strong differential attenuation (i.e., the Ku minus Ka band difference increasing closer to the surface) was noted near scan 170, indicative of high liquid water content below 4 km.
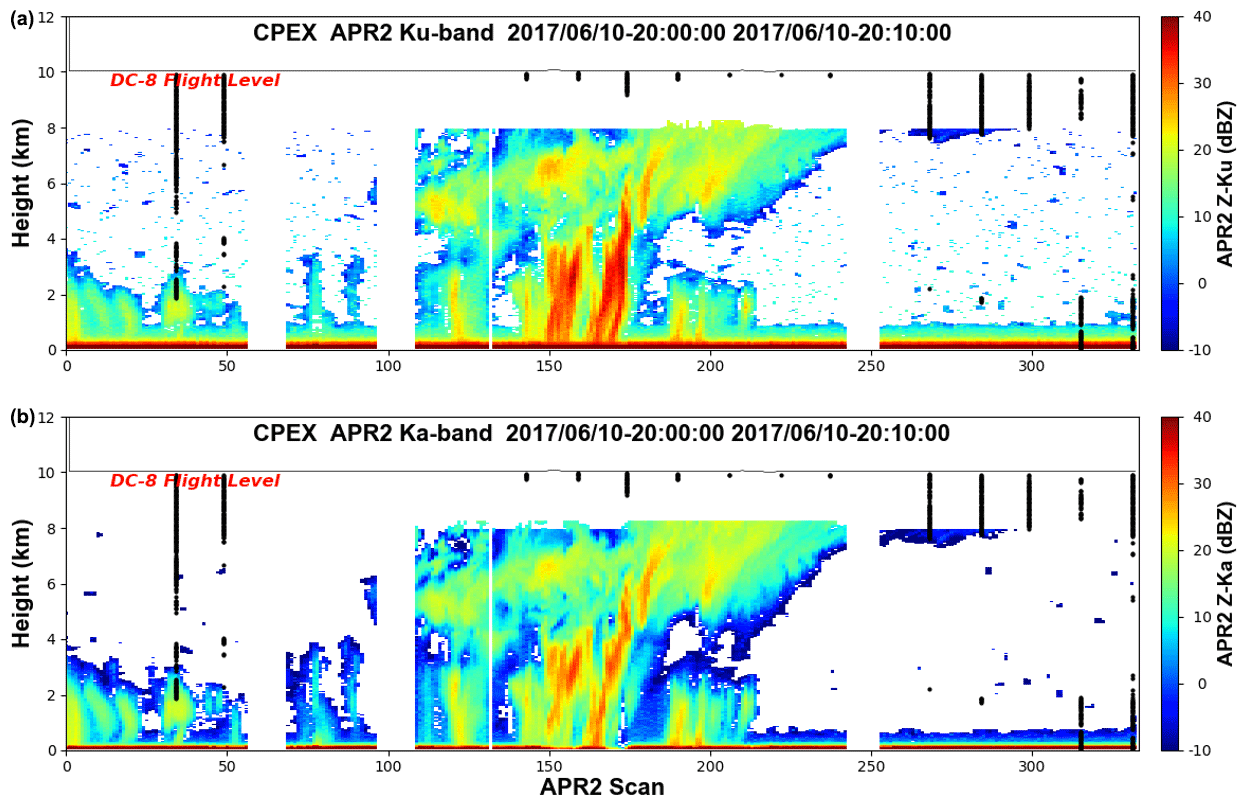
Figure 9APR-2 measured radar reflectivity vertical profiles for the 10 min DC-8 flight period between 20:00–20:10 UTC. (a) Ku band. (b) Ka band. The spacing between each APR-2 scan is 360 m. The black dots indicate DAWN wind profile locations.
Figures 10 and 11 are identical in layout to Figs. 7 and 8, respectively, but for the NU-WRF 21:00 UTC analysis. The locations for the associated N–S and E–W cross sections are depicted in Fig. 10 (black dashed lines), showing that the precipitation during this time has evolved into two main active regions inside the boxed area, with peak Ku-band reflectivity exceeding 30 dBZ. In the left column of Fig. 11, the associated vertical cross sections show the rapid growth of the cloud near 25.5∘ N, 73∘ W, with 45 dB radar tops near 10 km, more in accord with the APR-2 structure during this time (see Fig. 15 in T2020). In the right column of Fig. 11, the cloud near 25∘ N, 73.3∘ W has intensified to near 45 dB but has developed to only 5 km radar tops in both the N–S and E–W directions. The Ka-band attenuation is severe in both cells, with the radar signal being lost (below simulated DPR detection limits) before reaching the surface.
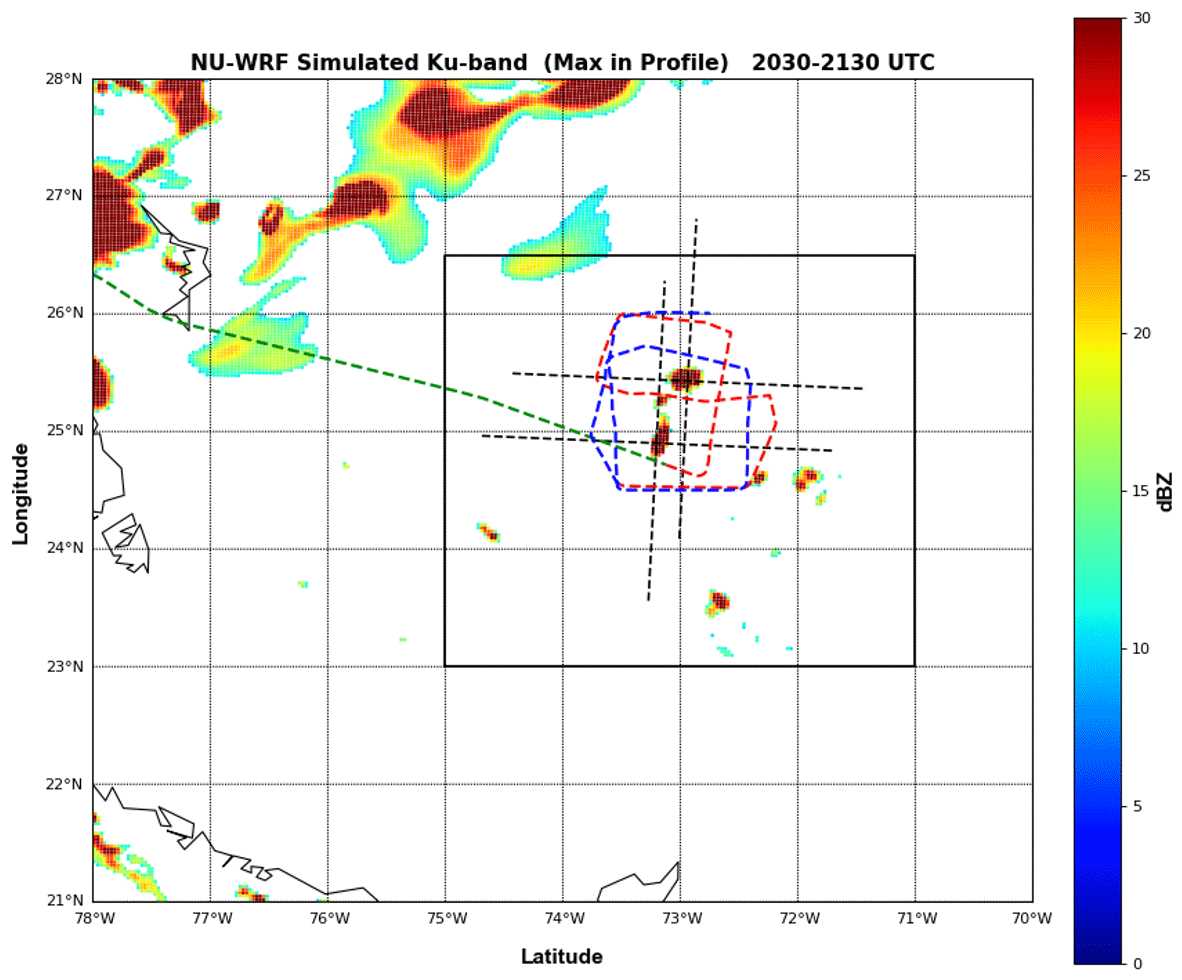
Figure 10Plan view of the NU-WRF simulated DPR Ku band (maximum reflectivity in the profile) for the 21:00 UTC analysis. The dashed lines indicate the locations of the E–W and N–S cross sections shown in Fig. 11, crossing at locations 25.5∘ N, 73∘ W and 25∘ N, 73.3∘ W. The green, red, and blue dashed lines indicate the DC-8 flight tracks between 18:30–19:30, 19:30–20:30, and 20:30–21:30 UTC, respectively.
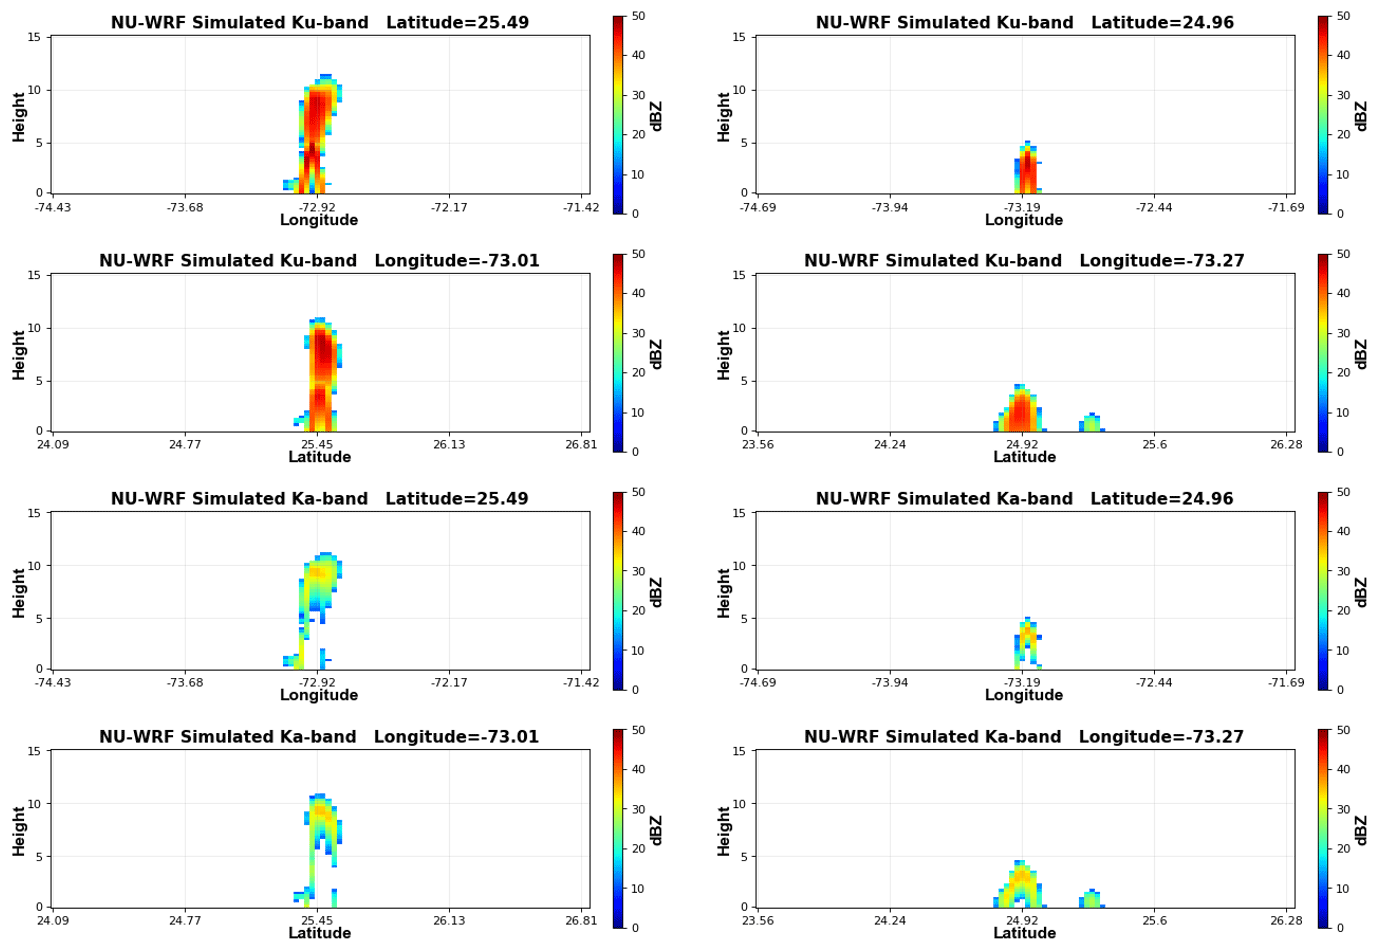
Figure 11Convection in the 21:00 UTC analysis. (Left column) NU-WRF simulated DPR profiles under the black dashed lines crossing at 25.5∘ N, 73∘ W in the box in Fig. 10. From top to bottom: vertical profile of Ku-band reflectivity under the E–W line (latitude 25.5∘ N), Ku band under the N–S line (longitude 73∘ W), and these same two again but for the Ka-band simulation. The right column is the same as the left, but for the NU-WRF simulated DPR profiles under the black dashed lines crossing at 25∘ N, 73.3∘ W in the box in Fig. 10.
To compare these simulated profiles with nearby observed profiles, Fig. 12 shows an APR-2 cross section (Ku and Ka band) between 21:15–21:25 UTC near the end of the DC-8 flight segment (blue dashed line) in Fig. 10 (essentially, Fig. 12 is a close-up of the APR-2 profile shown in Fig. 15 of T2020). The clouds in this area are more mature and developed than what NU-WRF had forecasted, with the Ku-band cloud top exceeding the 8 km level and especially strong differential attenuation (below the 4 km level) near scan 200.

Figure 12APR-2 measured radar reflectivity vertical profiles for the 10 min DC-8 flight period between 21:15–21:25 UTC. (a) Ku band. (b) Ka band. The spacing between each APR-2 scan is 360 m. The black dots indicate DAWN wind profile locations.
In summary, the control NU-WRF simulations failed to produce precipitation inside the box that was sampled during the 10 June flight mission. In contrast, according to both APR-2 and the GPM satellite observations, convection was observed in that box. After the assimilation of the DAWN winds, NU-WRF developed convection in the places where it was observed. However, the development of the convection was delayed by about 1 h. While the NU-WRF simulations represented the location of the developing precipitation well (even though delayed in time), the associated growth in the heights of vertical precipitation structure also evolved more slowly. The NU-WRF simulated Ku- and Ka-band radar tops did not reach the vertical development noted by APR-2, but they had better agreement with APR-2 cloud structure in the 20:30–21:30 period (an hour behind the observed precipitation). Hence, the assimilation of the DAWN winds resulted in the development of clouds and precipitation, even though delayed, where it was observed. Interestingly, NU-WRF succeeded in producing the observed characteristics of the clouds and precipitation – predominantly shallow, non-glaciated clouds with high liquid water content, noticed in the strongly attenuated Ka-band radar profile.
4.2 Impact of the DAWN data assimilation on the model wind, temperature, and moisture structure: analyzing the analysis increments
The analysis above focused on the change to the convective structure that occurred following the assimilation of the DAWN wind profiles in the NU-WRF EDAS. As noted in Fig. 4, the assimilation of the DAWN winds, beginning with the 19:00 UTC assimilation cycle, produced subsequent precipitation in the area where it was observed, whereas the control run produced no precipitation in the same region. A relevant question is how the assimilation of the DAWN winds contributed to the subsequent development of precipitation in the area where it was observed in reality. While this study is not of a scope to fully answer this question, one can compare the environmental state (structure of wind, potential temperature, and water vapor) that was produced by the control model forecast to the analysis produced after the assimilation cycle to address the impact of the DAWN data assimilation on modifying the initial environment in which the subsequent convection develops. Indeed, the assimilation of the DAWN winds, even at a single time step, produced a very significant impact on the associated wind, temperature, and moisture structure, as further illustrated below.
The impact on the wind structure of the model after the assimilation of the DAWN data was examined. The environmental wind shear conditions that were present at the time of the first assimilation period (a ±30 min assimilation window centered at 19:00 UTC) are illustrated in Fig. 7 in T2020, which depicts the vertical wind shear conditions inferred solely from DAWN profiles during this period. There was sustained directional wind shear between 2 and 8 km levels in the area west of 73∘ W, oriented from west to east, whereas between 2 and 6 km the shear was weaker and oriented more south to north. For a particular example, Fig. 2 (top left panel) illustrates the observed vertical profile of the zonal component of the wind during the 19:00 UTC assimilation cycle, which incorporated observations between 18:30–19:30 UTC. These wind conditions were provided to the NU-WRF EDAS in the DAWN assimilation run and absent in the control run. Figure 13 presents the analysis increments (assimilation minus control) introduced in the vertical profiles of the zonal (u) and meridional (v) wind components after the 19:00 UTC assimilation cycle. A close look suggests the assimilation of the DAWN winds resulted in a decrease in the zonal wind shear immediately next to the convective development at the end of the DC-8 track (80–90 km of distance). This is manifested by more positive-valued increments near the surface and more negative increments at upper levels (above 6.25 km). The meridional component increments suggested the reverse: i.e., an increase in meridional shear in the 80–90 km range (near the subsequent precipitation). This is manifested by the more negative increments at that range near the surface versus the more positive increments at the same range but at higher altitudes.
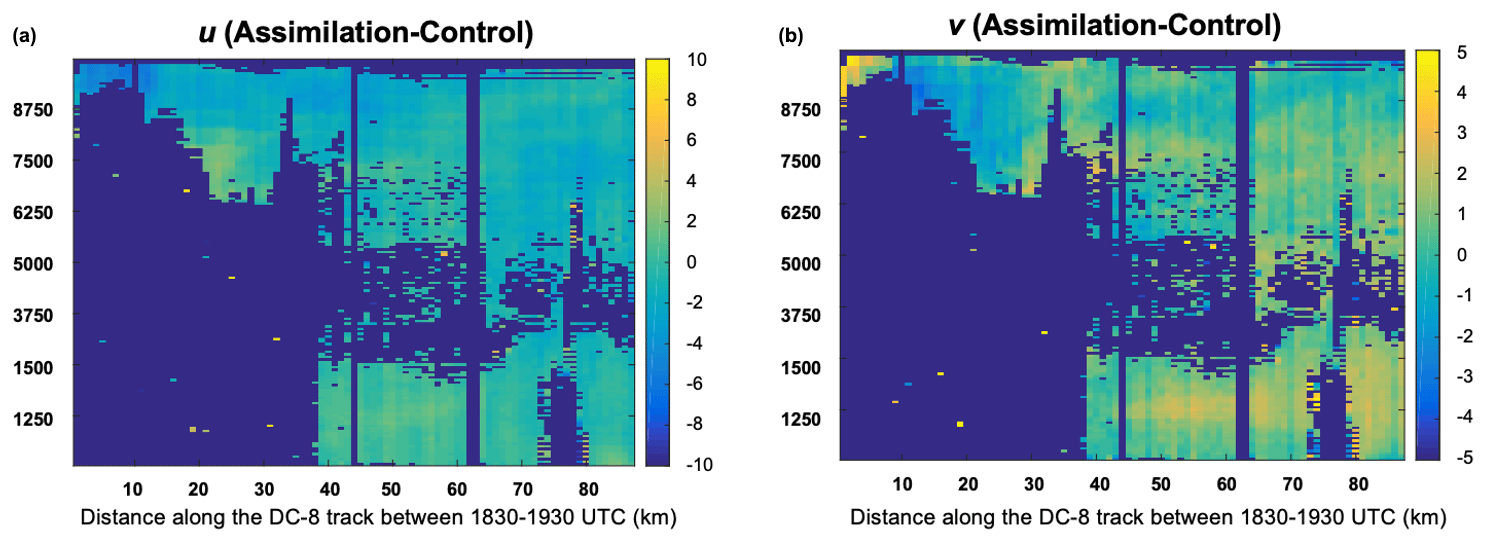
Figure 13Profile of the analysis increment (assimilation run at 19:00 UTC minus the control run at 19:00 UTC) of the (a) zonal (u) and the (b) meridional (v) wind components of the flow along the DC-8 flight track as shown in Fig. 3 (top left panel). Units: m s−1.
Figure 14 shows the NU-WRF 500 m height model wind field after the first assimilation cycle (centered at 19:00 UTC). The wind increments are broken down into their zonal and meridional components and plotted as a difference field (assimilation minus control). The red curves indicate the approximate boundary (high gradient) between the negative- and positive-valued contours, with a focus on the area where the subsequent precipitation would develop in the data assimilation run. The zonal winds (left panel) reveal positive differences to the west of this boundary (stronger westerly winds) and negative differences to the east (stronger easterly winds), both indicative of stronger low-level convergence of the zonal wind in the assimilation run versus the control, i.e., a stronger zonal forcing after the assimilation. The meridional winds (right panel) reveal positive differences (increments) to the south of the boundary line (stronger southerly winds) and negative differences to the north (stronger northerly winds), also indicative of stronger low-level meridional convergence in the vicinity of the subsequent development of precipitation. Therefore, the assimilation of the DAWN winds modified the low-level wind field in such a way as to strengthen convergence (both zonal and meridional, almost at the same location) in a narrowly focused zone. This line of convergence provided favorable dynamical conditions to promote further vertical cloud development.
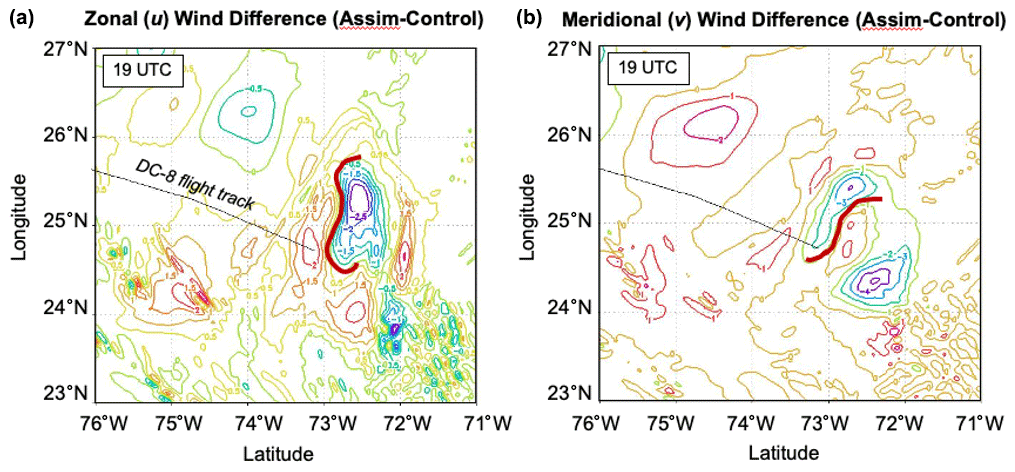
Figure 14The 500 m height wind field difference (assimilation minus control; m s−1) that resulted after the first data assimilation period centered at 19:00 UTC. (a) Zonal (u) wind component difference (m s−1). (b) Meridional (v) wind component difference (m s−1). The red curves in each panel shows the approximate boundary between negative and positive contours in the vicinity of where the precipitation eventually developed. The DC-8 flight segment during this time is shown.
In a similar fashion as Fig. 14, Fig. 15 shows the NU-WRF water vapor mixing ratio increments (left panel) and the potential temperature increments (right panel) resulting from this same DAWN assimilation cycle (centered at 19:00 UTC), also plotted as a difference field (assimilation minus control, i.e., an analysis increment). The region of strongest positive increments (contours) is shown in the red shaded area. It can be seen from Fig. 15 that the assimilation of the DAWN winds during this time produced positive moisture and temperature increments in highly overlapping areas. While only new wind data were assimilated (no new moisture data), the resulting increments in moisture and temperature were produced through the background error covariances generated by the model ensemble. Both the higher moisture and the warmer temperatures resulted in enhanced convective potential in these regions.
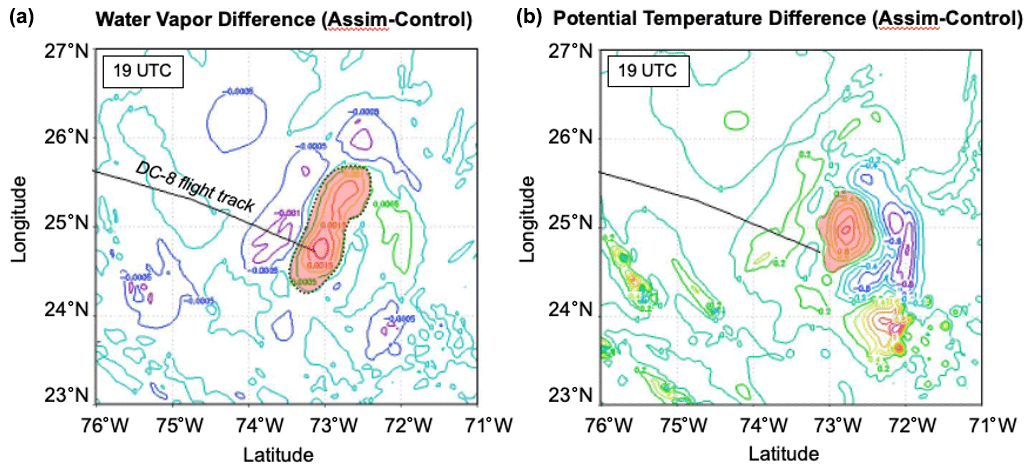
Figure 15Thermodynamic increments (assimilation minus control) that resulted after the first DAWN assimilation period centered at 19:00 UTC. (a) Water vapor mixing ratio difference (kg kg−1). (b) Potential temperature difference in Kelvin. The shaded red area denotes the area of the highest contour levels (strongest positive increments) in the vicinity of where the subsequent precipitation developed in the assimilation run. The DC-8 flight segment during this time is shown.
Further observational evidence of the enhanced moisture in the area of the observed convective development comes from combining a number of retrievals of total precipitable water (TPW) and a passive MW rain index (RI) provided by a variety of NASA, NOAA, and EUMETSAT satellite systems (Fig. 16). The RI is a multi-channel index combining brightness temperatures (TB) in the 10–90 GHz range (Hristova-Veleva et al., 2020). The RI from the same GMI overpass (18:52 UTC) shown in Fig. 5 and the 6 h composite (14:00–20:00 UTC) of the total precipitable water vapor (TPW) produced from the Microwave Integrated Retrieval System (MiRS) (Liu et al., 2020) are shown in the left and right panels of Fig. 16, respectively. These quantities are illustrated in the JPL CPEX portal (https://cpexportal.jpl.nasa.gov, last access: 30 April 2021) that combines satellite and airborne observations with model forecasts, specifically tailored for CPEX. The portal options provide interactive visualization and online analysis tools to help users understand tropical convection processes (Hristova-Veleva et al., 2020).
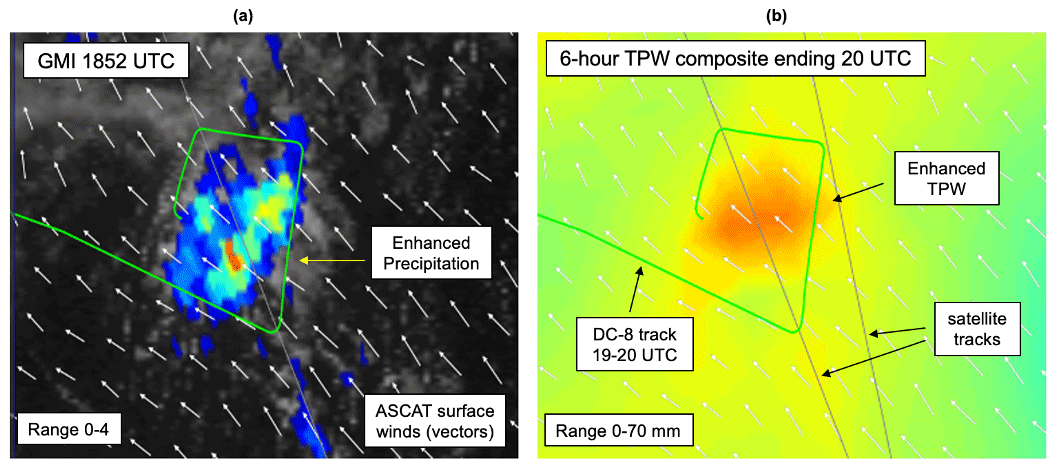
Figure 16Depiction of the observed rain index (a) derived from GMI at 18:52 UTC, shown in the JPL CPEX data portal overlaid on top of the ASCAT-derived ocean surface winds at 19:00 UTC. (b) The 6 h composite of the observed total precipitable water (TPW), also available from the CPEX data portal (b).
These overall conditions (enhanced near-surface wind convergence accompanied by enhanced low-level moisture and temperature) that resulted from the DAWN assimilation provided favorable conditions for eventual vertical development. After the assimilation, the subsequent forecast produced precipitation where there was none in the control run. Where the precipitation developed, it appeared more organized. Figure 17 provides a conceptual interpretation of the underlying drivers and consequences. This figure summarizes differences in precipitation in relation to the analysis increments introduced by the assimilation of DAWN data during the 19:00 UTC assimilation cycle. The features in Fig. 14 (zonal and meridional wind convergence) and in Fig. 15 (increased moisture, temperature) are co-registered in Fig. 17a. The analysis increment produced surface convergence co-located with increased moisture and temperature. Figure 17b overlays these features on top of the resultant precipitation in the model integration interval (19:00–20:00 UTC period) following this period of DAWN data assimilation, as shown earlier in Fig. 4b. These dynamic and thermodynamic components increased in a very coherent way, strongly suggesting that the resultant precipitation in the model integration interval was the consequence of the DAWN assimilation inducing an increase in the convective potential exactly where the precipitation was observed. This resulted in convective initiation and the subsequent development of precipitation where there was none in the control run. From this, can one identify the important self-aggregating processes that allowed this initial convection to grow upscale to produce the extensive area of precipitation within the box of the flight area (DC-8 flight line in Fig. 17b).

Figure 17Relating the analysis increments produced by the assimilation of the DAWN winds to their impact on the precipitation field. Panels are a zoom-in (75–71∘ W, 23–26.5∘ N) of the area shown in Figs. 3 and 4. (a) Analysis increments (assimilation–control) as a result of the 19:00 UTC assimilation cycle. Marked are the lines of enhanced convergence (zonal in blue; meridional in purple) shown in Fig. 14, and the zone of increased moisture (green) and the zone of increased temperature (red) shown in Fig. 15. (b) Superposition of these same lines and contours onto the precipitation analysis at 20:00 UTC (representing a 1 h model integration from 19:00–20:00 UTC), which was shown in Fig. 4b. The DC-8 flight segment during this time is shown.
As precipitation develops it produces precipitation-loading-driven downdrafts that also lead to the entrainment of drier mid-level air – ready to evaporate the precipitation when the two come in contact. When precipitation evaporates, it further enhances the downdrafts, making them more negatively buoyant because of the loss the latent heat needed for the evaporation. When these downdrafts reach the surface, they spread out, being colder and denser than the surrounding air. This leads to the creation of so-called cold pools – areas that are colder than the surrounding air, causing them to spread radially outward (Schlemmer and Hohenegger, 2014) as density currents. The cold pools created by the individual downdrafts interact with each other, and the mesoscale flow organizes them into bigger entities. In turn, these precipitation-induced cold pools lead to the initiation of new convection along their leading edged by creating favorable conditions for forced lifting of the environmental air, affecting the location, strengths, and organization of the convection that develops later on. As this environmental air is warmer and has more moisture, the induced lifting comes as an additional benefitting component, further improving the chances for the development of new convection and precipitation.
These mechanisms behind the formation and dissipation of the cold pool process (Zuidema et al., 2017; Grant and van den Heever, 2016) and its identification in cloud-resolving model simulations (Drager and van den Heever, 2017) are beyond the scope of this investigation. Here, the role of the cold pools in terms of their structure and relationship to precipitation development is addressed. The control run and the assimilation run are compared and contrasted in terms of the near-surface temperature anomalies that develop. The two model forecasts are compared using the 2 m air temperature anomaly (difference from the initial state) as a footprint of the cold pool structure. Figure 18 shows the 20:00 UTC analysis 2 m temperature anomaly (shaded), precipitation (contoured in thin red lines), and wind at the 500 m level (vectors). The thick solid red line denotes the approximate boundary of the cold pool that was detected in dropsonde observations taken during the June 10 flight (Zipser and Rajagopal, 2018).
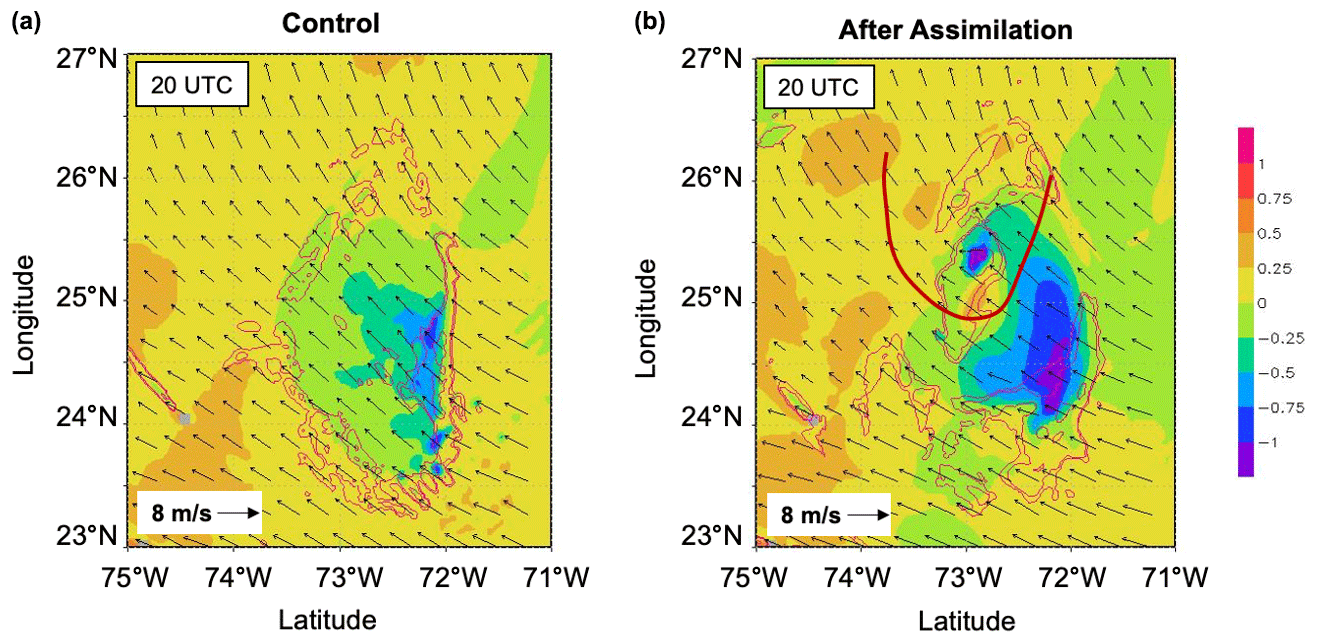
Figure 18Cold pool structure and development, showing the impact of assimilating DAWN winds at 19:00 UTC. The cold pools are depicted by the 2 m temperature anomaly (from the initial state) at 20:00 UTC, after 1 h of model integration following the 19:00 UTC assimilation. Overlaid are the cold pools (in Kelvin, shaded), precipitation during the 19:00–20:00 UTC model integration (contoured in thin red lines), and wind at the 500 m level (vectors). (a) Control run. (b) After assimilation of the DAWN wind profile data. The thick red line indicates the approximate boundary of the observed cold pool created by downdrafts, as analyzed from dropsonde data by Zipser and Rajagopal (2018).
Both the control and assimilation run show cold anomalies (cold pools) that are closely related to the precipitating areas, as should be expected. However, the assimilation run shows much more intense and bigger cold pools. Two maxima are of interest. The first is the smaller one to the north that is closely related to the precipitating area in the assimilation run (Fig. 18b) that was not present in the control (Fig. 18a). This cold pool, while not very big in areal extent, is closely related to the one observed in the dropsonde data as marked by the thick red line. The second is the much bigger, better organized, and stronger cold pool found to the southeast. This extensive area of cold anomalies is related to the much bigger and organized precipitating system there. Interestingly, this area of organized precipitation shows further signs of upscale growth as revealed by the precipitation structure at the later 20:00–21:00 UTC and 21:00–22:00 UTC periods revealed in Fig. 4.
This paper presented the results of the impact on the forecasted precipitation structure that resulted when DAWN wind vector profiles were assimilated by the NASA NU-WRF EDAS. This study is a direct follow-on to the recently published paper by the authors (Turk et al., 2020), which describes in detail the DAWN observations during each of the 1 h periods used in the assimilation and the APR-2 data for the 10 June 2017 flight used for this impact study. The study focused on (a) understanding whether (and if so, how) the assimilation of the DAWN winds impacted the subsequent development of convection and precipitation and (b) determining what environmental factors were modified by the assimilation as well as understanding how would they have possibly impacted the development of precipitation.
The impact was examined from two directions. First, the structure and timing of the model precipitation field were examined relative to those observed by the APR-2 radar data collected coincidently with the DAWN data. The Goddard SDSU instrument simulator was used to simulate DPR (Ku- and Ka-band) radar profiles for direct comparison to APR-2 and a GPM overpass that occurred during the first data assimilation cycle. Second, the structure of the NU-WRF model winds, temperature, and moisture was contrasted between the model control run and the model data assimilation run. With these prognostic variables, the pattern of convergence of moister air was examined to explain the role of thermodynamics in the evolution of the resultant model precipitation horizontal and vertical structure, as well as how the vertical structure evolved in time relative to the APR-2 observations.
During the 18:30–19:30 UTC time interval, dense DAWN observations were sampled in the surrounding environment, notably in the cloud-free region just W–SW of the area of interest (Fig. 4 in T2020), showing fairly strong wind shear between the upper and lower levels. This is the time interval just preceding the onset of precipitation within the DC-8 coverage area noted in the model data assimilation run. While the NU-WRF simulations represented the location of the developing precipitation well in the subsequent 19:00–20:00 UTC period, the associated growth in the heights of vertical precipitation structure evolved more slowly, with better agreement with APR-2 cloud structure in the 20:30–21:30 period. In accord with actual DPR data collected earlier (18:52 UTC), NU-WRF produced shallow, non-glaciated clouds with high liquid water content, noticed in the strongly attenuated Ka-band radar profile.
Assimilation of the DAWN winds in NU-WRF EDAS, even at a single time step, produced a very significant impact. Analysis of individual variables revealed that the assimilation of the DAWN winds resulted in important and coherent modifications of the environment. It led to an increase in the near-surface convergence, 2 m air temperature, and water vapor, creating more favorable conditions for the development of convection exactly where it was observed. The realism of the forecasted precipitation structure was shown by comparisons with nearby satellite and aircraft observations. Comparison to observations from APR-2 (and a fortuitous GPM satellite overpass) shows a much-improved precipitation forecast after the assimilation of the DAWN winds – development of precipitation where it was observed but not present in the control and more organized structure where the precipitation eventually developed. Most importantly, the assimilation produced a much more intense and organized cold pool, similar to the one detected in a separate analysis of the dropsonde data collected during the DC-8 mission flight on that day. It should be pointed out that a similar result was noted by Cui et al. (2020) in their DAWN assimilation study (modification of the near-surface wind convergence field) from a different modeling system and two CPEX flight dates different than the date studied here.
These findings add to the growing body of evidence suggesting that assimilation of high-resolution, high-precision Doppler wind lidar profiles into convection-allowing models improves the analysis of the environment, creating conditions that favor convective storm development and upscale growth. While encouraging, these findings represent a limited number of cases. A longer assimilation period and more flight dates are needed to establish any repeatable impact from which to draw conclusions. This is challenging, given limited-duration flight dates and fairly short (typically 3–4 h) aircraft on-station times that encounter convection in its early formation stages. Future research can also address many other important questions. Are cold pools more effective at initiating new convection in some environmental conditions versus others, including variable aerosol loading (aerosol effects were not addressed here)?. In each case, one can relate the environmental parameters to the strength and the structure of the cold pools and then their ability to generate and continuously support new convection at their leading lines, eventually resulting in an upscale growth of the system. The proposed NASA–ESA CPEX-AW field campaign will provide the opportunity to fly the APR-3, DAWN, and the High Altitude Lidar Observatory (HALO) (Bedka et al., 2021) alongside available ADM-Aeolus observations in the eastern Atlantic where African easterly waves interact with the Saharan air layer (Zipser et al., 2009). The HALO instrument provides aerosol and water vapor profiles (a missing component of these airborne data) to complement the DAWN wind-sensing capability. The investigation design presented here, based on the availability of concurrent precipitation radar observations, is appropriate for further investigation of the impact of airborne Doppler wind lidar observations upon short-term convective precipitation forecasts.
The APR-2 data (HDF5 format) are archived at https://tcis.jpl.nasa.gov/data/cpex/apr3/data (Jet Propulsion Laboratory, 2021). DAWN data (LOS and profile, ASCII format) are archived at the NASA Langley ASDC: https://asdc.larc.nasa.gov/project/CPEX (NASA Langley Research Center, 2021). NU-WRF model output fields (binary format) are available from the authors upon request.
FJT carried out the data processing of DAWN, GPM, and APR-2 data. SQZ performed the NU-WRF data assimilation and modeling simulations. SHV, ZSH, and RS performed model post-processing and model diagnosis.
The authors declare that they have no conflict of interest.
The work contained in this presentation was carried out at the Jet Propulsion Laboratory, California Institute of Technology, under a contract with NASA. Support from NASA under the Weather and Atmospheric Dynamics program is recognized. The authors gratefully acknowledge the efforts by the APR-2 co-principal investigators Stephen Durden and Simone Tanelli, the DAWN principal investigator Dr. Michael Kavaya, the DC-8 flight operations team, the DAWN data processing efforts by Steve Greco at Simpson Weather Associates, and the CPEX co-principal investigators Ed Zipser and Shuyi Chen.
This research has been supported by the National Aeronautics and Space Administration (grant no. 80NM0018F0617).
This paper was edited by Ad Stoffelen and reviewed by Ad Stoffelen and two anonymous referees.
Baker, W. E., Atlas, R., Cardinali, C., Clement, A., Emmitt, G. D., Gentry, B. M., Hardesty, R. M., Källén, E., Kavaya, M. J., Langland, R., Ma, Z., Masutani, M., McCarty, W., Pierce, R. B., Pu, Z., Riishojgaard, L. P., Ryan, J., Tucker, S., Weissmann, M., and Yoe, J. G.: Lidar-Measured Wind Profiles: The Missing Link in the Global Observing System, B. Am. Meteorol. Soc., 95, 543–564, https://doi.org/10.1175/BAMS-D-12-00164.1, 2014.
Bedka, K. M., Nehrir, A. R., Kavaya, M., Barton-Grimley, R., Beaubien, M., Carroll, B., Collins, J., Cooney, J., Emmitt, G. D., Greco, S., Kooi, S., Lee, T., Liu, Z., Rodier, S., and Skofronick-Jackson, G.: Airborne Lidar Observations of Wind, Water Vapor, and Aerosol Profiles During The NASA Aeolus Cal/Val Test Flight Campaign, Atmos. Meas. Tech. Discuss. [preprint], https://doi.org/10.5194/amt-2020-475, in press, 2021.
Chen, S. S., Kerns, B. W., Guy, N., Jorgensen, D. P., Delanoë, J., Viltard, N., Zappa, C. J., Judt, F., Lee, C.-Y., and Savarin, A.: Aircraft Observations of Dry Air, the ITCZ, Convective Cloud Systems, and Cold Pools in MJO during DYNAMO, B. Am. Meteorol. Soc., 97, 405–423, https://doi.org/10.1175/BAMS-D-13-00196.1, 2015.
Cui, Z., Pu, Z., Emmitt, G. D., and Greco, S.: The Impact of Airborne Doppler Aerosol Wind (DAWN) Lidar Wind Profiles on Numerical Simulations of Tropical Convective Systems during the NASA Convective Processes Experiment (CPEX), J. Atmos. Ocean. Tech., 37, 705–722, https://doi.org/10.1175/JTECH-D-19-0123.1, 2020.
Drager, A. J. and van den Heever, S. C.: Characterizing convective cold pools, J. Adv. Model. Earth Sy., 9, 1091–1115, https://doi.org/10.1002/2016MS000788, 2017.
Durden, S. L., Tanelli, S., and Im, E.: Recent observations of clouds and precipitation by the airborne precipitation radar 2nd generation in support of the GPM and ACE missions, in: Proc. SPIE Asia-Pacific Remote Sensing, Remote Sensing of the Atmosphere, Clouds, and Precipitation IV, Kyoto, Japan, 8 November 2012, 85230M, https://doi.org/10.1117/12.977574, 2012.
Grant, L. D. and van den Heever, S. C.: Cold pool dissipation, J. Geophys. Res.-Atmos., 121, 1138–1155, https://doi.org/10.1002/2015JD023813, 2016.
Greco, S., Emmitt, G. D., Garstang, M., and Kavaya, M.: Doppler Aerosol WiNd (DAWN) Lidar during CPEX 2017: Instrument Performance and Data Utility, Remote Sens.-Basel, 12, 2951, https://doi.org/10.3390/rs12182951, 2020.
Grecu, M., Olson, W. S., Munchak, S. J., Ringerud, S., Liao, L., Haddad, Z. S., Kelley, B. L., and McLaughlin, S. F.: The GPM combined algorithm, J. Atmos. Ocean. Tech., 33, 2225–2245, https://doi.org/10.1175/JTECH-D-16-0019.1, 2016.
Horányi, A., Cardinali, C., Rennie, M., and Isaksen, L.: The assimilation of horizontal line-of-sight wind information into the ECMWF data assimilation and forecasting system, Part I: The assessment of wind impact, Q. J. Roy. Meteor. Soc., 141, 1223–1232, https://doi.org/10.1002/qj.2430, 2015.
Houze, R. A.: 100 Years of Research on Mesoscale Convective Systems, Meteor. Mon., 59, 171–175, https://doi.org/10.1175/AMSMONOGRAPHS-D-18-0001.1, 2018.
Hristova-Veleva, S., Li, P. P., Knosp, B., Vu, Q., Turk, F. J., Poulsen, W. L., Haddad, Z., Lambrigtsen, B., Stiles, B. W., Shen, T.-P., Niamsuwan, N., Tanelli, S., Sy, O., Seo, E.-K., Su, H., Vane, D. G., Chao, Y., Callahan, P. S., Dunbar, R. S., Montgomery, M., Boothe, M., Tallapragada, V., Trahan, S., Wimmers, A. J., Holz, R., Reid, J. S., Marks, F., Vukicevic, T., Bhalachandran, S., Leighton, H., Gopalakrishnan, S., Navarro, A., and Tapiador, F. J.: An Eye on the Storm: Integrating a Wealth of Data for Quickly Advancing the Physical Understanding and Forecasting of Tropical Cyclones, B. Am. Meteorol. Soc., 101, 1718–1742, https://doi.org/10.1175/BAMS-D-19-0020.1, 2020.
Hristova-Veleva, S., Haddad, Z., Chau, A., Stiles, B. W., Turk, F. J., Li , P. P., Knosp, B., Vu, Q., Shen, T. P., Lambrigtsen, B., Seo, E.-K., and Su, H.: Impact of microphysical parameterizations on simulated hurricanes: Using multiparameter satellite data to determine the Particle Size Distributions that produce most realistic storms, Atmosphere, 12, 154, https://doi.org/10.3390/atmos12020154, 2021.
Jet Propulsion Laboratory: CPEX data, APR-2 Data Archive for CPEX, available at: https://tcis.jpl.nasa.gov/data/cpex/apr3/data/, last access: 30 April 2021.
Kavaya, M. J., Beyon, J. Y., Koch, G. J., Petros, M., Petzar, P. J., Singh, U. N., Trieu, B. C., and Yu, J.: The Doppler aerosol wind (DAWN) airborne, wind-profiling coherent-detection Lidar system: overview and preliminary flight results, J. Atmos. Ocean. Tech., 31, 826–842, https://doi.org/10.1175/JTECH-D-12-00274.1, 2014.
Liu, S., Grassotti, C., Liu, Q., Lee, Y.-K., Honeyager, R., Zhou, Y., and Fang, M.: The NOAA Microwave Integrated Retrieval System (MiRS): Validation of Precipitation From Multiple Polar-Orbiting Satellites, IEEE J. Sel. Top. Appl., 13, 3019–3031, https://doi.org/10.1109/JSTARS.2020.3000348, 2020.
Lux, O., Lemmerz, C., Weiler, F., Marksteiner, U., Witschas, B., Rahm, S., Geiß, A., and Reitebuch, O.: Intercomparison of wind observations from the European Space Agency's Aeolus satellite mission and the ALADIN Airborne Demonstrator, Atmos. Meas. Tech., 13, 2075–2097, https://doi.org/10.5194/amt-13-2075-2020, 2020.
Matsui, T., Santanello, J., Shi, J. J., Tao, W.-K., Wu, D., Peters-Lidard, C., Kemp, E., Chin, M., Starr, D., Sekiguchi, M., and Aires, F.: Introducing multisensor satellite radiance-based evaluation for regional Earth System modeling, J. Geophys. Res.-Atmos., 119, 8450–8475, https://doi.org/10.1002/2013JD021424, 2014.
Morrison, H.: On the robustness of aerosol effects on an idealized supercell storm simulated with a cloud system-resolving model, Atmos. Chem. Phys., 12, 7689–7705, https://doi.org/10.5194/acp-12-7689-2012, 2012.
NASA Langley Research Center: CPEX data, Atmospheric Science Data Center (ASDC) for CPEX, available at: https://asdc.larc.nasa.gov/project/CPEX, last access: 30 April 2021.
Okamoto, K., Ishibashi, T., Ishii, S., Baron, P., Gamo, K., Tanaka, T. Y., Yamashita, K., and Kubota, T.: Feasibility Study for Future Space-Borne Coherent Doppler Wind Lidar, Part 3: Impact Assessment Using Sensitivity Observing System Simulation Experiments, J. Meteorol. Soc. Jpn., 96, 179–199, https://doi.org/10.2151/jmsj.2018-024, 2018.
Peters, K., Hohenegger, C., and Klocke, D.: Different Representation of Mesoscale Convective Systems in Convection-Permitting and Convection-Parameterizing NWP Models and Its Implications for Large-Scale Forecast Evolution, Atmosphere, 10, 503, https://doi.org/10.3390/atmos10090503, 2019.
Prein, A. F., Langhans, W., Fosser, G., Ferrone, A., Ban, N., Goergen, K., Keller, M., Tölle, M., Gutjahr, O., Feser, F., Brisson, E., Kollet, S., Schmidli, J., Van Lipzig, N. P., and Leung, R.: A review on regional convection-permitting climate modeling: Demonstrations, prospects, and challenges, Rev. Geophys., 53, 323–361, https://doi.org/10.1002/2014RG000475, 2015.
Raymond, D., Fuchs, Ž., Gjorgjievska, S., and Sessions, S.: Balanced dynamics and convection in the tropical troposphere, J. Adv. Model. Earth Sy., 7, 1093–1116, https://doi.org/10.1002/2015MS000467, 2015.
Rowe, A. K., Rutledge, S. A., and Lang, T. J.: Investigation of Microphysical Processes Occurring in Organized Convection during NAME, Mon. Weather Rev., 140, 2168–2187, https://doi.org/10.1175/MWR-D-11-00124.1, 2012.
Šavli, M., Žagar, N., and Anderson, J. L.: Assimilation of horizontal line-of-sight winds with a mesoscale EnKF data assimilation system, Q. J. Roy. Meteor. Soc., 144, 2133–2155, https://doi.org/10.1002/qj.3323, 2018.
Schiro, K. A. and Neelin, J. D.: Deep Convective Organization, Moisture Vertical Structure, and Convective Transition Using Deep-Inflow Mixing, J. Atmos. Sci., 76, 965–987, https://doi.org/10.1175/JAS-D-18-0122.1, 2019.
Schiro, K. A., Sullivan, S. C., Kuo, Y.-H., Su, H., Gentine, P., Elsaesser, G. S., Jiang, J. H., and Neelin, J. D.: Environmental controls on tropical mesoscale convective system precipitation intensity, J. Atmos. Sci., 77, 4233–4249, https://doi.org/10.1175/JAS-D-20-0111.1, 2020.
Schlemmer, L. and Hohenegger, C.: The Formation of Wider and Deeper Clouds as a Result of Cold-Pool Dynamics, J. Atmos. Sci., 71, 2842–2858, https://doi.org/10.1175/JAS-D-13-0170.1, 2014.
Schumacher, R. S. and Rasmussen, K. L.: The formation, character and changing nature of mesoscale convective systems, Nature Reviews Earth & Environment, 1, 300–314, https://doi.org/10.1038/s43017-020-0057-7, 2020.
Stoffelen, A., Pailleux, J., Källén, E., Vaughan, J. M., Isaksen, L., Flamant, P., Wergen, W., Andersson, E., Schyberg, H., Culoma, A., Meynart, R., Endemann, M., and Ingmann, P.: The atmospheric dynamics mission for global wind field measurement, B. Am. Meteorol. Soc., 86, 73–88, https://doi.org/10.1175/BAMS-86-1-73, 2005.
Tan, J., Huffman, G. J., Bolvin, D. T., and Nelkin, E. J.: IMERG V06: Changes to the Morphing Algorithm, J. Atmos. Ocean. Tech., 36, 2471–2482, https://doi.org/10.1175/JTECH-D-19-0114.1, 2019.
Turk, F. J., Hristova-Veleva, S., Durden, S. L., Tanelli, S., Sy, O., Emmitt, G. D., Greco, S., and Zhang, S. Q.: Joint analysis of convective structure from the APR-2 precipitation radar and the DAWN Doppler wind lidar during the 2017 Convective Processes Experiment (CPEX), Atmos. Meas. Tech., 13, 4521–4537, https://doi.org/10.5194/amt-13-4521-2020, 2020.
Zhang, S. Q., Zupanski, M., Hou, A. Y., Lin, X., and Cheung, S. H.: Assimilation of precipitation-affected radiances in a cloud-resolving WRF ensemble data assimilation system, Mon. Weather Rev., 141, 754–772, https://doi.org/10.1175/MWR-D-12-00055.1, 2013.
Zhang, S. Q., Matsui, T., Cheung, S., Zupanski, M., and Peters-Lidard, C.: Impact of Assimilated Precipitation-Sensitive Radiances on the NU-WRF Simulation of the West African Monsoon, Mon. Weather Rev., 145, 3881–3900, https://doi.org/10.1175/MWR-D-16-0389.1, 2017.
Zipser, E. J. and Rajagopal, M.: June 10 case: Observations, satellite, DAWN, dropsondes, in: 1st CPEX Science Team Meeting, University of Utah, Salt Lake City, Utah, USA, 7–8 June 2018, available at: https://cpex.jpl.nasa.gov/cpex2017/scienceteammeeting/2018/index.php (last access: 11 December 2020), 2018.
Zipser, E. J., Twohy, C. H., Tsay, S.-C., Thornhill, K. L., Tanelli, S., Ross, R., Krishnamurti, T. N., Ji, Q., Jenkins, G., Ismail, S., Hsu, N. C., Hood, R., Heymsfield, G. M., Heymsfield, A., Halverson, J., Goodman, H. M., Ferrare, R., Dunion, J. P., Douglas, M., Cifelli, R., Chen, G., Browell, E. V., and Anderson, B.: The Saharan Air Layer and the Fate of African Easterly Waves – NASA's AMMA Field Study of Tropical Cyclogenesis, B. Am. Meteorol. Soc., 90, 1137–1156, https://doi.org/10.1175/2009BAMS2728.1, 2009.
Zuidema, P., Torri, G., Muller, C., and Chandra, A.: A Survey of Precipitation-Induced Atmospheric Cold Pools over Oceans and Their Interactions with the Larger-Scale Environment, Surv. Geophys., 38, 1283–1305, https://doi.org/10.1007/s10712-017-9447-x, 2017.
- Abstract
- Introduction
- DAWN and APR-2 data during CPEX
- NU-WRF configuration and simulations for the 10 June case
- Comparison of simulated radar profiles and model 2-D and 3-D fields
- Conclusions
- Data availability
- Author contributions
- Competing interests
- Acknowledgements
- Financial support
- Review statement
- References