the Creative Commons Attribution 4.0 License.
the Creative Commons Attribution 4.0 License.
 | 17 May 2021
Application of the ECT9 protocol for radiocarbon-based source apportionment of carbonaceous aerosols
Wendy Zhang
Guaciara M. Santos
Blanca T. Rodríguez
Sandra R. Holden
Vincent Vetro
Claudia I. Czimczik
Carbonaceous aerosol is mainly composed of organic carbon (OC) and elemental carbon (EC). Both OC and EC originate from a variety of emission sources. Radiocarbon (14C) analysis can be used to apportion bulk aerosol, OC, and EC into their sources. However, such analyses require the physical separation of OC and EC.
Here, we apply of ECT9 protocol to physically isolate OC and EC for 14C analysis and evaluate its effectiveness. Several reference materials are selected, including two pure OC (fossil “adipic acid” and contemporary “sucrose”), two pure EC (fossil “regal black” and “C1150”), and three complex materials containing contemporary and/or fossil OC and EC (“rice char”, NIST urban dust standards “SRM1649a” and “SRM8785”, i.e., fine fraction of resuspended SRM1649a on filters). The pure materials were measured for their OC, EC, and total carbon (TC) mass fractions and corresponding carbon isotopes to evaluate the uncertainty of the procedure. The average accuracy of TC mass, determined via volumetric injection of a sucrose solution, was approximately 5 %. Ratios of and were highly reproducible, with analytical precisions better than 2 % for all reference materials, ranging in size from 20 to 100 µg C. Consensus values were reached for all pure reference materials for both δ13C and fraction modern (F14C), with an uncertainty of < 0.3 ‰ and approximately 5 %, respectively. The procedure introduced 1.3 ± 0.6 µg of extraneous carbon, an amount compatible to that of the Swiss_4S protocol.
In addition, OC and EC were isolated from mixtures of pure contemporary OC (sucrose) with pure fossil EC (regal black) and fossil OC (adipic acid) with contemporary EC (rice char EC) to evaluate the effectiveness of OC and EC separation. Consensus F14C values were reached for all OC (∼ 5–30 µg) and EC (∼ 10–60 µg) fractions with an uncertainty of ∼ 5 % on average. We found that the ECT9 protocol efficiently isolates OC or EC from complex mixtures. Based on δ13C measurements, the average contribution of charred OC to EC is likely less than 3 % when the OC loading amount is less than 30 µg C.
Charring was further assessed by evaluating thermograms of various materials, including aerosol samples collected in the Arctic and from tailpipes of gasoline or diesel engines. These data demonstrate that the ECT9 method effectively removes pyrolyzed OC. Thus, the ECT9 protocol, initially developed for concentration and stable isotope measurements of OC and EC, is suitable for 14C-based apportionment studies, including µg C-sized samples from arctic environments.
- Article
(2159 KB) - Full-text XML
-
Supplement
(943 KB) - BibTeX
- EndNote


The works published in this journal are distributed under the Creative Commons Attribution 4.0 License. This licence does not affect the Crown copyright work, which is re-usable under the Open Government Licence (OGL). The Creative Commons Attribution 4.0 License and the OGL are interoperable and do not conflict with, reduce, or limit each other. © Crown copyright 2021
Carbonaceous aerosol is a major component (15 %–90 %) of airborne particulate matter (PM) (Jimenez et al., 2009; Putaud et al., 2010; Yang et al., 2011a, b; Hand et al., 2013; Ridley et al., 2018) and is a complex mixture composed of mainly light-scattering organic carbon (OC) and highly-refractory, light-absorbing elemental carbon (EC, also referred to as black carbon) (Pöschl, 2005). The OC and EC fractions play important and often distinct roles in climate (Bond et al., 2013; Hallquist et al., 2009; Kanakidou et al., 2005; Laskin et al., 2015), air pollution, and human health (Cohen et al., 2017; Grahame et al., 2014; Janssen et al., 2012). Moreover, both OC and EC were identified as short-lived climate forcers (SLCFs) by the IPCC expert meeting (https://www.ipcc-nggip.iges.or.jp/public/mtdocs/1805_Geneva.html, 15 April 2021) in 2018. To develop and monitor the efficiency of mitigation strategies for both climate change and air pollution, it is required to have a better understanding of the temporal and spatial dynamics of OC and EC emission sources.
The majority (> 50 %) of carbonaceous aerosol is OC, which has a wide size range. Coarse OC (in PM10) consists of plant debris, microorganisms, fungal spores, and pollen. Fine OC (in PM2.5) is formed predominantly via the oxidation or nucleation and coagulation of volatile organic compounds, such as mono- and sesquiterpenes, from both biogenic and anthropogenic sources (Shrivastava et al., 2017) but can also be directly emitted from combustion sources (Hallquist et al., 2009; Fuzzi et al., 2015; Liggio et al., 2016). In contrast, EC is found primarily in fine particles, e.g., PM1.0 or smaller (Chan et al., 2013; Bond et al., 2013). It is emitted through incomplete combustion of fossil fuels and biomass and biofuels (Bond et al., 2013; Huang et al., 2010; Evangeliou et al., 2016; Winiger et al., 2016, 2017, 2019).
Measuring the isotopic signature and composition, i.e., radiocarbon (14C) content and stable isotope ratio () of aerosol, offers a powerful tool for quantifying the sources of bulk aerosol and its OC and EC fractions. Aerosol 14C content can be used to quantify the relative contributions from contemporary biomass and fossil sources (Heal, 2014). 14C is a naturally occurring radioisotope (5730 year half-life) produced in the atmosphere. After its oxidation to carbon dioxide (14CO2), 14C enters the food chain through photosynthesis so that all living organisms are labeled with a characteristic ratio and described as “modern” carbon. Materials containing carbon older than about 50 000 years (14C ≪ 12C) are described as “fossil” carbon. Over the past centuries, the 14C content of the atmosphere has undergone distinct changes (Graven, 2015; Graven et al., 2020; Levin et al., 2010): anthropogenic combustion of fossil fuels emits 14C-depleted carbon into the atmosphere (i.e., dilutes the proportion of 14C relative to 12C). In contrast, nuclear weapons testing doubled the 14C content of CO2 in the Northern Hemisphere in the mid-20th century, followed by mixing of this bomb-derived 14C-enriched carbon into the ocean and biosphere. Similarly, aerosol stable isotope ratios provide insight to different types of anthropogenic sources (e.g., combustion of solid and liquid vs. gaseous fossil fuels). However, 13C data cannot distinguish emissions from mixed fossil fuel combustion and live C3 plant biomass (Huang et al., 2006; Winiger et al., 2016). Thus, isotope-based source apportionment studies become particularly insightful when both 14C and stable carbon isotopes are considered (Andersson et al., 2015; Winiger et al., 2016, 2017) or when combined with analyses of specific source tracers, such as levoglucosan or potassium for wood burning emissions (Szidat et al., 2006; Zhang et al., 2008) and/or remote sensing data and modeling analysis (Barrett et al., 2015; Mouteva et al., 2015b; Wiggins et al., 2018).
The objective of this study is to evaluate the effectiveness of separating OC and EC via the ECT9 (EnCan-Total-900) protocol (Huang et al., 2006; Chan et al. 2010, 2019) for 14C-based source apportionment studies of carbonaceous aerosols. The ECT9 technique was originally developed to physically separate OC and EC mass fractions for concentration quantification and stable carbon isotope analysis. This protocol has been used since 2006 to monitor carbonaceous aerosol mass concentrations and stable isotope composition over Canada, including in the Arctic at Alert, as part of the Canadian Aerosol Baseline Measurements (CABM) Network by Environment and Climate Change Canada (Chan et al., 2010, 2019; Eckhardt et al., 2015; Sharma et al., 2017; Xu et al., 2017; Leaitch et al., 2013, 2018; Huang, 2018). It has also been used to monitor carbonaceous aerosol over China (Yang et al., 2011a, b). Furthermore, EC concentration measurements made with the ECT9 protocol correlate well with those derived from light absorption by an aethalometer and refractory black carbon (rBC) using a Single Particle Soot Photometer (SP2) (Sharma et al., 2017; Chan et al., 2019). It was demonstrated that the ECT9 protocol can be used to quantify concentrations and provide source information at the same time.
The ECT9 protocol is a thermal evolution analysis (TEA) protocol that is different from commonly used thermal optical analysis (TOA) methods for monitoring air quality, such as the Interagency Monitoring of Protected Visual Environments (IMPROVE) protocol (Chow et al., 2001; Watson et al., 2007), the National Institute for Occupational Safety and Health protocol (NIOSH method 5040, Birch, 2002), and the European Supersites for Atmospheric Aerosol Research (EUSAAR) protocol (Cavalli et al., 2010). In those protocols, the OC fraction is thermally desorbed from filter samples in an inert helium (He) atmosphere at relatively low temperatures, and the EC fraction is combusted at higher temperatures by introducing oxygen (O2) into the He stream while the filter reflectance or transmittance for a laser signal is continuously monitored. During the analysis, a fraction of the OC may char (forming pyrolyzed OC or PyOC), causing the transmittance or reflectance to decrease. While TOA methods use the changes in laser signal to mathematically correct for PyOC within the measured EC fraction, the ECT9 protocol aims to minimize or remove PyOC, together with carbonate carbon (CC), during an intermediate temperature step of 870 ∘C in pure He via high-temperature evaporation (Chan et al., 2019). With much longer retention times at each temperature step (see Sect. 2) and without either reflectance or transmittance used, the ECT9 protocol effectively isolates OC, PyOC + CC, and EC.
It should be noted that other methods have been also developed mainly for 14C analysis of OC and EC, such as the CTO-375 (Zencak et al., 2007), the Swiss_4S protocol (Mouteva et al., 2015a; Zhang et al., 2012; Szidat et al., 2004), or hydropyrolysis (Meredith et al., 2012; Zhang et al., 2019), which use distinct temperature protocols and gas mixtures and/or remove water-soluble OC or inorganic carbon prior to EC analysis. In contrast to the ECT9 protocol, however, these approaches differ substantially from the protocols that are widely used for monitoring mass concentrations in the field, which limits the relevance of this data for improving the representation of carbonaceous aerosols in chemical transport models.
Here we analyzed the 14C content of OC and EC fractions (< 100 µg C) isolated with the ECT9 protocol from four pure fossil and contemporary reference materials. These materials were analyzed on their own to quantify the amount and source (modern or fossil) of extraneous carbon introduced by the procedure, as well as its reproducibility. Mixtures of two reference materials were measured to elucidate how efficiently the ECT9 protocol isolates OC from EC. In addition, we investigated the laser signals of three reference materials and three aerosol samples (tailpipe emissions, ambient aerosol from Alert, and SRM8785) to assess how efficiently the ECT9 protocol removes PyOC. Our evaluation of the ECT9 protocol on its ability to physically separate OC from EC for 14C-based source apportionment studies significantly expands the existing opportunities for characterizing and monitoring sources of carbonaceous aerosol at regional or global scales while at the same time providing a solid base for EC and OC concentration measurements.
2.1 The ECT9 protocol for the physical separation of OC and EC
The ECT9 protocol was developed at the carbonaceous aerosol and isotope research (CAIR) lab of Environment and Climate Change Canada (ECCC) to quantify the amount of OC and EC in carbonaceous aerosol and their δ13C values (Huang et al., 2006; Chan et al., 2010, 2019). Carbon fractions are isolated with an analyzer (Sunset Laboratory Inc.) coupled to a custom-made gas handling and cryogenic trapping system for CO2 collection from OC and EC fractions (Fig. 1a). The fractions are separated from each other, according to their degree of refractoriness. Specifically, carbon fractions are released by the ECT9 protocol in three steps (Fig. 1b): (1) OC at 550 ∘C for 600 s in pure He (99.9999 % purity), (2) PyOC and CC at 870 ∘C for 600 s in pure He, and (3) EC at 900 ∘C for 420 s in a mixture of 2 % O2 with 98 % He. All fractions are fully oxidized to CO2 by passing through a furnace containing MnO2 maintained at 870 ∘C. For concentration determination, the CO2 passes through a methanator at 500 ∘C, is converted to CH4, and is quantified with a flame ionization detector. For isotope analysis, the CO2 is cryo-trapped with liquid N2 (−196 ∘C) in a U-shaped glass trap, purified on a vacuum system (to remove He), sealed into a Pyrex ampoule, and analyzed for its δ13C ratio with an Isotopic Ratio Mass Spectrometer (IRMS), i.e., MAT253 or F14C with an Accelerated Mass Spectrometer (AMS).
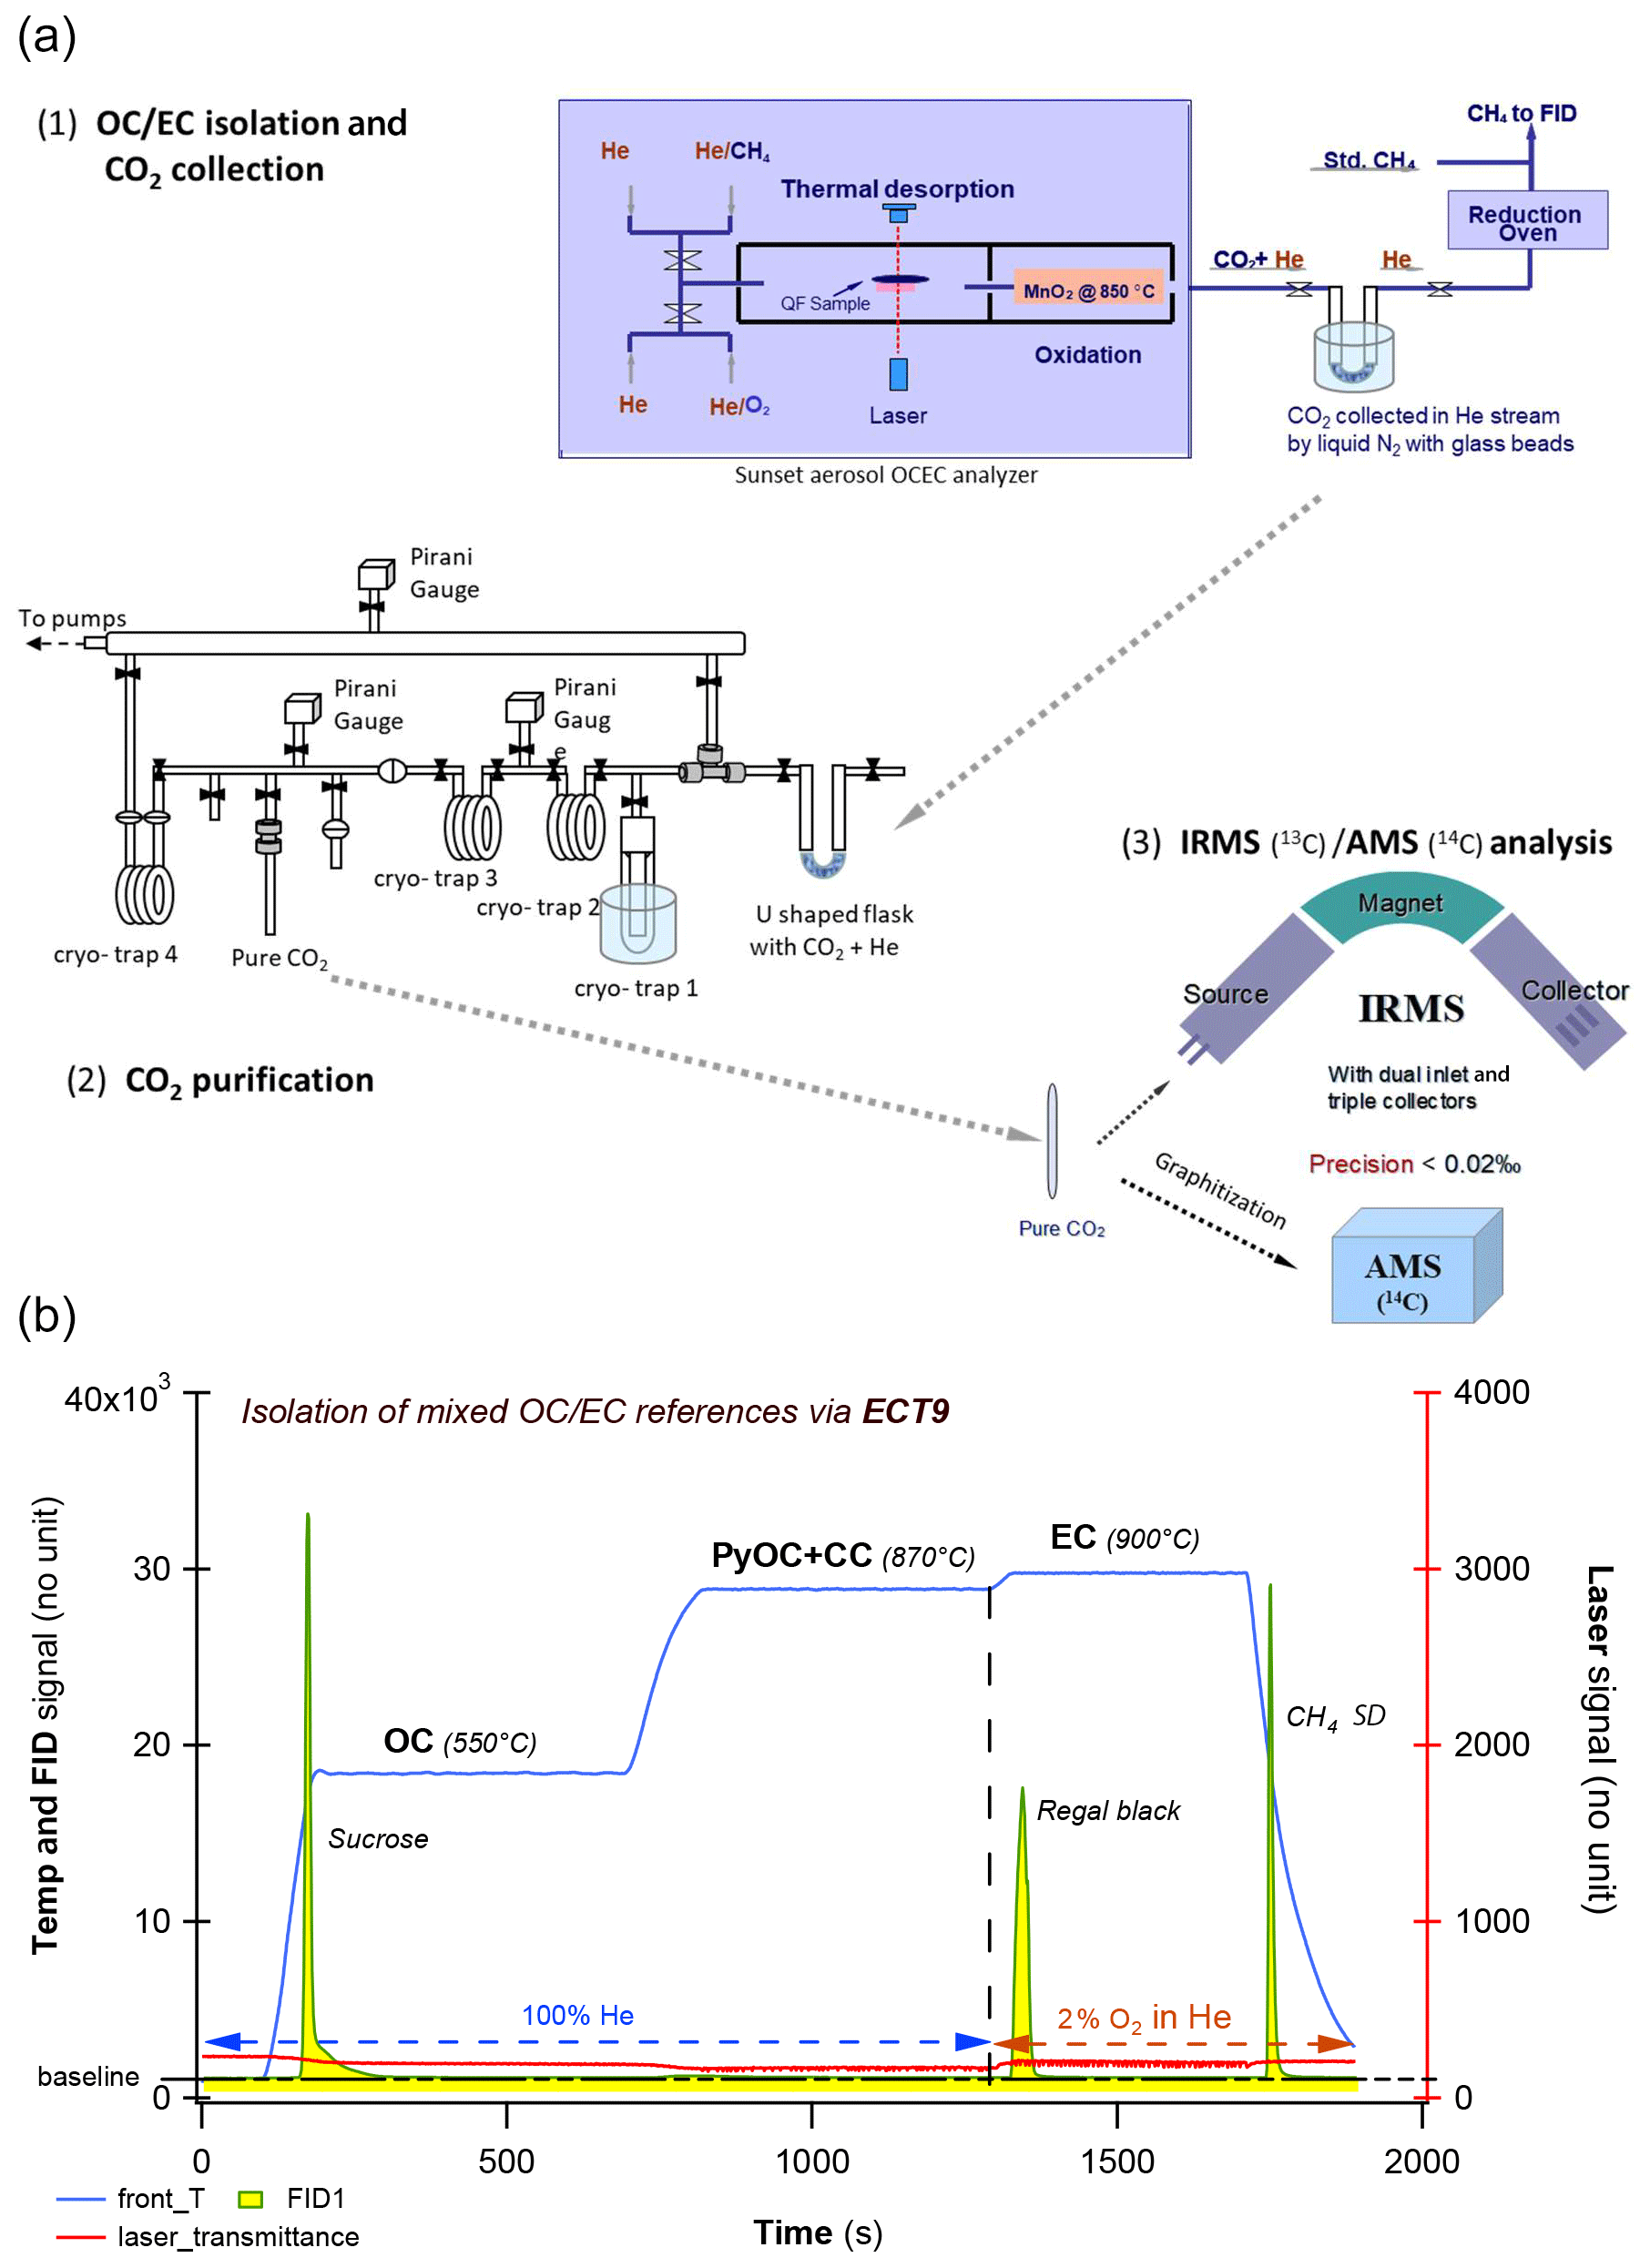
Figure 1Overview of the carbonaceous aerosol measurements (concentration and isotopes) via EnCan-Totol-900 (ECT9). (a) Schematic procedures for 13C and 14C measurements of via ECT9, including (1) isolation and CO2 collection via cryo-trapping, (2) CO2 purification, and (3) isotope analysis with IRMS ( of CO2) or AMS ( and of graphite targets). (b) Thermogram of the ECT9 protocol on a Sunset analyzer. First, organic carbon (OC) is thermally desorbed at 550 ∘C for 600 s in 100 % He, and then any pyrolyzed OC (PyOC), refractory OC, and carbonate carbon (CC) is released at 870 ∘C in 100 % He for 600 s. Finally, elemental carbon (EC) is combusted at 900 ∘C for 420 s by introducing 2 % O2 in He. All carbon fractions are oxidized to CO2 followed by reduction to CH4 and quantification via flame ionization detection (FID) for carbon content or purified and cryo-trapped in Pyrex ampoules for isotope analysis. Example FID signals are shown for a pure OC reference material (sucrose) mixed with a pure EC material (regal black) and the internal standard (CH4).
2.2 Reference materials and their composition
To evaluate the ECT9 method for separating OC and EC for 14C analysis, we isolated and measured the 13C and 14C content of the OC or EC fraction or total carbon (TC) from five to six modern or fossil reference materials (Table 1), including two pure OC (adipic acid, sucrose), two EC (C1150, regal black), and two natural mixtures (rice char and urban dust SRM1649a).
Table 1Overview of the bulk reference materials analyzed with the ETC9 method for their total carbon (TC), organic carbon (OC), and elemental carbon (EC) contents.
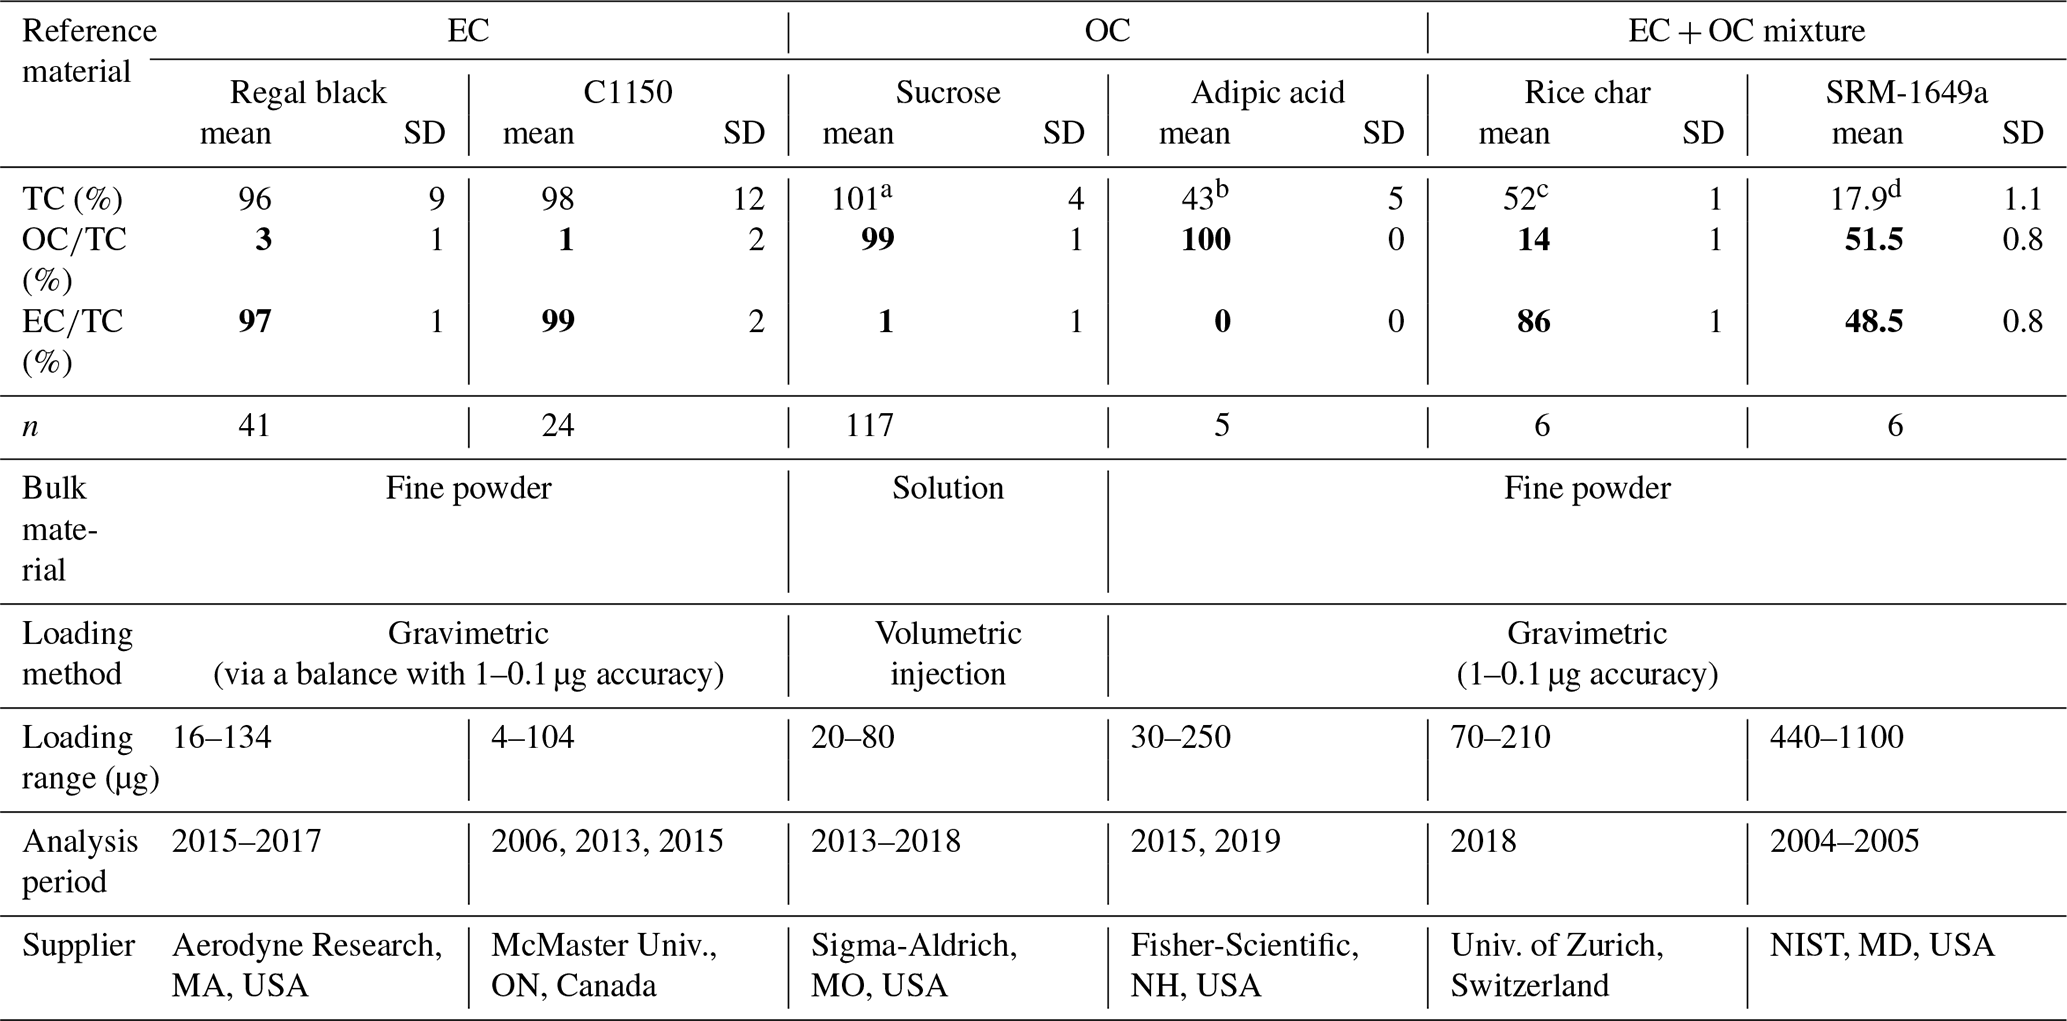
a The total of 101 % is obtained from the ratio of TC measured to TC calculated from the injected solution of sucrose; b A total of 49 % of TC to bulk material in adipic acid based on its molecular mass. c A total of 58.6 % of TC to bulk material in rice char obtained from Hammes et al. (2006). d A total of 17 % of TC to bulk material in SRM 1649a obtained from a critical evaluation of inter-laboratory data by Currie et al. (2002).
Some of the reference materials have previously been utilized to compare different protocols that quantify fractions (Hammes et al., 2007; Willis et al., 2016) and to determine the mass of extraneous carbon introduced during isolation from carbonaceous aerosol (Mouteva et al., 2015a). Table 1 provides an overview of their chemical compositions, i.e., total carbon contents and relative fraction of OC and EC, respectively (for individual measurements, see Table S1 in the Supplement). Primary methods (i.e., gravimetric or volumetric) are used for mass loading of the materials, whereas the mass of TC, OC, and EC are quantified via the ECT9 thermal protocol. Based on repeat injections of sucrose results (20–80 µg sucrose, n=117), the accuracy of the TC mass is about 5 %. The reproducibilities of both and percentages are 2 % or better. Although uncertainties of weighing pure EC mass (i.e., regal black and C1150) via microbalances are relatively large (due to static electricity and variable relative humidity), the and ratios for all reference materials are highly reproducible (one SD < 2 %). The results show that the two EC materials (i.e., regal black and C1150) contain 97 % and 98 % EC, with only 3 % and 2 % OC, respectively. The two OC materials (i.e., sucrose and adipic acid) are 99 % and 100 % OC and less than 1 % EC (likely due to charred OC contribution), respectively. Thus, the materials are suitable for the purpose of this study.
We also analyzed the 13C and 14C isotopic composition of each reference material, using offline combustions and ECT9 coupled with cryo-purification to convert them into CO2. The results are summarized in Table 2 (for individual results see Tables S2 and S3 in the Supplement). The 14C analysis of µg C-sized carbonaceous aerosol samples requires the assessment of extraneous carbon (Santos et al., 2010). This is achieved by measuring multiple smaller-sized materials with known 14C content. Consequently, the results in Table 2 are critical, as those 14C values provide the reference for quantifying the extraneous carbon introduced during the isotope analysis procedures.
Table 2Overview of the isotopic composition of the reference materials used in this study. Radiocarbon (, reported as fraction modern, FM14C) was measured at the KCCAMS facility, and δ13C was measured at the CAIR lab.

* Sucrose was loaded as a solution (µg C), and regal black, C1150, adipic acid, rice char, and SRM-1649a were loaded as a fine powder (µg dry mass); n/a stands for not applicable
2.3 Isolation of OC, EC, or TC with the ECT9 protocol and purification of CO2
The isotopic analysis of carbonaceous aerosol via the ECT9 system involves three steps (Fig. 1a): (1) OC and EC isolation and CO2 collection, (2) CO2 purification, and (3) isotope analysis for either by IRMS or 14C by AMS (i.e., coupled measurements of and of µg C-sized graphite targets), as desired.
The initial masses of the pure reference materials ranged from 5 to 47 µg C (n = 3–13; Table S6 in the Supplement), whereas those for the mixed materials ranged from 5–30 µg C for OC and 5–60 µg C for EC (n = 5–6; Table S7 in the Supplement). The loaded mass of each material was determined via a microbalance (MX5, Mettler Toledo or CCE6, Sartorius) with the lowest reading being 1 or 0.1 µg C, respectively. Filters before mass loading were pre-combusted at 900 ∘C in a muffle furnace overnight and wrapped into pre-fired aluminum foil before cooling below 200 ∘C. Usually, OC materials were first dissolved in Milli-Q water with known volume to obtain its concentration, and then a known amount (5–10 µL) of OC solution was very carefully applied onto a pre-cleaned quartz filter surface (1.5 cm2, Pall Canada Limited) via a syringe injection. After the injection, the quartz boat holding the punch is pushed to the right position inside of the analyzer. The volume of OC solution used does not saturate the filter but merely moistens the surface. After purging the filter for about 20 min ensuring the water is gone, the filter is ready for analysis. EC (i.e., regal black and C1150) and mixed materials (rice char or SRM 1649a), which cannot be completely dissolved in water, were directly weighed onto pre-cleaned quartz filter punches in the form of solids (powders). Adipic acid was also loaded as powder. The final power mass was determined by the difference weighted before and after analysis. A filter punch with the loaded mass was carefully carried to the Sunset analyzer by a Pyrex glass Petri dish with a cover for analysis with the ECT9 protocol.
OC and EC were separated and the combusted OC or EC fractions (as CO2) were cryo-collected in a U-shaped flask submerged in liquid N2 (Fig. 1a, step 1). Following this, the flask containing CO2 and He was connected to a vacuum line with four cryo-traps and several open ports (Fig. 1a, step 2), where the CO2 is purified by sequential distillation when passing cryo-traps 1 through 3. Finally, the pure CO2 is transferred and sealed into a 6 mm glass ampoule for 13C or 14C analysis. Pressure is read by a Pirani gauge before sealing the ampoule for an estimation of the amount of gas, and consequently sample size could be determined as µg C.
2.4 14C measurements
At the KCCAMS facility, the OC and EC fractions or TC (in form of CO2) were reduced to graphite on iron powder via hydrogen (H2) reduction using equipment and protocols specifically developed for smaller-sized (≤15 µg C) samples (Santos et al., 2007a, b). Briefly, sample- CO2 was introduced into a vacuum line, cryogenically isolated from any water vapor, monometrically quantified, and then transferred to a heated reaction chamber, where it was mixed with H2 and reduced to filamentous graphite. To characterize the graphitization, handling, and AMS analysis, two relevant standards (oxalic acid II as modern carbon and adipic acid as fossil carbon), with similar size ranges to the samples prepared via ECT9, were also processed into graphite. The graphite was then pressed into aluminum holders and loaded into the AMS unit alongside measurement standards (Table S6) and blanks for 14C measurement (Beverly et al., 2010). The data are reported as a fraction of modern carbon (F14C), following the conventions established by Stuiver and Polach (1977) and also described elsewhere (Reimer et al., 2004; Trumbore et al., 2016).
To establish consensus values (Table 2), we also analyzed the 14C content of the bulk reference materials ranging in size from 0.06 to 1 mg C, using our standard combustion and graphitization methods. Larger aliquots of material were weighed into a pre-combusted quartz tube with 80 mg CuO, evacuated, and combusted at 900 ∘C for 3 h. The resulting CO2 was cryogenically purified on a vacuum line, reduced to graphite using a closed-tube zinc-reduction method (Xu et al., 2007), and analyzed as described above.
2.5 Quantification of extraneous carbon
Any type of sample processing and analysis introduces extraneous carbon (Cex). Therefore, the measured mass of any sample will include the mass of this sample and of any Cex incorporated throughout the analysis (Eq. 1):
where mspl_meas, mspl, and mex are the measured and theoretical mass of the sample and of Cex, respectively. For small samples (with a mass of a few µg C), the mass of Cex can compete with or overwhelm the sample mass and cause the measured F14C value of a sample to deviate from its consensus value.
Here, we estimated the mass of Cex introduced during the ECT9 protocol and the 14C analysis following Santos et al. (2010), where Cex is understood to consist of a modern and of fossil component (Eq. 2):
where mmex and mfex is the mass of the modern and fossil Cex, respectively.
Following an isotope mass balance approach, the measured isotopic ratio () of a sample (Rspl_meas) can be expressed as Eq. (3).
where Rspl is the theoretical isotopic ratio of the sample, and Rm and Rf are the consensus isotopic ratios of a modern and fossil standard, respectively. This equation can be further simplified because Rf is 0. Rm is determined by measuring regular-sized aliquots of this reference material. In addition, all ratios are corrected for isotope fractionation using their δ13C measured alongside 14C on the AMS (Beverly et al., 2010).
The mass of modern Cex can be quantified by analyzing fossil reference materials, which are highly sensitive to modern pollutants and insensitive to fossil pollutants. Based on Eq. (3), the measured isotopic ratio of the fossil reference (Rf_meas) can be expressed as Eq. (4):
The smaller the mass of the fossil reference material, the greater the effect of the constant mass of modern Cex on the isotope ratio of the fossil reference material, i.e., Rf_meas deviates toward Rm.
Similarly, the mass of fossil Cex can be quantified by analyzing modern reference materials. With decreasing mass, the measured isotopic ratio of the modern reference (Rm_meas) will deviate more strongly from Rm (toward Rf). Based on Eqs. (1)–(3) and assuming mspl≫mmex, the Rm_meas can be expressed as Eq. (5):
Finally, we can calculate the Cex-corrected isotope ratio of an unknown sample (Fspl_cor). This value is reported as the ratio between the theoretical isotopic ratio of this sample and the accepted value of a modern standard , also known as “fraction modern” (F; with all R corrected for stable isotope fractionation). This data are reported as Eq. (6):
where Fm∗ is determined from the direct measurement of the modern primary reference material (OX1) used to produce six time-bracketed graphite targets measured in a single batch after isotopic fractionation correction and normalization (Santos et al., 2007a, b). The individual uncertainty of Fspl_cor is determined from counting statistics and by propagating the quantified blanks using a mass balance approach. Long-term and continuous measurements of various types of blanks indicate that the mass of Cex within one analytical method or system can vary as much as 50 % (see Santos et al., 2010; Fig. 1). Therefore, we applied a 50 % error in mfex and mmex from long-term measurements of variance in mex of small samples (Santos et al., 2007a).
In this study, we used a multi-step approach to quantify mex introduced by the ECT9 protocol and 14C analysis (i.e., graphite target preparation for CO2 sample plus AMS analysis). First, we quantified mex introduced during 14C sample preparation and analysis by analyzing different masses of our bulk reference materials without involving ECT9 protocol. Extraneous carbon is introduced during sealed tube combustion and graphitization followed by graphite target handling and AMS measurement at the KCCAMS facility. Typically, 14C sample preparation and AMS measurement contributes a small portion to mex (Mouteva et al., 2015a; Santos et al., 2010). Second, we quantified the portion of mex added during the isolation of OC and EC with the ECT9 protocol. This portion of mex allows us to determine the practical minimum sample size limit for the entire method, including mex contributions from filter handling before analysis, instrument separation, and transfer to the cryo-collection system and Pyrex ampoules. To isolate this portion, we quantified mex of the entire procedure (ECT9 protocol plus 14C analysis) by analyzing the 14C signature of OC and EC from different masses of a large set of reference materials and then subtracted the portion of mex introduced during 14C analysis.
3.1 Recovery estimation
The reference materials used in this study, including the modern and fossil end-members (i.e., the major carbon sources) found in carbonaceous aerosol and their TC, OC, and EC concentrations are shown in Table 1. Reference materials were separated into OC, EC, or TC using the ECT9 method at ECCC's CAIR lab (Fig. 1) and analyzed for their 14C content at UC Irvine's KCCAMS facility, including graphitization and AMS analysis.
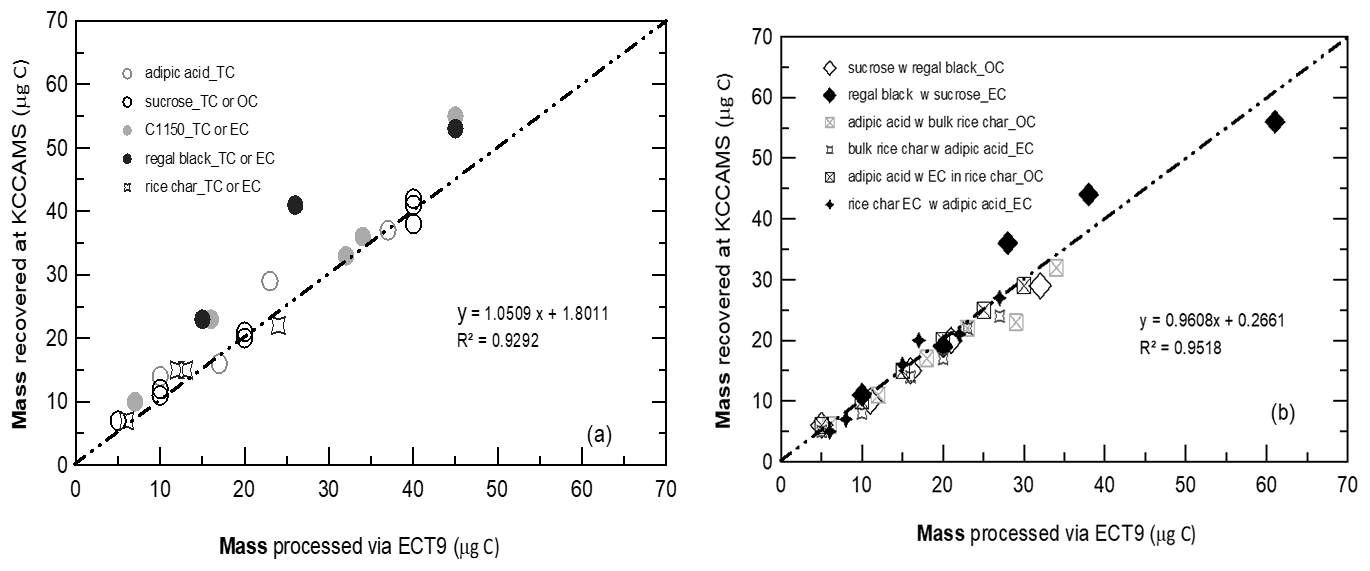
Figure 2Cross-validation of carbon mass processed by the ECT9 protocol and collected via cryo-trapping at ECCC and the carbon mass retrieved during the purification and graphitization on a KCCAMS vacuum line. Carbon fractions (OC, EC, or TC) were isolated from two reference materials for OC (sucrose, adipic acid) and for EC (regal black, C1150) and one OC and EC mixture (rice char). Most of the points deviating from the 1:1 line are carbon-rich reference materials, e.g., regal black and C1150 (> 90 % TC), wherein there are usually greater uncertainties in initial mass determination via weighing using microbalance.
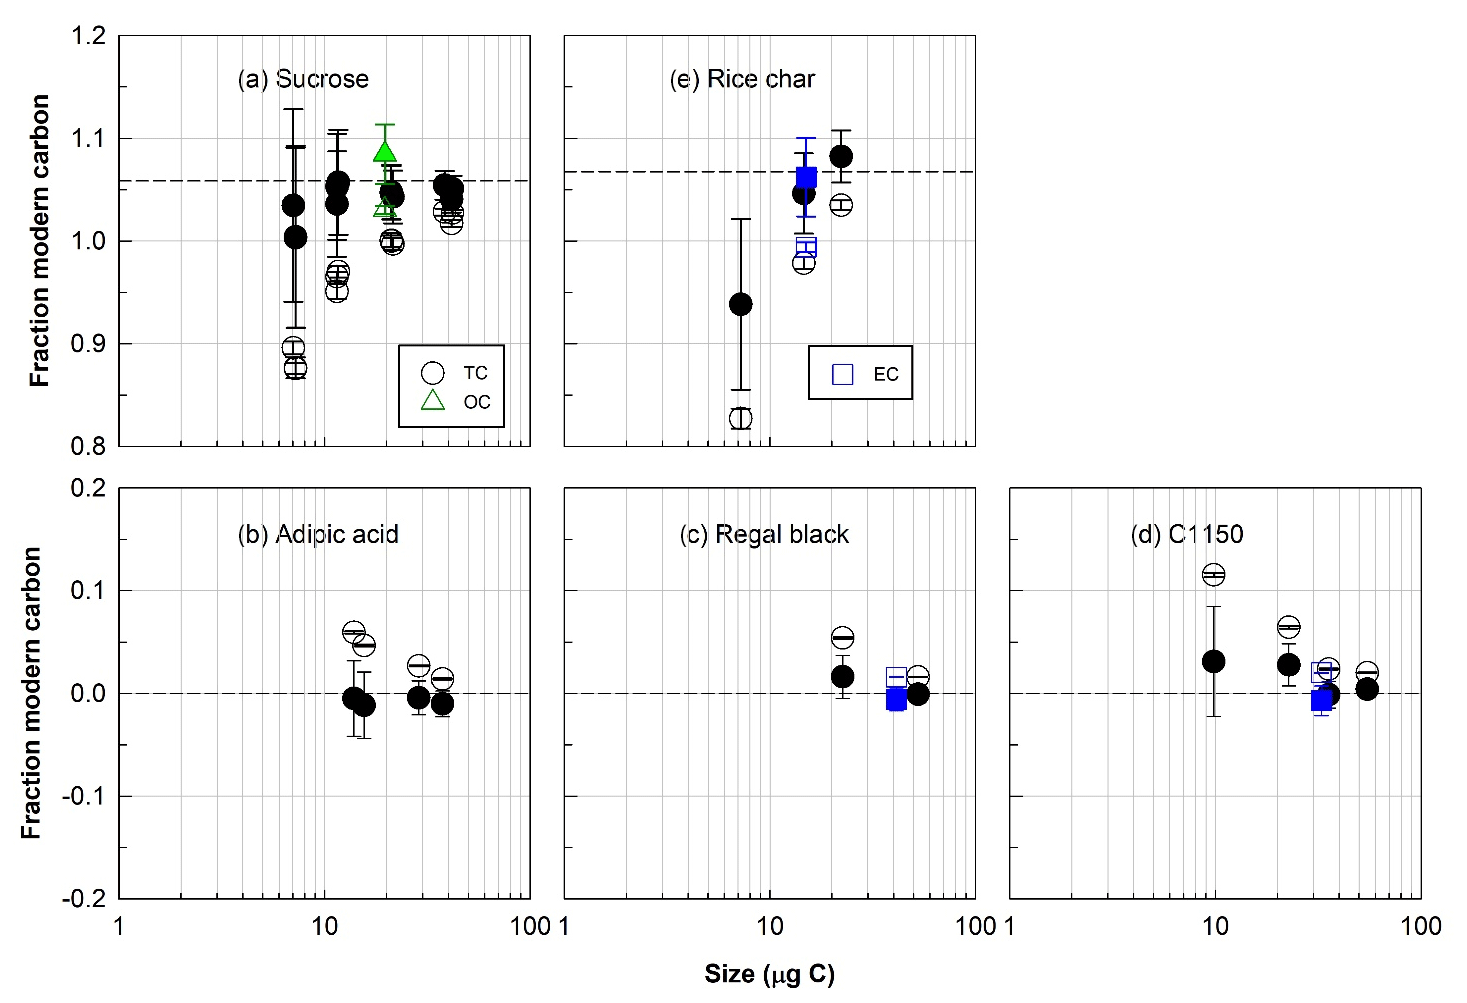
Figure 3Radiocarbon (14C) compositions, expressed as fraction of modern carbon, total carbon (TC, circles), organic carbon (OC, triangles), and elemental carbon (EC, squares) isolated with the ECT9 protocol from individual modern or fossil reference materials. (a) Sucrose and (b) adipic acid are modern and fossil OC, respectively; (c) regal black and (d) C1150 are fossil EC; and (e) rice char is a mixture of modern OC and EC. Open and solid symbols represent 14C data before and after correction for extraneous carbon introduced during isolation and subsequent 14C analysis, respectively. The dashed line indicates the consensus value determined from regular-sized bulk samples of these materials undergoing offline combustions (see Table 2).
Table 3Comparison of the OC and EC ECT9 and Swiss-4S isolation protocols.

a PyOC + CC = pyrolysis OC + carbonate carbon. b The flow of 10 % O2 + 90 % He mixing with the flow of 100 % He, resulting in 2 % O2 + 98 %He. c The EC punch is flushed with Milli-Q water prior the analysis to remove the water-soluble OC and minimize charring (Zhang et al., 2012; Mouteva et al., 2015a).
Figure 2 shows the cross-validation of carbon mass between the mass determined at ECCC's CAIR lab and the mass quantified at UC Irvine's KCCAMS lab indicating a very good positive correlation (R2 = 0.93 for pure materials and R2 = 0.95 for two-material-mixtures in Fig. 2a and b, respectively). Reassessment of sample masses by manometric measurements at UC Irvine (UCI) show good agreement with initial mass loaded at ECCC's CAIR lab via gravimetric or volumetric methods (Fig. 2a and b and Tables S6 and S7). It is suggested that no major losses or gains of carbon occurred during the entire analytical process and the overall recovery was close to 100 %, with a 5 % uncertainty for samples ranging in size from about 5 to 60 µg C.
3.2 Quantification of extraneous carbon and its sources
All types of samples, regardless of size, show deviations in their measured F14C value from their consensus values to certain degree due to Cex introduced during sample analysis. In µg C-sized samples (mass < 15 µg C), significant bias from any Cex can be observed because Cex constitutes a large fraction of the total sample. Previous work (using solvent-free analytical protocols) has shown that modern Cex is introduced mostly through instrumentation and sample handling techniques, while fossil Cex originates from iron oxide used as a catalyst for the reduction of CO2 to graphite prior to AMS analysis (Santos et al., 2007a, b).
The F14C values of the pure modern or fossil reference materials generally agreed with their accepted F14C values for both OC and EC fractions (within approximately 5 % uncertainty on average; see Fig. 3 and Table 2, S6, and S7) after applying a constant amount Cex correction in F14C determination. Specifically, the overall agreements for all individual pure (Table S6) and mixed reference materials (Table S7, excluding the OC data from adipic acid + bulk rice char) are within 2 ± 3 % of their corresponding values (Table 2). On average, for samples containing > 10 µg C the agreements are within 1 ± 1 %, whereas samples containing between > 5 µg C and < 10 µg C are around 7 ± 5 %. This constant Cex is a critical prerequisite for accurately correcting the F14C value of unknown samples. Hence, our data demonstrated that the ECT9 method (and subsequent 14C analysis) introduces a small, reproducible amount of Cex.
According to Eqs. (4) and (5) in Sect. 2.5, Cex can be quantified by measuring F14C of pure modern or fossil materials with different sizes. Figure 3 demonstrates that regardless what 14C content is in carbon fractions isolated from the reference materials and what size it is, the corrected F14C values match with the consensus value within propagated uncertainty.
To evaluate the suitability of ECT9 for 14C analysis of aerosol samples, a comparison is made between the results of a published method (i.e., Swiss_4S) and those of ECT9. The two protocols are listed in Table 3, and their Cex distribution is shown in Table 4. The total amount of Cex introduced by the complete procedure through ECT9 and determined based on all reference materials was 1.3 ± 0.6 µg C, with 70 % originating from contamination with modern carbon (Table 4). The isolation of OC and EC with the ECT9 protocol introduced 65 % of total Cex (0.85 out of 1.35 µg C), with 65 % derived from modern carbon. Overall, the total amount of Cex introduced during isolation with the ECT9 protocol is comparable to that for the Swiss_4S protocol established at UCI within uncertainties (Table 3, Mouteva et al., 2015a). Thus, it is demonstrated that the ECT9 protocol serves as a suitable alternative for the 14C analysis of aerosol samples with masses > 5 µg C.
Table 4Comparison of the procedural contamination with extraneous carbon for aerosol reference materials partitioned into organic carbon (OC) and elemental carbon (EC) with the ECT9 or Swiss_4S protocols based on their 14C contents. We assume a measurement uncertainty of 50 % (see Sect. 2).
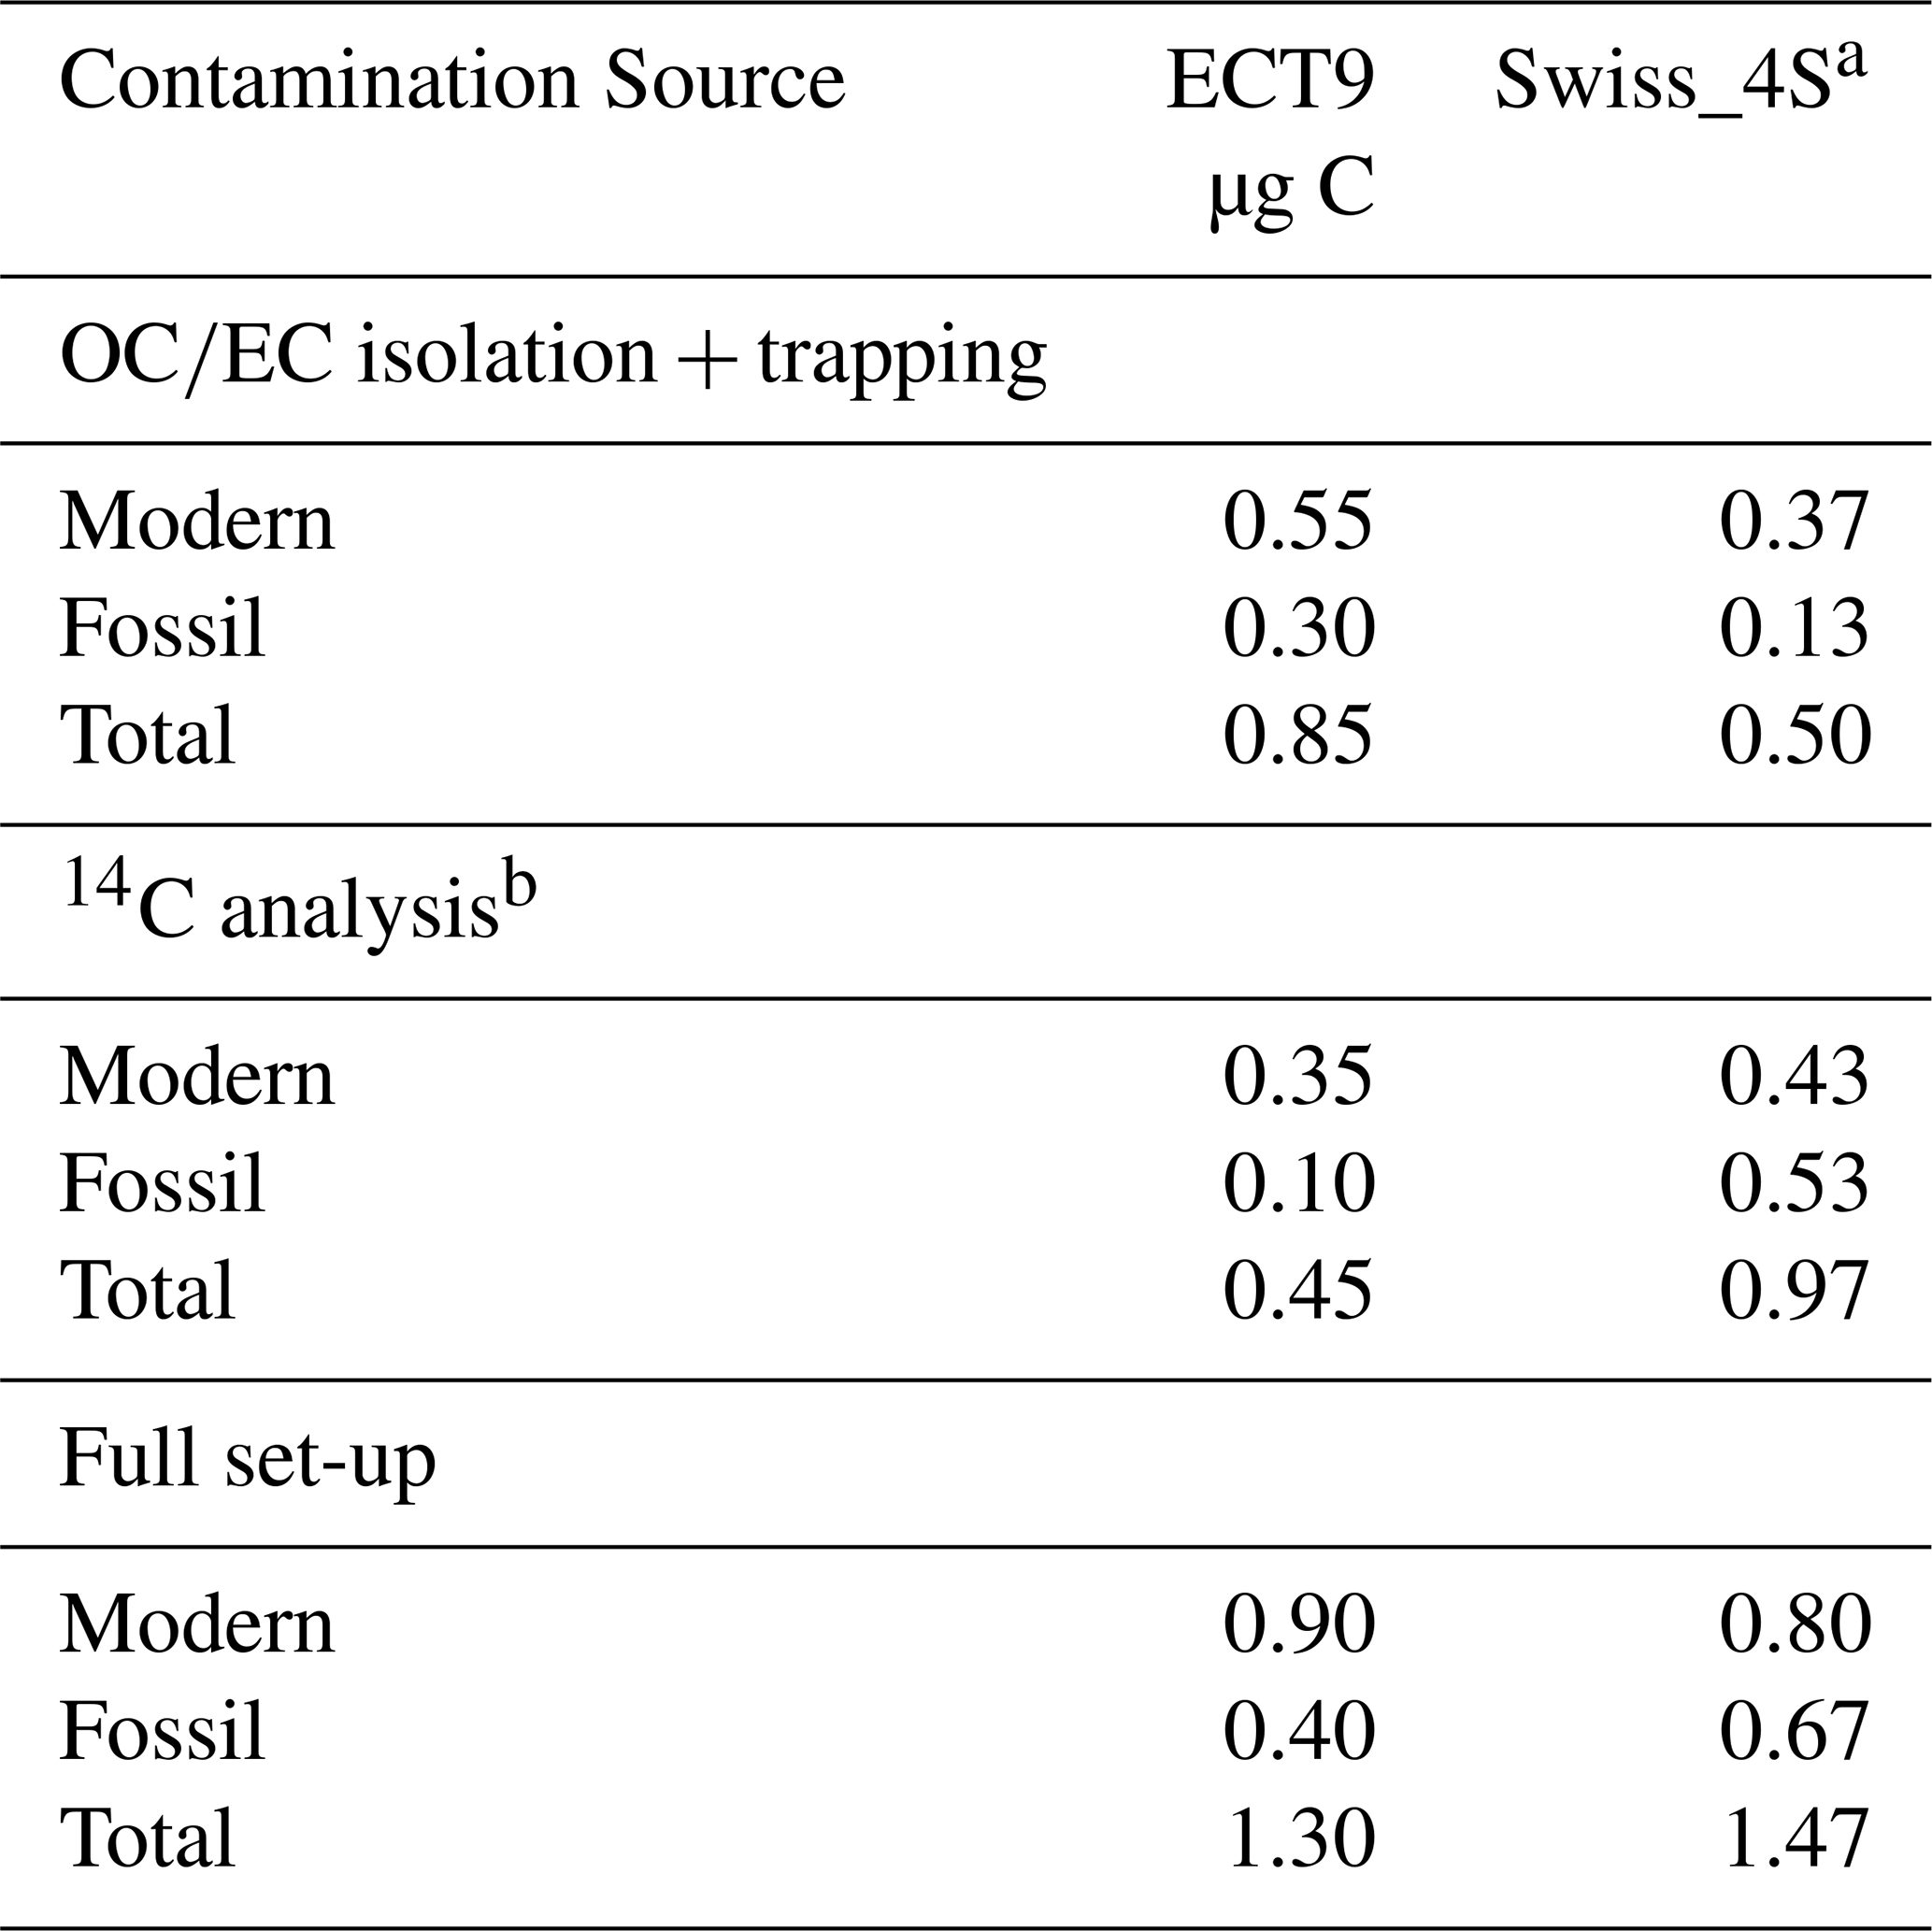
a From Mouteva et al. (2015a). b Carbon introduced during sample combustion, CO2 purification and graphitization, and measurement with 14C AMS.
3.3 Effectiveness of separation
To investigate the effectiveness of the ECT9 for separating OC from EC in more complex mixtures while minimizing OC into the EC fraction via pyrolysis, mixtures of the modern and fossil reference materials (Table 2) were used for measuring δ13C (Tables S4 and S5 in the Supplement) and F14C (Table S7).
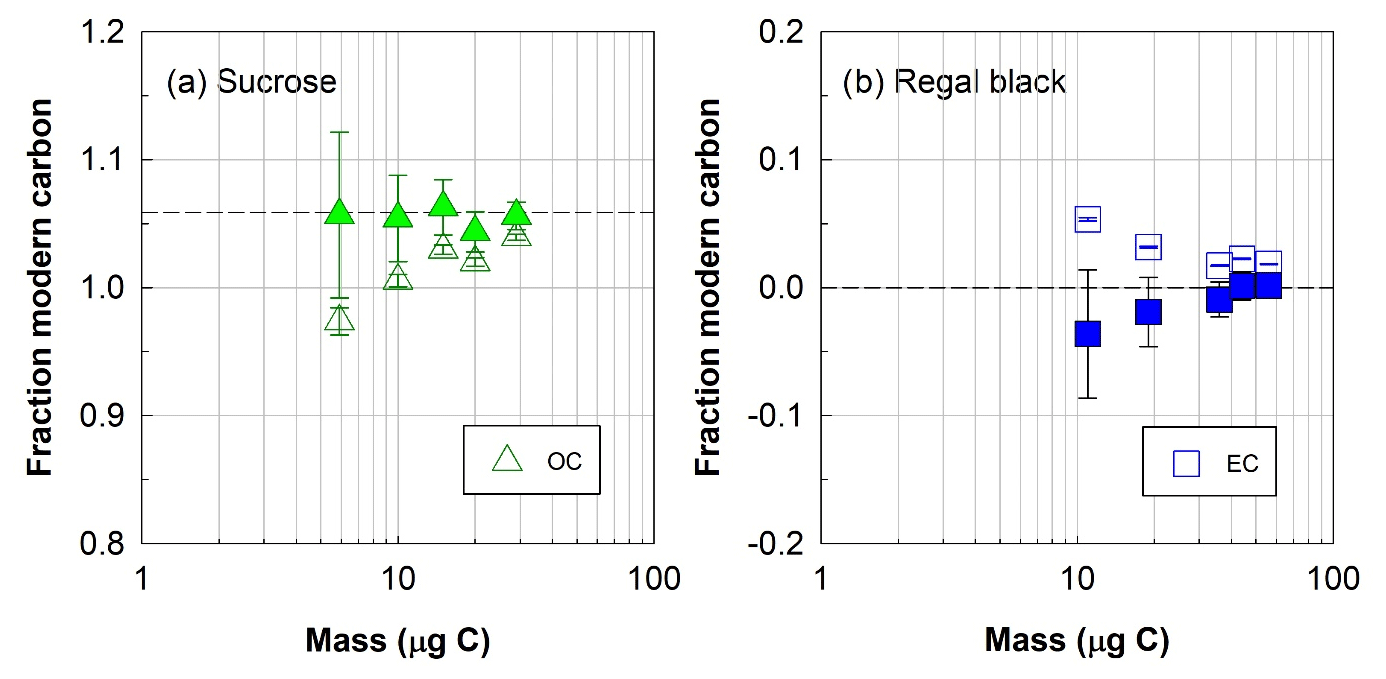
Figure 4Radiocarbon (14C) composition, expressed as fraction of modern carbon, of (a) organic (OC, triangles) or (b) elemental (EC, squares) carbon fractions isolated with the ECT9 protocol from mixtures of pure modern OC (sucrose) with fossil EC (regal black). Open and solid symbols represent 14C data before and after correction for extraneous carbon introduced during isolation via ECT9 and subsequent 14C analysis via AMS, respectively (see Table S7). The dashed line indicates the consensus value (see Table 2).
First, it was found that the F14C values of OC and EC fractions isolated from mixtures of pure sucrose (modern OC) and pure regal black (fossil EC) were within the measurement uncertainty of their accepted F14C values after correction for a constant amount of Cex (Fig. 4) for samples with 5–34 µg OC carbon and 10–60 µg EC carbon, showing a good separation of OC from EC. This amount of Cex was identical to that applied to the pure reference materials above, further corroborating the constant background introduced by the ECT9 protocol and 14C analysis.
Next, the mixtures of fossil adipic acid (pure OC) and modern rice char (mixture of OC and EC) were isolated and analyzed. It was found that after correction for Cex, the F14C values of the OC (from the mixture) were systematically greater than the consensus value of the pure adipic acid, i.e., a F14C of zero (Fig. 5a), indicating that there was certain level of modern fraction contributed to the measured OC from the modern rice char. Based on an elevated mean value of 0.1081 ± 0.0259 (n=6) after blank corrections, a mass balance calculation indicates that 10 ± 3 % of rice char OC is present. The high end of this estimation is close to ∼ 14 %, within a validity range of what one would expect.

Figure 5Radiocarbon (14C) compositions, expressed in fraction modern carbon, of organic (OC, triangles) and elemental (EC, squares) carbon fractions isolated with the ECT9 protocol from the mixtures of reference materials. Fraction of modern carbon (a) OC and (c) EC isolated from mixtures of pure fossil OC (adipic acid) with modern bulk rice char (made of 14 % OC and 86 % EC) and of (b) OC and (d) EC isolated from mixtures of pure fossil OC (adipic acid) with modern EC from rice char_EC (rice char_OC has been removed before mixing). Open and solid symbols represent data before and after correction for extraneous carbon introduced during isolation via ECT9 and subsequent 14C analysis via AMS, respectively (Table S7). The dashed line indicates the consensus value (see Table 2).
To confirm that ECT9 could remove OC contained in rice char, an additional step was taken before mixing modern rice char's EC with the fossil OC (adipic acid). Specifically, we stripped the OC fraction of rice char by running rice char (on a filter) through the ECT9 protocol. Adipic acid (fossil OC) was then injected onto the filter with the remaining rice char EC. The results show that the F14C of OC values of this mixture lie well within the expected range of the consensus value (Fig. 5b) after a Cex correction as described above, demonstrating an excellent removal of rice char OC.
In both mixtures (fossil adipic acid with modern bulk rice char or rice char EC), the corrected F14C values of the isolated EC fractions were within the expected range for the rice char reference material (Fig. 5c and d). This provides further evidence that the ECT9 protocol isolates modern EC from fossil OC with no obvious evidence of transferring fossil OC into the EC fraction. Together, the three sets of mixing experiments (Figs. 4 and 5) provide strong evidence for the effectiveness of separating OC from EC via ECT9 protocol.
In addition to F14C measurements, δ13C measurements in mixtures of OC and EC can also provide quantitative information on the effectiveness of OC and EC separation via ECT9. Various amounts of sucrose (pure OC, 10–30 µg C) were first mixed with varying amounts of regal black (pure EC, 20–66 µg C). The mixtures were then physically separated into OC and EC fractions by ECT9 for δ13C measurements. The measured δ13C values of OC and EC from these mixing experiments are listed in Table S4. Based on the δ13C values of individual pure reference materials (Table S3) and a two end-member mixing mass balance, it is estimated that the average fraction contributed into each other in the mixtures (i.e., sucrose fraction into regal black or vice versa) was likely less than 3 % (Table S5).

Figure 6Thermograms of pure or bulk references: (a) regal black, (b) sucrose, and (c) rice char. Temperature (solid blue line) and FID signals (integrated yellow area with green line) on the left axes and laser (solid red line) on the right axis. It is observed that on the three thermograms during the temperature stage of 870 ∘C, the laser transmittance signals decrease first and increase again before the next temperature stage, minimizing PyOC fraction, i.e., possible charred OC contribution to EC.
3.4 Charring evaluation and PyOC removal using the ECT9 protocol
It is known that some of OC (e.g., oxygenated OC or water-soluble OC) would char to form pyrolyzed organic carbon (PyOC) when heated in an inert He atmosphere, darkening the filter (Chow et al., 2004; Watson et al., 2007) and causing decreased laser signals due to light absorption of charred OC. In most TOA protocols, this PyOC would combust and contribute to EC when O2 is added. However, PyOC can be also be gasified and released as CO at high temperatures (> 700 ∘C) with limited O2 supply, e.g., oxygenated OC at 870 ∘C (Huang et al., 2006; Chan et al., 2010, 2019). Most TOA protocols estimate PyOC by quantifying the mass associated with reflectance and transmittance changes, i.e., the mass released between the time when O2 is introduced and the split point (where the reflectance and transmittance returns to the initial value). In contrast to other TOA protocols, ECT9 defines PyOC as the mass released at the temperature step of 870 ∘C (during a period of 600 s). This includes charred OC, calcium carbonate (CaCO3) that decomposes at 830 ∘C, and any refractory OC not thermally released at 550 ∘C (Huang et al., 2006; Chan et al., 2010, 2019).
Although ECT9 does not use laser signals to quantify PyOC, it is expected that the changes of laser signals during the stage of 870 ∘C would provide useful information about PyOC. Thus, four sets of samples were selected, including those of pure reference materials and ambient aerosol samples from different sources with heavy or light mass loading (e.g., those arctic sample filters from different seasons) to evaluate the possible charring via ECT9. Their thermograms are shown in Figs. 6 to 9.
Figure 6a–c show thermograms of pure or bulk references for regal black, sucrose, and rice char, respectively. It is observed in all three panels that the laser transmittance signals first decrease and then increase again during the 870 ∘C step and that they return to their initial values just before EC is released at the next step of 900 ∘C. This demonstrates that the ECT9 method minimizes PyOC contributions to the EC fraction.

Figure 7Thermograms of the filters directly collected from tailpipe exhaust of a diesel engine vehicle in (a) and a gasoline engine passage car in (b). The legends are the same as Fig. 6. Note that the mass fraction from the temperature stage of 870 ∘C in (b) is obviously larger than that in (a). The latter is negligible, indicating that the amount of PyOC fraction is sample matrix dependent. The amount of PyOC from gasoline vehicle emissions is likely larger than that from diesel vehicle emissions. Note that the laser signal reaches the initial value before the 900 ∘C stage for EC releasing, demonstrating that the charring contribution to EC is minimized.
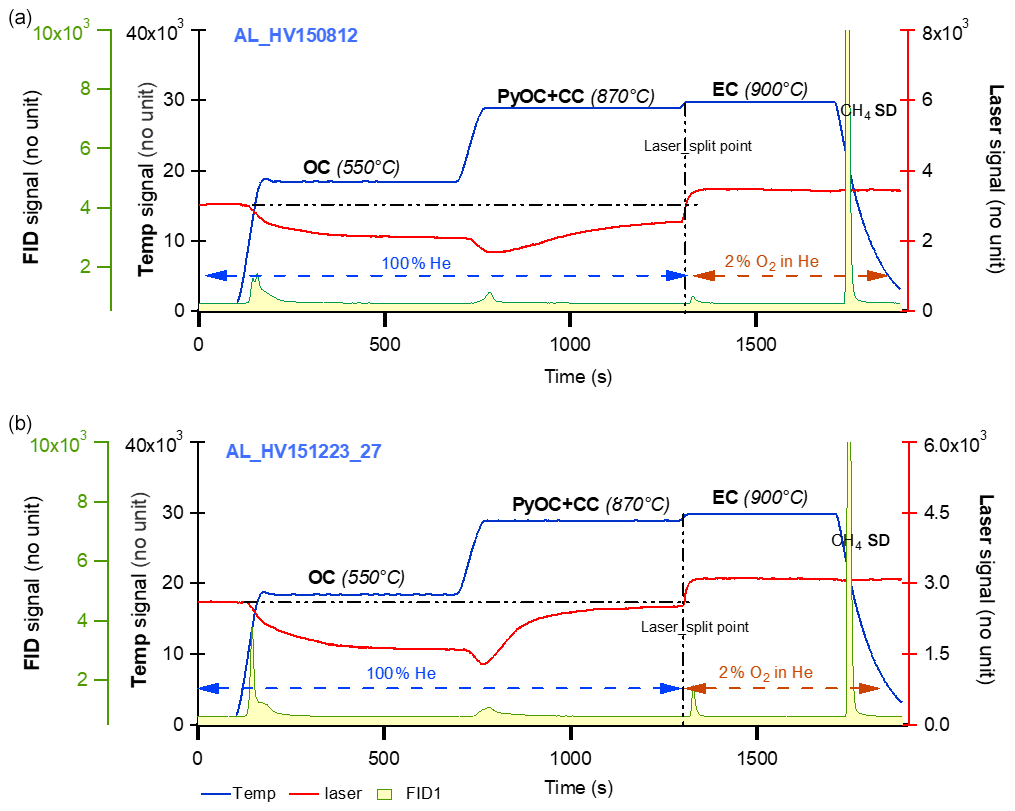
Figure 8Thermograms of fine particles (PM1.0 µm) from the filter samples collected at an arctic site, i.e., Alert, NU, Canada, in summer (a) and winter (b) 2015. The legends are the same as Fig. 6. It is clearly shown on both thermograms that during 550 ∘C stage, the laser signal starts decreasing (implying charred OC formation) and begins increasing at 870 ∘C and reaches the initial value before the EC stage (indicating the contribution to EC by charred OC is minimized or removed).

Figure 9Thermograms of the SRM 8785 filters (the fine fraction (PM2.5) of resuspended urban dust particles from SRM 1649a and collected on quartz filters) with various amount of materials ranging from 614 to 1723 mg via two different thermal protocols. Panels (a) and (b) were obtained by ECT9. The legends are the same as Fig. 6. Thermograms in (a) and (b) show the similar patterns as in Figs. 6–8 that the laser signals reaching the initial value are just before the temperature stage of EC, suggesting that the charred OC contribution to EC is minimized. The thermogram in (c) is obtained from the same filter in (b) but by Swiss-4 protocol for comparison. The legends are similar except for the integrated area with green line, which stands for CO2 in parts per million (by non-dispersive infrared) instead of FID signals.
The thermograms of aerosol (on filters) collected directly from tailpipe exhaust of a diesel engine vehicle and a gasoline engine passage car, respectively are shown in Fig. 7. These data suggest that the amount of PyOC generated during analysis are sample/matrix dependent. Specifically, the mass fraction during the 870 ∘C temperature is larger for the gasoline than the diesel engine. This finding supports previous work showing that PyOC is proportional to the amount of oxygenated OC (Chan et al., 2010). It is noticed that the laser signal reaches the initial value before the EC step, further demonstrating that the charring contribution to EC is minimized.
Another set of thermograms of two total suspended particle filter samples collected during the summer (August) and winter (December) of 2015 at an arctic site (i.e., Alert) are shown in Fig. 8. More details about these samples can be found in Wex et al. (2019). The laser signal patterns are similar to those shown in Figs. 6 and 7, yet more pronounced. During the 550 ∘C step, the laser signals decrease. During the 870 ∘C step, the signals further decrease, then increase, and finally increase to their initial point before EC is released at 900 ∘C. These thermograms further demonstrate ECT9 is able to minimize PyOC by gasification.
Finally, the thermographs of NIST urban dust reference material SRM 8785 (the resuspended SRM 1649a urban dust with a fine fraction < 2.5 µm collected on quartz filter) analyzed with ECT9 and Swiss_4S are shown in Fig. 9. Both thermograms obtained with the ECT9 method (Fig. 9a and b) show the similar patterns as those in Figs. 6–8, i.e., the laser signals reaching the initial value just before the EC release at 900 ∘C, suggesting that the charring contribution to EC is minimized during the stage of 870 ∘C even though some PyOC might remain.
In the thermogram obtained with the Swiss-4S protocol (Fig. 9c), the laser signal increases from the beginning of the run while the first two stages (375 and 475 ∘C) are under the conditions of pure O2 stream, inferring that light absorbing carbon is released during the first two OC stages. The laser signal continues to increase while the temperature increases up to 650 ∘C (the third stage) under the pure He gas stream, indicating that no charred OC is formed. However, when the temperature starts decreasing from 650 ∘C, the laser signal decreases, indicating PyOC formation below that temperature. This signal decrease continues until the beginning of the next pure O2 stage. It is important to note that to obtain EC fraction, the Swiss-4 (Table 3) method calls for filter sample pre-treatment, i.e., extraction with water before the thermal separation of to minimize the contribution of charred OC from the 3rd stage to EC at the 4th stage (Zhang et al., 2012). However, for a method comparison, the thermogram shown in Fig. 9c was from a filter without pre-treatment. While it is difficult to make direct comparisons between OC and EC from Fig. 9a and c, the laser profiles from those thermograms in Fig. 9a and b indicate that in both cases charred OC is negligible or minimum via ECT9.
Together, the thermograms (Figs. 6–9) elucidate that the ECT9 protocol can effectively remove or minimize charred OC (PyOC) to achieve good physical separation of OC and EC. Another great advantage of using ECT9 to separate OC from EC for isotope analysis (both 13C and 14C) is its consistency with the protocol used for OC and EC concentration measurements. Moreover, the ECT9 method does not require filter samples to be pre-extracted with water before EC analysis (to reduce PyOC).
We demonstrate the effectiveness of the ECT9 protocol to physically isolate OC and EC from aerosol samples for 14C and 13C analysis by using OC and EC reference materials on their own and as mixtures. It was found that the ECT9 protocol successfully separates OC and EC fractions with a low (but largely modern) total carbon blank of 1.3 ± 0.6 µg C. The majority (65 %) of this extraneous carbon originates from the isolation with the ECT9 protocol, with 35 % contributed from graphitization and 14C measurement of the samples at the KCCAMS facility. After mass balance background corrections, the F14C results from both bulk pure materials and mixtures (with sample size as small as 5 µg C) can reach the consensus values (Table 2) with an average uncertainty of about 5 %.
In addition, we evaluated potential PyOC formation during ECT9 by investigating thermograms of a variety of reference materials and ambient filter samples. It is demonstrated that ECT9 provides a good alternative for carbonaceous aerosol source apportionment studies, including ultra small sized (5–15 µg C) samples obtained from arctic regions. To increase the application of isotope data (14C or 13C) in atmospheric research, future efforts should be focused on the comparison on separation via different methods/protocols using the same sets of reference materials. At the same time, the isolation results should be also compared among those methods/protocols widely used in long-term national monitoring network for contents, ensuring a consistency in measurements between concentrations and their corresponding isotopic compositions.
| AMS | Accelerator Mass Spectrometry |
| ASTD | Atmospheric Science and Technology Directorate |
| BC | Black carbon |
| CABM | Canadian Aerosol Baseline Measurement |
| CAIR | Carbonaceous Aerosol and Isotope Research |
| CCMR | Climate Chemistry Measurements and Research |
| CC | Carbonate carbon |
| CRD | Climate Research Division |
| EC | Elemental carbon |
| ECCC | Environment and Climate Change Canada |
| ECT9 | EnCan-Total-900 protocol |
| EUSAAR | European Supersites for Atmospheric Aerosol Research |
| FID | Flame ionization detector |
| F14C | Fraction Modern Carbon |
| ICP | Inter-comparison study |
| IRMS | Isotopic Ratio Mass Spectrometer |
| IMPROVE | Interagency Monitoring PROtected Visual Environments |
| KCCAMS | W.M. Keck Carbon Cycle Accelerator Mass Spectrometry Facility |
| MAC | Mass absorption coefficient |
| NIST | National Institute of Standard and Technology |
| OC | Organic carbon |
| PM | Particulate matter |
| PyOC | Pyrolyzed organic carbon |
| PSAP | Particle Soot Absorption Photometer |
| rBC | Refractory Black Carbon |
| SP2 | Single Particle Soot Photometer |
| SRM | Standard Reference Material |
| TC | Total carbon |
| TEA | Thermal evolution analysis |
| TOA | Thermal optical analysis |
| UCI | University of California, Irvine |
All data presented in this article are included in the supplement.
The supplement related to this article is available online at: https://doi.org/10.5194/amt-14-3481-2021-supplement.
Conceptualizing and designing the study: LH, CIC, and GMS. Developing analytical methods and ensuring data quality: LH, GMS, WZ, CIC, BTR. Performing the experiments and data acquisition: WZ, GMS, SRH, VV, BTR. Data organizing/analysis and interpretation: LH, CIC, BTR, GMS, WZ. Writing the paper, including editing and preparing figures and tables: LH, CIC, BTR, GMS, WZ.
The authors declare that they have no conflict of interest.
This research was supported by A-base funding from Environment and Climate Change Canada and the KCCAMS Facility at the University of California, Irvine through G.M.S. We thank Darrell Enrst (ECCC) and John Southon (KCCAMS) for supporting 13C IRMS and 14C AMS analyses, respectively.
This paper was edited by Pierre Herckes and reviewed by three anonymous referees.
Andersson, A., Deng, J., Du, K., Zheng, M., Yan, C., Sköld, M., and Gustafsson, Ö.: Regionally-Varying Combustion Sources of the January 2013 Severe Haze Events over Eastern China, Environ. Sci. Technol., 49, 2038–2043, https://doi.org/10.1021/es503855e, 2015.
Barrett, T. E., Robinson, E. M., Usenko, S., and Sheesley, R. J.: Source Contributions to Wintertime Elemental and Organic Carbon in the Western Arctic Based on Radiocarbon and Tracer Apportionment, Environ. Sci. Technol., 49, 11631–11639, https://doi.org/10.1021/acs.est.5b03081, 2015.
Beverly, R. K., Beaumont, W., Tauz, D., Ormsby, K. M., Von Reden, K. F., Santos, G. M., and Southon, J. R.: The Keck Carbon Cycle AMS laboraoty, University of California, Irvine Status report, Radiocarbon, 52, 301–309, 2010.
Birch, M. E.: Applied Occupational and Environmental Hygiene Occupational Monitoring of Particulate Diesel Exhaust by NIOSH Method 5040, Applied Occupational and Environmental Hygiene, 17, 400–405, https://doi.org/10.1080/10473220290035390, 2002.
Bond, T. C., Doherty, S. J., Fahey, D. W., Forster, P. M., Berntsen, T., DeAngelo, B. J., Flanner, M. G., Ghan, S., Kärcher, B., Koch, D., Kinne, S., Kondo, Y., Quinn, P. K., Sarofim, M. C., Schultz, M. G., Schulz, M., Venkataraman, C., Zhang, H., Zhang, S., Bellouin, N., Guttikunda, S. K., Hopke, P. K., Jacobson, M. Z., Kaiser, J. W., Klimont, Z., Lohmann, U., Schwarz, J. P., Shindell, D., Storelvmo, T., Warren, S. G., and Zender, C. S.: Bounding the role of black carbon in the climate system: A scientific assessment, J. Geophys. Res.-Atmos., 118, 5380–5552, 2013.
Cavalli, F., Viana, M., Yttri, K. E., Genberg, J., and Putaud, J.-P.: Toward a standardised thermal-optical protocol for measuring atmospheric organic and elemental carbon: the EUSAAR protocol, Atmos. Meas. Tech., 3, 79–89, https://doi.org/10.5194/amt-3-79-2010, 2010.
Chan, T. W., Huang, L., Leaitch, W. R., Sharma, S., Brook, J. R., Slowik, J. G., Abbatt, J. P. D., Brickell, P. C., Liggio, J., Li, S.-M., and Moosmüller, H.: Observations of OM/OC and specific attenuation coefficients (SAC) in ambient fine PM at a rural site in central Ontario, Canada, Atmos. Chem. Phys., 10, 2393–2411, https://doi.org/10.5194/acp-10-2393-2010, 2010.
Chan, T. W., Meloche, E., Kubsh, J., Brezny, R., Rosenblatt, D., and Rideout, G.: Impact of Ambient Temperature on Gaseous and Particle Emissions from a Direct Injection Gasoline Vehicle and its Implications on Particle Filtration, SAE International Journal of Fuels and Lubricants, 6, 350–371, https://doi.org/10.4271/2013-01-0527, 2013.
Chan, T. W., Huang, L., Banwait, K., Zhang, W., Ernst, D., Wang, X., Watson, J. G., Chow, J. C., Green, M., Czimczik, C. I., Santos, G. M., Sharma, S., and Jones, K.: Inter-comparison of elemental and organic carbon mass measurements from three North American national long-term monitoring networks at a co-located site, Atmos. Meas. Tech., 12, 4543–4560, https://doi.org/10.5194/amt-12-4543-2019, 2019.
Chow, J. C., Watson, J. G., Crow, D., Lowenthal, D. H., and Merrifield, T.: Comparison of IMPROVE and NIOSH Carbon Measurements, Aerosol Sci. Technol., 34, 23–34, 2001.
Chow, J. C., Watson, J. G., Chen, L. W. A., Arnott, W. P., Moosmüller, H., and Fung, K.: Equivalence of elemental carbon by thermal/optical reflectance and transmittance with different temperature protocols, Environ. Sci. Technol., 38, 4414–4422, https://doi.org/10.1021/es034936u, 2004.
Cohen, A. J., Brauer, M., Burnett, R., Anderson, H. R., Frostad, J., Estep, K., Balakrishnan, K., Brunekreef, B., Dandona, L., Dandona, R., Feigin, V., Freedman, G., Hubbell, B., Jobling, A., Kan, H., Knibbs, L., Liu, Y., Martin, R., Morawska, L., Pope, C. A., Shin, H., Straif, K., Shaddick, G., Thomas, M., van Dingenen, R., van Donkelaar, A., Vos, T., Murray, C. J. L., and Forouzanfar, M. H.: Estimates and 25-year trends of the global burden of disease attributable to ambient air pollution: an analysis of data from the Global Burden of Diseases Study 2015, Lancet, 389, 1907–1918, https://doi.org/10.1016/S0140-6736(17)30505-6, 2017.
Currie, L. A., Benner, B. A. J., Kessler, J. D., Klinedinst, D. B., Klouda, G. A., Marolf, J. V., Slater, J. F., Wise, S. A., Cachier, H., Cary, R., Chow, J. C., Watson, J., Druffel, E. R. M., Masiello, C. A., Eglinton, T. I., Pearson, A., Reddy, C. M., Gustafsson, Ö., Quinn, J. G., Hartmann, P. C., Hedges, J. I., Prentice, K. M., Kirchstetter, T. W., Novakow, T., Puxbaum, H., and Schmid, H.: A Critical Evaluation of Interlaboratory Data on Total, Elemental, and Isotopic Carbon in the Carbonaceous Particle Reference Material, NIST SRM 1649a, J. Res. Natl. Inst. Stan., 107, 279–298, 2002.
Eckhardt, S., Quennehen, B., Olivié, D. J. L., Berntsen, T. K., Cherian, R., Christensen, J. H., Collins, W., Crepinsek, S., Daskalakis, N., Flanner, M., Herber, A., Heyes, C., Hodnebrog, Ø., Huang, L., Kanakidou, M., Klimont, Z., Langner, J., Law, K. S., Lund, M. T., Mahmood, R., Massling, A., Myriokefalitakis, S., Nielsen, I. E., Nøjgaard, J. K., Quaas, J., Quinn, P. K., Raut, J.-C., Rumbold, S. T., Schulz, M., Sharma, S., Skeie, R. B., Skov, H., Uttal, T., von Salzen, K., and Stohl, A.: Current model capabilities for simulating black carbon and sulfate concentrations in the Arctic atmosphere: a multi-model evaluation using a comprehensive measurement data set, Atmos. Chem. Phys., 15, 9413–9433, https://doi.org/10.5194/acp-15-9413-2015, 2015.
Evangeliou, N., Balkanski, Y., Hao, W. M., Petkov, A., Silverstein, R. P., Corley, R., Nordgren, B. L., Urbanski, S. P., Eckhardt, S., Stohl, A., Tunved, P., Crepinsek, S., Jefferson, A., Sharma, S., Nøjgaard, J. K., and Skov, H.: Wildfires in northern Eurasia affect the budget of black carbon in the Arctic – a 12-year retrospective synopsis (2002–2013), Atmos. Chem. Phys., 16, 7587–7604, https://doi.org/10.5194/acp-16-7587-2016, 2016.
Fuzzi, S., Baltensperger, U., Carslaw, K., Decesari, S., Denier van der Gon, H., Facchini, M. C., Fowler, D., Koren, I., Langford, B., Lohmann, U., Nemitz, E., Pandis, S., Riipinen, I., Rudich, Y., Schaap, M., Slowik, J. G., Spracklen, D. V., Vignati, E., Wild, M., Williams, M., and Gilardoni, S.: Particulate matter, air quality and climate: lessons learned and future needs, Atmos. Chem. Phys., 15, 8217–8299, https://doi.org/10.5194/acp-15-8217-2015, 2015.
Grahame, T. J., Klemm, R., Schlesinger, R. B., Gwen Eklund, A., Chow, J. C., Greenbaum, D. S., Hidy, G. M., Kleinman, M. T., Watson, J. G., Wyzga, R. E., Grahame, T. J., Klemm, R., and Schlesinger, R. B.: Public health and components of particulate matter: The changing assessment of black carbon, J. Air Waste Manage., 64, 1221–1231, https://doi.org/10.1080/10962247.2014.960218, 2014.
Graven, H., Keeling, R. F., and Rogelj, J.: Changes to Carbon Isotopes in Atmospheric CO2 over the Industrial Era and into the Future, Global Biogeochem. Cy., 34, e2019GB006170, https://doi.org/10.1029/2019GB006170, 2020.
Graven, H. D.: Impact of fossil fuel emissions on atmospheric radiocarbon and various applications of radiocarbon over this century, P. Natl. Acad. Sci. USA, 112, 9542–9545, https://doi.org/10.1073/pnas.1504467112, 2015.
Hallquist, M., Wenger, J. C., Baltensperger, U., Rudich, Y., Simpson, D., Claeys, M., Dommen, J., Donahue, N. M., George, C., Goldstein, A. H., Hamilton, J. F., Herrmann, H., Hoffmann, T., Iinuma, Y., Jang, M., Jenkin, M. E., Jimenez, J. L., Kiendler-Scharr, A., Maenhaut, W., McFiggans, G., Mentel, Th. F., Monod, A., Prévôt, A. S. H., Seinfeld, J. H., Surratt, J. D., Szmigielski, R., and Wildt, J.: The formation, properties and impact of secondary organic aerosol: current and emerging issues, Atmos. Chem. Phys., 9, 5155–5236, https://doi.org/10.5194/acp-9-5155-2009, 2009.
Hand, J. L., Schichtel, B. A., Malm, W. C., and Frank, N. H.: Spatial and Temporal Trends in PM2.5 Organic and Elemental Carbon across the United States, Adv. Meteorol., 2013, 367674, https://doi.org/10.1155/2013/367674, 2013.
Hammes, K., Smernik, R. J., Skjemstad, J. O., Herzog, A., Vogt, U. F., and Schmidt, M. W. I.: Synthesis and characterisation of laboratory-charred grass straw (Oryza sativa) and chestnut wood (Castanea sativa) as reference materials for black carbon quantification, Org. Geochem., 37, 1629–1633, https://doi.org/10.1016/j.orggeochem.2006.07.003, 2006.
Hammes, K., Schmidt, M. W. I., Smernik, R. J., Currie, L. A., Ball, W. P., Nguyen, T. H., Louchouarn, P., Houel, S., Gustafsson, Ö., Elmquist, M., Cornelissen, G., Skjemstad, J. O., Masiello, C. A., Song, J., Peng, P., Mitra, S., Dunn, J. C., Hatcher, P.G., Hockaday, W. C., Smith, D. M., Hartkopf‐Fröder, C., Böhmer, A., Lüer, B., Huebert, B. J., Amelung,W., Brodowski, S., Huang, L., Zhang, W., Gschwend, P. M., Flores-Cervantes, D. X., Largeau, C., Rouzaud, J-N., Rumpel, C., Guggenberger, G., Kaiser, K., Rodionov, A., Gonzalez-Vila, F.J., Gonzalez-Perez, J. A., de la Rosa, J. M., Manning, D. A. C., López‐Capél, E., and Ding, L. Y.: Comparison of quantification methods to measure fire-derived (black/elemental) carbon in soils and sediments using reference materials from soil, water, sediment and the atmosphere, 21, GB3016, https://doi.org/10.1029/2006GB002914, 2007.
Heal, M. R.: The application of carbon-14 analyses to the source apportionment of atmospheric carbonaceous particulate matter: A review, Anal. Bioanal. Chem., 406, 81–98, https://doi.org/10.1007/s00216-013-7404-1, 2014.
Huang, L.: The issue of harmonizing the methodologies for emission inventories of GHGs with those of SLCFs, presentation at the IPCC Expert Meeting on SLCFs, Geneva, May 2018, available at: https://www.ipcc-nggip.iges.or.jp/public/mtdocs/1805_Geneva.html (last access: 19 April 2021), 2018.
Huang, L., Brook, J. R., Zhang, W., Li, S. M., Graham, L., Ernst, D., Chivulescu, A., and Lu, G.: Stable isotope measurements of carbon fractions () in airborne particulate: A new dimension for source characterization and apportionment, Atmos. Environ., 40, 2690–2705, https://doi.org/10.1016/j.atmosenv.2005.11.062, 2006.
Huang, L., Gong, S. L., Sharma, S., Lavoué, D., and Jia, C. Q.: A trajectory analysis of atmospheric transport of black carbon aerosols to Canadian high Arctic in winter and spring (1990–2005), Atmos. Chem. Phys., 10, 5065–5073, https://doi.org/10.5194/acp-10-5065-2010, 2010.
Huang, L., Chivulescu, A., Ernst, D., Zhang, W., Norman, A.-L., and Lee, Y.-S.: Maintaining consistent traceability in high-precision isotope measurements of CO2: a way to verify atmospheric trends of δ13C and δ18O, Atmos. Meas. Tech., 6, 1685–1705, https://doi.org/10.5194/amt-6-1685-2013, 2013.
Janssen, N. A., Gerlofs-Nijland, M. E., Lanki, T., Salonen, R. O., Cassee, F., Hoek, G., Fischer, P., Brunekreef, B., and Krzyzanowski, M.: Health effects of black carbon, WHO Regional Office for Europe, Copenhagen, Denmark, 2012.
Jimenez, J. L., Canagaratna, M. R., Donahue, N. M., Prevot, A. S. H., Zhang, Q., Kroll, J. H., DeCarlo, P. F., Allan, J. D., Coe, H., Ng, N. L., Aiken, A. C., Docherty, K. S., Ulbrich, I. M., Grieshop, A. P., Robinson, A. L., Duplissy, J., Smith, J. D., Wilson, K. R., Lanz, V. A., Hueglin, C., Sun, Y. L., Tian, J., Laaksonen, A., Raatikainen, T., Rautiainen, J., Vaattovaara, P., Ehn, M., Kulmala, M., Tomlinson, J. M., Collins, D. R., Cubison, M. J., Dunlea, E. J., Huffman, J. A., Onasch, T. B., Alfarra, M. R., Williams, P. I., Bower, K., Kondo, Y., Schneider, J., Drewnick, F., Borrmann, S., Weimer, S., Demerjian, K., Salcedo, D., Cottrell, L., Griffin, R., Takami, A., Miyoshi, T., Hatakeyama, S., Shimono, A., Sun, J. Y., Zhang, Y. M., Dzepina, K., Kimmel, J. R., Sueper, D., Jayne, J. T., Herndon, S. C., Trimborn, A. M., Williams, L. R., Wood, E. C., Middlebrook, A. M., Kolb, C. E., Baltensperger, U., and Worsnop, D. R.: Evolution of organic aerosols in the atmosphere, Science, 326, 1525–1529, https://doi.org/10.1126/science.1180353, 2009.
Kanakidou, M., Seinfeld, J. H., Pandis, S. N., Barnes, I., Dentener, F. J., Facchini, M. C., Van Dingenen, R., Ervens, B., Nenes, A., Nielsen, C. J., Swietlicki, E., Putaud, J. P., Balkanski, Y., Fuzzi, S., Horth, J., Moortgat, G. K., Winterhalter, R., Myhre, C. E. L., Tsigaridis, K., Vignati, E., Stephanou, E. G., and Wilson, J.: Organic aerosol and global climate modelling: a review, Atmos. Chem. Phys., 5, 1053–1123, https://doi.org/10.5194/acp-5-1053-2005, 2005.
Laskin, A., Laskin, J., and Nizkorodov, S. A.: Chemistry of Atmospheric Brown Carbon, Chem. Rev., 115, 4335–4382, https://doi.org/10.1021/cr5006167, 2015.
Leaitch, W. R., Sharma, S., Huang, L., Toom-Sauntry, D., Chivulescu, A., Macdonald, A. M., von Salzen, K., Pierce, J. R., Bertram, A. K., Schroder, J. C., Shantz, N. C., Chang, R. Y.-W., and Norman, A.-L.: Dimethyl sulfide control of the clean summertime Arctic aerosol and cloud, Elementa, 1, 000017, https://doi.org/10.12952/journal.elementa.000017, 2013.
Leaitch, W. R., Russell, L. M., Liu, J., Kolonjari, F., Toom, D., Huang, L., Sharma, S., Chivulescu, A., Veber, D., and Zhang, W.: Organic functional groups in the submicron aerosol at 82.5∘ N, 62.5∘ W from 2012 to 2014, Atmos. Chem. Phys., 18, 3269–3287, https://doi.org/10.5194/acp-18-3269-2018, 2018.
Levin, I., Naegler, T., Kromer, B., Diehl, M., Francey, R. J., Gomez-Pelaez, A. J., Steele, L. P., Wagenbach, D., Weller, R., Worthy, D. E., and Deihl, M.: Observations and modelling of the global distribution and long-term trend of atmospheric 14CO2, Tellus B, 62, 26–46, 2010.
Liggio, J., Li, S. M., Hayden, K., Taha, Y. M., Stroud, C., Darlington, A., Drollette, B. D., Gordon, M., Lee, P., Liu, P., Leithead, A., Moussa, S. G., Wang, D., O'Brien, J., Mittermeier, R. L., Brook, J. R., Lu, G., Staebler, R. M., Han, Y., Tokarek, T. W., Osthoff, H. D., Makar, P. A., Zhang, J., Plata, D. L., and Gentner, D. R.: Oil sands operations as a large source of secondary organic aerosols, Nature, 534, 91–94, https://doi.org/10.1038/nature17646, 2016.
Meredith, W., Ascough, P. L., Bird, M. I., Large, D. J., Snape, C. E., Sun, Y., and Tilston, E. L.: Assessment of hydrprolysis as a method for the qualification of black carbon using standard reference materials, Geochim. Cosmochim. Aci, 97, 131–147, 2012.
Mouteva, G. O., Fahrni, S. M., Santos, G. M., Randerson, J. T., Zhang, Y.-L., Szidat, S., and Czimczik, C. I.: Accuracy and precision of 14C-based source apportionment of organic and elemental carbon in aerosols using the Swiss_4S protocol, Atmos. Meas. Tech., 8, 3729–3743, https://doi.org/10.5194/amt-8-3729-2015, 2015a.
Mouteva, G. O., Czimczik, C. I., Fahrni, S. M., Wiggins, E. B., Rogers, B. M., Veraverbeke, S., Xu, X., Santos, G. M., Henderson, J., Miller, C. E., and Randerson, J. T.: Black carbon aerosol dynamics and isotopic composition in Alaska linked with boreal fire emissions and depth of burn in organic soils, Global Biogeochem. Cy., 29, 1977–2000, https://doi.org/10.1002/2015GB005247, 2015b.
Pöschl, U.: Atmospheric aerosols: Composition, transformation, climate and health effects, Angew. Chem. Int. Edit., 44, 7520–7540, https://doi.org/10.1002/anie.200501122, 2005.
Putaud, J. P., Van Dingenen, R., Alastuey, A., Bauer, H., Birmili, W., Cyrys, J., Flentje, H., Fuzzi, S., Gehrig, R., Hansson, H. C., Harrison, R. M., Herrmann, H., Hitzenberger, R., Hüglin, C., Jones, A. M., Kasper-Giebl, A., Kiss, G., Kousa, A., Kuhlbusch, T. A. J., Löschau, G., Maenhaut, W., Molnar, A., Moreno, T., Pekkanen, J., Perrino, C., Pitz, M., Puxbaum, H., Querol, X., Rodriguez, S., Salma, I., Schwarz, J., Smolik, J., Schneider, J., Spindler, G., ten Brink, H., Tursic, J., Viana, M., Wiedensohler, A., and Raes, F.: A European aerosol phenomenology – 3: Physical and chemical characteristics of particulate matter from 60 rural, urban, and kerbside sites across Europe, Atmos. Environ., 44, 1308–1320, https://doi.org/10.1016/j.atmosenv.2009.12.011, 2010.
Reimer, P. J., Brown, T. A., and Reimer, R. W.: Discussion: Reporting and calibration of post bomb 14C data, Radiocarbon, 46, 1299–1304, 2004.
Ridley, D. A., Heald, C. L., Ridley, K. J., and Kroll, J. H.: Cause and consequences of decreasing atmeopheric organic aerosol in the United States, P. Natl. Acad. Sci. USA, 115, 290–295, https://doi.org/10.1073/pnas.1700387115, 2018.
Santos, G. M., Moore, R. B., Southon, J. R., Griffin, S., Hinger, E., and Zhang, D.: AMS 14C Sample Preparation at the KCCAMS/UCI Facility: Status Report and Performance of Small Samples, Radiocarbon, 49, 255–269, https://doi.org/10.1017/S0033822200042181, 2007a.
Santos, G. M., Southon, J. R., Griffin, S., Beaupre, S. R., and Druffel, E. R. M.: Ultra small-mass AMS 14C sample preparation and analyses at KCCAMS/UCI Facility, Nucl. Instrum. Meth. B, 259, 293–302, 2007b.
Santos, G. M., Southon, J. R., Drenzek, N. J., Ziolkowski, L. A., Druffel, E. R. M., Xu, X., Zhang, D., Trumbore, S. E., Eglinton, T. I., and Hughen, K. A.: Blank assessment for ultra-small radiocarbon samples, Radiocarbon, 52, 1322–1335, 2010.
Sharma, S., Leaitch, W. R., Huang, L., Veber, D., Kolonjari, F., Zhang, W., Hanna, S. J., Bertram, A. K., and Ogren, J. A.: An evaluation of three methods for measuring black carbon in Alert, Canada, Atmos. Chem. Phys., 17, 15225–15243, https://doi.org/10.5194/acp-17-15225-2017, 2017.
Shrivastava, M., Cappa, C. D., Fan, J., Goldstein, A. H., Guenther, A. B., Jimenez, J. L., Kuang, C., Laskin, A., Martin, S. T., Ng, N. L., and Petaja, T.: Recent advances in understanding secondary organic aerosol: Implications for global climate forcing, Rev. Geophys., 55, 509–559, 2017.
Stuiver, M. and Polach, H. A.: Discussion Reporting of 14C Data, Radiocarbon, 19, 355–363, https://doi.org/10.1017/S0033822200003672, 1977.
Szidat, S., Jenk, T. M., Gäggeler, H. W., Synal, H.-A., Hajdas, I., Bonani, G., and Saurer, M.: THEODORE, a two-step heating system for the EC/OC determination of radiocarbon (14C) in the environment, Nucl. Instrum. Meth. B, 223–224, 829–836, 2004.
Szidat, S., Jenk, T. M., Synal, H.-A., Kalberer, M., Wacker, L., Hajdas, I., Kasper-Giebl, A., and Baltensperger, U.: Contributions of fossil fuel, biomass-burning, and biogenic emissions to carbonaceous aerosols in Zurich as traced by 14C, J. Geophys. Res., 111, D07206, https://doi.org/10.1029/2005JD006590, 2006.
Trumbore, S. E., Sierra, C. A., and Hicks Pries, C. E.: Radiocarbon Nomenclature, Theory, Models, and Interpretation: Measuring Age, Determining Cycling Rates, and Tracing Source Pools, in: Radiocarbon and Climate Change: Mechanisms, Applications and Laboratory Techniques, edited by: Schuur, E. A. G., Druffel, E., and Trumbore, S. E., Springer International Publishing, Cham, 45–82, 2016.
Watson, J. G., Chen, L. A., Chang, O., Chow, J. C., Watson, J. G., Chen, L. A., Chang, M. C. O., Robinson, N. F., Trimble, D., and Kohl, S.: The IMPROVE_A Temperature Protocol for Thermal/Optical Carbon Analysis: Maintaining Consistency with a Long-Term Database, Air Waste Manage., 57, 1014–1023, https://doi.org/10.3155/1047-3289.57.9.1014, 2007.
Wex, H., Huang, L., Zhang, W., Hung, H., Traversi, R., Becagli, S., Sheesley, R. J., Moffett, C. E., Barrett, T. E., Bossi, R., Skov, H., Hünerbein, A., Lubitz, J., Löffler, M., Linke, O., Hartmann, M., Herenz, P., and Stratmann, F.: Annual variability of ice-nucleating particle concentrations at different Arctic locations, Atmos. Chem. Phys., 19, 5293–5311, https://doi.org/10.5194/acp-19-5293-2019, 2019.
Wiggins, E. B., Czimczik, C. I., Santos, G. M., Chen, Y., Xu, X., Holden, S. R., Randerson, J. T., Harvey, C. F., Kai, F. M., and Yu, L. E.: Smoke radiocarbon measurements from Indonesian fires provide evidence for burning of millennia-aged peat, P. Natl. Acad. Sci. USA, 115, 12419–12424, https://doi.org/10.1073/pnas.1806003115, 2018.
Willis, M. D., Healy, R. M., Riemer, N., West, M., Wang, J. M., Jeong, C.-H., Wenger, J. C., Evans, G. J., Abbatt, J. P. D., and Lee, A. K. Y.: Quantification of black carbon mixing state from traffic: implications for aerosol optical properties, Atmos. Chem. Phys., 16, 4693–4706, https://doi.org/10.5194/acp-16-4693-2016, 2016.
Winiger, P., Andersson, A., Eckhardt, S., Stohl, A., and Gustafsson, O.: The sources of atmospheric black carbon at a European gateway to the Arctic, Nat. Commun., 7, 12772, https://doi.org/10.1038/ncomms12776, 2016.
Winiger, P., Andersson, A., Eckhardt, S., Stohl, A., Semiletov, I. P., Dudarev, O. V., Charkin, A., Shakhova, N., Klimont, Z., Heyes, C., and Gustafsson, Ö.: Siberian Arctic black carbon sources constrained by model and observation, P. Natl. Acad. Sci. USA, 114, E1054–E1061, https://doi.org/10.1073/pnas.1613401114, 2017.
Winiger, P., Barrett, T. E., Sheesley, R. J., Huang, L., Sharma, S., Barrie, L. A., Yttri, K. E., Evangeliou, N., Eckhardt, S., Stohl, A., Klimont, Z., Heyes, C., Semiletov, I. P., Dudarev, O. V., Charkin, A., Shakhova, N., Holmstrand, H., Andersson, A., and Gustafsson, Ö.: Source apportionment of circum-Arctic atmospheric black carbon from isotopes and modeling, Science Advances, 5, eaau8052, https://doi.org/10.1126/sciadv.aau8052, 2019.
Xu, J.-W., Martin, R. V., Morrow, A., Sharma, S., Huang, L., Leaitch, W. R., Burkart, J., Schulz, H., Zanatta, M., Willis, M. D., Henze, D. K., Lee, C. J., Herber, A. B., and Abbatt, J. P. D.: Source attribution of Arctic black carbon constrained by aircraft and surface measurements, Atmos. Chem. Phys., 17, 11971–11989, https://doi.org/10.5194/acp-17-11971-2017, 2017.
Xu, X., Trumbore, S. E., Zheng, S., Southon, J. R., McDuffee, K. E., Luttgen, M., and Liu, J. C.: Modifying a sealed tube zinc reduction method for preparation of AMS graphite targets: Reducing background and attaining high precision, Nucl. Instrum. Meth. B, 259, 320–329, https://doi.org/10.1016/j.nimb.2007.01.175, 2007.
Yang, F., Huang, L., Duan, F., Zhang, W., He, K., Ma, Y., Brook, J. R., Tan, J., Zhao, Q., and Cheng, Y.: Carbonaceous species in PM2.5 at a pair of rural/urban sites in Beijing, 2005–2008, Atmos. Chem. Phys., 11, 7893–7903, https://doi.org/10.5194/acp-11-7893-2011, 2011a.
Yang, F., Tan, J., Zhao, Q., Du, Z., He, K., Ma, Y., Duan, F., Chen, G., and Zhao, Q.: Characteristics of PM2.5 speciation in representative megacities and across China, Atmos. Chem. Phys., 11, 5207–5219, https://doi.org/10.5194/acp-11-5207-2011, 2011b.
Zencak, Z., Elmquist, M., and Gustafsson, Ö.: Quantification and radiocarbon source apportionment of black carbon in atmospheric aerosols using the CTO-375 method, Atmos. Environ., 41, 7895–7906, 2007.
Zhang, X., Li, J., Mo, Y., Shen, C., Ding, P., Wang, N., Zhu, S., Cheng, Z., He, J., Tian, Y., Gao, S., Zhou, Q., Tian, C., Chen, Y., and Zhang, G.: Isolation and radiocarbon analysis of elemental carbon in atmospheric aerosols using hydropyrolysis, Atmos. Environ., 198, 381–386, https://doi.org/10.1016/j.atmosenv.2018.11.005, 2019.
Zhang, X. Y., Wang, Y. Q., Zhang, X. C., Guo, W., and Gong, S. L.: Carbonaceous aerosol composition over various regions of China during 2006, J. Geophys. Res., 113, D14111, https://doi.org/10.1029/2007JD009525, 2008.
Zhang, Y. L., Perron, N., Ciobanu, V. G., Zotter, P., Minguillón, M. C., Wacker, L., Prévôt, A. S. H., Baltensperger, U., and Szidat, S.: On the isolation of OC and EC and the optimal strategy of radiocarbon-based source apportionment of carbonaceous aerosols, Atmos. Chem. Phys., 12, 10841–10856, https://doi.org/10.5194/acp-12-10841-2012, 2012.