the Creative Commons Attribution 4.0 License.
the Creative Commons Attribution 4.0 License.
 | 19 May 2021
The design and development of a tuneable and portable radiation source for in situ spectrometer characterisation
Marek Šmíd
Geiland Porrovecchio
Jiří Tesař
Tim Burnitt
Luca Egli
Julian Grőbner
Petr Linduška
Martin Staněk
For spectroradiometers, the characterisation of their wavelength scale and spectral bandwidth underpins the quality of measured data substantially. This characterisation can be performed using metrology-grade tuneable monochromatic sources, which are currently available only in a few laboratories worldwide. Yet in numerous applications, only the in-field calibration is a feasible solution. We have designed and developed a tuneable and portable radiation source (TuPS) in the wavelength range from 300 to 350 nm for the in-field characterisation of Dobson spectrometers' wavelength scale and slit function, with standard uncertainties better than 0.02 nm in wavelength and with the bandwidth of emitted radiation smaller than 0.13 nm full width at half maximum (FWHM). The TuPS is designed such that only minor modifications of its optical system extend/shift its spectral range towards visible and near-infrared spectral regions and thus expand its application for characterisation of any spectroradiometers in the relevant spectral region of interest.
- Article
(1770 KB) - Full-text XML
- BibTeX
- EndNote


Dobson and Brewer spectrophotometers are the main instruments used to monitor the ozone layer, even though Dobson spectrophotometers are no longer being manufactured (Dobson, 1968; Kerr et al., 1981). Although each network type is in itself consistent, total column ozone retrieved from the two instrument types differs by up to 3 %, significantly larger than the consistency of better than ±0.5 %, which can be achieved within Brewer or Dobson spectrometer instruments' network (Vanicek, 2006; Vaníček et al., 2012). This large discrepancy currently precludes a merging of both datasets and an eventual replacement of one instrument with another type. As shown in Gröbner et al. (2021), the consistency can be significantly improved when using the actually measured line spread functions of a Dobson spectrophotometer, in conjunction with the cross-sections from IUP (Serdyuchenko et al., 2014). There is therefore a need for an improved characterisation and calibration of the Dobson and Brewer instruments, particularly by involving the reference instruments of each network. The bandwidths and wavelength-scale accuracy of the Dobson spectrophotometer are not known for each instrument but assumed to be equal to the world reference Dobson (Komhyr et al., 1993). Currently, tuneable monochromatic sources which could be used for characterisation of Dobsons and Brewers (Redondas et al., 2018) are complex and cumbersome systems that are only found in a few laboratories worldwide and cannot be used for in-field calibrations as requested by this global spectrometer network. Such laboratory-based characterisations were performed with a tuneable laser source (Komhyr et al., 1993) and more recently in CMI and PTB (Köhler et al., 2018) and requested typically a couple of days' time for each spectrometer plus additional time necessary for shipping of often heavy and large devices under test from their permanent in-field installation down to the metrology laboratory.
This work describes the design and development of a field tuneable and portable radiation source (TuPS) for the wavelength range 300 to 350 nm dedicated for an in-field characterisation of Dobson spectroradiometers' wavelength-scale accuracy and slit function measurement, providing uncertainties of better than 0.02 nm in the wavelength scale and emitting the output radiation with the bandwidth of approximately 0.1 nm and reports on its long-term temporal stability. Moreover, the TuPS design was such that only minor modifications of its optical system can extend or shift its spectral range towards visible and near-infrared spectral regions and thus expand its application for spectral characterisation of any spectrometers in the relevant spectral region of interest. To the best of our knowledge, there were no commercial monochromators available which could simultaneously meet the TuPS specifications for resolution, wavelength stability and portable size requirements.
The TuPS is composed of the combination of a broadband source and an optical tuneable dispersion system; the latter rejects all but a narrow wavelength band, thus rendering the combination of a narrow-band, tuneable source. The dispersion system is optically similar to a spectrometer but modified to act as a narrow-band tuneable filter for a broadband source. With regards to the spectral bandwidth and the uncertainty of the wavelength scale of emitted radiation, the requested parameters are given directly by the spectral dependence of the expected slit functions to be characterised. The values were set to 0.1 nm full width at half maximum (FWHM) for bandwidth and 0.05 nm or better in the uncertainty of setting the central wavelength of emitted radiation. The optimal level of total radiant flux emitted from TuPS was found experimentally during the laboratory-based characterisation of Dobson #074 (Köhler et al., 2018) as a value that ranges from 10 to 1000 nW for an output beam spectral bandwidth of 0.1 nm.
The optical layout was designed using the optical simulation tool Zemax® with the aim to design a tuning machine that uses exclusively commercially available off-the-shelf optomechanical components and that provides the high spectral accuracy, the narrow bandwidth and the necessary optical power required by the Dobson. A further constraint was on the TuPS physical dimensions requiring it to be being easily transportable such that it could be used for in-field characterisation of Dobson spectrophotometers.
The schematic diagram of the resulting layout of the TuPS dispersion system is shown in Fig. 1.
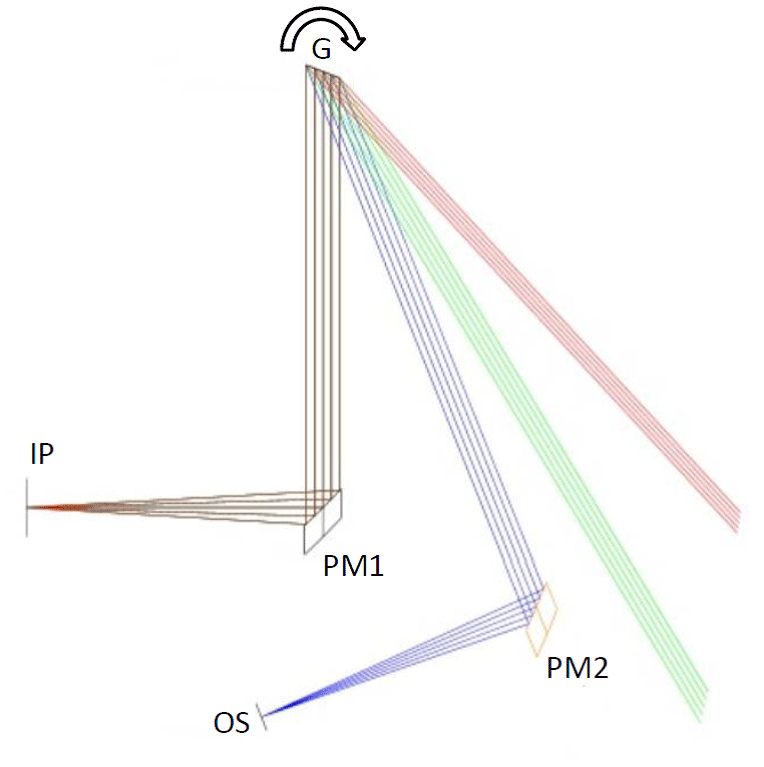
It consists of a 100 µm input pinhole (IP), a 100 µm vertically oriented output slit (OS), two identical 90∘ off-axis parabolic mirrors, 25 mm diameter and 203.2 mm effective focal length (PM1 and PM2), and 3600 grooves/mm grating 25 mm across, optimised for a spectral range of interest. Radiation from the input pinhole is collimated by a parabolic mirror and illuminates the grating. The resulting diffracted radiation is focussed by the second parabolic mirror forming a spectrum across the exit slit. The central output wavelength is controlled by the angle of the grating and the bandwidth by the width of the exit slit. A very small vertical shift in the image at the exit port is associated with the rotation of the grating. This shift is of no consequence to the subsequent use of the instrument other than that an exit pinhole may block some of the radiation as the image moves. Therefore, a vertically oriented exit slit is used instead. The input F-number is . The output F-number i varies with the wavelength. It ranges from at 300 nm to at 350 nm. An optical fibre-coupled high-intensity broadband UV discharge lamp (https://www.energetiq.com/ldls-laser-driven-light-source-products-energetiq, last access: 18 May 2021) was used as input radiation source. The system was designed such that the FWHM of emitted radiation did not exceed the value of 0.1 nm for the whole spectral range of interest.
The optical setup of the first prototype of TuPS is shown in Fig. 2.

The TuPS is built on a custom-made 400 mm × 400 mm optical board where the input pinhole, the first parabolic mirror and the output slit are mounted on high-precision micrometric linear stages to provide the fine adjustment needed to compensate for the focal length tolerance of the parabolic mirrors. Both parabolic mirrors and the grating are mounted on adjustable stages to adjust the mirrors' orientation angles for their optical alignment. The motorised rotation stage that sets the grating angle uses a high-resolution encoder with an accuracy of better than 0.001∘. The TuPS light engine is enclosed in a light, tight housing.
It is worth noting that the TuPS is designed such that only minor modifications of its optical system, involving mainly the selection of a suitable diffraction grating and the employment of an optimal set of order sorting filters at the input aperture side, can extend/shift the spectral range towards the visible and near-infrared spectral regions and thus expand its application for characterisation of any spectroradiometers in the relevant spectral region of interest.
The optical characterisation of TuPS light engine, both in terms of the central wavelength of its output radiation and the spectral bandwidth, was performed using the CMI reference tuneable monochromatic source consisting of the CMI fibre-coupled tuneable optical parametric oscillator laser facility (OPO). This system offers the tuneable laser operation over the spectral range from 250 to 2500 nm, whilst the spectral bandwidth of emitted laser beam does not exceed the value of 0.03 nm over the whole investigated spectral range of interest (https://ekspla.com/product/nt242-series-tunable-wavelength-nanosecond-lasers/#specifications, last access: 18 May 2021). The OPO tunability increment is 0.05 nm.
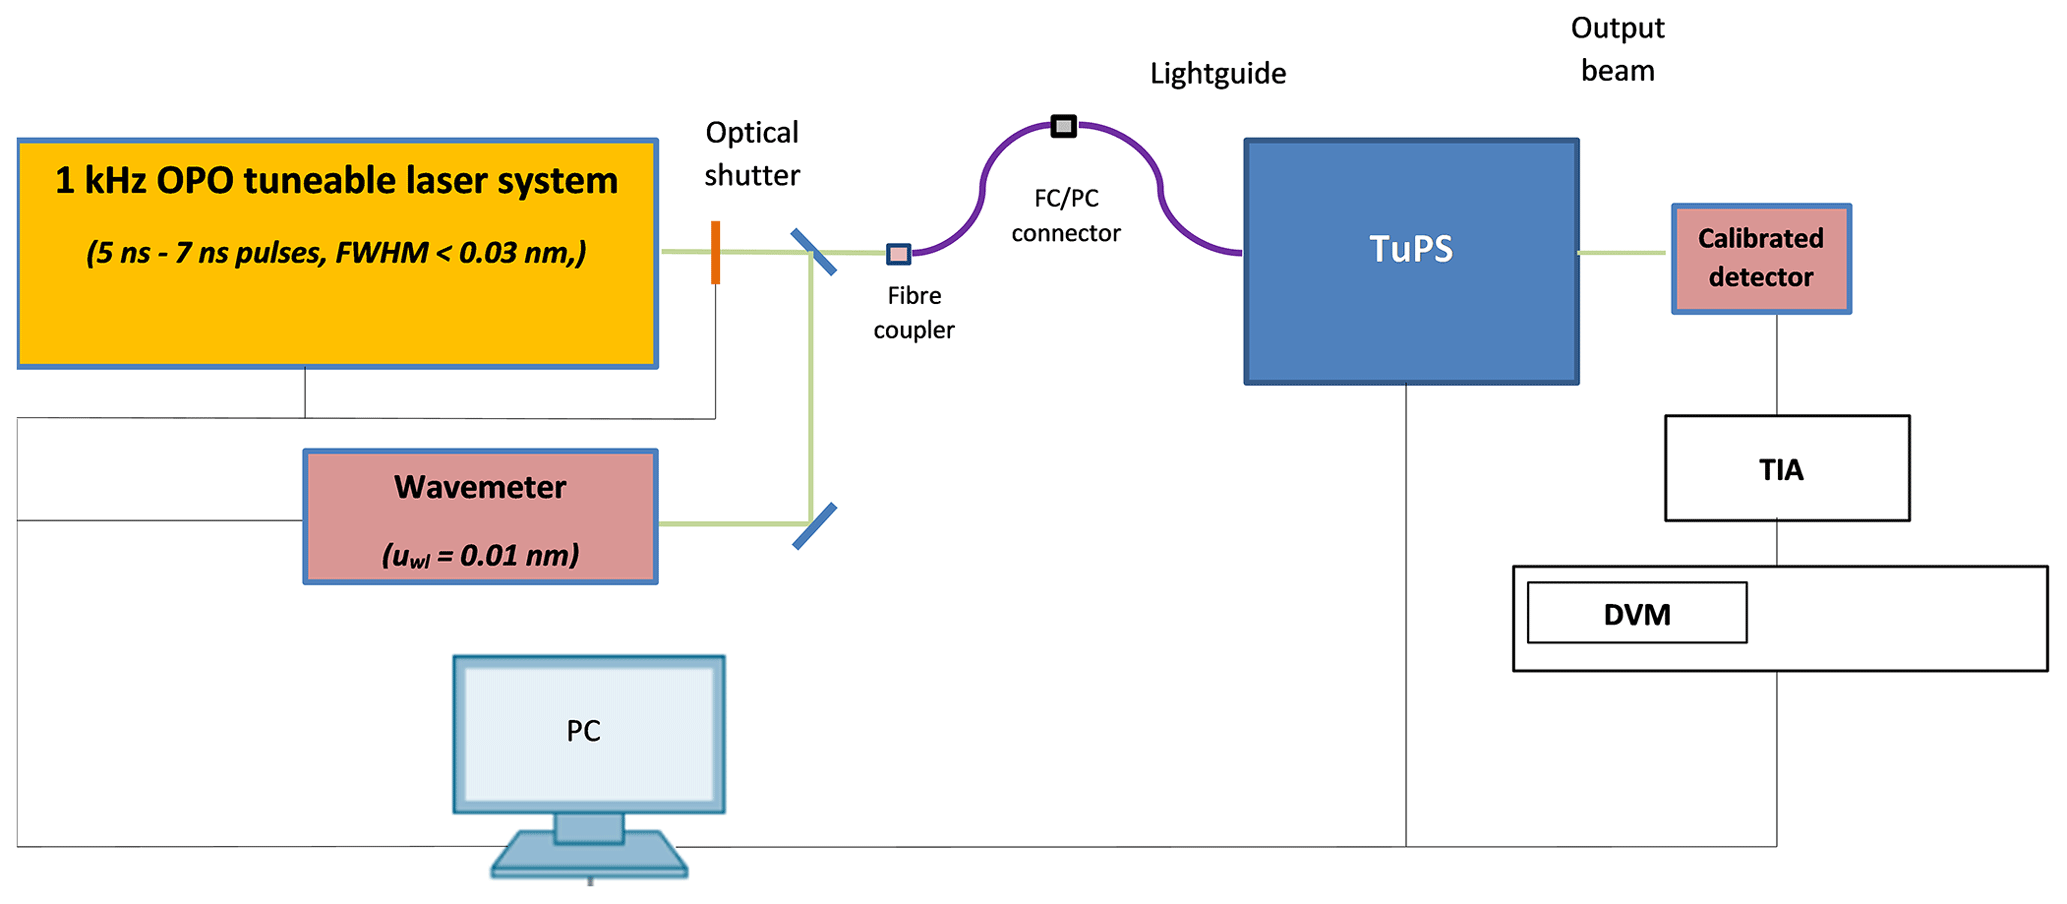
The OPO laser radiation wavelength and its stability are monitored by calibrated wavemeter, with accuracy better than 0.01 nm (Balling, et al., 2012). A schematic diagram of the measurement setup is shown in Fig. 3.
3.1 TuPS wavelength scale
As shown on the diagram, the power of optical radiation emitted from the TuPS output slit is measured by a calibrated 10 mm × 10 mm Si-based photodiode detector in conjunction with a calibrated transimpedance amplifier (TIA). The measurements are performed via setting the OPO laser wavelength on a desired value and measuring the power of optical radiation throughput at the TuPS output slit while scanning the grating angle in a set of 60 values around the expected angle with an angular step as low as 0.001∘. These measurements were repeatedly performed at wavelength regions ranging from 300 to 330 nm with a 5 nm step (in black in Fig. 4) plus the six typical values measured by the Dobson, i.e. 305.5, 311.5, 317.5, 325.0, 332.4, and 339.5 nm (in red in Fig. 4).
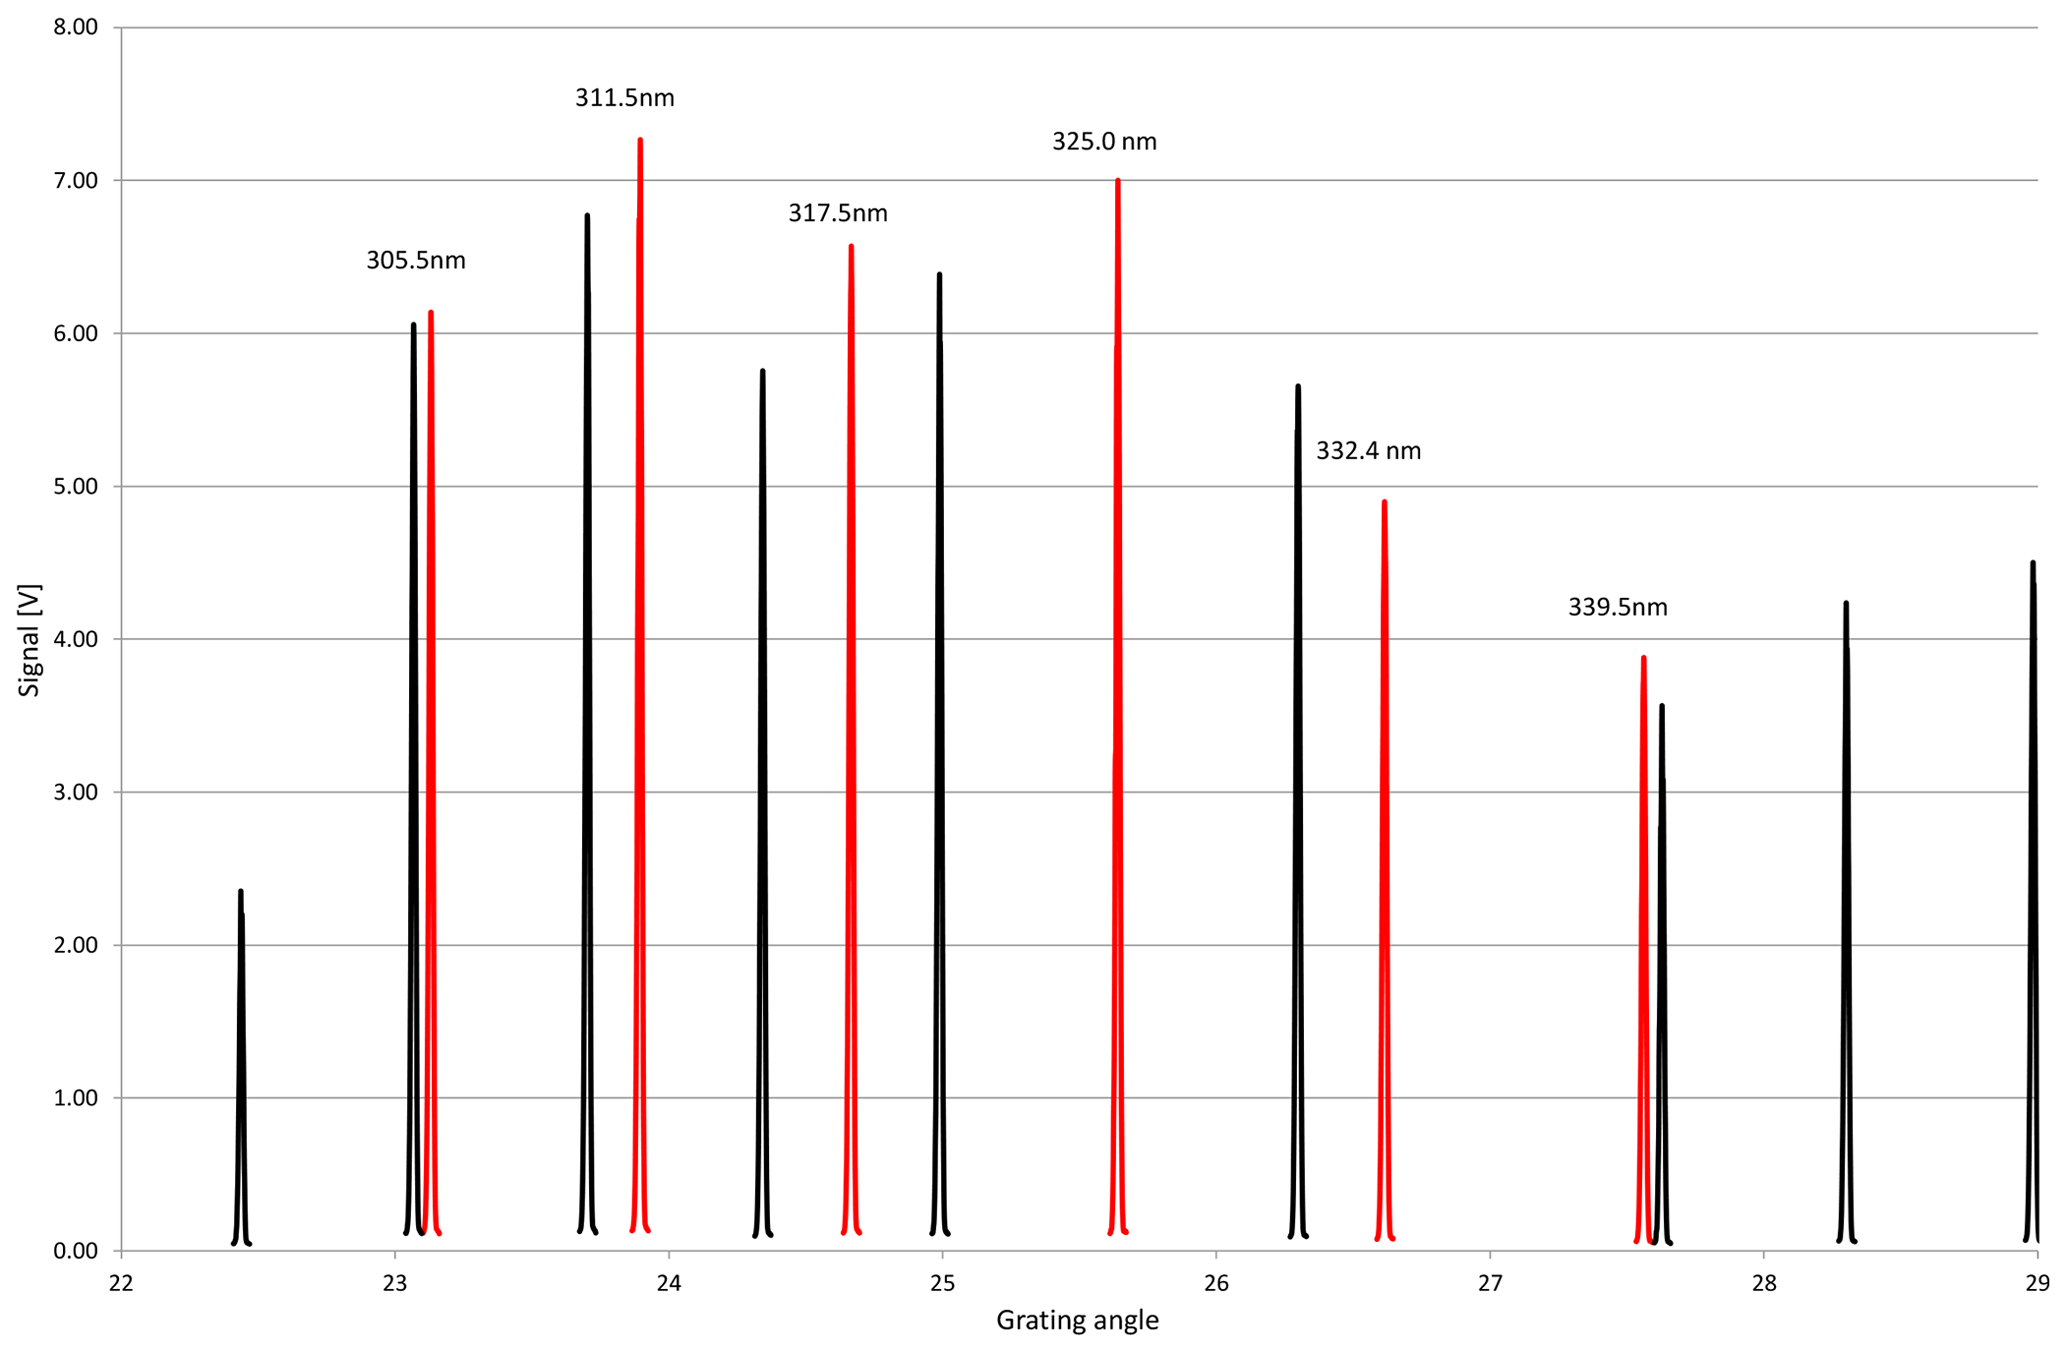
Figure 4TuPS wavelength calibration with CMI OPO facility. In red the values of interest for the Dobson spectrometer.
For each wavelength, the angular position of the peak Aλ relative to the wavemeter-corrected wavelength of the calibrating laser line λ is calculated using the centroid formula Eq. (1):
where Vi is the signal in volts measured at the grating angle Ai, and N is the number of measured values around each laser line (typically N=60). The resulting relationship between the TuPS grating rotation angle and the TuPS output radiation wavelength at the output slit (OS) is then determined.
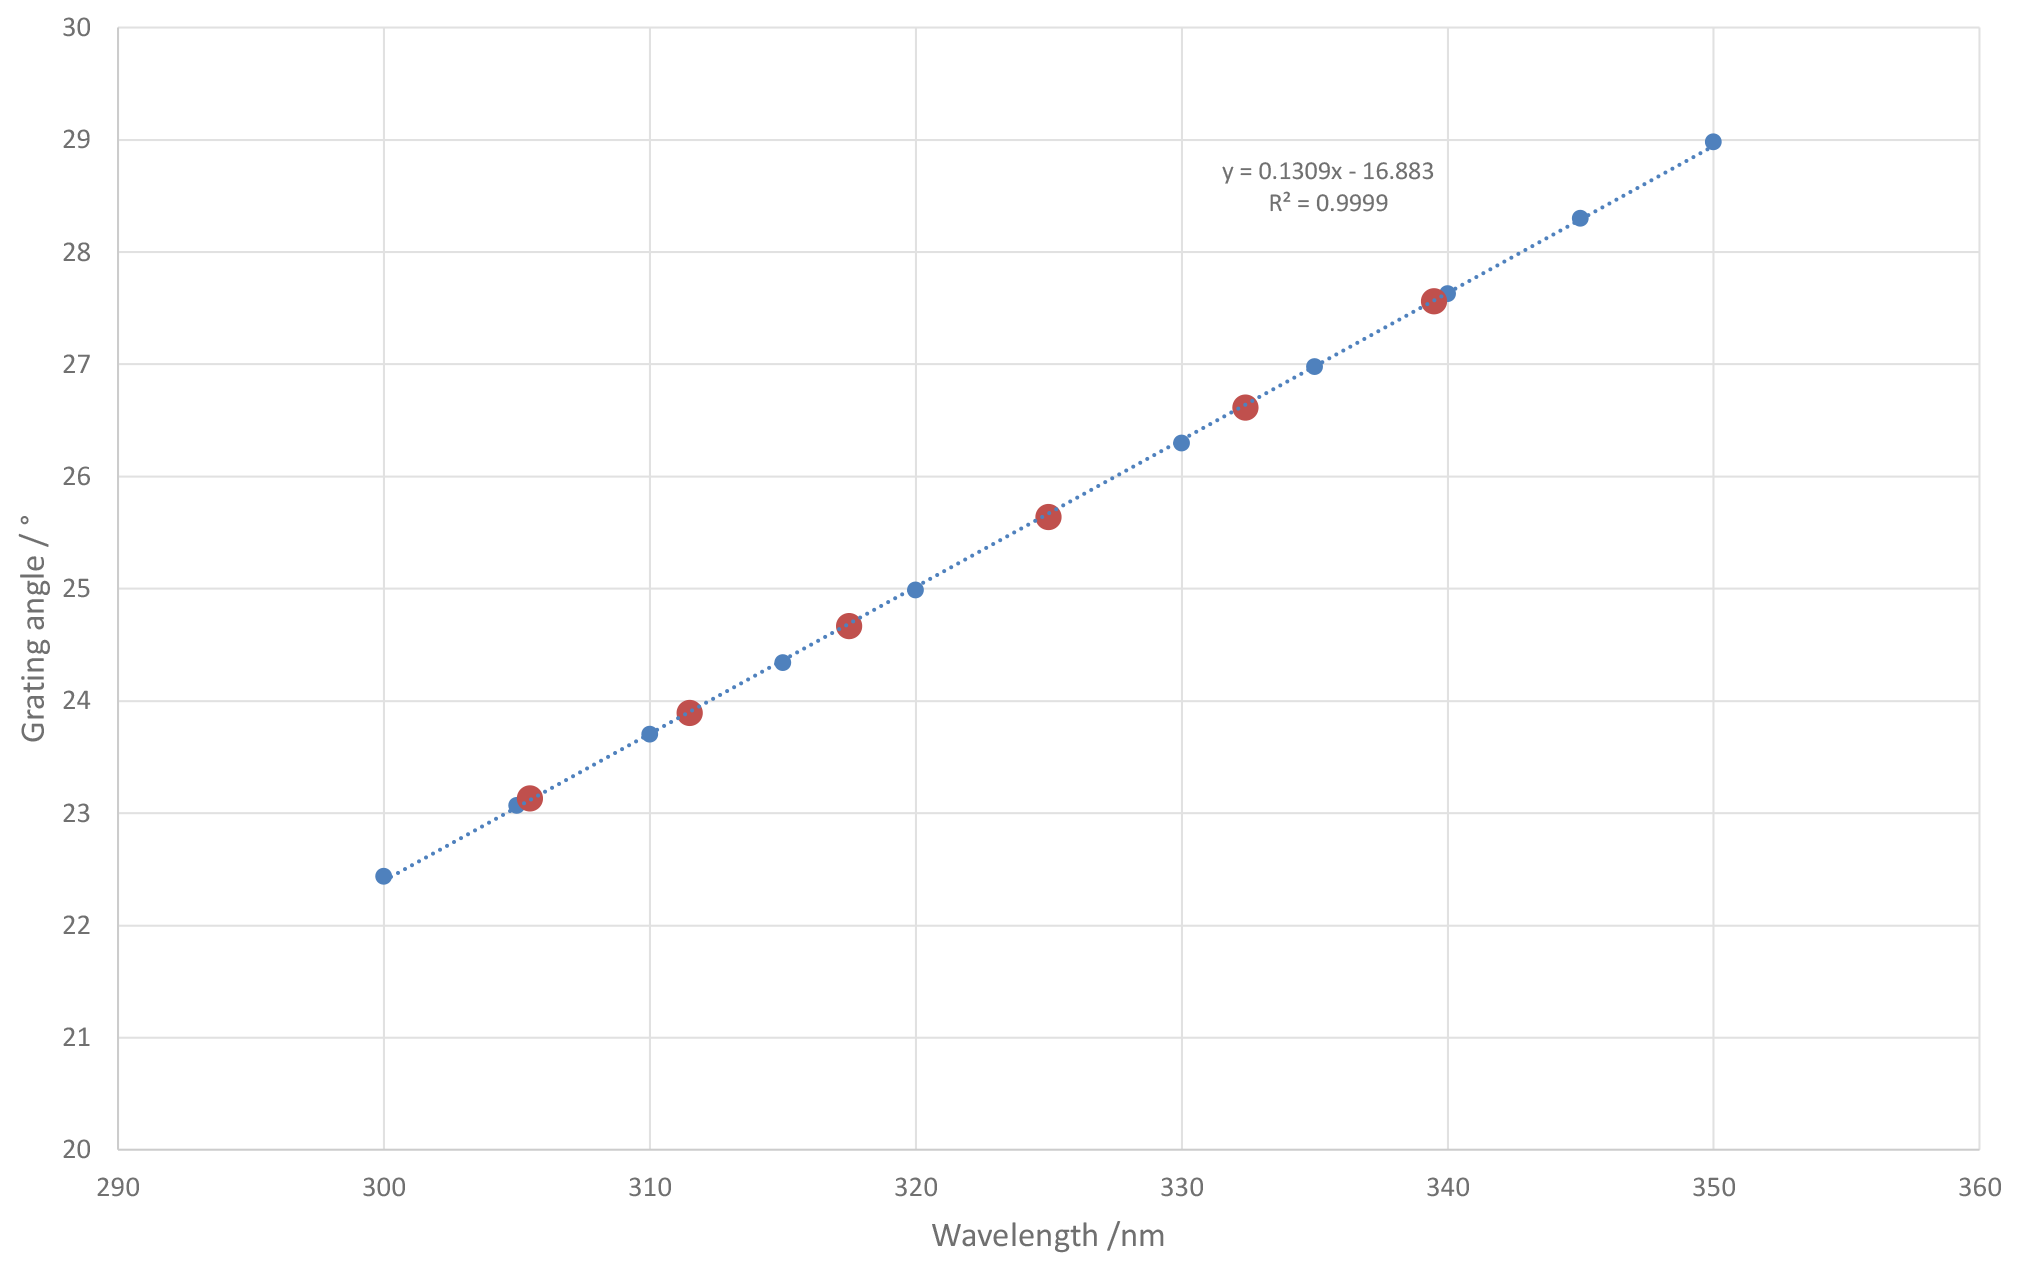
Figure 5TuPS wavelength calibration function. Red points represent red values reported in Fig. 4.
Although in general the relation between the rotation angle of diffraction grating and the central wavelength of the radiation emitted from the TuPS output slit does not follow a pure linear character, in the relatively narrow Dobson-required spectral range, the linear interpolation becomes a more than sufficient approximation. This is evident from Fig. 5 where we report the results of one particular TuPS wavelength-scale calibration process and where the coefficient of determination R squared reaches the value 0.9999. Consequently, the residual differences between TuPS set wavelength and measured central wavelength of emitted radiation after wavelength-scale calibration performed do not exceed the value of 0.01 nm over whole spectral range of interest. To investigate its repeatability, we performed series of repeated wavelength-scale calibrations. Results confirmed the repeatability of setting of the desired central wavelength scale of TuPS-emitted radiation at the value 0.006 nm (k=1).
It is worth noting that the TuPS wavelength scale is recalibrated before and after each in-field measurement campaign (as reported in Sect. 6 below), and based on the calibration results, the two linear interpolation parameters are readjusted. Potential differences are then accounted for as a temporal stability uncertainty contribution to the uncertainty budget associated with that in-field calibration campaign.
As for in-field portable equipment, its sensitivity to changing ambient conditions is crucial; we performed the characterisation of TuPS temperature dependence. We have provided the calibration of its wavelength scale in four different ambient temperatures ranging from 20 to 30 ∘C. The results have shown a small sensitivity of 0.007 nm ∘C−1 (k=1) in this temperature range. This can be explained by mechanical symmetry of the TuPS optical setup as well as its compact construction.
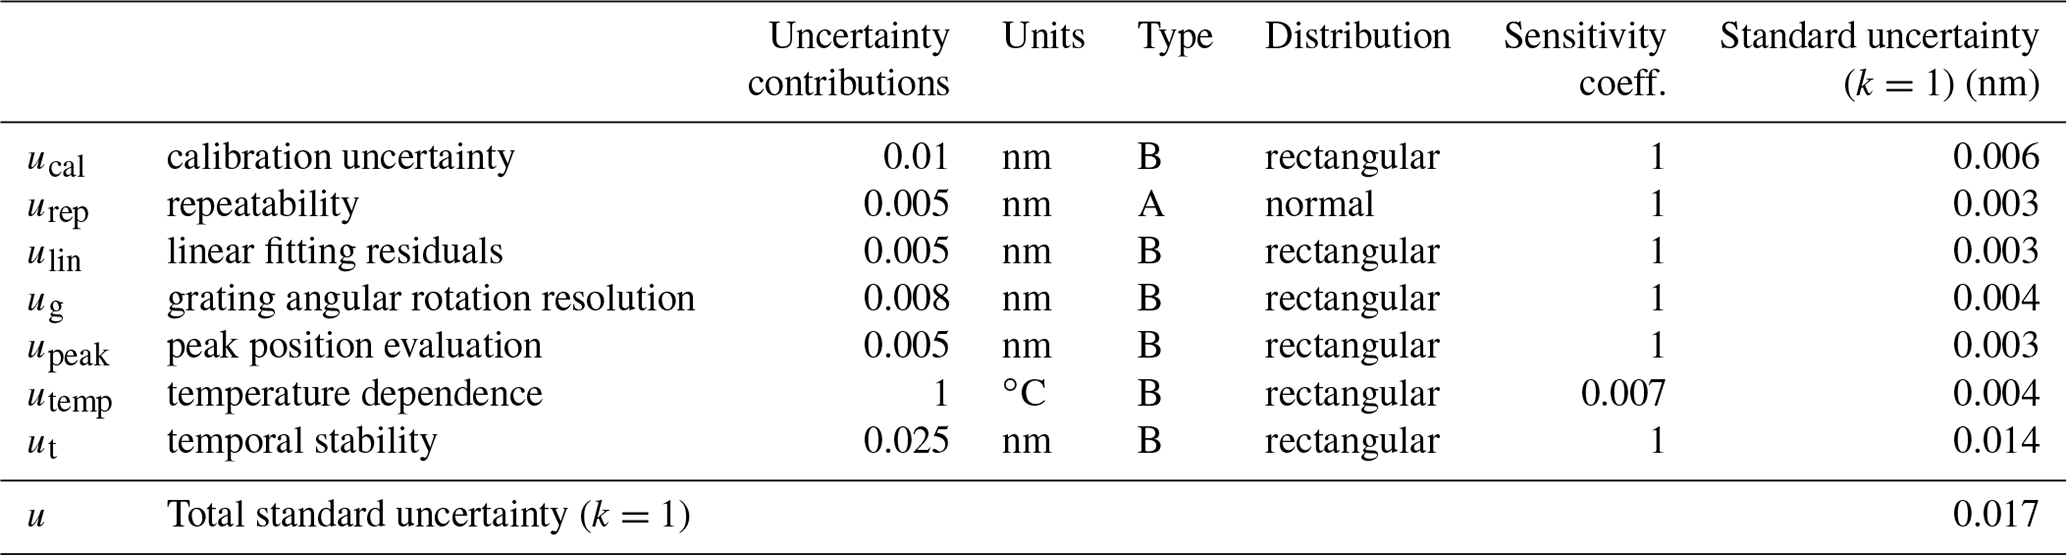
The evaluation of standard uncertainty of the TuPS wavelength scale (JCGM 100:2008(E), 2008) is reported in Table 3 in Sect. 6.
3.2 TuPS spectral bandwidth
Using the same dataset and the linear relationship between the grating angle and wavelength, it is also possible to easily assess the bandwidth performance of the TuPS. In Fig. 6 the TuPS bandwidth measurement performed at 305 nm using the OPO as monochromatic source is reported. The measured angular grating rotation of 0.015∘ corresponds to a spectral bandwidth of 0.12 nm. This presents a sufficient result, providing that we take into account that the measured Dobson spectral bandwidth is about 10 to 40 times larger. The design of TuPS optical setup was optimised such as it keeps the bandwidth of the output radiation close to constant over the specified spectral range. The measurement we provided proved a small increase of 0.01 nm with increasing wavelength ranging from 0.12 nm at 305 nm (Fig. 6) to 0.13 nm at 350 nm.
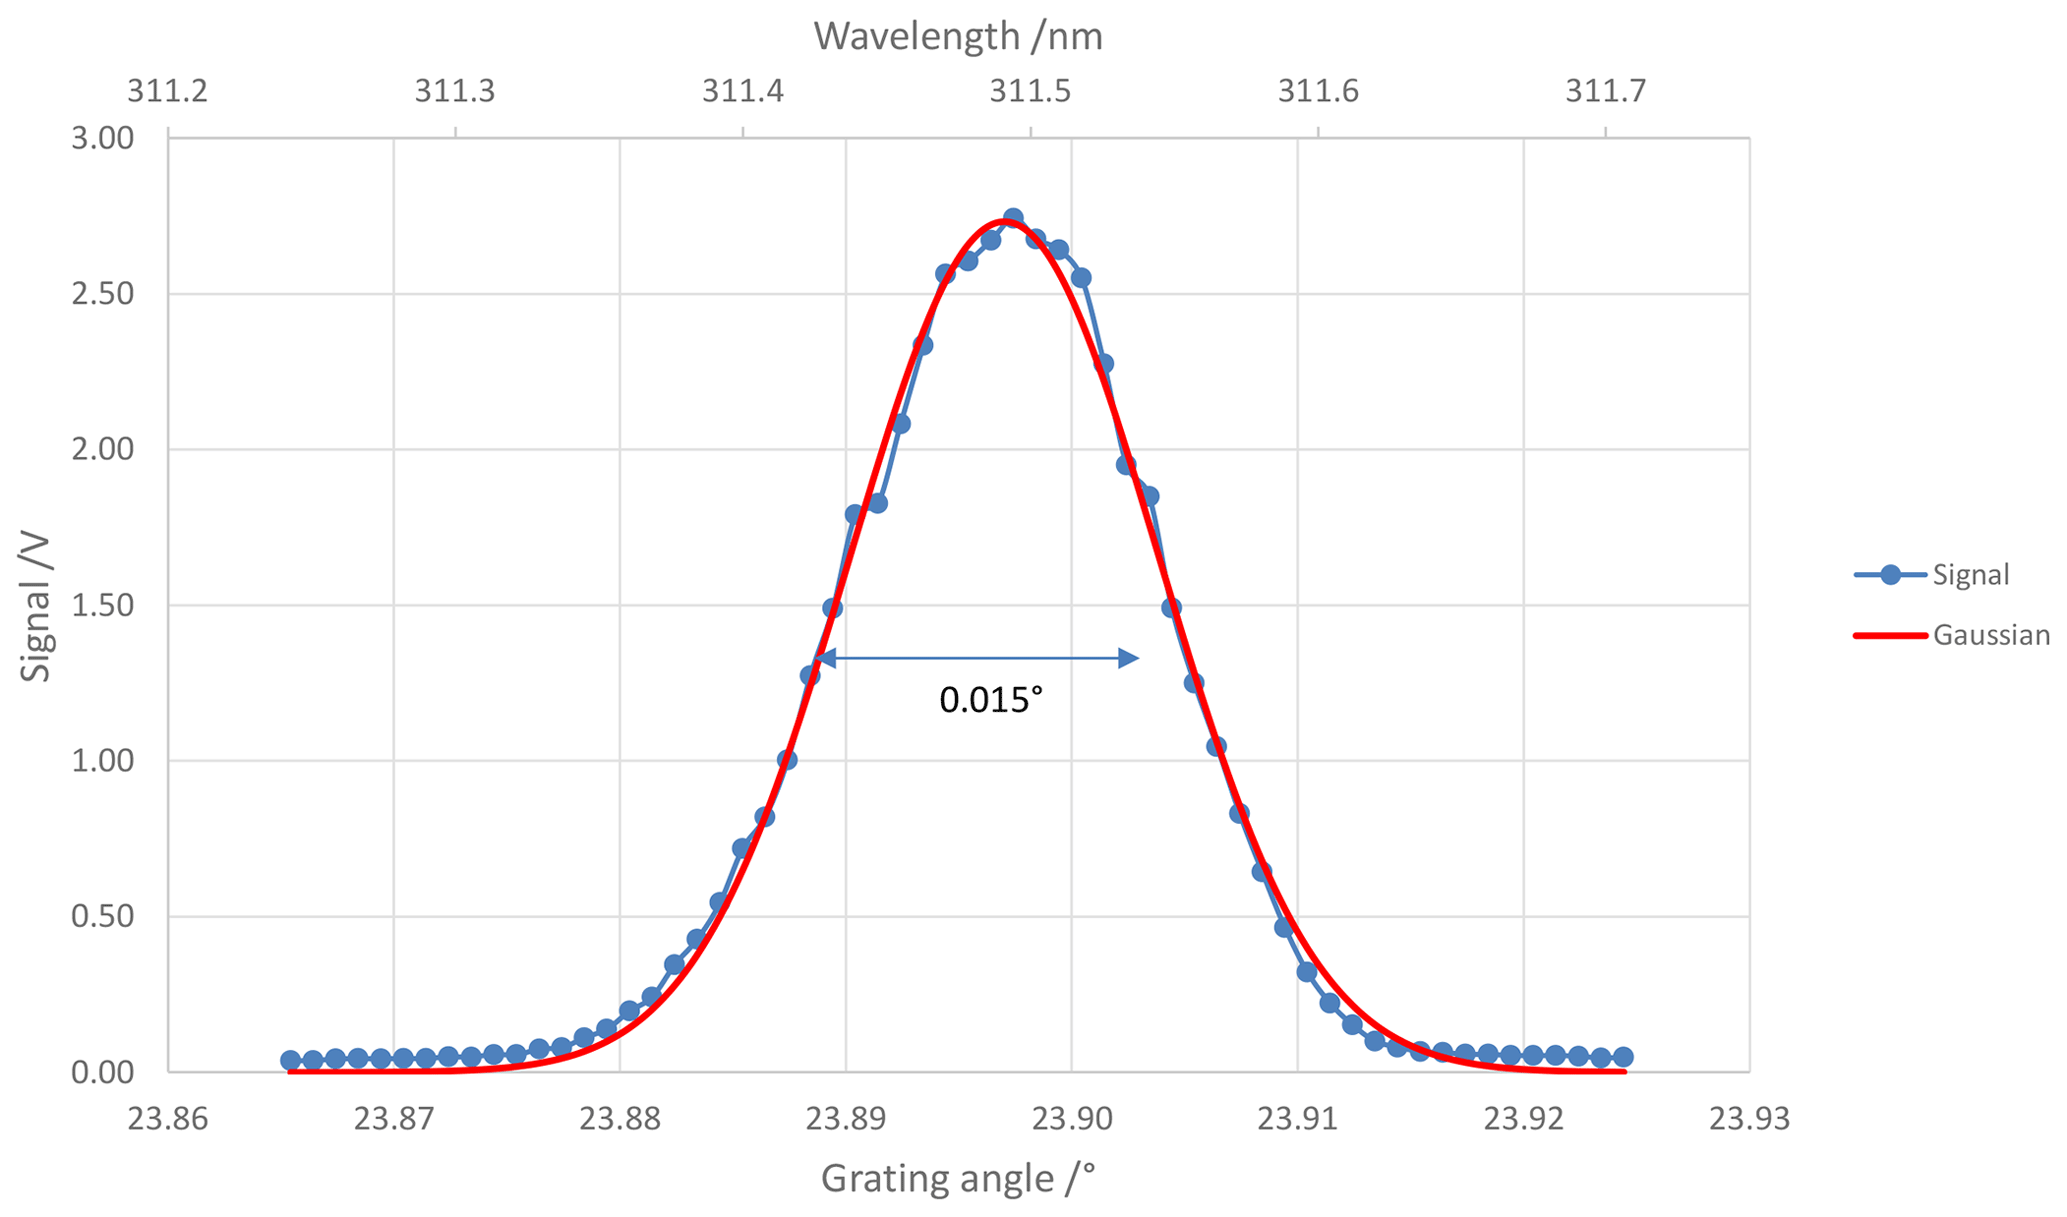
Figure 6TuPS bandwidth measurement performed at 305 nm. The width of the peak of 0.015∘ corresponds to spectral FWHM 0.12 nm.
Taking into account the uncertainty of the central wavelength of TuPS-emitted radiation (described above) and its bandwidth, the uncertainty of the measurement of spectral bandwidth (FWHM) for the Dobson spectrometer can be estimated to be as high as 0.05 nm.
3.3 TuPS optical output power
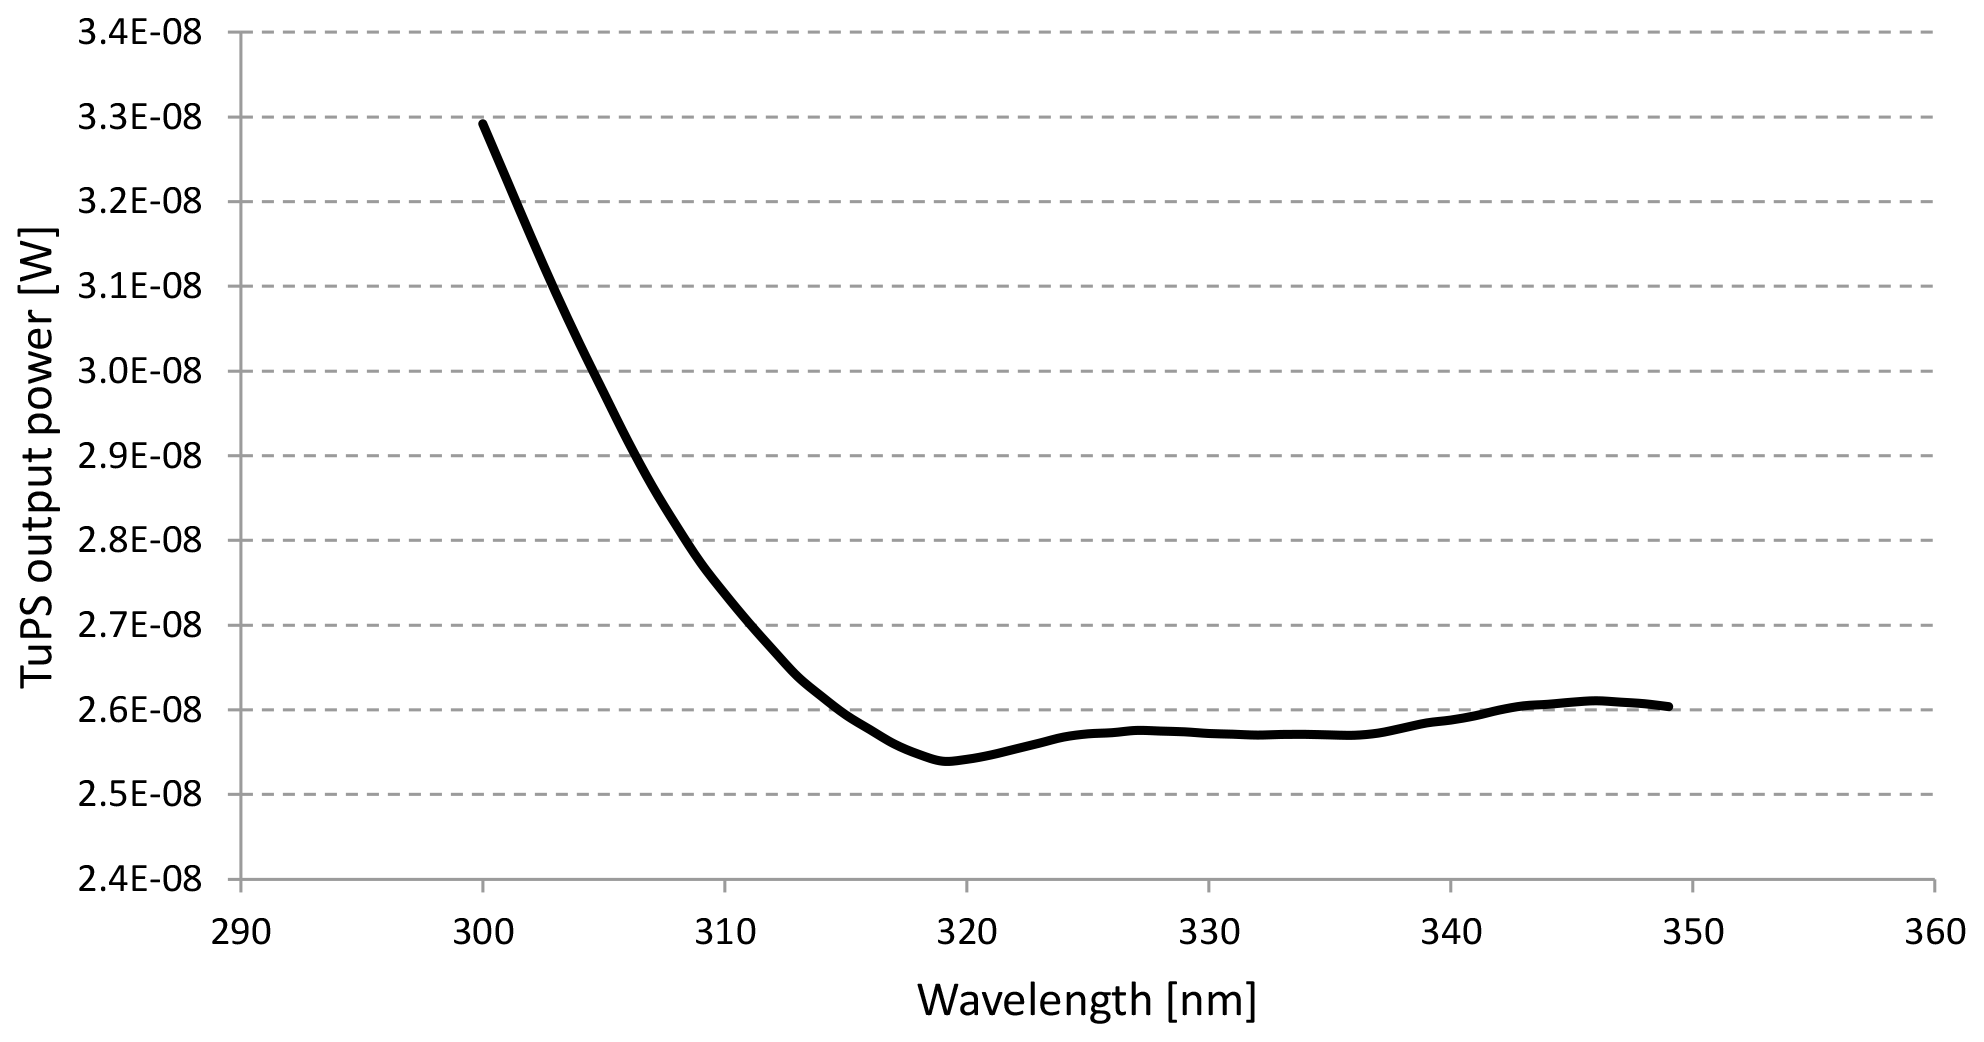
For the measurement of the optical radiation output power (optical throughput) of the TuPS light engine in the spectral region of interest, we connected the TuPS input fibre in the final operational configuration with a fibre-coupled high-intensity broadband UV discharge lamp.
A calibrated Si photodiode positioned at the TuPS output measured the power of the optical beam. Considering the output beam shape and its divergence angle, the position of calibrated detector was set such that its sensitive area was significantly under-filled. The photodiode photocurrent is converted by a calibrated transimpedance amplifier.
As shown in Fig. 7, the measured values are above 25 nW on 0.1 nm FWHM over the whole spectral range of interest. Based on the data acquired in CMI during the Dobson calibration performed with the CMI monochromator-based facility (Köhler et al., 2018), the optical power value of 20 nW is sufficiently intense to be detected by the Dobson with a convenient signal-to-noise ratio.
To perform the Dobson characterisation, the TuPS tuneable source is placed on top of the spectrometer so that its output is aligned with the Dobson entrance optics with the sun director removed. The optical coupling includes the Dobson entrance diffuser. The alignment between the two instruments is facilitated by the fact that the TuPS is provided with a telescopic cylinder that fits the Dobson entrance optics. The Dobson's photomultiplier current signal is measured by a digital multimeter (DMM) through the voltage drop across a 470 Ohm resistor present in the Dobson photomultiplier board. The Dobson is set to the highest sensitivity available (usually correspondent to a photomultiplier high voltage of 800 V). Potential stray light coming from the surrounding environment is minimised via covering the Dobson top outlets with light insulation fabric.
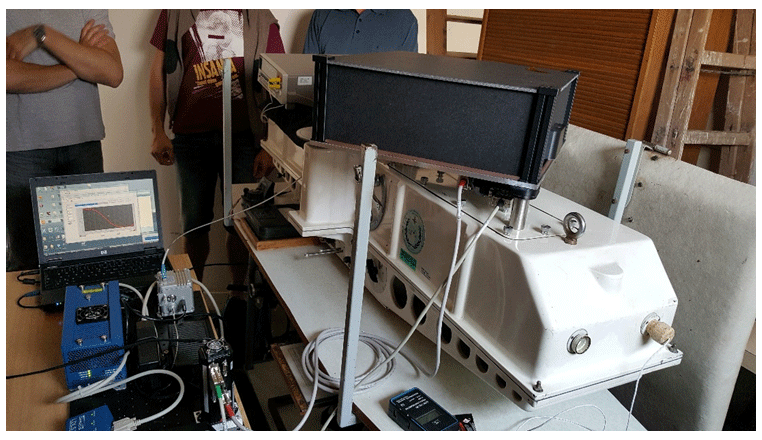
Figure 8TuPS in-field measurement arrangement (taken during the Dobson calibration in CHMI Hradec Kralove). On the right side – TuPS light engine coupled with the Dobson, in the bottom left corner – driving PC and fibre-coupled discharge UV broadband radiation source.
A typical TuPS in-field measurement arrangement is shown in Fig. 8.
To perform the comparison of the results of the TuPS in-field calibration of Dobson spectrometer with the laboratory-based characterisation, we carried out the in-field calibration of Dobson spectrometer #074 on its measuring side at the Czech Hydrometeorological Institute in Hradec Kralove, Czech Republic. The laboratory-based characterisation of the same Dobson #074 was performed earlier in CMI (Köhler, et al., 2018). These laboratory-based calibration measurements, carried out in 2016, require typically a couple of days' period for calibration itself plus additional time necessary for shipping of heavy and large devices under test from their permanent in-field installation down to the CMI metrology laboratory, in total typically a period of 1 week.
Compared to that, the in-field calibration in 2017 requested approximately 30 min time for installation of TuPS system and alignment of TuPs–Dobson coupling, another 30 min of warm-up time, and typically 1 h for measuring overall six typical bandpasses of the Dobson, i.e. 305.5, 311.5, 317.5, 325.0, 332.4, and 339.5 nm.
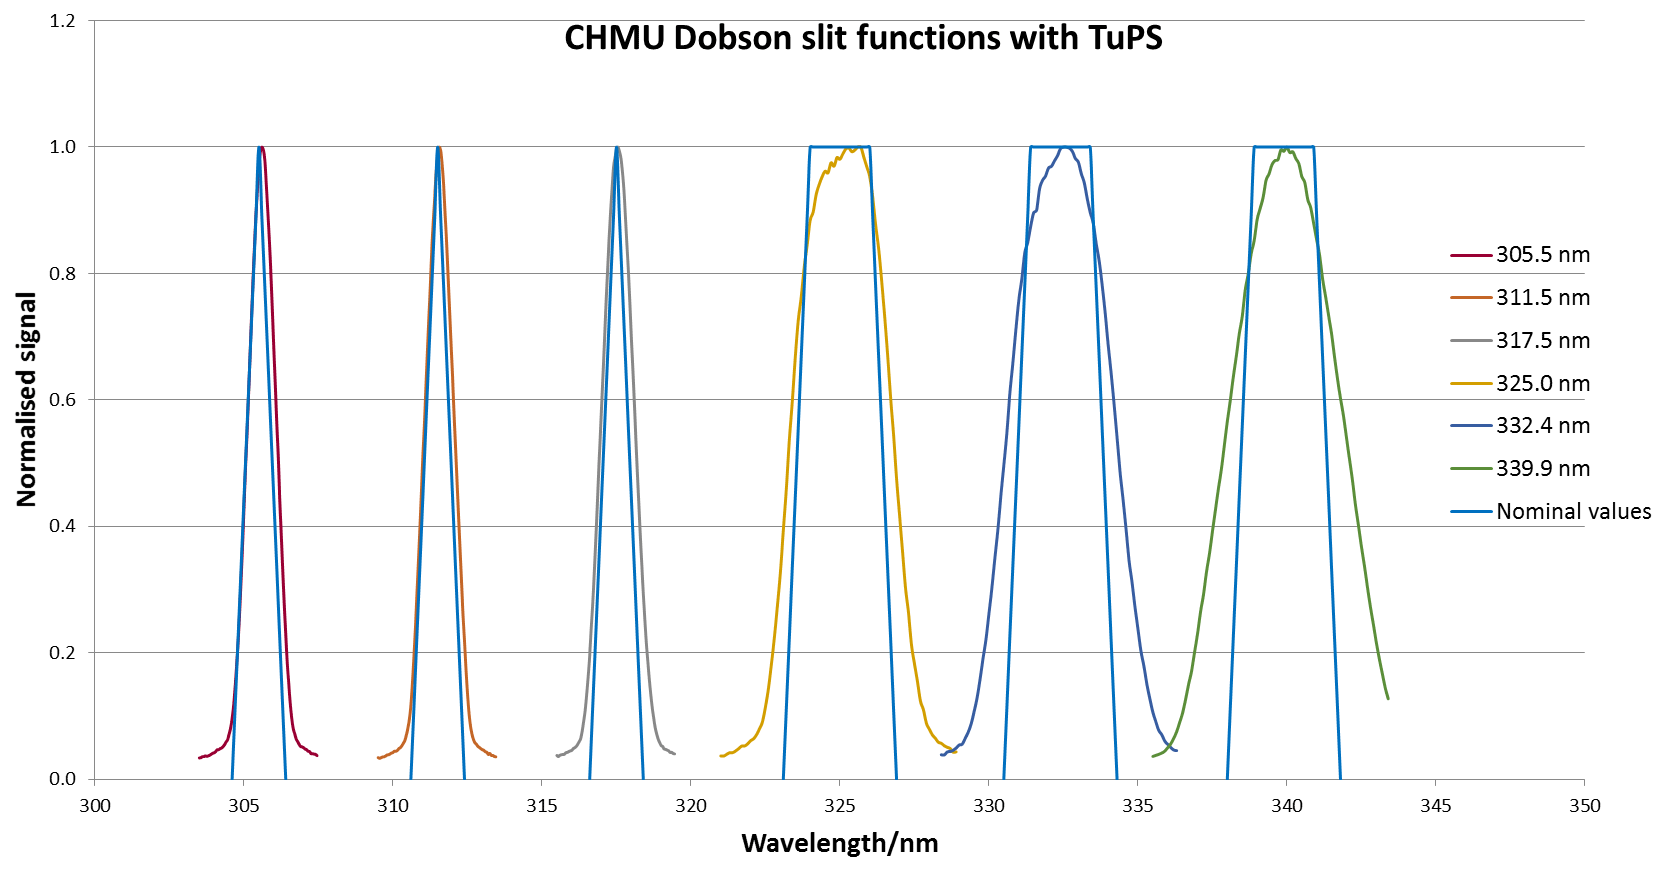
Figure 9Dobson #074 slit functions measured during the TuPS-based in-field characterisation.
Table 1Results of the TuPS-based in-field characterisation of Dobson #074.
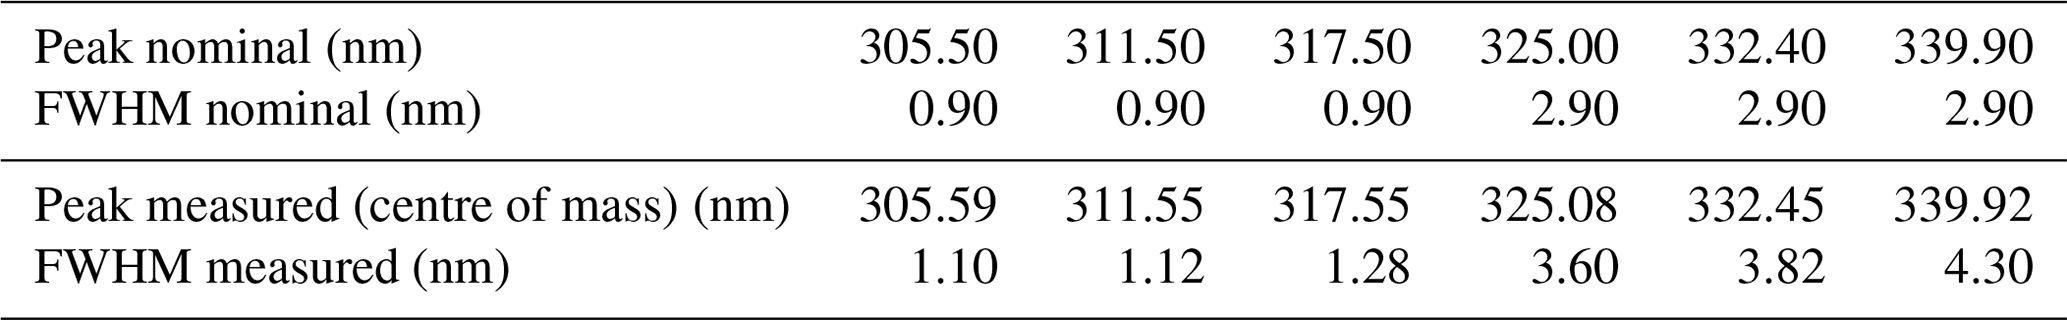
Calibration results are presented in the graph shown in Fig. 9, where all measured slit functions are shown after normalisation. The results are summarised in Table 1 as well.
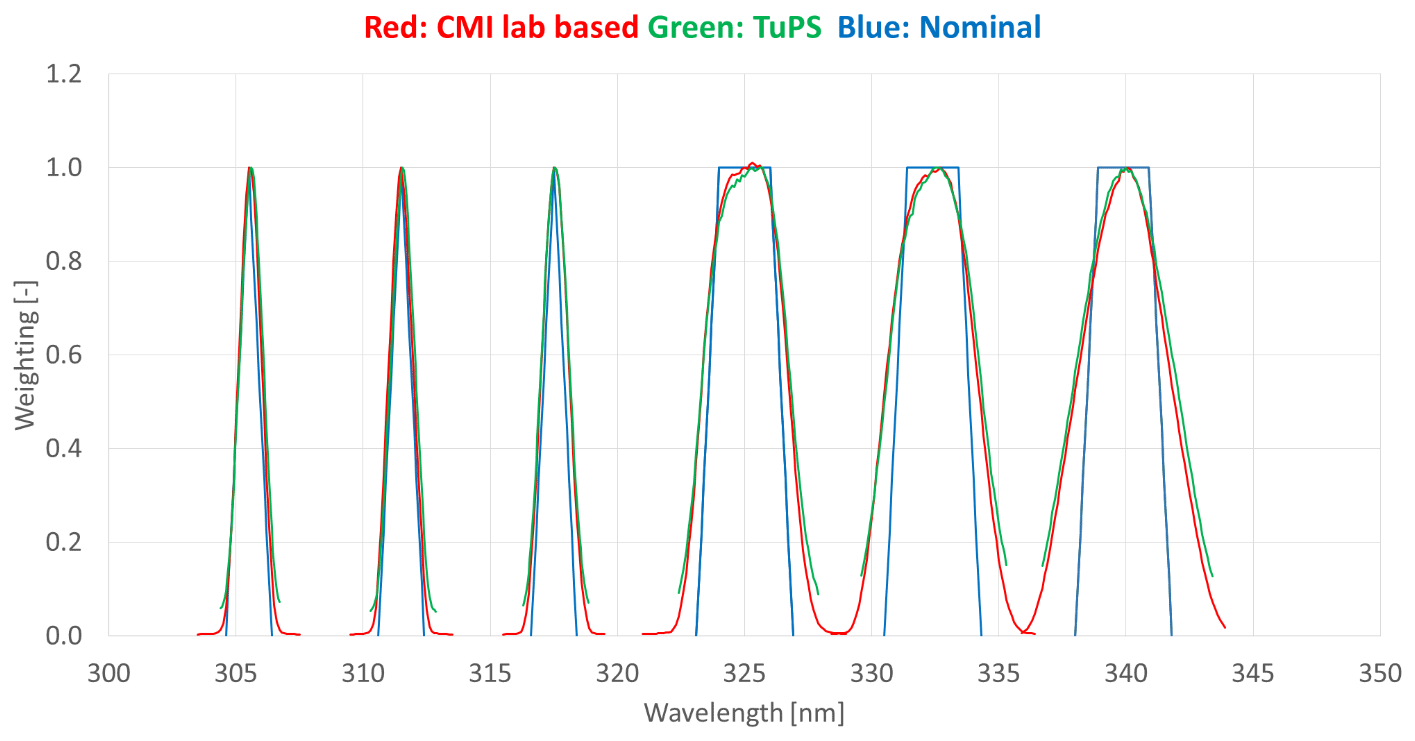
Figure 10Comparison of in-field calibration and CMI laboratory-based calibration of Dobson #074.
The results of the comparison of TuPS in-field calibration data and CMI laboratory-based calibration data of Dobson #074 are presented in the graph shown in Fig. 10.
Despite a half-a-year time gap between both measurements, the differences between them did not exceed 0.01 nm, in terms of the central wavelength, and 0.02 nm, in terms of the spectral bandwidth, for all six Dobson spectral bandpasses.
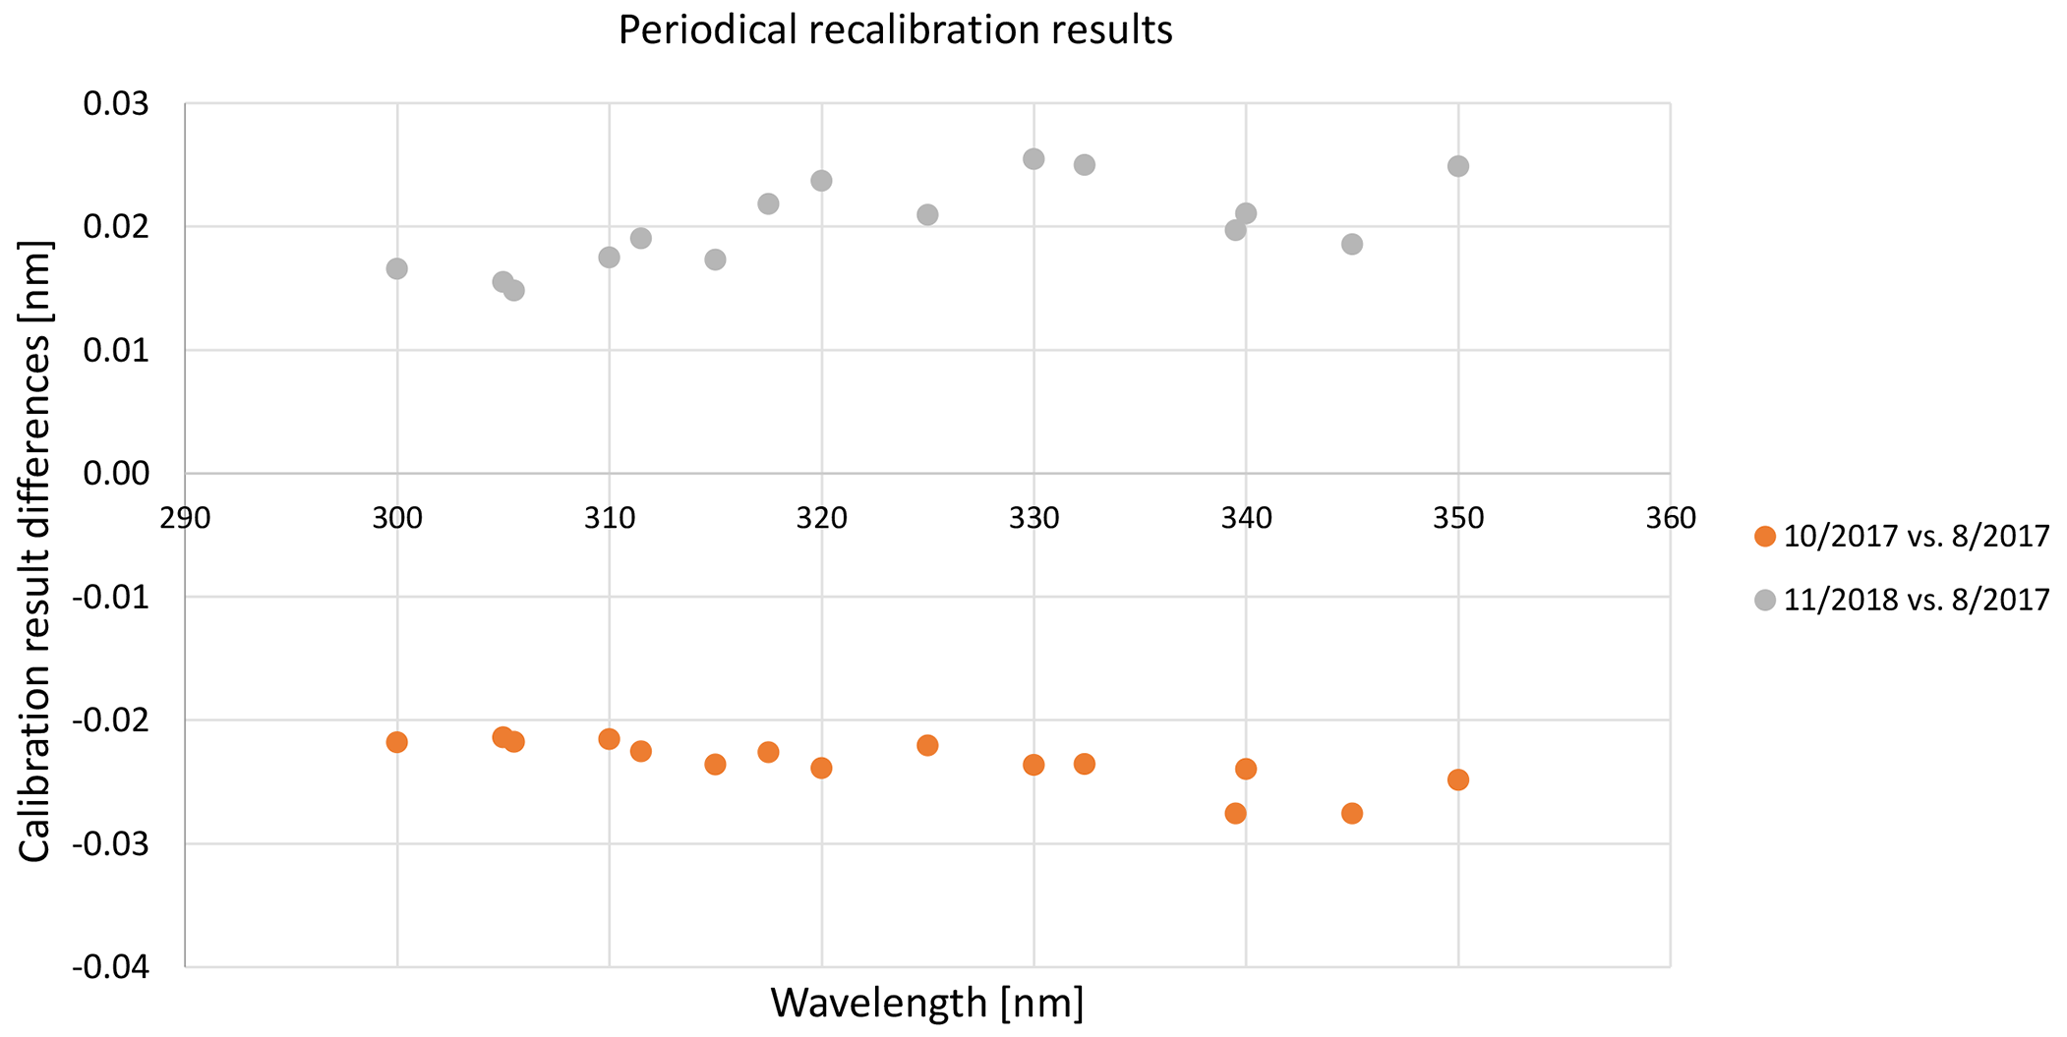
Figure 11The largest differences measured in pre- and post-campaign TuPS wavelength-scale calibrations in CMI. Dobson comparison campaign in AEMET Izaña in Spain (orange circles) and campaign in the Deutscher Wetterdienst (DWD) in Hohenpeissenberg in Germany (grey circles).
Temporal stability of the TuPS light engine was investigated over a period of 2 years from 2017. During the year 2017, the TuPS participated in five measurement campaigns, during which it performed the complete characterisation of a total of 14 Dobson spectrometers. Before and after each measurement campaign, the TuPS wavelength scale was recalibrated and readjusted in the CMI laboratory using the OPO laser facility as described above (see Sect. 3.1). The results for calibrations before and after each campaign are reported in Fig. 11. The largest differences of both at about 0.025 nm were recorded after the measurements in AEMET Izaña in Spain and the Deutscher Wetterdienst (DWD) in Hohenpeissenberg in Germany campaigns, both over a time interval of approximately 45 d. The TuPS was ground-shipped in its protective transportation plastic box and in some cases even together with a number of Dobson spectrometers (for the international Dobson comparison in Izaña conducted in September 2017). These two results for calibrations before and after each campaign are reported in Fig. 11. The different environmental conditions in which the TuPS operated varied from strictly controlled laboratory environments to real in-field measurement conditions, with temperatures as high as 26 ∘C.
The evaluation of standard uncertainty of the TuPS wavelength scale (JCGM 100:2008(E), 2008) is reported in Table 3.
Table 2Results of the TuPS-based in-field characterisations of different Dobsons which were measured during the campaign in El Arenosillo in September 2017.

To demonstrate the example of the variability of individual Dobsons, we present as an example the results of TuPS-based in-field characterisation of wavelength-scale accuracy and bandwidth of six Dobsons performed during the Campaign in El Arenosillo in Spain in September 2017. The results are summarised in Table 2 below.
Table 3The evaluation of standard uncertainty of the TuPS wavelength scale.
The tuneable and portable radiation source (TuPS) was developed as an instrument to be used for determining the slit function and centre wavelength of a Dobson spectrophotometer. The TuPS was fully characterised at CMI for both bandwidth and the central wavelength accuracy all over the spectral range of interest. Wavelength-scale calibration and the investigation of FWHM bandwidth of emitted radiation were performed using the fibre-coupled CMI tuneable OPO laser facility in combination with the CMI reference wavemeter, and they were proved to be better than 0.02 and 0.1 nm respectively. Moreover, the long-term (1-year) temporal stability of both key parameters was proved to be better than 0.02 nm, while this 1-year operation included a few in-field calibration campaigns abroad involving both shipping and in-field installations.
Considering the results achieved, TuPS-based in-field characterisation might become a prospective method for determination of effective absorption coefficients (EACs) for individual Dobson spectroradiometers of a global monitoring network.
The ozone absorption coefficient of all Dobson spectrophotometers follows the one of the primary Dobson, defined as the world reference for the global Dobson network. This ozone absorption coefficient is obtained from the convolution of the line spread functions of each slit with the ozone cross-sections at a particular ozone temperature. As shown in Köhler et al. (2018), the difference in ozone absorption coefficients using either the nominal value or the ones obtained using the actual measured line spread functions can differ by up to 1 %.
The 3 % difference between the Dobson and Brewer results in part due to the use of a nominal instead of the actually measured line spread functions, as well as the inconsistency in the ozone absorption cross-sections used up to now (Bass and Paur, 1985). As shown in Gröbner et al. (2021), the consistency can be significantly improved from 3 % to better than 1 % when using the actually measured line spread functions of a Dobson spectrophotometer, in conjunction with the cross-sections from IUP (Serdyuchenko et al., 2014).
The LabView TuPS driving code as well as CMI calibration–automation code are hardware-specific routines only applicable in the CMI TuPS system and the CMI calibration facility as described in the paper (both written in NI LabView). The corresponding author may be contacted for more information.
All data reported in the paper are made available with their description in a public data repository at https://doi.org/10.17632/58ky97926k.1 (Šmíd, 2021).
MSm prepared the paper with GP and JG and contributions from all co-authors. TB provided the optical design in collaboration with LE and MSm, PL prepared the TuPS mechanical setup, GP developed TuPs driving and data acquisition software, JT, MSm, and GP prepared the TuPS calibration facility and methodology, and MSt, JG, and PL developed the TuPS–Dobson interfacing.
The authors declare that they have no conflict of interest.
This work has been supported by the European Metrology Research Programme (EMRP) within the joint research project EMRP ENV59 ATMOZ “Traceability for atmospheric total column ozone”. The EMRP is jointly funded by the EMRP-participating countries within EURAMET and the European Union.
This research has been supported by the EMRP (European Metrology Research Programme) EURAMET (project ENV59 ATMOZ).
This paper was edited by Jochen Stutz and reviewed by three anonymous referees.
Balling, P., Masika, P., Kren, P., and Dolezal, M.: Length and refractive index measurement by Fourier transform interferometry, Meas. Sci. Technol., 23, 1–13, https://doi.org/10.1088/0957-0233/23/9/094001, 2012.
Bass, A. M. and Paur, R. J.: The ultraviolet cross-sections of ozone. I. The measurements, II – Results and temperature dependence, Atmospheric ozone, Proceedings of the Quadrennial, 1, 606–616, 1985.
Dobson, G. M. B.: Forty Years: Research on Atmospheric Ozone at Oxford: a History, Appl. Optics, 7, 387–405, 1968.
Gröbner, J., Schill, H., Egli, L., and Stübi, R.: Consistency of total column ozone measurements between the Brewer and Dobson spectroradiometers of the LKO Arosa and PMOD/WRC Davos, Atmos. Meas. Tech. Discuss. [preprint], https://doi.org/10.5194/amt-2020-497, in review, 2021.
JCGM 100:2008(E): Evaluation of measurement data – Guide to the expression of uncertainty in measurement, BIPM, JCGM, available at: https://www.bipm.org/en/publications/guides (last access: 18 May 2021), 2008.
Kerr, J., Mcelroy, C., and Olafson, R.: Measurements of ozone with the Brewer ozone spectrophotometer, in: Quadrennial International Ozone Symposium, 4–9 August 1980, Boulder, Colorado, USA, 74–79, 1981.
Köhler, U., Nevas, S., McConville, G., Evans, R., Smid, M., Stanek, M., Redondas, A., and Schönenborn, F.: Optical characterisation of three reference Dobsons in the ATMOZ Project – verification of G. M. B. Dobson's original specifications, Atmos. Meas. Tech., 11, 1989–1999, https://doi.org/10.5194/amt-11-1989-2018, 2018.
Komhyr, W. D., Mateer, C. L., and Hudson, R. D.: Effective Bass-Paur 1985 ozone absorption coefficients for use with Dobson ozone spectrophotometers, J. Geophys. Res., 98, 20451–20465, 1993.
Redondas, A., Nevas, S., Berjón, A., Sildoja, M.-M., León-Luis, S. F., Carreño, V., and Santana-Díaz, D.: Wavelength calibration of Brewer spectrophotometer using a tunable pulsed laser and implications to the Brewer ozone retrieval, Atmos. Meas. Tech., 11, 3759–3768, https://doi.org/10.5194/amt-11-3759-2018, 2018.
Serdyuchenko, A., Gorshelev, V., Weber, M., Chehade, W., and Burrows, J. P.: High spectral resolution ozone absorption cross-sections – Part 2: Temperature dependence, Atmos. Meas. Tech., 7, 625–636, https://doi.org/10.5194/amt-7-625-2014, 2014.
Šmíd, M.: amt-tups-data, Mendeley Data [data set], V1, https://doi.org/10.17632/58ky97926k.1, 2021.
Vanicek, K.: Differences between ground Dobson, Brewer and satellite TOMS-8, GOME-WFDOAS total ozone observations at Hradec Kralove, Czech, Atmos. Chem. Phys., 6, 5163–5171, https://doi.org/10.5194/acp-6-5163-2006, 2006.
Vaníček, K., Metelka, L., Skřivánková, P., and Staněk, M.: Dobson, Brewer, ERA-40 and ERA-Interim original and merged total ozone data sets – evaluation of differences: a case study, Hradec Králové (Czech), 1961–2010, Earth Syst. Sci. Data, 4, 91–100, https://doi.org/10.5194/essd-4-91-2012, 2012.
- Abstract
- Motivation and specific objective
- Methods
- Results
- TuPS in-field operation
- Comparison of the TuPS in-field calibration and laboratory-based calibration
- TuPS temporal stability and wavelength-scale uncertainty evaluation
- Conclusions
- Code availability
- Data availability
- Author contributions
- Competing interests
- Acknowledgements
- Financial support
- Review statement
- References