the Creative Commons Attribution 4.0 License.
the Creative Commons Attribution 4.0 License.
 | 20 May 2021
The importance of size ranges in aerosol instrument intercomparisons: a case study for the Atmospheric Tomography Mission
Hongyu Guo
Pedro Campuzano-Jost
Benjamin A. Nault
Douglas A. Day
Jason C. Schroder
Dongwook Kim
Jack E. Dibb
Maximilian Dollner
Bernadett Weinzierl
Jose L. Jimenez
Aerosol intercomparisons are inherently complex as they convolve instrument-dependent detection efficiencies vs. size (which often change with pressure, temperature, or humidity) and variations in the sampled aerosol population, in addition to differences in chemical detection principles (e.g., inorganic-only nitrate vs. inorganic plus organic nitrate for two instruments). The NASA Atmospheric Tomography Mission (ATom) spanned four separate aircraft deployments which sampled the remote marine troposphere from 86∘ S to 82∘ N over different seasons with a wide range of aerosol concentrations and compositions. Aerosols were quantified with a set of carefully characterized and calibrated instruments, some based on particle sizing and some on composition measurements. This study aims to provide a critical evaluation of inlet transmissions impacting aerosol intercomparisons, and of aerosol quantification during ATom, with a focus on the aerosol mass spectrometer (AMS). The volume determined from physical sizing instruments (aerosol microphysical properties, AMP, 2.7 nm to 4.8 µm optical diameter) is compared in detail with that derived from the chemical measurements of the AMS and the single particle soot photometer (SP2). Special attention was paid to characterize the upper end of the AMS size-dependent transmission with in-field calibrations, which we show to be critical for accurate comparisons across instruments with inevitably different size cuts. Observed differences between campaigns emphasize the importance of characterizing AMS transmission for each instrument and field study for meaningful interpretation of instrument comparisons. Good agreement (regression slope =0.949 and 1.083 for ATom-1 and ATom-2, respectively; SD =0.003) was found between the composition-based volume (including AMS-quantified sea salt) and that derived from AMP after applying the AMS inlet transmission. The AMS captured, on average, 95±15 % of the standard PM1 volume (referred to as the URG Corp. standard cut 1 µm cyclone operated at its nominal efficiency). These results support the absence of significant unknown biases and the appropriateness of the accuracy estimates for AMS total mass and volume for the mostly aged air masses encountered in ATom. The particle size ranges (and their altitude dependence) that are sampled by the AMS and complementary composition instruments (such as soluble acidic gases and aerosol, SAGA, and particle analysis by laser mass spectrometry, PALMS) are investigated to inform their use in future studies.
- Article
(5855 KB) - Full-text XML
-
Supplement
(7043 KB) - BibTeX
- EndNote


Aerosols are ubiquitous in the atmosphere and have a lifetime of about a week, and thus they can travel long distances (Tsigaridis et al., 2014), and have important effects on climate forcing through both direct (Pilinis et al., 1995; Haywood and Boucher, 2000) and indirect effects (Lohmann and Feichter, 2005; IPCC, 2013). Remote regions account for much of the Earth's surface and are infrequently sampled, and thus they have especially uncertain aerosol distributions and radiative impacts (IPCC, 2013; Hodzic et al., 2020). The NASA Atmospheric Tomography Mission (ATom) sampled the remote marine troposphere from 86∘ S to 82∘ N over four different seasons with a comprehensive suite of high-quality and carefully calibrated and operated physical and chemical aerosol instruments. It provides a unique dataset to improve our understanding of the remote atmospheric aerosols and thus refine global model predictions. A prerequisite for that purpose is to evaluate the accuracy and consistency of the ATom aerosol instruments.
The ATom physical sizing instruments have been recently described and evaluated in Williamson et al. (2018), Kupc et al. (2018), Brock et al. (2019a), and Spanu et al. (2020), while the particle analysis by laser mass spectrometer (PALMS) chemical instrument during ATom has been described in Froyd et al. (2019). In this paper, we focus on the Aerodyne aerosol mass spectrometer (AMS). AMS (Canagaratna et al., 2007) and aerosol chemical speciation monitor (ACSM; smaller, lower cost, and simpler to operate versions) (Ng et al., 2011) have been deployed extensively worldwide for ground aerosol monitoring (Jimenez et al., 2009; Crenn et al., 2015; Hu et al., 2015; Kiendler-Scharr et al., 2016; Zhang et al., 2018; ACTRIS, 2021). AMS has been deployed in most advanced atmospheric chemistry aircraft experiments worldwide (Dunlea et al., 2009; Middlebrook et al., 2012; Barth et al., 2015; Schroder et al., 2018; Garofalo et al., 2019; Hodzic et al., 2020; Mei et al., 2020; Morgan et al., 2020). The overall AMS concentration uncertainty (2σ) is normally reported as ±38 % for organic aerosol (OA) and ±34 % for inorganics, while the precision is typically much better, except at concentrations near the detection limit (Bahreini et al., 2009; Jimenez et al., 2016). A detailed evaluation of those uncertainties requires both very careful AMS characterization and calibration, as well as high-quality collocated measurements, as was the case in ATom. Concerns about AMS quantification raised by Murphy (2016a) motivate rigorous evaluation of this topic despite some questions being solved in the following discussions (Jimenez et al., 2016; Murphy, 2016b).
This work uses the extensive ATom field dataset for remote aerosols to evaluate (1) the consistency of the different submicron aerosol volume measurements, (2) the quantification ability of the AMS for remote aerosols, and (3) the size ranges contributing chemical composition information to different instruments for ATom and their variation with altitude. Volume comparison probes the ability of the AMS to quantify total aerosol mass and predict aerosol density (based on fractional composition) accurately, and hence it is the most direct method to evaluate the AMS overall quantification (unlike, e.g., comparing total mass to extinction that depends on mass extinction efficiency). We examine in detail the accurate quantification and application of the AMS transmission efficiency (EL) to the particle volume intercomparisons in this study. This study also serves as the basis for a future study on individual chemical species intercomparisons.
2.1 ATom overview
Over 2 years, the DC-8 aircraft was deployed once a season: July–August 2016 (ATom-1), January–February 2017 (ATom-2), September–October 2017 (ATom-3), and April–May 2018 (ATom-4). During these flights, the DC-8 repeatedly ascended and descended between ∼0.18 and ∼13 km altitudes at regular intervals, typically every hour (with a single vertical profile lasting ∼25 min), leading to the execution of ∼140 vertical profiles of the troposphere per deployment (the vertical profile of sampling time is shown in the Supplement in Fig. S1). The unique spatiotemporal coverage and high-quality measurements of this campaign ensure that its data will be used very widely, such as to evaluate and constrain global modeling. Therefore it is of high interest to document the consistency of the multiple aerosol measurements. This analysis is also useful to re-evaluate the quantification uncertainties of the AMS for a wide range of particle concentrations and composition (e.g., Fig. S2). Due to the similarities in the geographic coverage of ATom studies, we focus on the intercomparisons for the first two ATom campaigns in the following analysis.
2.2 Definitions of particle diameters
Conversions between different particle diameter definitions are required for meaningful instrument comparisons. For example, particle size spectrometers report estimated geometric diameter (dp), which is derived from multiple condensation particle counters using an inversion method, or from light scattering signals by using an assumed constant refractive index for aerosols. AMS transmission operates in vacuum aerodynamic diameter (dva) since its aerodynamic lens and supersonic expansion operate in the free molecular regime (DeCarlo et al., 2004). Impactors (Marple et al., 1991, 2014) and cyclones (typically sourced from URG Corp., Chapel Hill, NC, USA) are often installed upstream of aerosol instruments to preselect desired aerosol ranges for ground or aircraft measurements. The cutoff sizes of both devices follow the transition-regime aerodynamic diameter (dta; as the size range of interest to this study is in the transition regime, requiring a “slip correction”). A detailed discussion of particle diameter definitions can be found in DeCarlo et al. (2004). The dva value is related to the volume-equivalent diameter (dve, the diameter that would result if the particle was melted to form a sphere of the same density as the particle and without any internal voids) as
where ρp is the particle density, ρ0 is the standard density (1 g cm−3), and χv is the vacuum (i.e., free-molecular regime) dynamic shape factor (=1 for spheres and >1 for non-spherical particles). Since the aerosols sampled during ATom were remote and aged, we assume χv∼1 and dve∼dp. The transition-regime aerodynamic diameter can be calculated as
where χt is the transition-regime dynamic shape factor, and Cc is the Cunningham slip correction factor. In this study, χt is assumed to be 1, and Cc is calculated based on air pressure. Although a given particle always has the same dry dp and dva, the dry dta changes with pressure. To distinguish the dta calculated at different altitudes, we use dta,sea to denote that calculated at sea level (P=1013 mbar) and dta,air for sampling aloft with an aircraft (or at an elevated ground site). In addition, all diameters change under humid/dry conditions due to water uptake or evaporation (DeCarlo et al., 2004).
2.3 AMS description and quantification
The highly customized University of Colorado (CU) high-resolution time-of-flight aerosol mass spectrometer (HR-ToF-AMS, hereafter referred to as AMS; Aerodyne Research Inc., Billerica, MA) (DeCarlo et al., 2006) measured non-refractory, bulk submicron particle compositions at 1 Hz resolution. The AMS uses an aerodynamic lens to sample particles into a high vacuum, where they impact and vaporize on a hot porous tungsten vaporizer (600 ∘C). The evaporated constituents undergo electron ionization (EI), with the resulting ions being detected by a mass spectrometer (Jayne et al., 2000; Jimenez et al., 2003; Drewnick et al., 2005; DeCarlo et al., 2006; Canagaratna et al., 2007). The mass concentration of a species, s, within a multi-component aerosol particle can be calculated from the measured ion signal with the following equation (Alfarra et al., 2004; Canagaratna et al., 2007; Jimenez et al., 2016):
where Cs is the mass concentration of species s, is the molecular weight of nitrate, CEs is the collection efficiency of species s, RIEs is the relative ionization efficiency of species s (to nitrate), is the ionization efficiency of nitrate, Q is the volume flow rate into the AMS, NA is Avogadro's number, Is,i is the ion signal from ion i produced from species s, and the 1012 factor accounts for unit conversions.
CE is typically defined as the efficiency with which particles entering the AMS inlet are detected. It has been formally defined as a product of aerodynamic lens transmission efficiency for spherical particles (EL), transmission efficiency correction for non-spherical particles (Es) due to additional particle beam broadening, and detection efficiency at the vaporizer (Eb), which can be reduced due to particle bounce. It is thus expressed as
(Huffman et al., 2005; Canagaratna et al., 2007; Middlebrook et al., 2012). Previous studies have shown that Es∼1 for ambient particles (Huffman et al., 2005; Salcedo et al., 2007), and thus CE is determined by EL and Eb. When the mass size distribution being sampled is mostly within the region where EL∼1, then CE∼Eb. Most papers in the literature make that implicit approximation, although it is not clear that the approximation is always justified since EL changes in time and between instruments and is infrequently quantified as it is experimentally challenging to do so. Eb depends on particle viscosity and thus phase (Matthew et al., 2008; Middlebrook et al., 2012; Pajunoja et al., 2016). With the “standard vaporizer” used in this study (Hu et al., 2020), ambient aerosols in continental regions typically have Eb∼0.5, but a range between 0.5 to 1 can be observed (Middlebrook et al., 2012; Hu et al., 2017, 2020). Eb increases for certain compositions, which leads to less viscous particles, such as high ammonium nitrate mass fraction or high acidity conditions, which can be estimated with a parameterization based on aerosol composition (Middlebrook et al., 2012; Hu et al., 2017, 2020; Nault et al., 2018). Such parametrizations assume internally mixed aerosols, which is typically the case for submicron ambient aerosol away from sources due to condensation and coagulation (Petters et al., 2006; Wang et al., 2010; Mei et al., 2013).
The main submicron inorganic ambient aerosol species are ammonium (NH4), sulfate (SO4), nitrate (pNO3), chloride (Cl), and, in marine areas, sea salt. The charges are omitted for the AMS-measured nominally inorganic species as the AMS may also detect some SO4 or NO3 signals from organosulfates or organonitrates (Farmer et al., 2010). To avoid the confusion between the NO3 radical and particle NO3, pNO3 is used to denote total particle NO3 explicitly (Nault et al., 2018). RIEs for the inorganic species can be calibrated regularly (including in the field). However, similar explicit calibrations cannot be readily performed for the thousands of individual organic aerosol (OA) molecules in ambient particles. Thus, laboratory-based calibrations with a limited set of OA species have been used to estimate RIEOA (Slowik et al., 2004; Dzepina et al., 2007; Jimenez et al., 2016; Robinson et al., 2017; Xu et al., 2018), and this approach has been verified using laboratory and field intercomparisons with other instruments (Takegawa et al., 2005; Dzepina et al., 2007; DeCarlo et al., 2008; Bahreini et al., 2009; Dunlea et al., 2009; Timonen et al., 2010; Docherty et al., 2011; Middlebrook et al., 2012; Crenn et al., 2015). Bahreini et al. (2009) estimated the uncertainty in (which is always calibrated in the field) to be ∼10 % vs. 15 % for the other inorganics (sulfate, chloride; since most AMS users do not perform in-field calibrations for those or do so less frequently). Compared to the inorganics, the uncertainty in RIEOA was estimated to be higher at 20 % to account for the diversity of species (Bahreini et al., 2009). An average RIEOA∼1.4 was determined from laboratory calibrations. However, there are conflicting reports for RIEOA of chemically reduced species such as hydrocarbons, with some values around 1.4 and others higher (Slowik et al., 2004; Dzepina et al., 2007; Docherty et al., 2011; Jimenez et al., 2016; Reyes-Villegas et al., 2018; Xu et al., 2018). However, such species were insignificant during ATom. For more oxidized species relevant for most biomass burning OA and secondary organic aerosol (SOA), average laboratory RIEOA overlaps within uncertainties of 1.4 (Jimenez et al., 2016; Xu et al., 2018). Reviews on this topic (Jimenez et al., 2016; Murphy, 2016a, b) have emphasized the need for the additional investigation of AMS quantification in the field.
2.4 AMS operation during ATom
The aircraft operation of the CU AMS has been discussed previously (DeCarlo et al., 2006, 2008, 2010; Dunlea et al., 2009; Cubison et al., 2011; Kimmel et al., 2011; Schroder et al., 2018). The specific operational procedures used during ATom have been discussed in Nault et al. (2018) and Hodzic et al. (2020). Important operation details of AMS that are relevant to this study are described below. Per aircraft conventions, mass concentrations are reported in micrograms per cubic meter air volume at standard conditions of T=273.15 K and P=1013 mbar (µg sm−3), hereafter referred to as STP. Note that many definitions of STP are in use, especially in other fields).
Ambient aerosols were sampled through a National Center for Atmospheric Research (NCAR) high-performance instrumented airborne platform for environmental research (HIAPER) modular inlet (HIMIL) (Stith et al., 2009) mounted on a 4′′ raised platform on the window plate to ensure that sampling occurred consistently outside the DC-8 boundary layer (Vay et al., 2003). Aerosols were introduced at a constant standard flow rate of 9 sL min−1 (up to ∼9 km, 15 L min−1 above that; “s” refers to standard conditions, and no “s” indicates a volumetric flow at in situ T and P), with 1 L min−1 being continuously subsampled into a pressure controlled inlet (PCI) operated at 250 mbar (187 Torr) (Bahreini et al., 2008). A fraction of that flow, 86 scm3 min−1, was then sampled into the high vacuum region of the mass spectrometer through an aerodynamic focusing lens operated at 2.00 mbar (1.50 Torr). Due to the much lower ambient air pressure at high altitudes, the PCI pressure cannot be maintained at 250 mbar above ∼9 km, resulting in a drop in lens pressure (down to 1.00 Torr) and flow (down to 55 scm3 min−1) at the max altitude (12.5 km). Residence times from the tip of the HIMIL to the aerosol vaporizer varied from ∼0.5 s in the boundary layer to ∼0.9 s at 12 km during ATom (Fig. S3; note that a detailed characterization of HIMIL and PCI performance is included in the Supplement in Sect. S4 with Figs. S3–S10). The relative humidity (RH) in the line was not actively controlled but was very low, on average 10±21 % in ATom-1 and ATom-2 with a median of 0.4 %, due to the thermal gradients between the plane cabin and ambient conditions ( K) (8 % of the data was >40 % RH, including 3 % >80 % RH, which could increase CE). Composition-dependent CE was estimated based on the Middlebrook et al. (2012) parameterization and was on average 0.87±0.15 and 0.90±0.13 for ATom-1 and ATom-2, respectively, mainly due to high acidity (Fig. S11). After every research flight, was calibrated by atomizing pure NH4NO3 solutions and selecting dry (desiccated with a Nafion dryer) 400 nm (mobility diameter, dm; equivalent to dva=550 nm) (DeCarlo et al., 2004) particles with a differential mobility analyzer (DMA; TSI model 3081, St. Paul, MN, USA) into the AMS. RIEs for sulfate, ammonium, and chloride were determined by multiple in-field calibrations.
A summary plot of the in-field calibrations of these parameters is shown in Fig. S12. Assuming a constant instrument response over the course of each deployment, the variability in the calibrations can be taken as an estimate of the random component of RIE uncertainty. Uncertainties (2σ) for , , and RIECl are hence 4 % (6 %), 4 % (2 %), and 5 % (8 %), respectively, for ATom-1 (ATom-2), all smaller than the reported values from Bahreini et al. (2009). The 2σ variability in (normalized as its ratio to the air beam signal, ) is 6 % for ATom-1 and 15 % for ATom-2. The propagated AMS uncertainties using these values, 31 % for inorganics and 37 % for organics, are similar to those from Bahreini et al. (2009) due to the dominant uncertainty contribution from CE (30 %). For the AMS reported mass concentration, uncertainties (i.e., accuracies) in CE, RIEs, and dominate the total reported uncertainties in most situations, although precision (statistical) error becomes important at low concentrations and short averaging times.
calibrations, performed in event trigger mode with 400 nm ammonium nitrate aerosols (Nault, 2016; Schroder et al., 2018), also provided multiple AMS transmission measurements throughout the campaign by a direct comparison of the single-particle AMS counts with a condensation particle counter (CPC) (Nault et al., 2018). Besides these single-size (at the edge of the EL∼1 range) post-flight calibrations, the upper end of the AMS transmission curve was characterized on the aircraft during ATom-2 by measuring multiple sizes of monodisperse ammonium nitrate (dm range 350–850 nm) by comparing the mass measured by AMS to that by CPC (i.e., CPC counts × single particle volume). Multiply charged ammonium nitrate aerosols were removed by the impactor upstream of the DMA, and the removal was confirmed by the AMS size-resolved measurements. The resulting transmission accounts for all the losses in the PCI and aerodynamic lens. A calculation of the inlet line losses is presented in the Supplement (Fig. S4), and based on these calculations additional losses are very small and can be ignored. These calculations do not include the transmission of the actual HIMIL aircraft inlet (Stith et al., 2009) nor the secondary diffuser inside the HIMIL. To confirm that the aircraft-probe-related size-dependent losses or enhancements did not impact the overall transmission, the AMS sampled several times at different altitudes off the University of Hawaii (UH) and NASA Langley Aerosol Research Group inlet (LARGE inlet hereafter) used by the NOAA instruments over the course of the four ATom deployments, which transmits particles to ∼3–5 µm dta,air with 50 % passing efficiency (McNaughton et al., 2007; Brock et al., 2019a). No difference in volume comparison (discussed in Sect. 3.3) was found under those conditions or in previous missions with on average larger accumulation mode peaks (Fig. S5); hence, we conclude that this is a valid assumption. The lower-end AMS transmission for small particles is more difficult to quantify than the upper end due to the challenges of making monodisperse particles in the sub-200 nm (dva) size range for which the DMA impactors cannot effectively remove the multiple-charged particles, being limited by the airflows. In the lab, a newly constructed evaporation–condensation particle generator produces monodisperse small oleic acid particles reliably in the range of 20–250 nm. The lower-end mass-based transmission was characterized in the summer of 2020 as the best estimate for ATom.
Another concern for airborne sampling with an AMS is the misalignment of the aerodynamic lens due to mechanical stress during flight. Such a misalignment will not necessarily be caught by the previously described calibrations since they do not probe the full surface of the vaporizer and since lens focusing can have some size-dependence. Hence for ATom-2–4, a particle beam width probe (Huffman et al., 2005) was flown, and profiles of both the air and particle signal were taken at most airports during the mission, as shown in Fig. S10, directly confirming the lack of change in lens alignment.
During ATom, the AMS was operated in the fast mass spectrum mode (FMS; Kimmel et al., 2011), allowing for high-time-resolution measurements at 1 Hz. For every minute, AMS started with FMS with the particle beam blocked (instrumental background measurement; 6 s) and then with the beam open (background plus ambient air and particles; 46 s) and ended with efficient particle time-of-flight (ePToF) mode (nominally 8 s), which measured speciated size distributions. The interpolated average of two consecutive background signals (beam closed) was subtracted from 1 s ambient signals (beam open). Also, fast blanks (20 s) were scheduled every 18 min by directing ambient air through a high-efficiency particulate air (HEPA) filter serving to characterize the AMS zero (field background) and as a leak check downstream of the HEPA filter (Nault et al., 2018). It also serves as a frequent confirmation for the real-time continuous detection limits estimated using the method proposed in Drewnick et al. (2009). AMS data were reported at 1 s and 1 min time resolutions. For the 1 min product, the raw mass spectra were averaged prior to data reduction and analysis, which reduces nonlinear spectral fitting noise for the least-squares error minimization method. This is observed because a fit to the 1 min average spectrum has less fitting noise than the average of the fits to the 1 s spectra. In the following analysis, the 1 min data product is used due to the improved signal-to-noise ratio (SNR). Since the aerosol loadings were typically low and changed slowly in the global remote regions, longer averaging times were used for some analyses. Continuous time-dependent detection limits (DLs) were estimated using the method of Drewnick et al. (2009) and corrected by comparison with the periodic filter blanks. The average DLs for the 1 min data were 76, 10, 6, 1, 7, and 30 ng sm−3 during ATom-1 and 133, 18, 9, 2, 10, and 40 ng sm−3 during ATom-2 for OA, SO4, pNO3, NH4, Cl, and sea salt, respectively. Sea salt is an important submicron aerosol component when sampling the marine boundary layer in ATom. Although sea salt is not a standard AMS data product, in this study we report AMS sea salt mass concentrations with the method from Ovadnevaite et al. (2012) with a laboratory-calibrated response factor, , for the AMS sea salt marker Na35Cl. Additional species were reported for ATom, with DLs for MSA (methanesulfonic acid) and ClOx (perchlorate) of 2 and 1 ng sm−3 during ATom-1 and ATom-3, and 2 ng sm−3 during ATom-2. Iodine and bromine were also quantified with DLs of 0.4 and 1.5 ng sm−3 during ATom-1 and 0.5 and 2 ng sm−3 during ATom-2, as reported by Koenig et al. (2020). The variation in AMS detection limits across species is mostly controlled by differences in background signals for different ions. Many of these detection limits are lower than for typical AMS aircraft operation, especially during the first several hours of each flight, due to the use of a cryopump in the CU AMS (Jayne, 2004; DeCarlo, 2009). The above customizations of the CU AMS, such as the cryopump and PCI, optimize the instrument performance for aircraft deployments but do not substantially make the intercomparisons less relevant to other AMSs.
2.5 Other aerosol measurements used in this study
The following instruments all sampled through the LARGE inlet except soluble acidic gases and aerosol (SAGA). The transmission efficiency for this inlet has been characterized as a function of particle size by flying the NASA DC-8 in a previous campaign (McNaughton et al., 2007), demonstrating a unity efficiency up to supermicron size ranges and reaching 50 % at dta,air of ∼5 µm at the surface and 3.2 µm at 12 km. Hereafter, we refer to the 50 % transmission diameter as d50.
Particle size spectrometers. Dry particle size distributions for dp from 2.7 nm to 4.8 µm were reported at 1 Hz using three optical particle spectrometers, including a nucleation-mode aerosol size spectrometer (NMASS; custom-built; 0.003–0.06 µm) (Williamson et al., 2018), an ultra-high sensitivity aerosol spectrometer (UHSAS; Droplet Measurement Technologies, Longmont, CO, USA; 0.06–1 µm) (Kupc et al., 2018), and a laser aerosol spectrometer (LAS; LAS 3340, TSI, St. Paul, MN, USA; 0.12–4.8 µm), all operated by NOAA Earth System Research Laboratory (ESRL). Two NMASSs, two UHSASs (during ATom-2 and ATom-3, a 300 ∘C thermodenuder was installed upstream of the detector of the second UHSAS to volatilize refractory components), and one LAS comprise the package of aerosol microphysical properties (AMP). Brock et al. (2019a) discussed extensively the data inversion method to merge the three non-thermally denuded size distributions into one in the size resolution of 20 bins per decade. Hereafter, we refer to the non-thermally denuded integrated volume (2.7 nm–4.8 µm) as the physical sizing-based volume (Vphys). AMP gives nearly unity detection efficiency of the ∼5 nm to ∼4 µm aerosols at sea level: (1) the NMASS had nearly unity detection efficiency from ∼5 to 100 nm but only reported up to 60 nm; (2) the UHSAS had >90 % counting efficiency from 63 to 1000 nm; and (3) the LAS had high detection efficiency between 120 nm and 10 µm; however, the max size was limited to <4.8 µm by the aircraft inlet (Brock et al., 2019a). AMP performed well and consistency was found in the overlapping size range during ATom. For instance, Brock et al. (2019a) found agreement within 1 % for particle number and 9 % for integrated volume for the overlap between the UHSAS and LAS during ATom-1. Although the NMASS barely overlapped with the UHSAS, the two size distributions appear to agree well with each other as shown in Fig. 6 in Brock et al. (2019a). Most relevant to the AMS size range, the UHSAS reported volume was estimated to have an asymmetric uncertainty of due to the differences in refractive index (n) between ambient particles and assumed ammonium sulfate particles (n=1.527, which is similar to the refractive index found for aged ambient OA; Aldhaif et al., 2018). This uncertainty range is estimated to be between 1σ and 2σ depending on the conditions. Here we assume that it represents 1.5σ when using it for uncertainty analyses.
Other than the AMP that was operated in the cabin of the DC-8 and provided dry particle size distributions, the second generation cloud, aerosol, and precipitation spectrometer (CAPS) was installed underwing to monitor the aerosol and cloud droplet size distributions at near-ambient conditions (Spanu et al., 2020). Since the CAPS has limited size resolution and coverage in the submicron size range that matters the most for the analysis presented in this work, CAPS data in this paper are only used to screen for in-cloud sampling. Brock et al. (2021) combine the data from AMP and CAPS to derive a size distribution product that covers a wider size range in which the CAPS data are used above 1.01 µm (and up to 50 µm) and the LAS data are used between 0.50 and 1.01 µm. In this study, the LAS data are used between 0.50 and 4.8 µm (Brock et al., 2019a).
SP2. Refractory black carbon (rBC; as defined in Petzold et al., 2013) mass concentrations in the accumulation mode size range were measured by the NOAA single particle soot photometer (SP2; Droplet Measurement Technologies, Longmont, CO, USA) (Schwarz et al., 2010b; Katich et al., 2018). The ATom SP2 detection system was operated as in Schwarz et al. (2010a) with a size range for rBC mass of dve∼90–550 nm (Schwarz et al., 2010b). This size range typically contains ∼90 % of the total rBC mass in the ambient accumulation mode (Schwarz et al., 2008; Shiraiwa et al., 2008).
PALMS. The particle analysis by laser mass spectrometry (PALMS) is a single-particle laser-ablation and ionization mass spectrometer instrument that measures size-resolved (dp∼0.1–5 µm) particle chemical composition with a fast response (Thomson et al., 2000; Murphy et al., 2006). Particle mass concentrations can be derived as a function of size when mapping the PALMS chemical composition to the size distributions reported from the UHSAS and LAS (above 100 nm dp), which is referred to as the PALMS-AMP products (Froyd et al., 2019). In this study, we focus on the different particle size ranges observed by PALMS and AMS, to illustrate the strengths and applications of the two aerosol composition instruments on board the DC-8. PALMS is the most complex of the chemical composition instruments used in ATom. It has both a very steep detection efficiency vs. particle size in the smaller particle range and the ability to measure much larger particles than the AMS. While the total reported mass (with some density uncertainty) of the PALMS-AMP products will always match the physical volume measurement over the range that PALMS reports (100–5000 nm dp), the uneven sampling data coverage of particles across each size bin, as well as the broadness of the bins chosen for PALMS-AMP analysis, can lead to a chemical bias if composition gradients exist within a bin (Fig. S13). Therefore, care must be taken to balance statistical representativeness against the need for unvarying particle composition across the size range over which those statistics are obtained (Froyd et al., 2019). In addition to the allocated four size bins that assume 100 % data coverage (Froyd et al., 2019), we also characterize the operational size coverage of PALMS based on the reported size resolution of the AMP particle size distributions (i.e., at higher size resolution) for ease of comparison with other instruments. The details can be found in Sect. S8.
SAGA. Gas-phase HNO3 plus particulate inorganic nitrate and sulfate were measured online with the University of New Hampshire (UNH) SAGA mist chamber (MC) ion chromatography (IC) at a time resolution of ∼80 s. Water-soluble chemical species were also measured offline by collecting particles with Zefluor filters (9 cm diameter, 1 mm thick, and 1 µm pore size, from MilliporeSigma Corp., Burlington, MA, USA) with subsequent procedures as described by Dibb et al. (1999, 2000) and Heim et al. (2020). In brief, filter samples were collected during level portions of each flight, stored over dry ice, extracted with ultrapure water, and sent back to the lab in UNH for IC analysis to quantify more species than the MC (Dibb, 2019).
SAGA filters were sampled from the UNH inlet with an estimated cutoff size of 4.1 µm () at the surface and 2.6 µm () at 12 km (McNaughton et al., 2007). The SAGA MC sampled from a glass-coated (vapor deposited) manifold (8 cm inner diameter) with high airflow (on the order of 2000 sL m−3 at low altitude) (as shown in Fig. S17). The diffuser type configuration at the manifold entrance boosts airflow, and the surrounding piece at the pipe tip excludes cloud droplets and giant sea salt particles (Talbot et al., 2003). The in-cabin part of the pipe till MC was heated to 50 ∘C to minimize HNO3 wall deposition, although sampled air T is assumed to be the same as ambient due to the high airflow and short residence time (∼0.2 s). A small glass tube from MC, which is sealed at the bottom and opens a small hole on the downstream side, sticks down into the manifold. This configuration provides a particle cutoff size of ∼1 µm () at the surface and lower at higher altitudes (van Donkelaar et al., 2008).
To be compared with other ATom aerosol measurements, the pressure-dependent SAGA MC and filter inlet transmissions are calculated based on the ATom conditions and summarized in the Supplement in Figs. S18 and S19, respectively.
2.6 Estimating aerosol volume from chemical instruments
For instrument comparisons, we estimate the aerosol volume based on the chemical instruments (Vchem). Vchem is determined from the AMS non-refractory mass concentrations plus the refractory species sea salt and rBC by assuming volume additivity, with an average particle density (ρm) estimated as in DeCarlo et al. (2004) and Salcedo et al. (2006).
The OA density (ρOA) is estimated with the AMS measured and atomic ratios of OA using the parameterization of Kuwata et al. (2012) (when OA is under the DL and hence no elemental ratios can be calculated, we assumed a default ρOA of 1.7 g cm−3 based on typical OA elemental ratios found for concentrations close to the DL; Fig. S20). The “improved-ambient” method was used for OA elemental analysis (Canagaratna et al., 2015; Hu et al., 2018). The combined density of SO4, NH4, and pNO3 is assumed to be 1.75 g cm−3, an approximation from ammonium sulfate, ammonium bisulfate, and ammonium nitrate (Sloane et al., 1991; Stein et al., 1994; Salcedo et al., 2006). The non-refractory chloride density is assumed to be 1.52 g cm−3 based on ammonium chloride (Salcedo et al., 2006). The sea salt volume is estimated from its AMS mass concentration with a density of 1.45 g cm−3, assuming particles had not fully effloresced prior to detection (Froyd et al., 2019). Sea salt is typically externally mixed with sulfate, organic, and nitrate internally mixed particles (Froyd et al., 2019); therefore, it is not routinely considered in the aerosol density estimation (such as in Eq. 5). The rBC volume is estimated from SP2 mass measurements (Katich et al., 2018) with a density of 1.77 g cm−3 (Park et al., 2004). The frequency distributions of ρm and ρOA are summarized in Fig. S21. The mass-weighted average ρm is 1.60±0.14 g cm−3 and 1.66±0.10 g cm−3, and ρOA (averaged from concentrations above OA DL) is 1.51±0.19 g cm−3 and 1.59±0.24 g cm−3 for ATom-1 and ATom-2, respectively. Negative AMS mass concentrations exist at low concentrations since the AMS uses a difference measurement (signal minus background). These negative AMS mass concentrations are kept as they are in deriving Vchem, otherwise a positive statistical bias would be introduced if a zero or a positive value was artificially assigned to those data points.
The exclusion of dust in the volume closure is reasonable in general based on the results in Sect. 3.2 due to the limited impacts from dust for ATom, on average 1.1±4.3 % (median =0.0 %) of the AMS observed volume, but it can contribute as high as 95 % for occasional short plumes encountered in ATom-2 (Fig. S22) (Froyd et al., 2019). Besides, we exclude the last ATom-1 research flight (a transit flight in the continental United States from Minneapolis, MN, to Palmdale, CA, different from the remote marine atmosphere of the other ATom flights) and <10 min of sampling impacted by volcanic ash near Hawaii in ATom-2 (Research Flight 203, 30 January 2017). As discussed above, we use 1 min AMS data for intercomparison, and 1 s Vphys is averaged to the same timescale. There may be a minor bias introduced from this approach since AMS periodic blank measurements exclude some 1 s data points from the AMS but not from Vphys (∼3 % of the total 1 s Vphys points), and similarly, some data are removed from the sizing measurements due to cloud masking but not for the AMS (13 %, discussed below in Sect. 3.2). In this study, the particle volume is reported in units of µm3 scm−3, where scm−3 are cubic centimeters of air under STP. When comparing Vchem to Vphys, orthogonal distance regression (ODR) is always used to derive the linear fitting slope (for comparing two variables with uncertainties), such as in Figs. 4–6.
2.7 Summary of the ATom aerosol size distribution and in-cabin instrument size ranges
Figure 1 summarizes the ATom-2 campaign-averaged number and volume size distributions from AMP and compares them to the subranges observed from several ATom aerosol instruments to provide context for this study and future instrument comparisons based on the ATom dataset (Brock et al., 2021, present a wider size coverage by combining the data from AMP and CAPS. Fig. S23 is the same as Fig. 1 except for showing the number size distribution in a log scale.). The upper cutoff sizes for LAS, SAGA MC, and filter, determined from their inlets, move towards smaller particles at higher altitudes; thus the size ranges plotted in Fig. 1 for these instruments are the best-case scenario (in the planetary boundary layer). In contrast, the AMS transmission stays the same up to ∼9 km. Based on Fig. 1, the AMS size range is more closely comparable to SAGA MC, and comparison to all the other instruments requires considering the different size ranges. Therefore, accurately characterizing AMS transmission is a prerequisite for quantitative instrumental intercomparisons. While the focus of this work is on in-cabin instrument comparisons, we want to emphasize that a properly characterized size cut is also important for model comparisons and that the size bins used in most global models, typically reported as dp, vary widely (Hodzic et al., 2020).
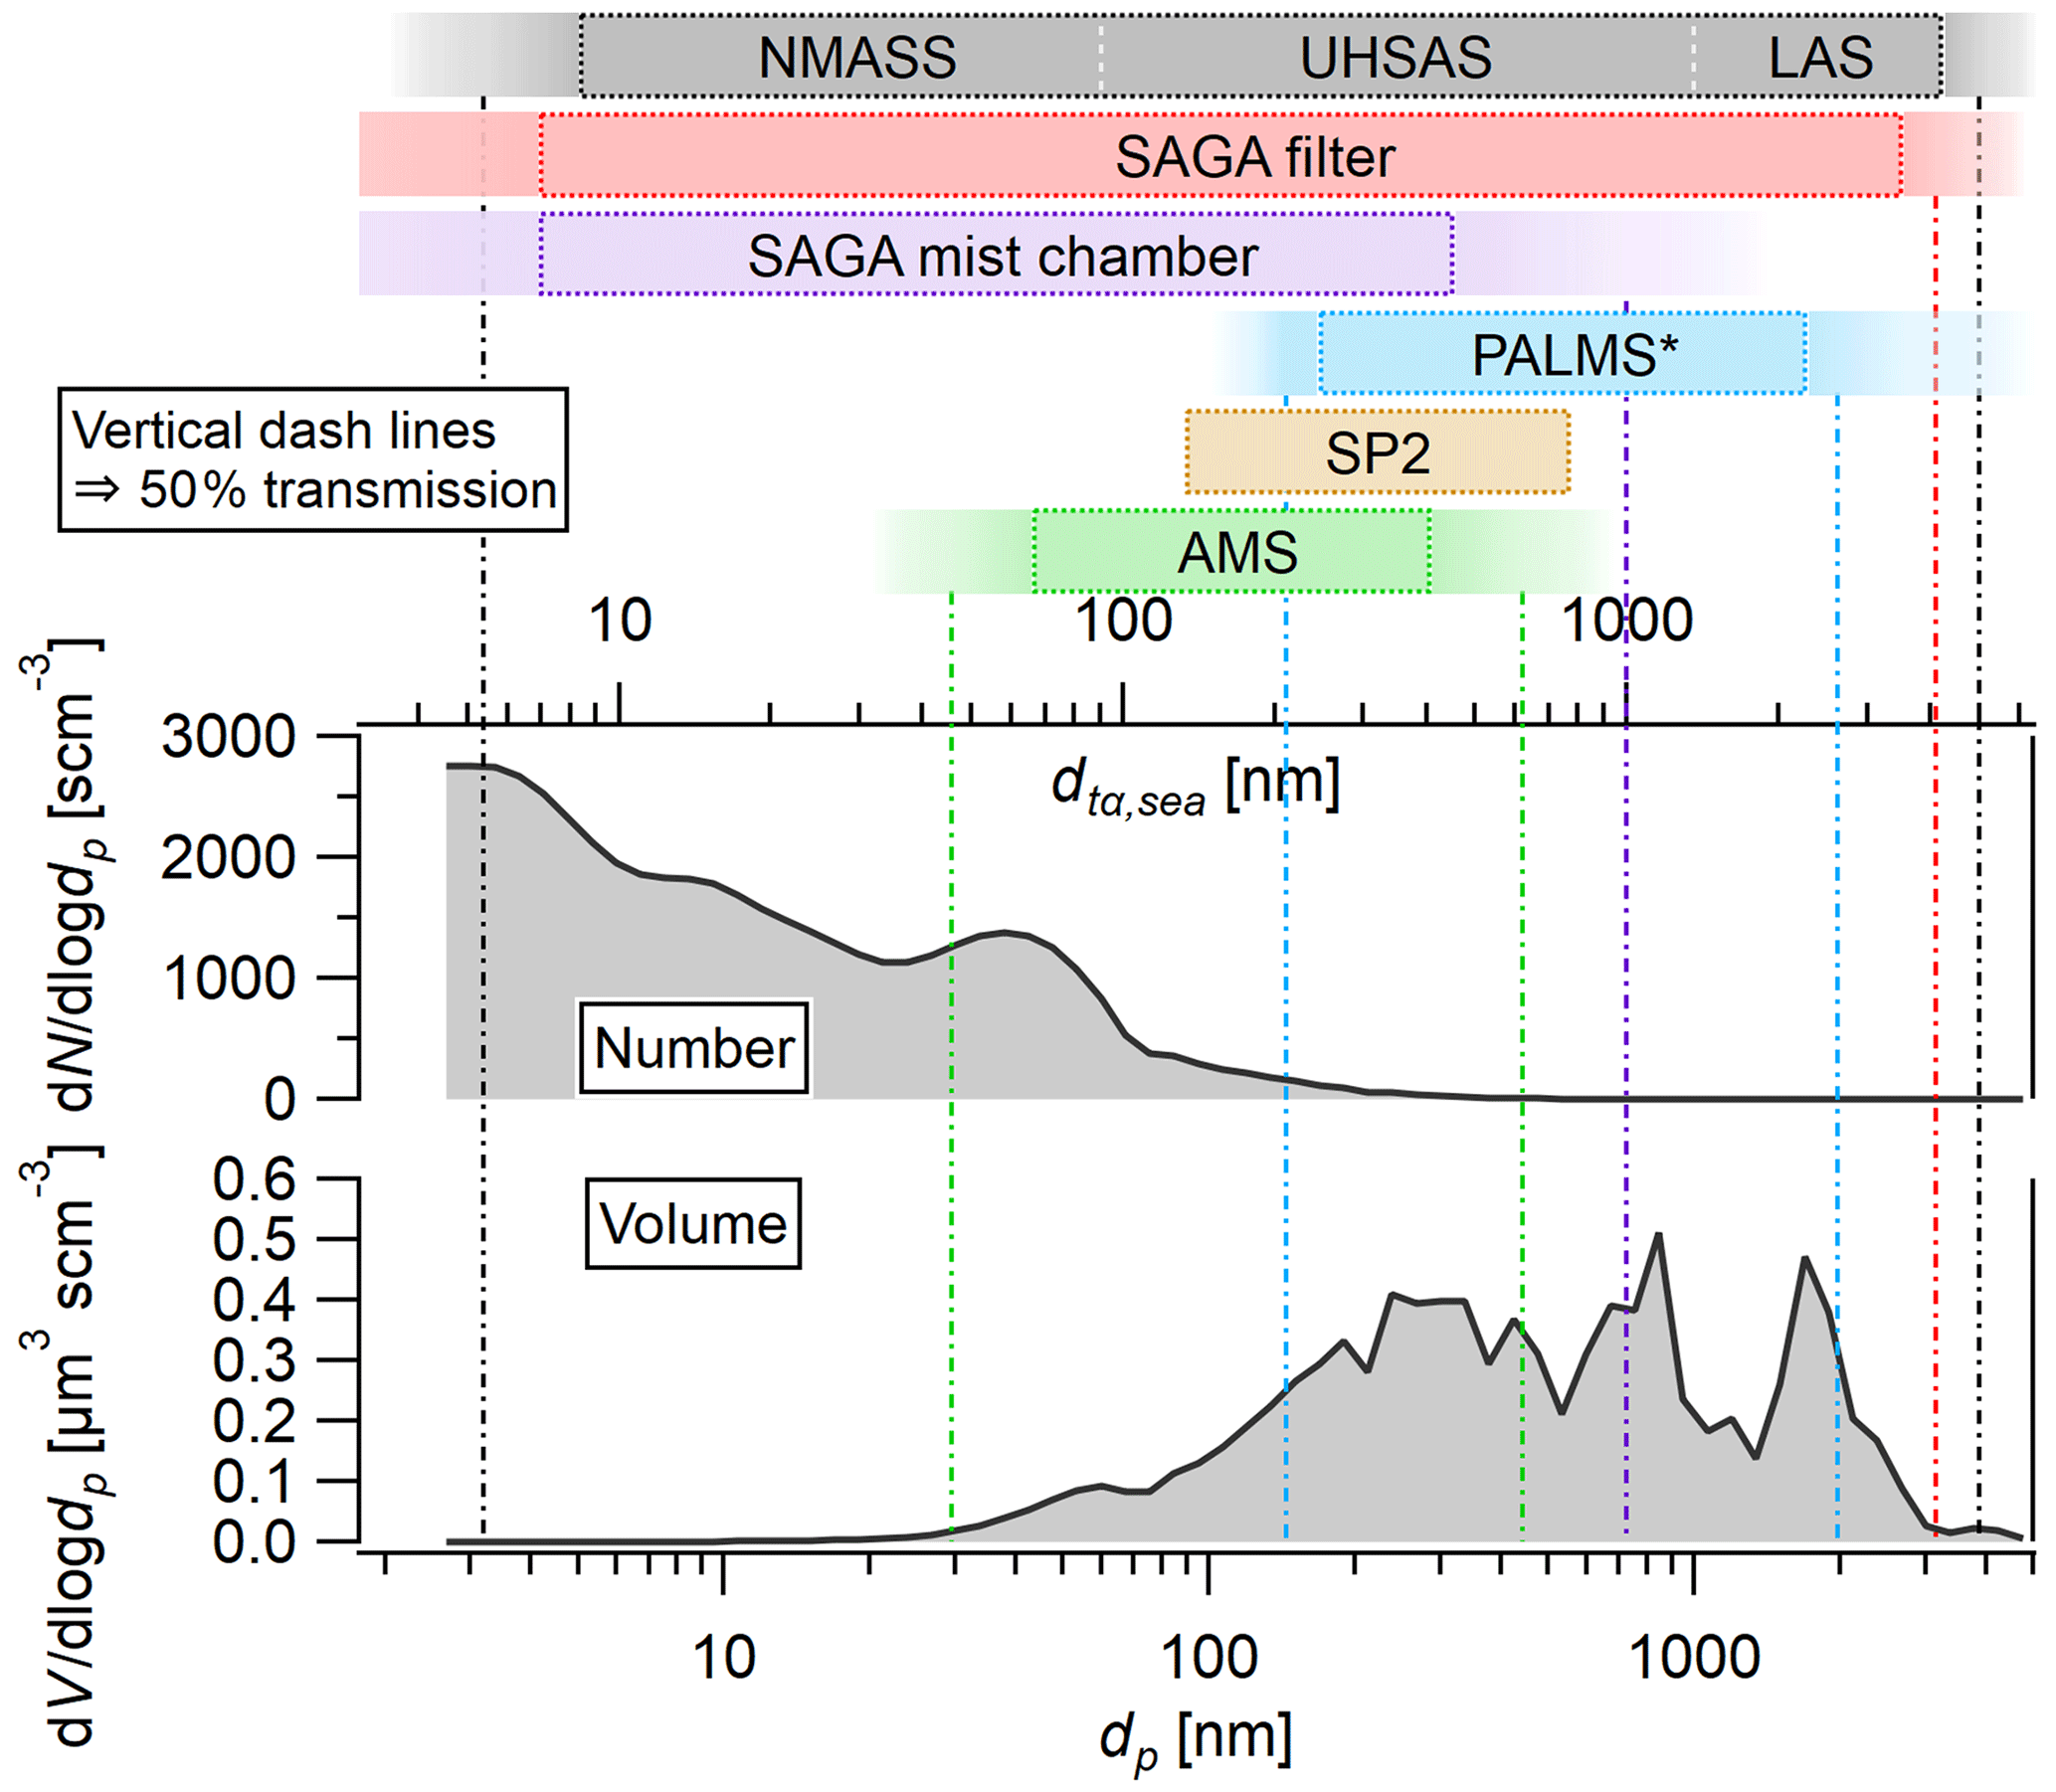
Figure 1Approximate particle size ranges quantified by AMS, SP2, PALMS, SAGA MC, SAGA filters, and AMP (NMASS, UHSAS, and LAS), plotted with the campaign-averaged AMP number and volume size distributions during ATom-2. For each instrument (except PALMS), the box indicates 100 % inlet transmission and the transition shade on both sides indicates a decrease from 100 % to 0 %, with 50 % denoted by the vertical dashed line. The PALMS bar represents the approximate observable size range at a 60 min averaging timescale (at AMP size resolution) for composition data only (see Sect. S8). The top horizontal axis shows aerodynamic diameter (dta,sea) and the bottom geometric diameter (dp); the conversion between the two diameters is based on ATom-2 campaign-averaged aerosol density of 1.70 g cm−3 and sea level P of 1013 mbar using Eq. (2).
3.1 AMS transmission
AMP gives nearly unity detection efficiency of the particles (not lost in the inlet) from ∼5 nm to ∼4 µm (dp) at sea level and 50 % transmission at 2.7 nm and 4.8 µm (inlet-limited), of which AMS, SAGA MC, PALMS, and SP2 observe a subrange (McNaughton et al., 2007; Brock et al., 2019a). Therefore, the volume derived from the AMP size distributions (Vphys) can be used as the basis for intercomparisons. Characterizing AMS transmission (EL) is critical for a meaningful comparison of Vphys vs. Vchem.
AMS transmission (always specified vs. dva) can be quite variable between instruments and can also change for a specific AMS in time, so it is critical to characterize the transmission in the field for meaningful instrumental intercomparisons (Liu et al., 2007; Knote et al., 2011; Hu et al., 2017; Nault et al., 2018). During ATom, the large particle region (∼500–1200 nm, dva) of the CU AMS transmission was calibrated in the field (Fig. 2). A fit to the multi-size field calibrations indicates a 100 % transmission at dva of ∼483 nm (1σ range: 445–525 nm) and a 0 % transmission at ∼1175 nm (1112–1241 nm), with 50 % transmission at 754 nm. This transmission was stable throughout the ATom-1 and ATom-2 deployments. The small particle region was calibrated in the lab, showing a 0 % transmission at 34 nm (33–35 nm) and a 100 % transmission at 74 nm (70–77 nm). The sizes are slightly better than previous and scarce measurements (Zhang et al., 2004; Knote et al., 2011), 0 % at 35 nm and 100 % at 100 nm. Other than new particle formation and growth events, the small particle end of the transmission curve is less critical in determining submicron aerosol volume since volume is normally dominated by the accumulation mode (which normally refers to the range 100–1000 nm dta) (Seinfeld and Pandis, 2016) instead of the Aitken mode (10–100 nm dta). Brock et al. (2019a) found the accumulation mode during ATom to be 60–500 nm dp, equivalent to 93–674 nm in dta,sea, as remote particles were far away from sources of precursor gases that could sustain growth to larger sizes. Sensitivity tests on the small particle transmission points (Sect. 3.4 below) confirm a lack of impact on the volume comparison for ATom conditions. AMS transmission curves for all ATom campaigns are shown in Fig. 3. Importantly, the AMS transmission for large particles improved noticeably for ATom-4 compared to the prior ATom legs possibly due to small changes in the inlet during reassembly. This shows the importance of characterizing EL for each campaign for quantitative intercomparisons. Similar changes have been observed in the past for other aircraft and ground campaigns.
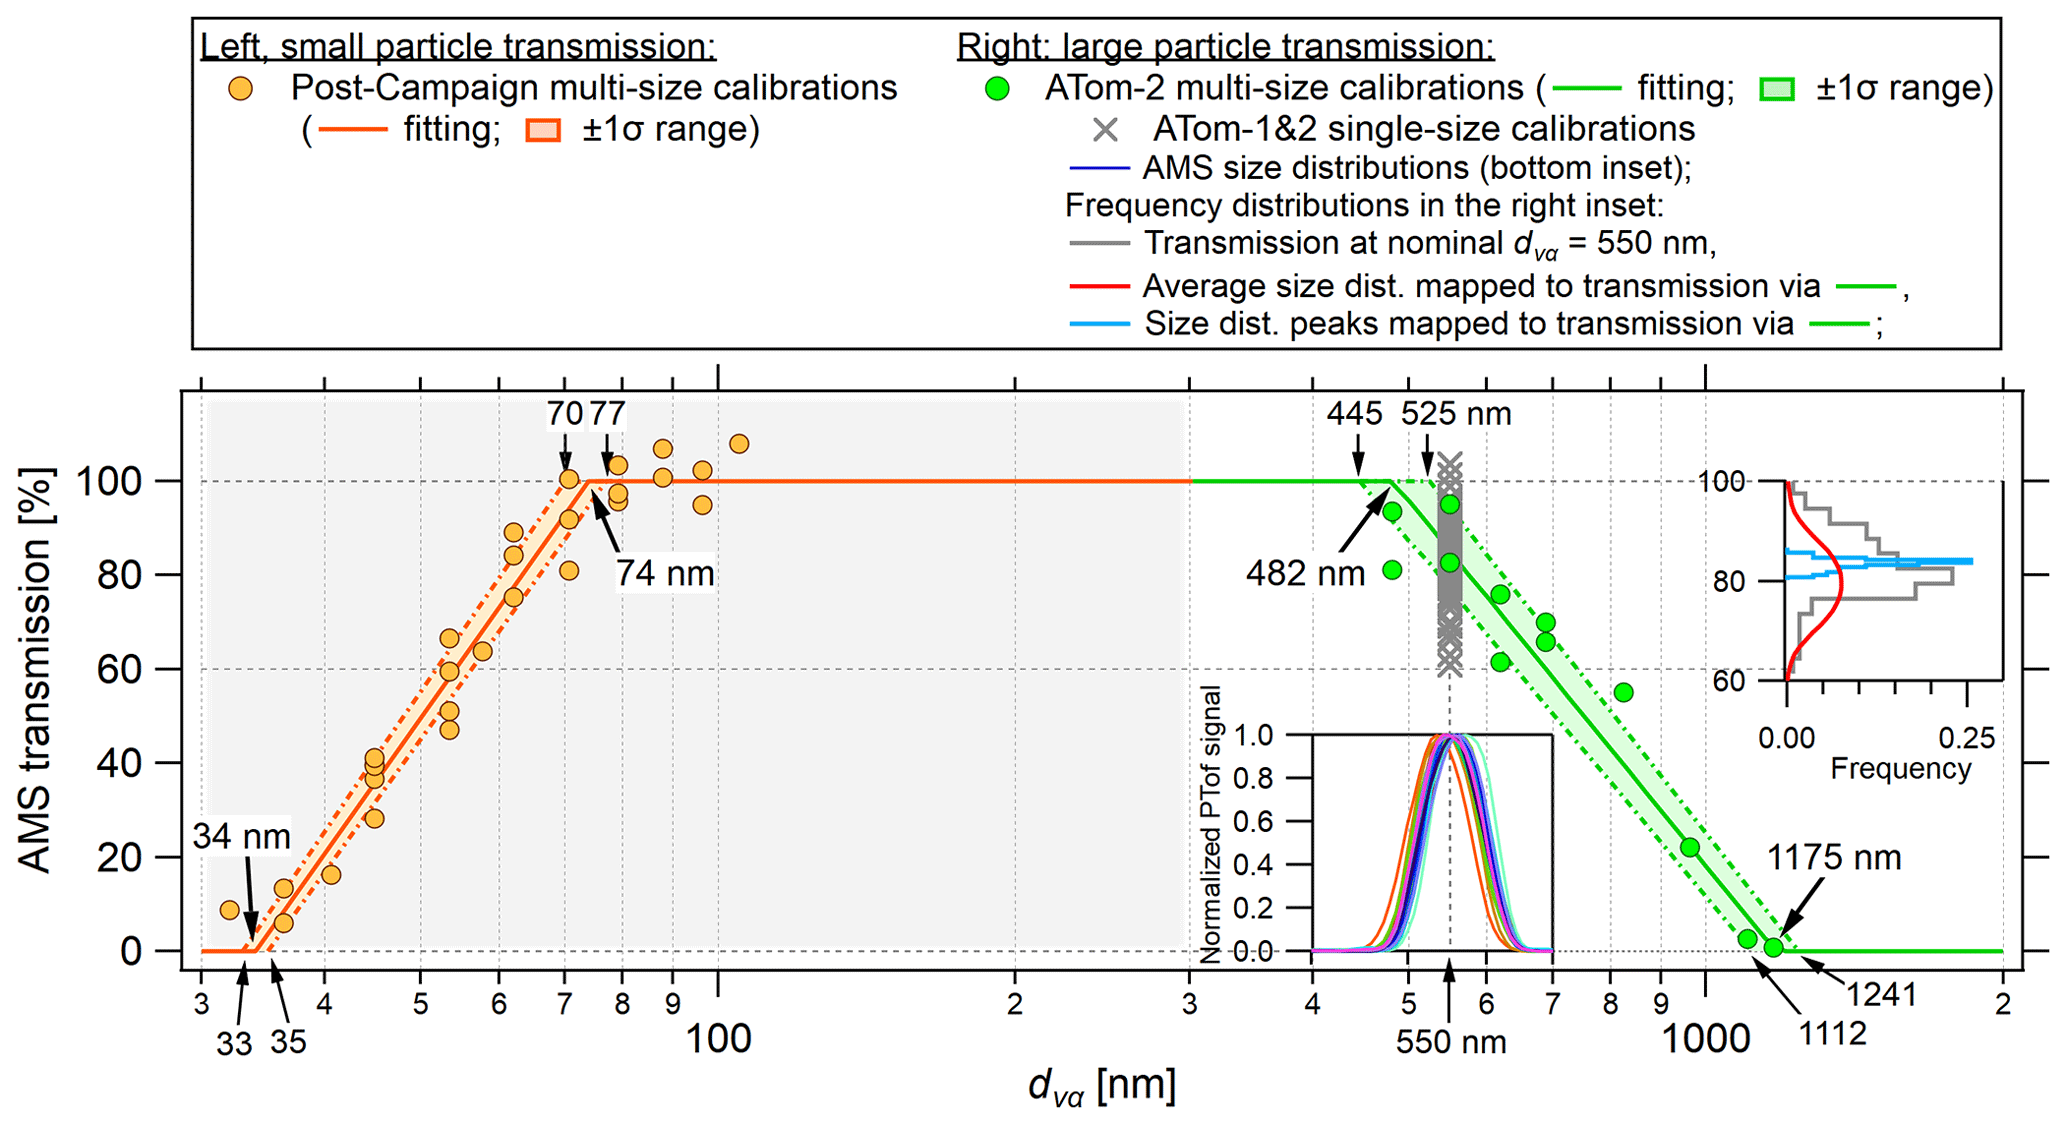
Figure 2Results of AMS transmission calibrations vs. vacuum aerodynamic diameter (dva) for ATom-1 and ATom-2. The small particle transmission was calibrated with oleic acid post-campaign (left), and the large particle transmission was calibrated with NH4NO3 particles in the field. On the right side, the green markers are multi-size field calibrations, and the gray cross markers are single-size (at dm=400 nm, equivalent to 550 nm dva) field calibrations after every research flight. The insets show the frequency distributions of measured transmissions (right, top) and observed, normalized size distributions (left, bottom) of these single-size calibrations. A fit shows 100 % transmission at 483 nm (1σ uncertainty of the fit: 445–525 nm) and 0 % transmission at 1175 nm (1σ: 1112–1241 nm). When forcing 0 % transmission at 1175 nm (confirmed by (NH4)2SO4 calibrations), the fit to all data gives 100 % transmission at 482 nm (1σ: 479–485 nm, not shown), consistent with the 483 nm fitted values based only on the ATom-2 multi-size field calibrations.
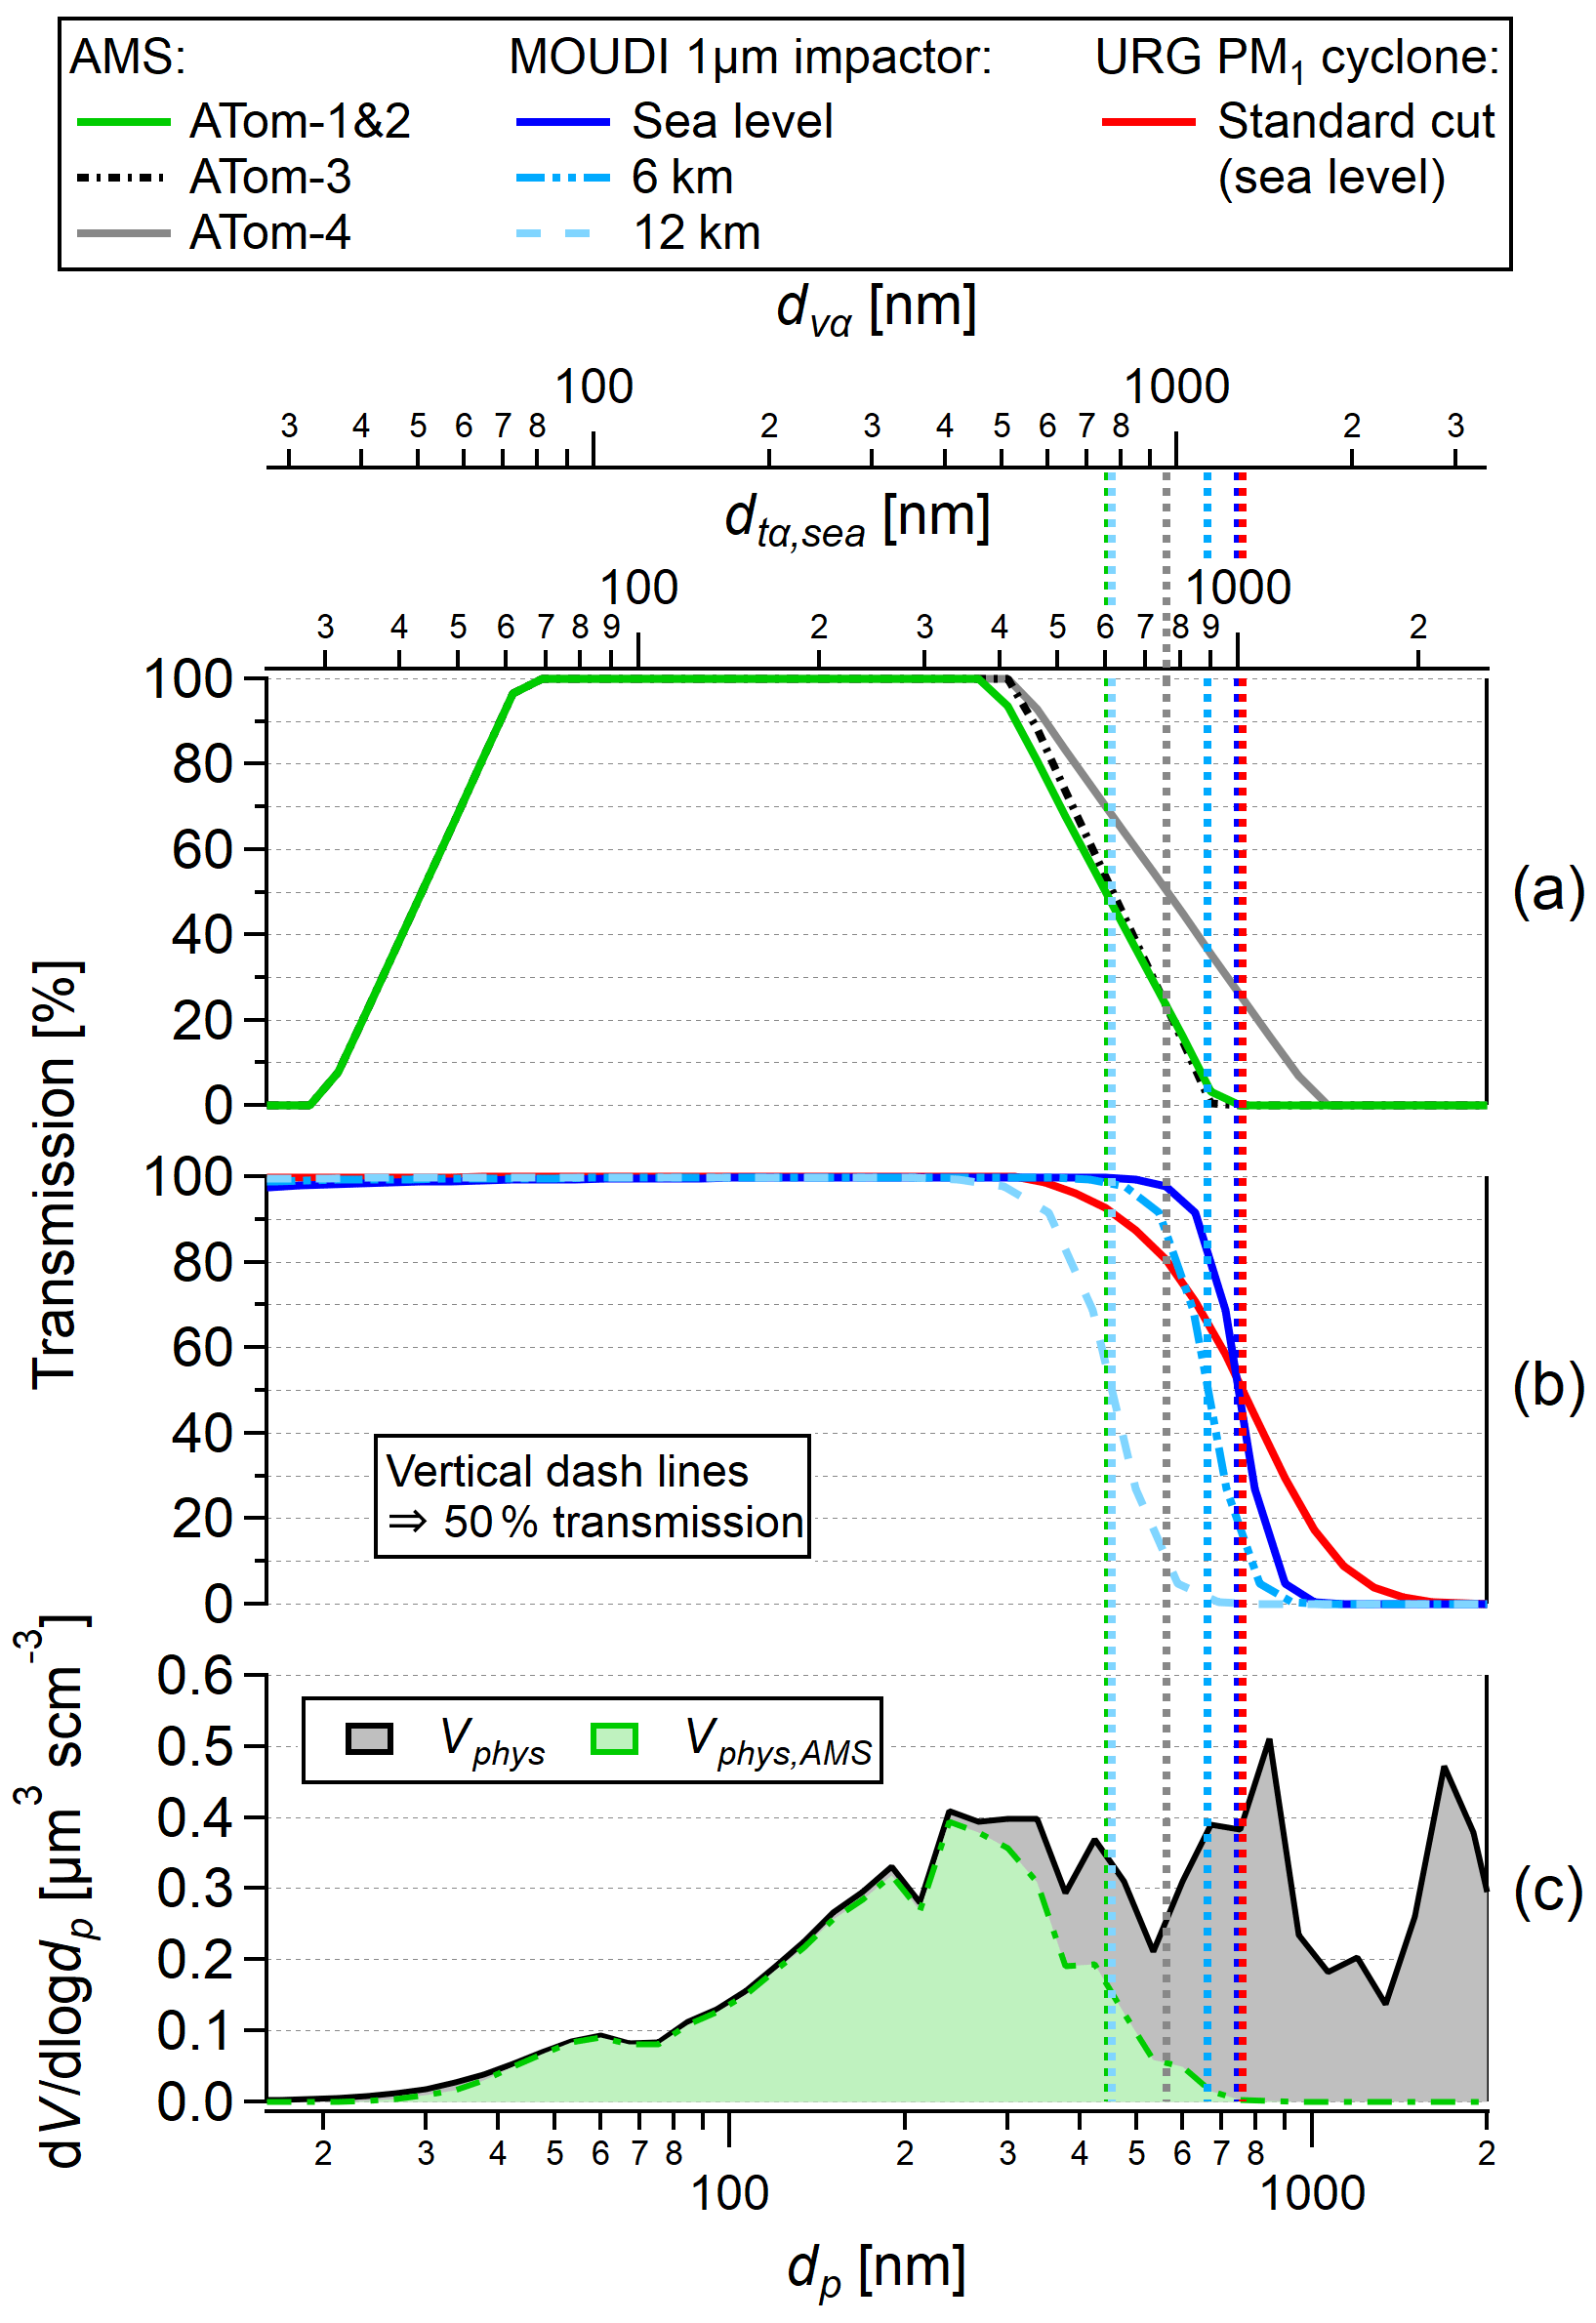
Figure 3Transmission curves (a) for AMS during ATom-1 (same for ATom-2), ATom-3, and ATom-4 deployments and (b) for MOUDI 1 µm stage impactor operated at sea level, 6 km, and 12 km (at T=293 K as typical cabin temperature and P based on the US standard atmosphere) (NOAA et al., 1976) and for URG PM1 cyclone (sea level). (c) Average AMP volume distribution (Vphys) and the fraction observed by AMS (Vphys,AMS) for ATom-2. Particle size in geometric diameter (dp; reported by AMP), vacuum aerodynamic diameter (dva; AMS), and aerodynamic diameter (dta; for the MOUDI impactor and URG cyclone; note that the MOUDI transmissions at 6 and 12 km are accurate on the dp and dva axes but slightly off on the sea level dta axis due to the change in slip correction) are shown as the three horizontal axes, all for dry particles. The 50 % large particle cutoff sizes for AMS, MOUDI, and URG are listed in Table S1 based on dta, dva, and dp. Because URG cyclone is normally used to size-select ambient particles for ground studies, the equivalent dry cut would be smaller than 1 µm, approximately 0.8 µm based on the aerosols sampled in this study (Sect. 3.5).
3.2 Comparison of AMS vs. standard PM1 size cuts
AMS is often described as an approximate “PM1” or “submicron” instrument. Since the standard definition of PM1 is based on devices that impose an aerodynamic diameter (dta) cut under ground-level pressure, temperature (e.g., defined as T=293.15 K and P=1013 mbar; Marple et al., 1991), and humidity, the equivalent AMS transmission in dta depends on particle density and composition, as well as the EL of the specific AMS for a given study. The careful transmission calibrations and extensive sampling of ATom allow for more precise characterizations of this cutoff size for the CU aircraft AMS and remote aerosols.
For aircraft sampling when a submicron cut is desired (not including the AMS), the single 1 µm stage from a micro-orifice uniform deposit impactor (MOUDI) (Marple et al., 1991, 2014) is often used (e.g., Peltier et al., 2008; Brock et al., 2011; Guo et al., 2016) to preselect submicron particles (the transmission is shown in Fig. S24). Here, we choose MOUDI instead of SAGA MC, also known as a submicron cut instrument deployed for aircraft studies, due to the lack of a published transmission curve for SAGA MC. Due to the higher temperature in cabin vs. ambient air (Guo et al., 2016), the MOUDI impactor (operating at cabin T and ambient P) is expected to size-select dry particles, similar to the AMS. The impactor provides a nominal PM1 cut at T=293.15 K and P=1013 mbar, but the dta,50 for a given particle is pressure and temperature dependent, and thus it varies with altitude. For instance, at an aerosol density of 1.7 g cm−3 (the ATom-2 campaign average), drops from 1 µm to 912 nm at 6 km and to 686 nm at 12 km height, based on the US standard atmosphere (NOAA et al., 1976), as shown in Fig. 3. Even lower cut sizes, 752 nm at 6 km and 400 nm at 12 km, are expected if the impactor was operated under ambient T (not typically done and best avoided for an optimal particle cut; summarized in Table S1). Hence, the deviation from the nominal 1 µm cut size can be very significant at high altitudes (although it could in principle be modulated by changing the flow rate vs. altitude). The pressure-dependent diffusion loss of small particles for MOUDI is estimated using the inlet system on board the NCAR/NSF C-130 from Guo et al. (2016), a ∼2.5 m tubing with an inner diameter of ∼1.1 cm. Given a flow rate of 30 L m−3, Reynolds number is 3858 at sea level and increases with altitude, indicating a turbulent flow in the inlet.
If we compare the AMS transmission to ground-level-based dry dta (using a dry particle density of 1.7 g cm−3 to calculate dta from dva), the ATom-2, ATom-3, and ATom-4 values are 599, 615, and 758 nm, respectively (the values are higher and listed in Table S1; for example, is 782 and 837 nm at 6 and 12 km, respectively, for ATom-4). Thus the cutoff size of the AMS in ATom is more stringent than a MOUDI nominal PM1 cut at the surface and 6 km and less stringent at the higher altitudes in ATom-4. Importantly, the AMS transmission stays constant up to ∼9 km in altitude for the implemented PCI. No in-field characterization of the AMS transmission at higher altitudes (when inlet pressure slips) was performed, but laboratory calibration shows no change in transmission at 710 nm dva at the max altitude inlet pressure (1.05 Torr).
For ground studies, URG PM1 standard cut (model: URG-2000-30EHB) and sharp cut (model: SCC 2.229) cyclones are widely used for non-AMS instruments. The estimated diffusion loss of small particles in the URG cyclones was negligible (e.g., 5 % loss at nm and less loss expected at larger sizes), calculated with a nominal flow rate of 16.7 L m−3 and assumed cyclone internal dimensions of 0.50 inch (1.27 cm) in diameter and 50 cm in length (Reynolds number =2100, indicating a likely turbulent flow). The two cyclones offer cutoff sizes at 1 µm at T=293.15 K and P=1013 mbar (Fig. S24) and smaller cuts when such cyclones are deployed at lower ambient pressure and the nominal volumetric flow, e.g., at a mountain site.
One additional complexity arises since the standard PM1 cut made with URG cyclones are under ambient humidity conditions (i.e., particles are not dried prior to sampling). Thus, the equivalent dry particle cut size is below 1 µm at sea level and depends on the amount of liquid water associated with the particles. For the ATom conditions, particle size shrinks on average ∼20 % (assuming a complete loss of the predicted particle liquid water content from the higher ambient RH, mean/median(± SD) %, to the lower inlet RH, %; Fig. S2c–d), and the frequency distribution plots are shown in Fig. S25 (SD stands for standard deviation). While AMS transmission is characterized by dry particles, a smaller difference between the AMS transmissions and the cyclone transmissions is expected compared to Fig. 3. Taking the estimated ∼20 % shrinkage in particle size from drying in the sample line (for the ATom-1 and ATom-2 conditions), the AMS transmission would be equivalent to a standard PM0.75 and a PM0.95 cut during ATom-2 and ATom-4, respectively, in terms of ambient aerosol size.
Since aerosol density affects the conversion between dva and dta (Eqs. 1–2), a higher AMS dta,50 is expected if sampling aerosols with lower densities than the ATom-2 campaign average of 1.70 g cm−3. To illustrate this point further, results based on an assumed 0.9 g cm−3 aerosol density, typical of hydrocarbon-like OA from lubricating oil or oleic acid as a cooking aerosol surrogate (Kuwata et al., 2012; Herring et al., 2015), are shown in the Supplement in Fig. S26b. In this case, the ATom-2 and ATom-4 AMS values increase to 789 and 1006 nm, respectively, making the ATom-4 AMS a dry PM1 cut when performing experiments with those aerosols.
It is also useful to compare the sharpness of the different transmission curves. The sharpness of transmission is commonly defined as (, where dta,16 and dta,84 are particle aerodynamic diameters at 84 % and 16 % transmissions (Peters et al., 2001). The sharpness of the AMS transmission profiles is similar to that of a URG PM1 standard cut cyclone: 1.34 in ATom-2 and 1.49 in ATom-4 compared to 1.35 and 1.17 of the URG standard cut and sharp cut cyclones (a lower number indicates a sharper cut). The MOUDI 1 µm stage impactor provides the sharpest cut at 1.12 at sea level, but the sharpness decreases at higher altitudes, 1.15 at 6 km and 1.22 at 12 km.
Including all effects, the CU aircraft AMS was approximately equivalent to a standard ground-level PM0.75 instrument during ATom-2 and a PM0.95 instrument during ATom-4. For laboratory or field experiments with oily particles with an aerosol density of 0.9 g cm−3, the same AMS would be a PM0.79 or PM1.0 instrument in terms of dry aerosol size.
3.3 Volume closure
AMS observes a fraction of the full AMP size distributions, as shown in Fig. 3. To properly characterize the part of Vphys observed by the AMS, we first convert the calibrated dva-based AMS transmission to its dp-based form (using Eq. 1) with the time-resolved ρm estimated from the AMS (Eq. 5). This volume is referred to as Vphys,AMS (the AMS-transmission-corrected Vphys). The comparisons between Vphys,AMS and Vchem for ATom-1 and ATom-2 are shown in Fig. 4. Good agreement is observed, with the data points distributed around the 1:1 line over a 3-order-of-magnitude range of concentrations. For ATom-1 the regression slope is 0.95 (0.949±0.003), and r2 is 0.95. The larger volume concentrations were generally detected in the boundary layer. Time averaging reduces random noise (more dominant at smaller volumes), as evidenced when comparing this analysis for 1, 5, and 10 min averages (Fig. S27). The fitting slope being slightly further from 1 (1.083±0.003) in ATom-2 (r2 of 0.93) may be due to the larger contribution of sea salt in ATom-2 in the boundary layer (Hodzic et al., 2020) and hence the larger uncertainty arising from applying the AMS size cut. Nevertheless, the slopes for ATom-1 and ATom-2 are well within the combined instrumental uncertainties (discussed in this section). To illustrate the impacts of sea salt, we replotted the comparisons (Fig. 4a–b) colored by sea salt shown in Fig. S28a–b, which suggests that some outliers in ATom-2 are observed at high sea salt concentrations. We also investigate the potential differences in the data products due to the differences in raw data processing criteria for cloud artifacts between AMS and AMP and find no clear evidence (Fig. S28c–d). Furthermore, we confirm that excluding submicron dust volume is reasonable; only a few outliers have noticeably higher contributions from dust (Fig. S28e–f). Besides, as a sensitivity test, we estimate Vphys,AMS based on broader bin widths to test the impact of AMP size resolution. We find that using 10 or 5 bins per decade has minor effects compared to the AMP-reported 20 bins per decade (0.4 % deviation in slope for 10 bins per decade and ∼1.6 % for 5 bins per decade) despite the slightly larger scatter as expected from applying AMS transmission to a coarser size distribution (Fig. S29).

Figure 4Comparison between Vchem and Vphys,AMS for (a) ATom-1 and (b) ATom-2, with data points colored by altitude and averaged to 5 min resolution. Vchem is also compared to Vphys, as the gray markers, to show the effect of not applying the AMS inlet transmission. (c) A time series of these volumes for a research flight in ATom-2, with an inset showing the scatter plot only for this flight (at 1 min timescale, as also shown for the time series). Note that Vchem includes the AMS-quantified sea salt. Two correlation coefficients (r2) are listed: one at linear scale (commonly used) and the other at logarithmic scale, which emphasizes the scatter at low concentrations.
Species density is used to convert the AMS mass to volume concentrations and thus affects the volume comparison. As discussed above (Fig. S21), ρOA in this study is estimated with the parameterization method of Kuwata et al. (2012). The ρOA parameterization method from Kuwata et al. (2012) was validated up to 1.9 g cm−3 (i.e., oxalic acid), and the lab generated SOA in that study had up to 1.46 g cm−3 ρOA with an of 0.72. The estimated ATom-1 and ATom-2 ρOA is close to that of succinic acid, 1.57 g cm−3, which has a similar ratio (ATom-1 and ATom-2 vs. succinic acid: 1.05±0.44 vs. 1.0), and falls into the observed ρOA density range, 1.5–1.7 g cm−3, for low mass concentrations of SOA (<3 µg m−3, as was the case during most ATom flights) made from α-pinene and ozone from a chamber study (Shilling et al., 2009). However, ρOA estimated from PALMS, 1.35–1.45 g cm−3 (Froyd et al., 2019), is ∼0.2 g cm−3 lower than that estimated from AMS for reasons that are not yet understood. As a sensitivity check, we recalculate Vchem by subtracting 0.2 g cm−3 from the AMS estimated ρOA (Fig. S30). Compared to the base cases (Fig. 4a–b), the r2 values barely change, and the slopes increase by 5 % or 8 % due to the higher estimated OA volume in Vchem. Therefore, this uncertainty is below 10 % and does not undermine the agreement within the uncertainties between Vchem and Vphys,AMS.
To illustrate that applying the AMS transmission to Vphys is a prerequisite for a meaningful comparison, Fig. 4c illustrates the volume closure for a research flight in ATom-2 (RF208, 15 February 2017, from Ascension to the Azores), in which the contribution of supermicron particles to total volume is significant. Although Vphys was, in general, several times larger than Vchem when the DC-8 flew at lower altitudes (below ∼3 km), Vphys,AMS agrees very well with Vchem with a regression slope of 1.04 and an r2 of 0.97. The effect of applying the AMS transmission to Vphys is also shown in Fig. 3a and b as the gray markers on the campaign level. Clearly, at times the effect is major, and at other times minimal, depending on the ambient size distribution. When AMS transmission is not characterized, an alternative for volume intercomparison is to truncate Vphys at a certain size (e.g., 1 µm). In this case, the intercomparison is not ideal (shown in Fig. S31 with slopes of 0.74 and 0.65 for ATom-1 and ATom-2, respectively, with more scatter for ATom-1), highlighting the importance of calibrating and applying the inlet transmission. To examine if applying the AMS transmission introduces a systematic bias, Fig. 4a–b was replotted and colored by the removed fraction of Vphys (in the Supplement in Fig. S32). The binned data points at 20 % intervals show little difference, suggesting that no significant bias is arising for this reason for both ATom-1 and ATom-2. An exception is the 80 %–100 % bin for ATom-2 due to some outliers with high sea salt as shown in Fig. S28b and possibly the increased statistical noise, with only 25 % of the data points in this bin compared to ATom-1.
Box plots, regressions, and correlations were carried out for the separate datasets in each bin of removed Vphys, as shown in Fig. 5a–c. For the combined ATom-1 and ATom-2 data (Fig. 5a), the majority of the volume ratios are distributed around the 1:1 line and within the combined systematic uncertainty range (combined 2σ of AMS and UHSAS, the size spectrometer that overlaps most with the AMS; see Fig. 1). If using the UHSAS data product alone and applying the AMS transmission, the resulting volume is on average 93±9 % in ATom-1 and 87±14 % in ATom-2 compared to Vphys,AMS. Therefore, the UHSAS uncertainty is representative of that of Vphys,AMS. The Vphys uncertainty depends on particle size range or mode (see Table 1 in Brock et al., 2019a), and the random uncertainty in Vphys is expected to be smoothed out with longer averaging timescales. All five bins show high correlations with r2 of 0.79–0.96 with a lower correlation at the 80 %–100 % Vphys removal bin. The smallest slope of 0.84 is also seen in this bin, where the largest discrepancy is expected due to the combined sharpness of the decreasing AMS transmission for larger particles and the rising tail of coarse mode particles into the submicron size range (e.g., the AMS transmission excludes on average 89 % of the total sea salt volume sampled during ATom-2). When investigating ATom-1 and ATom-2 independently, ATom-1 averages are slightly below unity but consistent throughout the five bins (Fig. 5b), and ATom-2 shows an increasing bias above 60 % Vphys removal (again likely due to the much higher sea salt fractional contribution for this campaign). Only the 80 %–100 % bin in ATom-2 has substantial data outside the 2σ uncertainty range. Overall, the above results suggest the in-field characterized AMS transmission is robust for the various conditions encountered in the ATom-1 and ATom-2 studies.
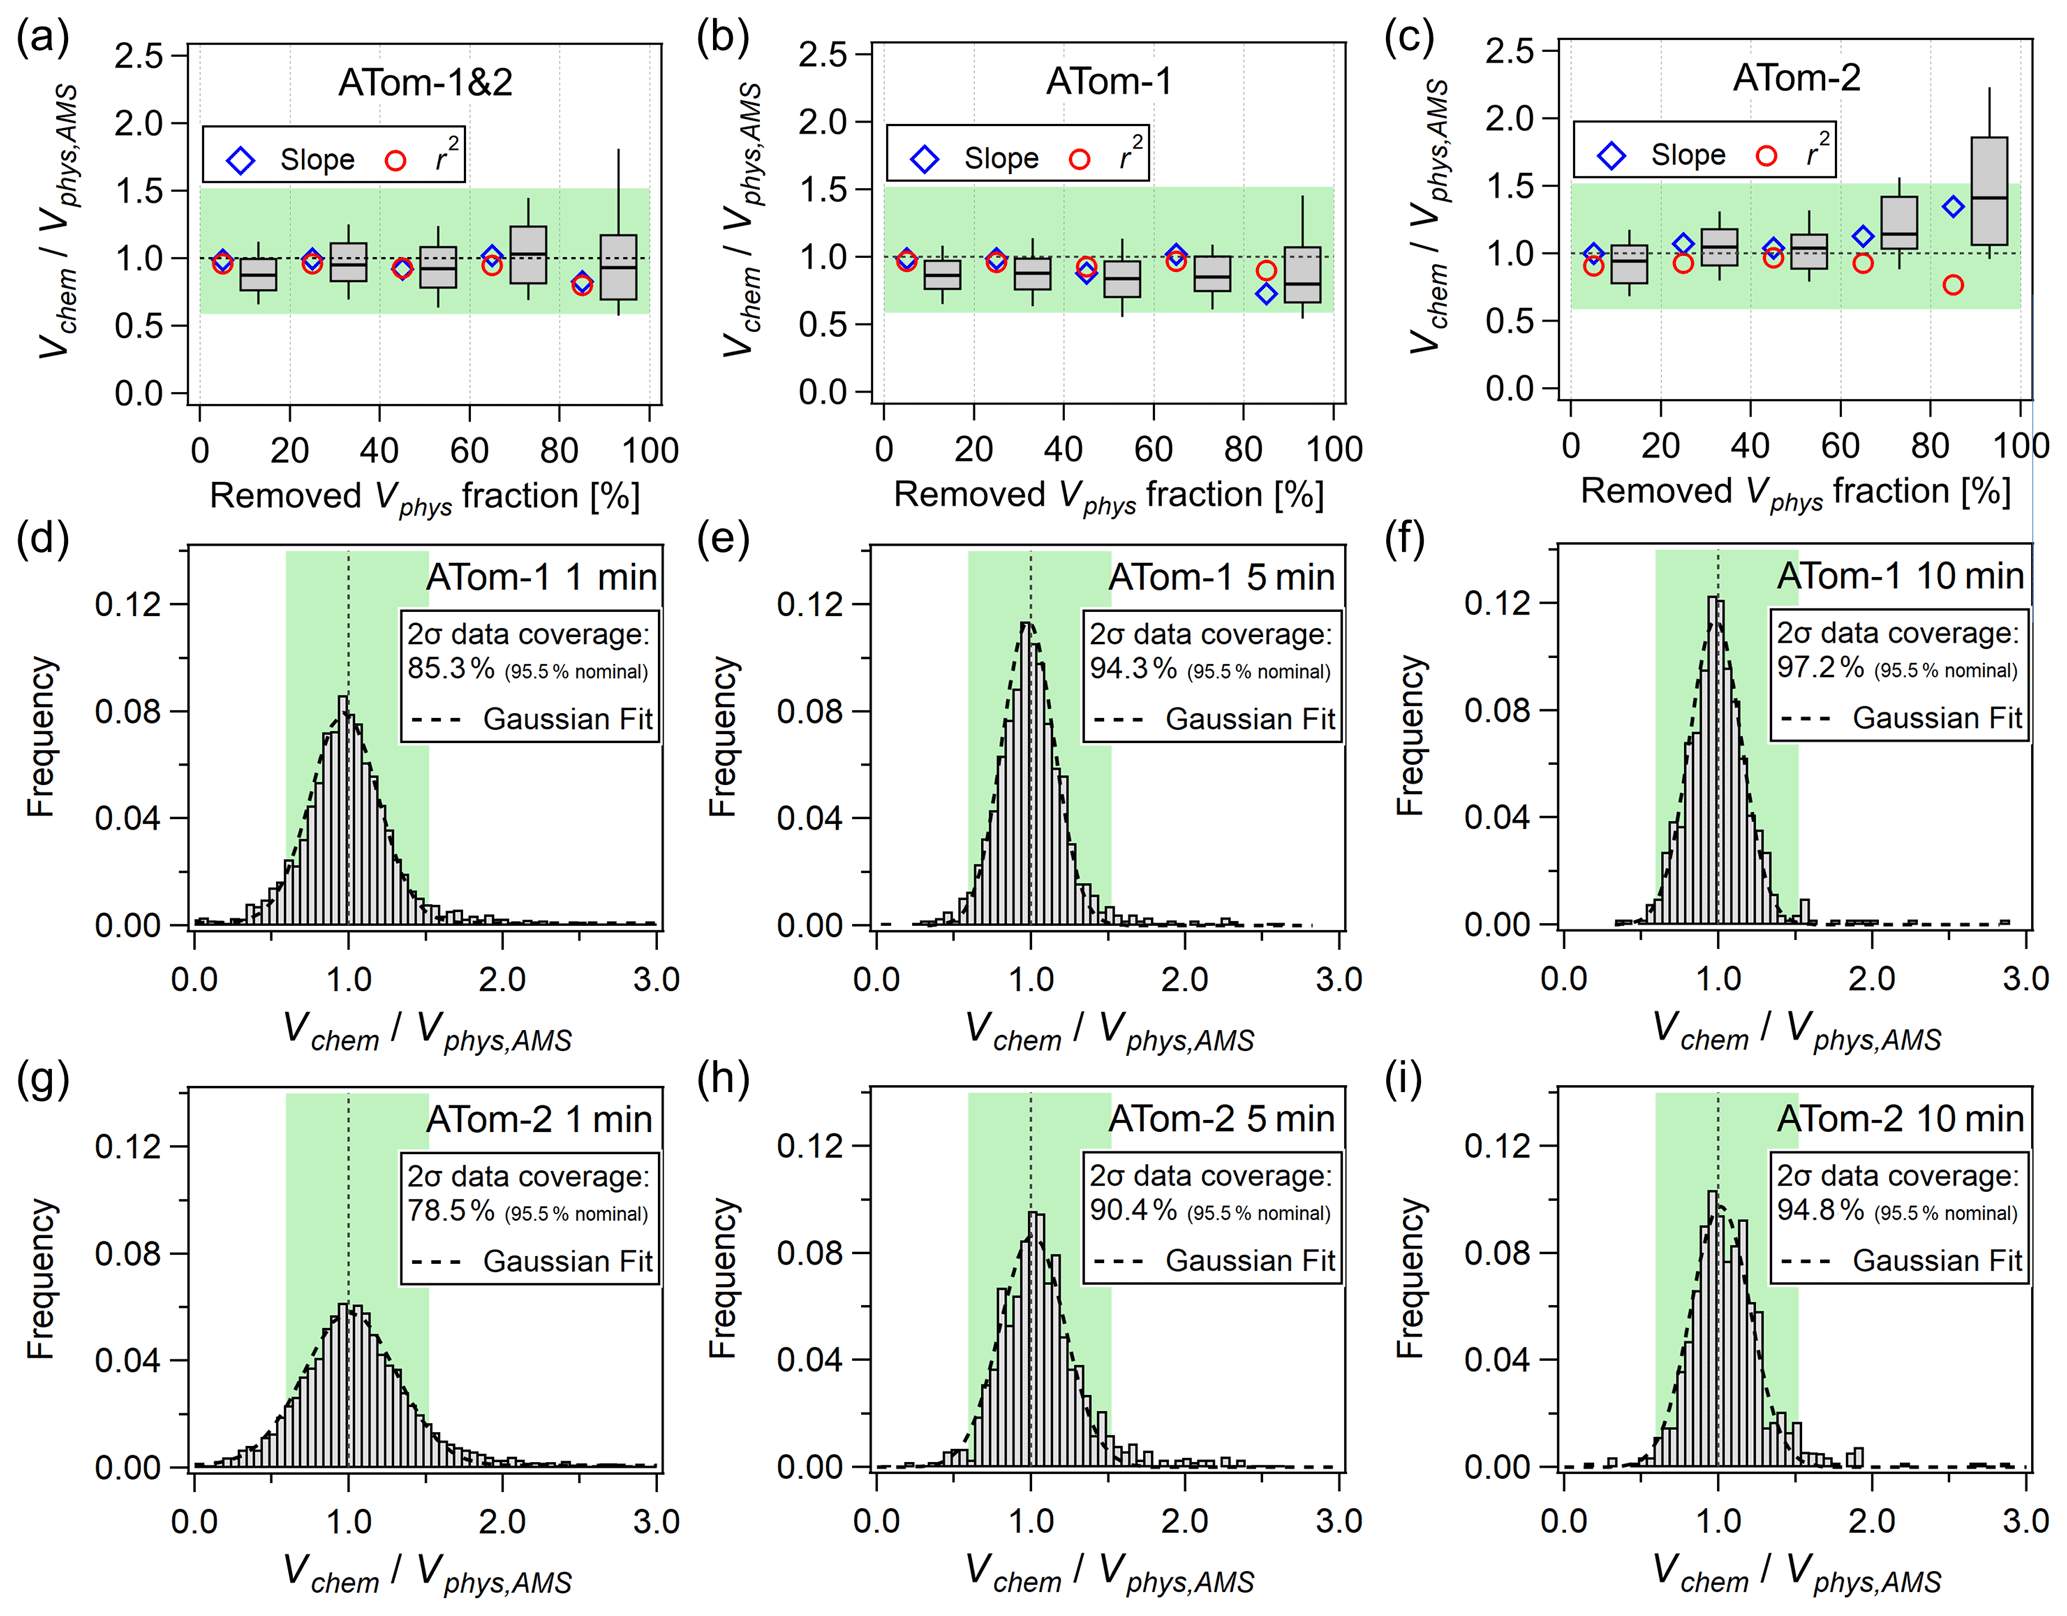
Figure 5Box plots of and the linear regression fitting slopes and correlations of the two volumes for (a) the combined ATom-1 and ATom-2 datasets, (b) ATom-1, and (c) ATom-2, binned by removed Vphys fraction when applying AMS transmission (at 20 % interval). The 10th, 25th, 50th, 75th, and 90th percentiles are plotted with the box and whiskers. The binned scatter plots can be found in the Supplement in Fig. S33. Panels (d–i) are the normalized frequency distributions of the volume ratio for ATom-1 and ATom-2, respectively, at three averaging timescales: (a, d, g) 1 min, (b, e, h) 5 min, and (c, f, i) 10 min. The green-tinted backgrounds indicate the combined 2σ accuracy from AMS (38 %; 2σ) (Bahreini et al., 2009) and UHSAS (; treated as 1.5σ in this study) (Kupc et al., 2018).
While binning the data is useful for exploring possible systematic biases, looking at the overall deviations of the individual measurements allows us to explore to what extent the reported instrument uncertainties are consistent with the ATom dataset. Figure 5d–i shows the frequency distributions of the volume ratio, , together with the combined 2σ accuracy of AMS and UHSAS. The ATom-2 data distribution is slightly broader than ATom-1 partly owing to the larger precision error (e.g., when mass concentration is within 3 times of the DLs) associated with the lower submicron mass concentrations, 0.38 vs. 0.50 µg m−3. A longer averaging time can deemphasize the precision errors, especially for a dataset like ATom with few sharp plumes. Thus, we plot the volume ratio at three timescales: 1, 5, and 10 min. It shows a clear improvement in the spread of the ratio as the averaging timescale increases, with the 10 min data being consistent with the reported accuracies. This supports the good quality and consistency of the ATom aerosol dataset, and it also supports the reported AMS accuracies.
3.4 Sensitivity tests to AMS transmission
The above discussion demonstrates the critical role of well-characterized AMS transmission for meaningful volume intercomparison. In this section, we aim to quantify the impact of the AMS transmission on the volume comparison by artificially adjusting the transmission with a series of sensitivity tests. As shown in Fig. 6a, the AMS transmission can be characterized by four “anchoring” particle sizes, representing 0 % and 100 % transmissions at both ends. During ATom-1 and ATom-2, these anchoring sizes (in dva) were estimated as (i) 35 nm, (ii) 100 nm, (iii) 482 nm, and (iv) 1175 nm, as discussed above (Fig. 2). Uncertainty ranges are estimated for the latter two sizes from the ATom calibrations and shown in Fig. 6d–e. We alter one anchoring size at a time, recalculate Vphys,AMS, and recompare to Vchem, which is kept unchanged. The resulting slopes and r2 are summarized in Fig. 6. The adjustments at the two lower anchoring sizes, up to ±25 nm at 35 nm and ±50 nm at 100 nm, have a negligible impact on the volume comparison due to the small volume and mass concentrations at these sizes during ATom (e.g., Fig. 3), except for the unrealistic 50 nm decrease at 100 nm (the second anchoring point). In contrast, a dependency of the fitting results on the details of the AMS transmission curve for large particles is observed. For the third anchoring point, corresponding to the largest particles with 100 % transmission (Fig. 6d), a smaller dva excludes more Vphys and results in a higher slope. For example, at the lower 1 SD limit dva of 445 nm, the fitting slopes increase from 0.97 to 1.01 for ATom-1 and 1.09 to 1.12 for ATom-2. These small changes in slope are the largest among the four anchoring points, and they are statistically significant because the changes are 1 magnitude higher than the fitting 1σ uncertainties of the slopes (∼0.03 vs. ∼0.004). In all the cases investigated, r2 barely changes. The importance of the upper end transmission is also highlighted in a ground-based intercomparison for ACSM that used a similar aerodynamic lens as the AMS (Poulain et al., 2020).
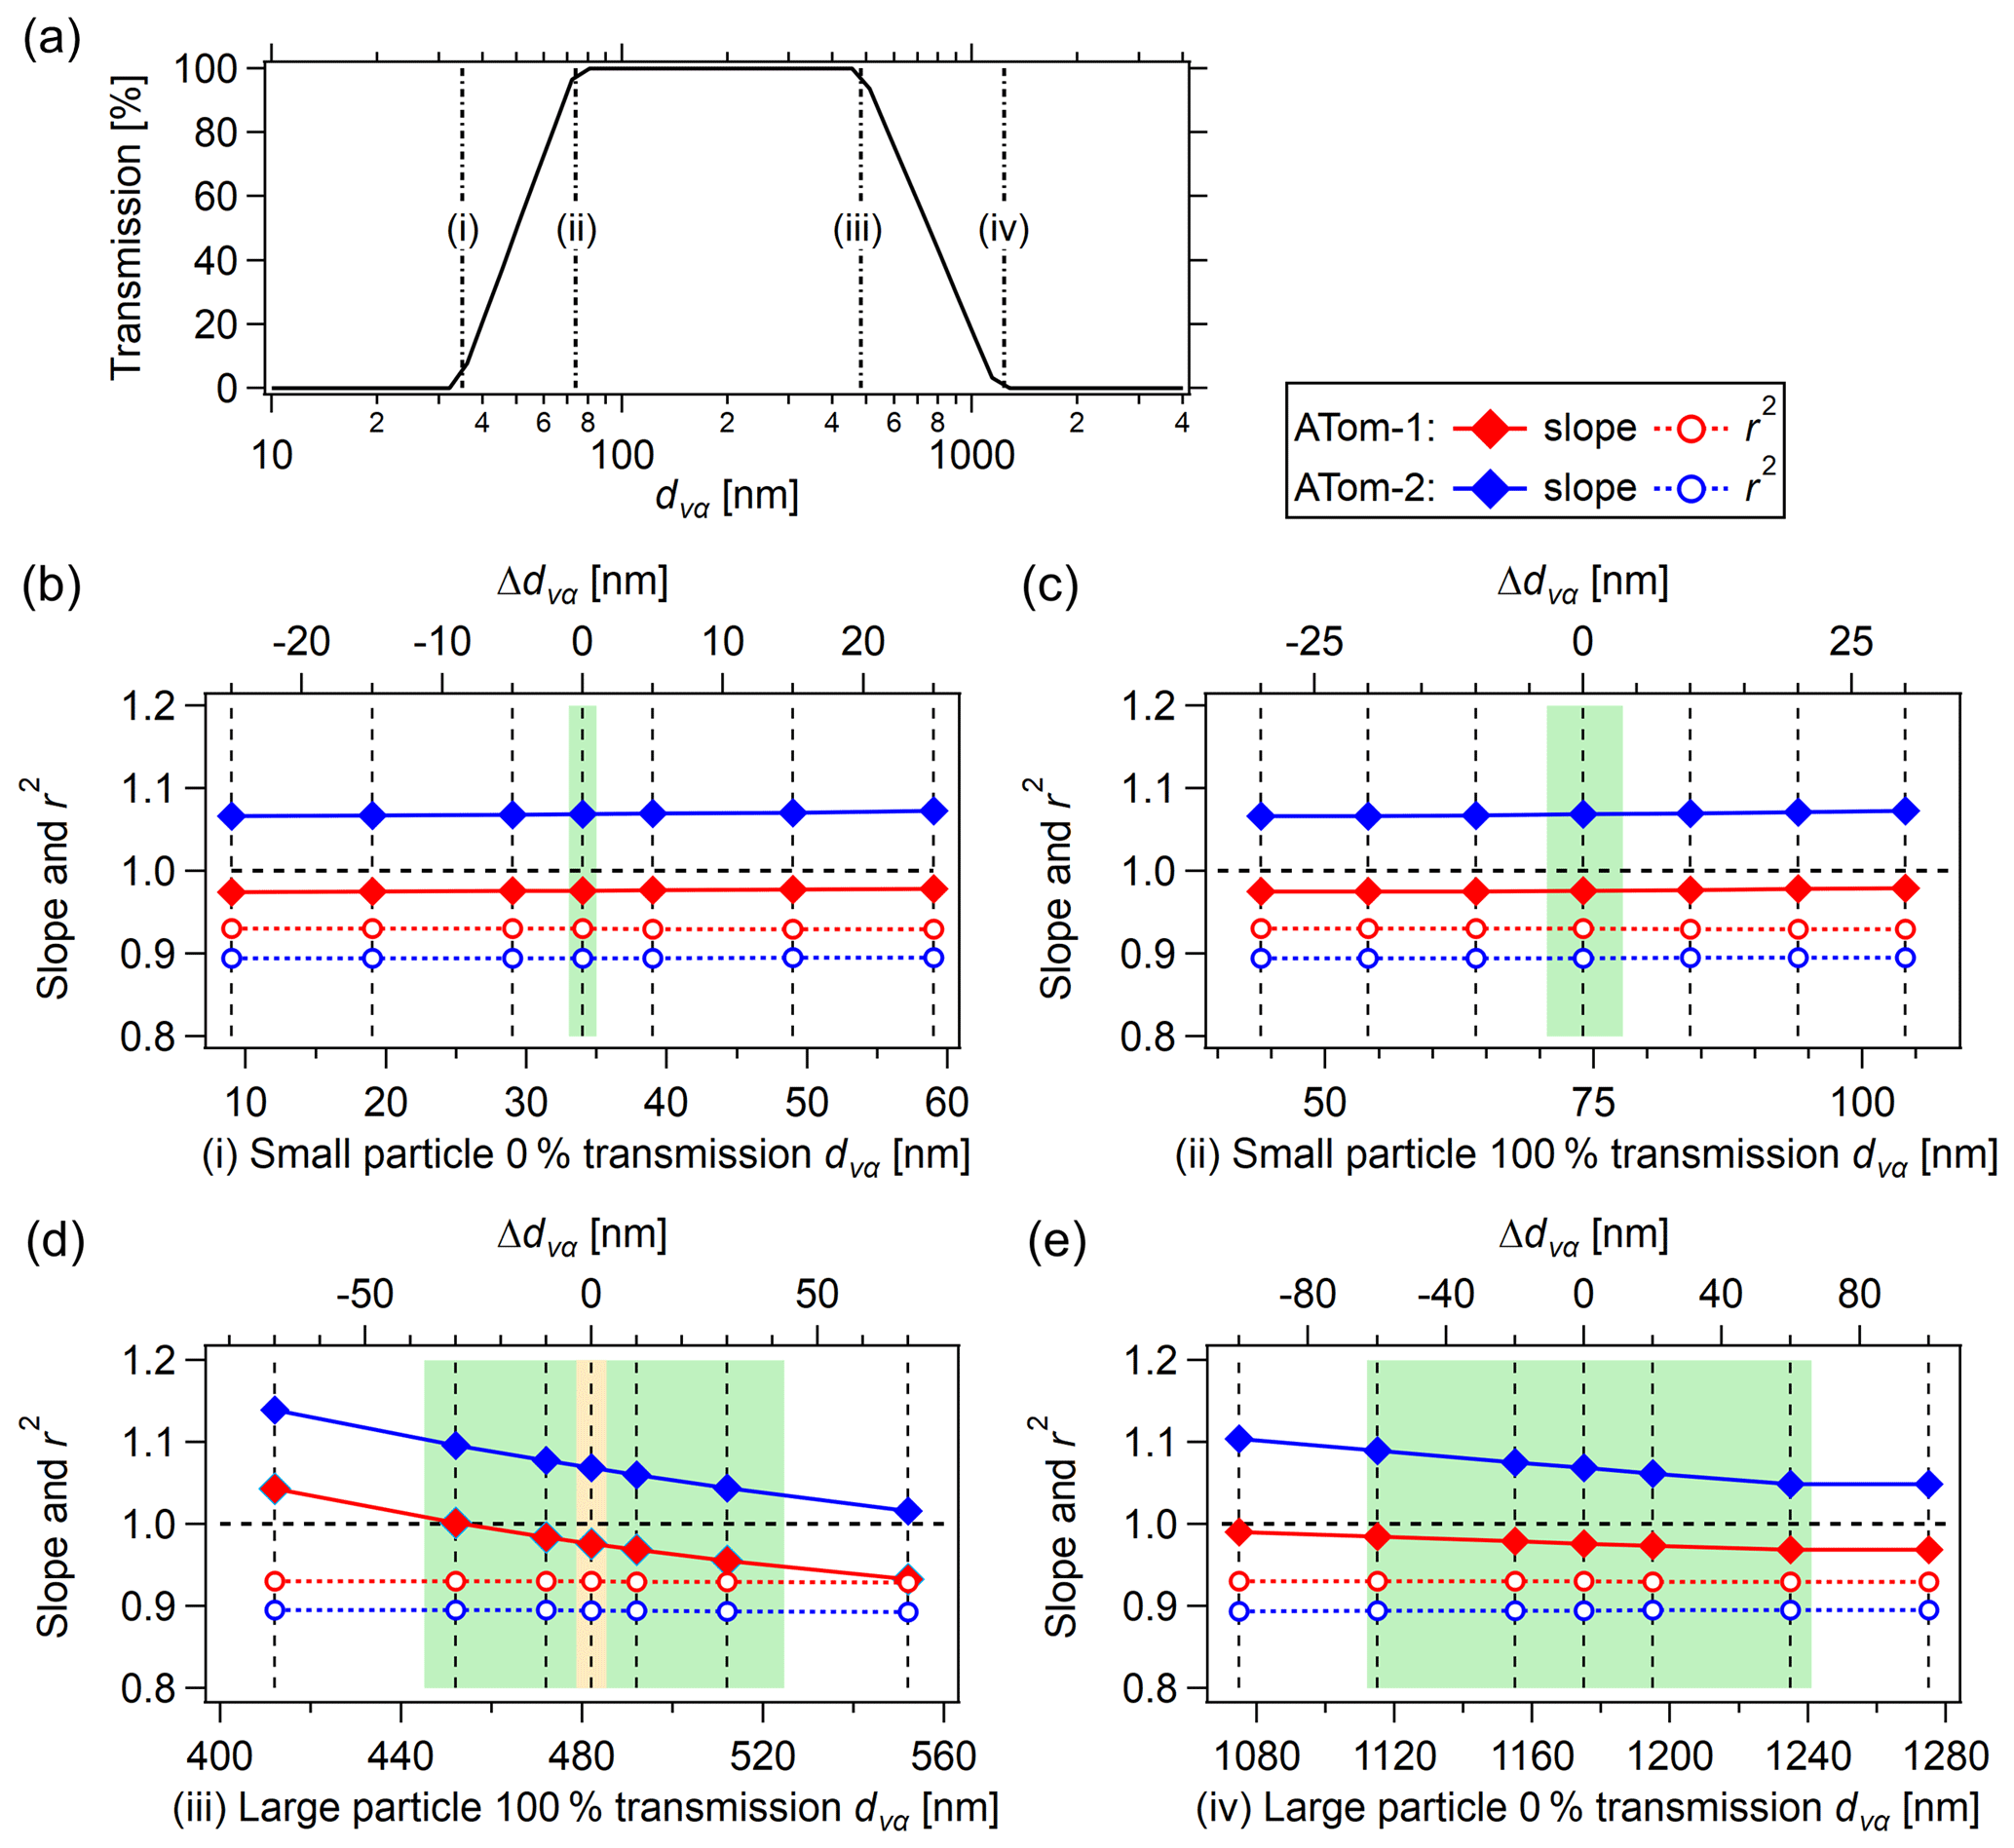
Figure 6Sensitivity test of AMS transmission: the regression slopes and correlations between Vchem (y axis) and Vphys,AMS (x axis) by artificially changing the AMS transmission (a). The four subpanels labeled with (b, c, d, e) are for the four anchoring points, (i) 35 nm, (ii) 100 nm, (iii) 482 nm, and (iv) 1175 nm (all in dva), as shown in the top AMS transmission figure. In (d, e), the green-tinted background indicates the 1 standard deviation range from in-field calibrations, and the orange-tinted background in (d) is the narrower standard deviation range estimated from multiple calibrations (Fig. 2).
It is also of interest to compare the results if we had assumed that AMS literature transmission curves applied to this study. Here we test the commonly used transmission curves of Liu et al. (2007) and Hu et al. (2017). The four anchoring sizes (all in nm) in Liu et al. (2007) (Hu et al. 2017 in parentheses) are (i) 50 (40), (ii) 150 (100), (iii) 300 (500), and (iv) 1400 (1500, estimated by fitting). The regression slopes with the Liu curve (the Hu curve) are 1.18 and 1.23 (0.94 and 0.96) in ATom-1 and ATom-2, respectively, compared to 0.96 and 1.09 derived from applying the ATom-1 and ATom-2 transmission (Fig. 4). In summary, the above results suggest the following: (1) the volume closure is relatively insensitive to the uncertainties of the AMS transmission curve characterized in this study; (2) the use of transmission curves from the literature for uncharacterized instruments can result in substantial deviations (which may then be incorrectly attributed to changes in CE or RIE); (3) the large particle region of the AMS transmission curve is more important than the small particle region for ATom-1 and ATom-2; and (4) the point (iii) with 100 % transmission size for large particles (482 nm in this case) is the most important calibration due to the dominance of the accumulation mode mass for the submicron size range.
3.5 Characterization of the AMS observable particle fraction during ATom vs. the standard ground-based and aircraft-based PM1 definition
It is of interest to compare the fraction of the volume detected by the AMS for ATom vs. what a standard ground-level PM1 (the most common definition of “submicron”) instrument would detect. In this study, we use the standard cut URG cyclone operating at the surface ambient humidity as the reference, simulating its operation at ground sites at different altitudes (e.g., sea level and mountain sites). As discussed above, both the AMS and the AMP size distributions measure dry particles, while the “standard” PM1 is defined with practical size selection under ambient humidity. To account for the difference, the URG transmission is applied to the estimated ambient particle size before losing liquid water content (the effect of water on ρp is also considered) (DeCarlo et al., 2004). We assume no size dependence for ρp or the volume fraction of liquid water content for the submicron aerosols. Ambient P and T from ATom are applied to the URG transmission to account for the shift at non-STP conditions, which is relevant when operating such a cyclone at higher altitudes, e.g., a mountain site. The results of applying the AMS and URG PM1 standard cut cyclone transmissions to Vphys are shown in Fig. 7. AMS observed on average 96±16 % (median 96 %) and 94±12 % (median 94 %) of the volumes that would transmit through a ground-level URG PM1 cyclone in ATom-1 and ATom-2, respectively. Although we previously concluded that the AMS was approximately an equivalent ground-level PM0.75 instrument in ATom-1 and ATom-2, the difference in collected volume is only ∼5 %. This is because the submicron volume size distribution peaked around 300 nm (dta; see Fig. 3 for example), where AMS transmission is ∼100 %, and also due to the effect of liquid water on particle size.
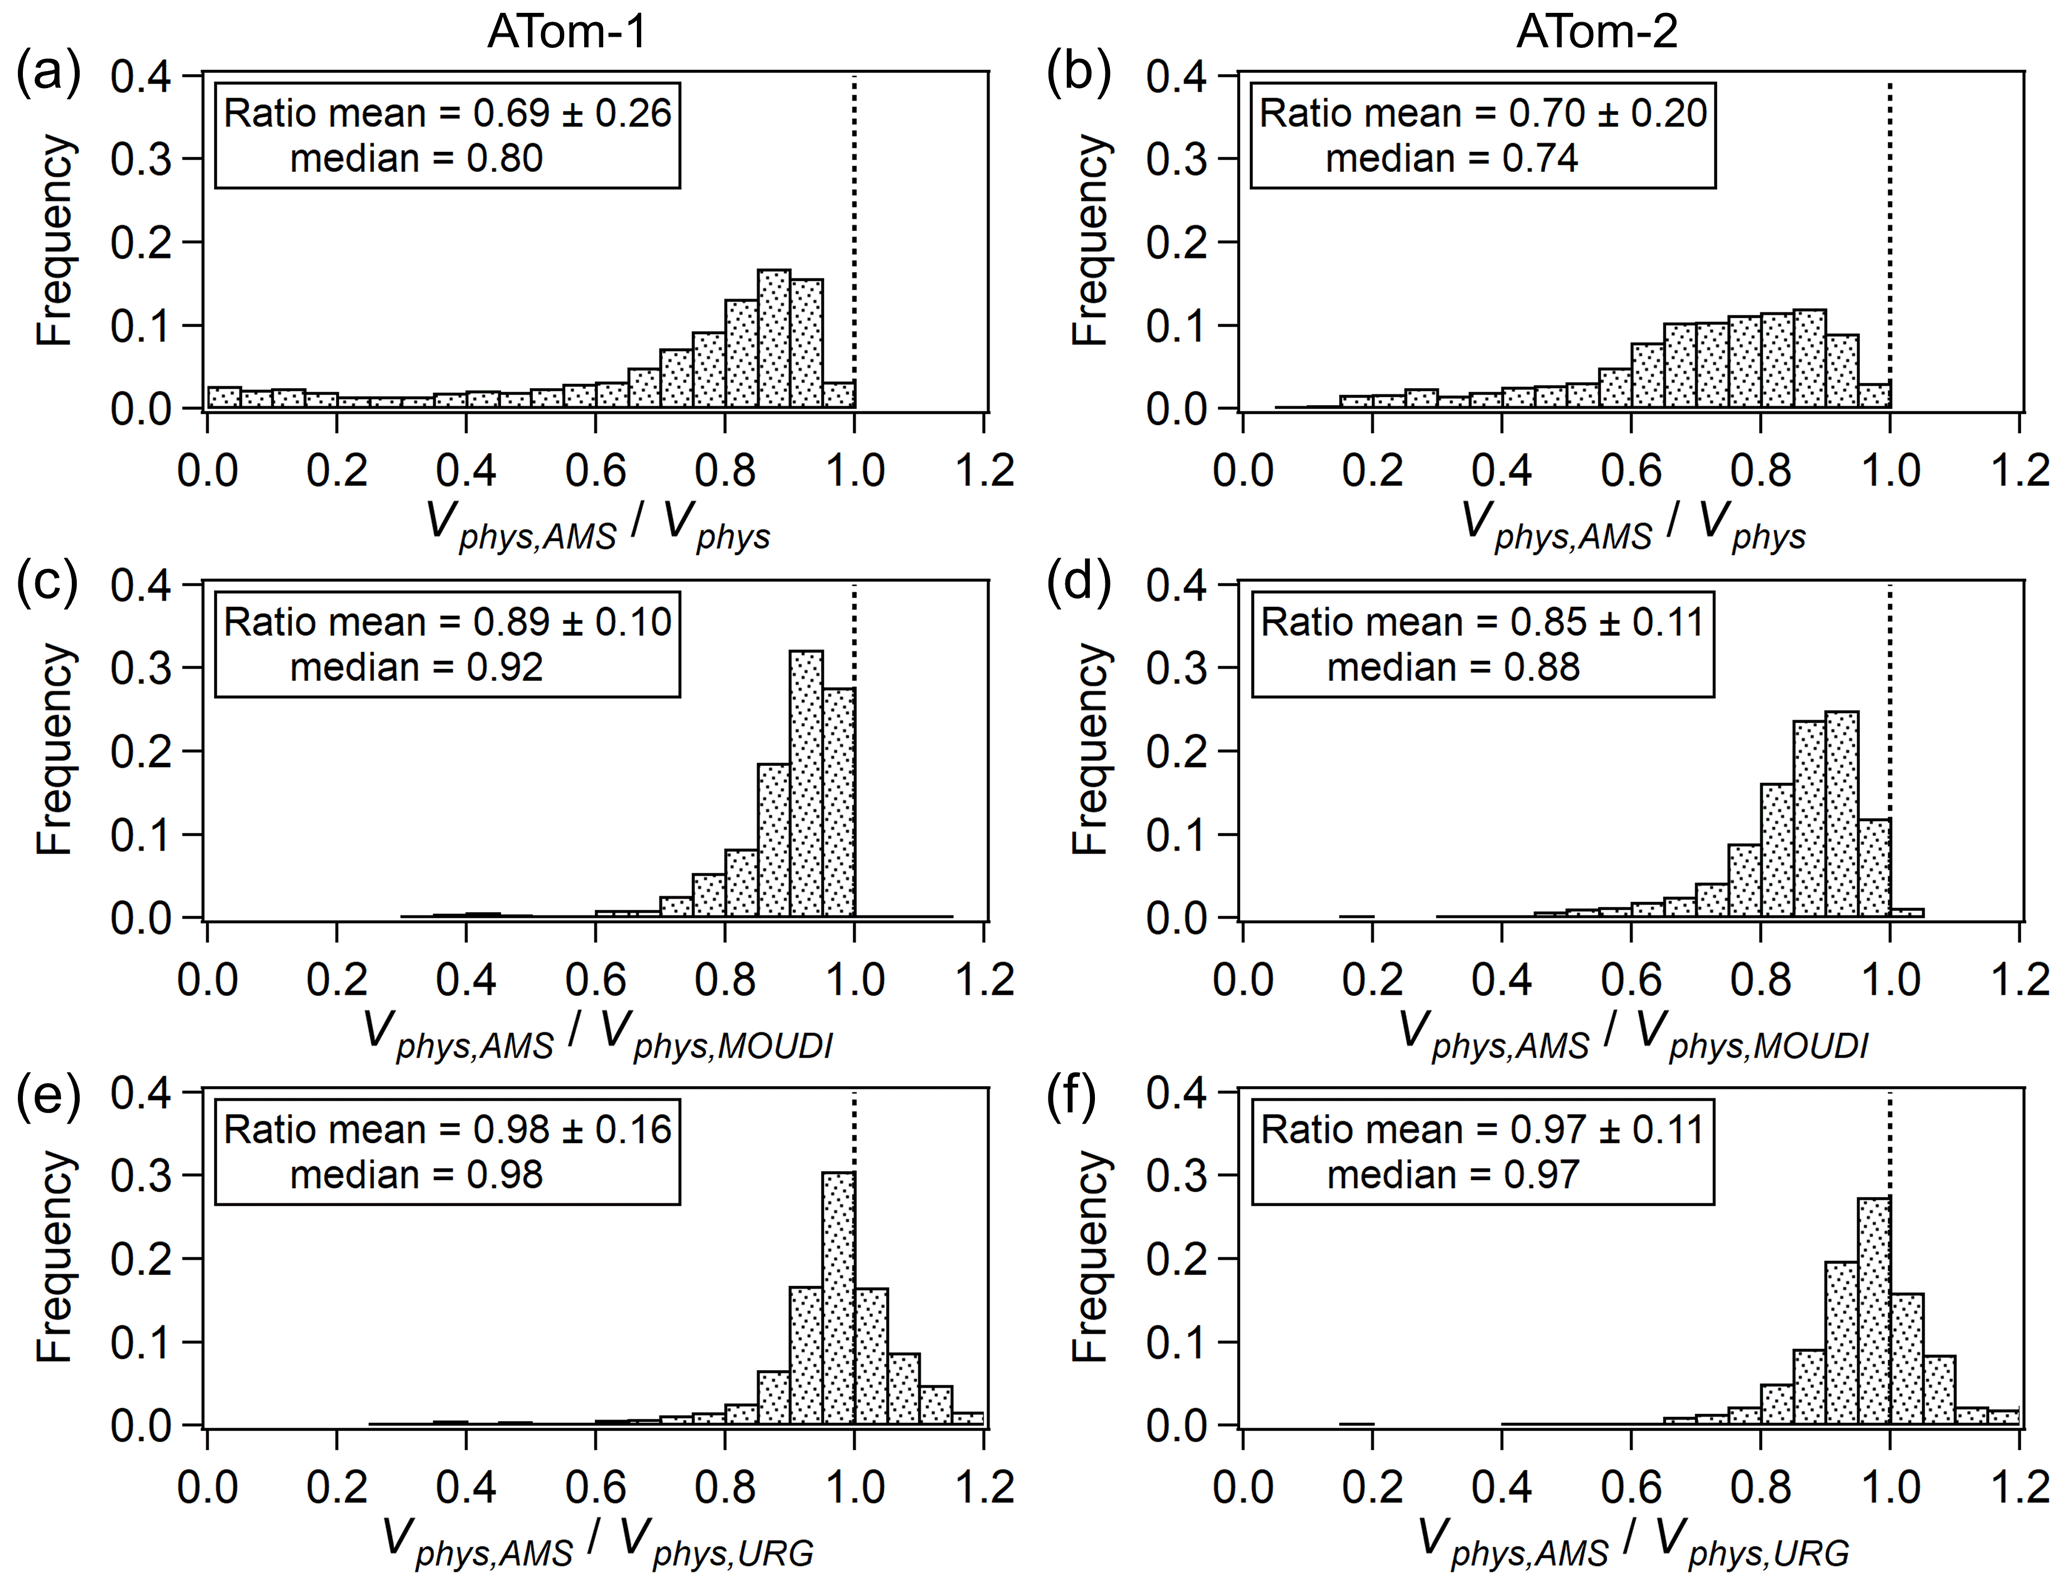
Figure 7(a, b) Frequency distributions of the AMS-transmission-corrected Vphys (Vphys,AMS) vs. the (total) Vphys. (c, d) Same for Vphys,AMS vs. the dry condition altitude-dependent MOUDI 1 µm stage-impactor-transmission-corrected Vphys (Vphys,MOUDI). (e, f) Same for Vphys,AMS vs. the ground level ambient condition URG-PM1-corrected (standard PM1 cut) Vphys (Vphys,URG). ATom-1 is shown on the left and ATom-2 on the right.
Next, we compared the submicron volumes observed from the CU AMS and a MOUDI 1 µm stage impactor during aircraft studies, using the ATom conditions (Figs. 7c and 6d). The two inlets size-select dry particles due to sample line heating. In ATom-1 and ATom-2, AMS observed 87 % and 83 % by means and 90 % and 85 % by medians of those from an airborne MOUDI impactor, lower than the ratios when comparing to the URG PM1 cyclones for two reasons: the smaller cutoff size of URG vs. MOUDI due to particle water and lower operating T for URG (which relates to air viscosity). We also compared the Vphys,AMS to the (total) Vphys (Figs. 7a and 6b). AMS collected 68 % by means (the same for ATom-1 and ATom-2, and 78 % in ATom-1 and 71 % in ATom-2 by medians) of Vphys; in other words, 32 % of Vphys was excluded by applying the AMS transmission. For both ATom-1 and ATom-2, there was considerable variability in the fraction of Vphys removed to obtain Vphys,AMS, which spanned the range from 0 % to 100 % removal, thus providing a good scenario for testing the AMS transmission. Nevertheless, these data show that on average the AMS captured the submicron range well, as shown in Fig. 4, and that the comparisons presented here are meaningful for a wide range of scenarios.
3.6 Characterization of the observable particle populations for different chemical instruments
The different parts of the aerosol population included in different measurements and models make comparisons of aerosol species inherently more complex than those for gas-phase species. In this section, we characterize the size ranges that contribute information to each composition measurement. Importantly, only the particle ranges are illustrated, irrespective of the properties of each chemical detector (e.g., species measured, detection limits). Speciated particle mass concentrations can be derived by sampling the bulk aerosol using a size cut. For example, MOUDI 1 µm stage impactor and SAGA MC are suitable for size-selecting the submicron range (Fig. S18). With a wider coverage expanding to supermicron sizes, SAGA filters measure up to dta,sea of 4.1 µm, and their estimated altitude-dependent transmissions for the ATom conditions are shown in Fig. S19. Speciated mass concentrations can also be derived as a function of size by mapping the PALMS single-particle chemical composition onto an independent physical size distribution measurement (in the case of ATom, the AMP size distribution products described in Brock et al., 2019a) (Froyd et al., 2019), and PALMS-AMP-derived sulfate and organic mass concentrations have recently been reported to the NASA ATom archive (Wofsy et al., 2018).
Figure 8 summarizes the approximate fractions of the volume and number distributions that each ATom instrument observed for ATom-2 (Fig. S34 shows ATom-1). A MOUDI 1 µm stage impactor is also included for comparison. SAGA filters collect nearly the entire total volume. The vertical profiles of volume size distributions collected by AMS and MOUDI are similar and converge at higher altitudes due to the shift in the MOUDI cutoff size. Both AMS and PALMS capture the accumulation mode, which often dominates particle mass, and thus agreement of the reported submicron concentrations should be expected under such conditions. The AMS samples contain chemical information about smaller particles that are typically absent from the PALMS data (Williamson et al., 2019). Conversely, the PALMS samples a significant fraction of the supermicron mode beyond the transmission range of the AMS. The PALMS-AMP at the reported AMP size resolution and 3 min time resolution is shown in Fig. 8 (and Fig. S34), and similar plots for other size and time resolutions are shown in Fig. S35 and S36. The 3 min time resolution corresponds to ∼36 km horizontal distances and ∼1.5 km vertical distances during ATom profiles and thus is a reasonable basis for comparison.
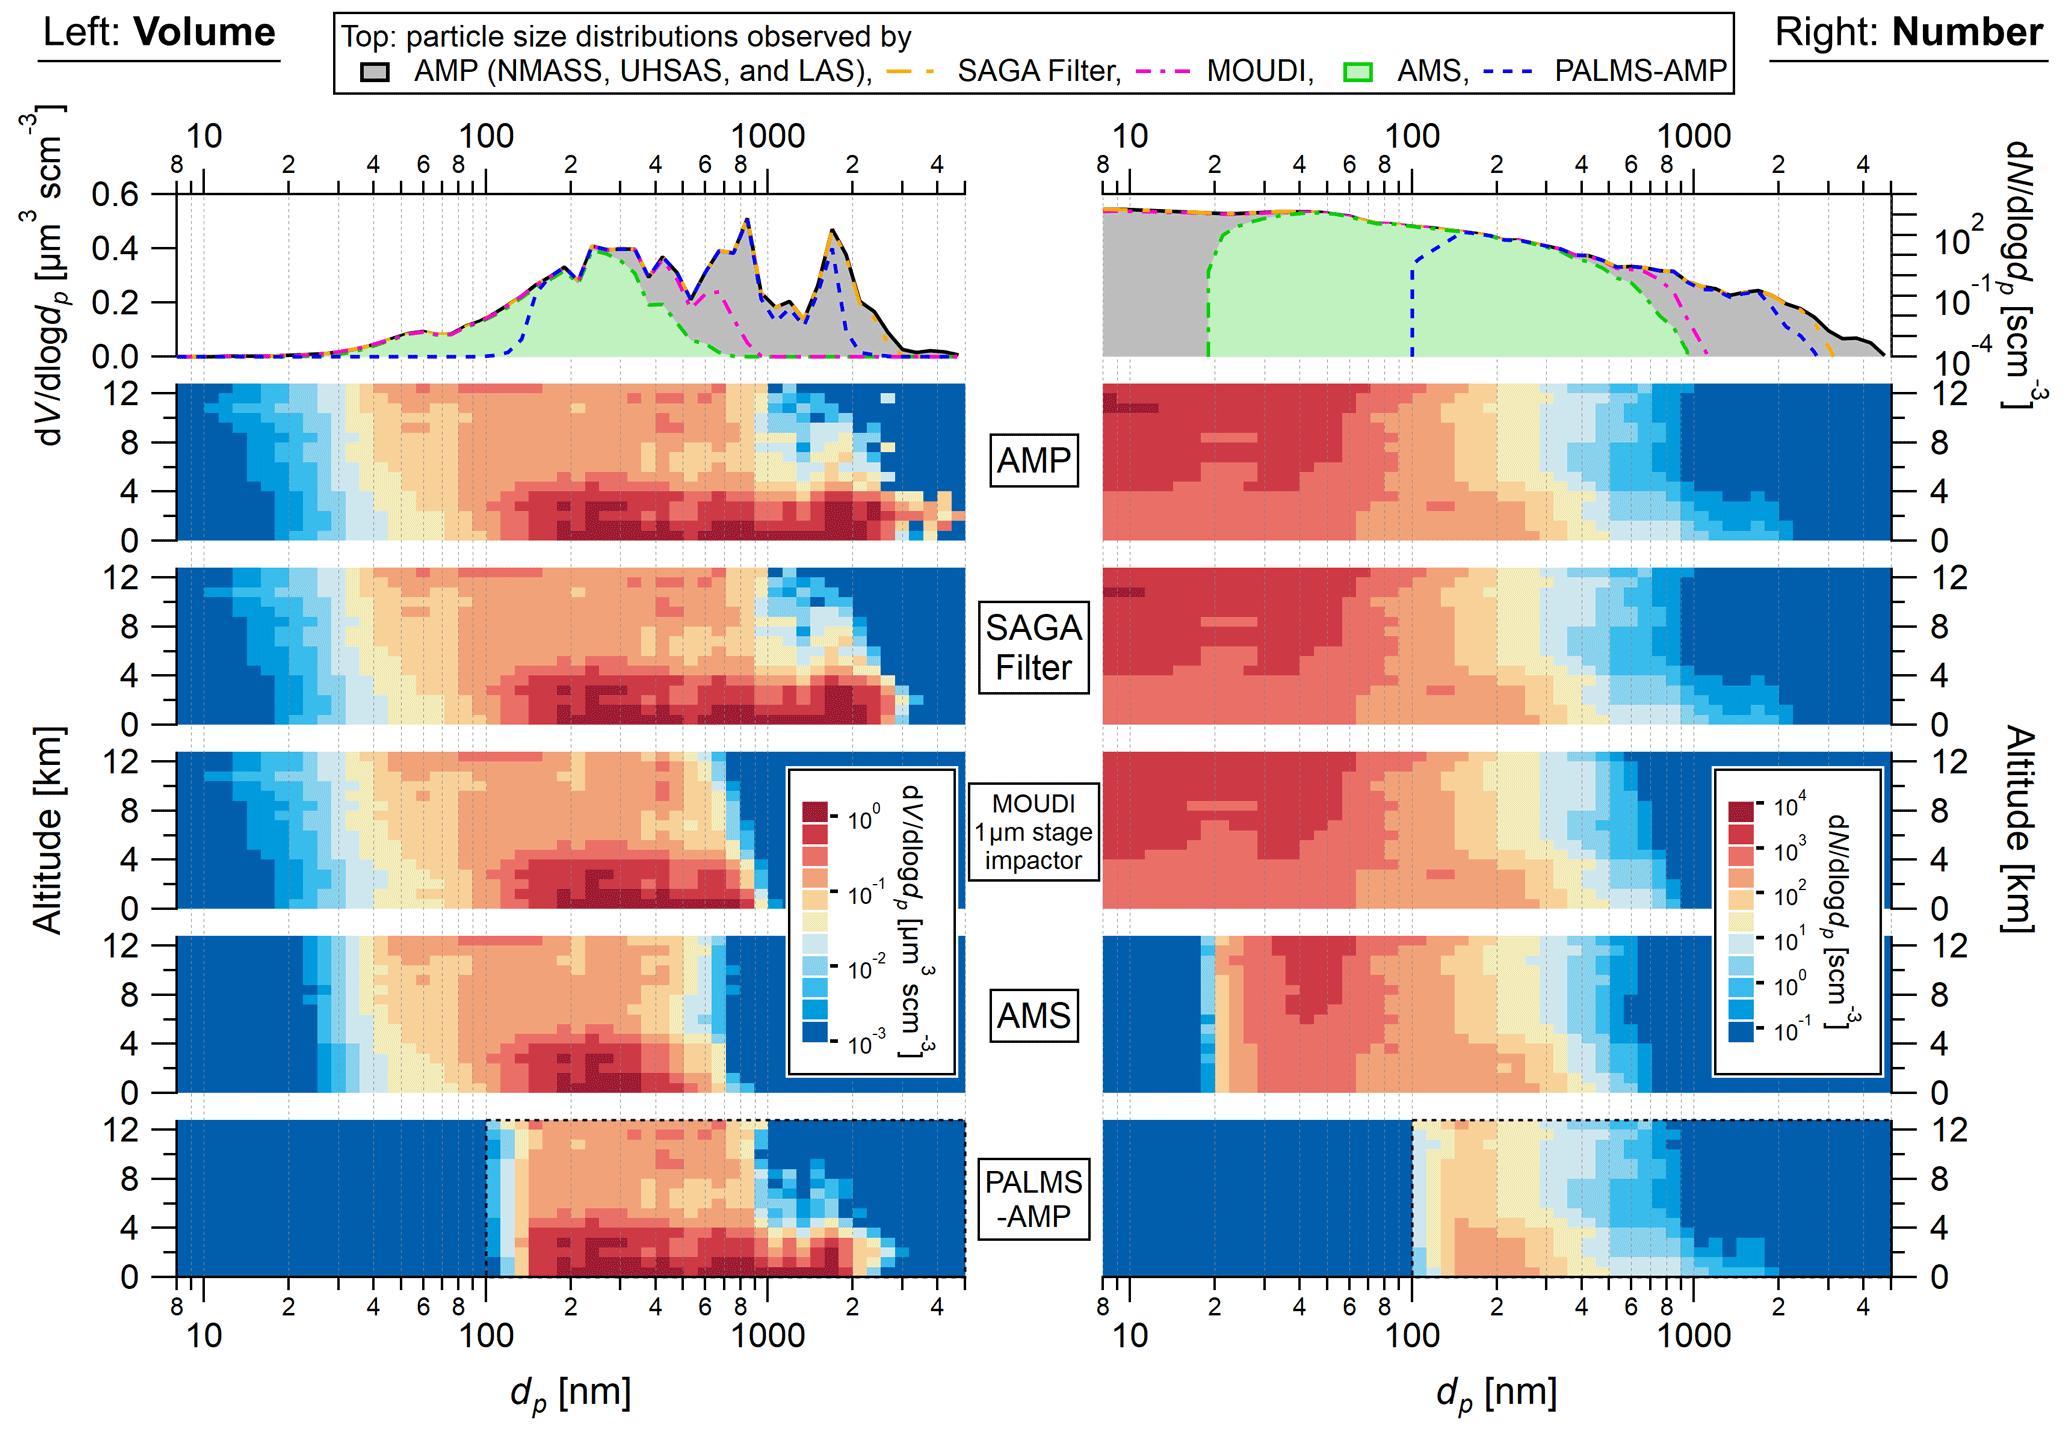
Figure 8Campaign-averaged volume (left) and number (right) size distributions observed by AMP in ATom-2 (NMASS measured down to 3 nm, and here we only show the subrange starting from 8 nm), together with the approximate particle size ranges contributing chemical composition information (without consideration of the details of the chemical detection) to the AMS, PALMS, and SAGA filter and size-selected by a MOUDI 1 µm stage impactor. The top panel is one dimensional with the campaign-averaged result of each instrument (the transmissions of MOUDI and SAGA filter are altitude dependent and plotted in Figs. 3 and S19, respectively; PALMS effective detection range depends on counting statistics, and the detected particles given a sampling period are discussed in Figs. S15–16). Note that the top panel shows the fraction of the average, while Fig. 7 shows the average fractions (a summary in Table S2). The right plots represent the size ranges of the number size distribution contributing chemical composition information to each instrument. The following panels show the vertical profiles of the same quantities for AMP, SAGA filter, MOUDI impactor, AMS, and PALMS-AMP, respectively. The PALMS-AMP product (Froyd et al., 2019) reports compositions above 100 nm, the size range indicated by the dashed square in the bottom panels. The plotted altitude bins are 800 m each.
It is also of interest to quantify what fraction of the particle number is represented by each instrument's data. For instance, the composition relevant to calculations of cloud condensation nuclei (CCN) number concentrations would be dominated by small particles. The number fractions have somewhat different meanings for the instruments. PALMS, when merged with size distribution measurements, can quantify the number of particles of various types as a function of size. For the other (bulk) instruments, the number fraction merely represents the number of particles in the size range where mass is measured. Unlike the volume case, where the size distribution is dominated by the accumulation and coarse modes, the number size distribution in ATom was dominated by the nucleation and Aitken mode particles. In ATom-1 and ATom-2, the SAGA filters, MOUDI, AMS, and PALMS-AMP (based on AMP size resolution and 3 min time resolution) characterize the chemical composition on average of 96 % (median 99.9 %), 78 % (87 %), 68 % (74 %), and 56 % (58 %) of Vphys (total AMP particle volume) and 98 % (99 %), 89 % (93 %), 41 % (41 %), and 6.3 % (2.1 %) of the total AMP particle number, respectively. The Vphys fraction observed by the PALMS-AMP is the lowest because of the opposite trend vs. altitude compared to the other instruments (discussed in the next paragraph) and the larger fraction of the sampling time in the upper troposphere vs. below in the ATom deployments (Fig. S1). It should be noted that the PALMS-AMP characterizes size-resolved rather than bulk aerosol composition, such as SAGA filters or AMS FMS data products (the AMS ePToF mode does measure size-resolved aerosol composition). The size range above 100 nm dp, for which PALMS-AMP (Froyd et al., 2019) reports chemical products (partially by extrapolating composition measurements of others sizes, especially at higher time resolutions and lower concentrations), covers 76 % (83 %) and 11 % (5 %) of the AMP volume and number, respectively.
To complete the illustration of the coverage of the previously discussed instruments, the vertical profiles of observed volume fractions, in both the submicron range and the full AMP size range, are summarized in Fig. 9 (and the statistics summarized in Table S2 in the Supplement). For the submicron measurements, AMS is highly comparable to the URG PM1 standard cut cyclone, MOUDI 1 µm stage impactor, and SAGA MC. More particle volume is observed by AMS as altitude increases due to the relatively constant AMS lens transmission (that always operates in the free molecular regime) and the smaller aerodynamic cutoff sizes for the other three inlets (that operate at ambient P). For the AMP size range, similar increasing fractions of Vphys as a function of altitude are observed in all the panels, except for PALMS-AMP due to the larger fraction of the aerosol population at smaller diameters aloft than at the surface (Fig. 8) (Williamson et al., 2019) since PALMS-AMP does not report below 100 nm dp. PALMS excels in the lower 2 km of the atmosphere where it characterizes most of the volume, while the submicron instruments only capture ∼40 % to 50 %. This clearly shows the heterogeneity and complementarity between PALMS-AMP and the other submicron bulk measurements as a function of altitude. The differences between the 3 min characterization and the PALMS-AMP products are greatly reduced by averaging to 60 min.
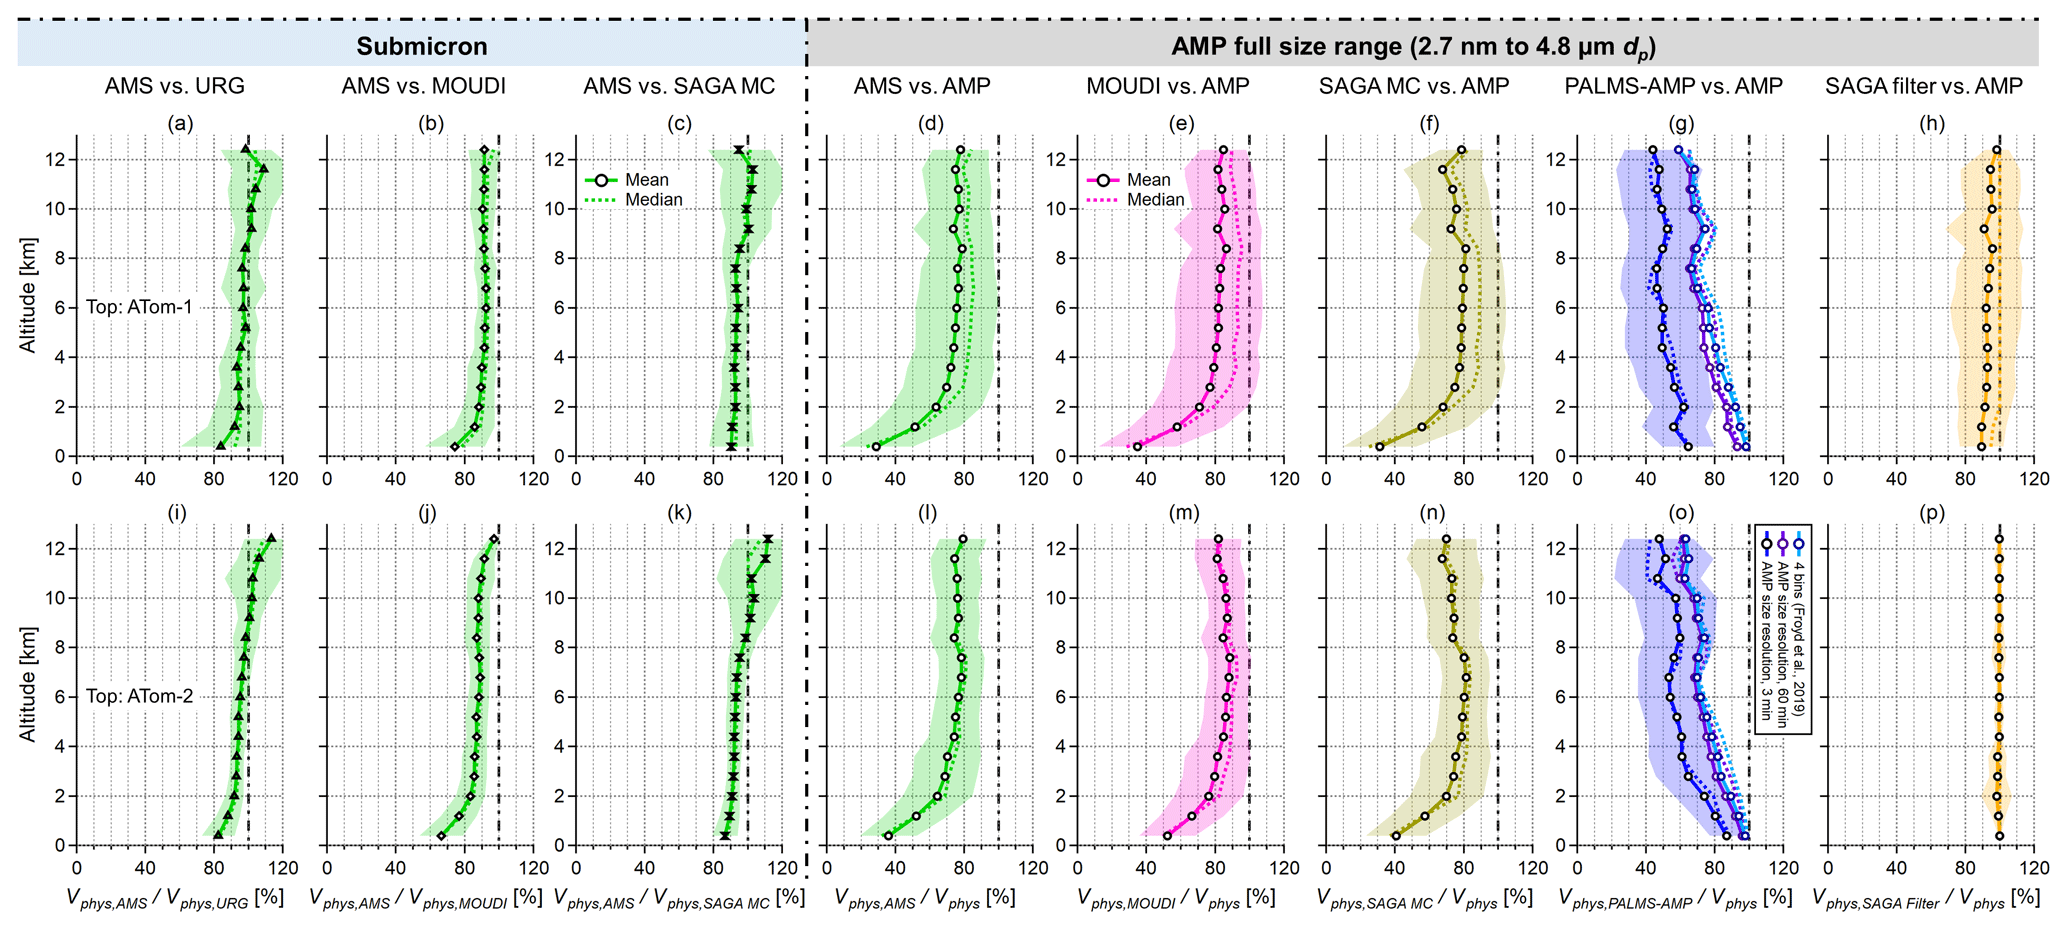
Figure 9Comparison of the fraction of the particle volume that is observable (i.e., those contributing chemical composition information but independent of the properties of the chemical detector) between instruments or inlets as a function of altitude, for the conditions in (a–h) ATom-1 and (i–p) ATom-2. (a–c, i–k) The widely used approximate submicron cuts are compared. (d–h, l–p) The ATom aerosol payload is compared, including a MOUDI 1 µm impactor that has been flown in other studies. The color-shaded area indicates the SD of volume ratios.
In summary, outside dust or biomass burning plumes, the particle volume sampled by AMS is within 97±14 % compared to SAGA MC, for which the difference disappears for the higher altitude legs, and 85±10 % of an airborne dry PM1 measurement, a MOUDI impactor often used in aircraft. AMS and PALMS particle compositional data overlap for a large part of the volume distribution in ATom, and they complement each other at the ends of the distribution (the statistics of the overlap are listed in Table S2). Last but not least, SAGA filters characterize the particle bulk chemical components representative of the combined size range from the AMP.
The large range of conditions sampled by the high-quality aerosol instrument payload on board the NASA DC-8 during the ATom missions provides a unique opportunity to quantitatively investigate the comparability of submicron volume (and hence mass quantification) derived from physical sizing vs. bulk chemical instruments, as well as to evaluate whether currently reported AMS measurement uncertainties are realistic. Characterizing the upper end of the AMS transmission curve during field deployments is critical for meaningful intercomparisons. Calibrating the AMS transmission curve avoids improperly attributing the differences in transmission to errors in CE or RIE if a discrepancy is found. In-field calibration of AMS transmission is suggested since lens alignment or possible impacts during transport have been observed to cause a change in transmission. AMS variability in transmission can be significant, e.g., this study vs. Hu et al. (2017) and Liu et al. (2007), leading to differences of up to 25 % in transmitted concentrations for ATom conditions, which could be larger in the presence of a larger accumulation mode. After applying the AMS transmission curve to the size spectrometer data, good agreement was found between the physically and chemically derived volumes over 3 orders of magnitude (slope =0.96 and 1.09, r2=0.95 and 0.93, for ATom-1 and ATom-2, respectively). Significant deviations would have been observed if some literature transmission curves had been used. No evidence of biases in AMS detection of remote aerosols was found. The combined stated uncertainties are consistent for the overall statistics of the instrument comparison for the remote aerosols sampled during ATom.
The CU AMS inlet was equivalent to a PM0.75 cyclone operating on ambient particles (i.e., not dried prior to sampling) during ATom-1 to ATom-3 and to a PM0.95 cyclone during ATom-4. For an aerosol density of 0.9 g cm−3, such as pure hydrocarbon-like OA or cooking aerosol dominated by fatty acids, the same AMS is equivalent to a PM0.79 (ATom-1, ATom-2, ATom-3) and PM1.0 (ATom-4) cyclone for dry particles. Despite being equivalent to a PM0.75 cyclone in ATom-1 and ATom-2, 95±15 % of the theoretically calculated URG PM1 cyclone sampled mass and volume was detected by the AMS as the effect of ambient pressure and humidity on the URG cyclone transmission bridges the gap. Furthermore, the AMS quantified particle mass and properties represent 68 % (mean) of the integrated AMP volume and 41 % of the integrated AMP number from 2.7 nm to 4.8 µm geometric diameter (dp) size range. PALMS-AMP at a 3 min time resolution (or the PALMS-AMP products, which assume a full coverage of >100 nm dp AMP) characterizes 56 % (76 %) of the integrated volume and 6.3 % (11 %) of the integrated number, while MOUDI 1 µm stage impactor would collect 78 % of the volume and 89 % of the number. SAGA filters collect nearly all the aerosol, 96 % of the volume and 98 % of the number. The overlap in the collected particle volumes between the AMS and an aerodynamic PM1 cut, such as the MOUDI 1 µm stage impactor (dry condition; AMS vs. MOUDI 85±10 %) or SAGA MC (ambient condition; AMS vs. SAGA MC 97±14 %), suggest that a direct comparison of these bulk aerosol properties is generally meaningful. However, the more pressure-dependent cutoff size of an aerodynamic inlet that operates at ambient P for airborne sampling may impact comparisons with data from other instruments as a function of altitude. That effect could be compensated for by lowering the volumetric flow rate vs. altitude to keep the size cut (i.e., d50) the same at the cost of a less sharp transmission. The CU AMS inlet provides a more constant transmission vs. altitude. This work serves as a case study of the importance of size ranges when intercomparing different instruments and contributes to document the performance of the ATom aerosol payload, confirms the realism of the stated uncertainties, and serves as a framework for a subsequent intercomparison focusing on individual chemical species.
The AMS data are published at https://doi.org/10.3334/ORNLDAAC/1716 (Jimenez et al., 2019). The AMP data are published at https://doi.org/10.3334/ORNLDAAC/1671 (Brock et al., 2019b). The merged ATom data are published at https://doi.org/10.3334/ORNLDAAC/1581 (Wofsy et al., 2018).
The supplement related to this article is available online at: https://doi.org/10.5194/amt-14-3631-2021-supplement.
PCJ and JLJ acquired funding. PCJ, BAN, JCS, and DAD collected the AMS data in the field. PCJ performed the AMS data reduction. HG, DK, and PCJ calibrated the lower end of AMS transmission in the lab. JED provided information on the SAGA inlets' design and operation. MD and BW developed and provided the cloud indicator product in this study used to screen the dataset for periods inside clouds. HG, PCJ, and JLJ performed the analyses and wrote the paper. All co-authors provided valuable comments on the paper.
The authors declare that they have no conflict of interest.
The authors gratefully acknowledge the support of NASA (grant nos. NNX15AH33A and 80NSSC19K0124). Jack E. Dibb was supported by NASA (grant no. NNX15AG62A). Bernadett Weinzierl and Maximilian Dollner have received funding from the European Research Council (ERC) under the European Union's Horizon 2020 research and innovation framework program under grant 640458 (A-LIFE) and from the University of Vienna. We thank the ATom leadership team, science team, and the NASA DC-8 crew for their contributions to the success of the ATom mission. We thank the AMS user community for many useful discussions, Bruce Anderson and Luke Ziemba for collecting and sharing the LARGE particle extinction data during SEAC4RS, and Xiaoliang Wang and Peter H. McMurry for inlet discussions and calculations. We thank Charles Brock, Christina Williamson, and Agnieszka Kupc for the use of the AMP data, Joshua Schwarz and Joseph Katich for use of the SP2 data, and Karl Froyd and Daniel Murphy for useful discussions about PALMS.
This research has been supported by NASA (grant nos. NNX15AH33A, 80NSSC19K0124, and NNX15AG62A), the ERC (A-LIFE; grant no. 640458), and the University of Vienna.
This paper was edited by Mingjin Tang and reviewed by two anonymous referees.
ACTRIS: ACTRIS Data Centre, available at: https://www.actris.eu/data-tools-services, last access: 29 April 2021.
Aldhaif, A. M., Stahl, C., Braun, R. A., Moghaddam, M. A., Shingler, T., Crosbie, E., Sawamura, P., Dadashazar, H., Ziemba, L., Jimenez, J. L., Campuzano-Jost, P., and Sorooshian, A.: Characterization of the Real Part of Dry Aerosol Refractive Index Over North America From the Surface to 12 km, J. Geophys. Res.-Atmos., 123, 8283–8300, https://doi.org/10.1029/2018JD028504, 2018.
Alfarra, M. R., Coe, H., Allan, J. D., Bower, K. N., Boudries, H., Canagaratna, M. R., Jimenez, J. L., Jayne, J. T., Garforth, A. A., Li, S.-M., and Worsnop, D. R.: Characterization of urban and rural organic particulate in the Lower Fraser Valley using two Aerodyne Aerosol Mass Spectrometers, Atmos. Environ., 38, 5745–5758, https://doi.org/10.1016/j.atmosenv.2004.01.054, 2004.
Bahreini, R., Dunlea, E. J., Matthew, B. M., Simons, C., Docherty, K. S., DeCarlo, P. F., Jimenez, J. L., Brock, C. A., and Middlebrook, A. M.: Design and Operation of a Pressure-Controlled Inlet for Airborne Sampling with an Aerodynamic Aerosol Lens, Aerosol Sci. Tech., 42, 465–471, https://doi.org/10.1080/02786820802178514, 2008.
Bahreini, R., Ervens, B., Middlebrook, A. M., Warneke, C., de Gouw, J. A., DeCarlo, P. F., Jimenez, J. L., Brock, C. A., Neuman, J. A., Ryerson, T. B., Stark, H., Atlas, E., Brioude, J., Fried, A., Holloway, J. S., Peischl, J., Richter, D., Walega, J., Weibring, P., Wollny, A. G., and Fehsenfeld, F. C.: Organic aerosol formation in urban and industrial plumes near Houston and Dallas, Texas, J. Geophys. Res., 114, D00F16, https://doi.org/10.1029/2008JD011493, 2009.
Barth, M. C., Cantrell, C. A., Brune, W. H., Rutledge, S. A., Crawford, J. H., Huntrieser, H., Carey, L. D., MacGorman, D., Weisman, M., Pickering, K. E., Bruning, E., Anderson, B., Apel, E., Biggerstaff, M., Campos, T., Campuzano-Jost, P., Cohen, R., Crounse, J., Day, D. A., Diskin, G., Flocke, F., Fried, A., Garland, C., Heikes, B., Honomichl, S., Hornbrook, R., Huey, L. G., Jimenez, J. L., Lang, T., Lichtenstern, M., Mikoviny, T., Nault, B., O'Sullivan, D., Pan, L. L., Peischl, J., Pollack, I., Richter, D., Riemer, D., Ryerson, T., Schlager, H., St. Clair, J., Walega, J., Weibring, P., Weinheimer, A., Wennberg, P., Wisthaler, A., Wooldridge, P. J., and Ziegler, C.: The Deep Convective Clouds and Chemistry (DC3) Field Campaign, B. Am. Meteorol. Soc., 96, 1281–1309, https://doi.org/10.1175/BAMS-D-13-00290.1, 2015.
Brock, C. A., Cozic, J., Bahreini, R., Froyd, K. D., Middlebrook, A. M., McComiskey, A., Brioude, J., Cooper, O. R., Stohl, A., Aikin, K. C., de Gouw, J. A., Fahey, D. W., Ferrare, R. A., Gao, R.-S., Gore, W., Holloway, J. S., Hübler, G., Jefferson, A., Lack, D. A., Lance, S., Moore, R. H., Murphy, D. M., Nenes, A., Novelli, P. C., Nowak, J. B., Ogren, J. A., Peischl, J., Pierce, R. B., Pilewskie, P., Quinn, P. K., Ryerson, T. B., Schmidt, K. S., Schwarz, J. P., Sodemann, H., Spackman, J. R., Stark, H., Thomson, D. S., Thornberry, T., Veres, P., Watts, L. A., Warneke, C., and Wollny, A. G.: Characteristics, sources, and transport of aerosols measured in spring 2008 during the aerosol, radiation, and cloud processes affecting Arctic Climate (ARCPAC) Project, Atmos. Chem. Phys., 11, 2423–2453, https://doi.org/10.5194/acp-11-2423-2011, 2011.
Brock, C. A., Williamson, C., Kupc, A., Froyd, K. D., Erdesz, F., Wagner, N., Richardson, M., Schwarz, J. P., Gao, R.-S., Katich, J. M., Campuzano-Jost, P., Nault, B. A., Schroder, J. C., Jimenez, J. L., Weinzierl, B., Dollner, M., Bui, T., and Murphy, D. M.: Aerosol size distributions during the Atmospheric Tomography Mission (ATom): methods, uncertainties, and data products, Atmos. Meas. Tech., 12, 3081–3099, https://doi.org/10.5194/amt-12-3081-2019, 2019a.
Brock, C. A., Kupc, A., Williamson, C. J., Froyd, K., Erdesz, F., Murphy, D. M., Schill, G. P., Gesler, D. W., Mclaughlin, R. J., Richardson, M., Wagner, N. L., and Wilson, J. C.: ATom: L2 In Situ Measurements of Aerosol Microphysical Properties (AMP), ORNL DAAC, Oak Ridge, Tennessee, USA, [data set], https://doi.org/10.3334/ORNLDAAC/1671, 2019b.
Brock, C. A., Froyd, K. D., Dollner, M., Williamson, C. J., Schill, G., Murphy, D. M., Wagner, N. J., Kupc, A., Jimenez, J. L., Campuzano-Jost, P., Nault, B. A., Schroder, J. C., Day, D. A., Price, D. J., Weinzierl, B., Schwarz, J. P., Katich, J. M., Zeng, L., Weber, R., Dibb, J., Scheuer, E., Diskin, G. S., DiGangi, J. P., Bui, T., Dean-Day, J. M., Thompson, C. R., Peischl, J., Ryerson, T. B., Bourgeois, I., Daube, B. C., Commane, R., and Wofsy, S. C.: Ambient aerosol properties in the remote atmosphere from global-scale in-situ measurements, Atmos. Chem. Phys. Discuss. [preprint], https://doi.org/10.5194/acp-2021-173, in review, 2021.
Canagaratna, M. R., Jayne, J. T., Jimenez, J. L., Allan, J. D., Alfarra, M. R., Zhang, Q., Onasch, T. B., Drewnick, F., Coe, H., Middlebrook, A., Delia, A., Williams, L. R., Trimborn, A. M., Northway, M. J., DeCarlo, P. F., Kolb, C. E., Davidovits, P., and Worsnop, D. R.: Chemical and microphysical characterization of ambient aerosols with the aerodyne aerosol mass spectrometer, Mass Spectrom. Rev., 26, 185–222, https://doi.org/10.1002/mas.20115, 2007.
Canagaratna, M. R., Jimenez, J. L., Kroll, J. H., Chen, Q., Kessler, S. H., Massoli, P., Hildebrandt Ruiz, L., Fortner, E., Williams, L. R., Wilson, K. R., Surratt, J. D., Donahue, N. M., Jayne, J. T., and Worsnop, D. R.: Elemental ratio measurements of organic compounds using aerosol mass spectrometry: characterization, improved calibration, and implications, Atmos. Chem. Phys., 15, 253–272, https://doi.org/10.5194/acp-15-253-2015, 2015.
Crenn, V., Sciare, J., Croteau, P. L., Verlhac, S., Fröhlich, R., Belis, C. A., Aas, W., Äijälä, M., Alastuey, A., Artiñano, B., Baisnée, D., Bonnaire, N., Bressi, M., Canagaratna, M., Canonaco, F., Carbone, C., Cavalli, F., Coz, E., Cubison, M. J., Esser-Gietl, J. K., Green, D. C., Gros, V., Heikkinen, L., Herrmann, H., Lunder, C., Minguillón, M. C., Močnik, G., O'Dowd, C. D., Ovadnevaite, J., Petit, J.-E., Petralia, E., Poulain, L., Priestman, M., Riffault, V., Ripoll, A., Sarda-Estève, R., Slowik, J. G., Setyan, A., Wiedensohler, A., Baltensperger, U., Prévôt, A. S. H., Jayne, J. T., and Favez, O.: ACTRIS ACSM intercomparison – Part 1: Reproducibility of concentration and fragment results from 13 individual Quadrupole Aerosol Chemical Speciation Monitors (Q-ACSM) and consistency with co-located instruments, Atmos. Meas. Tech., 8, 5063–5087, https://doi.org/10.5194/amt-8-5063-2015, 2015.
Cubison, M. J., Ortega, A. M., Hayes, P. L., Farmer, D. K., Day, D., Lechner, M. J., Brune, W. H., Apel, E., Diskin, G. S., Fisher, J. A., Fuelberg, H. E., Hecobian, A., Knapp, D. J., Mikoviny, T., Riemer, D., Sachse, G. W., Sessions, W., Weber, R. J., Weinheimer, A. J., Wisthaler, A., and Jimenez, J. L.: Effects of aging on organic aerosol from open biomass burning smoke in aircraft and laboratory studies, Atmos. Chem. Phys., 11, 12049–12064, https://doi.org/10.5194/acp-11-12049-2011, 2011.
DeCarlo, P. F.: IE (and RIE) Calibration with the ToF-AMS, available from: http://cires1.colorado.edu/jimenez-group/UsrMtgs/EUCAARIClinic2010/PSI-IECalibration.pdf (last access: 13 April 2021), 2009.
DeCarlo, P. F., Slowik, J. G., Worsnop, D. R., Davidovits, P., and Jimenez, J. L.: Particle Morphology and Density Characterization by Combined Mobility and Aerodynamic Diameter Measurements. Part 1: Theory, Aerosol Sci. Tech., 38, 1185–1205, https://doi.org/10.1080/027868290903907, 2004.
DeCarlo, P. F., Kimmel, J. R., Trimborn, A., Northway, M. J., Jayne, J. T., Aiken, A. C., Gonin, M., Fuhrer, K., Horvath, T., Docherty, K. S., Worsnop, D. R., and Jimenez, J. L.: Field-deployable, high-resolution, time-of-flight aerosol mass spectrometer, Anal. Chem., 78, 8281–8289, https://doi.org/10.1021/ac061249n, 2006.
DeCarlo, P. F., Dunlea, E. J., Kimmel, J. R., Aiken, A. C., Sueper, D., Crounse, J., Wennberg, P. O., Emmons, L., Shinozuka, Y., Clarke, A., Zhou, J., Tomlinson, J., Collins, D. R., Knapp, D., Weinheimer, A. J., Montzka, D. D., Campos, T., and Jimenez, J. L.: Fast airborne aerosol size and chemistry measurements above Mexico City and Central Mexico during the MILAGRO campaign, Atmos. Chem. Phys., 8, 4027–4048, https://doi.org/10.5194/acp-8-4027-2008, 2008.
DeCarlo, P. F., Ulbrich, I. M., Crounse, J., de Foy, B., Dunlea, E. J., Aiken, A. C., Knapp, D., Weinheimer, A. J., Campos, T., Wennberg, P. O., and Jimenez, J. L.: Investigation of the sources and processing of organic aerosol over the Central Mexican Plateau from aircraft measurements during MILAGRO, Atmos. Chem. Phys., 10, 5257–5280, https://doi.org/10.5194/acp-10-5257-2010, 2010.
Dibb, J. E.: ATom: Measurements of Soluble Acidic Gases and Aerosols (SAGA), ORNL DAAC, Oak Ridge, Tennessee, USA, https://doi.org/10.3334/ORNLDAAC/1748, 2019.
Dibb, J. E., Talbot, R. W., Scheuer, E. M., Blake, D. R., Blake, N. J., Gregory, G. L., Sachse, G. W., and Thornton, D. C.: Aerosol chemical composition and distribution during the Pacific Exploratory Mission (PEM) Tropics, J. Geophys. Res.-Atmos., 104, 5785–5800, https://doi.org/10.1029/1998jd100001, 1999.
Dibb, J. E., Talbot, R. W., and Scheuer, E. M.: Composition and distribution of aerosols over the North Atlantic during the Subsonic Assessment Ozone and Nitrogen Oxide Experiment (SONEX), J. Geophys. Res.-Atmos., 105, 3709–3717, https://doi.org/10.1029/1999jd900424, 2000.
Docherty, K. S., Aiken, A. C., Huffman, J. A., Ulbrich, I. M., DeCarlo, P. F., Sueper, D., Worsnop, D. R., Snyder, D. C., Peltier, R. E., Weber, R. J., Grover, B. D., Eatough, D. J., Williams, B. J., Goldstein, A. H., Ziemann, P. J., and Jimenez, J. L.: The 2005 Study of Organic Aerosols at Riverside (SOAR-1): instrumental intercomparisons and fine particle composition, Atmos. Chem. Phys., 11, 12387–12420, https://doi.org/10.5194/acp-11-12387-2011, 2011.
Drewnick, F., Hings, S. S., DeCarlo, P., Jayne, J. T., Gonin, M., Fuhrer, K., Weimer, S., Jimenez, J. L., Demerjian, K. L., Borrmann, S., and Worsnop, D. R.: A New Time-of-Flight Aerosol Mass Spectrometer (TOF-AMS)–Instrument Description and First Field Deployment, Aerosol Sci. Technol., 39, 637–658, https://doi.org/10.1080/02786820500182040, 2005.
Drewnick, F., Hings, S. S., Alfarra, M. R., Prevot, A. S. H., and Borrmann, S.: Aerosol quantification with the Aerodyne Aerosol Mass Spectrometer: detection limits and ionizer background effects, Atmos. Meas. Tech., 2, 33–46, https://doi.org/10.5194/amt-2-33-2009, 2009.
Dunlea, E. J., DeCarlo, P. F., Aiken, A. C., Kimmel, J. R., Peltier, R. E., Weber, R. J., Tomlinson, J., Collins, D. R., Shinozuka, Y., McNaughton, C. S., Howell, S. G., Clarke, A. D., Emmons, L. K., Apel, E. C., Pfister, G. G., van Donkelaar, A., Martin, R. V., Millet, D. B., Heald, C. L., and Jimenez, J. L.: Evolution of Asian aerosols during transpacific transport in INTEX-B, Atmos. Chem. Phys., 9, 7257–7287, https://doi.org/10.5194/acp-9-7257-2009, 2009.
Dzepina, K., Arey, J., Marr, L. C., Worsnop, D. R., Salcedo, D., Zhang, Q., Onasch, T. B., Molina, L. T., Molina, M. J., and Jimenez, J. L.: Detection of particle-phase polycyclic aromatic hydrocarbons in Mexico City using an aerosol mass spectrometer, Int. J. Mass Spectrom., 263, 152–170, https://doi.org/10.1016/j.ijms.2007.01.010, 2007.
Farmer, D. K., Matsunaga, A., Docherty, K. S., Surratt, J. D., Seinfeld, J. H., Ziemann, P. J., and Jimenez, J. L.: Response of an aerosol mass spectrometer to organonitrates and organosulfates and implications for atmospheric chemistry, P. Natl. Acad. Sci. USA, 107, 6670–6675, https://doi.org/10.1073/pnas.0912340107, 2010.
Froyd, K. D., Murphy, D. M., Brock, C. A., Campuzano-Jost, P., Dibb, J. E., Jimenez, J.-L., Kupc, A., Middlebrook, A. M., Schill, G. P., Thornhill, K. L., Williamson, C. J., Wilson, J. C., and Ziemba, L. D.: A new method to quantify mineral dust and other aerosol species from aircraft platforms using single-particle mass spectrometry, Atmos. Meas. Tech., 12, 6209–6239, https://doi.org/10.5194/amt-12-6209-2019, 2019.
Garofalo, L. A., Pothier, M. A., Levin, E. J. T., Campos, T., Kreidenweis, S. M., and Farmer, D. K.: Emission and Evolution of Submicron Organic Aerosol in Smoke from Wildfires in the Western United States, ACS Earth Space Chem., 3, 1237–1247, https://doi.org/10.1021/acsearthspacechem.9b00125, 2019.
Guo, H., Sullivan, A. P., Campuzano-Jost, P., Schroder, J. C., Lopez-Hilfiker, F. D., Dibb, J. E., Jimenez, J. L., Thornton, J. A., Brown, S. S., Nenes, A., and Weber, R. J.: Fine particle pH and the partitioning of nitric acid during winter in the northeastern United States, J. Geophys. Res., 121, 10355–10376, https://doi.org/10.1002/2016jd025311, 2016.
Haywood, J. and Boucher, O.: Estimates of the direct and indirect radiative forcing due to tropospheric aerosols: A review, Rev. Geophys., 38, 513–543, https://doi.org/10.1029/1999RG000078, 2000.
Heim, E. W., Dibb, J., Scheuer, E., Campuzano Jost, P., Nault, B. A., Jimenez, J. L., Peterson, D., Knote, C., Fenn, M., Hair, J., Beyersdorf, A. J., Corr, C., and Anderson, B. E.: Asian dust observed during KORUS-AQ facilitates the uptake and incorporation of soluble pollutants during transport to South Korea, Atmos. Environ., 224, 117305, https://doi.org/10.1016/j.atmosenv.2020.117305, 2020.
Herring, C. L., Faiola, C. L., Massoli, P., Sueper, D., Erickson, M. H., McDonald, J. D., Simpson, C. D., Yost, M. G., Jobson, B. T., and VanReken, T. M.: New Methodology for Quantifying Polycyclic Aromatic Hydrocarbons (PAHs) Using High-Resolution Aerosol Mass Spectrometry, Aerosol Sci. Tech., 49, 1131–1148, https://doi.org/10.1080/02786826.2015.1101050, 2015.
Hodzic, A., Campuzano-Jost, P., Bian, H., Chin, M., Colarco, P. R., Day, D. A., Froyd, K. D., Heinold, B., Jo, D. S., Katich, J. M., Kodros, J. K., Nault, B. A., Pierce, J. R., Ray, E., Schacht, J., Schill, G. P., Schroder, J. C., Schwarz, J. P., Sueper, D. T., Tegen, I., Tilmes, S., Tsigaridis, K., Yu, P., and Jimenez, J. L.: Characterization of organic aerosol across the global remote troposphere: a comparison of ATom measurements and global chemistry models, Atmos. Chem. Phys., 20, 4607–4635, https://doi.org/10.5194/acp-20-4607-2020, 2020.
Huffman, J. A., Jayne, J. T., Drewnick, F., Aiken, A. C., Onasch, T., Worsnop, D. R., and Jimenez, J. L.: Design, Modeling, Optimization, and Experimental Tests of a Particle Beam Width Probe for the Aerodyne Aerosol Mass Spectrometer, Aerosol Sci. Tech., 39, 1143–1163, https://doi.org/10.1080/02786820500423782, 2005.
Hu, W., Campuzano-Jost, P., Day, D. A., Croteau, P., Canagaratna, M. R., Jayne, J. T., Worsnop, D. R., and Jimenez, J. L.: Evaluation of the new capture vaporizer for aerosol mass spectrometers (AMS) through field studies of inorganic species, Aerosol Sci. Tech., 51, 735–754, https://doi.org/10.1080/02786826.2017.1296104, 2017.
Hu, W., Day, D. A., Campuzano-Jost, P., Nault, B. A., Park, T., Lee, T., Croteau, P., Canagaratna, M. R., Jayne, J. T., Worsnop, D. R., and Jimenez, J. L.: Evaluation of the New Capture Vaporizer for Aerosol Mass Spectrometers (AMS): Elemental Composition and Source Apportionment of Organic Aerosols (OA), ACS Earth Space Chem., 2, 410–421, https://doi.org/10.1021/acsearthspacechem.8b00002, 2018.
Hu, W., Campuzano-Jost, P., Day, D. A., Nault, B. A., Park, T., Lee, T., Pajunoja, A., Virtanen, A., Croteau, P., Canagaratna, M. R., Jayne, J. T., Worsnop, D. R., and Jimenez, J. L.: Ambient Quantification and Size Distributions for Organic Aerosol in Aerosol Mass Spectrometers with the New Capture Vaporizer, ACS Earth Space Chem., 4, 676–689, https://doi.org/10.1021/acsearthspacechem.9b00310, 2020.
Hu, W. W., Campuzano-Jost, P., Palm, B. B., Day, D. A., Ortega, A. M., Hayes, P. L., Krechmer, J. E., Chen, Q., Kuwata, M., Liu, Y. J., de Sá, S. S., McKinney, K., Martin, S. T., Hu, M., Budisulistiorini, S. H., Riva, M., Surratt, J. D., St. Clair, J. M., Isaacman-Van Wertz, G., Yee, L. D., Goldstein, A. H., Carbone, S., Brito, J., Artaxo, P., de Gouw, J. A., Koss, A., Wisthaler, A., Mikoviny, T., Karl, T., Kaser, L., Jud, W., Hansel, A., Docherty, K. S., Alexander, M. L., Robinson, N. H., Coe, H., Allan, J. D., Canagaratna, M. R., Paulot, F., and Jimenez, J. L.: Characterization of a real-time tracer for isoprene epoxydiols-derived secondary organic aerosol (IEPOX-SOA) from aerosol mass spectrometer measurements, Atmos. Chem. Phys., 15, 11807–11833, https://doi.org/10.5194/acp-15-11807-2015, 2015.
IPCC: Climate Change 2013: The Physical Science Basis. Contribution of Working Group I to the Fifth Assessment Report of the Intergovernmental Panel on Climate Change, edited by: Stocker, T. F., Qin, D., Plattner, G.-K., Tignor, M., Allen, S. K., Boschung, J., Nauels, A., Xia, Y., Bex, V., and Midgley, P. M., Cambridge University Press, Cambridge, United Kingdom and New York, NY, USA, 1535 pp., 2013.
Jayne, J.: Update on (AMS) Hardware since Last Year & Future Plans, available at: http://cires1.colorado.edu/jimenez-group/UsrMtgs/UsersMtg5/Presentations/JayneHardware.pdf (last access: 13 April 2021), 2004.
Jayne, J. T., Leard, D. C., Zhang, X., Davidovits, P., Smith, K. A., Kolb, C. E., and Worsnop, D. R.: Development of an Aerosol Mass Spectrometer for Size and Composition Analysis of Submicron Particles, Aerosol Sci. Tech., 33, 49–70, https://doi.org/10.1080/027868200410840, 2000.
Jimenez, J. L., Jayne, J. T., Shi, Q., Kolb, C. E., Worsnop, D. R., Yourshaw, I., Seinfeld, J. H., Flagan, R. C., Zhang, X., Smith, K. A., Morris, J. W., and Davidovits, P.: Ambient aerosol sampling using the Aerodyne Aerosol Mass Spectrometer, J. Geophys. Res., 108, 8425, https://doi.org/10.1029/2001JD001213, 2003.
Jimenez, J. L., Canagaratna, M. R., Donahue, N. M., Prevot, A. S. H., Zhang, Q., Kroll, J. H., DeCarlo, P. F., Allan, J. D., Coe, H., Ng, N. L., Aiken, A. C., Docherty, K. S., Ulbrich, I. M., Grieshop, A. P., Robinson, A. L., Duplissy, J., Smith, J. D., Wilson, K. R., Lanz, V. A., Hueglin, C., Sun, Y. L., Tian, J., Laaksonen, A., Raatikainen, T., Rautiainen, J., Vaattovaara, P., Ehn, M., Kulmala, M., Tomlinson, J. M., Collins, D. R., Cubison, M. J., Dunlea, E. J., Huffman, J. A., Onasch, T. B., Alfarra, M. R., Williams, P. I., Bower, K., Kondo, Y., Schneider, J., Drewnick, F., Borrmann, S., Weimer, S., Demerjian, K., Salcedo, D., Cottrell, L., Griffin, R., Takami, A., Miyoshi, T., Hatakeyama, S., Shimono, A., Sun, J. Y., Zhang, Y. M., Dzepina, K., Kimmel, J. R., Sueper, D., Jayne, J. T., Herndon, S. C., Trimborn, A. M., Williams, L. R., Wood, E. C., Middlebrook, A. M., Kolb, C. E., Baltensperger, U., and Worsnop, D. R.: Evolution of organic aerosols in the atmosphere, Science, 326, 1525–1529, https://doi.org/10.1126/science.1180353, 2009.
Jimenez, J. L., Canagaratna, M. R., Drewnick, F., Allan, J. D., Alfarra, M. R., Middlebrook, A. M., Slowik, J. G., Zhang, Q., Coe, H., Jayne, J. T., and Worsnop, D. R.: Comment on “The effects of molecular weight and thermal decomposition on the sensitivity of a thermal desorption aerosol mass spectrometer”, Aerosol Sci. Tech., 50, i–xv, https://doi.org/10.1080/02786826.2016.1205728, 2016.
Jimenez, J. L., Campuzano-Jost, P., Day, D. A., Nault, B. A., Price, D. J., and Schroder, J. C.: ATom: L2 Measurements from CU High-Resolution Aerosol Mass Spectrometer (HR-AMS), ORNL DAAC, Oak Ridge, Tennessee, USA, [data set], https://doi.org/10.3334/ORNLDAAC/1716, 2019.
Katich, J. M., Samset, B. H., Bui, T. P., Dollner, M., Froyd, K. D., Campuzano-Jost, P., Nault, B. A., Schroder, J. C., Weinzierl, B., and Schwarz, J. P.: Strong Contrast in Remote Black Carbon Aerosol Loadings Between the Atlantic and Pacific Basins, J. Geophys. Res.-Atmos., 123, 13386–13395, https://doi.org/10.1029/2018JD029206, 2018.
Kiendler-Scharr, A., Mensah, A. A., Friese, E., Topping, D., Nemitz, E., Prevot, A. S. H., Äijälä, M., Allan, J., Canonaco, F., Canagaratna, M., Carbone, S., Crippa, M., Dall Osto, M., Day, D. A., De Carlo, P., Di Marco, C. F., Elbern, H., Eriksson, A., Freney, E., Hao, L., Herrmann, H., Hildebrandt, L., Hillamo, R., Jimenez, J. L., Laaksonen, A., McFiggans, G., Mohr, C., O'Dowd, C., Otjes, R., Ovadnevaite, J., Pandis, S. N., Poulain, L., Schlag, P., Sellegri, K., Swietlicki, E., Tiitta, P., Vermeulen, A., Wahner, A., Worsnop, D., and Wu, H.-C.: Ubiquity of organic nitrates from nighttime chemistry in the European submicron aerosol, Geophys. Res. Lett., 43, 7735–7744, https://doi.org/10.1002/2016GL069239, 2016.
Kimmel, J. R., Farmer, D. K., Cubison, M. J., Sueper, D., Tanner, C., Nemitz, E., Worsnop, D. R., Gonin, M., and Jimenez, J. L.: Real-time aerosol mass spectrometry with millisecond resolution, Int. J. Mass Spectrom., 303, 15–26, https://doi.org/10.1016/j.ijms.2010.12.004, 2011.
Knote, C., Brunner, D., Vogel, H., Allan, J., Asmi, A., Äijälä, M., Carbone, S., van der Gon, H. D., Jimenez, J. L., Kiendler-Scharr, A., Mohr, C., Poulain, L., Prévôt, A. S. H., Swietlicki, E., and Vogel, B.: Towards an online-coupled chemistry-climate model: evaluation of trace gases and aerosols in COSMO-ART, Geosci. Model Dev., 4, 1077–1102, https://doi.org/10.5194/gmd-4-1077-2011, 2011.
Koenig, T. K., Baidar, S., Campuzano-Jost, P., Cuevas, C. A., Dix, B., Fernandez, R. P., Guo, H., Hall, S. R., Kinnison, D., Nault, B. A., Ullmann, K., Jimenez, J. L., Saiz-Lopez, A., and Volkamer, R.: Quantitative detection of iodine in the stratosphere, P. Natl. Acad. Sci. USA, 117, 1860–1866, https://doi.org/10.1073/pnas.1916828117, 2020.
Kupc, A., Williamson, C., Wagner, N. L., Richardson, M., and Brock, C. A.: Modification, calibration, and performance of the Ultra-High Sensitivity Aerosol Spectrometer for particle size distribution and volatility measurements during the Atmospheric Tomography Mission (ATom) airborne campaign, Atmos. Meas. Tech., 11, 369–383, https://doi.org/10.5194/amt-11-369-2018, 2018.
Kuwata, M., Zorn, S. R., and Martin, S. T.: Using elemental ratios to predict the density of organic material composed of carbon, hydrogen, and oxygen, Environ. Sci. Technol., 46, 787–794, https://doi.org/10.1021/es202525q, 2012.
Liu, P. S. K., Deng, R., Smith, K. A., Williams, L. R., Jayne, J. T., Canagaratna, M. R., Moore, K., Onasch, T. B., Worsnop, D. R., and Deshler, T.: Transmission Efficiency of an Aerodynamic Focusing Lens System: Comparison of Model Calculations and Laboratory Measurements for the Aerodyne Aerosol Mass Spectrometer, Aerosol Sci. Tech., 41, 721–733, https://doi.org/10.1080/02786820701422278, 2007.
Lohmann, U. and Feichter, J.: Global indirect aerosol effects: a review, Atmos. Chem. Phys., 5, 715–737, https://doi.org/10.5194/acp-5-715-2005, 2005.
Marple, V., Olson, B., Romay, F., Hudak, G., Geerts, S. M., and Lundgren, D.: Second Generation Micro-Orifice Uniform Deposit Impactor, 120 MOUDI-II: Design, Evaluation, and Application to Long-Term Ambient Sampling, Aerosol Sci. Tech., 48, 427–433, https://doi.org/10.1080/02786826.2014.884274, 2014.
Marple, V. A., Rubow, K. L., and Behm, S. M.: A Microorifice Uniform Deposit Impactor (MOUDI): Description, Calibration, and Use, Aerosol Sci. Tech., 14, 434–446, https://doi.org/10.1080/02786829108959504, 1991.
Matthew, B. M., Middlebrook, A. M., and Onasch, T. B.: Collection Efficiencies in an Aerodyne Aerosol Mass Spectrometer as a Function of Particle Phase for Laboratory Generated Aerosols, Aerosol Sci. Tech., 42, 884–898, https://doi.org/10.1080/02786820802356797, 2008.
McNaughton, C. S., Clarke, A. D., Howell, S. G., Pinkerton, M., Anderson, B., Thornhill, L., Hudgins, C., Winstead, E., Dibb, J. E., Scheuer, E., and Maring, H.: Results from the DC-8 Inlet Characterization Experiment (DICE): Airborne Versus Surface Sampling of Mineral Dust and Sea Salt Aerosols, Aerosol Sci. Tech., 41, 136–159, https://doi.org/10.1080/02786820601118406, 2007.
Mei, F., Hayes, P. L., Ortega, A., Taylor, J. W., Allan, J. D., Gilman, J., Kuster, W., de Gouw, J., Jimenez, J. L., and Wang, J.: Droplet activation properties of organic aerosols observed at an urban site during CalNex-LA, J. Geophys. Res.-Atmos., 118, 2903–2917, https://doi.org/10.1002/jgrd.50285, 2013.
Mei, F., Wang, J., Comstock, J. M., Weigel, R., Krämer, M., Mahnke, C., Shilling, J. E., Schneider, J., Schulz, C., Long, C. N., Wendisch, M., Machado, L. A. T., Schmid, B., Krisna, T., Pekour, M., Hubbe, J., Giez, A., Weinzierl, B., Zoeger, M., Pöhlker, M. L., Schlager, H., Cecchini, M. A., Andreae, M. O., Martin, S. T., de Sá, S. S., Fan, J., Tomlinson, J., Springston, S., Pöschl, U., Artaxo, P., Pöhlker, C., Klimach, T., Minikin, A., Afchine, A., and Borrmann, S.: Comparison of aircraft measurements during GoAmazon2014/5 and ACRIDICON-CHUVA, Atmos. Meas. Tech., 13, 661–684, https://doi.org/10.5194/amt-13-661-2020, 2020.
Middlebrook, A. M., Bahreini, R., Jimenez, J. L., and Canagaratna, M. R.: Evaluation of Composition-Dependent Collection Efficiencies for the Aerodyne Aerosol Mass Spectrometer using Field Data, Aerosol Sci. Tech., 46, 258–271, https://doi.org/10.1080/02786826.2011.620041, 2012.
Morgan, W. T., Allan, J. D., Bauguitte, S., Darbyshire, E., Flynn, M. J., Lee, J., Liu, D., Johnson, B., Haywood, J., Longo, K. M., Artaxo, P. E., and Coe, H.: Transformation and ageing of biomass burning carbonaceous aerosol over tropical South America from aircraft in situ measurements during SAMBBA, Atmos. Chem. Phys., 20, 5309–5326, https://doi.org/10.5194/acp-20-5309-2020, 2020.
Murphy, D. M.: The effects of molecular weight and thermal decomposition on the sensitivity of a thermal desorption aerosol mass spectrometer, Aerosol Sci. Tech., 50, 118–125, https://doi.org/10.1080/02786826.2015.1136403, 2016a.
Murphy, D. M.: Reply to “Comment on the effects of molecular weight and thermal decomposition on the sensitivity of a thermal desorption aerosol mass spectrometer” by Jimenez et al., Aerosol Sci. Tech., 50, 1277–1283, https://doi.org/10.1080/02786826.2016.1254347, 2016b.
Murphy, D. M., Cziczo, D. J., Froyd, K. D., Hudson, P. K., Matthew, B. M., Middlebrook, A. M., Peltier, R. E., Sullivan, A., Thomson, D. S., and Weber, R. J.: Single-particle mass spectrometry of tropospheric aerosol particles, J. Geophys. Res., 111, D23S32, https://doi.org/10.1029/2006JD007340, 2006.
Nault, B. A.: Using Event Trigger Panel for IE/AB and Transmission Curve Calibrations, CIRES, available at: http://cires1.colorado.edu/jimenez-group/UsrMtgs/UsersMtg17/2016-10-19_Nault_AMS_Users_Meeting_2016_v4_online.pdf (last access: 13 April 2021), 2016.
Nault, B. A., Campuzano-Jost, P., Day, D. A., Schroder, J. C., Anderson, B., Beyersdorf, A. J., Blake, D. R., Brune, W. H., Choi, Y., Corr, C. A., de Gouw, J. A., Dibb, J., DiGangi, J. P., Diskin, G. S., Fried, A., Huey, L. G., Kim, M. J., Knote, C. J., Lamb, K. D., Lee, T., Park, T., Pusede, S. E., Scheuer, E., Thornhill, K. L., Woo, J.-H., and Jimenez, J. L.: Secondary organic aerosol production from local emissions dominates the organic aerosol budget over Seoul, South Korea, during KORUS-AQ, Atmos. Chem. Phys., 18, 17769–17800, https://doi.org/10.5194/acp-18-17769-2018, 2018.
Ng, N. L., Herndon, S. C., Trimborn, A., Canagaratna, M. R., Croteau, P. L., Onasch, T. B., Sueper, D., Worsnop, D. R., Zhang, Q., Sun, Y. L., and Jayne, J. T.: An Aerosol Chemical Speciation Monitor (ACSM) for Routine Monitoring of the Composition and Mass Concentrations of Ambient Aerosol, Aerosol Sci. Tech., 45, 780–794, https://doi.org/10.1080/02786826.2011.560211, 2011.
NOAA, NASA, and U. S. Air Force: U. S. Standard Atmosphere 1976, U. S. Government Printing Office, Washington, DC, 1976.
Ovadnevaite, J., Ceburnis, D., Canagaratna, M., Berresheim, H., Bialek, J., Martucci, G., Worsnop, D. R., and O'Dowd, C.: On the effect of wind speed on submicron sea salt mass concentrations and source fluxes, J. Geophys. Res.-Atmos., 117, D16201, https://doi.org/10.1029/2011JD017379, 2012.
Pajunoja, A., Hu, W., Leong, Y. J., Taylor, N. F., Miettinen, P., Palm, B. B., Mikkonen, S., Collins, D. R., Jimenez, J. L., and Virtanen, A.: Phase state of ambient aerosol linked with water uptake and chemical aging in the southeastern US, Atmos. Chem. Phys., 16, 11163–11176, https://doi.org/10.5194/acp-16-11163-2016, 2016.
Park, K., Kittelson, D. B., Zachariah, M. R., and McMurry, P. H.: Measurement of Inherent Material Density of Nanoparticle Agglomerates, J. Nanopart. Res., 6, 267–272, https://doi.org/10.1023/b:nano.0000034657.71309.e6, 2004.
Peltier, R. E., Hecobian, A. H., Weber, R. J., Stohl, A., Atlas, E. L., Riemer, D. D., Blake, D. R., Apel, E., Campos, T., and Karl, T.: Investigating the sources and atmospheric processing of fine particles from Asia and the Northwestern United States measured during INTEX B, Atmos. Chem. Phys., 8, 1835–1853, https://doi.org/10.5194/acp-8-1835-2008, 2008.
Peters, T. M., Gussman, R. A., Kenny, L. C., and Vanderpool, R. W.: Evaluation of PM2.5 Size Selectors Used in Speciation Samplers, Aerosol Sci. Tech., 34, 422–429, https://doi.org/10.1080/02786820119266, 2001.
Petters, M. D., Prenni, A. J., Kreidenweis, S. M., DeMott, P. J., Matsunaga, A., Lim, Y. B., and Ziemann, P. J.: Chemical aging and the hydrophobic-to-hydrophilic conversion of carbonaceous aerosol, Geophys. Res. Lett., 33, L24806, https://doi.org/10.1029/2006GL027249, 2006.
Petzold, A., Ogren, J. A., Fiebig, M., Laj, P., Li, S.-M., Baltensperger, U., Holzer-Popp, T., Kinne, S., Pappalardo, G., Sugimoto, N., Wehrli, C., Wiedensohler, A., and Zhang, X.-Y.: Recommendations for reporting “black carbon” measurements, Atmos. Chem. Phys., 13, 8365–8379, https://doi.org/10.5194/acp-13-8365-2013, 2013.
Pilinis, C., Pandis, S. N., and Seinfeld, J. H.: Sensitivity of direct climate forcing by atmospheric aerosols to aerosol size and composition, J. Geophys. Res., 100, 18739–18754, https://doi.org/10.1029/95JD02119, 1995.
Poulain, L., Spindler, G., Grüner, A., Tuch, T., Stieger, B., van Pinxteren, D., Petit, J.-E., Favez, O., Herrmann, H., and Wiedensohler, A.: Multi-year ACSM measurements at the central European research station Melpitz (Germany) – Part 1: Instrument robustness, quality assurance, and impact of upper size cutoff diameter, Atmos. Meas. Tech., 13, 4973–4994, https://doi.org/10.5194/amt-13-4973-2020, 2020.
Reyes-Villegas, E., Bannan, T., Le Breton, M., Mehra, A., Priestley, M., Percival, C., Coe, H., and Allan, J. D.: Online Chemical Characterization of Food-Cooking Organic Aerosols: Implications for Source Apportionment, Environ. Sci. Technol., 52, 5308–5318, https://doi.org/10.1021/acs.est.7b06278, 2018.
Robinson, E. S., Onasch, T. B., Worsnop, D., and Donahue, N. M.: Collection efficiency of α-pinene secondary organic aerosol particles explored via light-scattering single-particle aerosol mass spectrometry, Atmos. Meas. Tech., 10, 1139–1154, https://doi.org/10.5194/amt-10-1139-2017, 2017.
Salcedo, D., Onasch, T. B., Dzepina, K., Canagaratna, M. R., Zhang, Q., Huffman, J. A., DeCarlo, P. F., Jayne, J. T., Mortimer, P., Worsnop, D. R., Kolb, C. E., Johnson, K. S., Zuberi, B., Marr, L. C., Volkamer, R., Molina, L. T., Molina, M. J., Cardenas, B., Bernabé, R. M., Márquez, C., Gaffney, J. S., Marley, N. A., Laskin, A., Shutthanandan, V., Xie, Y., Brune, W., Lesher, R., Shirley, T., and Jimenez, J. L.: Characterization of ambient aerosols in Mexico City during the MCMA-2003 campaign with Aerosol Mass Spectrometry: results from the CENICA Supersite, Atmos. Chem. Phys., 6, 925–946, https://doi.org/10.5194/acp-6-925-2006, 2006.
Salcedo, D., Onasch, T. B., Canagaratna, M. R., Dzepina, K., Huffman, J. A., Jayne, J. T., Worsnop, D. R., Kolb, C. E., Weimer, S., Drewnick, F., Allan, J. D., Delia, A. E., and Jimenez, J. L.: Technical Note: Use of a beam width probe in an Aerosol Mass Spectrometer to monitor particle collection efficiency in the field, Atmos. Chem. Phys., 7, 549–556, https://doi.org/10.5194/acp-7-549-2007, 2007.
Schroder, J. C., Campuzano-Jost, P., Day, D. A., Shah, V., Larson, K., Sommers, J. M., Sullivan, A. P., Campos, T., Reeves, J. M., Hills, A., Hornbrook, R. S., Blake, N. J., Scheuer, E., Guo, H., Fibiger, D. L., McDuffie, E. E., Hayes, P. L., Weber, R. J., Dibb, J. E., Apel, E. C., Jaeglé, L., Brown, S. S., Thornton, J. A., and Jimenez, J. L.: Sources and Secondary Production of Organic Aerosols in the Northeastern United States during WINTER, J. Geophys. Res.-Atmos., 123, 7771–7796, https://doi.org/10.1029/2018JD028475, 2018.
Schwarz, J. P., Spackman, J. R., Fahey, D. W., Gao, R. S., Lohmann, U., Stier, P., Watts, L. A., Thomson, D. S., Lack, D. A., Pfister, L., Mahoney, M. J., Baumgardner, D., Wilson, J. C., and Reeves, J. M.: Coatings and their enhancement of black carbon light absorption in the tropical atmosphere, J. Geophys. Res., 113, D03203, https://doi.org/10.1029/2007JD009042, 2008.
Schwarz, J. P., Spackman, J. R., Gao, R. S., Watts, L. A., Stier, P., Schulz, M., Davis, S. M., Wofsy, S. C., and Fahey, D. W.: Global-scale black carbon profiles observed in the remote atmosphere and compared to models, Geophys. Res. Lett., 37, L18812, https://doi.org/10.1029/2010GL044372, 2010a.
Schwarz, J. P., Spackman, J. R., Gao, R. S., Perring, A. E., Cross, E., Onasch, T. B., Ahern, A., Wrobel, W., Davidovits, P., Olfert, J., Dubey, M. K., Mazzoleni, C., and Fahey, D. W.: The Detection Efficiency of the Single Particle Soot Photometer, Aerosol Sci. Tech., 44, 612–628, https://doi.org/10.1080/02786826.2010.481298, 2010b.
Seinfeld, J. H. and Pandis, S. N.: Atmospheric Chemistry and Physics: From Air Pollution to Climate Change, 3rd edn., John Wiley & Sons. available at: https://play.google.com/store/books/details?id=n_RmCgAAQBAJ (last access: 13 April 2021), 2016.
Shilling, J. E., Chen, Q., King, S. M., Rosenoern, T., Kroll, J. H., Worsnop, D. R., DeCarlo, P. F., Aiken, A. C., Sueper, D., Jimenez, J. L., and Martin, S. T.: Loading-dependent elemental composition of α-pinene SOA particles, Atmos. Chem. Phys., 9, 771–782, https://doi.org/10.5194/acp-9-771-2009, 2009.
Shiraiwa, M., Kondo, Y., Moteki, N., Takegawa, N., Sahu, L. K., Takami, A., Hatakeyama, S., Yonemura, S., and Blake, D. R.: Radiative impact of mixing state of black carbon aerosol in Asian outflow, J. Geophys. Res., 113, 1042, https://doi.org/10.1029/2008JD010546, 2008.
Sloane, C. S., Watson, J., Chow, J., Pritchett, L., and Willard Richards, L.: Size-segregated fine particle measurements by chemical species and their impact on visibility impairment in Denver, Atmos. Environ. A-Gen., 25, 1013–1024, https://doi.org/10.1016/0960-1686(91)90143-u, 1991.
Slowik, J. G., Stainken, K., Davidovits, P., Williams, L. R., Jayne, J. T., Kolb, C. E., Worsnop, D. R., Rudich, Y., DeCarlo, P. F., and Jimenez, J. L.: Particle Morphology and Density Characterization by Combined Mobility and Aerodynamic Diameter Measurements. Part 2: Application to Combustion-Generated Soot Aerosols as a Function of Fuel Equivalence Ratio, Aerosol Sci. Tech., 38, 1206–1222, https://doi.org/10.1080/027868290903916, 2004.
Spanu, A., Dollner, M., Gasteiger, J., Bui, T. P., and Weinzierl, B.: Flow-induced errors in airborne in situ measurements of aerosols and clouds, Atmos. Meas. Tech., 13, 1963–1987, https://doi.org/10.5194/amt-13-1963-2020, 2020.
Stein, S. W., Turpin, B. J., Cai, X., Huang, P.-F., and Mcmurry, P. H.: Measurements of relative humidity-dependent bounce and density for atmospheric particles using the DMA-impactor technique, Atmos. Environ., 28, 1739–1746, https://doi.org/10.1016/1352-2310(94)90136-8, 1994.
Stith, J. L., Ramanathan, V., Cooper, W. A., Roberts, G. C., DeMott, P. J., Carmichael, G., Hatch, C. D., Adhikary, B., Twohy, C. H., Rogers, D. C., Baumgardner, D., Prenni, A. J., Campos, T., Gao, R., Anderson, J., and Feng, Y.: An overview of aircraft observations from the Pacific Dust Experiment campaign, J. Geophys. Res., 114, D05207, https://doi.org/10.1029/2008JD010924, 2009.
Takegawa, N., Miyazaki, Y., Kondo, Y., Komazaki, Y., Miyakawa, T., Jimenez, J. L., Jayne, J. T., Worsnop, D. R., Allan, J. D., and Weber, R. J.: Characterization of an Aerodyne Aerosol Mass Spectrometer (AMS): Intercomparison with Other Aerosol Instruments, Aerosol Sci. Tech., 39, 760–770, https://doi.org/10.1080/02786820500243404, 2005.
Talbot, R., Dibb, J., Scheuer, E., Seid, G., Russo, R., Sandholm, S., Tan, D., Singh, H., Blake, D., Blake, N., Atlas, E., Sachse, G., Jordan, C., and Avery, M.: Reactive nitrogen in Asian continental outflow over the western Pacific: Results from the NASA Transport and Chemical Evolution over the Pacific (TRACE-P) airborne mission, J. Geophys. Res., 108, 2171, https://doi.org/10.1029/2002JD003129, 2003.
Thomson, D. S., Schein, M. E., and Murphy, D. M.: Particle Analysis by Laser Mass Spectrometry WB-57F Instrument Overview, Aerosol Sci. Tech., 33, 153–169, https://doi.org/10.1080/027868200410903, 2000.
Timonen, H., Aurela, M., Carbone, S., Saarnio, K., Saarikoski, S., Mäkelä, T., Kulmala, M., Kerminen, V.-M., Worsnop, D. R., and Hillamo, R.: High time-resolution chemical characterization of the water-soluble fraction of ambient aerosols with PILS-TOC-IC and AMS, Atmos. Meas. Tech., 3, 1063–1074, https://doi.org/10.5194/amt-3-1063-2010, 2010.
Tsigaridis, K., Daskalakis, N., Kanakidou, M., Adams, P. J., Artaxo, P., Bahadur, R., Balkanski, Y., Bauer, S. E., Bellouin, N., Benedetti, A., Bergman, T., Berntsen, T. K., Beukes, J. P., Bian, H., Carslaw, K. S., Chin, M., Curci, G., Diehl, T., Easter, R. C., Ghan, S. J., Gong, S. L., Hodzic, A., Hoyle, C. R., Iversen, T., Jathar, S., Jimenez, J. L., Kaiser, J. W., Kirkevåg, A., Koch, D., Kokkola, H., Lee, Y. H., Lin, G., Liu, X., Luo, G., Ma, X., Mann, G. W., Mihalopoulos, N., Morcrette, J.-J., Müller, J.-F., Myhre, G., Myriokefalitakis, S., Ng, N. L., O'Donnell, D., Penner, J. E., Pozzoli, L., Pringle, K. J., Russell, L. M., Schulz, M., Sciare, J., Seland, Ø., Shindell, D. T., Sillman, S., Skeie, R. B., Spracklen, D., Stavrakou, T., Steenrod, S. D., Takemura, T., Tiitta, P., Tilmes, S., Tost, H., van Noije, T., van Zyl, P. G., von Salzen, K., Yu, F., Wang, Z., Wang, Z., Zaveri, R. A., Zhang, H., Zhang, K., Zhang, Q., and Zhang, X.: The AeroCom evaluation and intercomparison of organic aerosol in global models, Atmos. Chem. Phys., 14, 10845–10895, https://doi.org/10.5194/acp-14-10845-2014, 2014.
van Donkelaar, A., Martin, R. V., Leaitch, W. R., Macdonald, A. M., Walker, T. W., Streets, D. G., Zhang, Q., Dunlea, E. J., Jimenez, J. L., Dibb, J. E., Huey, L. G., Weber, R., and Andreae, M. O.: Analysis of aircraft and satellite measurements from the Intercontinental Chemical Transport Experiment (INTEX-B) to quantify long-range transport of East Asian sulfur to Canada, Atmos. Chem. Phys., 8, 2999–3014, https://doi.org/10.5194/acp-8-2999-2008, 2008.
Vay, S. A., Anderson, B. E., Thornhill, K. L., and Hudgins, C. H.: An Assessment of Aircraft-Generated Contamination on In Situ Trace Gas Measurements: Determinations from Empirical Data Acquired Aloft, J. Atmos. Ocean. Tech., 20, 1478–1487, https://doi.org/10.1175/1520-0426(2003)020<1478:AAOACO>2.0.CO;2, 2003.
Wang, J., Cubison, M. J., Aiken, A. C., Jimenez, J. L., and Collins, D. R.: The importance of aerosol mixing state and size-resolved composition on CCN concentration and the variation of the importance with atmospheric aging of aerosols, Atmos. Chem. Phys., 10, 7267–7283, https://doi.org/10.5194/acp-10-7267-2010, 2010.
Williamson, C., Kupc, A., Wilson, J., Gesler, D. W., Reeves, J. M., Erdesz, F., McLaughlin, R., and Brock, C. A.: Fast time response measurements of particle size distributions in the 3–60 nm size range with the nucleation mode aerosol size spectrometer, Atmos. Meas. Tech., 11, 3491–3509, https://doi.org/10.5194/amt-11-3491-2018, 2018.
Williamson, C. J., Kupc, A., Axisa, D., Bilsback, K. R., Bui, T., Campuzano-Jost, P., Dollner, M., Froyd, K. D., Hodshire, A. L., Jimenez, J. L., Kodros, J. K., Luo, G., Murphy, D. M., Nault, B. A., Ray, E. A., Weinzierl, B., Wilson, J. C., Yu, F., Yu, P., Pierce, J. R., and Brock, C. A.: A large source of cloud condensation nuclei from new particle formation in the tropics, Nature, 574, 399–403, https://doi.org/10.1038/s41586-019-1638-9, 2019.
Wofsy, S. C., Afshar, S., Allen, H. M., Apel, E., Asher, E. C., Barletta, B., Bent, J., Bian, H., Biggs, B. C., Blake, D. R., Blake, N., Bourgeois, I., Brock, C. A., Brune, W. H., Budney, J. W., Bui, T. P., Butler, A., Campuzano-Jost, P., Chang, C. S., Chin, M., Commane, R., Correa, G., Crounse, J. D., Cullis, P. D., Daube, B. C., Day, D. A., Dean-Day, J. M., Dibb, J. E., Digangi, J. P., Diskin, G. S., Dollner, M., Elkins, J. W., Erdesz, F., Fiore, A. M., Flynn, C. M., Froyd, K., Gesler, D. W., Hall, S. R., Hanisco, T. F., Hannun, R. A., Hills, A. J., Hintsa, E. J., Hoffman, A., Hornbrook, R. S., Huey, L. G., Hughes, S., Jimenez, J. L., Johnson, B. J., Katich, J. M., Keeling, R., Kim, M. J., Kupc, A., Lait, L. R., Lamarque, J.-F., Liu, J., Mckain, K., Mclaughlin, R. J., Meinardi, S., Miller, D. O., Montzka, S. A., Moore, F. L., Morgan, E. J., Murphy, D. M., Murray, L. T., Nault, B. A., Neuman, J. A., Newman, P. A., Nicely, J. M., Pan, X., Paplawsky, W., Peischl, J., Prather, M. J., Price, D. J., Ray, E., Reeves, J. M., Richardson, M., Rollins, A. W., Rosenlof, K. H., Ryerson, T. B., Scheuer, E., Schill, G. P., Schroder, J. C., Schwarz, J. P., St. Clair, J. M., Steenrod, S. D., Stephens, B. B., Strode, S. A., Sweeney, C., Tanner, D., Teng, A. P., Thames, A. B., Thompson, C. R., Ullmann, K., Veres, P. R., Vizenor, N., Wagner, N. L., Watt, A., Weber, R., Weinzierl, B., Wennberg, P. O., Williamson, C. J., Wilson, J. C., Wolfe, G. M., Woods, C. T., and Zeng, L. H.: ATom: Merged Atmospheric Chemistry, Trace Gases, and Aerosols, ORNL DAAC, Oak Ridge, Tennessee, USA, https://doi.org/10.3334/ORNLDAAC/1581, 2018.
Xu, W., Lambe, A., Silva, P., Hu, W., Onasch, T., Williams, L., Croteau, P., Zhang, X., Renbaum-Wolff, L., Fortner, E., Jimenez, J. L., Jayne, J., Worsnop, D., and Canagaratna, M.: Laboratory evaluation of species-dependent relative ionization efficiencies in the Aerodyne Aerosol Mass Spectrometer, Aerosol Sci. Tech., 52, 626–641, https://doi.org/10.1080/02786826.2018.1439570, 2018.
Zhang, Q., Stanier, C. O., Canagaratna, M. R., Jayne, J. T., Worsnop, D. R., Pandis, S. N., and Jimenez, J. L.: Insights into the chemistry of new particle formation and growth events in Pittsburgh based on aerosol mass spectrometry, Environ. Sci. Technol., 38, 4797–4809, https://doi.org/10.1021/es035417u, 2004.
Zhang, Q., Parworth, C., Lechner, M., and Jimenez, J. L.: Aerosol Mass Spectrometer (AMS) Global Database, available at: https://sites.google.com/site/amsglobaldatabase/ (last access: 15 November 2019), 2018.