the Creative Commons Attribution 4.0 License.
the Creative Commons Attribution 4.0 License.
Modeled source apportionment of black carbon particles coated with a light-scattering shell
The Aethalometer model has been used widely for estimating the contributions of fossil fuel emissions and biomass burning to equivalent black carbon (eBC). The calculation is based on measured absorption Ångström exponents (αabs). The interpretation of αabs is ambiguous since it is well known that it not only depends on the dominant absorber but also on the size and internal structure of the particles, core size, and shell thickness. In this work the uncertainties of the Aethalometer-model-derived apparent fractions of absorption by eBC from fossil fuel and biomass burning are evaluated with a core–shell Mie model. Biomass-burning fractions (BB(%)) were calculated for pure and coated single BC particles for lognormal unimodal and bimodal size distributions of BC cores coated with ammonium sulfate, a scattering-only material. BB(%) was very seldom 0 % even though BC was the only absorbing material in the simulations. The shape of size distribution plays an important role. Narrow size distributions result in higher αabs and BB(%) values than wide size distributions. The sensitivity of αabs and BB(%) to variations in shell volume fractions is the highest for accumulation-mode particles. This is important because that is where the largest aerosol mass is. For the interpretation of absorption Ångström exponents it would be very good to measure BC size distributions and shell thicknesses together with the wavelength dependency of absorption.
- Article
(3643 KB) - Full-text XML
-
Supplement
(253 KB) - BibTeX
- EndNote
Incomplete combustion of organic fuels results in emission of light-absorbing carbon (LAC) particles that contain both black carbon (BC) and brown carbon (BrC). BrC is light-absorbing organic matter in atmospheric aerosols of various origins, e.g., soil humics, humic-like substances (HULIS), tarry materials from combustion, and bioaerosols (Andreae and Gelenscer, 2006; Laskin et al., 2015). BrC can significantly absorb solar radiation in the ultraviolet–visible (UV–Vis) wavelength range (λ≈ 300–800 nm). The radiative effects of BC and BrC vary in time during atmospheric aging. For many combustion sources the absorbance in fresh emission is almost completely caused by BC particles, but during atmospheric transport they often get coated with some light-scattering compounds, for instance ammonium sulfate or light-absorbing organic carbon, BrC. For some sources (e.g., biomass burning) BrC may contribute substantially to light absorption already in the directly emitted aerosols and either increase or decrease during aging. Thus, BrC is highly time-dependent as its composition and absorption properties change during atmospheric oxidation processes (Laskin et al., 2015).
The absorption coefficient σap is approximately proportional to the power function , where λ is the wavelength and αabs is the absorption Ångström exponent. αabs is generally used to distinguish aerosol types: for pure BC particles αabs≈ 1, while for other light-absorbing aerosols (BrC, soil dust) it is clearly > 1 (e.g., Kirchstetter et al., 2004; Bond and Bergstrom, 2006; Bergstrom et al., 2007; Moosmüller et al., 2011; Kirchstetter and Thatcher, 2012; Lack et al., 2012; Bond et al., 2013; Saleh et al., 2013; Laskin et al., 2015; Valenzuela et al., 2015; Devi et al., 2016). The method has been used not only for in situ absorption measurements but also for interpreting absorption coefficients retrieved from remote sensing measurements, such as the Aerosol Robotic Network (AERONET; e.g., Russell et al., 2010; Arola et al., 2011; Chung et al., 2012; Cazorla et al., 2013; Feng et al., 2013; Schuster et al., 2016; Wang et al., 2016).
One of the instruments used for measuring black carbon concentrations is the Aethalometer that collects aerosol on a filter tape, measures changes in light attenuation in the wavelength range of 370–950 nm, and calculates the equivalent black carbon (eBC) concentrations. The data are used also to calculate αabs and to estimate the contributions of fossil fuel emissions and biomass burning to eBC. The Aethalometer model (Sandradewi et al., 2008a) is probably the most widely used method for this, and it is even calculated automatically in the new Aethalometer model AE33. It is there assumed that the absorption Ångström exponents are αff = 1 and αbb = 2 for eBC from fossil fuel and biomass burning, respectively. These are the default settings in the AE33, but also different αff and αbb values have been used (Sandradewi et al., 2008b; Herich et al., 2011; Fuller et al., 2014; Harrison et al., 2013; Healy et al., 2017; Zotter et al., 2017; Helin et al., 2018)
The interpretation of αabs is ambiguous since it not only depends on the dominant absorber but also on the size and internal structure of the particles, core size, and shell thickness. For instance, for pure BC particles, αabs may be < 1 and BC particles coated with non-absorbing material may have αabs in the range from < 1 to ∼ 1.7 (e.g., Gyawali et al., 2009; Lack and Cappa, 2010; Lack and Langridge, 2013; Schuster et al., 2016; Liu et al., 2018; Chylek et al., 2019; Zhang et al., 2020). The present paper may be considered an extension to the abovementioned analyses since they did not explicitly analyze the effects on the Aethalometer model.
The aim of this study is to estimate uncertainties of the Aethalometer-model-derived fractions of absorption by eBC from fossil fuel and biomass burning when spherical BC cores are coated by some non-absorbing material. To state this more clearly, it is assumed that there is only one type of BC particles that can be called fossil fuel BC in the Aethalometer model terminology. Consequently, any deviations from biomass-burning fraction of BB % = 0 indicate uncertainty in the source appointment. Biomass-burning fractions were calculated for pure and coated single particles for lognormal unimodal and bimodal size distributions. The work is based on modeling only; no measurement data are used.
The BC cores were assumed to be coated with an ammonium sulfate shell by using two approaches. It was assumed (1) that the shell thickness is the same for all particles in a size distribution (Fig. 1a) and (2) that the core volume fraction is the same for all particles in a size distribution (Fig. 1b). The core volume fraction was calculated from
where Vp is the particle volume, Vcore is the BC core volume, Dp is the particle diameter (= Dcore+2s), Dcore is the BC core diameter, and s is the shell thickness. The shell volume fraction was then calculated from . The ratio of the coated particle diameter to the core diameter is an often used metric for presenting the coating of particles. R, fc, and fs can be calculated from each other as
The number-weighted Dp-to-Dcore ratio is calculated from
where Ni and Ri are the number concentration and Dp-to-Dcore ratio of the particle diameter Dp,i, respectively. If fs is independent of particle size – which is the assumption used in some of the simulations below – Eq. (3) simplifies to = R.
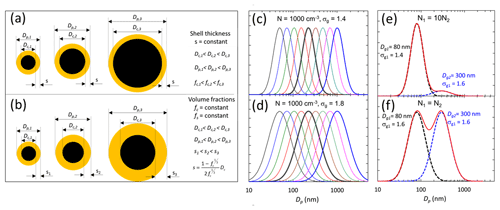
Figure 1Examples of particles and size distributions used in the simulations: (a) particles with a BC core coated with a constant shell thickness s, (b) particles with constant BC core and shell volume fractions fc and fs, (c) unimodal narrow size distributions with the geometric standard deviation of σg = 1.4, (d) unimodal wide size distributions with σg = 1.8, (e) bimodal size distributions with a dominating Aitken mode, and (f) bimodal size distributions with equal-sized Aitken and accumulation modes.
Lognormal size distributions were generated, where Dp is the particle diameter, Dg is the geometric mean diameter, and σg is the geometric standard deviation. The Dp range was 3 nm–10 µm. For the unimodal size distributions the Dg range was 50 nm–1 µm, and σg was given three values: 1.4, 1.6, and 1.8 (Fig. 1c and d). Bimodal size distributions were also generated. For the small-particle mode the geometric mean diameter Dg1 range was 50–100 nm, and the large-particle mode Dg2 range was 100–500 nm. In addition to varying the geometric mean diameters, the ratios of the number of particles in the two modes were also varied. Two cases were used for this: (1) N1=10N2, σg1=1.4, σg2=1.6 (Fig. 1e) and (2) N1=N2, σg1=1.6, σg2=1.6 (Fig. 1f).
Absorption coefficients were calculated from
where Qa is the absorption efficiency that is a function of the wavelength λ, Dp, the complex refractive indices of the core and shell, mcore and mshell , respectively, and the shell thickness s. Qa was calculated using the N-Mie Fortran code written and described in detail by Voshchinnikov and Mathis (1999). The code is based on the recursive algorithm of Wu and Wang (1991). The code calculates the extinction, scattering, and absorption efficiency factors for n-layered spheres. The complex refractive indices were (BC as in Lack and Cappa, 2010) and (ammonium sulfate) for the core and shell, respectively. Absorption coefficients were calculated for the Aethalometer wavelengths λ = 470 and 950 nm, and αabs was calculated from
The wavelengths 470 and 950 nm were used as they are used also in the AE33 automatic source apportionment. In analyses of aerosol optical depth data from AERONET, αabs is often calculated for the wavelength pair 440 and 870 nm (Russell et al., 2010; Schuster et al., 2016). To evaluate the applicability of the simulations of the present work to AERONET data analyses, σap was calculated also for these wavelengths, and the respective αabs was calculated from them. There are size-dependent differences between and , but they are not big (see Figs. S1 and S2 in the Supplement), so it may safely be concluded that the results to be presented below are valid also for the AERONET data.
For the absorption due to particles from wood burning or biomass burning, Zotter et al. (2017) give the equation
where αff and αbb are the αabs of fossil fuel and biomass-burning BC in the Aethalometer model. Noting that , the fraction of absorption due to biomass burning is
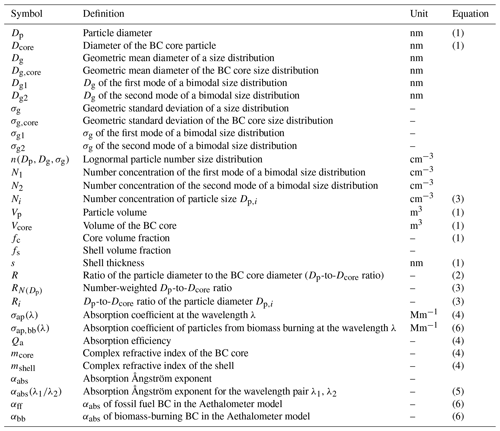
so that BB% depends on the Ångström exponents αabs, αff, and αbb. Two settings for the constants were used: the one presented in the AE33 manual, αff = 1 and αbb = 2; and the one presented by Zotter et al. (2017), αff = 0.9 and αbb = 1.68. The symbols and their definitions are presented in Table 1.
3.1 Single particles
The absorption Ångström exponent αabs and the fraction of biomass-burning BC for single coated particles are shown in Fig. 2. The dashed lines in Fig. 2a, c, and e show the core diameter Dcore of particles that have the same diameter Dp at all shell thicknesses. In Fig. 2b, d, and f the dashed lines show the particle diameter Dp and fs of particles that have the same Dcore at all shell volume fractions fs in the range fs ≤ 99 %. The dependence of αabs on core and shell is presented twice. This is apparently superfluous, but they are visualizations that complement each other.
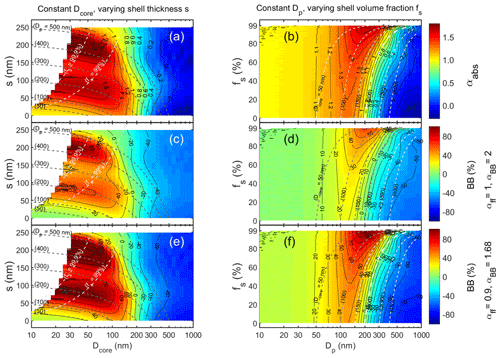
Figure 2Absorption Ångström exponent (αabs) and the fraction of biomass-burning BC calculated from it for single coated particles (a, c, e) as a function of BC core diameter (Dcore) and shell thickness (s) and (b, d, f) as a function of particle diameter (Dp = Dcore+2s) and shell volume fraction fs in the range fs ≤ 99 %. In panels (a), (c), and (e), the dark dashed lines show the Dcore and s of particles that have the same Dp – written in parentheses – at all shell thicknesses, and the light dashed lines show the shell thicknesses that correspond to fs = 99 % and 99.9 %. In panels (b), (d), and (f), the dashed lines show the Dp and fs of particles that have the same Dcore – written in parentheses – at all shell volume fractions. The color bars are common for panels (a) and (b), (c) and (d), and (e) and (f).
The first approach (Fig. 2a, c, and e) shows that when Dcore < ∼ 150 nm and s > ∼ 25–50 nm the absorption Ångström exponent αabs > 1.4. The respective BB fractions are larger than about 40 % or 60 % for the Aethalometer model parameters of αff = 1, αbb = 2 (pair 1) and αff = 0.9, αbb = 1.68 (pair 2), respectively. Figure 2a also shows that for Dcore < ∼ 100 nm there are two maxima of the αabs when the shell grows thicker. In the second maximum, αabs > ∼ 1.6. As a result the BB fractions would be > 60 % and even > 100 % for the two Aethalometer model parameter pairs. When Dcore is in the range of ∼ 170–200 nm, αabs ≈ 1 and αabs decreases with a growing s. For larger core diameters the absorption Ångström exponent is even smaller. When Dcore > 200 nm, αabs < 1 and even negative for Dcore > ∼ 360 nm. Further, when Dcore > 200 nm, αabs does not grow essentially at all as a function of s.
The visualization of αabs as a function of shell volume fraction fs and particle full diameter Dp (Fig. 2b) shows some other features. When Dp < 50 nm, αabs varies in the range of 1.0–1.1, and it does not depend on fs, but in the Dp range of about 100–300 nm αabs depends strongly on fs. When Dp ≈ 500 nm, αabs < 1 for almost all shell volume fractions, up to fs ∼ 99 %. For larger particles αabs is close to 0 at all shell volume fractions.
The visualization also shows that the αabs value of 1, usually considered an indication of BC, is not a result of an unambiguous Dcore−s (Fig. 2a) or Dp−fs (Fig. 2b) combination.
3.2 Unimodal BC core size distributions, same coating thickness for all sizes
For single particles αabs depends clearly on both the core size and the shell thickness. However, in real atmospheric studies the wavelength dependency of absorption by particle size distributions is measured. Here these were first modeled by assuming that pure BC particle size distributions get coated with ammonium sulfate layers so that the shell thickness is independent of particle size as visualized in Fig. 1a. For example, the shell thickness on a 50 nm BC particle would be the same as on a 200 nm particle, which means the shell volume fractions are not the same. The BC core geometric mean diameter (Dg,core) was varied from 50 to 200 nm at 10 nm intervals. The geometric standard deviations of the size distributions were σg = 1.4, σg = 1.6, and σg = 1.8, representing narrow, average, and wide size distributions. The shell thickness s varied from 0 to 250 nm at 1 nm intervals. Absorption coefficient and subsequently αabs was calculated for the full size distribution 3–2500 nm.
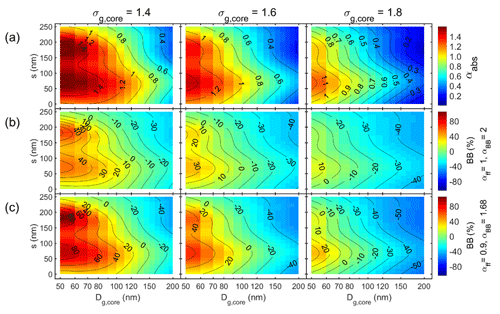
Figure 3Unimodal particle size distributions with a size-independent shell thickness (s) for three widths of the core size distributions: σg,core = 1.4, 1.6, and 1.8. (a) Absorption Ångström exponent (αabs) and the fraction of biomass-burning BC (BB(%)) calculated from it with the Aethalometer model constants of (b) αff = 1 and αbb = 2 and (c) αff = 0.9 and αbb = 1.68 vs. the geometric mean diameter of the core (Dg,core).
The results are first shown as a function of Dg,core and shell thickness s for the three size distribution widths (Fig. 3). There are both similarities and differences compared with the corresponding relationships of single particles (Fig. 2). For example, for single particles αabs ≈ 1 at Dcore ≈ 180 nm for shell thicknesses s ≈ 0–70 nm as shown by the almost vertical αabs = 1 isoline in Fig. 2a, whereas for the size distributions with σg,core > 1 the respective isoline is a strong function of both s and σg,core (Fig. 3a). At all widths of the size distribution, αabs increases with increasing shell thickness and then starts decreasing. For small core sizes (Dg,core < ∼ 80 nm) αabs also has a second maximum when the size distribution is narrow. The width of the size distribution has a clear effect on the αabs: for all core sizes and shell thicknesses αabs decreases with increasing σg,core.
Both for single particles and size distributions the first maximum of αabs is the smaller the larger the Dg,core and σg,core are (Fig. 4a). The first maximum is reached at shell thickness s ≈ 70 ± 5 nm for all size distribution widths although for single particles the variability of the shell thickness corresponding to the first maximum is larger (Fig. 4b). The first maximum αabs results in apparent BB fractions of up to ∼ 100 % for single particles and in the range from 0 % to ∼ 80 % for the size distributions, and again the BB(%) is smaller the larger the Dg,core and σg are (Fig. 4c and d).
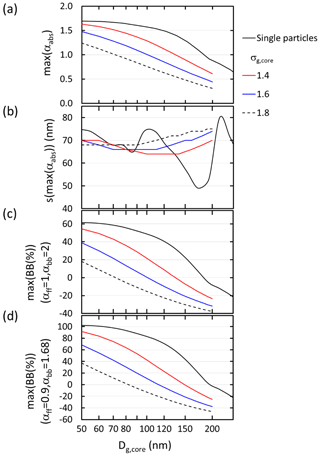
Figure 4Size distribution dependence of the first maximum of αabs when a size-independent shell grows on a BC core: (a) the first maximum value of αabs, (b) the shell thickness at the maximum αabs, (c) maximum biomass-burning fraction with the Aethalometer model constants αff = 1 and αbb= 2, and (d) maximum biomass-burning fraction with the Aethalometer model constants αff = 0.9 and αbb = 1.68 as a function of the BC core geometric mean diameter (Dg,core) and geometric standard deviation (σg,core).
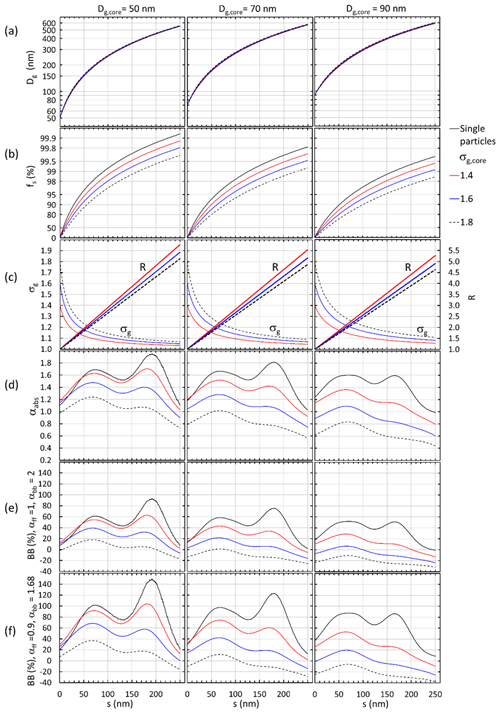
Figure 5Examples of the growth of a non-size-dependent scattering shell on BC core size distributions with , 70, and 90 nm and on single BC particles. (a) Geometric mean diameter, (b) shell volume fraction, (c) geometric standard deviation and Dp-to-Dcore ratio (R), (d) absorption Ångström exponent, (e) BB(%) with the Aethalometer model constants αff = 1 and αbb = 2, and (d) biomass-burning fraction with the Aethalometer model constants αff = 0.9 and αbb = 1.68 as a function shell thickness s.
This approach is further followed by plotting the parameters as a function of shell thickness for three different BC core diameters, 50, 70, and 90 nm of single particles and core size distributions with the geometric standard deviations of σg,core = 1.4, 1.6, and 1.8 (Fig. 5). This analysis can be considered a description of what may happen to the size distribution, αabs, and the apparent BB(%) during condensational growth on fresh small BC cores if the growing shell thickness were independent of the core diameter, even if this is unrealistic. The shell volume fraction fs increases to > 99.9 % when the shell thickness grows from s = 0 to 250 nm on single 50 nm particles but to lower fractions for the wider size distributions and larger core sizes so that for Dg,core = 90 m and σg = 1.8, fs ≈ 98 % even with s = 250 nm (Fig. 5a). The geometric mean diameter Dg of the whole size distribution grows to ∼ 600 nm when the shell thickness grows to 250 nm, with minimal differences between the original widths (Fig. 5b). The width of the size distribution, i.e., σg, decreases fast to < 1.2 (Fig. 4c). Such values correspond to very narrow size distributions, which are not really observed in the real atmosphere.
The number-weighted Dp-to-Dcore ratio , Eq. (3), was calculated for the size range 90–600 nm to present the numbers comparable with papers that present shell-to-core ratios of refractory BC (rBC) obtained from SP2 measurements. For instance, Kondo et al. (2011) measured urban air of Tokyo and obtained the median R = 1.1 with a range up to about 1.3, the mean Dg = 64 ± 6 nm, and σg = 1.66 ± 0.12. Moteki et al. (2007) conducted SP2 measurements in an aircraft in urban plumes on the Japanese coast. They fitted the data with lognormal size distributions with mass median diameters (MMDs) of 190 and 210 nm and σg of 1.55 and 1.45 for fresh and aged rBC, respectively. The fresh rBC was thinly coated with R < 2 and the aged rBC thickly coated with R ∼ 2. The MMD and σg values yield Dg = 107 and 139 nm. Shiraiwa et al. (2008) measured the mixing state and size distribution of BC aerosol with an SP2 at a remote island (Fukue) in Japan. They observed that the BC number median diameters were in the range of 120–140 nm in every air mass type, and the median shell core diameter ratio (R) in different air masses varied in the range of 1.2–1.6. However, they also observed that the fraction of R values in the range 2–3.5 was not negligible either (Fig. 9 of Shiraiwa et al., 2008). Such values correspond to the range where αabs first grows to > 1.6 for the narrow (σg,core = 1.4) BC core size distribution that has the smallest geometric mean size (Dg,core = 50 nm) but to lower values for the wider size distributions that have larger Dg,core (Fig. 5c and d). The first maximum is reached at shell thicknesses of s ≈ 70 nm that correspond to R ≈ 2 and shell volume fractions of fs ≈ 90 ± 8 % (Fig. 5b). Schwarz et al. (2008) reported statistics of rBC mass size distributions in urban aerosol: fs = 9 ± 6 %, s = 20 ± 10 nm, MMD = 170 nm, and σg of 1.71, which yields Dg = 72 nm; in biomass-burning emissions: %, s = 65 ± 12 nm, MMD = 210 nm, and σg = 1.43, which yields Dg = 143 nm; and in background continental aerosol: fs = 46 ± 3 %, s = 48 ± 14 nm, MMD = 210 nm, and σg=1.55, which yields Dg = 118 nm.
The referenced studies show that the s, R, and fs values are in the range observed in ambient measurements studies. What is not realistic in atmospheric aerosol is the width of the size distribution, which soon decreases to σg < 1.2 (Fig. 5c).
After reaching the first maximum, αabs decreases, and for single particles and the narrowest core size distributions it starts growing again and reaches a second maximum at shell thicknesses of s ≈ 170 nm, which corresponds to R > 4 and fs > 98 %. Such s and R values are not in the range observed in the abovementioned studies, nor are the low geometric standard deviations of σg < 1.1 realistic, so the second maximum can be considered as a theoretical value only. For size distributions with Dg,core > 70 nm there is no second maximum of αabs.
As αabs increases and decreases, it is clear that this applies to BB(%) as well (Fig. 5d–e). For the smallest core sizes (Dg,core = 50 nm) and the narrowest size distributions (σg,core = 1.4), the first maximum BB(%) may be as high as ∼ 90 % when the values of αff = 0.9 and αbb = 1.68 are used in Eq. (7) but lower, ∼ 50 %, when the values of αff = 1 and αbb = 2 are used. For the wider core size distributions the BB(%) fractions are lower. For the widest core size distributions (σg,core = 1.8) clearly positive BB(%) values are reached only for the smallest core sizes.
Figure 5 can also be considered a proxy for a time series of the development of αabs and derived BB(%) after emission of BC particles and their growth by condensation of non-absorbing compounds. A similar development – αabs values increase to > 1.3 and decrease to < 0.9 during a several-day-long pollution episode during which the Dg of the whole size distribution grew possibly by condensation – was observed at the Station for Observing Regional Processes of the Earth System (SORPES) in Nanjing, China (Fig. 9 of Shen et al., 2018). There was no SP2 available for the core–shell structure measurements in that study, so it cannot really be proven that the observed αabs development was due to condensational growth even though it seems a good explanation and is qualitatively in line with Fig. 5.
3.3 Unimodal size distributions with the same BC core fraction for all sizes
The second approach is to assume that the BC core fraction – or equivalently the shell volume fraction – is the same for all sizes, which means that the shell thickness increases with size as was visualized in Fig. 1b. This can be considered to be a result of aging of BC by not only condensational growth but also by cloud processing. The latter would lead to thick shells on particles activated into cloud droplets that would absorb for instance SO2 and NH3 and that would not rain but later get back into the aerosol phase by evaporation of cloud water. The constant volume fraction is not realistic but neither is the constant shell thickness. Both can be considered to be approximations.
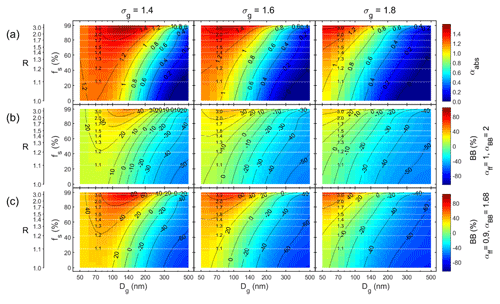
Figure 6Unimodal particle size distributions with size-independent shell volume fractions fs and three widths of the size distributions: σg = 1.4, 1.6, and 1.8. (a) Absorption Ångström exponent (αabs) and the fraction of biomass-burning BC (BB(%)) calculated from it with the Aethalometer model constants of (b) αff = 1 and αbb = 2 and (c) αff = 0.9 and αbb = 1.68 vs. the geometric mean diameter of the whole size distribution (Dg). The white horizontal grid lines show constant Dp-to-Dcore ratios (=R).
In this approach the geometric standard deviations of the whole size distributions were set to σg = 1.4, 1.6, and 1.8, and the shell volume fractions fs were set to vary from 0 % to 99 %. The resulting αabs and BB(%) are presented as a function of Dg, fs, and σg (Fig. 6). They are comparable with the analogous plots for single particles, i.e., σg = 1.0 (Fig. 2b, d, and f). Note that from Eq. (2) it follows that the assumption of a constant fs means that also the Dp-to-Dcore ratio R is constant and that the fs range of 0 % to 99 % corresponds to the R range of 1 to 4.6. Figure 6 therefore has two y axes: one showing the fs and the other the corresponding R values.
Several observations can be made from Fig. 6. One of them is that the isoline of αabs = 1 grows with growing Dg for each of the size distribution widths (σg) but decreases with growing σg. Another is that the wider the size distribution is, the lower the αabs and BB(%) are at any given shell volume fraction. The third one is that for all three widths αabs and BB(%) grows when fs grows but that the growth is not uniformly distributed over the fs vs. Dg space.
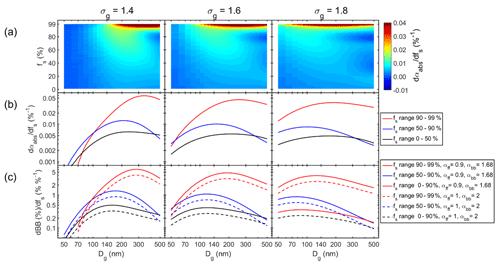
Figure 7Size-dependent sensitivity of αabs and BB(%) to variations of the shell volume fraction fs. (a) αabs sensitivity in the whole fs range of 1 %–99 %, (b) average αabs sensitivity in three fs ranges, and (c) average BB(%) sensitivities in three fs ranges.
The last observation leads to calculations of size-dependent sensitivities of αabs to variations in fs. The sensitivity was calculated as , and its unit is %−1. Figure 7a shows the sensitivities in the whole fs range of 1 %–99 % as a function of Dg for the three size distribution widths. The sensitivity depends clearly on both Dg and σg of the size distribution, and it also varies with fs. It is very clear that αabs is most sensitive to fs variations when Dg of the size distribution is in the accumulation-mode sizes of 100–200 nm. The sensitivity grows fairly steadily with growing fs until it increases very strongly for fs > 90 % – which equals R > 2.
Another step for visualizing the sensitivities was taken by calculating size-dependent average sensitivities of αabs and BB(%) in three fs ranges: fs = 0 %–50 %, 50 %–90 %, and 90 %–99 % (Fig. 7b and c).
According to Eq. (2) the fs ranges correspond to the R ranges of 1–1.3, 1.3–2.2, and 2.2–4.6. The lines in Fig. 7b and c can be used for a rough estimate on a possible effect on αabs and BB(%). For instance, if Dg≈ 140 nm, σg = 1.4, and fs ≈ 50 %–90 % , an increase in fs from 50 % to 51 % leads to an αabs increase of ∼ 0.01 and consequently to a BB(%) increase of ∼ 1 % when Aethalometer model constants of αff = 0.9 and αbb = 1.68 are used.
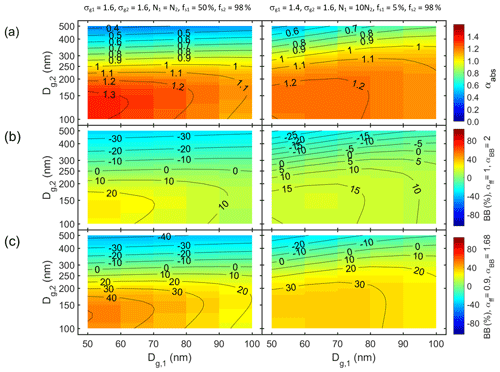
Figure 8Bimodal particle size distributions with size-independent shell volume fractions fs in two modes as a function of geometric mean diameters of mode 1 (Dg1) and mode 2 (Dg2). (a) Absorption Ångström exponent (αabs) and the fraction of biomass-burning BC (BB(%)) calculated from it with the Aethalometer model constants of (b) αff = 1 and αbb = 2 and (c) αff = 0.9 and αbb = 1.68. The widths, the relative number of particles in the two modes, and the shell volume fractions of the two modes: σg1 = 1.6, σg2 = 1.6, N1 = N2, fs1 = 50 %, and fs2 = 98 % on the left column and σg1 = 1.4, σg2 = 1.6, N1 = 10N2, fs1 = 5 %, and fs2 = 98 % on the right column.
3.4 Bimodal size distributions with the same BC core fraction for all sizes in the mode
Finally, bimodal size distributions are examined briefly. The size distributions consist of two externally mixed modes that have different shell volume fractions. In both modes the shell volume fractions are size-independent as in Fig. 1b. Mode 1 is an Aitken mode with the geometric mean diameter Dg1 in the range 50–100 nm. There are two different settings for the Aitken mode: in the first case its number concentration is 10 times larger than that of the accumulation mode, i.e., N1 = 10N2; it consists of almost pure fresh BC particles with fs1 = 5 % (R ≈ 1.02); and it is narrow, σg1 = 1.4. In the second setting the number concentrations of the Aitken and accumulation mode are equal (N1 = N2); the Aitken mode is aged so that fs1 = 50 % (R ≈ 1.3); and it is wider, σg1 = 1.6. Mode 2 is an accumulation mode with the geometric mean diameter Dg2 in the range 100–500 nm, σg2 = 1.6, and it is very aged, with fs2 = 98 % (R ≈ 3.7). The accumulation mode could be the result of cloud processing as explained above.
The results show that αabs is more sensitive to variations of the accumulation mode than of the Aitken mode (Fig. 8a). For instance, if Dg2 < 250 nm, αabs > 1 at all Dg,1 values. Also, if Dg,1 = 60 nm and Dg2 varies in the whole range of 100–500 nm, αabs varies in the range of ∼ 0.4–1.3. When the Aitken mode dominates the number concentration (N1 = 10N2) with the fresh BC particles, the maximum αabs ≈ 1.2 at Dg1≈ 60 nm and Dg2≈ 140 nm is smaller than when the two modes have an equal amount of particles. In the latter case the maximum αabs > 1.3. When the Aitken mode with fs = 5 % dominates the number concentration, the whole size distribution moves to the region that is less sensitive to fs variations as discussed above in Sect. 3.3. It is worth noting also that the maximum αabs and BB(%) values (Fig. 8b and c) are smaller than derived from the unimodal size distributions (Sect. 3.3).
The purpose of this study is not to claim that all Aethalometer model results are wrong but that they have higher uncertainties than have been discussed in the literature. It is clear that there are BrC particles that have absorption Ångström exponents clearly larger than 1, as shown in a very large number of publications. However, the size of light-absorbing particles and their coating even by purely scattering material clearly affect the wavelength dependence of absorption and thus have the potential to affect the Aethalometer model results. Since the wavelength dependency is used for source apportionment, these effects have the potential to result in contributions of wood-burning or fossil fuel emissions that are tens of percent too high or low.
There are some important results. In the modeling, αabs equals 1 or 0.9 in very rare cases, and thus BB(%) was very seldom 0 % even though one type of BC was the only absorbing material in the simulations. The shape of size distribution plays an important role. Narrow size distributions result in higher αabs and BB(%) values than wide size distributions. The sensitivity of αabs and BB(%) to variations in shell volume fractions is the highest for accumulation-mode particles. This is important because that is where the largest aerosol mass is.
The goal of the paper was not to find out whether some pair of αff and αbb is better than the other. Two well-known αff and αbb pairs were used and shown how large the uncertainties may become just for these two pairs even if BC particles were coated by purely scattering material. The goal was not at all to find a good pair. On the contrary, the study shows that no constant values are good since in the real atmosphere BC particle size distributions are not constant, neither their mean diameter nor the coating of the particles. They all vary dynamically in the atmosphere. The study shows that any constant values will undoubtedly lead to large uncertainties of both the BB and FF fractions if no information on the size of the core or the thickness of the shell is available, even if purely scattering material is coating BC cores. As a conclusion, for the interpretation of absorption Ångström exponents it would be very important to measure BC size distributions and shell thicknesses together with the wavelength dependency of absorption.
There are obvious limitations in this study. A core–shell Mie model was used only so the work is limited to spherical particles. Fresh BC particles are usually agglomerates. There are studies that show that during aging processes these agglomerate may collapse and become closer to spherical particles, so Mie modeling probably agrees better for aged than fresh BC particles. Further, even if particles were spherical, how well can they be modeled with a Mie code when they are collected on filters? Or does light absorption then follow the spectral absorbance of the bulk materials?
This question could in principle be answered by generating spherical BC particles, coating them in an aging chamber with some non-absorbing material – for instance ammonium sulfate, and measuring both light absorption at multiple wavelengths with an Aethalometer and BC core size distributions and shell thicknesses with an SP2. If αabs increases up to some maximum value as a function of shell thickness and then starts decreasing like in the simulations above, then the process agrees with the growth of a size-independent coating. Or if αabs increases steadily then it suggests that the growth is size-dependent and possibly with a size-independent shell volume fraction growth rate. If these effects are observed then the uncertainties discussed in this work should be taken seriously.
On the other hand, if none of these effects were observed and the absorption Ångström exponents of the collected particles were ≈ 1 regardless of core size and shell thickness, it would be safe to say that the Aethalometer measures the absorption spectra of the bulk materials and that the Aethalometer model yields correct results. The truth is probably somewhere between these extremes: when the filter tape is still relatively clean the particles can be modeled even with a Mie code, and for heavily loaded filters αabs is that of bulk material. This could and should also be tested experimentally.
The code is described in Voshchinnikov and Mathis (1999) and it is available in http://www.astro.spbu.ru/staff/ilin2/SOFTWARE/nmie0.html.
The data can be generated as described in Sect. 2. No real data were used in this paper.
The supplement related to this article is available online at: https://doi.org/10.5194/amt-14-3707-2021-supplement.
The author declares that there is no conflict of interest.
This article is part of the special issue “Satellite and ground-based remote sensing of aerosol optical, physical, and chemical properties over China”. It is not associated with a conference.
This research has been supported by the Academy of Finland via the projects NABCEA (grant no. 296302) and ACFA (grant no. 335845) and by Business Finland via project BC Footprint (grant no. 528/31/2019).
This paper was edited by Linlu Mei and reviewed by two anonymous referees.
Andreae, M. O. and Gelencsér, A.: Black carbon or brown carbon? The nature of light-absorbing carbonaceous aerosols, Atmos. Chem. Phys., 6, 3131–3148, https://doi.org/10.5194/acp-6-3131-2006, 2006.
Arola, A., Schuster, G., Myhre, G., Kazadzis, S., Dey, S., and Tripathi, S. N.: Inferring absorbing organic carbon content from AERONET data, Atmos. Chem. Phys., 11, 215–225, https://doi.org/10.5194/acp-11-215-2011, 2011.
Bergstrom, R. W., Pilewskie, P., Russell, P. B., Redemann, J., Bond, T. C., Quinn, P. K., and Sierau, B.: Spectral absorption properties of atmospheric aerosols, Atmos. Chem. Phys., 7, 5937–5943, https://doi.org/10.5194/acp-7-5937-2007, 2007.
Bond, T. C. and Bergstrom, R. W.: Light Absorption by Carbonaceous Particles: An Investigative Review, Aerosol Sci. Technol., 40, 27–67, 2006.
Bond, T. C., Doherty, S. J., Fahey, D. W., Forster, P. M., Berntsen, T., DeAngelo, B. J., Flanner, M. G., Ghan, S., Kärcher, B., Koch, D., Kinne, S., Kondo, Y., Quinn, P. K., Sarofim, M. C., Schultz, M. G., Schulz, M., Venkataraman, C., Zhang, H., Zhang, S., Bellouin, N., Guttikunda, S. K., Hopke, P. K., Jacobson, M. Z., Kaiser, J. W., Klimont, Z., Lohmann, U., Schwarz, J. P., Shindell, D., Storelvmo, T., Warren, S. G., and Zender, C.S.: Bounding the role of black carbon in the climate system: A scientific assessment, J. Geophys. Res.-Atmos., 118, 5380–5552, https://doi.org/10.1002/jgrd.50171, 2013.
Cazorla, A., Bahadur, R., Suski, K. J., Cahill, J. F., Chand, D., Schmid, B., Ramanathan, V., and Prather, K. A.: Relating aerosol absorption due to soot, organic carbon, and dust to emission sources determined from in-situ chemical measurements, Atmos. Chem. Phys., 13, 9337–9350, https://doi.org/10.5194/acp-13-9337-2013, 2013.
Chung, C., Ramanathan, V., and Decremer, D.: Observationally constrained estimates of carbonaceous aerosol radiative forcing, P. Natl. Acad. Sci. USA, 109, 11624–11629, 2012.
Chylek, P., Lee, J. E., Romonosky, D. E., Gallo, F., Lou, S., Shrivastava, M., Carrico, C. M., Aiken, A. C., and Dubey, M. K.: Mie scattering captures observed optical properties of ambient biomass burning plumes assuming uniform black, brown, and organic carbon mixtures, J. Geophys. Res.-Atmos., 124, 11406–11427, https://doi.org/10.1029/2019JD031224, 2019.
Devi, J. J., Bergin, M., McKenzie, M., Schauer, J. J., and Weber, R.: Contribution of particulate brown carbon to light absorption in the rural and urban Southeast US, Atmos. Environ., 136, 95–104, 2016.
Feng, Y., Ramanathan, V., and Kotamarthi, V. R.: Brown carbon: a significant atmospheric absorber of solar radiation?, Atmos. Chem. Phys., 13, 8607–8621, https://doi.org/10.5194/acp-13-8607-2013, 2013.
Fuller, G. W., Tremper, A. H., Baker, T. D., Yttri, K. E., and Butterfield, D.: Contribution of wood burning to PM10 in London, Atmos. Environ., 87, 87–94, 2014.
Gyawali, M., Arnott, W. P., Lewis, K., and Moosmüller, H.: In situ aerosol optics in Reno, NV, USA during and after the summer 2008 California wildfires and the influence of absorbing and non-absorbing organic coatings on spectral light absorption, Atmos. Chem. Phys., 9, 8007–8015, https://doi.org/10.5194/acp-9-8007-2009, 2009.
Harrison, R. M., Beddows, D. C., Jones, A. M., Calvo, A., Alves, C., and Pio, C.: An evaluation of some issues regarding the use of aethalometers to measure woodsmoke concentrations, Atmos. Environ., 80, 540–548, 2013.
Healy, R., Sofowote, U., Su, Y., Debosz, J., Noble, M., Jeong, C.-H., Wang, J., Hilker, N., Evans, G., and Doerksen, G.: Ambient measurements and source apportionment of fossil fuel and biomass burning black carbon in Ontario, Atmos. Environ., 161, 34–47, 2017.
Helin, A., Niemi, J., Virkkula, A., Pirjola, L., Teinilä, K., Backman, J., Aurela, M., Saarikoski, S., Rönkkö, T., Asmi, E., and Timonen, H.: Characteristics and source apportionment of black carbon in the Helsinki metropolitan area, Finland, Atmos. Environ., 190, 87–98, https://doi.org/10.1016/j.atmosenv.2018.07.022, 2018.
Herich, H., Hueglin, C., and Buchmann, B.: A 2.5 year's source apportionment study of black carbon from wood burning and fossil fuel combustion at urban and rural sites in Switzerland, Atmos. Meas. Tech., 4, 1409–1420, https://doi.org/10.5194/amt-4-1409-2011, 2011.
Kirchstetter, T. W. and Thatcher, T. L.: Contribution of organic carbon to wood smoke particulate matter absorption of solar radiation, Atmos. Chem. Phys., 12, 6067–6072, https://doi.org/10.5194/acp-12-6067-2012, 2012.
Kirchstetter, T. W., Novakov, T., and Hobbs, P. V.: Evidence that the spectral dependence of light absorption by aerosols is affected by organic carbon, J. Geophys. Res., 109, D21208, https://doi.org/10.1029/2004JD004999, 2004.
Kondo, Y., Sahu, L., Moteki, N., Khan, F., Takegawa, N., Liu, X., Koike, M., and Miyakawa, T.: Consistency and traceability of black carbon measurements made by laser-induced incandescence, thermal-optical transmittance, and filter-based photo-absorption techniques, Aerosol Sci. Technol., 45, 295–312, https://doi.org/10.1080/02786826.2010.533215, 2011.
Lack, D. A. and Cappa, C. D.: Impact of brown and clear carbon on light absorption enhancement, single scatter albedo and absorption wavelength dependence of black carbon, Atmos. Chem. Phys., 10, 4207–4220, https://doi.org/10.5194/acp-10-4207-2010, 2010.
Lack, D. A. and Langridge, J. M.: On the attribution of black and brown carbon light absorption using the Ångström exponent, Atmos. Chem. Phys., 13, 10535–10543, https://doi.org/10.5194/acp-13-10535-2013, 2013.
Lack, D. A., Langridge, J. M., Bahreini, R., Cappa, C. D., Middlebrook, A. M., and Schwarz, J. P.: Brown carbon and internal mixing in biomass burning particles, P. Natl. Acad. Sci. USA, 109, 14802–14807, 2012.
Laskin, A., Laskin, J., and Nizkorodov, S. A.: Chemistry of Atmospheric Brown Carbon, Chem. Rev., 115, 4335–4382, https://doi.org/10.1021/cr5006167, 2015.
Liu, C., Chung, C. E., Yin, Y., and Schnaiter, M.: The absorption Ångström exponent of black carbon: from numerical aspects, Atmos. Chem. Phys., 18, 6259–6273, https://doi.org/10.5194/acp-18-6259-2018, 2018.
Moosmüller, H., Chakrabarty, R. K., Ehlers, K. M., and Arnott, W. P.: Absorption Ångström coefficient, brown carbon, and aerosols: basic concepts, bulk matter, and spherical particles, Atmos. Chem. Phys., 11, 1217–1225, https://doi.org/10.5194/acp-11-1217-2011, 2011.
Moteki, N., Kondo, Y., Miyazaki, Y., Takegawa, N., Komazaki, Y., Kurata, G., Shirai, T., Blake, D. R., Miyakawa, T., and Koike, M.: Evolution of mixing state of black carbon particles: Aircraft measurements over the western Pacific in March 2004, Geophys. Res. Lett., 34, L11803, https://doi.org/10.1029/2006GL028943, 2007.
Russell, P. B., Bergstrom, R. W., Shinozuka, Y., Clarke, A. D., DeCarlo, P. F., Jimenez, J. L., Livingston, J. M., Redemann, J., Dubovik, O., and Strawa, A.: Absorption Angstrom Exponent in AERONET and related data as an indicator of aerosol composition, Atmos. Chem. Phys., 10, 1155–1169, https://doi.org/10.5194/acp-10-1155-2010, 2010.
Saleh, R., Hennigan, C. J., McMeeking, G. R., Chuang, W. K., Robinson, E. S., Coe, H., Donahue, N. M., and Robinson, A. L.: Absorptivity of brown carbon in fresh and photo-chemically aged biomass-burning emissions, Atmos. Chem. Phys., 13, 7683–7693, https://doi.org/10.5194/acp-13-7683-2013, 2013.
Sandradewi, J., Prevot, A. S. H., Szidat, S., Perron, N., Alfarra, M. R., Lanz, V. A., Weingartner, E., and Baltensperger, U.: Using aerosol light absorption measurements for the quantitative determination of wood burning and traffic emission contributions to particulate matter, Environ. Sci. Technol., 42, 3316–3323, 2008a.
Sandradewi, J., Prevot, A. S. H., Weingartner, E., Schmidhauser, R., Gysel, M., and Baltensperger, U.: A study of wood burning and traffic aerosols in an Alpine valley using a multi-wavelength Aethalometer, Atmos. Environ., 42, 101–112, 2008b.
Schuster, G. L., Dubovik, O., Arola, A., Eck, T. F., and Holben, B. N.: Remote sensing of soot carbon – Part 2: Understanding the absorption Ångström exponent, Atmos. Chem. Phys., 16, 1587–1602, https://doi.org/10.5194/acp-16-1587-2016, 2016.
Schwarz, J. P., Gao, R. S., Spackman, J. R., Watts, L. A., Thomson, D. S., Fahey, D. W., Ryerson, T. B., Peischl, J., Holloway, J. S., Trainer, M., Frost, G. J., Baynard, T., Lack, D. A., de Gouw, J. A., Warneke, C., and Del Negro, L. A.: Measurement of the mixing state, mass, and optical size of individual black carbon particles in urban and biomass burning emissions, Geophys. Res. Lett., 35, L13810, https://doi.org/10.1029/2008GL033968, 2008.
Shen, Y., Virkkula, A., Ding, A., Wang, J., Chi, X., Nie, W., Qi, X., Huang, X., Liu, Q., Zheng, L., Xu, Z., Petäjä, T., Aalto, P. P., Fu, C., and Kulmala, M.: Aerosol optical properties at SORPES in Nanjing, east China, Atmos. Chem. Phys., 18, 5265–5292, https://doi.org/10.5194/acp-18-5265-2018, 2018.
Shiraiwa, M., Kondo, Y., Moteki, N., Takegawa, N., Sahu, L. K., Takami, A., Hatakeyama, S., Yonemura, S., and Blake, D. R.: Radiative impact of mixing state of black carbon aerosol in Asian outflow, J. Geophys. Res., 113, D24210, https://doi.org/10.1029/2008JD010546, 2008.
Valenzuela, A., Olmo, F. J., Lyamani, H., Antón, M., Titos, G., Cazorla, A., and Alados-Arboledas, L.: Aerosol scattering and absorption Angström exponents as indicators of dust and dust-free days over Granada (Spain), Atmos. Res., 154, 1–13, 2015.
Voshchinnikov, N. V. and Mathis, J. S.: Calculating Cross Sections of Composite Interstellar Grains, Astrophys. J., 526, 257–264, https://doi.org/10.1086/307997, 1999 (code available at: http://www.astro.spbu.ru/staff/ilin2/SOFTWARE/nmie0.html, last access: 21 May 2021).
Wang, X., Heald, C. L., Sedlacek, A. J., de Sá, S. S., Martin, S. T., Alexander, M. L., Watson, T. B., Aiken, A. C., Springston, S. R., and Artaxo, P.: Deriving brown carbon from multiwavelength absorption measurements: method and application to AERONET and Aethalometer observations, Atmos. Chem. Phys., 16, 12733–12752, https://doi.org/10.5194/acp-16-12733-2016, 2016.
Wu, Z. P. and Wang, Y. P.: Electromagnetic scattering for multilayered spheres: recursive algorithms, Radio Science, 26, 1393–1401, 1991.
Zhang, X., Mao, M., Yin, Y., and Tang, S.: The absorption Ångstrom exponent of black carbon with brown coatings: effects of aerosol microphysics and parameterization, Atmos. Chem. Phys., 20, 9701–9711, https://doi.org/10.5194/acp-20-9701-2020, 2020.
Zotter, P., Herich, H., Gysel, M., El-Haddad, I., Zhang, Y., Močnik, G., Hüglin, C., Baltensperger, U., Szidat, S., and Prévôt, A. S. H.: Evaluation of the absorption Ångström exponents for traffic and wood burning in the Aethalometer-based source apportionment using radiocarbon measurements of ambient aerosol, Atmos. Chem. Phys., 17, 4229–4249, https://doi.org/10.5194/acp-17-4229-2017, 2017.


