the Creative Commons Attribution 4.0 License.
the Creative Commons Attribution 4.0 License.
 | 21 May 2021
Investigation of structural changes of atmospheric aerosol samples during two thermal–optical measurement procedures (EUSAAR2, NIOSH870)
Theresa Haller
Eva Sommer
Thomas Steinkogler
Christian Rentenberger
Anna Wonaschuetz
Anne Kasper-Giebl
Hinrich Grothe
Regina Hitzenberger
Thermal–optical measurement techniques are widely used for the monitoring of carbonaceous aerosols. Although results of different thermal–optical measurement techniques are comparable for total carbon, they can vary widely for values of elemental carbon especially in the presence of brown carbon. Charring of organic material during the inert heating phase of thermal–optical measurements has been found to be a major confounder, but no literature about investigations of structural changes during this process in atmospheric aerosols is available. In a recent study we investigated these structural changes for combustion aerosol standard (CAST) soot. Now we apply this approach to selected atmospheric aerosol filter samples and a subset of eight washed filter samples with low loadings of water-soluble organic carbon (WSOC). To investigate structural changes, Raman spectra were obtained for samples heated to the corresponding temperature levels and gas atmospheres of the EUSAAR2 and NIOSH870 protocols. The temperature levels where changes in the Raman spectra occurred (i.e., changes in structure) varied for different samples. For the washed samples with low WSOC loadings and absence of other water-soluble aerosol components such as inorganic salts, changes in structural ordering and darkening of the samples were not observed. We were able to show for the first time that the darkening of a sample (measured in terms of transmission laser signal) is not necessarily caused by an increase of structural ordering in the sample. Possible transformations at lower temperatures could include a formation of non-graphitic light-absorbing intermediate organic carbon, a release of C−H groups or a decrease of carbonyl groups.
- Article
(3917 KB) - Full-text XML
-
Supplement
(656 KB) - BibTeX
- EndNote


Carbonaceous matter is an important component of atmospheric aerosols because of its adverse impacts on climate and human health (e.g., Bond and Bergstrom, 2006; Highwood and Kinnersley, 2006). It spans a rather continuous range from highly light-absorbing graphitic-like material to non-absorbing organic molecules (e.g., Pöschl, 2005) and is usually classified optically into light-absorbing carbon (LAC) covering brown carbon (BrC) and black carbon (BC) or thermochemically into organic carbon (OC), elemental carbon (EC), and inorganic or carbonate carbon (CC) (Petzold et al., 2013). However, these definitions are tied to measurement methods rather than to the actual internal structure of the material, which makes reliable measurements challenging. Using thermal measurement techniques, OC is defined as the thermally unstable carbonaceous material which evolves in the absence of oxygen at temperatures below 550–700 ∘C (Bond and Bergstrom, 2006; Chow et al., 2004). EC is defined as the fraction which does not evolve below 550–700 ∘C in the absence of oxygen and combusts in the presence of oxygen at temperatures above 600 ∘C (Andreae and Gelencsér, 2006).
Results for EC and OC measured with different thermal–optical techniques suffer from biases by up to 44 % for EC, while the values of total carbon (TC = EC + OC) are comparable within 5 %–15 % (e.g., Reisinger et al., 2008; Cavalli et al., 2010; Yu et al., 2002; Cheng et al., 2012; Hitzenberger et al., 2006; Panteliadis et al., 2015; Müller et al., 2004; Venkatachari et al., 2006; Watson et al., 2005; ten Brink et al., 2004). The largest discrepancies were found for samples obtained under wintry conditions and in the presence of biomass smoke (Reisinger et al., 2008; Wonaschuetz et al., 2009; Cheng et al., 2012), when large amounts of BrC can be found (Lukács et al., 2007). The optical absorptivity of BrC is markedly higher in the shortwave range of the visible spectrum than in the longwave range. BrC is more thermally refractory than other organic matter and can therefore be seen as a substance with properties intermediate between those of elemental and organic carbon (e.g., Pöschl, 2005).
In thermal–optical measurement techniques a filter sample is heated stepwise first in an inert atmosphere and then in an oxidizing atmosphere, and the amount of carbon leaving the filter is measured. Different temperature protocols vary in height and duration of the temperature steps and particularly in the maximum temperature of the inert phase (550–900 ∘C; Cavalli et al., 2010). A potential darkening of the sample during the inert phase, commonly explained by pyrolysis and/or charring of the sample producing “pyrolyzed carbon” (PC), is monitored with a transmission and/or reflection laser signal.
The transmission and/or reflection laser signal is used to correct for PC. The amount of carbon detected before this signal reaches its initial value (i.e., the split point) is assigned to OC and carbon detected after this point is assigned to EC. However, this optical correction is based on two essential assumptions which are not generally fulfilled: firstly, PC does not evolve totally before EC, and secondly the specific light absorption coefficients of PC and EC are not equal (Yu et al., 2002; Chow et al., 2004; Subramanian et al., 2006; Han et al., 2007). Moreover, the specific light absorption coefficient of PC can change during the heating procedure (Yu et al., 2002). Because of these uncertainties, the optical correction can lead to an over- or underestimation of EC or OC (Yu et al., 2002; Cheng et al., 2012).
Extensive efforts were undertaken to refine the original thermal–optical measurement procedure (Birch and Cary, 1996) in order to achieve a more accurate setting of the split point and to reduce the formation of PC (e.g., Cavalli et al., 2010; Chow et al., 2004; Cheng et al., 2012). EUSAAR2 was found to produce less PC than other protocols during analyses of ambient European aerosols (Cavalli et al., 2010) and was subsequently selected as the European standard method (Brown et al., 2017).
Despite all efforts, pyrolysis is still a problematic factor in thermal–optical analyses depending on sample composition. Water-soluble organic carbon (WSOC) was found to be responsible for a large fraction of charring (13 %–66 %; Yu et al., 2002). Several inorganic constituents can influence charring in complex and sometimes contradictory ways: ammonium bisulfate enhances the charring of starch and cellulose but reduces the charring of levoglucosan (Yu et al., 2002). Metal salts can generally enhance the charring of OC at least in diesel soot and ambient aerosols (Wang et al., 2010). As a consequence of this interplay of several complex chemical reactions, there is no unequivocal effect of non-carbonaceous aerosol constituents on the charring behavior (Wang et al., 2010; Yu et al., 2002; Bladt et al., 2014), and a simple prediction of the charring behavior of an atmospheric aerosol sample is currently impossible.
Most of the studies of pyrolysis during thermal–optical measurement procedures only analyze the laser signals (e.g., Cavalli et al., 2010; Cheng et al., 2012; Yu et al., 2002) or the thermal properties of PC (Yu et al., 2002). The terms “charring” and “pyrolysis” are often used interchangeably to describe processes leading to sample darkening which is implicitly assumed to be caused by a formation of a more structured phase of carbon. Underlying structural changes are not explained. Le et al. (2019) investigated structural changes of laboratory-generated aerosols (produced in a CAST (combustion aerosol standard) soot generator) during heat treatment in N2 and give detailed information about evolution and restructuring of carbonaceous species. However, the gas atmospheres as well as the heating rates differ from the conditions during thermal–optical analyses.
To our knowledge, no study to date has addressed the structural changes of an atmospheric aerosol sample during a thermal–optical measurement procedure by analyzing graphitization or structural ordering. In a previous study (Haller et al., 2019), we investigated the increase of structural ordering of two widely different combustion aerosol standard soot types (produced by propane combustion in a CAST burner) during a thermal–optical heating procedure (NIOSH870). Using Raman spectroscopy, we found that structural ordering increased at 870 ∘C when a BrC-rich (and BC-poor) sample was heated in a He atmosphere, while a BC-rich (and BrC-poor) sample did not further change its already high degree of graphitization. This approach is now applied to the much more complex situation of atmospheric aerosols. For 21 atmospheric aerosol samples selected from a 2-year set of daily filter samples, the changes of structural ordering during the inert phases of the NIOSH870 (Birch and Cary, 1996) and EUSAAR2 (Cavalli et al., 2010) protocols were investigated. From a subset of filters, WSOC and other soluble aerosol material was removed by washing. The protocols were chosen because of the different production of PC reported by Cavalli et al. (2010). A dual-optics thermal–optical analyzer (Sunset Instruments Inc.) was used to produce heated samples and to determine EC and OC. Samples heated to each temperature plateau of the inert phases of both temperature protocols were analyzed with Raman spectroscopy to investigate the degree of intermolecular ordering in the material. Several properties of the samples (e.g., ionic composition, EC OC, BC BrC) were compared with the progress of structural changes derived from the Raman spectra.
2.1 Sampling
Atmospheric aerosol was sampled on quartz fiber filters (Pall Tissuquartz 2500 QAT-UP, 47 mm) at the rooftop lab of the physics building of the University of Vienna (35 m above ground) located about 1.5 km from the city center. Although the building is located in an area highly impacted by traffic, the aerosol at the rooftop lab can be seen as an urban background site, since the sampling inlet faces the enclosed source-free courtyard of the building. The aerosol was sampled with an automatic sequential filter sampler (SEQ47/50, Sven Leckel) equipped with a PM2.5 inlet and set to a flow rate of 2.3 m3 h−1. Sampling time was set to 23 h from 12:00 to 11:00 (UTC+1) of the next day. The loaded filters were stored in the filter sampler for about 1 to 2 weeks in a closed magazine before they were transferred to the lab and stored at −22 ∘C in petri dishes closed with Parafilm®. Before sampling, the filters had been heated at 450 ∘C for an hour to remove volatile organic substances and stored for at least 24 h in a water-vapor-saturated atmosphere to prevent re-adsorption of OCs (Jankowski et al., 2008) and to ensure low-OC blanks (blank values typically around 0.2 µg C cm−2). The samples were collected in 2014 and 2015 for nearly every day. BC and BrC values were obtained from these filters using the integrating sphere method (Sommer, 2020).
2.2 Integrating sphere method
Light-absorbing carbon (LAC) (i.e., BrC and BC) was analyzed for all filter samples with an extension (Wonaschuetz et al., 2009) of the original integrating sphere technique (an extensive description is given by Hitzenberger and Tohno, 2001). Circular filter punches with diameters of 10 mm were immersed in a mixture of 10 % isopropanol, 40 % H2O and 50 % acetone in polyethylene (PE) vials. The immersion in this mixture reduces enhanced absorption caused by possible non-absorbing coatings of the particles: soluble material is removed, and the effect of insoluble coatings is reduced due to the similar refractive indices of the liquid and the coatings (Hitzenberger and Tohno, 2001). The PE vials were placed in the center of a 6 in. integrating sphere coated internally with a highly diffusely reflective material (Spectraflect™). The sample was illuminated with a halogen light source equipped with a diffusor and three interference filters (450, 550 and 650 nm), and the wavelength-dependent light signal was recorded with a photodiode.
The BC and BrC content in the sample was then calculated in an iterative procedure described by Wonaschuetz et al. (2009), comparing the wavelength-dependent light signals with calibration curves obtained with a proxy for BC (Elftex 124, Cabot Corp.) and a proxy for BrC (humic acid sodium salt, Acros Organics, no. 68131044). The values for BrC should therefore be understood as “humic acid sodium salt equivalent” and refer to the total mass of BrC including other atoms (humic acid sodium salt contains 47 % carbon by mass). Detection limits are 1 µg per sample for BC and 10 µg per sample for BrC.
2.3 Sample selection and preparation
From the total set of 660 filter samples, 21 samples were chosen for further analysis. As the focus of this study is on the restructuring of carbonaceous material with special emphasis on the presence of BrC, winter samples with high-BrC loadings and high BrC LAC ratios and summer samples with BrC loadings below detection limit were selected. The seven samples from summer 2015 had LAC loadings between about 3 and 5 µg cm−2 with BrC LAC = 0. The 14 samples from winter 2014/2015 had LAC loadings between about 8 and 27 µg cm−2 and BrC LAC ratios from about 0.3 to 0.7, which were the highest BrC LAC ratios in this period. TC values varied from 7 to 34 µg cm−2 for summer samples and from 13 to 71 µg cm−2 for winter samples.
To investigate the effect of WSOC, 8 randomly selected filters (out of the 21 samples) were cut in half and one piece of each filter was immersed in 80 mL of Milli-Q water (18 MΩ cm, Millipore) in 100 mL bottles and shaken mechanically in a shaking water bath (GFL Technology, type GFL 1086) for about 20 min at room temperature with 100 rpm to remove most of the WSOC as well as other soluble aerosol material (e.g., Gao et al., 2003; Kirchstetter and Novakov, 2004). The washed filters were removed from the bottles, transferred into petri dishes and dried in a desiccator for 3–4 d. The dry filters were then stored at −22 ∘C in closed petri dishes. In the following discussions, aliquots of the untreated (i.e., unheated and unwashed) filters are referred to as “original” samples.
2.4 Thermal–optical measurements and preparation of heated samples
The EC and OC content of the samples was measured with a dual-optics thermal–optical instrument (Sunset Instruments Inc.). In this instrument the sample is heated stepwise first in He and then in an oxidizing atmosphere (2 % O2 in He). The duration times of the steps and the temperatures and atmospheres for two different heating protocols (EUSAAR2 and NIOSH870) are listed in Table 1. The evolving carbon during each temperature step is tracked by a flame ionization detector (FID). The FID signal is proportional to the evolving carbon content and is calibrated by introducing a known amount of methane at the end of each filter measurement. The darkening of the sample during the heating procedure in the inert phase is monitored with a laser signal (in transmission and reflection with wavelength of 635 nm), which is used afterwards to correct the results for pyrolysis: a split point is defined when the laser signal reaches its initial value, and the carbon evolving prior to the split point is assigned to OC and the carbon evolving afterwards to EC. The precision of the instrument is 6 % for OC as well as for EC, and the lower detection limit is 0.1 µg C cm−2 for OC and EC.
Table 1Duration times, temperatures and gas atmospheres for the two different thermal–optical measurement protocols (NIOSH870, EUSAAR2). The “Raman” column indicates that heated samples were analyzed with Raman spectroscopy for the respective temperature (see below). The codes are used when we refer to samples heated to a certain temperature – symbolized by the numeric index – following NIOSH870 (NI) or EUSAAR2 (EU).
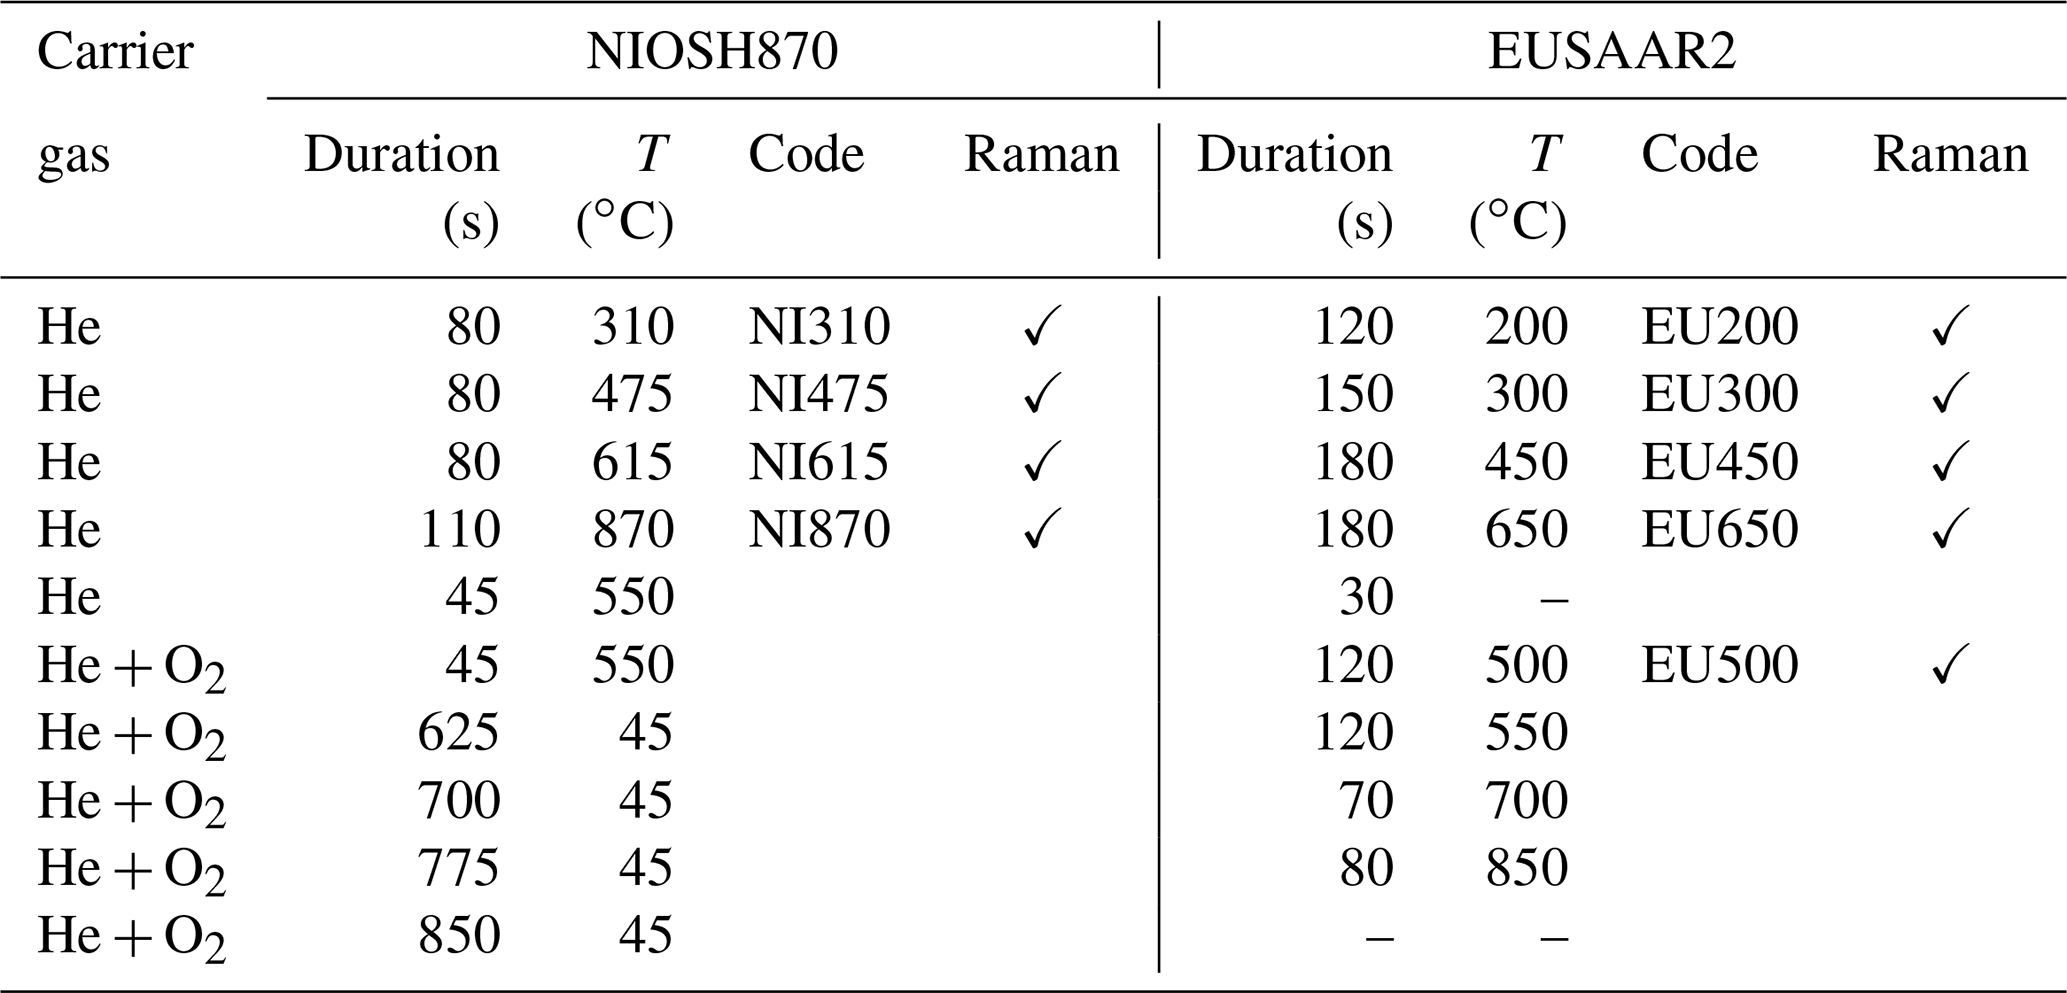
Twelve out of the 21 atmospheric aerosol samples were analyzed with both EUSAAR2 and NIOSH870 protocols (Table 1); the other 8 samples were only with EUSAAR2, as parts of these filters were washed to remove water-soluble material including WSOC (see below) and were therefore not available for extra analysis with another protocol. For both protocols, heated samples were prepared corresponding to the temperature levels of the inert phase and the first oxidizing temperature level of EUSAAR2: aliquots of the filters were heated in the instrument following the NIOSH870 and EUSAAR2 temperature steps and atmospheres, respectively, before the procedure was interrupted at the desired temperature level. All samples were cooled down in He to below 75 ∘C, removed from the oven and stored in a closed petri dish at laboratory temperature.
2.5 Raman spectroscopy
For the investigation of the soot structure, a confocal Raman microscope (Horiba Jobin-Yvon LabRAM 800HR) was used. The Raman microscope was equipped with a 632.8 nm HeNe laser (maximum output < 20 mW), a 532 nm frequency-doubled Nd:YAG DPSS (diode-pumped solid-state) laser (Oxxius LMX-532, maximum output < 52 mW) and a CCD camera (Peltier cooled to −60 ∘C). The laser beam was focused onto the sample with a 20× magnification objective lens (CF Plan, 20×/0.35, WD 20.5 mm, Nikon) and a 100× long working distance (LWD) objective lens (MPlanN, 100×/0.75, WD 0.21 mm, Olympus). The spectra were calibrated with the silicon peak at 520.07 cm−1. Generally Raman signals were obtained for 10 spots for each (unheated and heated) filter sample within an area of (1 × 2) mm2. We found that this area was large enough to characterize a whole sample. Only for some samples with too low loadings were five spots focused manually. The acquisition times were chosen between 0.005 and 3 s and 30–3000 single spectra were accumulated for each position (slit of 400 µm, confocal hole of 500 µm). A laser power between 25 % and 100 % was used. Generally laser power was lowered for highly absorbing samples to prevent thermal destruction of the material and for samples containing fluorescent material to reduce the interfering fluorescence background. The particular settings (acquisition time, number of accumulations, laser power) were chosen individually to obtain the best signal-to-noise ratio for each sample, since the fluorescence background intensity was different for the samples and for different excitation wavelengths.
Due to instrument availability, all samples were measured using the HeNe (red) laser, except the heated and unheated samples of the washed filters (see below) and their unwashed counterparts, which were measured using the Nd:YAG (green) laser. For samples heated to 500 ∘C in O2 + He (EUSAAR2) and 870 ∘C in He (NIOSH870), which were measured using the red laser, a 100× LWD objective lens and a smaller confocal hole (3 µm) were used to focus on single particles since the red laser in combination with the 20× objective lens was not sufficient to obtain spectra for the small amounts of material left on the filters at these heating stages. The laser power was decreased to 1 % and accumulations of 400 single spectra and an acquisition time of 0.5 s were required. Because of these restrictions, Raman spectra were obtained for only five different spots for these samples. Mean spectra and their standard deviations were calculated for the spectra of all samples using the 5 to 10 spectra obtained from different measurement positions.
Typical Raman spectra of soot and related carbonaceous material show two overlapping peaks at about 1350 cm−1 (D-peak or defect peak) and 1580 cm−1 (G-peak or graphitic peak) (e.g., Fig. 1). Several authors (e.g., Sadezky et al., 2005; Le et al., 2019; Zickler et al., 2006, and references there) suggest that these peaks arise from five or more bands attributed to different vibrational modes in the soot structure. Detailed descriptions are given by, for example, Rosen and Novakov (1978), Sadezky et al. (2005), Ferrari and Robertson (2000), Schmid et al. (2011), Knauer et al. (2009) and Ivleva et al. (2007). The ratio of the D and G peak intensities () is an indication of the degree of structural ordering in the carbonaceous material (Tuinstra and Koenig, 1970; Ferrari and Robertson, 2000). For small crystallite sizes La < 2 nm, as can be found in combustion soot particles (see e.g., Haller et al., 2019), is proportional to the probability to find sixfold aromatic rings in the cluster, which means that an increasing ratio indicates increasing crystallite sizes (Ferrari and Robertson, 2000; Zickler et al., 2006) and therefore an increase of structural ordering. Ferrari and Robertson (2000) propose proportionality between and with a wavelength-dependent factor. Because of this wavelength dependence, we discuss here only samples where all spectra (original, washed, heated, unheated) were obtained with the same excitation wavelength. A more detailed description of the interpretation of Raman spectra of soot can be found in the studies by Ferrari and Robertson (2000) or Haller et al. (2019). Several other authors use this interpretation of the ratio for Raman spectra of combustion aerosol samples (e.g., Commodo et al., 2016; Ess et al., 2016) and use a higher ratio as an indication of a higher degree of structural ordering within the material.
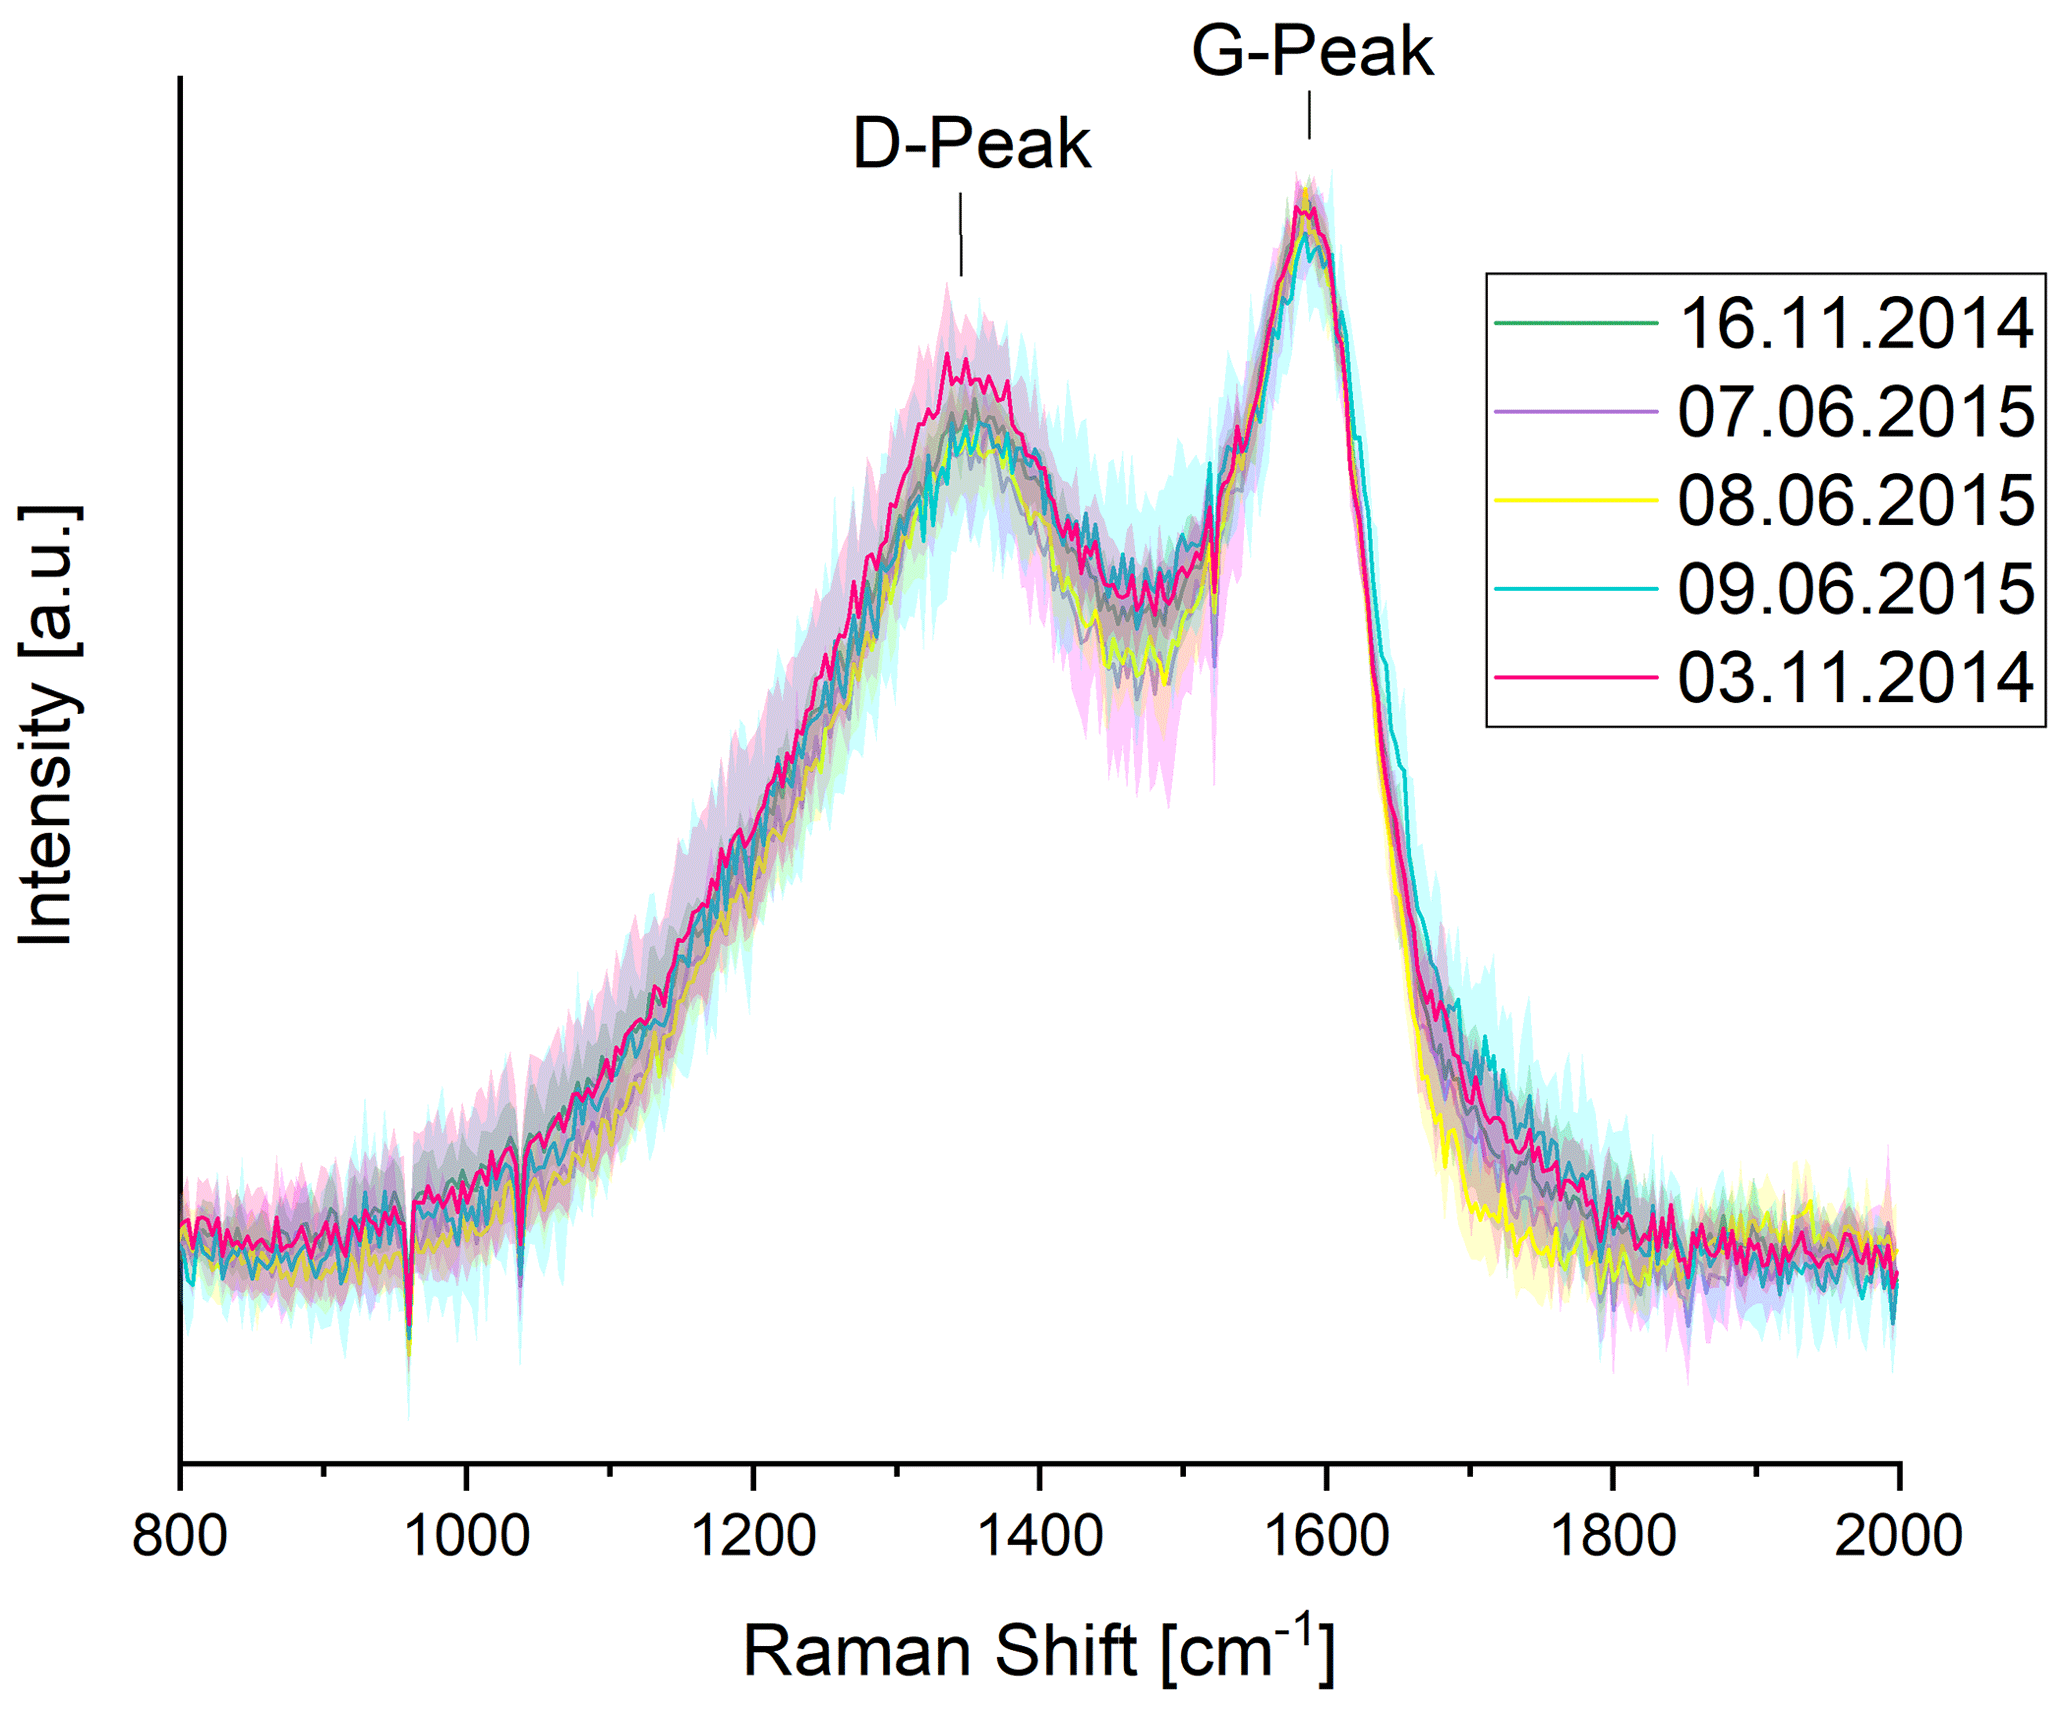
Figure 1Raman spectra for a representative subset of original (unheated, unwashed) samples. Error bars (standard deviation of the mean spectra) are displayed as shaded areas. The spectra are similar among themselves within their error bars especially in the peak heights. For a better illustration, only five spectra were selected. All other spectra of original samples are comparable within their error bars.
2.6 Electron microscopy
As crystallite sizes are important for the interpretation of the ratio in the Raman spectra, the crystallite sizes of three samples (16 November 2014, 9 June 2015, 10 November 2015) were exemplarily determined from electron diffraction patterns obtained with an electron microscope. A 200 kV transmission electron microscope (TEM, Philips CM200) equipped with a Gatan™ Orius CCD camera was used to obtain electron diffraction patterns. Intensity profiles of the diffraction patterns were obtained by both azimuthal integration along rings and background correction using PASAD-tools (Gammer et al., 2010). By fitting pseudo-Voigt functions to the intensity profiles taken from at least six different locations on each sample, the average full width at half maximum of the first intense diffraction peak was determined and used to calculate the mean crystallite size with the Scherrer equation (Fultz and Howe, 2001).
2.7 Ion chromatography
Aliquots of the filters (areas between 78 and 101 mm2 depending on filter loadings) were extracted in 2 mL of ultrapure water (Milli-Q, 18 MΩ cm, Millipore). After ultrasonic agitation for 20 min and centrifugation for 5 min at 13 400 rpm, the extracts were analyzed by suppressed ion chromatography. For the determination of the anions (Cl−, NO, NO and SO) a Dionex Aquion system (Thermo Fisher) equipped with CS16 and CG16 columns, a CERS 500 self-regenerating suppressor, and a DS6 heated conductivity detector was used. The cations (Na+, NH, Mg2+, Ca2+ and K+) were determined with a Dionex ICS-1100 system (Thermo Fisher) equipped with AS22 and AG22 columns, an AERS 500 self-regenerating suppressor, and a DS6 heated conductivity detector. The calibration was performed with external standards, prepared from Merck stock solutions with 1000 ppm. The limit of detection for Cl− is 0.005 mg L−1; for all other analytes it was 0.01 mg L−1.
3.1 Properties of the original (unwashed and unheated) samples
The Raman spectra of all samples (e.g., Figs. 1, 2, 3) show two distinct peaks around 1350 cm−1 (D-peak or defect peak) and 1580 cm−1 (G-peak or graphitic peak) which is typical for soot. The Raman spectra of the original samples are surprisingly similar (Fig. 1), although the samples differ in composition. This could be explained by an appreciably higher contribution of graphite-like material to the Raman signal in comparison to the contribution of possibly coexisting organic or brown carbon.
Sommer (2020) found for the whole set of our samples that the fraction of BC in PM2.5 (measured with the integrating sphere method) was relatively constant over the whole year. Traffic is one of the major sources of BC in Vienna in summer as well as in winter. In winter, space heating contributes only a small amount to BC, because district heating and natural gas are used in most households in Vienna (about 45 % each in 2017/18; Statistik Austria, 2021) followed by electricity (about 6 % in 2017/18; Statistik Austria, 2021). All of these are relatively clean systems regarding particle production. On the other hand, wood combustion is used by less than 1 % of the households in Vienna, and oil or coal combustion are negligible (Statistik Austria, 2021). BrC emission factors of wood combustion can be nearly 10 times the emission factors for BC (e.g., Sun et al., 2021). Our winter samples have less than 70 % BrC in LAC; therefore, also for the samples with the highest amount of BrC, nearly 80 % of wintertime BC derives from traffic. In 2015 about 57 % of all passenger cars and nearly 100 % of heavy-duty vehicles in Vienna had diesel engines. Diesel fuel accounted for about 80 % to total fuel sales in 2015 in Austria (WKO, Mineralölindustrie, 2020). Traffic is therefore a relatively constant and homogeneous source of carbonaceous aerosol, especially diesel soot. This could explain the similarity of the Raman spectra of all original samples.
Crystallite sizes of the three samples analyzed by TEM are well below 2 nm (mean crystallite size of all three samples: 1.13 ± 0.1 nm). These sizes match with the crystallite sizes of two CAST soot samples in our recent publication (recalculated: 1.2 ± 0.1 nm for a BC-rich sample and 0.8 ± 0.1 nm for a BrC-rich sample; Haller et al., 2019). We therefore assume that the crystallite sizes of the other atmospheric aerosol samples in this study also should be below 2 nm.
3.2 Structural changes of the washed samples
Washed and unwashed filter samples were analyzed with EUSAAR2, and Raman spectra were obtained for the non-heated and heated washed and unwashed samples. Figure 2 shows two typical thermograms: one of an unwashed and one of a washed part of the same filter. While the transmission laser signal of the unwashed sample decreases during the inert phase, the signal of the washed sample is nearly constant until it starts to increase during the 650 ∘C step in He. The initial laser signal for the washed sample is higher than the one for the original sample indicating that part of the light-absorbing material was removed during the washing procedure. Since the samples were shaken in this process, also substances which are not soluble in water (e.g., BC) could have been removed mechanically. This was confirmed by integrating sphere measurements: part of BC (about 60 %) is absent and BrC is below detection limit also for samples with a high amount of BrC in the unwashed counterpart.
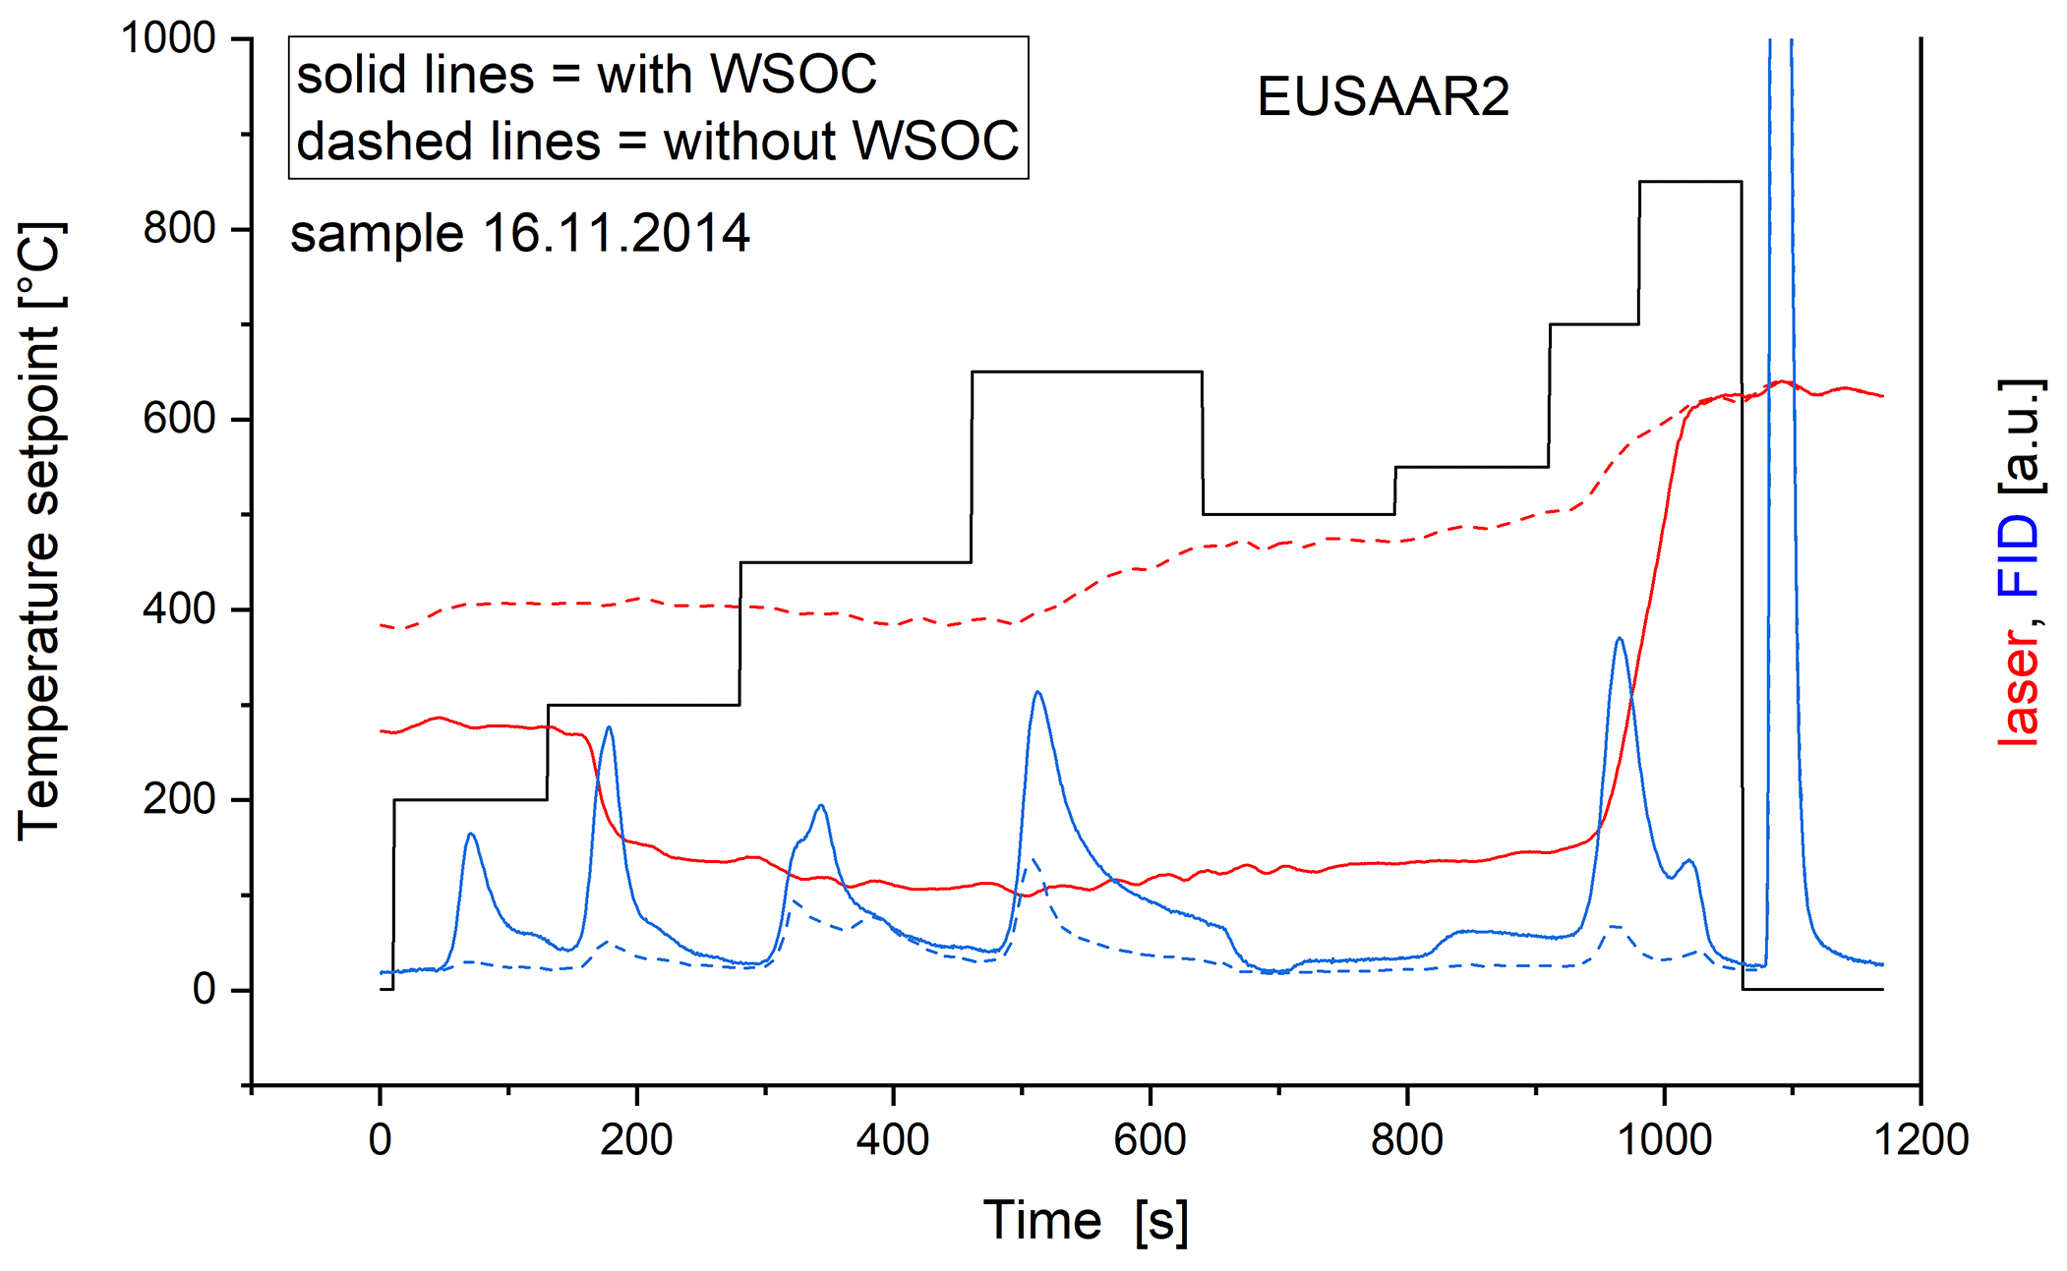
Figure 2Typical thermogram of a sample with (solid lines) and without (dashed lines) WSOC. The transmission laser signal decreases during the first three temperature levels for the unwashed sample (red solid line) but stays nearly constant for the washed sample (red dashed line). The FID signals are lower for all temperature levels for the washed sample (blue dashed line) than for the unwashed sample (blue solid line). The black solid line represents the ideal progress of the sample temperature.
The differences in the laser signals between original and washed samples hold for all of the eight investigated samples (Fig. S1 in the Supplement). These findings are in good agreement with Yu et al. (2002), who found that WSOC accounted for a large contribution (13 %–66 %) to the charring during NIOSH-like heating procedures.

Figure 3Progress of the Raman spectra during the heating procedure (EUSAAR2) of the washed (a) and unwashed (b) part of a representative atmospheric aerosol sample (7 June 2015). Error bars are shown as shaded areas. The Raman spectra of the unwashed sample change at 650 ∘C in He (late and fast change; see categorization below), while the spectra of the washed sample do not change noticeably during heating following EUSAAR2.
The ratios of the Raman spectra of most unwashed samples increase during the heating procedure above 450 ∘C (Fig. 3a and Sect. 3.3.2), indicating an increase of structural ordering according to Ferrari and Robertson (2000). On the other hand, the Raman spectra of the washed samples do not change noticeably during the heating process even when their unwashed counterparts have changing Raman signals (Fig. 3), indicating that no increase of structural ordering occurs during heating of the washed samples. This is in good agreement with the findings of Yu et al. (2002), who based their interpretation of charring of WSOC on thermal and optical properties of their heated samples. We can confirm this now by showing that the washed samples indeed do not change their structure (i.e., do not build graphite-like material) during heating. In contrast to cases where the laser signal decreases despite constant ratios (as described in Sect. 3.3.1), it seems to be possible to conclude from an unchanged laser signal to a lack of structural ordering of the material.
The laser signals start to increase during the last temperature step in He (650 ∘C) also for the washed samples. The Raman spectra of these samples show that structural ordering does not increase during the heating procedure and the relatively constant (transmission and/or reflectance) laser signals during the first three temperature levels suggest that no noticeable pyrolysis occurs. Therefore, we assume that some of the light-absorbing material which was originally on the filter evolves in the absence of oxygen at 650 ∘C. This could be caused by a premature evolution of EC due to oxygenation with oxygen supplied by mineral oxides or catalysis by metal or other inorganic salts (Chow et al., 2001; Wang et al., 2010).
3.3 Analysis of the unwashed (heated and original) samples
3.3.1 Comparison of structural changes EUSAAR2 vs. NIOSH870 after the inert phase
A comparison between NIOSH870 and EUSAAR2 protocols was performed for a subset of six unwashed samples (five winter, one summer). The ratio increased during the course of the inert phase for both protocols (EUSAAR2 and NIOSH870). However, for three samples (13 June 2015, 3 December 2014, 25 October 2015) out of six, the ratio at the maximum He temperature is significantly larger for NIOSH870 than for EUSAAR2 (Fig. 4). For the sample on 25 October 2015, of EU500 (i.e., the first temperature step in He + O2) also remains lower than the of NI870. For the other three samples (8 January 2015, 17 February 2015, 9 January 2015), relative D-peak intensities are similar for NI870 and EU650 as well as for EU500.
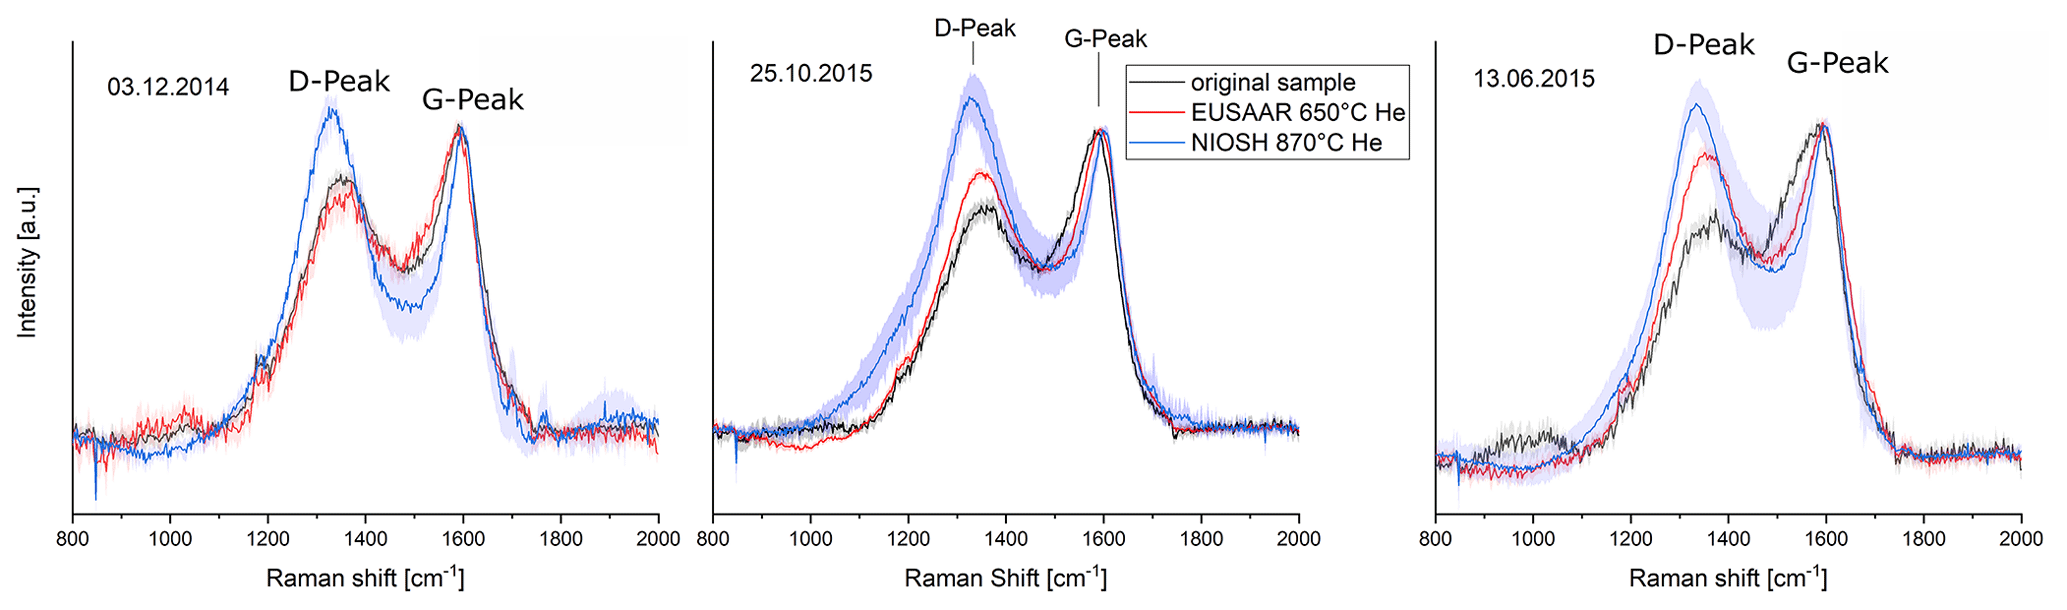
Figure 4Comparison of Raman spectra of EU650 (red lines) and NI870 (blue lines) for the three samples where of NI870 is larger than of EU650 (from left to right: 3 December 2014, 25 October 2015 and 13 June 2015). Error bars are shown as shaded areas. The ratio increases for NIOSH870 as well as for EUSAAR2 compared to the spectrum of the original sample (black lines), but the relative D-peak of NI870 is visibly higher than the D-peak of EU650 for all three samples.
The larger increase of for NI870 for some samples can be interpreted as a stronger increase of structural ordering, when these samples are heated according to the NIOSH870 protocol compared to EUSAAR2.
These differences could be caused by a stronger graphitization during the NIOSH870 protocol than during EUSAAR2 at least in three cases out of six. This would mean that PC developed during the heating with different protocols might also have different optical properties which would influence the decrease of the transmission and/or reflection laser signal during the thermal–optical measurement procedure. This would be in good agreement with Yu et al. (2002), who found that light absorption coefficients of PC formed during a thermal–optical heating procedure are not identical over the whole heating procedure. It is plausible that this might be true also for two protocols with different maximum temperatures in He. The higher ratio for a higher heating temperature is also in accordance with Le et al. (2019), who found increasing ratios between 600 and 800 ∘C for their OC-rich samples heated in N2.
As suggested by Chow et al. (2001), part of EC could leave the filter already during the 870 ∘C temperature level in helium because of oxygenation or catalysis caused by mineral or other oxides at temperatures > 700 ∘C. This premature evolution of relatively structured material could also affect the ratio during the highest inert temperature step in NIOSH870.
Therefore, we assume that the higher ratio of NI870 for some samples could be a combination of stronger graphitization caused by the higher temperature and premature oxidation of EC during the 870 ∘C level in NIOSH870.
3.3.2 Structural changes during EUSAAR2
For all of the 21 (unwashed) samples, Raman spectra were taken for unheated samples and for samples heated according to the EUSAAR2 protocol. In most cases (17 out of 21) the ratio increases during the heating process, indicating an increase of structural ordering. However, distinct changes of the Raman spectra occur at different temperature levels during the heating procedure in the inert phase (450–650 ∘C) or the oxidizing phase (500 ∘C). Moreover in some cases the change happens only at one temperature level or extends over two temperature levels. Therefore, the samples were classified into six categories (subsequently referred to as “Raman categories”) depending on the temperature levels where significant changes in the Raman signals occur: the significance was investigated by performing unpaired, two-sided t tests for all spectra compared to the spectra of the next higher and lower temperature level, respectively, using a significance level α of 5 %. Some slight decreases in the peak ratio between EU200 and EU300 are visible, but they are not significant except for 1 sample out of 21 (13 June 2015, p = 0.035). A possible explanation of this decrease is given by Le et al. (2019), who observed a similar behavior during heating in N2 and gave as a reason for the evaporation of OC volatile components and cyclization of molecular structures. Since this decreasing ratio is not significant in most of our samples, we focus here only on increasing ratios. The six categories were defined as follows. (Sample codes are explained in Table 1 and examples for the categories are shown in Fig. 5a–e.)
-
Early structural change (four samples). ratio of the Raman spectrum obtained for EU450 is significantly higher according to a t test with α=5 % than ratio of the spectrum for EU300. And ratio of EU650 is significantly higher than of EU450. The ratios do not increase significantly between unheated sample, EU200 and EU300 and between EU650 and EU500 (Fig. 5a).
-
Late structural change (two samples). ratio of the Raman spectrum of EU650 is significantly higher than of the Raman spectrum of EU450 and of the Raman spectrum of EU500 is significantly higher than of EU650. The ratio does not increase significantly between the unheated sample, EU200, EU300, EU450 or EU650 (Fig. 5b).
-
No change (four samples). All mean spectra lie within the error bars of the other spectra, and ratios do not change significantly (Fig. 5c).
-
Fast and early structural change (one sample). ratio of the Raman spectrum of EU450 is significantly higher than of EU300, and does not decrease significantly between EU200 and EU300 as well as between EU450, EU650 and EU500 (Fig. 5d).
-
Fast and late structural change (six samples). ratio of the Raman spectrum of EU650 is significantly higher than of EU450, and does not increase significantly between EU200, EU300 and EU450 as well as between EU650 and EU500 (Fig. 5e).
-
Undefined (four samples). Changes of the Raman spectra cannot be assigned unambiguously to one of the other five categories as a consequence of too strong noise signals.
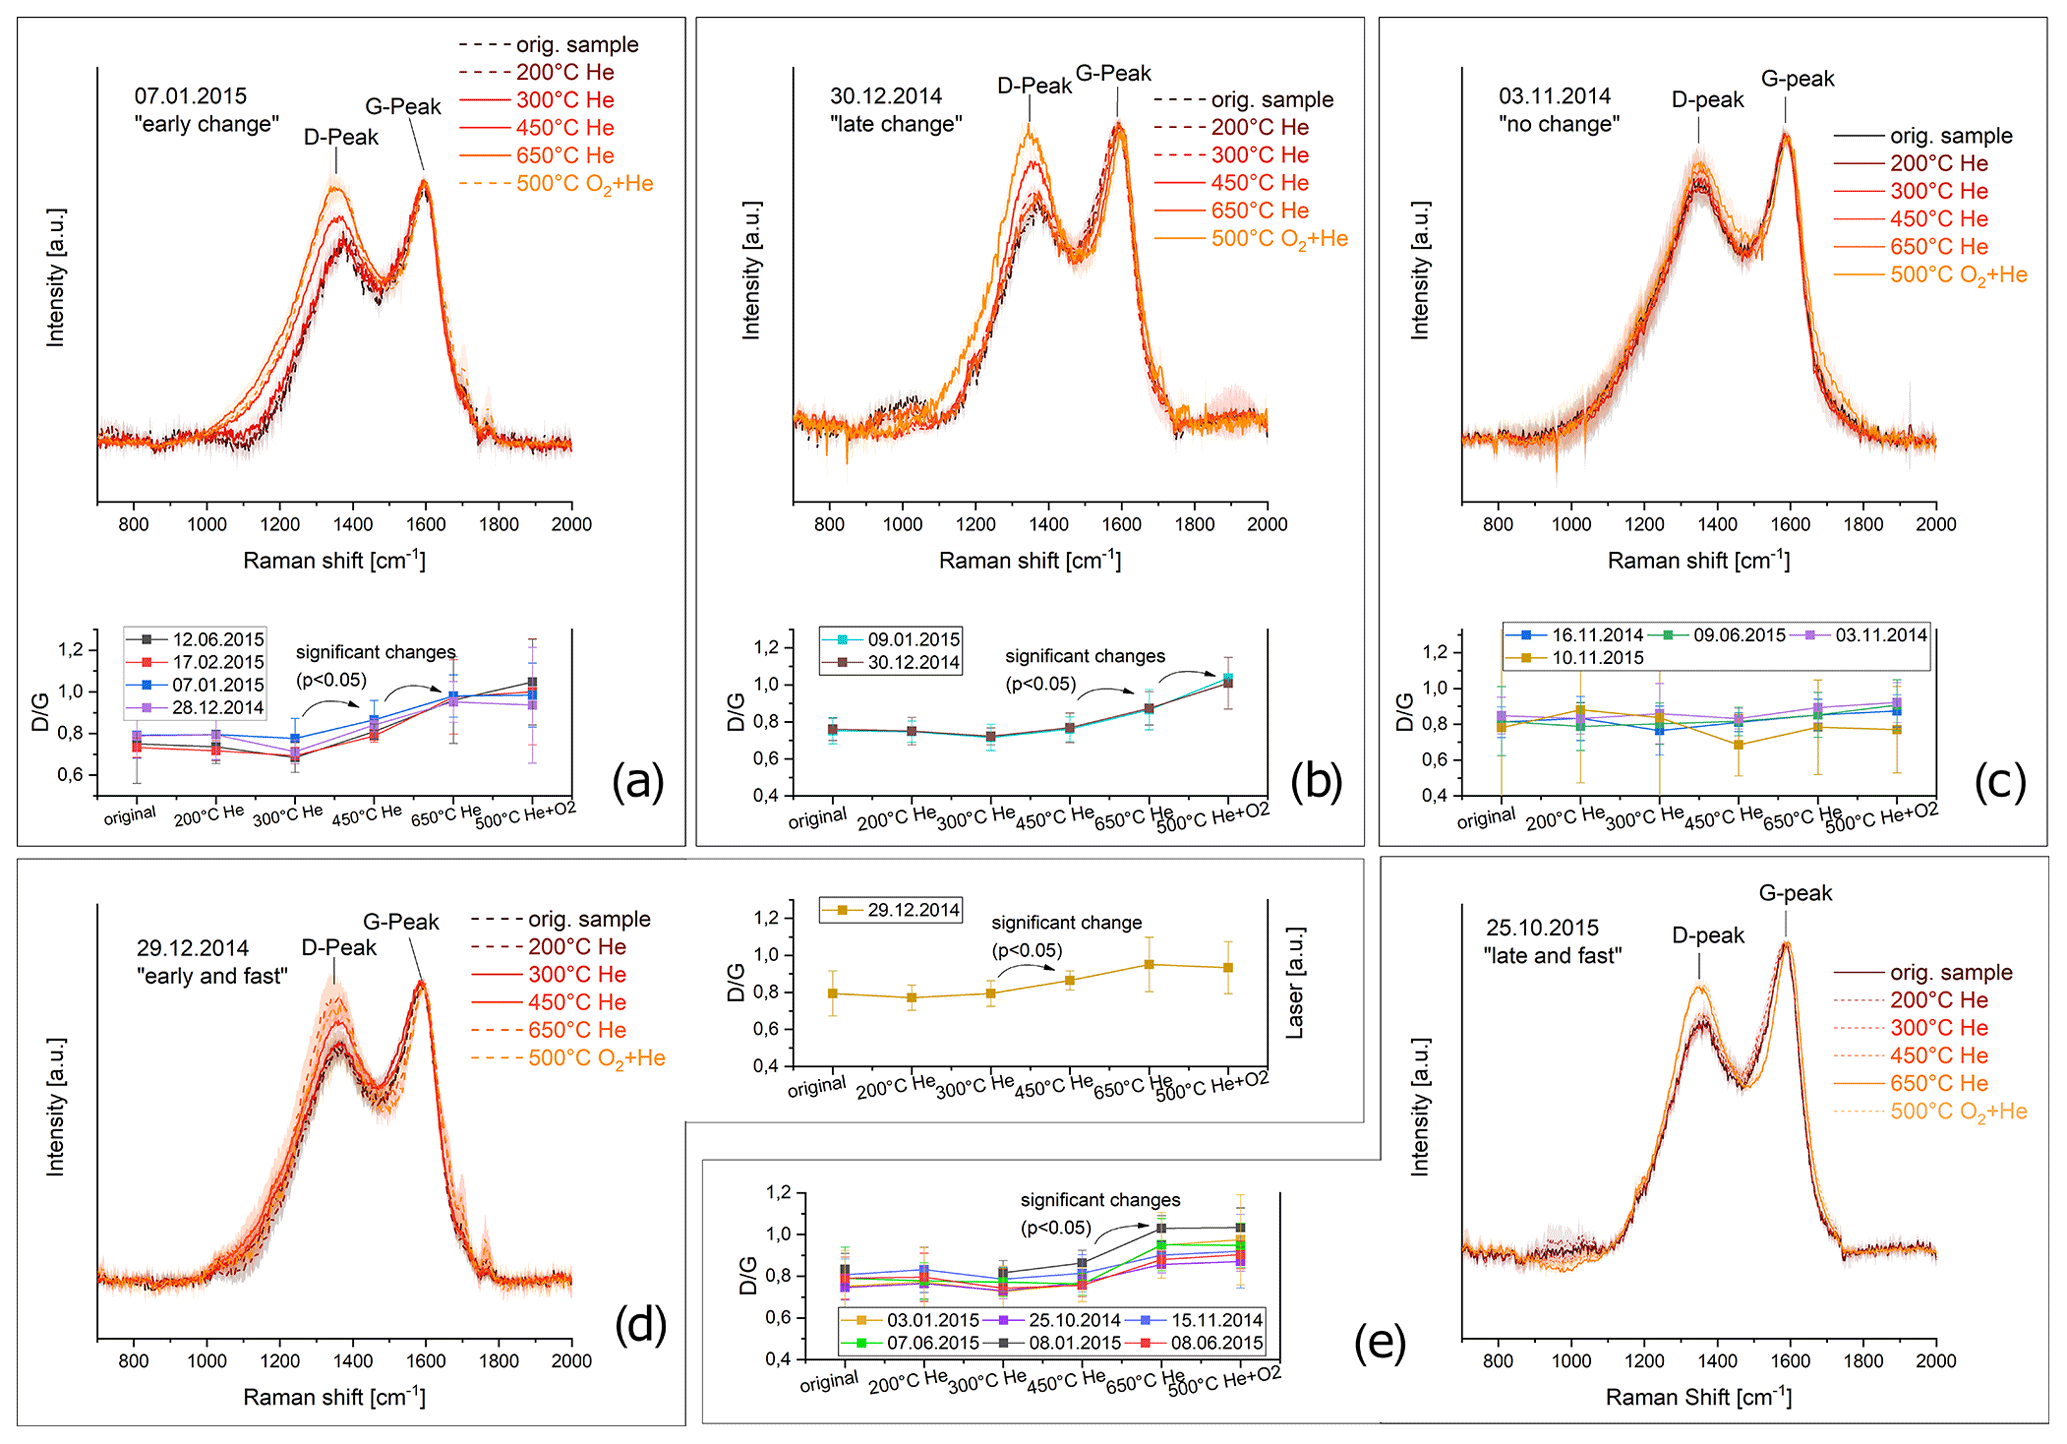
Figure 5Examples of Raman spectra for of heated and unheated filter samples assigned to the categories “early structural change” (a), “late structural change” (b), “no structural change” (c) “early and fast structural change” (d) and “late and fast structural change” (e). Error bars are shown as shaded areas. The changes of ratio with heating temperature are shown for all samples assigned to the respective category in an additional image. Arrows indicate the temperature levels where significant changes were identified according to a t test (α=5 %).
The changes of peak ratios as a function of temperature level are shown in Fig. 5 for all samples of each category as well as examples for the changes in the Raman spectra. It is remarkable that the spectra of the heated samples differ and show different progresses over the heating procedure (Fig. 5), although the Raman spectra of the original (unheated) samples are comparable. Therefore, we conclude that the differences in the progress of restructuring might not be caused by the degree of structural ordering of the original samples or at least cannot be simply predicted by their Raman spectra.
3.3.3 Structural changes and laser signals (EUSAAR2)
During the thermal–optical analysis procedure with EUSAAR2 as well as with NIOSH870 decreasing (transmission and reflection), laser signals were observed during the inert phase for all unwashed samples. The signals started to increase again during the last temperature level in He for both protocols. This increase was also described by other authors (e.g., Chow et al., 2004; Yu et al., 2002).
For a more detailed analysis of the progress of the laser signals, we focus on EUSAAR2 here. During the heating following EUSAAR2, the reflection laser signals decrease in more or less pronounced steps at each temperature level in the He phase, and no distinct differences between the samples and therefore no relationship between the changes of the Raman spectra and the reflection laser signals are visible. For the transmission signals, two different types of decrease can be observed. For some samples, the signal decreases with a pronounced step during the 300 ∘C temperature level in He. For other samples, the transmission laser signal shows a relatively steady decrease before it reaches its minimal value. However, no relation between the slope of the decrease and the Raman categories is visible. The diagrams can be found in the Supplement (Figs. S2 and S3).
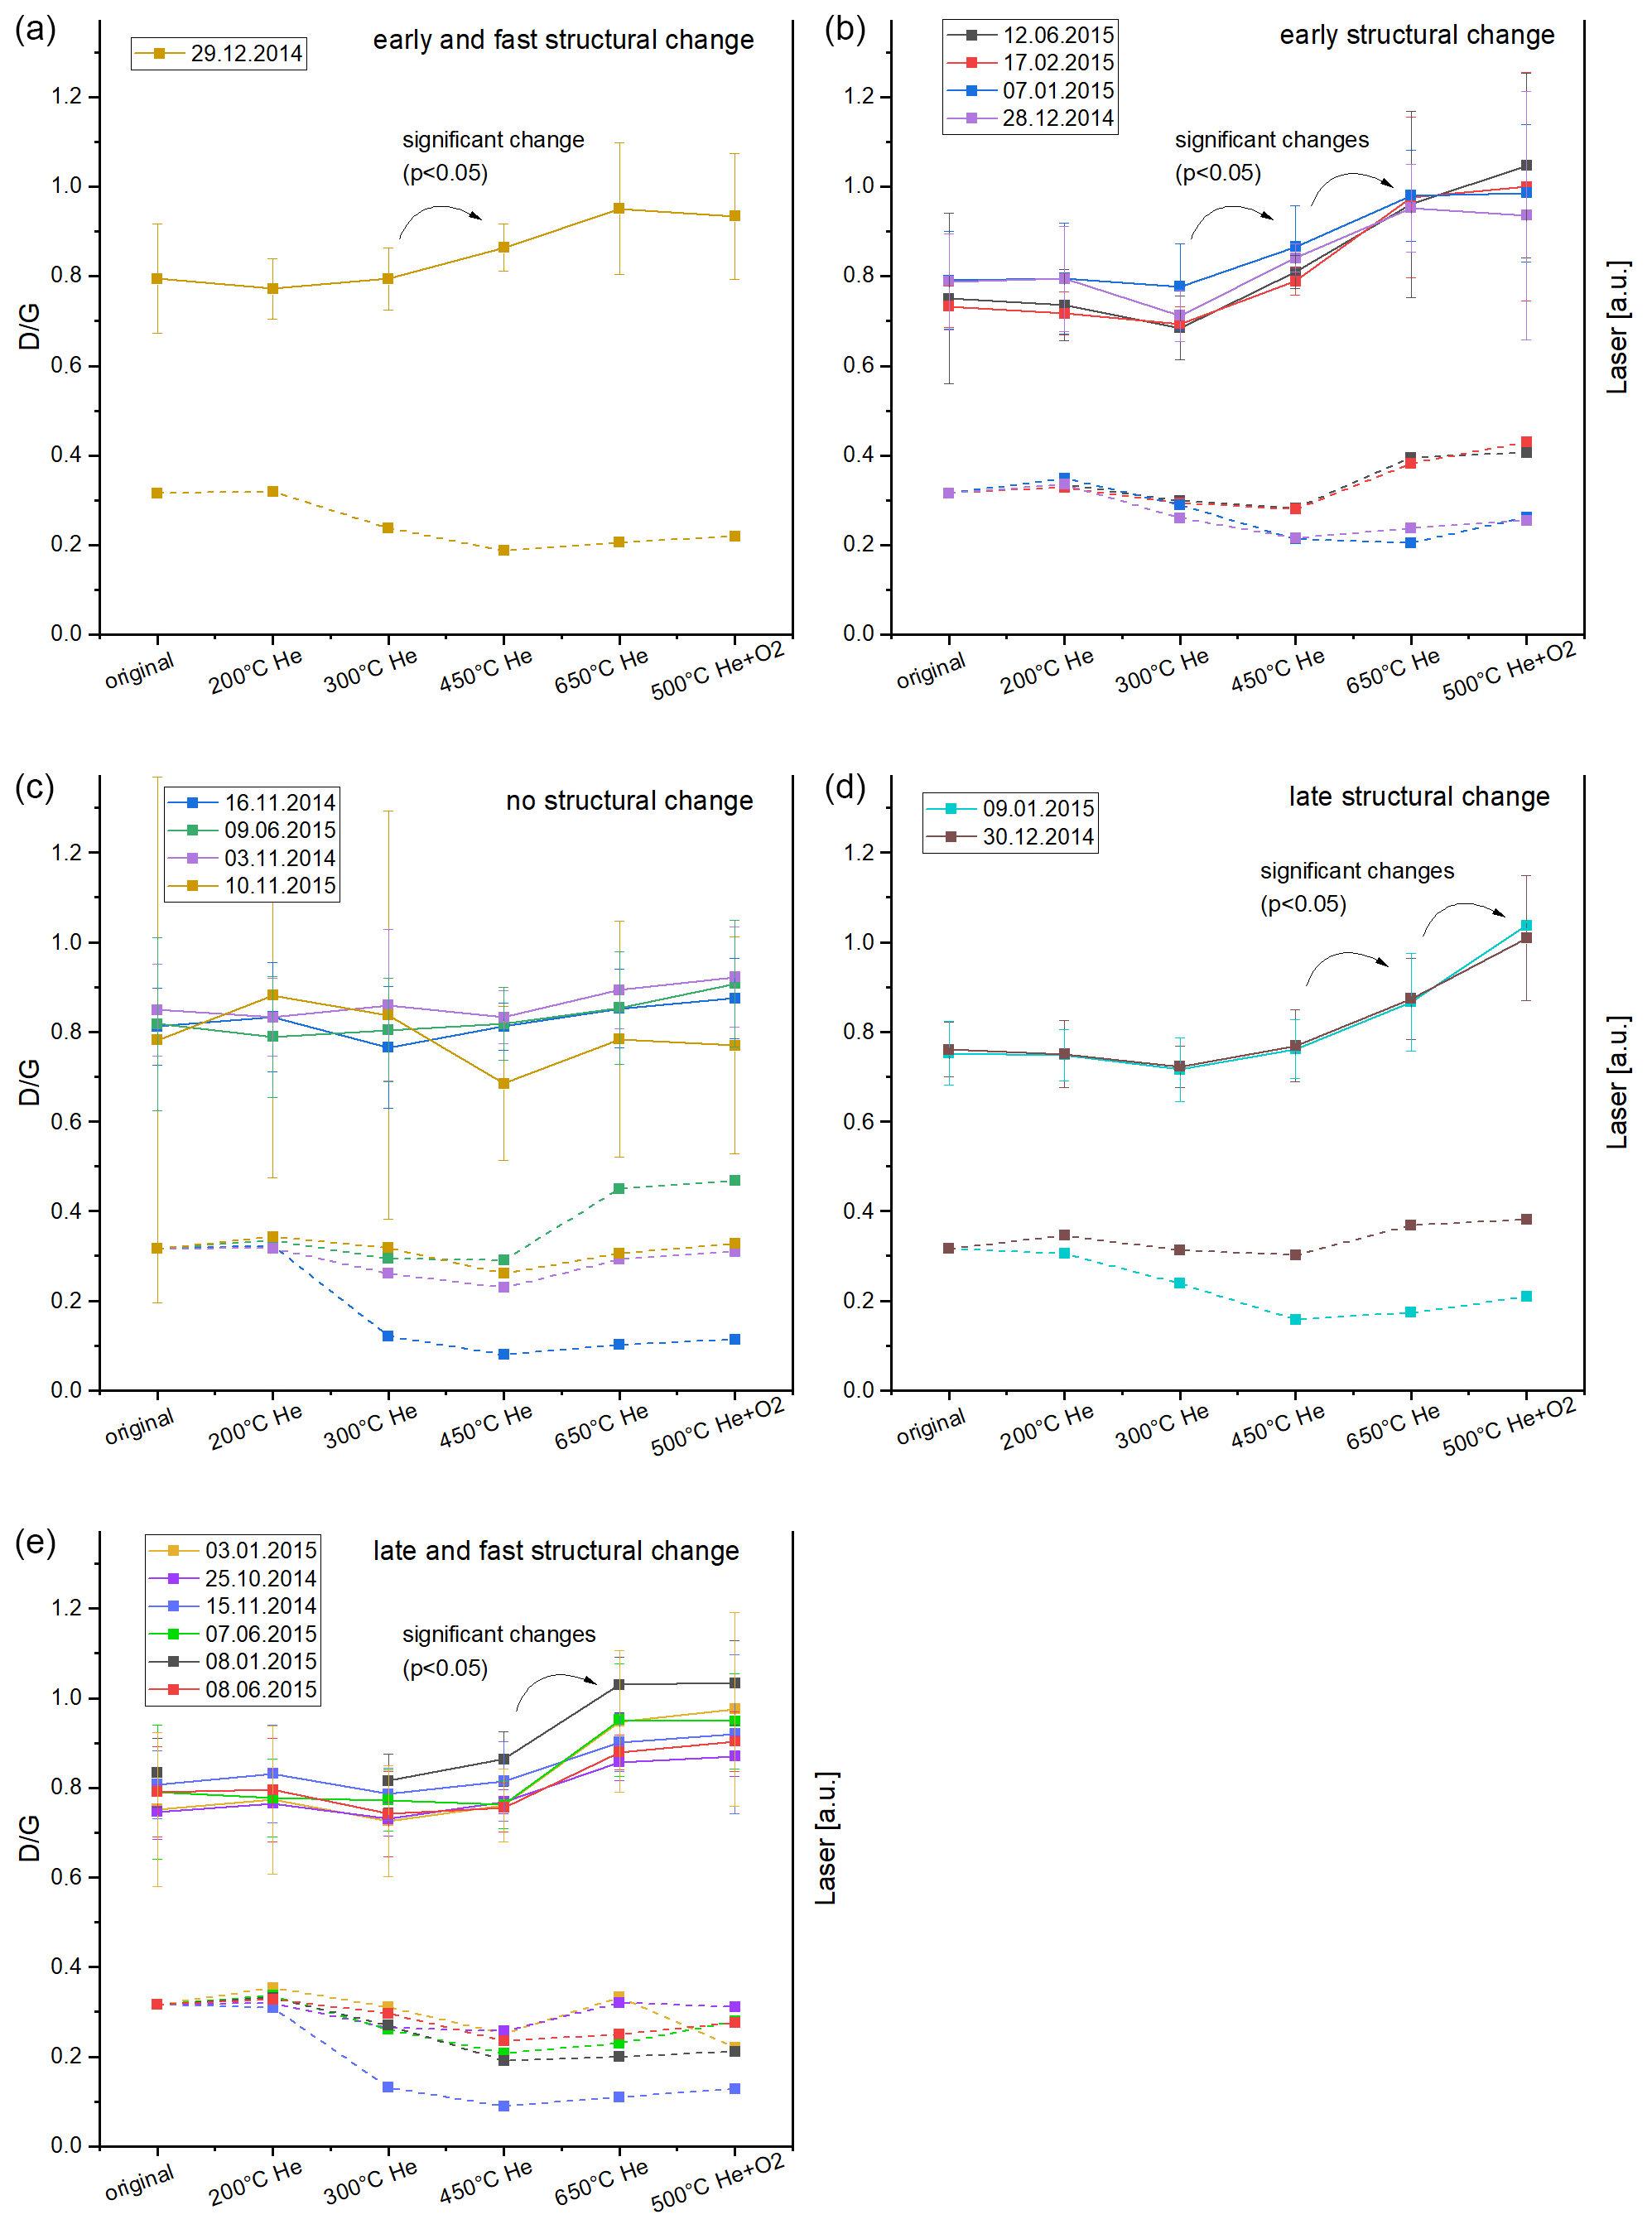
Figure 6Comparison of the changes of peak ratios (solid lines, left axis) and transmission laser signals (dashed lines, right axis) at the end of each temperature level sorted by Raman categories. Standard deviations of are calculated from the standard deviations of the Raman spectra. All laser signals are normalized to the signal at the end of the measurement procedure (i.e., signal of the clean filter). The curves for the different filters are shifted at the y axis so that all curves start at the same point (original sample). It is visible that changes in and changes in laser signal are not related.
Figure 6 shows a comparison of the ratio and the value of the transmission laser signal at the end of each temperature level in EUSAAR2 sorted by the Raman categories. It is obvious that the decrease of the transmission signal is not related to the increase of the ratio. Samples with similar behavior of the Raman signals can have different curves of the transmission laser signals and vice versa. It is also noteworthy that the strongest decreases of the transmission laser signals do not occur at the temperature levels where changes in the Raman spectra are observable (450, 650 ∘C). We found similar effects in our earlier study (Haller et al., 2019) where we compared UV–Vis spectra of heated (NIOSH870 protocol) CAST soot samples with the changes of the respective Raman spectra. The UV–Vis spectra started to change at lower temperatures, while the Raman spectra changed only at the highest temperature in He (870 ∘C).
This lack of correlation between laser signal and ratio is most striking for the four samples with no change in the Raman spectra of the heated samples (Fig. 6c). Although the Raman spectra do not indicate an increase of structural ordering, the (transmission, reflection) laser signals decrease during the heating procedure in He. Therefore, we conclude that the formation or increase of graphite-like structures cannot be the only reason for the darkening (i.e., stronger absorption of the red laser signal). Our data give evidence that non-graphitic material with smaller optical band gaps and therefore higher absorbance at 635 nm than in the unheated material might be formed. This corresponds also to the findings of Yu et al. (2002), who assume that light-absorbing intermediate OC products are formed during the inert phase of the thermal–optical measurement procedures they used (a NIOSH method and other experimental temperature protocols). Le et al. (2019) performed a detailed analysis of several heated CAST soot samples and suggest a removal of C−H “out-of-plane” bonds around 350–400 ∘C, a decomposition of oxygen containing surface groups () or a decrease of cross-linkages between polyaromatic units and carbon chains. All of these transformations could influence the optical properties without an increase of graphite-like structures.
3.3.4 Possible relations of structural changes with other parameters
Generally, the charring behavior of aerosol samples or the reliability of thermal–optical measurements is often reported to be influenced by the composition of the aerosol (e.g., Wang et al., 2010; Yu et al., 2002; Reisinger et al., 2008; Wonaschuetz et al., 2009). Since our samples show differing charring behaviors, we investigated possible relations to the aerosol composition using the unwashed samples. We compared the progress of structural changes (expressed by the assignment to the Raman categories) to the chemical composition of the non-carbonaceous matter and to the composition of the carbonaceous matter (LAC BC, EC OC). The ionic composition of the samples sorted by their Raman categories is shown in Fig. 7.
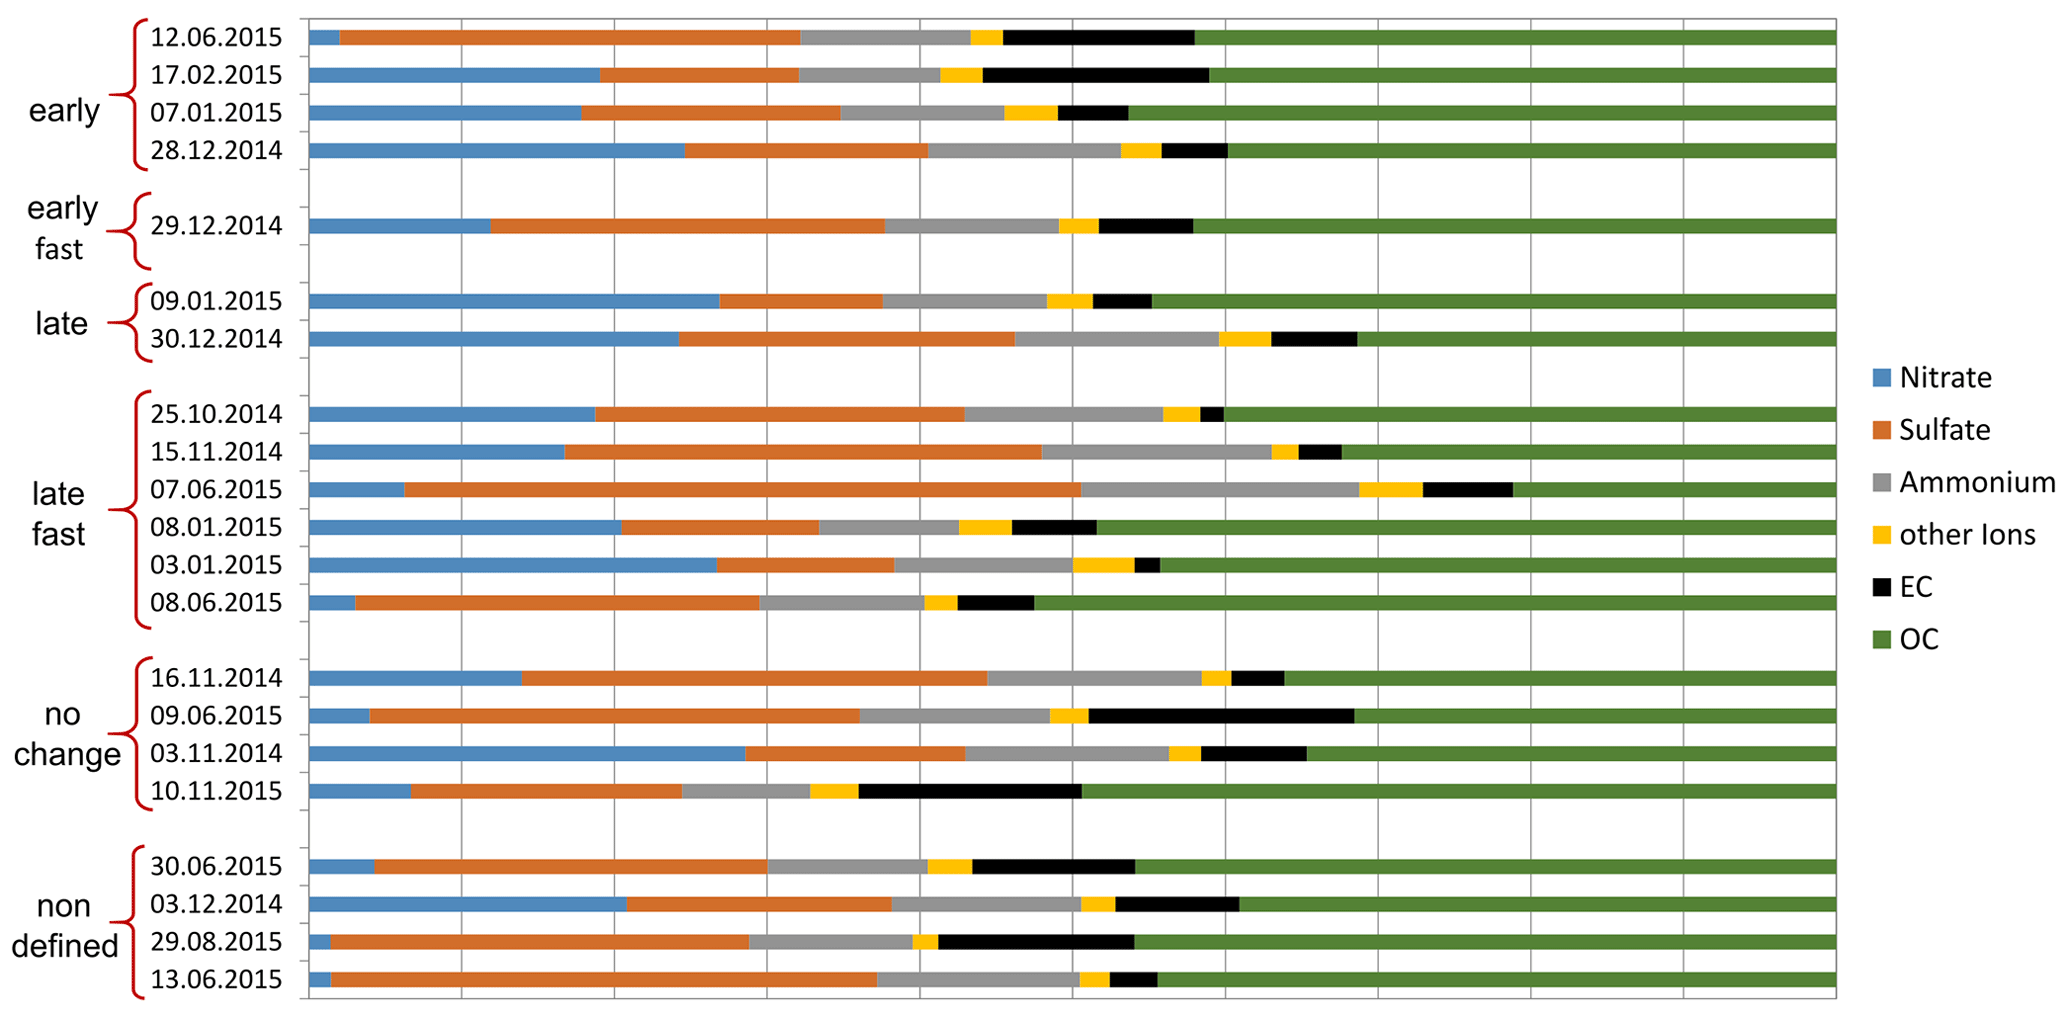
Figure 7Fractions of analyzed ions, elemental carbon (EC) and organic carbon (OC) sorted by the categories representing the behavior of the Raman spectra during the thermal–optical heating procedure. The contribution of minor ions to the category “other ions” can be found in the Supplement.
No relationship between the ionic components and the progress of restructuring of the material is visible. This could be explained by the study by Yu et al. (2002), who showed that one and the same compound can enhance or reduce charring depending on the chemistry of the organic substances present in the sample. Although they analyzed only three standards for organic carbon, it is possible that similar counteracting influences could be found also for other organic substances which could suppress a possible relationship between charring and the inorganic material within a sample.
The progress of structural changes is also unrelated to the BrC LAC ratio (Fig. 8). Samples with BrC below detection limit are found in nearly all the Raman categories. Especially the samples in the category “no change” during heating do not have appreciably lower BrC LAC ratios than others. This is quite interesting, because previous studies in Austrian aerosol (e.g., Reisinger et al., 2008; Wonaschuetz et al., 2009) found larger discrepancies between EC values obtained with different thermal–optical methods for atmospheric aerosol samples with high contributions of BrC to LAC, up to about 0.9 (Wonaschuetz et al., 2009) and 0.75 (Reisinger et al., 2008). These values are comparable to the BrC LAC of about 0.7 in our study. At the time of the earlier studies, it was not possible to determine whether these discrepancies were due to a higher tendency of BrC to char (and therefore influence the EC OC split) or from other BrC-related processes. Our findings suggest that the relative amount of BrC has no influence on the increase of structural ordering during the heating procedure at least for the samples analyzed here. The discrepancies between different thermal–optical methods for BrC-rich samples might therefore have other reasons than a restructuring of BrC in terms of increased structural ordering.
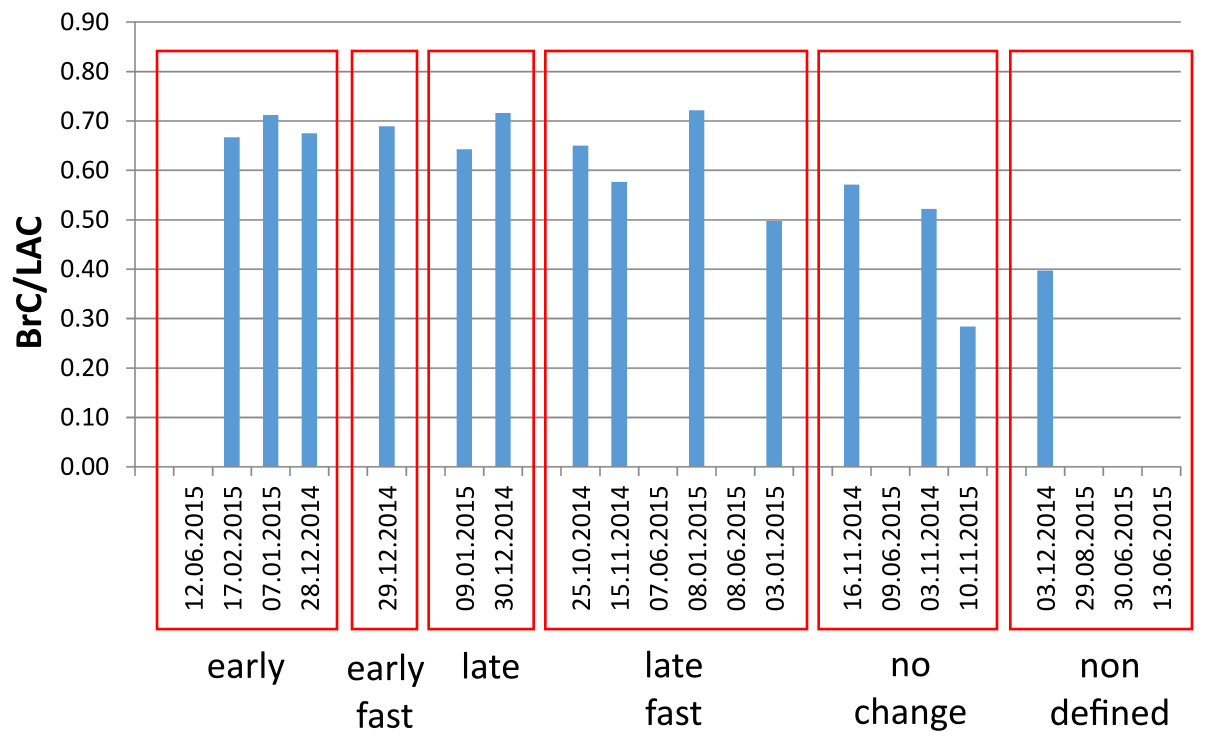
Figure 8Comparison of BrC LAC with the categories representing the behavior of the Raman signal during the heating procedure of the thermal–optical analysis. For samples with BrC LAC = 0 (i.e., no bar in the diagram), BrC was below the detection limit (< 12.7 µg cm−2).
The aim of this study was to investigate structural changes of carbonaceous matter during thermal–optical analyses. Two different thermal–optical measurement protocols with different maximum temperatures in the He phase (EUSAAR2, NIOSH870) were used to show the progress of restructuring of carbonaceous material during heating. Raman spectra of unheated and heated samples were taken for 21 atmospheric aerosol samples. A subset of these samples was washed with water to remove WSOC and other water-soluble constituents. The transmission laser signal patterns during the EUSAAR2 protocol and the progress of structural changes were compared for the washed samples and their unwashed counterparts.
We found that the laser signals did not decrease during the heating procedure of the washed samples but decreased when the unwashed samples were heated. This is in good agreement with Yu et al. (2002), who observed that water-soluble material contributed most to charring. The peak ratios of the Raman spectra of the washed samples did not change appreciably during heating in He following the EUSAAR2 protocol. We therefore infer that the relatively constant transmission laser signal can indeed be interpreted as a lack of graphitization.
A comparison between EUSAAR2 and NIOSH870 was performed for six unwashed samples. EUSAAR2 is used in Europe as a standard method to monitor EC and OC (Brown et al., 2017). One of the arguments for the introduction of EUSAAR2 was that less PC is formed during EUSAAR2 in comparison with other (NIOSH-like) temperature protocols (Cavalli et al., 2010). However, this argument was solely based on the decrease of the transmission laser signal. Structural changes of the material were not investigated. We found now that the peak ratios of the Raman spectra can be higher for samples heated to the maximum He temperature of NIOSH870 compared to samples heated to the maximum He temperature of EUSAAR2 at least for some samples, which means that PC formed during NIOSH870 might have a higher degree of structural ordering in these cases.
When comparing the Raman spectra for 21 samples heated following the EUSAAR2 protocol, we found a rather complex behavior of structural changes. Since changes in the Raman signals (i.e., the ratio of the peak intensities) occur at different temperature levels, we defined six Raman categories of samples depending on the temperature levels, where significant changes in the Raman spectra occur and how fast they proceed. We tried to find similarities for samples with similar progress of structural changes (i.e., the attribution to one of the six Raman categories) and chemical composition (BC, BrC, major ions), but we did not find any relationship. This is in good agreement with Wang et al. (2010) and Yu et al. (2002), who found that non-carbonaceous components have conflicting influences on the charring behavior during thermal–optical analyses.
We also investigated the progress of the thermal–optical transmission laser signals in relation to the Raman categories corresponding to the temperature levels where visible structural changes occur. It was obvious that the decrease of the transmission signal did not occur at the same temperature levels where structural changes in terms of increased ordering were found. This lack of a relation is most prominent for samples where the peak ratios of the Raman spectra do not change during the whole heating procedure in He. Although the Raman spectra do not indicate an increase of structural ordering, the transmission (and reflection) laser signals still decrease during the He phase. Moreover no noticeable differences can be seen between the transmission laser signal patterns of samples where no increase of ordering occurs in comparison with samples where the Raman spectra change during heating.
We therefore conclude that some of the processes that lead to a darkening of the sample (i.e., more absorption at 635 nm) do not affect the relative peak heights of the Raman spectra, which means that structural ordering does not increase (similar findings as well as their interpretation were described for CAST soot samples in our previous publication; Haller et al., 2019). Processes suggested by various authors include, for example, the separation of oxygen and hydrogen at temperatures above 250 ∘C in He (Petzold et al., 2013; Chow et al., 2004, Le et al., 2019), the decomposition of oxygen containing surface groups () or a decrease of cross-linkages between polyaromatic units and carbon chains (Le et al., 2019). All of these transformations could affect the optical properties of the material without affecting the peak ratio of the Raman spectra. These findings are in good agreement with Yu et al. (2002), who describe a possible formation of light-absorbing intermediate (non-graphitic) OC products during the inert phase of thermal–optical analyses.
In the literature the darkening of a sample during thermal–optical analysis is often explained by “charring” or “pyrolysis”, although exact descriptions of the underlying structural changes are not given. Based on our findings, it is important to point out that what is called “charring” or “pyrolysis” is not necessarily an increase of structural ordering. Particularly the group of samples where the peak ratio does not change over the whole heating procedure gives evidence that the darkening of the sample cannot be understood as building of graphite-like structures in all cases. We therefore suggest that the widely used terms “charring” and “pyrolysis” should be used carefully when the darkening of a sample during thermal–optical measurement procedures is interpreted.
In summary, we can say that restructuring of carbonaceous matter during thermal–optical analysis is very complex and not easily predictable for atmospheric aerosol samples. At least for the washed samples, the constant transmission and/or reflection signal indicates an absence of graphitization, but for all samples a decrease of the transmission or reflection laser signal during the heating procedures is not a reliable indicator for an increase of structural ordering since other processes can also lead to a darkening of the material.
Data can be accessed by contacting the corresponding author.
The supplement related to this article is available online at: https://doi.org/10.5194/amt-14-3721-2021-supplement.
TH performed the conceptualization of the experimental setup, most measurements (except TEM, BrC/BC, ion chromatography), the data evaluation and interpretation and prepared the article. ES performed the BrC/BC measurements. TS performed the ion chromatography measurements and wrote the text in the Experimental section. CR performed the TEM measurements and wrote the TEM section. AW supervised the BrC/BC measurements. AKG contributed to discussions and provided input for the ion chromatography and to the article in general. HG contributed to discussions and provided input for the Raman measurements. RH performed the conceptualization and supervision of the study, contributed to discussions and provided extensive input to the text.
The authors declare that they have no conflict of interest.
This work was supported by the Austrian Science Fund (FWF), grant P26040. The integrating sphere technique was developed thanks to grant H-85/92, Hochschuljubiläumstiftung der Stadt Wien.
We thank the Analytical Instrumentation Center (AIT) of the Vienna University of Technology and the group of Bernhard Lendl for providing the Raman microscope, and we thank Angelika Geroldinger for the advice regarding the statistical tests.
This research has been supported by the Austrian Science Fund (grant no. P26040) and the Hochschuljubiläumstiftung der Stadt Wien (grant no. H-85/92).
This paper was edited by Zamin A. Kanji and reviewed by two anonymous referees.
Andreae, M. O. and Gelencsér, A.: Black carbon or brown carbon? The nature of light-absorbing carbonaceous aerosols, Atmos. Chem. Phys., 6, 3131–3148, https://doi.org/10.5194/acp-6-3131-2006, 2006.
Birch, M. E. and Cary, R. A.: Elemental Carbon-Based Method for Monitoring Occupational Exposures to Particulate Diesel Exhaust, Aerosol Sci. Tech., 25, 221–241, https://doi.org/10.1080/02786829608965393, 1996.
Bladt, H., Ivleva, N. P., and Niessner, R.: Internally mixed multicomponent soot: Impact of different salts on soot structure and thermo-chemical properties, J. Aerosol Sci., 70, 26–35, https://doi.org/10.1016/j.jaerosci.2013.11.007, 2014.
Bond, T. C. and Bergstrom, R. W.: Light Absorption by Carbonaceous Particles: An Investigative Review, Aerosol Sci. Tech., 40, 27–67, https://doi.org/10.1080/02786820500421521, 2006.
Brown, R. J. C., Beccaceci, S., Butterfield, D. M., Quincey, P. G., Harris, P. M., Maggos, T., Panteliadis, P., John, A., Jedynska, A., Kuhlbusch, T. A. J., Putaud, J.-P., and Karanasiou, A.: Standardisation of a European measurement method for organic carbon and elemental carbon in ambient air: results of the field trial campaign and the determination of a measurement uncertainty and working range, Environ. Sci.-Proc. Imp., 19, 1249–1259, https://doi.org/10.1039/C7EM00261K, 2017.
Cavalli, F., Viana, M., Yttri, K. E., Genberg, J., and Putaud, J.-P.: Toward a standardised thermal-optical protocol for measuring atmospheric organic and elemental carbon: the EUSAAR protocol, Atmos. Meas. Tech., 3, 79–89, https://doi.org/10.5194/amt-3-79-2010, 2010.
Cheng, Y., Duan, F.-K., He, K.-B., Du, Z.-Y., Zheng, M., and Ma, Y.-L.: Intercomparison of thermal-optical method with different temperature protocols: Implications from source samples and solvent extraction, Atmos. Environ., 61, 453–462, https://doi.org/10.1016/j.atmosenv.2012.07.066, 2012.
Chow, J. C., Watson, J. G., Crow, D., Lowenthal, D. H., and Merrifield, T.: Comparison of IMPROVE and NIOSH Carbon Measurements, Aerosol Sci. Tech., 34, 23–34, https://doi.org/10.1080/027868201300081923, 2001.
Chow, J. C., Watson, J. G., Chen, L.-W. A., Arnott, W. P., Moosmüller, H., and Fung, K.: Equivalence of Elemental Carbon by Thermal/Optical Reflectance and Transmittance with Different Temperature Protocols, Environ. Sci. Technol., 38, 4414–4422, https://doi.org/10.1021/es034936u, 2004.
Commodo, M., de Falco, G., Larciprete, R., D'Anna, A., and Minutolo, P.: On the hydrophilic/hydrophobic character of carbonaceous nanoparticles formed in laminar premixed flames, Exp. Therm. Fluid Sci., 73, 56–63, https://doi.org/10.1016/j.expthermflusci.2015.09.005, 2016.
Ess, M. N., Ferry, D., Kireeva, E. D., Niessner, R., Ouf, F.-X., and Ivleva, N. P.: In situ Raman microspectroscopic analysis of soot samples with different organic carbon content: Structural changes during heating, Carbon, 105, 572–585, https://doi.org/10.1016/j.carbon.2016.04.056, 2016.
Ferrari, A. C. and Robertson, J.: Interpretation of Raman spectra of disordered and amorphous carbon, Phys. Rev. B, 61, 14095–14107, https://doi.org/10.1103/PhysRevB.61.14095, 2000.
Fultz, B. and Howe, J. M.: Transmission electron microscopy and diffractometry of materials, Physics and astronomy online library, Springer, Berlin, Germany, 2001.
Gammer, C., Mangler, C., Rentenberger, C., and Karnthaler, H. P.: Quantitative local profile analysis of nanomaterials by electron diffraction, Scripta Mater., 63, 312–315, https://doi.org/10.1016/j.scriptamat.2010.04.019, 2010.
Gao, S., Hegg, D. A., Hobbs, P. V., Kirchstetter, T. W., Magi, B. I., and Sadilek, M.: Water-soluble organic components in aerosols associated with savanna fires in southern Africa: Identification, evolution, and distribution, J. Geophys. Res., 108, 8491, https://doi.org/10.1029/2002JD002324, 2003.
Haller, T., Rentenberger, C., Meyer, J. C., Felgitsch, L., Grothe, H., and Hitzenberger, R.: Structural changes of CAST soot during a thermal–optical measurement protocol, Atmos. Meas. Tech., 12, 3503–3519, https://doi.org/10.5194/amt-12-3503-2019, 2019.
Han, Y., Cao, J., Chow, J. C., Watson, J. G., An, Z., Jin, Z., Fung, K., and Liu, S.: Evaluation of the thermal/optical reflectance method for discrimination between char- and soot-EC, Chemosphere, 69, 569–574, https://doi.org/10.1016/j.chemosphere.2007.03.024, 2007.
Highwood, E. J. and Kinnersley, R. P.: When smoke gets in our eyes: The multiple impacts of atmospheric black carbon on climate, air quality and health, Environ. Int., 32, 560–566, https://doi.org/10.1016/j.envint.2005.12.003, 2006.
Hitzenberger, R. and Tohno, S.: Comparison of black carbon (BC) aerosols in two urban areas – concentrations and size distributions, Atmos. Environ., 35, 2153–2167, https://doi.org/10.1016/S1352-2310(00)00480-5, 2001.
Hitzenberger, R., Petzold, A., Bauer, H., Ctyroky, P., Pouresmaeil, P., Laskus, L., and Puxbaum, H.: Intercomparison of Thermal and Optical Measurement Methods for Elemental Carbon and Black Carbon at an Urban Location, Environ. Sci. Technol., 40, 6377–6383, https://doi.org/10.1021/es051228v, 2006.
Ivleva, N. P., Messerer, A., Yang, X., Niessner, R., and Pöschl, U.: Raman Microspectroscopic Analysis of Changes in the Chemical Structure and Reactivity of Soot in a Diesel Exhaust Aftertreatment Model System, Environ. Sci. Technol., 41, 3702–3707, https://doi.org/10.1021/es0612448, 2007.
Jankowski, N., Schmidl, C., Marr, I. L., Bauer, H., and Puxbaum, H.: Comparison of methods for the quantification of carbonate carbon in atmospheric PM10 aerosol samples, Atmos. Environ., 42, 8055–8064, https://doi.org/10.1016/j.atmosenv.2008.06.012, 2008.
Kirchstetter, T. W., Novakov, T., and Hobbs, P. V.: Evidence that the spectral dependence of light absorption by aerosols is affected by organic carbon, J. Geophys. Res., 109, D21208, https://doi.org/10.1029/2004JD004999, 2004.
Knauer, M., Schuster, M. E., Su, D., Schlögl, R., Niessner, R., and Ivleva, N. P.: Soot structure and reactivity analysis by Raman microspectroscopy, temperature-programmed oxidation, and high-resolution transmission electron microscopy, J. Phys. Chem. A, 113, 13871–13880, https://doi.org/10.1021/jp905639d, 2009.
Le, K. C., Pino, T., van Pham, T., Henriksson, J., Török, S., and Bengtsson, P.-E.: Raman spectroscopy of mini-CAST soot with various fractions of organic compounds: Structural characterization during heating treatment from 25 ∘C to 1000 ∘C, Combust. Flame, 209, 291–302, https://doi.org/10.1016/j.combustflame.2019.07.037, 2019.
Lukács, H., Gelencsér, A., Hammer, S., Puxbaum, H., Pio, C., Legrand, M., Kasper-Giebl, A., Handler, M., Limbeck, A., Simpson, D., and Preunkert, S.: Seasonal trends and possible sources of brown carbon based on 2-year aerosol measurements at six sites in Europe, J. Geophys. Res., 112, 1052, https://doi.org/10.1029/2006JD008151, 2007.
Müller, K., Spindler, G., Maenhaut, W., Hitzenberger, R., Wieprecht, W., Baltensperger, U., and ten Brink, H.: INTERCOMP2000, a campaign to assess the comparability of methods in use in Europe for measuring aerosol composition, Atmos. Environ., 38, 6459–6466, https://doi.org/10.1016/j.atmosenv.2004.08.031, 2004.
Panteliadis, P., Hafkenscheid, T., Cary, B., Diapouli, E., Fischer, A., Favez, O., Quincey, P., Viana, M., Hitzenberger, R., Vecchi, R., Saraga, D., Sciare, J., Jaffrezo, J. L., John, A., Schwarz, J., Giannoni, M., Novak, J., Karanasiou, A., Fermo, P., and Maenhaut, W.: ECOC comparison exercise with identical thermal protocols after temperature offset correction – instrument diagnostics by in-depth evaluation of operational parameters, Atmos. Meas. Tech., 8, 779–792, https://doi.org/10.5194/amt-8-779-2015, 2015.
Petzold, A., Ogren, J. A., Fiebig, M., Laj, P., Li, S.-M., Baltensperger, U., Holzer-Popp, T., Kinne, S., Pappalardo, G., Sugimoto, N., Wehrli, C., Wiedensohler, A., and Zhang, X.-Y.: Recommendations for reporting “black carbon” measurements, Atmos. Chem. Phys., 13, 8365–8379, https://doi.org/10.5194/acp-13-8365-2013, 2013.
Pöschl, U.: Atmospheric Aerosols: Composition, Transformation, Climate and Health Effects, Angew. Chem. Int. Ed., 44, 7520–7540, https://doi.org/10.1002/anie.200501122, 2005.
Reisinger, P., Wonaschütz, A., Hitzenberger, R., Petzold, A., Bauer, H., Jankowski, N., Puxbaum, H., Chi, X., and Maenhaut, W.: Intercomparison of Measurement Techniques for Black or Elemental Carbon Under Urban Background Conditions in Wintertime: Influence of Biomass Combustion, Environ. Sci. Technol., 42, 884–889, https://doi.org/10.1021/es0715041, 2008.
Rosen, H. and Novakov, T.: Identification of primary particulate carbon and sulfate species by Raman spectroscopy, Atmos. Environ., 12, 923–927, https://doi.org/10.1016/0004-6981(78)90031-8, 1978.
Sadezky, A., Muckenhuber, H., Grothe, H., Niessner, R., and Pöschl, U.: Raman microspectroscopy of soot and related carbonaceous materials: Spectral analysis and structural information, Carbon, 43, 1731–1742, https://doi.org/10.1016/j.carbon.2005.02.018, 2005.
Schmid, J., Grob, B., and Niessner, R., Ivleva, N. P.: Multiwavelength Raman Microspectroscopy for Rapid Prediction of Soot Oxidation Reactivity, Anal. Chem., 83, 1173–1179, https://doi.org/10.1021/ac102939w, 2011.
Sommer, E.: Long Term Trends of Black and Brown Carbon Concentrations in the Urban Aerosol of Vienna, Master Thesis, University of Vienna, Vienna, Austria, 2020.
Statistik Austria: https://www.statistik.at/web_de/statistiken/energie_umwelt_innovation_mobilitaet/energie_und_umwelt/energie/energieeinsatz_der_haushalte/index.html, last access 18 February 2021.
Subramanian, R., Khlystov, A. Y., and Robinson, A. L.: Effect of Peak Inert-Mode Temperature on Elemental Carbon Measured Using Thermal-Optical Analysis, Aerosol Sci. Tech., 40, 763–780, https://doi.org/10.1080/02786820600714403, 2006.
Sun, J., Zhang, Y., Zhi, G., Hitzenberger, R., Jin, W., Chen, Y., Wang, L., Tian, C., Li, Z., Chen, R., Xiao, W., Cheng, Y., Yang, W., Yao, L., Cao, Y., Huang, D., Qiu, Y., Xu, J., Xia, X., Yang, X., Zhang, X., Zong, Z., Song, Y., and Wu, C.: Brown carbon's emission factors and optical characteristics in household biomass burning: developing a novel algorithm for estimating the contribution of brown carbon, Atmos. Chem. Phys., 21, 2329–2341, https://doi.org/10.5194/acp-21-2329-2021, 2021.
ten Brink, H., Maenhaut, W., Hitzenberger, R., Gnauk, T., Spindler, G., Even, A., Chi, X., Bauer, H., Puxbaum, H., Putaud, J.-P., Tursic, J., and Berner, A.: INTERCOMP2000: the comparability of methods in use in Europe for measuring the carbon content of aerosol, Atmos. Environ., 38, 6507–6519, https://doi.org/10.1016/j.atmosenv.2004.08.027, 2004.
Tuinstra, F. and Koenig, J. L.: Raman Spectrum of Graphite, J. Chem. Phys., 53, 1126–1130, https://doi.org/10.1063/1.1674108, 1970.
Venkatachari, P., Zhou, L., Hopke, P. K., Schwab, J. J., Demerjian, K. L., Weimer, S., Hogrefe, O., Felton, D., and Rattigan, O.: An Intercomparison of Measurement Methods for Carbonaceous Aerosol in the Ambient Air in New York City, Aerosol Sci. Tech., 40, 788–795, https://doi.org/10.1080/02786820500380289, 2006.
Wang, Y., Chung, A., and Paulson, S. E.: The effect of metal salts on quantification of elemental and organic carbon in diesel exhaust particles using thermal-optical evolved gas analysis, Atmos. Chem. Phys., 10, 11447–11457, https://doi.org/10.5194/acp-10-11447-2010, 2010.
Watson, J. G., Chow, J. C., and Chen, L.-W. A.: Summary of Organic and Elemental Carbon/Black Carbon Analysis Methods and Intercomparisons, Aerosol Air Qual. Res., 5, 65–102, https://doi.org/10.4209/aaqr.2005.06.0006, 2005.
WKO, Mineralölindustrie: https://www.wko.at/branchen/industrie/mineraloelindustrie/statistik.html, last access: 19 February 2020.
Wonaschütz, A., Hitzenberger, R., Bauer, H., Pouresmaeil, P., Klatzer, B., Caseiro, A., and Puxbaum, H.: Application of the Integrating Sphere Method to Separate the Contributions of Brown and Black Carbon in Atmospheric Aerosols, Environ. Sci. Technol., 43, 1141–1146, https://doi.org/10.1021/es8008503, 2009.
Yu, J. Z., Xu, J., and Yang, H.: Charring Characteristics of Atmospheric Organic Particulate Matter in Thermal Analysis, Environ. Sci. Technol., 36, 754–761, https://doi.org/10.1021/es015540q, 2002.
Zickler, G. A., Smarsly, B., Gierlinger, N., Peterlik, H., and Paris, O.: A reconsideration of the relationship between the crystallite size La of carbons determined by X-ray diffraction and Raman spectroscopy, Carbon, 44, 3239–3246, https://doi.org/10.1016/j.carbon.2006.06.029, 2006.