the Creative Commons Attribution 4.0 License.
the Creative Commons Attribution 4.0 License.
 | 07 Jun 2021
Assessing the sources of particles at an urban background site using both regulatory instruments and low-cost sensors – a comparative study
Dimitrios Bousiotis
Ajit Singh
Molly Haugen
David C. S. Beddows
Sebastián Diez
Killian L. Murphy
Pete M. Edwards
Adam Boies
Roy M. Harrison
Measurement and source apportionment of atmospheric pollutants are crucial for the assessment of air quality and the implementation of policies for their improvement. In most cases, such measurements use expensive regulatory-grade instruments, which makes it difficult to achieve wide spatial coverage. Low-cost sensors may provide a more affordable alternative, but their capability and reliability in separating distinct sources of particles have not been tested extensively yet. The present study examines the ability of a low-cost optical particle counter (OPC) to identify the sources of particles and conditions that affect particle concentrations at an urban background site in Birmingham, UK. To help evaluate the results, the same analysis is performed on data from a regulatory-grade instrument (SMPS, scanning mobility particle sizer) and compared to the outcomes from the OPC analysis. The analysis of the low-cost sensor data manages to separate periods and atmospheric conditions according to the level of pollution at the site. It also successfully identifies a number of sources for the observed particles, which were also identified using the regulatory-grade instruments. The low-cost sensor, due to the particle size range measured (0.35 to 40 µm), performed rather well in differentiating sources of particles with sizes greater than 1 µm, though its ability to distinguish their diurnal variation, as well as to separate sources of smaller particles, at the site was limited. The current level of source identification demonstrated makes the technique useful for background site studies, where larger particles with smaller temporal variations are of significant importance. This study highlights the current capability of low-cost sensors in source identification and differentiation using clustering approaches. Future directions towards particulate matter source apportionment using low-cost OPCs are highlighted.
- Article
(1471 KB) - Full-text XML
- Companion paper
-
Supplement
(1682 KB) - BibTeX
- EndNote


Particulate matter (PM) plays a dominant role in air quality and is known to cause adverse health effects (Dockery et al., 1993; Pascal et al., 2013; Wu et al., 2016; Zeger et al., 2008). As a result, regulatory limits are set for its concentrations, especially in urban areas (US EPA, 2012; WHO, 2006). For the implementation of such regulations, the identification of the sources of PM is required. To accomplish this, measurements of the concentrations of PM, typically alongside PM composition, in the area of study are conducted. Until recent years these measurements were typically made using regulatory-grade instruments which, while providing high quality data, are rather expensive, thereby limiting the number that could be deployed and consequently the spatial resolution of any measurement network. This increases the spatial interpolation uncertainty (Kanaroglou et al., 2005) and can result in inadequate connection between the levels of air pollution exposures and resulting health effects (Holstius et al., 2014), especially in complex urban environments (Harrison, 2017; Mueller et al., 2016). Additionally, many low- and middle-income countries are unable to invest the large economic assets currently required for source apportionment, even though in many of these countries the air quality is poor (Ghosh and Parida, 2015; Kan et al., 2009; Petkova et al., 2013; Pope et al., 2018; Singh et al., 2020).
In the past decade, the development of new and cheaper sensors for air quality monitoring has intensified. Many different sensors were introduced measuring either the number concentration or surface area of PM (or gas-phase species) (Jovašević-Stojanović et al., 2015; Lewis et al., 2018; Popoola et al., 2018). Overall, the low-cost PM sensors currently offer better comparison with regulatory-grade equipment compared to their gas-phase counterparts (Lewis et al., 2018). However, many shortcomings have been identified in their application, with the most common being the loss of accuracy in the measurements due to environmental conditions such as relative humidity (RH) variations or high PM concentrations (Castell et al., 2017; Crilley et al., 2018, 2020; Di Antonio et al., 2018; Hagan and Kroll, 2020; Miskell et al., 2017; Zheng et al., 2018). Measurements in ambient conditions also lead to discrepancies with research-grade instruments, which often measure in controlled environments that are air conditioned (U.S. Environmental Protection Agency, 2016). The reproducibility and variability of the outputs from sensors of the same type can also be problematic (Austin et al., 2015; Sousan et al., 2016; Wang et al., 2015). Therefore, the need for constant and careful calibration is repeatedly highlighted for many studies that evaluate the potential of low-cost sensors (Rai et al., 2017; Spinelle et al., 2015, 2017). When these calibration steps are implemented, low-cost sensors have been shown to provide reliable near real-time measurements, maintaining high correlations with research-grade instruments (Kelly et al., 2017; Malings et al., 2020; Sayahi et al., 2019) with the added advantages of the lower cost and portability.
Consequently, low-cost sensors have been successfully deployed in many studies for which the use of more expensive instruments was not feasible. There is a number of applications in low- and middle-income countries (e.g. Nagendra et al., 2019; Pope et al., 2018), in studies which included mobile measurements within the urban environment (Ionascu et al., 2018; Jerrett et al., 2017; Miskell et al., 2018), or studies of indoor air quality from multiple sites, such as the SKOMOBO project conducted in New Zealand, in which the air quality in schools was assessed (Weyers et al., 2018). The greatest advantage though is likely, as their name implies, their lower cost, which made possible the formation of a network of measuring stations (Feinberg et al., 2019; Kotsev et al., 2016; Moltchanov et al., 2015), increasing the spatial resolution and through new data analysis methods improving the mapping of air pollution up to a sub-neighbourhood level (Schneider et al., 2017; Shindler, 2019). Therefore, it is suggested that the development and use of low-cost sensors, either used individually or in conjunction with research-grade instruments (Snyder et al., 2013), have the potential to radically change the conventional approach of both pollution measuring and policymaking (Borrego et al., 2018; Kumar et al., 2015; Lagerspetz et al., 2019; Morawska et al., 2018), providing a more effective general public information and enhanced environmental awareness (Penza et al., 2014), even for countries with smaller budgets (Amegah, 2018).
As yet, studying the different sources of particles at a site with the use of data from low-cost sensors has not been widely attempted. Pope et al. (2018) managed to identify major pollution sources by studying the ratios of PM of different sizes provided by low-cost sensors, while Popoola et al. (2018) using a network of sensors identified the sources of pollution near Heathrow Airport in London, UK. Hagan et al. (2019), applying a statistical method (non-negative matrix factorisation) on low-cost sensor data, identified a combustion factor in a three-factor solution in New Delhi, India. The present study investigates the ability of low-cost sensors to provide measurements that can be used to identify the sources of pollution at a background site in Birmingham, UK, using clustering of particle size profiles. This method was successfully used in a number of previous studies, though with the use of measurements from research-grade instruments (Beddows et al., 2009, 2015; Von Bismarck-Osten and Weber, 2014; Dall'Osto et al., 2011, 2012; Sabaliauskas et al., 2013). To support the clustering method, chemical composition data from both research-grade and low-cost sensor instruments were used, as well as meteorological data from a closely located measurement station. Apart from attempting the source differentiation with low-cost sensor data, a direct comparison with the results from a similar analysis using research-grade instruments is also conducted to not only validate the results but also find the strengths and weaknesses of such an application.
2.1 Location of the site and instruments
The measurement site (Fig. 1), characterised as an urban background, is the Birmingham Air Quality Supersite (BAQS) located at the grounds of the University of Birmingham (52.45∘ N, 1.93∘ W), about 3 km southwest from the city centre (Alam et al., 2015). In the present study, measurements from the following instruments for the period 24 January to 12 March 2020 (the date range was chosen to avoid the effect of the lockdown due to COVID-19) were used (Table 1, a picture of the low-cost sensors used at BAQS is found in Fig. S1 in the Supplement).

Figure 1Map of the location of the Birmingham Air Quality Supersite (BAQS) in the UK (Map by © HERE).
Table 1List of the measuring instruments used in the present study.
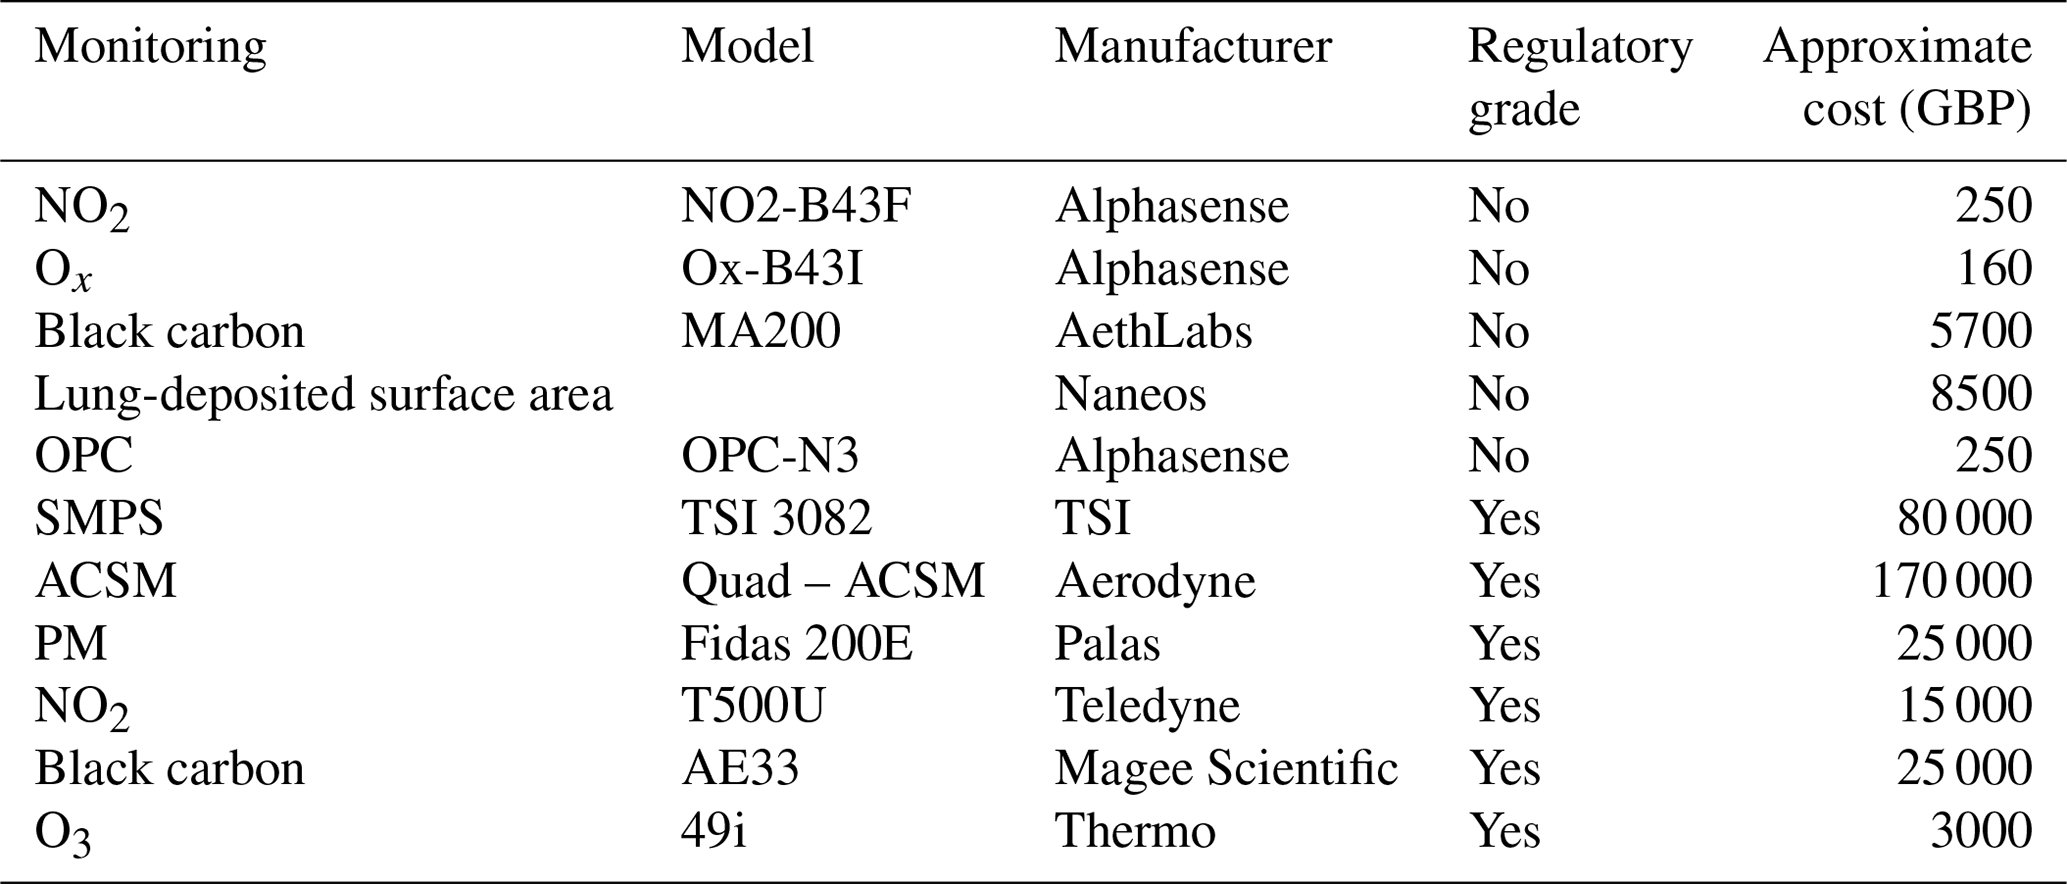
The Alphasense OPC-N3, which is an optical particle counter (OPC), measuring particle number concentrations in the size range between 0.35 and 40 µm at rates up to about 10 000 particles s−1. As the sample air stream enters the instrument with a sample flow rate of 210 mL m−1 (dynamically monitored and corrected by the sensor), it passes through a laser beam (wavelength at 658 nm). OPC-N3 measures the light scattered by individual particles carried in a sample air stream through a laser beam. These measurements are used to determine the particle size, related to the intensity of light scattered via a calibration based on Mie scattering theory and particle number concentration. Particle mass loadings (PM1, PM2.5 and PM10) are then calculated from the particle size spectra and concentration data, assuming a particle density and refractive index (default density is 1.65 g mL−1, and complex refractive index is 1.5+i0) (Alphasense, 2019). Particles of larger size are likely lost to impaction in the tubing prior to the OPC and thus are not considered. The OPC is located within the air-conditioned station, so measurements represent PM dry mass.
The AethLabs MA200 (microAeth MA200) provides black carbon (BC) information (0–1 mg BC m−3). The sample is deposited onto an internal filter, and an IR light (880 nm) is directed through the sample on the filter and into a detector on the other side of the sample. The amount of light absorbed from the sample is proportional to the BC concentration.
Two Naneos Partectors (Naneos Particle Solutions GmbH) provide the lung-deposited surface area metric (LDSA, µm2 cm−3) in the particle diameter range 10 nm to 10 µm. In general, the instrument charges particles with an efficiency proportional to the particle diameter to the power of 1.1 (d1.1) and is independent of particle composition (Todea et al., 2015; Geiss et al., 2016). The particle number concentration (N) is also provided for all particles, resulting in a Nd1.1 metric that can be correlated to LDSA. A catalytic stripper (Catalytic Instruments CS015) was used to remove the semi-volatile particles entering one of the two Naneos Partectors. The other Naneos Partector was not subject to the catalytic stripper and therefore measured the surface of all particles. In the present study, apart from the values provided directly from the sensors, the ratio between the measurements of the two Naneos Partectors was also considered according to
This was done to resolve whether such a configuration can also provide information such as the level of pollution or the age of the incoming air masses, as increased concentrations of semi-volatile compounds are usually associated with anthropogenic sources, especially in the urban environment (Harkov, 1989; Mahbub et al., 2011; Schnelle-Kreis et al., 2007; Xu and Zhang, 2011). Thus, a high LDSAratio is expected to be associated with fresher pollution, which usually has a higher content of volatile compounds (i.e. pollution sources at a close distance from the site), while lower ratios are probably associated with either cleaner conditions or more regional and aged pollution with higher concentrations of semi-volatile compounds, usually associated with sources at a greater distance from the measuring site. The specific metric though should be considered with caution, as it can be biased by the absolute surface areas measured.
The sensors monitoring nitrogen dioxide (NO2) and ozone (O3) concentrations are part of an Alphasense BOx of Clustered Sensors (BOCSs) (Smith et al., 2019), which is a low-power instrument based on multiple low-cost air pollution sensors allocated in two independent circuits to redundantly measure concentrations and other airflow parameters. The air is driven by a pump through the cell (air flow is about 4 L min−1) that hosts electrochemical (EC) sensors and the nondispersive infrared (NDIR) sensors. The EC sensors redundantly (six sensors per gas) measure carbon monoxide, NO2, nitrogen monoxide and oxidising gases (Ox), and the NDIR sensors measure carbon dioxide. EC sensors are based on recording the current generated by redox reactions that occur at the electrode–electrolyte interface in an electrochemical cell composed of three electrodes (working electrode (WE), counter electrode (CE) and reference electrode (RE)). While the gas of interest reacts on the WE surface, the CE completes the redox reaction, and the RE ensures that the WE potential remains in the proper range. In the present study, only the measurements of O3 (deriving from a linear regression of the values of the six Ox sensors with the measurements from the reference instrument also located at BAQS) and NO2 were used.
The Aethalometer, model AE33 by Magee Scientific, collects aerosol particles continuously by drawing the aerosol-laden air stream through a spot on the filter tape. It analyses the aerosol by measuring the transmission of light through one portion of the filter tape containing the sample versus the transmission through an unloaded portion of the filter tape acting as a reference area. This analysis is done at seven optical wavelengths spanning the range from the near-infrared to the near-ultraviolet. The Aethalometer calculates the instantaneous concentration of optically absorbing aerosols from the rate of change of the attenuation of light transmitted through the particle-laden filter.
For the same period, data from regulatory-grade instruments were also available. Thus, particle size composition data from a model TSI 3082 scanning mobility particle sizer (SMPS) in the size range 12–552 nm, along with PM data for the sizes of 1, 2.5, 4 and 10 µm acquired using a Fidas 200E, were used. Additionally, chemical composition data for NO2 and O3, as well as SO, NO and organic content (size range 40 nm to 1 µm), from an Aerodyne aerosol chemical speciation monitor (ACSM) were also available. Meteorological data (wind speed (WS) and direction, temperature, RH, and rain level) from the Birmingham Air Quality Supersite were also used in the characterisation of the clusters formed from both methods.
Planetary boundary layer (PBL) height data were downloaded from ECMWF's ERA5 (https://cds.climate.copernicus.eu/cdsapp#!/dataset/reanalysis-era5-single-levels, last access: 20 March 2021). Back-trajectory data calculated using the HYSPLIT model (Draxler and Hess, 1998) were extracted by the NOAA Air Resources Laboratory (https://ready.arl.noaa.gov/READYtransp.php, last access: 17 August 2020). Data were processed using the Openair package for R (Carslaw and Ropkins, 2012).
2.2 k-means clustering
In this study, two size spectra are considered: one deriving from the OPC and one from the regulatory-grade SMPS. It is noted that the size spectra from the two instruments only briefly overlap in the size range 350–552 nm, with the SMPS mostly measuring smaller particles and the OPC mostly measuring larger particles. For the time period studied (24 January–12 March 2020), 874 h of available data (averaged from 10 s intervals – 76 % coverage) from the OPC and 732 h from the SMPS (66 % coverage) were exposed to k-means clustering. k-means clustering is a method successfully used in many studies for particle source differentiation (Beddows et al., 2015; Brines et al., 2015, Von Bismarck-Osten and Weber, 2014; Giorio et al., 2015; Wegner et al., 2012) and has been shown to have better performance compared to other clustering techniques (Beddows et al., 2009; Salimi et al., 2014). The technique was found to produce clusters with the highest similarity between their elements and the highest separation against the other clusters formed (Hennig, 2007). It is a method of vector quantisation which aims to partition observations (x1, x2, ..., xn) into k sets, minimising within-cluster variances (squared Euclidean distances) as
where Si represents the sets (clusters) formed, and μi represents the centroid point of the cluster (Likas et al., 2003). k-means clustering in this study was performed using the “stats” library for R. The optimal number of clusters was chosen using two metrics: the Dunn index and the Silhouette width as proposed by Beddows et al. (2009). The Dunn index provides a measure of the ratio of the minimum cluster separation to the maximum cluster (providing a metric of the compactness and separation of the clusters formed within the space – Pakhira et al., 2004). The larger the Dunn index, the better separated are the clusters formed. The Silhouette width is a measure of the similarity of the spectra within each cluster (Rousseeuw, 1987). Both the Dunn index and Silhouette width were calculated using the “fpc” library for R. In the present study the best statistically fitted solution was chosen (the solution for which both metrics maximised), though in source differentiation studies such a solution may not always provide the best separation of all the available sources. Using the aforementioned statistical tests, a six-cluster solution was independently suggested for both the OPC and SMPS datasets. Although the clustering process could be applied for the Fidas data, which are comparable in size range, it was not performed in this study because of the limited size bin data of the Fidas instrument.
3.1 General conditions, sources of particles and pollution at the site
Being an urban background site, it presents relatively low concentrations of most pollutants (the average atmospheric conditions for each cluster formed by both methods is presented in Table 2), without the effect of direct sources of pollution, such as traffic. Wind rose and polar plots illustrating the conditions in the period studied are found in Fig. S2. The main source of pollution lies in the north and northeast sectors, where the city centre is located, as well as in the southern and eastern sectors, where a populous residential area is located. As a result, the main sources of NO2 and BC as well as the smaller-sized PM are associated with easterly winds (this though is not reflected in particles observed in the SMPS size range). For the PM10, apart from the aforementioned, increased concentrations are also found with southwestern winds likely associated with marine sources. Typical for the UK, the average wind profile for the period consists mainly of western and southwestern winds (McIntosh and Thom, 1969), reducing the effect of the pollution sources in the east of the site. Finally, the secondary pollutants NO and SO, which are in most cases associated with aged pollution and long-distance transport, have less consistent profiles, though they both seem to be mainly associated with southern wind directions. Finally, for the period studied no new particle formation (NPF) events were observed. This is consistent with the general trend in the area as found by Alam et al. (2003) for Birmingham (as well as in more recent studies by Bousiotis et al. (2019, 2021) at nearby sites in Oxford and London), in which NPF events in southern UK are more frequent during the summer months and barely occurring during winter and early spring, mainly due to unfavourable meteorological conditions.
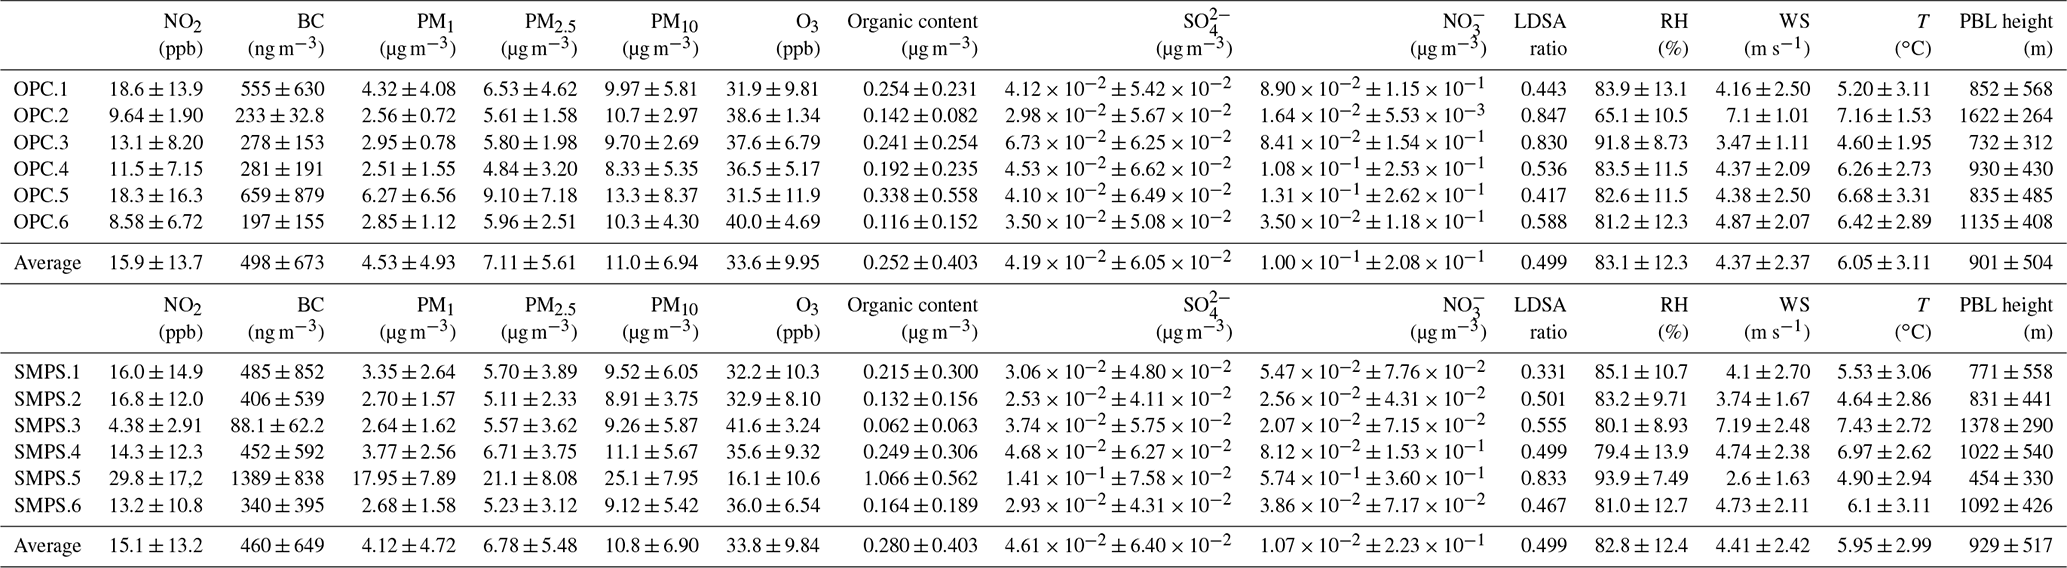
Table 2Average atmospheric conditions for the clusters formed by both methods.
3.2 Clustering of the OPC data
Due to the larger particle sizes measured by the OPC-N3, the differences in the cluster profiles are mainly associated with the particle number concentrations and to a lesser extent with the different peaks, which are less distinct due to the smaller variation found as particle diameter increases. The frequency of the clusters formed, as well as their diurnal occurrence, is shown in Fig. 2. The average particle size distribution spectra and wind roses for the clusters formed are found in Figs. S3 and S4.
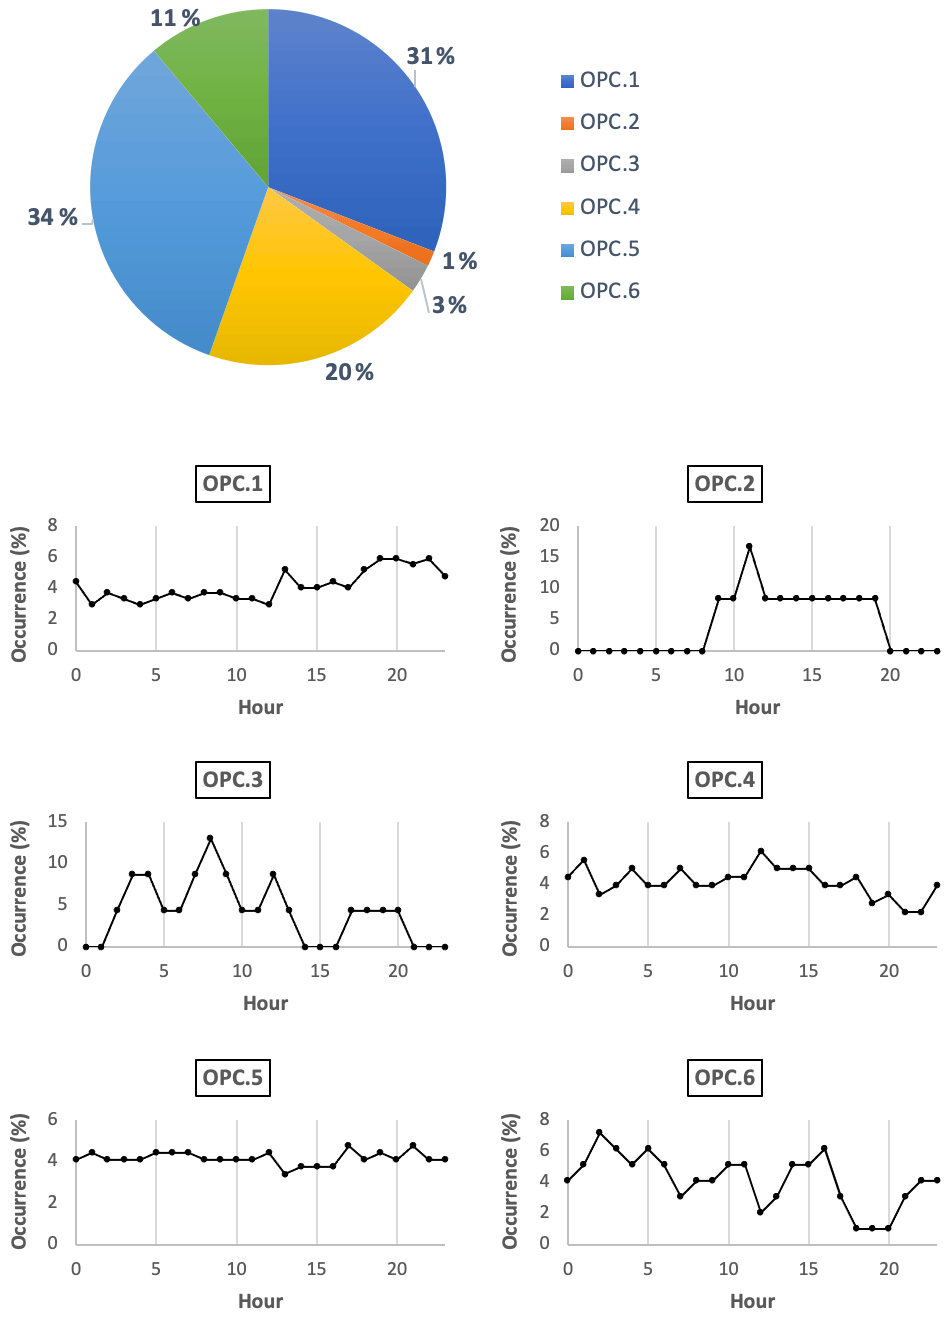
The six clusters formed from the OPC data are as follows:
-
OPC.1 is a rather polluted group with the highest NO2 concentrations and average secondary pollutants, PM and LDSA ratio. Its fresher polluted character is further confirmed using the SMPS data which showed higher-than-average particle concentrations for particles with diameters smaller than 50 nm. This group presents lower-than-average temperature, RH, and PBL height and slower-than-average southwestern winds, which is explained, to an extent, by the cluster being slightly more frequent during night-time.
-
OPC.2 refers mainly to a single midday event on 12 March 2020 (which explains the highest PBL height found) with high-speed southwestern winds, which are associated with lower pollution levels in the area (McGregor and Bamzelis, 1995), high temperature and very low RH. On this day the concentrations of all the pollutants were rather low, though due to the high wind speeds (an increase in the wind speed is observed at the start of the occurrence of this cluster – at 10:00 LT – which affects the particle distribution profile as can be seen in Fig. S5) the PM10 values were close to average (when PM1 and PM2.5 were rather low), indicating the stronger presence of coarser particles, possibly of marine origin, as shown by the back trajectories, which is a source with an increasing importance for larger-size PM in this area (Harrison et al., 2004; Taiwo et al., 2014). This group presents the highest LDSA ratio, which is in agreement with the low concentrations of the secondary pollutants.
-
OPC.3 is a group occurring mainly during some of the midday periods in January, with the lowest temperature and wind speed averages, as well as the highest average RH, containing both southwestern and southern winds. While the concentrations of the measured pollutants are close to average, high sulfate and ozone concentrations were found, with the former pointing to air masses with higher concentrations of aged pollutants assisted by the lowest PBL found for this cluster. The LDSA ratio, though, was found to be very high despite the higher concentrations of sulfate and nitrate. The near-average NO2 concentrations may point to the effect of a nearby pollution source that may have resulted in the increased LDSA ratio found.
-
OPC.4 is a group with low concentrations of NO2, BC and PM but close-to-average secondary pollutant concentrations. It is associated with close-to-average temperature, RH, PBL height and wind speed of mainly southwestern directions. It is slightly more frequent during daytime and has lower-than-average concentrations of particles in the SMPS range.
-
OPC.5 includes the most polluted conditions in the area throughout the day. It is associated with western and southwestern winds of average speed, high temperature and lower-than-average RH. Most pollutant concentrations, including PM, are rather high, while O3 is low. Similarly, it presents the highest concentrations of particles in all SMPS size ranges, which is probably due to the reduced atmospheric mixing in the lowest average PBL height among the OPC clusters. This cluster also includes the more polluted conditions found with northeastern winds.
-
OPC.6 is a group associated with rather clean conditions, presenting the lowest concentrations of NO2, BC, NO and organic content. It is associated with higher-than-average temperature, PBL height and wind speed and lower-than-average RH; it has low concentrations of PM1 and PM2.5, while the PM10 concentration is close to average. Its association with cleaner conditions (lower concentrations of the pollutants with available data) probably explains the highest O3 concentrations. The fast-moving southwestern air masses, which this group is associated with, are probably of marine origin that have not passed through any significant pollution sources, which can be further suggested by both the low LDSA values and the highest LDSA ratio.
3.3 Clustering of the SMPS data
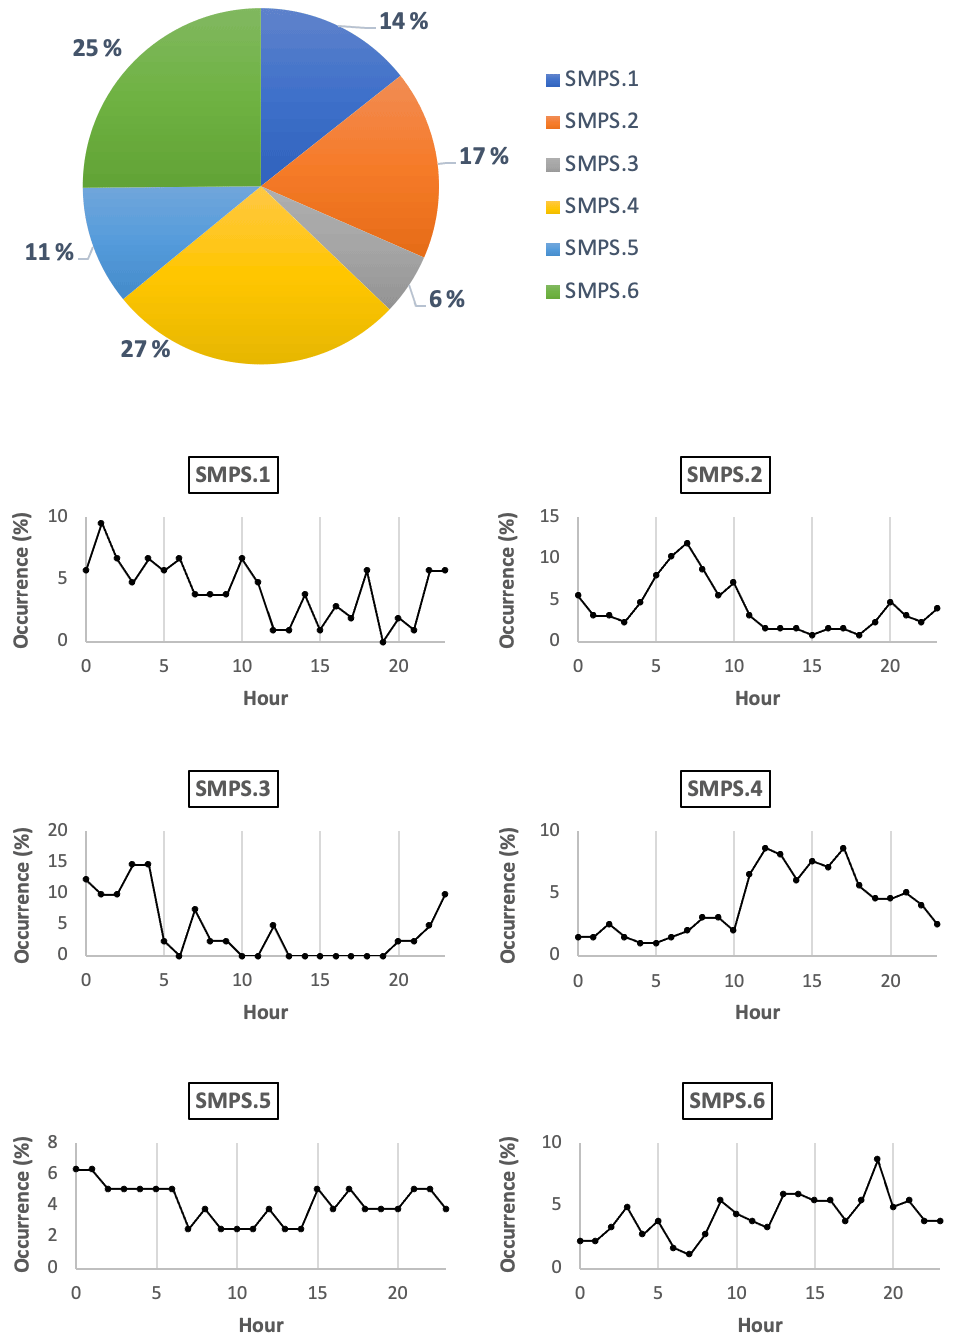
In the past, a number of studies on the sources of particles were conducted for both the greater area of Birmingham and specifically the site in the university (Harrison et al., 1997; Taiwo, 2016; Yin et al., 2010). As these studies mainly focused on the chemical composition of coarser particles, to the authors' knowledge this is the first study that uses ultrafine particle size distribution data to study the sources of particles in Birmingham, UK. The frequency and hourly occurrence of the six clusters formed from the SMPS data are found in Fig. 3. The average particle size distributions and wind roses for the clusters formed are found in Figs. S6 and S7.
-
SMPS.1 contains averagely polluted hours and is associated with fresher pollutants (such as NO2 or NO) and PM, while secondary pollutants such as NH, NO and SO are relatively low. Due to being associated with fresher emissions, this group presents higher-than-average concentrations of particles below 50 nm and a low LDSA ratio. It is associated with average southwestern winds (it also includes the small portion of northeastern winds) and temperature and higher-than-average RH, and it occurs more frequently during late night and early morning hours, which explains the low PBL height among the SMPS clusters.
-
SMPS.2 is similar to the first group, and average pollutant concentrations are found in this group with low concentrations of secondary pollutants. It is associated with slow western and southwestern winds and lower-than-average temperatures, RH, and PBL height, and it is more frequent during early morning hours. It has the highest concentrations of particles with diameters smaller than 20 nm, but the particle concentrations become relatively smaller as their size increases.
-
SMPS.3 is a small group containing very clean night hours mainly in February, with higher-than-average temperature, lower-than-average RH, strong western and southwestern winds, and a remarkably great PBL height for the time of the day. It has low concentrations of pollutants and PM apart from O3 (despite the time of day), though PM10 concentration is enhanced, probably associating this group with stronger marine origins. The particle concentrations of all size ranges below 500 nm are the lowest among the groups formed and, along with the high LDSA ratio, are in agreement with the very clean conditions associated with this cluster. This cluster, contrary to all others, presents two peaks: one peaking just below 30 nm and another one just over 100 nm, which indicates that it is probably associated with at least two different sources.
-
SMPS.4 presents near-average concentrations of all the pollutants studied. PM1 average concentration is rather low, while PM10 is higher than the average. It is associated with average-speed southwestern winds, higher-than-average temperature and PBL height, and low RH. It is more frequent during midday and evening hours, and it appears to represent the most common conditions in the area, hence having the highest frequency of all clusters.
-
SMPS.5 is a unique group associated with southern winds, the side at which the central part of the university resides. This is the most polluted group, probably affected by emissions from the university and the residential area found in that direction, assisted by the very low PBL height, with very high concentrations of all the pollutants (apart from O3), PM and ultrafine particles with available data. The LDSA ratio is very high, and this is probably due to the great surface area of the involatile component found. It is associated with very slow wind speeds, low temperature and very high RH, and it occurred evenly throughout the day, mainly on the first weeks of the campaign when pollution levels were rather high, probably due to increased heating emissions.
-
SMPS.6 presents low concentrations of all pollutants (apart from O3), PM and ultrafine particles with available data and is associated with western winds with higher-than-average speed, near-average temperatures and PBL height, and low RH. It occurred more frequently during evening hours and almost equally frequently throughout the whole study period apart from the first 2 weeks when pollution levels were rather high.
3.4 Direct comparison between the methods
Due to the difference in the size ranges measured by the SMPS and OPC instruments, it is evident that a direct comparison between the two methods would provide mixed results as some clusters found using the SMPS data are not detectable with the OPC and vice versa. The particle size range that is common between the two instruments lies at about 350–550 nm. Therefore, many particle sources associated with particles in the size range below the minimum detectable size of the OPC are not expected to be found using its data and vice versa. At a background site though, many of the sources of smaller-sized particles play a less important role as they are usually associated with fresher emissions, which are not common to such sites.
The clustering process attempts to separate the particle size distributions into groups with as similar spectral profiles as possible, while being as different to the other groups as possible. As expected, the SMPS is more capable of separating different cluster profiles at the size range smaller than 500 nm, a size range in which the cluster profiles (using the SMPS data) formed by the groups from the OPC are almost uniform (Fig. 4). This shows the limitation of the OPC data to distinguish ultrafine particle variations; thus, it does not provide insight for the sources of particles within this size range. On the other hand, the OPC performs much better in identifying different sources when considering larger particles in the range between 1–10 µm, for which it manages to clearly distinguish variations between the groups formed (Fig. 5). The clusters formed using the OPC data appear to be better associated with different sources of PM1 (Fig. 6), compared to those deriving from the SMPS data (Fig. S8), as distinct “hot spots” of PM1 are more clearly defined on the polar plots from the OPC compared to the less clear and mainly associated with calm (or almost calm) conditions from the SMPS (providing no separation among possible sources of PM1).
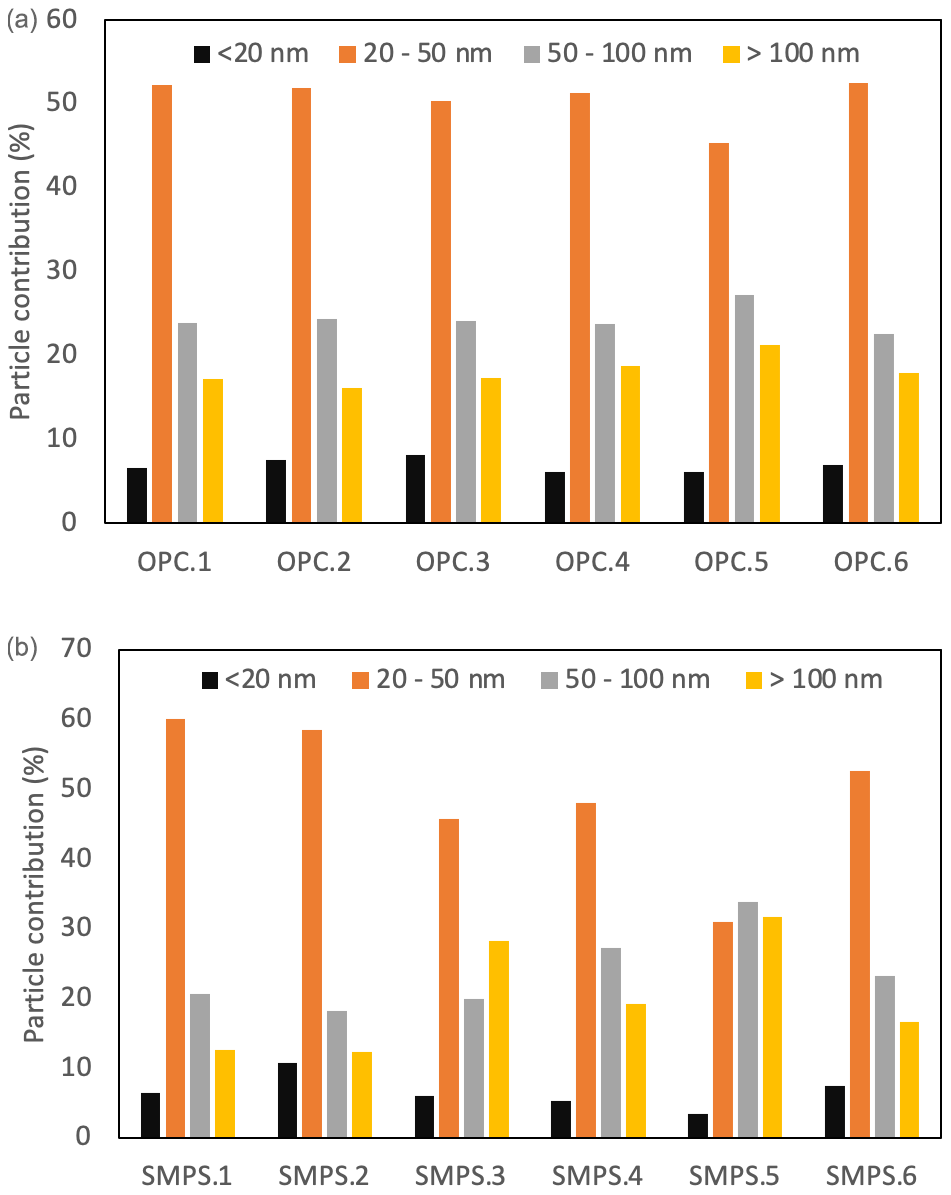
Figure 4Particle contributions in the range 12–550 nm (using the SMPS data) for the clusters formed using the OPC data (a) and the SMPS data (b).
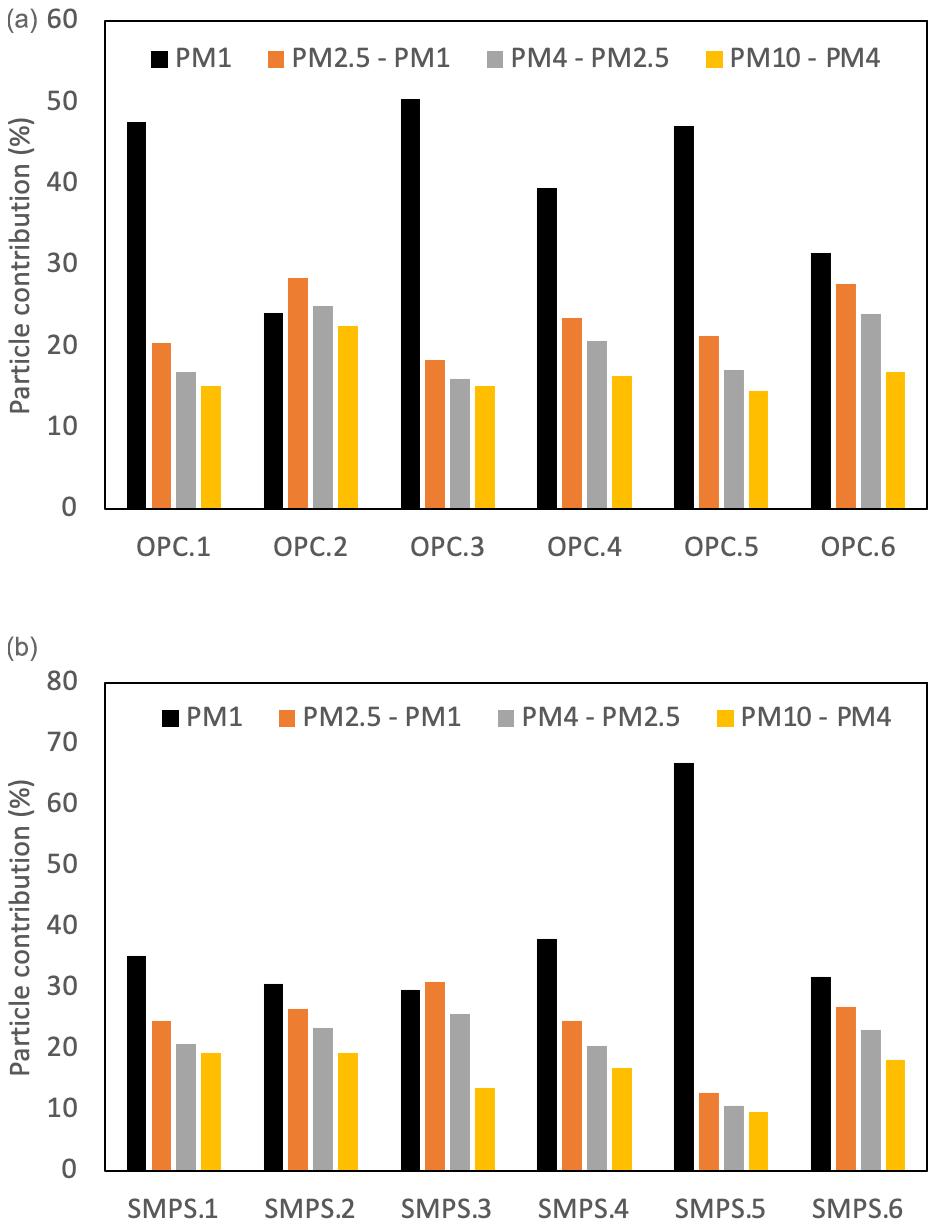
Figure 5Particle contributions in the range up to 10 µm (using the Fidas data) for the clusters formed using the OPC data (a) and the SMPS data (b).
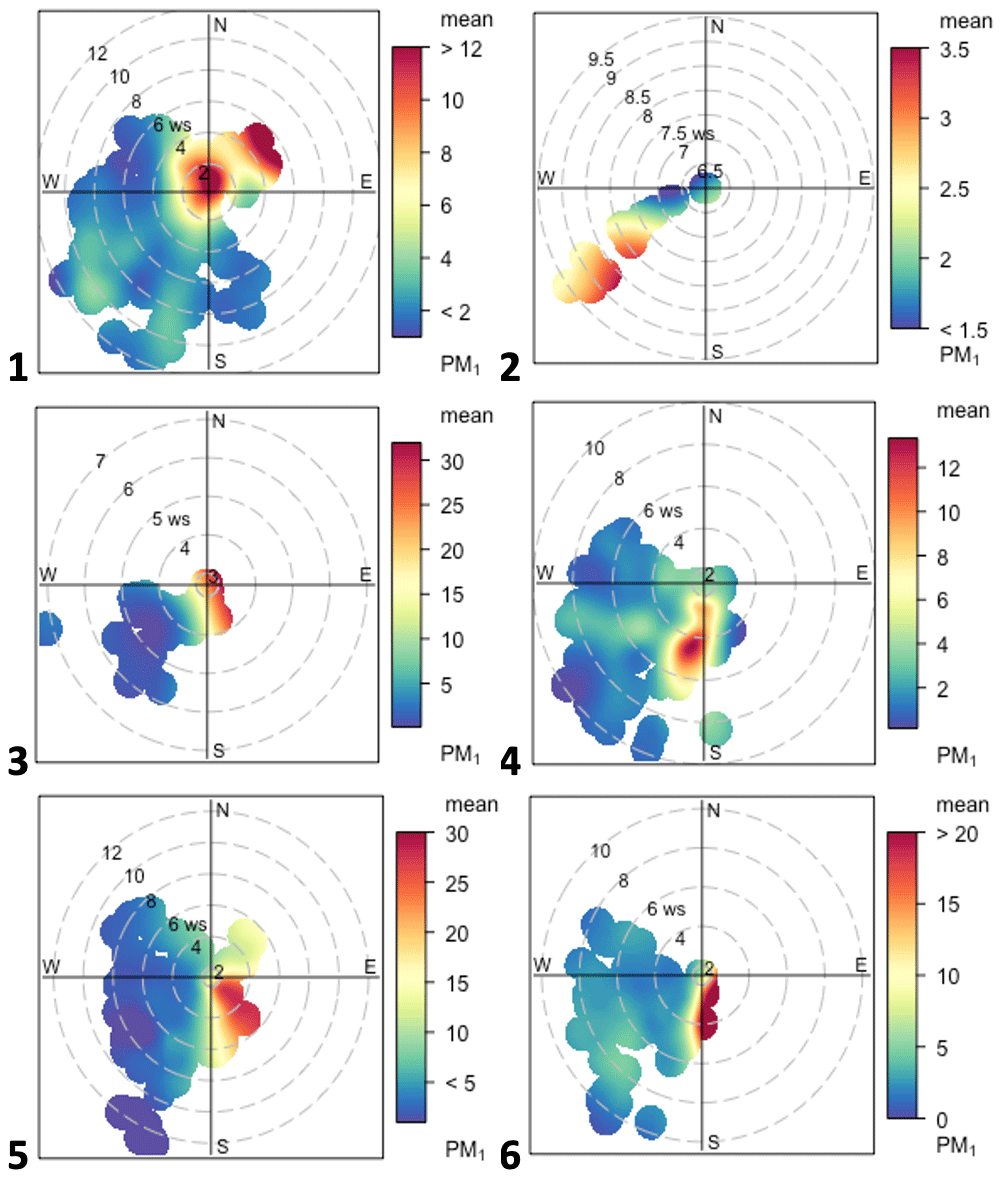
Table 3Simultaneous occurrences of the clusters formed by both the OPC and SMPS.
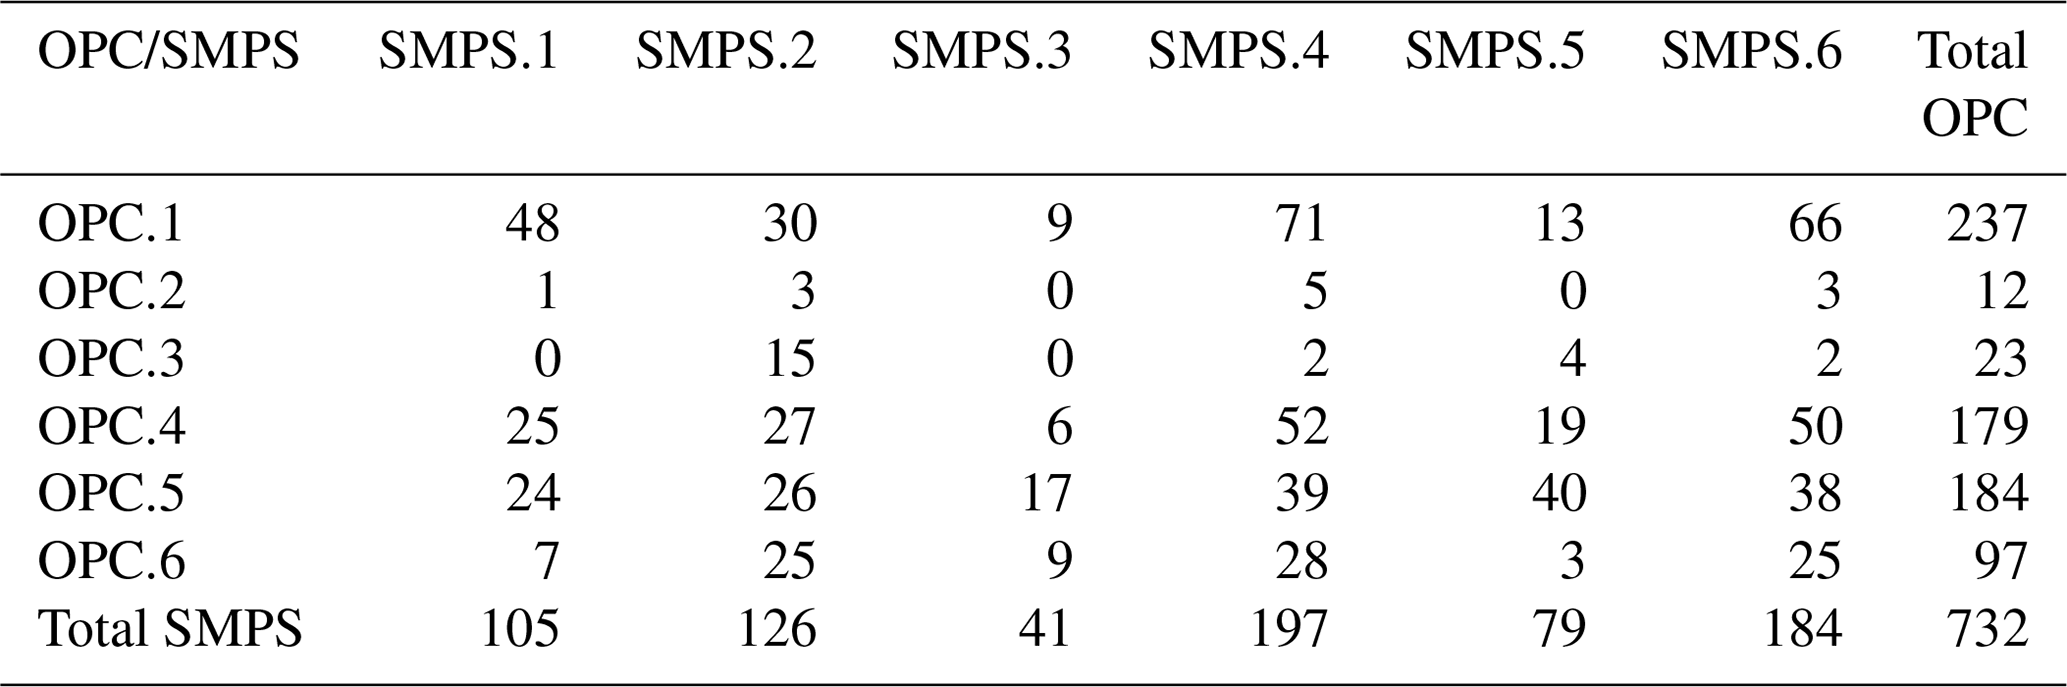
Table 3 contains the cluster relationships between the two methods, while Table S1 contains the conditions observed when pairs of clusters from both methods are considered. The OPC.2 and OPC.3 clusters appear infrequently, and it would be nonsensical to directly associate them with SMPS groups, as they appear under very specific conditions that are either not detected or are not identified as separate cases by the SMPS. As a result, they will be separately studied later in this study.
The OPC.1 was mainly associated with SMPS.4 and SMPS.6 and to a lesser extent with SMPS.1. OPC.1 has a somehow higher frequency during night times and it shares many of these hours with groups SMPS.4 and SMPS.6, while with SMPS.1 it mainly shares early morning hours. It includes the more polluted portion of the rather clean SMPS.6 and a portion with lower PM10 (though not much difference from average pollutant concentrations) from the more polluted SMPS.4. It is interesting that the variation between the subgroups (in relation to SMPS clusters) of the OPC.1 is very small for the NO2 concentrations, a pollutant for which its variations are not expected to be directly “visible” at the size range of the OPC as it is mainly associated with fresher emissions. No great variation was found for the wind direction in the subgroups of OPC.1, though it includes the lower-temperature and higher RH conditions of the SMPS clusters that it is associated with. The OPC.1 includes the relatively clean part of the more polluted SMPS.1 and the more polluted portion of the cleaner SMPS.6. While this does not provide a clear connection between the OPC and SMPS results, it shows that there is consistency in the results provided by the former in identifying particle sources of specific qualities.
Similarly, OPC.4 was mainly associated with SMPS.4 and SMPS.6. As the OPC.4 occurs under cleaner conditions, it includes the less polluted hours of both the SMPS clusters that it is mainly associated with, though the concentrations of the secondary pollutants such as NO and SO are closer to the average. The OPC.4 is associated with the cleaner portion of the aforementioned SMPS clusters with higher-than-average temperature and RH though with variable wind speeds.
OPC.5 represents a polluted group of hours associated mainly with SMPS.4, SMPS.5 and SMPS.6. Being a group of hours associated with higher concentrations of pollutants, it includes the more polluted portions of SMPS.4 and SMPS.6 with average meteorological conditions though lower wind speeds. It also coincides with the largest portion of SMPS.5, mainly in the sixth week when the temperature was the lowest, including the portion with the higher concentrations of organic content and NO. SMPS.5 is the group that is associated with southern wind directions, a side from which a source of secondary pollutants (NO, SO, NH), organic content and particles of diameter greater than 100 nm occurs. OPC.5 is associated with the part of SMPS.5 which is more burdened from secondary pollutants; hence, very large concentrations are observed for them.
Finally, OPC.6 is mainly associated with SMPS.2, SMPS.4 and SMPS.6. Being a cleaner group of hours, it includes the portion of these SMPS clusters with lower pollutant concentrations but higher PM10 concentrations (though with lower PM1 concentrations). These rather clean conditions, along with the western and southwestern high-speed winds on average and the large PM10 concentrations, further enhance the possible marine character of this cluster. Due to the size range of these particles, such variation is not clearly identified by the SMPS, resulting in them not being clearly separated when their data are considered.
The weekly contribution of each cluster group from the analysis of either dataset is found in Fig. 7, and the conditions on each week studied are shown in Table S2. It is evident that the variation from the SMPS is greater than that of the OPC, as the latter is less affected by the diurnal variations. It is apparent that it is easier to comprehend the clusters' variation in association with the levels of pollution in the site (the more polluted weeks have a greater portion of SMPS.1 and SMPS.5), while for those with lower concentrations of pollutants the SMPS.4 and SMPS.6 are more enhanced. These variations are harder to distinguish using the OPC data, as they are less apparent in the size range measured by the sensor. To further understand the possible sources using the latter, information from other instruments which provide chemical composition data are needed, though it is still hard to pinpoint exact sources, due to the OPC's weakness in explaining distinct particle sources within the day.
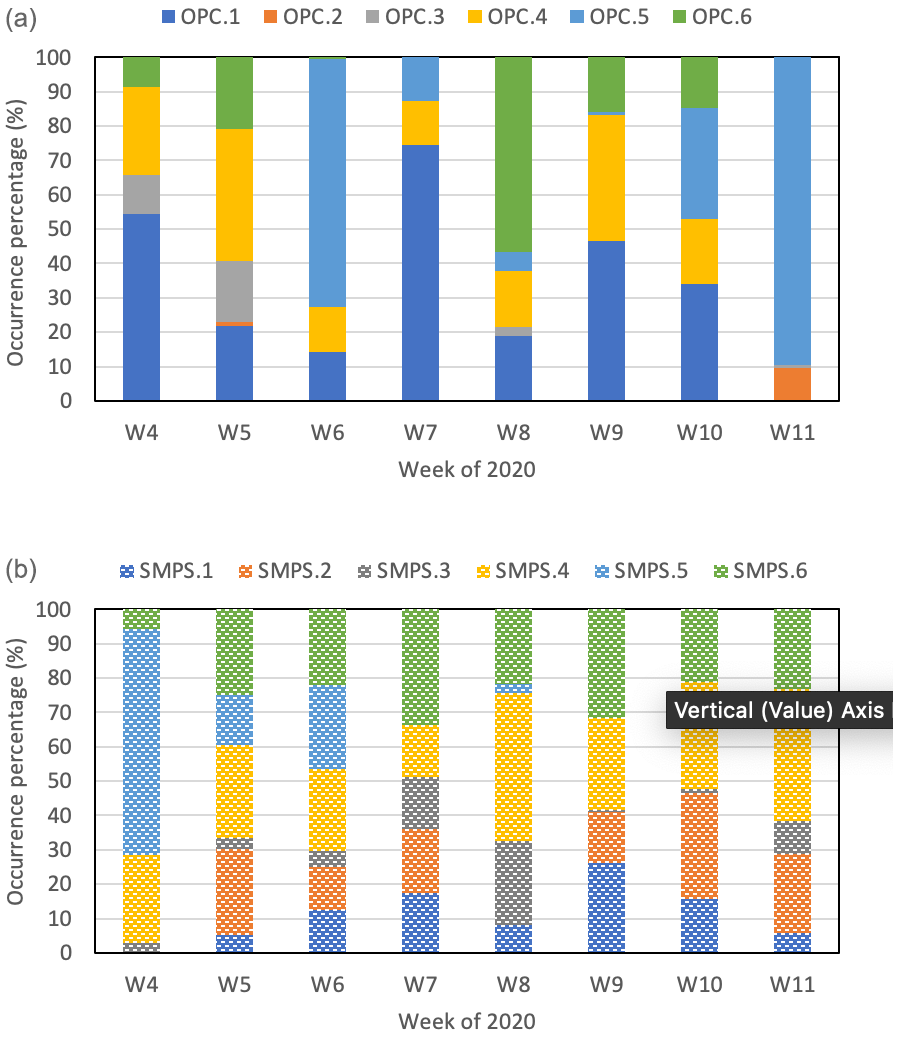
Figure 7Weekly contribution (week number refers to week of year 2020) of the clusters formed by the OPC (a) and SMPS (b).
3.5 Case studies
3.5.1 OPC.2
OPC.2 occurs mainly on a single day in March (12 March) with higher-than-average temperature and strong western winds. This was the cluster with the lowest concentrations of NH, NO (about an order of magnitude compared to average conditions), and SO; rather low concentrations of NO2 and BC; and high O3, which is probably the result of the strong winds and the very high PBL height assisting in the removal of the pollutants from the site. Using the SMPS data, this group of hours seems to follow the trends of BC, associating it with SMPS.6 for low concentrations, SMPS.1 and SMPS.2 for medium concentrations, and SMPS.4 for higher concentrations of BC. This cluster has very low PM1 and PM2.5 and near-average PM10 concentrations, probably associating it with marine sources (due to the high wind speed). Because to this, it is not clearly separated using the SMPS data, which it does so for the hours of this group according to the level of fresher pollutants, the variation of which is smaller in this type of environment. This cluster seems to be the result of the change in the wind profile which greatly affected the coarser particles at the site (Fig. S5).
3.5.2 OPC.3
The third cluster formed using the OPC data was a rather small group of hours in late January (25, 27 and 28 January), with the lowest average temperature, wind speed and PBL height compared to the rest of the clusters. The wind direction profile for this group contains both western and southern winds, with the latter being associated with high concentrations of pollutants (as found by the study of the SMPS data). The majority of the hours in this group (65 %) were characterised as freshly polluted when using the SMPS data, mainly associated with SMPS.2. Unfortunately, data of NO2, BC, O3 and PM for this group were very scarce from regulatory-grade instruments (due to instrument error – the results provided in Table 2 for the OPC.3 are only from 2 h of data that were available from the regulatory-grade instrument). The ACSM data, which were available for the hours of this cluster, pointed to marginally lower-than-average values of organic content, nitrate and ammonium, while the sulfate concentrations were rather high. Using the low-cost sensor data, it is found that this group has the highest BC (data from this low-cost sensor are not included) and involatile component of LDSA. This group also had the highest average particle concentration in the size range of the OPC, which is in agreement with the highest PM concentrations in all ranges (PM1, PM2.5, PM10) and is probably the result of the low wind speed and PBL height. As this is not visible from the SMPS, the cluster associated with this group has nearly average particle concentrations in the SMPS particle ranges. This group was not distinctively detected by the SMPS due to presenting variation in larger-sized particles, which can be one of the weaknesses of studying the sources of such particles using SMPS data alone. The OPC.3 appears to contain the more polluted slow-moving portion of SMPS.2 with enhanced SO, BC and PM concentrations.
3.5.3 SMPS.3
The third cluster from the analysis of SMPS data presented a unique profile with two peaks: one below 30 nm and one a bit over 100 nm. This unique group was associated with very clean conditions, with very low concentrations for all the pollutants with available data (apart from O3) and low particle concentrations for all the ranges in the SMPS and OPC range as well as PM1 and PM2.5. The concentrations of PM10 and SO were somehow higher but still lower than the average in the area for the period of the study. This group is associated with high average temperature and wind speed and rather low RH, with wind directions being mainly southwestern and western. This group occurred solely at night hours during a number of relatively warm nights mainly in February and to a lesser extend in March. Even with very low particle concentrations (as found by both the SMPS and OPC), the presence of two separate peaks in the size range of the ultrafine particles is indicative of more than one simultaneous source. Due to these sources of particles occurring at the ultrafine particle range, the OPC was not able to distinguish this special condition and grouped the hours of this cluster into a number of clusters (mainly OPC.5 and to a lesser extend OPC.1 and OPC.6), occurring either during night-time or throughout the day. The inability of the OPC to distinguish complicated conditions in the ultrafine range is a weakness of the OPC that should be considered when such conditions are anticipated.
As the SMPS measures smaller particle sizes and with enhanced accuracy compared to the OPC, it managed to better separate the different sources of fresher pollution with the main differentiating factor being the time of the day, for which the variability of such sources is more prominent. The differences in NO2 concentrations, which are mainly associated with fresher emissions, are more distinct between the groups; using this data, better separation of very clean (SMPS.3) and very polluted conditions from a distinct source (SMPS.5) was achieved, while the other groups described mostly average conditions with lesser variability (as expected in this range at a background site). Additionally, using the SMPS data, it is possible to distinguish multiple sources of ultrafine particles (SMPS.3), as they can appear as multiple peaks within the SMPS spectra. This is not possible using the OPC data, as the size range measured by this instrument cannot identify such cases.
Contrary to the SMPS, using the OPC data provided less distinct separation of fresher emissions (as expected due to the lack of data of small-sized particles). Additionally, the OPC data are less sensitive to diurnal variations due to the range of particles covered, which are in a size range that does not vary significantly through the day but between days. This results in the less distinct diurnal variations found between the groups formed. The analysis of the OPC data, though, managed to adequately separate conditions and/or sources associated with larger particles, such as aged pollution (for which it also managed to separate a small time window with very strong sulfate presence – OPC.3), which has the greatest contribution in the particle chemical composition for the study area (Harrison et al., 2003; Taiwo, 2016; Yin et al., 2010), RH variations or air masses of marine origin. To an extent, this might be due to the number of clusters chosen, as there is a possibility that a larger number of clusters from the SMPS may separate sources of larger particles better but with the risk of also separating similar sources. Additionally, the pollution levels of the clusters formed directly follow the trends of the PBL height in the area, which is a variation captured by both instruments, showing the importance of this variable in the air quality of an area.
To sum up, the study of SMPS data with k-means clustering is far superior at separating complex pollution sources within urban environments in which the variation of very small particles is crucial for identifying particle and emission sources. This advantage of the SMPS will not be overcome even with a denser measuring network of OPCs that could be acquired for the same cost of the SMPS. However, clustering of the OPC data can provide useful information to assess the sources of air pollution at background sites in which the direct (smaller) particle sources are few. The method managed to find sources of greater pollution associated with higher concentrations of particles of greater sizes (which are mainly associated with aged pollution), showing that the footprint of pollution in the ultrafine particle range can have a detectable effect in coarser particle distributions as well. While not as precise as the SMPS, a denser network of such instruments in background sites can be more beneficial and more cost efficient in studying multiple pollution sources or hot spots within the urban environment.
The current inability of low-cost PM sensors to measure particle size spectra at small sizes (< 300 nm) is the greatest drawback in their application for separating particle sources, since much information is contained in these smaller sizes. OPCs using shorter-wavelength light sources and hence smaller particle detection could be beneficial here. Also, there are several low-cost sensors that provide insight for the surface area or the total number of particles in the ultrafine particle size range (such as the LDSA sensor used in this study). The combined use of the OPC with these instruments, along with sophisticated statistical techniques, may provide possibilities for more precise source differentiation than shown in the present study.
It is noted that while clustering of particle number size distributions is one approach in the study of the source assessment of particles, other alternative methods, such as the positive matrix factorisation (PMF), may also provide useful results.
The present study investigates the capabilities of a low-cost OPC sensor for source differentiation at an urban background site in Birmingham, UK. It is used alongside a regulatory-grade SMPS instrument, which has previously been used successfully for source differentiation. The clustering approach identified optimal solutions of six clusters for both the SMPS and OPC data. There were similarities between the SMPS and OPC solutions, which provide insights into periods of low and high pollution. However, large differences were also observed. A more distinct separation of direct emission sources was achieved using the SMPS data, which identified sources with time windows that correlated with extreme NO2 concentrations (either high or low), as well as periods with more complex sources. The OPC was able to distinguish time periods with greater variation of supermicron-sized particle sources (e.g. marine sources). There seems to be a clearer distinction of the diurnal variability of sources using the SMPS data, while the OPC seems to be able to only distinguish the variability within periods of days rather than hours, as found by the less variable diurnal and weekly variation. This, though, might not be a great drawback when considering background sites, as this variability is smaller in such environments which are mainly affected by regional pollution, while the local emissions are less and more distinct. Low-cost sensors can be a reliable alternative for source identification studies in environments with less complex sources, which present smaller alterations within the span of the day. Still, such instruments cannot be used for scientific analyses, which require greater precision. Their application will probably be adequate when studying the sources of particles with a more regional character (e.g. marine sources) rather than direct and variable sources (e.g. traffic or cooking emissions) and can provide enough information for the air quality levels, sources and conditions that these are anticipated from. Such studies may include the analysis of mineral dust events resulting from either anthropogenic activities or meteorological events (e.g. dust storms), bioaerosol events in forested areas and other sources which affect mainly the composition of coarser particles.
This study demonstrates that single low-cost sensor PM units can provide sensible source differentiation of large-sized PM pollution sources. This allows for the prospect of source apportionment via networks of low-cost sensors in the near future, thereby allowing triangulation of sources. The development of more sophisticated low-cost sensors in conjunction with their low cost ensures the application of a denser measurement network, making better air quality monitoring and control feasible in the near future. However, this requires additional studies, which can further elucidate the strengths and weaknesses of those sensors compared to the regulatory-grade ones, as they develop.
Data supporting this publication are openly available from the UBIRA eData repository at https://doi.org/10.25500/edata.bham.00000584 (Pope and Bousiotis, 2021).
The supplement related to this article is available online at: https://doi.org/10.5194/amt-14-4139-2021-supplement.
The study was conceived and planned by FDP, who also contributed to the final article, and DB, who also carried out the analysis and prepared the first draft. AS, MH, DCSB, KLM and SD have provided the data for the analysis. DCSB provided help with the analysis of the data. RMH provided advice on the analysis. PME and AB contributed to the final article.
The authors declare that they have no conflict of interest.
We thank the OSCA team (Integrated Research Observation System for Clean Air) at the Birmingham Air Quality Supersite (BAQS), funded by NERC (NE/T001909/1), for help in data collection for the regulatory-grade instruments. We thank Lee Chapman for access to his meteorological dataset used in the analysis.
This research has been supported by the Natural Environment Research Council (grant no. NE/T001879/1) and the Engineering and Physical Sciences Research Council (grant no. EP/T030100/1).
This paper was edited by Daniela Famulari and reviewed by two anonymous referees.
Alam, A., Shi, J. P., and Harrison, R. M.: Observations of new particle formation in urban air, J. Geophys. Res.-Atmos., 108, 4093, https://doi.org/10.1029/2001JD001417, 2003.
Alam, M. S., Keyte, I. J., Yin, J., Stark, C., Jones, A. M., and Harrison, R. M.: Diurnal variability of polycyclic aromatic compound (PAC) concentrations: Relationship with meteorological conditions and inferred sources, Atmos. Environ., 122, 427–438, https://doi.org/10.1016/j.atmosenv.2015.09.050, 2015.
Alphasense: User Manual for OPC-N3 Optical Particle Counter, Alphasense Ltd., 072-0502, 32 pp., Essex, UK, 2019.
Amegah, A. K.: Proliferation of low-cost sensors. What prospects for air pollution epidemiologic research in Sub-Saharan Africa?, Environ. Pollut., 241, 1132–1137, https://doi.org/10.1016/j.envpol.2018.06.044, 2018.
Austin, E., Novosselov, I., Seto, E., and Yost, M. G.: Laboratory evaluation of the Shinyei PPD42NS low-cost particulate matter sensor, PLoS One, 10, 1–17, https://doi.org/10.1371/journal.pone.0137789, 2015.
Beddows, D. C. S., Dall'Osto, M., and Harrison, R. M.: Cluster analysis of rural, urban, and curbside atmospheric particle size data, Environ. Sci. Technol., 43, 4694–4700, https://doi.org/10.1021/es803121t, 2009.
Beddows, D. C. S., Harrison, R. M., Green, D. C., and Fuller, G. W.: Receptor modelling of both particle composition and size distribution from a background site in London, UK, Atmos. Chem. Phys., 15, 10107–10125, https://doi.org/10.5194/acp-15-10107-2015, 2015.
Borrego, C., Ginja, J., Coutinho, M., Ribeiro, C., Karatzas, K., Sioumis, T., Katsifarakis, N., Konstantinidis, K., De Vito, S., Esposito, E., Salvato, M., Smith, P., André, N., Gérard, P., Francis, L. A., Castell, N., Schneider, P., Viana, M., Minguillón, M. C., Reimringer, W., Otjes, R. P., von Sicard, O., Pohle, R., Elen, B., Suriano, D., Pfister, V., Prato, M., Dipinto, S., and Penza, M.: Assessment of air quality microsensors versus reference methods: The EuNetAir Joint Exercise – Part II, Atmos. Environ., 193, 127–142, https://doi.org/10.1016/j.atmosenv.2018.08.028, 2018.
Bousiotis, D., Dall'Osto, M., Beddows, D. C. S., Pope, F. D., and Harrison, R. M.: Analysis of new particle formation (NPF) events at nearby rural, urban background and urban roadside sites, Atmos. Chem. Phys., 19, 5679–5694, https://doi.org/10.5194/acp-19-5679-2019, 2019.
Bousiotis, D., Brean, J., Pope, F. D., Dall'Osto, M., Querol, X., Alastuey, A., Perez, N., Petäjä, T., Massling, A., Nøjgaard, J. K., Nordstrøm, C., Kouvarakis, G., Vratolis, S., Eleftheriadis, K., Niemi, J. V., Portin, H., Wiedensohler, A., Weinhold, K., Merkel, M., Tuch, T., and Harrison, R. M.: The effect of meteorological conditions and atmospheric composition in the occurrence and development of new particle formation (NPF) events in Europe, Atmos. Chem. Phys., 21, 3345–3370, https://doi.org/10.5194/acp-21-3345-2021, 2021.
Brines, M., Dall'Osto, M., Beddows, D. C. S., Harrison, R. M., Gómez-Moreno, F., Núñez, L., Artíñano, B., Costabile, F., Gobbi, G. P., Salimi, F., Morawska, L., Sioutas, C., and Querol, X.: Traffic and nucleation events as main sources of ultrafine particles in high-insolation developed world cities, Atmos. Chem. Phys., 15, 5929–5945, https://doi.org/10.5194/acp-15-5929-2015, 2015.
Carslaw, D. C. and Ropkins, K.: openair – An R package for air quality data analysis, Environ. Model. Softw., 27–28, 52–61, https://doi.org/10.1016/j.envsoft.2011.09.008, 2012.
Castell, N., Dauge, F. R., Schneider, P., Vogt, M., Lerner, U., Fishbain, B., Broday, D., and Bartonova, A.: Can commercial low-cost sensor platforms contribute to air quality monitoring and exposure estimates?, Environ. Int., 99, 293–302, https://doi.org/10.1016/j.envint.2016.12.007, 2017.
Crilley, L. R., Shaw, M., Pound, R., Kramer, L. J., Price, R., Young, S., Lewis, A. C., and Pope, F. D.: Evaluation of a low-cost optical particle counter (Alphasense OPC-N2) for ambient air monitoring, Atmos. Meas. Tech., 11, 709–720, https://doi.org/10.5194/amt-11-709-2018, 2018.
Crilley, L. R., Singh, A., Kramer, L. J., Shaw, M. D., Alam, M. S., Apte, J. S., Bloss, W. J., Hildebrandt Ruiz, L., Fu, P., Fu, W., Gani, S., Gatari, M., Ilyinskaya, E., Lewis, A. C., Ng'ang'a, D., Sun, Y., Whitty, R. C. W., Yue, S., Young, S., and Pope, F. D.: Effect of aerosol composition on the performance of low-cost optical particle counter correction factors, Atmos. Meas. Tech., 13, 1181–1193, https://doi.org/10.5194/amt-13-1181-2020, 2020.
Dall'Osto, M., Monahan, C., Greaney, R., Beddows, D. C. S., Harrison, R. M., Ceburnis, D., and O'Dowd, C. D.: A statistical analysis of North East Atlantic (submicron) aerosol size distributions, Atmos. Chem. Phys., 11, 12567–12578, https://doi.org/10.5194/acp-11-12567-2011, 2011.
Dall'Osto, M., Beddows, D. C. S., Pey, J., Rodriguez, S., Alastuey, A., Harrison, R. M., and Querol, X.: Urban aerosol size distributions over the Mediterranean city of Barcelona, NE Spain, Atmos. Chem. Phys., 12, 10693–10707, https://doi.org/10.5194/acp-12-10693-2012, 2012.
Di Antonio, A., Popoola, O. A. M., Ouyang, B., Saffell, J., and Jones, R. L.: Developing a relative humidity correction for low-cost sensors measuring ambient particulate matter, Sensors (Switzerland), 18, 2790, https://doi.org/10.3390/s18092790, 2018.
Dockery, D. W., Pope III, C. A., Xu, X., Spengler, J. D., Ware, J. H., Fay, M. E., G., F. B., and E., S. F.: An association between air pollution and mortality in six U.S. cities, N. Engl. J. Med., 329, 1753–1759, 1993.
Draxler, R. R. and Hess, G. D.: An Overview of the HYSPLIT_4 Modelling System for Trajectories, Dispersion, and Deposition, Aust. Meteorol. Mag., 47, 295–308, 1998.
Feinberg, S. N., Williams, R., Hagler, G., Low, J., Smith, L., Brown, R., Garver, D., Davis, M., Morton, M., Schaefer, J., and Campbell, J.: Examining spatiotemporal variability of urban particulate matter and application of high-time resolution data from a network of low-cost air pollution sensors, Atmos. Environ., 213, 579–584, https://doi.org/10.1016/j.atmosenv.2019.06.026, 2019.
Geiss, O., Bianchi, I., and Barrero-Moreno, J.: Lung-deposited surface area concentration measurements in selected occupational and non-occupational environments, J. Aerosol Sci., 96, 24–37, https://doi.org/10.1016/j.jaerosci.2016.02.007, 2016.
Ghosh, D. and Parida, P.: Air Pollution and India: Current Scenario, Int. J. Curr. Res., 7, 22194–22196, 2015.
Giorio, C., Tapparo, A., Dallosto, M., Beddows, D. C. S., Esser-Gietl, J. K., Healy, R. M., and Harrison, R. M.: Local and regional components of aerosol in a heavily trafficked street canyon in central London derived from PMF and cluster analysis of single-particle ATOFMS spectra, Environ. Sci. Technol., 49, 3330–3340, https://doi.org/10.1021/es506249z, 2015.
Hagan, D. H. and Kroll, J. H.: Assessing the accuracy of low-cost optical particle sensors using a physics-based approach, Atmos. Meas. Tech., 13, 6343–6355, https://doi.org/10.5194/amt-13-6343-2020, 2020.
Hagan, D. H., Gani, S., Bhandari, S., Patel, K., Habib, G., Apte, J. S., Hildebrandt Ruiz, L., and Kroll, J. H.: Inferring Aerosol Sources from Low-Cost Air Quality Sensor Measurements: A Case Study in Delhi, India, Environ. Sci. Technol. Lett., 6, 467–472, https://doi.org/10.1021/acs.estlett.9b00393, 2019.
Harkov R.: Semivolatile Organic Compounds in the Atmosphere, in: Air Pollution. The Handbook of Environmental Chemistry, vol. 4/4B, Springer, Berlin, Heidelberg, Germany, https://doi.org/10.1007/978-3-540-46113-5_2, 1989.
Harrison, R. M.: Urban atmospheric chemistry: a very special case for study, npj Clim. Atmos. Sci., 1, 20175, https://doi.org/10.1038/s41612-017-0010-8, 2017.
Harrison, R. M., Deacon, A. R., Jones, M. R., and Appleby, R. S.: Sources and processes affection concentrations of PM10 and PM2.5 particulate matter in Birmingham (U.K.), Atmos. Environ., 31, 4103–4117, https://doi.org/10.1016/S1352-2310(97)00296-3, 1997.
Harrison, R. M., Jones, A. M., and Lawrence, R. G.: A pragmatic mass closure model for airborne particulate matter at urban background and roadside sites, Atmos. Environ., 37, 4927–4933, https://doi.org/10.1016/j.atmosenv.2003.08.025, 2003.
Harrison, R. M., Jones, A. M., and Lawrence, R. G.: Major component composition of PM10 and PM2.5 from roadside and urban background sites, Atmos. Environ., 38, 4531–4538, https://doi.org/10.1016/j.atmosenv.2004.05.022, 2004.
Hennig, C.: Cluster-wise assessment of cluster stability, Comput. Stat. Data An., 52, 258–271, https://doi.org/10.1016/j.csda.2006.11.025, 2007.
Holstius, D. M., Pillarisetti, A., Smith, K. R., and Seto, E.: Field calibrations of a low-cost aerosol sensor at a regulatory monitoring site in California, Atmos. Meas. Tech., 7, 1121–1131, https://doi.org/10.5194/amt-7-1121-2014, 2014.
Ionascu, M. E., Gruicin, I., and Marcu, M.: Laboratory evaluation and calibration of low-cost sensors for air quality measurement, SACI 2018 – IEEE 12th Int. Symp. Appl. Comput. Intell. Informatics, 17–19 May 2018, Timisoara, Romania, Proc., 395–400, https://doi.org/10.1109/SACI.2018.8440974, 2018.
Jerrett, M., Donaire-Gonzalez, D., Popoola, O., Jones, R., Cohen, R. C., Almanza, E., de Nazelle, A., Mead, I., Carrasco-Turigas, G., Cole-Hunter, T., Triguero-Mas, M., Seto, E., and Nieuwenhuijsen, M.: Validating novel air pollution sensors to improve exposure estimates for epidemiological analyses and citizen science, Environ. Res., 158, 286–294, https://doi.org/10.1016/j.envres.2017.04.023, 2017.
Jovašević-Stojanović, M., Bartonova, A., Topalović, D., Lazović, I., Pokrić, B., and Ristovski, Z.: On the use of small and cheaper sensors and devices for indicative citizen-based monitoring of respirable particulate matter, Environ. Pollut., 206, 696–704, https://doi.org/10.1016/j.envpol.2015.08.035, 2015.
Kan, H., Chen, B., and Hong, C.: Health impact of outdoor air pollution in China: Current knowledge and future research needs, Environ. Health Perspect., 117, 12737, https://doi.org/10.1289/ehp.12737, 2009.
Kanaroglou, P. S., Jerrett, M., Morrison, J., Beckerman, B., Arain, M. A., Gilbert, N. L., and Brook, J. R.: Establishing an air pollution monitoring network for intra-urban population exposure assessment: A location-allocation approach, Atmos. Environ., 39, 2399–2409, https://doi.org/10.1016/j.atmosenv.2004.06.049, 2005.
Kelly, K. E., Whitaker, J., Petty, A., Widmer, C., Dybwad, A., Sleeth, D., Martin, R., and Butterfield, A.: Ambient and laboratory evaluation of a low-cost particulate matter sensor, Environ. Pollut., 221, 491–500, https://doi.org/10.1016/j.envpol.2016.12.039, 2017.
Kotsev, A., Schade, S., Craglia, M., Gerboles, M., Spinelle, L., and Signorini, M.: Next generation air quality platform: Openness and interoperability for the internet of things, Sensors (Switzerland), 16, 403, https://doi.org/10.3390/s16030403, 2016.
Kumar, P., Morawska, L., Martani, C., Biskos, G., Neophytou, M., Di Sabatino, S., Bell, M., Norford, L., and Britter, R.: The rise of low-cost sensing for managing air pollution in cities, Environ. Int., 75, 199–205, https://doi.org/10.1016/j.envint.2014.11.019, 2015.
Lagerspetz, E., Motlagh, N. H., Arbayani Zaidan, M., Fung, P. L., Mineraud, J., Varjonen, S., Siekkinen, M., Nurmi, P., Matsumi, Y., Tarkoma, S., and Hussein, T.: MegaSense: Feasibility of Low-Cost Sensors for Pollution Hot-spot Detection, IEEE Int. Conf. Ind. Informatics, 22–25 July 2019, Helsinki, Finland, 1083–1090, https://doi.org/10.1109/INDIN41052.2019.8971963, 2019.
Lewis, A. C., von Schneidemesser, E., Peltier, R. E., Lung, C., Jones, R., Zellweger, C., Karppinen, A., Penza, M., Dye, T., Hüglin, C., Ning, Z., Leigh, R., Hagan, D. H., Laurent, O., and Carmichael, G.: Low-cost sensors for the measurement of atmospheric composition: overview of topic and future applications, available at: https://www.ccacoalition.org/en/resources/low- cost-sensors-measurement-atmospheric-composition-overview-topic-and-future (last access: 1 June 2021), 2018.
Likas, A., Vlassis, N., and Verbeek, J. J.: The global k-means clustering algorithm, Pattern Recogn., 36, 451-461, https://doi.org/10.1016/S0031-3203(02)00060-2, 2003.
Mahbub, P., Ayoko, G. A., Goonetilleke, A., and Egodawatta, P.: Analysis of the build-up of semi and non volatile organic compounds on urban roads, Water Res., 45, 2835–2844, https://doi.org/10.1016/j.watres.2011.02.033, 2011.
Malings, C., Tanzer, R., Hauryliuk, A., Saha, P. K., Robinson, A. L., Presto, A. A., and Subramanian, R.: Fine particle mass monitoring with low-cost sensors: Corrections and long-term performance evaluation, Aerosol Sci. Technol., 54, 160–174, https://doi.org/10.1080/02786826.2019.1623863, 2020.
McGregor, G. R. and Bamzelis, D.: Synoptic typing and its application to the investigation of weather air pollution relationships, Birmingham, United Kingdom, Theor. Appl. Climatol., 51, 223–236, 1995.
McIntosh, D. H. and Thom, A. S.: Essentials of meteorology, Wykeham Publications, London, UK, 96, 773–773, https://doi.org/10.1002/qj.49709641028, 1969.
Miskell, G., Salmond, J., and Williams, D. E.: Low-cost sensors and crowd-sourced data: Observations of siting impacts on a network of air-quality instruments, Sci. Total Environ., 575, 1119–1129, https://doi.org/10.1016/j.scitotenv.2016.09.177, 2017.
Miskell, G., Salmond, J. A., and Williams, D. E.: Use of a handheld low-cost sensor to explore the effect of urban design features on local-scale spatial and temporal air quality variability, Sci. Total Environ., 619–620, 480–490, https://doi.org/10.1016/j.scitotenv.2017.11.024, 2018.
Moltchanov, S., Levy, I., Etzion, Y., Lerner, U., Broday, D. M., and Fishbain, B.: On the feasibility of measuring urban air pollution by wireless distributed sensor networks, Sci. Total Environ., 502, 537–547, https://doi.org/10.1016/j.scitotenv.2014.09.059, 2015.
Morawska, L., Thai, P. K., Liu, X., Asumadu-Sakyi, A., Ayoko, G., Bartonova, A., Bedini, A., Chai, F., Christensen, B., Dunbabin, M., Gao, J., Hagler, G. S. W., Jayaratne, R., Kumar, M., Lau, A. K. H., Louie, P. K. K., Mazaheri, M., Ning, Z., Motta, N., Mullins, B., Rahman, M. M., Ristovski, Z., Shafiei, M., Tjondronegoro, D., Westerdahl, D., and Williams, R.: Applications of low-costsensing technologies for a quality air monitoring and exposure assessment: How far have they gone?, Environ. Int., 116, 286–299, https://doi.org/10.1016/j.envint.2018.04.018, 2018.
Mueller, M. D., Hasenfratz, D., Saukh, O., Fierz, M., and Hueglin, C.: Statistical modelling of particle number concentration in Zurich at high spatio-temporal resolution utilizing data from a mobile sensor network, Atmos. Environ., 126, 171–181, https://doi.org/10.1016/j.atmosenv.2015.11.033, 2016.
Nagendra, S., Reddy Yasa, P., Narayana, M., Khadirnaikar, S., and Pooja Rani: Mobile monitoring of air pollution using low cost sensors to visualize spatio-temporal variation of pollutants at urban hotspots, Sustain. Cities Soc., 44, 520–535, https://doi.org/10.1016/j.scs.2018.10.006, 2019.
Pakhira, M. K., Bandyopadhyay, S., and Maulik, U.: Validity index of crisp and fuzzy clusters, Pattern Recogn., 37, 487–501, https://doi.org/10.1016/j.patcog.2003.06.005, 2004.
Pascal, M., Corso, M., Chanel, O., Declercq, C., Badaloni, C., Cesaroni, G., Henschel, S., Meister, K., Haluza, D., Martin-Olmedo, P., and Medina, S.: Assessing the public health impacts of urban air pollution in 25 European cities: Results of the Aphekom project, Sci. Total Environ., 449, 390–400, https://doi.org/10.1016/j.scitotenv.2013.01.077, 2013.
Penza, M., Suriano, D., Villani, M. G., Spinelle, L., and Gerboles, M.: Towards air quality indices in smart cities by calibrated low-cost sensors applied to networks, SENSORS, 2014 IEEE, 2012–2017, 2014.
Petkova, E. P., Jack, D. W., Volavka-Close, N. H., and Kinney, P. L.: Particulate matter pollution in African cities, Air Qual. Atmos. Heal., 6, 603–614, https://doi.org/10.1007/s11869-013-0199-6, 2013.
Pope, F. D. and Bousiotis, D.: Research data supporting “Assessing the sources of particles at an urban background site using both regulatory instruments and low-cost sensors – A comparative study”, University of Birmingham [data set], https://doi.org/10.25500/edata.bham.00000584, 2021.
Pope, F. D., Gatari, M., Ng'ang'a, D., Poynter, A., and Blake, R.: Airborne particulate matter monitoring in Kenya using calibrated low-cost sensors, Atmos. Chem. Phys., 18, 15403–15418, https://doi.org/10.5194/acp-18-15403-2018, 2018.
Popoola, O. A. M., Carruthers, D., Lad, C., Bright, V. B., Mead, M. I., Stettler, M. E. J., Saffell, J. R., and Jones, R. L.: Use of networks of low cost air quality sensors to quantify air quality in urban settings, Atmos. Environ., 194, 58–70, https://doi.org/10.1016/j.atmosenv.2018.09.030, 2018.
Rai, A. C., Kumar, P., Pilla, F., Skouloudis, A. N., Di Sabatino, S., Ratti, C., Yasar, A., and Rickerby, D.: End-user perspective of low-cost sensors for outdoor air pollution monitoring, Sci. Total Environ., 607–608, 691–705, https://doi.org/10.1016/j.scitotenv.2017.06.266, 2017.
Rousseeuw, P. J.: Silhouettes: A graphical aid to the interpretation and validation of cluster analysis, J. Comput. Appl. Math., 20, 53–65, https://doi.org/10.1016/0377-0427(87)90125-7, 1987.
Sabaliauskas, K., Jeong, C.-H. H., Yao, X., Jun, Y.-S. S., and Evans, G.: Cluster analysis of roadside ultrafine particle size distributions, Atmos. Environ., 70, 64–74, https://doi.org/10.1016/j.atmosenv.2012.12.025, 2013.
Salimi, F., Ristovski, Z., Mazaheri, M., Laiman, R., Crilley, L. R., He, C., Clifford, S., and Morawska, L.: Assessment and application of clustering techniques to atmospheric particle number size distribution for the purpose of source apportionment, Atmos. Chem. Phys., 14, 11883–11892, https://doi.org/10.5194/acp-14-11883-2014, 2014.
Sayahi, T., Butterfield, A., and Kelly, K. E.: Long-term field evaluation of the Plantower PMS low-cost particulate matter sensors, Environ. Pollut., 245, 932–940, https://doi.org/10.1016/j.envpol.2018.11.065, 2019.
Schneider, P., Castell, N., Vogt, M., Dauge, F. R., Lahoz, W. A., and Bartonova, A.: Mapping urban air quality in near real-time using observations from low-cost sensors and model information, Environ. Int., 106, 234–247, https://doi.org/10.1016/j.envint.2017.05.005, 2017.
Schnelle-Kreis, J., Sklorz, M., Orasche, J., Stölzel, M., Peters, A., and Zimmermann, R.: Semi volatile organic compounds in ambient PM2.5. Seasonal trends and daily resolved source contributions, Environ. Sci. Technol., 41, 3821–3828, https://doi.org/10.1021/es060666e, 2007.
Shindler, L.: Development of a low-cost sensing platform for air quality monitoring: Application in the city of Rome, Environ. Technol., 42, 618–631, https://doi.org/10.1080/09593330.2019.1640290, 2019.
Singh, A., Avis, W. R., and Pope, F. D.: Visibility as a proxy for air quality in East Africa, Environ. Res. Lett., 15 084002, https://doi.org/10.1088/1748-9326/ab8b12, 2020.
Smith, K. R., Edwards, P. M., Ivatt, P. D., Lee, J. D., Squires, F., Dai, C., Peltier, R. E., Evans, M. J., Sun, Y., and Lewis, A. C.: An improved low-power measurement of ambient NO2 and O3 combining electrochemical sensor clusters and machine learning, Atmos. Meas. Tech., 12, 1325–1336, https://doi.org/10.5194/amt-12-1325-2019, 2019.
Snyder, E. G., Watkins, T. H., Solomon, P. A., Thoma, E. D., Williams, R. W., Hagler, G. S. W., Shelow, D., Hindin, D. A., Kilaru, V. J., and Preuss, P. W.: The changing paradigm of air pollution monitoring, Environ. Sci. Technol., 47, 11369–11377, https://doi.org/10.1021/es4022602, 2013.
Sousan, S., Koehler, K., Thomas, G., Park, J. H., Hillman, M., Halterman, A., and Peters, T. M.: Inter-comparison of low-cost sensors for measuring the mass concentration of occupational aerosols, Aerosol Sci. Technol., 50, 462–473, https://doi.org/10.1080/02786826.2016.1162901, 2016.
Spinelle, L., Gerboles, M., Villani, M. G., Aleixandre, M., and Bonavitacola, F.: Field calibration of a cluster of low-cost available sensors for air quality monitoring. Part A: Ozone and nitrogen dioxide, Sensor. Actuat. B-Chem., 215, 249–257, https://doi.org/10.1016/j.snb.2015.03.031, 2015.
Spinelle, L., Gerboles, M., Villani, M. G., Aleixandre, M., and Bonavitacola, F.: Field calibration of a cluster of low-cost commercially available sensors for air quality monitoring. Part B: NO, CO and CO2, Sensor. Actuat. B-Chem., 238, 706–715, https://doi.org/10.1016/j.snb.2016.07.036, 2017.
Taiwo, A. M.: Source apportionment of urban background particulate matter in Birmingham, United Kingdom using a mass closure model, Aerosol Air Qual. Res., 16, 1244–1252, https://doi.org/10.4209/aaqr.2015.09.0537, 2016.
Taiwo, A. M., Beddows, D. C. S., Shi, Z., and Harrison, R. M.: Mass and number size distributions of particulate matter components: Comparison of an industrial site and an urban background site, Sci. Total Environ., 475, 29–38, https://doi.org/10.1016/j.scitotenv.2013.12.076, 2014.
Todea, A. M., Beckmann, S., Kaminski, H., and Asbach, C.: Accuracy of electrical aerosol sensors measuring lung deposited surface area concentrations, J. Aerosol Sci., 89, 96–109, https://doi.org/10.1016/j.jaerosci.2015.07.003, 2015.
U.S. Environmental Protection Agency (US EPA): The National Ambient Air Quality Standards for Particle Matter: Revised Air Quality Standards for Particle Pollution and Updates to the Air Quality Index (AQI), Environ. Prot. Agency, 1–5, available at: https://www.epa.gov/sites/production/files/2016-04/documents/2012_aqi_factsheet.pdf (last access: 1 June 2021), 2012.
U.S. Environmental Protection Agency (US EPA): Quality Assurance Guidance Document 2.12, p. 105, available at: https://www3.epa.gov/ttnamti1/files/ambient/pm25/qa/m212.pdf (last access: 1 June 2021), 2016.
Von Bismarck-Osten, C. and Weber, S.: A uniform classification of aerosol signature size distributions based on regression-guided and observational cluster analysis, Atmos. Environ., 89, 346–357, https://doi.org/10.1016/j.atmosenv.2014.02.050, 2014.
Wang, Y., Li, J., Jing, H., Zhang, Q., Jiang, J., and Biswas, P.: Laboratory Evaluation and Calibration of Three Low-Cost Particle Sensors for Particulate Matter Measurement, Aerosol Sci. Technol., 49, 1063–1077, https://doi.org/10.1080/02786826.2015.1100710, 2015.
Wegner, T., Hussein, T., Hämeri, K., Vesala, T., Kulmala, M., and Weber, S.: Properties of aerosol signature size distributions in the urban environment as derived by cluster analysis, Atmos. Environ., 61, 350–360, https://doi.org/10.1016/j.atmosenv.2012.07.048, 2012.
Weyers, R., Jang-Jaccard, J., Moses, A., Wang, Y., Boulic, M., Chitty, C., Phipps, R., and Cunningham, C.: Low-cost Indoor Air Quality (IAQ) Platform for Healthier Classrooms in New Zealand: Engineering Issues, Proc. – 2017 4th Asia-Pacific World Congr. Comput. Sci. Eng. APWC CSE 2017, 11–13 December 2017, Nadi, Fiji, 208–215, https://doi.org/10.1109/APWConCSE.2017.00045, 2018.
World Health Organization (WHO): Air quality guidelines for particulate matter, ozone, nitrogen dioxide and sulfur dioxide – Global update 2005, Geneva, Switzerland, 2006.
Wu, S., Ni, Y., Li, H., Pan, L., Yang, D., Baccarelli, A. A., Deng, F., Chen, Y., Shima, M., and Guo, X.: Short-term exposure to high ambient air pollution increases airway inflammation and respiratory symptoms in chronic obstructive pulmonary disease patients in Beijing, China, Environ. Int., 94, 76–82, https://doi.org/10.1016/j.envint.2016.05.004, 2016.
Xu, Y. and Zhang, J. S.: Understanding SVOCs, ASHRAE J., 53, 121–125, 2011.
Yin, J., Harrison, R. M., Chen, Q., Rutter, A., and Schauer, J. J.: Source apportionment of fine particles at urban background and rural sites in the UK atmosphere, Atmos. Environ., 44, 841–851, https://doi.org/10.1016/j.atmosenv.2009.11.026, 2010.
Zeger, S. L., Dominici, F., McDermott, A., and Samet, J. M.: Mortality in the medicare population and Chronic exposure to fine Particulate air pollution in urban centers (2000–2005), Environ. Health Perspect., 116, 1614–1619, https://doi.org/10.1289/ehp.11449, 2008.
Zheng, T., Bergin, M. H., Johnson, K. K., Tripathi, S. N., Shirodkar, S., Landis, M. S., Sutaria, R., and Carlson, D. E.: Field evaluation of low-cost particulate matter sensors in high- and low-concentration environments, Atmos. Meas. Tech., 11, 4823–4846, https://doi.org/10.5194/amt-11-4823-2018, 2018.