the Creative Commons Attribution 4.0 License.
the Creative Commons Attribution 4.0 License.
 | 17 Jun 2021
Comparative characterization of the performance of bio-aerosol nebulizers in connection with atmospheric simulation chambers
Silvia G. Danelli
Marco Brunoldi
Franco Parodi
Virginia Vernocchi
Paolo Prati
The interplay of bio-aerosol dispersion and impact, meteorology, and air quality is gaining increasing interest in the wide spectrum of atmospheric sciences. Experiments conducted inside confined artificial environments, such as atmospheric simulation chambers (ASCs), where atmospheric conditions and composition are controlled, can provide valuable information on bio-aerosol viability, dispersion, and impact. We focus here on the reproducible aerosolization and injection of viable microorganisms into an ASC, the first and crucial step of any experimental protocol to expose bio-aerosols to different atmospheric conditions. We compare the performance of three nebulizers specifically designed for bio-aerosol applications: the Collison nebulizer, the Blaustein Atomizing Modules (BLAM), and the Sparging Liquid Aerosol Generator (SLAG), all manufactured and commercialized by CH TECHNOLOGIES. The comparison refers to operating conditions and the concentration of viable bacteria at the nebulizer outlet, with the final goal being to measure the reproducibility of the nebulization procedures and assess their application in experiments inside ASCs. A typical bacterial test model, Escherichia coli (ATCC® 25922™), was selected for such characterization. Bacteria suspensions with a concentration around 108 CFU mL−1 were first aerosolized at different air pressures and collected by a liquid impinger to obtain a correlation curve between airflow and nebulized bacteria for each generator. Afterwards, bacteria were aerosolized inside the atmospheric simulation chamber ChAMBRe (Chamber for Aerosol Modelling and Bio-aerosol Research) to measure the reproducibility of the whole procedure. An overall reproducibility of 11 % (i.e., standard deviation of the results obtained with the three nebulizers) was obtained with each nebulizer through a set of baseline experiments.
- Article
(753 KB) - Full-text XML
- BibTeX
- EndNote


The term primary biological aerosol particles (PBAPs) refers to particles of biological origin suspended in gaseous medium, including microorganisms and fragments of biological materials. Biological aerosol particles such as pollen, fungal spores, and bacteria can cause many adverse health effects and influence Earth's climate (Després et al., 2012).
Among PBAPs, bacteria have a crucial role (Bowers et al., 2010). Bacteria are ubiquitous in the atmosphere, with concentrations of bacterial cells typically greater than 1 × 10⁴ m−3 over land and, due to their small size, bacteria have a long atmospheric residence time (several days or more) and can be transported over long distances of up to thousands of kilometers (Burrows et al., 2009; Federici et al., 2018).
Bacterial viability, including the capability to survive and maintain their pathogenicity, depends on several atmospheric conditions, such as relative humidity, temperature, irradiation, and chemical composition of ambient air (Marthi et al., 1990; Burrows et al., 2009). The interaction between bacteria and the other atmospheric constituents has recently attracted interest as part of the broader field of atmospheric sciences (Amato et al., 2015; Brotto et al., 2015; Massabò et al., 2018). The referenced experiments were performed using atmospheric simulation chambers (ASCs), which are small to large-scale facilities (with volumes ranging between a few to hundreds of cubic meters), where atmospheric conditions can be maintained and monitored in real time for periods long enough to mimic real environments and study interactions among their constituents (Finlayson-Pitts and Pitts, 2000; Becker, 2006).
In view of long-term and systematic studies, the aerosolization of a reproducible number of viable bacteria inside an ASC is the first and non-trivial step of the experimental procedure and deserves special attention. There are several phases potentially critical to variability and interpretation of the data (Alsved et al., 2019): preparation of the material pre-aerosolization, aerosol generation, injection and residence time in the ASC, sampling, and analysis. Bio-aerosol experiments require nebulization devices that can provide high particle concentrations with minimal damage to microorganisms and their viability. The choice of the best equipment for a given application is often hampered by the lack of information on performance or drawbacks of single instruments. So far, different new aerosol generators have been designed to improve the preservation of cultivability and structural integrity of the aerosolized microorganisms (Zhen et al., 2014). Single-pass devices are now available, where the solution to be sprayed passes through the aerosolization nozzle just one time thus minimizing the stress to microorganisms. Market-available examples are the Blaustein Atomizing Modules (BLAM) and the Sparging Liquid Aerosol Generator (SLAG), both distributed by CH TECHNOLOGIES. The BLAM concept is an improvement of the pneumatic nebulization mechanism without liquid recirculation. The SLAG is a bubbling generator, designed for low-pressure aerosolization of sensitive and delicate microorganisms; it implements the concept of bursting bubbles to aerosolize particles developed by Mainelis et al. (2005).
This study compares the performance of three nebulizers: the widely used Collison nebulizer (also manufactured and commercialized by CH TECHNOLOGIES), the Blaustein Atomizing Modules and the Sparging Liquid Aerosol Generator. The comparison focuses on the reproducibility of operating conditions in atmospheric simulation chambers and on the concentration of viable bacteria at the nebulizer outlet.
2.1 Selection and preparation of bacterial strain
Gram-negative bacteria Escherichia coli (ATCC® 25922™) was selected as the test bacterial species. E. coli is a rod-shaped Enterobacter about 1–2 µm long and about 0.25 µm in diameter (Jang et al., 2017). This organism is used in bio-aerosol research as standard test bacteria (Lee et al., 2002; Lee and Kim, 2003; Simon et al., 2011).
Prior to the experiments, the bacteria are cultivated on a non-selective tryptic soy broth (TSB) medium until the mid-exponential phase (optical density (OD) at λ=600 nm of around 0.5) and then centrifuged at 4000 g for 10 min. Afterwards, bacteria are resuspended in sterile physiological solution (NaCl 0.9 % ) to prepare a suspension of approximately 108 CFU mL−1 (colony forming units), as verified by standard dilution plating. The average of the colonies counted on these petri dishes is used to estimate the uncertainty range of the bacterial concentration in the solutions following the Poisson statistics (i.e., the square root of the number of colonies counted in the petri dishes). For the experiments performed inside the simulation chamber, the bacteria concentration was around 107 CFU mL−1 (see Massabò et al., 2018 for details).
2.2 Nebulization systems
Many natural sources of bio-aerosol arise from wet environments; bacteria and viruses are commonly found in liquid suspensions and are hence aerosolized from liquids (Alsved et al., 2019; Joung et al., 2017). Among the liquid bio-aerosol generators, the pneumatic nebulizers, such as the Collison device, are the most frequently used. Each atomizer considered in this study works with a different pressure range and aerosolization flow rate, as described below.
The Collison nebulizer has widespread applications and produces high concentrations of aerosol, but can cause damage to the microorganisms due to strong impaction and shear forces. The recirculation of the cell suspension increases fragmentation of bacteria during prolonged nebulization as well (Reponen et al., 1997; Zhen et al., 2014). This device generates droplets by physical shearing and impaction onto a vessel wall. The solution to be sprayed is positioned directly in the glass jar. The compressed air is used to aspirate the liquid from the reservoir into a sonic velocity air jet, wherein the liquid is sheared into droplets. The resulting liquid jet impacts against the wall of the jar, removing the larger fraction (in size) of the droplets. The resulting smaller droplets are carried out by the airflow while the larger particles return to the liquid reservoir are then re-aerosolized. In this work, the one-nozzle version of the Collison nebulizer was used. The upstream pressure can span in the 1–6 bar range, which corresponds to an airflow rate from 2 to 7 L min−1 for the one-jet model. The main disadvantage of this device is the recirculation of the liquid; the repetitive exposure to shear forces during atomization and impaction against the vessel wall can progressively cause damage and loss of viability to biological entities (Zhen et al., 2014). Several literature studies on the Collison nebulizer performance report high particle concentrations but with resulting cell damage (Mainelis et al., 2005; Thomas et al., 2011; Zhen et al., 2014). It is worth noting that, differently from the specific model used in this work, some Collison units can be operated in a non-recirculation mode using a syringe pump.
The single-jet BLAM nebulizer is used in one-pass mode; the liquid medium is subjected to the sonic air jet only one time. The atomizing head is composed of two main parts: nozzle body and expansion plate (Fig. 1). The atomizer features a modular design, composed of five interchangeable plates with different cavity depth and cone diameter to accommodate liquids with different properties (mainly viscosity). The atomization process is generated using a vacuum effect produced in the cavity between the body of the nozzle and the expansion plate when pressurized air passes at sonic velocity through a precisely laser cut ruby crystal (fixed size of 0.025 cm in diameter) located in the nozzle body (Fig. 1). This effect pushes the liquid hosted in the cavity into the air jet, which breaks up the liquid into droplets. Only the droplets smaller than a certain critical size can follow the airflow to the outlet tube located on top of the BLAM unit; this critical size is determined by the speed of the airflow through the nebulizer. The jar should be filled with 20 mL of test solution, which serves only as a soft impact surface for the larger droplets; it is not used for atomization. The liquid is delivered to the nozzle body with a desired flow rate (range of liquid feed rate: 0.1–6 mL min−1) using a precision pump (NE-300 Just Infusion™ Syringe Pump, New Era Pump Systems, Inc.). The upstream air pressure determines the resulting airflow rate in the range of 1 to 4 L min−1, which is kept constant using a mass flow controller. The properties of the aerosol generated by the single-jet BLAM nebulizer are, nominally, a function of the jet hole size, depth of the liquid cavity, expansion cone size, and liquid viscosity. In this work, the expansion plate with a cavity depth and a cone diameter of 0.003 and 0.050 cm, respectively, was used.
Figure 1Components of the BLAM nozzle body. Extracted and modified from the BLAM user's manual.
So far, the bubbling mechanism has been studied as a naturally occurring phenomenon and has been recognized as a significant factor in aerosolization of seawater and suspended contaminants from breaking waves (Mainelis et al., 2005). The SLAG model is a single-pass bubbling generator where a suspension of particles or microorganisms is pumped at a certain flow rate to the top surface of a porous stainless-steel disc where it forms a liquid film. Then, the airflow is delivered through the porous disc creating fine bubbles in the liquid film that subsequently burst, releasing particles into the air. Particles are carried out of the device by the same air stream. We used a SLAG nebulizer with a 0.75′′ diameter porous disc and nominal pore size of 2 µm. The recommended airflow ranges between 2 and 6 L min−1 and it is set using a mass flow controller. This principle of gentle bubbling aerosolization is expected to reduce stress and damage to microorganisms compared to pneumatic nebulization (Simon et al., 2011).
2.3 Experimental setup
In the first phase we used the experimental setup schematically shown in Fig. 2. The aerosol was sampled directly at the output of the nebulizer through a flanged connection using an impinging system (liquid impinger by Aquaria Srl) filled with 20 mL of sterile physiological solution and operated at a constant airflow of 12.5 L min−1 (Terzieva et al., 1996; Zheng and Yao, 2017). The bacteria suspension (concentration: about 108 CFU mL−1; see Sect. 2.1) was sprayed and directly collected by the liquid impinger. The number of cultivable cells inside the impinger was then determined in CFU by standard dilution plating: 100 µL of serial dilutions of the solution was spread on an agar non-selective culture medium (trypticase soy agar (TSA)) and incubated overnight at 37 ∘C before CFU counting. For each nebulizer, different airflows were tested using a mass flow controller (Bronkhorst, model F201C-FA), and the nebulization efficiency was determined in terms of culturable fraction of aerosolized bacteria (i.e., percentage ratio of the concentration of viable bacteria inside the liquid impinger and in the sprayed solution).
Figure 2Experimental setup for the tests with the impinger. (a) BLAM, (b) SLAG, and (c) Collison.
Further tests took place at ChAMBRe (Chamber for Aerosol Modelling and Bio-aerosol Research), a 2.2 m3 stainless steel atmospheric simulation chamber specifically designed for research on atmospheric bio-aerosols. At ChAMBRe, particles in the dimensional range of bacteria (1–2 µm) have a lifetime of several hours (Massabò et al., 2018). Atmospheric conditions and composition (i.e., type and concentration of gaseous species and PM) can be monitored and controlled. Water vapor can be directly injected into ChAMBRe, thus adjusting the relative humidity inside the chamber from 0 % to about 99 %. Temperature and relative humidity (RH %) inside the chamber are monitored using a HMT334 Vaisala® Humicap® transmitter. In the operative range (from 15 to 25 ∘C), the RH accuracy is ±1 % RH (0 % to 90 % RH) and ±1.7 % RH (90 % to 100 % RH); the temperature accuracy is ±0.2 ∘C at 20 ∘C. A set of two pressure gauges is used to measure the atmospheric pressure inside and outside the chamber. An MKS Instruments 910 DualTrans™ transducer is installed inside (measuring range: from 5 × 10⁻⁴ to 2 × 10³ hPa; accuracy of ±0.75 % of the reading in the range of 15–1000 hPa). A Vaisala BAROCAP® Barometer PTB110 is installed outside the chamber with a measuring range from 5 × 10² to 1.1 × 10³ hPa and accuracy of ±0.3 hPa at 20 ∘C. Ambient gas monitors from Environnement SA (model: O342e, AC32e, CO12e, AF22e, and VOC72M) continuously measure the concentration of ozone, nitrogen oxides, carbon monoxide and dioxide, sulfur dioxide, and BTEX inside the chamber volume. Detection limits and sensitivities are 0.2 and 0.1 ppb for O342e and AC32e; 0.035 ppm and 0.015 ppm for CO12e; 0.4 and 0.2 ppb for AF22e; and 0.05 µg m−3 for VOC72M (reading of benzene), with a precision of 0.025 µg m−3 at 0.5 µg m−3 of benzene. Particle concentration inside the chamber is measured continuously using an optical particle counter (OPC; model Envirocheck 1.107, GRIMM Technologies, Inc.), which operates at 675 nm in the 0.25–32 µm size range with a 6 s time resolution and a flow rate of 1.2 L min−1. The OPC is periodically factory calibrated via monodisperse latex particles for size classification. A fan is installed in the bottom part of the chamber to favor the mixing of the gas and aerosol species in the reactor. Acquisition and control of devices connected to ChAMBRe are handled by a National Instruments-based system made up of a main controller (NI9057 cRIO) and several modules (C Series modules), which allow communication with the peripheral devices via analog, serial, and ethernet data exchange. A custom NI Labview SCADA (supervisory control and data acquisition) application allows the user to interact with the system using a user-friendly graphical interface. ChAMBRe is also equipped with a sterilization system: a 58 cm long UV lamp (UV-STYLO-F-60H, Light Progress Srl) is inserted through a lateral flange. The lamp produces 60 W UV radiation at λ=253.7 nm, which is used to sterilize the chamber volume without producing ozone before or after any experiment with bio-aerosols. Before each test with the nebulizers, the chamber is cleaned by evacuating the internal volume down to 10−5 hPa thanks to a composite pumping system (a rotary pump model TRIVAC® D65B, Leybold Vacuum, followed by a root pump model RUVAC WAU 251, Leybold Vacuum, and a Leybold Turbovac 1000). Then, the chamber is vented again to atmospheric pressure throughout a five-stage filtering/purifying/drying inlet system (including a HEPA filter, model: PFIHE842; 99.97 % efficient at 0.3 µm), which reduces the ambient RH to about 15 %. This filtering system ensures an excellent purification of the air entering the chamber. After venting, particle and gas concentrations inside the chamber are lower than the typical environmental values and close to the instrument sensitivity. During the experiments reported in this work, CO2 was kept constant around 450 ppm thanks to a CO2 feedback system based on a steady PID (proportional-integral-derivative control) algorithm. The chamber conditions for each experiment were: temperature between 18 and 22 ∘C, atmospheric pressure between 990 and 1020 hPa, and relative humidity around 70 %. The fan was turned on during all the experiments with a nominal speed of 5 rpm that results in a mixing time of about 160 s. Sets of experiments with a particular aerosol generator at fixed settings were performed with different concentrations of bacteria, in the physiological solution sprayed into the chamber of around 107 cell mL−1. Inside the chamber, the exposure time was up to about 5 h, according to the lifetime in ChAMBRe of particles with diameter around 1 µm (Massabò et al., 2018). Finally, bacteria were collected by gravitational settling on four petri dishes filled with trypticase soy agar medium placed in the bottom of the chamber through an automated shelf (Massabò et al., 2018) and maintained in that position for the whole 5 h period. Once extracted outside the chamber, the petri dishes were incubated overnight at 37 ∘C to determine the bacteria culturable fraction by CFU visual counting. The comparison here focuses on the reproducibility of the operating conditions of the nebulizers when coupled to atmospheric simulation chambers.
The chamber sterility was periodically checked through a blank experiment (i.e., injecting sterile physiological solution only); no bacterial contamination was observed in the four petri dishes positioned on the sliding tray. Further details on the experimental protocols at ChAMBRe are reported in Massabò et al. (2018).
3.1 Tests with impinger
In the first set of experiments, we measured the nebulization efficiency in terms of culturable fraction of aerosolized bacteria for each device and at different airflows. We adopted the ratio between the CFU counted in the impinger liquid and the CFU introduced in the liquid solution of the nebulizer as an operative definition of efficiency. With the BLAM and SLAG nebulizers, the latter corresponds to the product of the concentration (i.e., CFU mL−1) in the bacterial solution for the volume of liquid (2 mL) introduced in the nebulizer. Since the Collison nebulizer works in a recirculation mode, (i) it is not possible to quantify the absolute value of the liquid volume passing through the nozzle and (ii) an unknown fraction of the liquid to be aerosolized passes through the nozzle more than once. To have a comparable metric in the experiments with the Collison nebulizer, the volume of the liquid was substituted with the injection time (5 min; the same used with other two nebulizers). Even if this choice does not meet a strict metrological criterion, it makes possible a direct comparison of the three devices in well-defined operative conditions (see Table 1). The aerosolization air flow varied in the range of 1.4–3.5 L min−1 for the BLAM and 2–5 L min−1 for the SLAG and Collison nebulizers. The bacteria suspension was supplied to the BLAM and SLAG devices at the same liquid flow rate of 0.4 mL min−1 (see Table 1). The tests started after a suitable warming time (about 5 min) to get a stable nebulizer output. Afterwards, the aerosol was extracted for a further 5 min with an impinger flow of 12.5 L min−1. This way, 2 mL of bacteria suspension at the flow rate of 0.4 mL min−1 were aerosolized both by the BLAM and SLAG nebulizer.
Table 1Working conditions of each nebulizer during the tests with the liquid impinger. NA means not available.
Figures 3–5 show the nebulization efficiency of the BLAM, SLAG, and Collison nebulizers, respectively. The average of the colonies counted on the dilution plating petri dishes is used to evaluate the uncertainty range of the bacterial concentration in the nebulized solution, while the uncertainty on the air flow was determined as 1 % of the flow controller full scale. At fixed air flow, the BLAM nebulizer shows the highest nebulization efficiency, followed by the Collison and SLAG (e.g., at 3.5 L min−1 the BLAM efficiency is about 2 and 4 times higher than the Collison and SLAG nebulizers, respectively). Our experimental procedure did not allow direct control of the fraction of damaged bacteria during the nebulization phase, but in the specific case of the Collison nebulizer (Fig. 5), the nebulization efficiency of the culturable fraction increases linearly with the airflow until about 3 L min−1; after that the curve bends, likely because the cell damage becomes more and more relevant. However, with the described injection conditions (5 min; air flow ≤ 5 L min−1) the output of viable bacteria turned out to be comparable with the results obtained with the other two nebulizers.
Figure 3BLAM nebulization efficiency (percentage values) vs. upstream air flow. Liquid feed rate = 0.4 mL min−1.

Figure 4SLAG nebulization efficiency (percentage values) vs. upstream air flow. Liquid feed rate = 0.4 mL min−1.
At the same time, with the BLAM nebulizer the flow of liquid supplied to the nebulizer can be accurately tuned. The SLAG nebulizer requires a lower upstream pressure and, according to the producer claim, results in a softer injection (and therefore less bio-damage) of viable bacteria. Therefore, the SLAG nebulizer looks best suited for experiment with fragile bacteria that can be nebulized in large numbers even with its extremely gentle nebulization system. The BLAM efficiency seems subjected to a higher variability; such a feature is likely due to the coupling between the nebulizer and the impinger setup since the experiments with injection directly into the simulation chamber were much more stable (see Sect. 3.2).
3.2 Tests at ChAMBRe
In the second set of experiments, we focused on the performance of the three aerosol generators when used to nebulize bacteria directly inside an atmospheric simulation chamber. The goal of this set of experiments was to assess of the reproducibility of the whole procedure by fixing a working condition for each nebulizer. Four experiments were performed with the BLAM and Collison nebulizers and five with the SLAG nebulizer, all between November 2019 and July 2020. Experimental conditions and results are reported in Tables 2–4. The uncertainties quoted on both injected and collected bacteria are just those deriving from the Poisson fluctuation (i.e., the square root of the number of colonies counted in the petri dishes) and they do not include any other systematic or statistical term. The values of the collected CFU are the average of the counts of the four petri dishes exposed in each experiment; each group of four turned out to be statistically compatible (i.e., within the interval delimited by the statistical uncertainty, the counts in the four petri dishes agreed). Inside the chamber, the working conditions adopted for the Collison nebulizer produce an initial PM10 concentration of about 200 µg m−3 (Table 4), like the BLAM output (Table 2). The initial PM10 concentration, as determined by the OPC, was taken as a rough reference for the aerosolization efficiency and quantity of aerosol generated (bacteria plus NaCl particles).
Table 2Bacteria concentration in the aerosolized solution, average number of colonies counted on the petri dishes, and the meteorological parameters (P, T, RH) in ChAMBRe in the experiments with the BLAM nebulizer operated at: liquid feed rate = 0.4 mL min−1, volume of injected solution = 2 mL, injection time = 5 min, and air flow = 2.4 L min−1.

Table 3Bacteria concentration in the aerosolized solution, average number of colonies counted on the petri dishes, and the meteorological parameters (P, T, RH) in ChAMBRe in the experiments with the SLAG nebulizer operated at: liquid feed rate = 0.4 mL min−1, volume of injected solution = 2 mL, injection time = 5 min, and air flow = 3.5 L min−1.
Table 4Bacteria concentration in the aerosolized solution, average number of colonies counted on the petri dishes, and the meteorological parameters (P, T, RH) in ChAMBRe in the experiments with the Collison nebulizer operated at: liquid feed rate = 0.4 mL min−1, volume of injected solution = 2 mL, injection time = 4 min, and air flow = 3.0 L min−1.
The injected bacteria correspond to the product of the concentration (i.e., CFU mL−1) in the bacterial solution for the volume of liquid (2 mL) introduced in the BLAM and SLAG nebulizer. In the experiments with the Collison nebulizer, the injection time was considered instead of the liquid volume to calculate the number of injected bacteria and to make possible a direct comparison with the BLAM and SLAG nebulizer performance. At ChAMBRe, considering the range of inlet air flows for the three devices, the typical figure for the ratio between the CFU on petri dishes (diameter: 10 cm) placed inside the chamber to collect the bacteria by gravitational settling and the injected CFU is 10−6 for each nebulizer. A good and stable correlation between the number of injected and collected CFU was obtained for each nebulizer, as shown in Figs. 6–8, which refer to BLAM, SLAG, and Collison, respectively.
Figure 6Correlation curve between the number of E. coli bacteria injected in ChAMBRe by the BLAM nebulizer and the average count on the four petri dishes exposed in each experiment. The injected bacteria correspond to the product of the concentration (i.e., CFU mL−1) in the bacterial suspension for the volume of liquid (2 mL) introduced in the nebulizer.
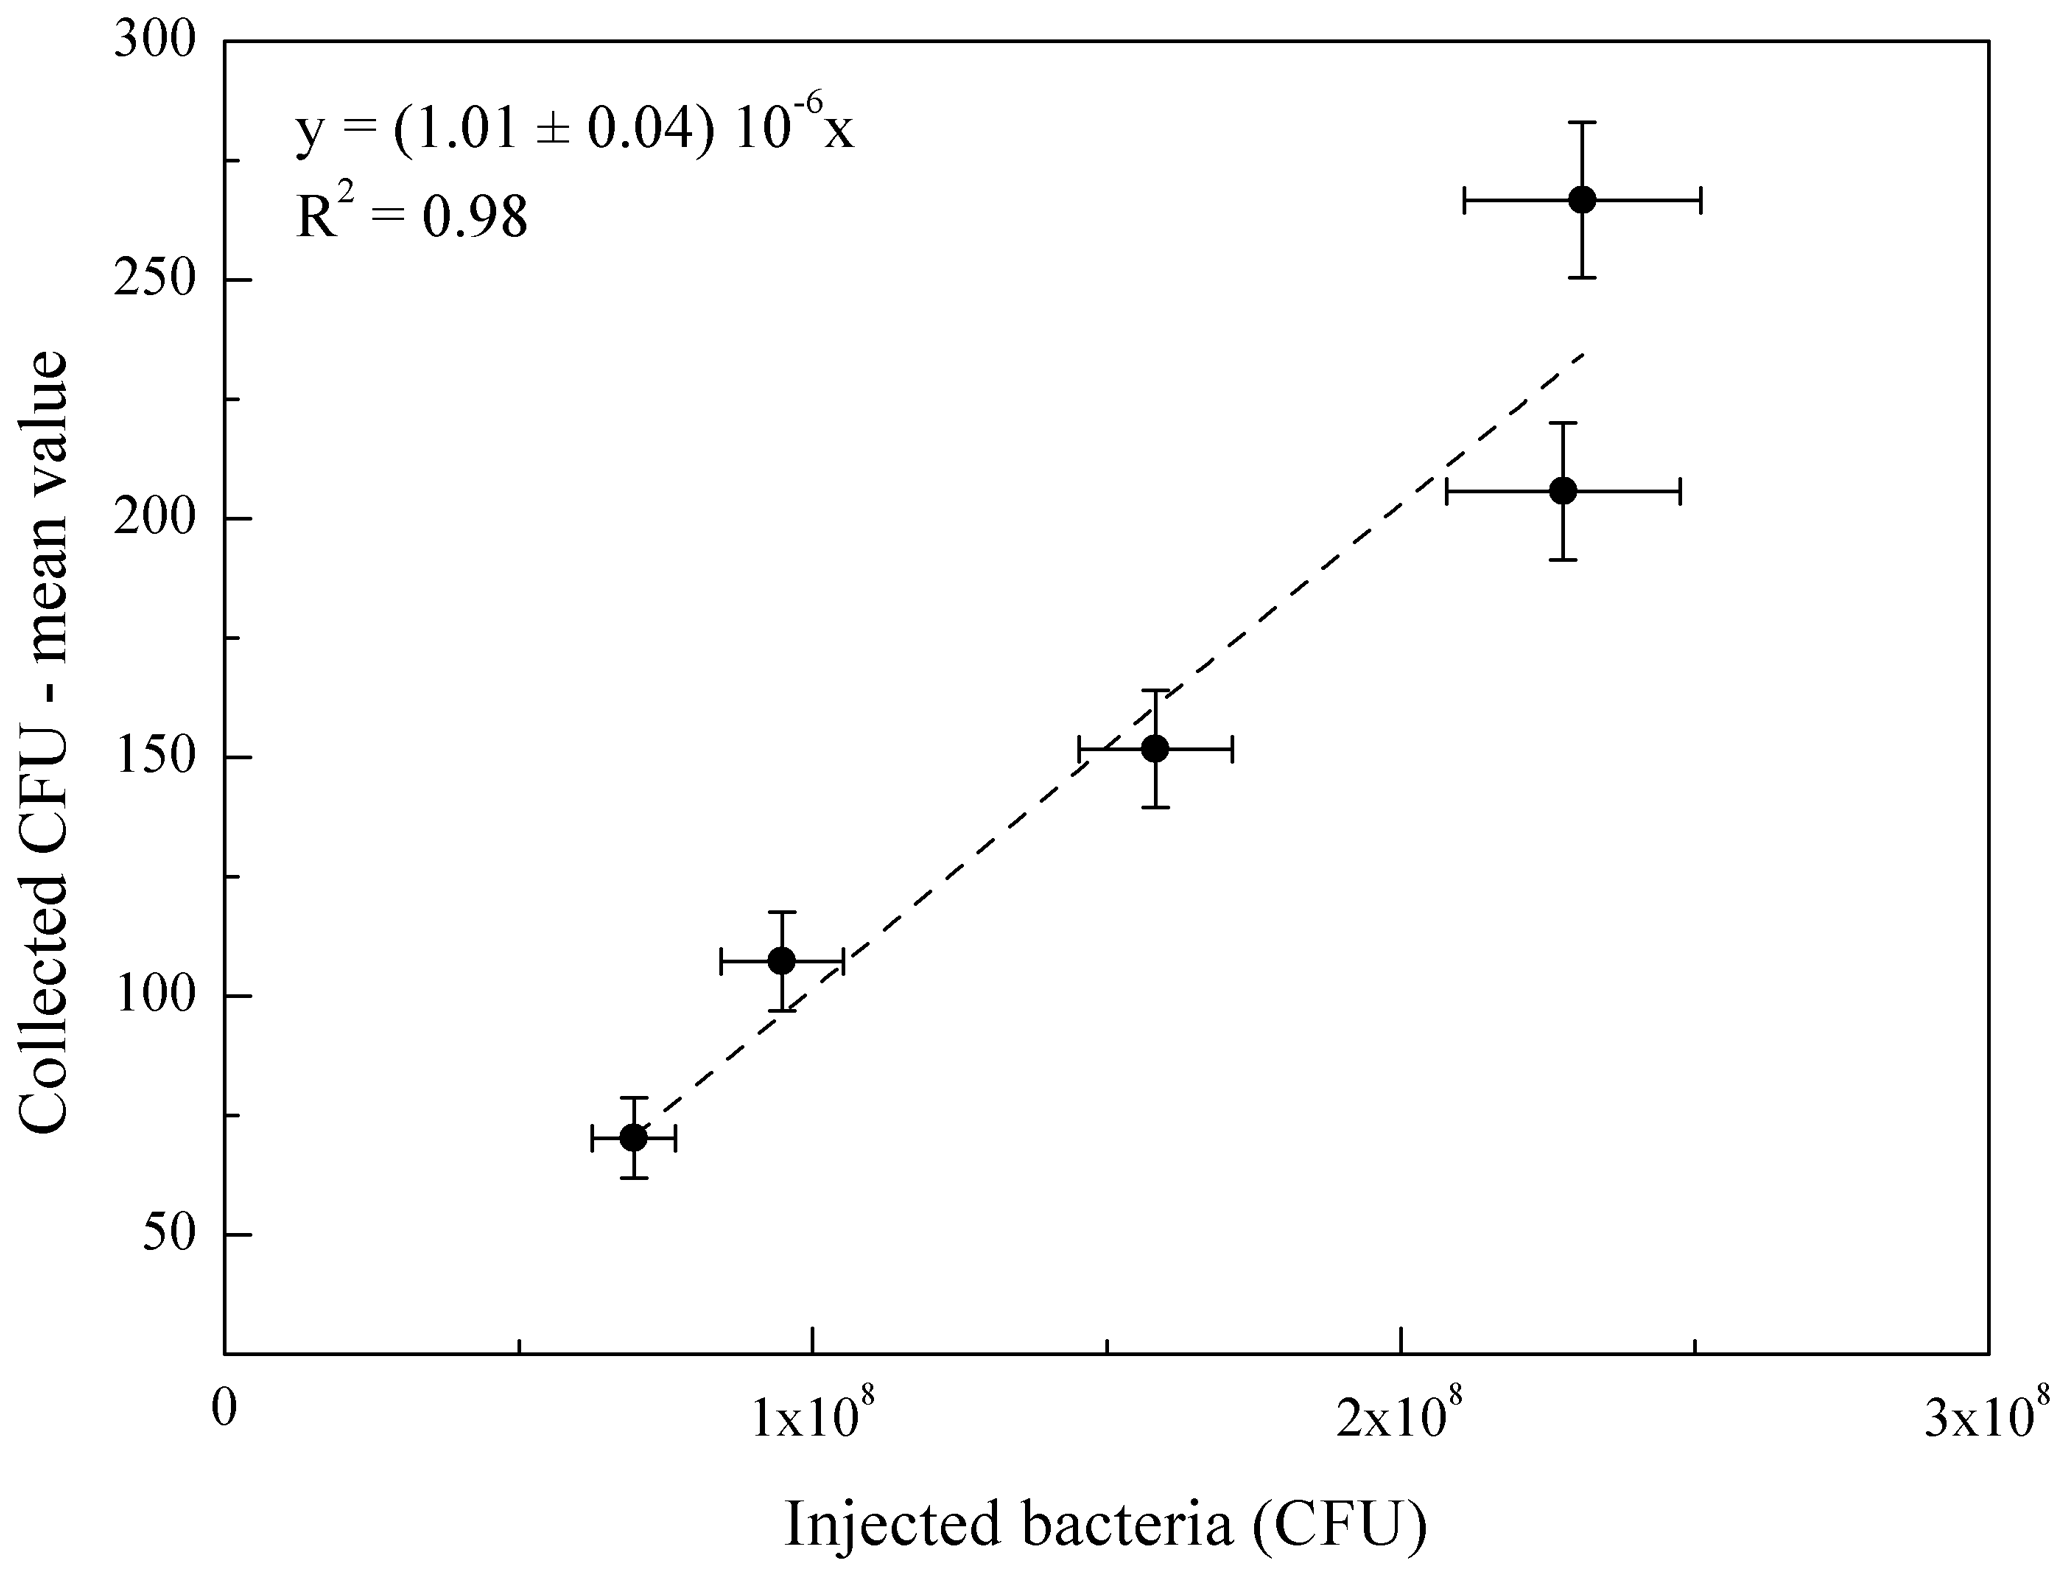
Figure 7Correlation curve between the number of E. coli bacteria injected in ChAMBRe by the SLAG nebulizer and the average count on the four petri dishes exposed in each experiment. The injected bacteria correspond to the product of the concentration (i.e., CFU mL−1) in the bacterial suspension for the volume of liquid (2 mL) introduced in the nebulizer.

Figure 8Correlation curve between the number of E. coli bacteria injected in ChAMBRe by the Collison nebulizer and the average count on the four petri dishes exposed in each experiment. The injected bacteria were operatively calculated as the product of the concentration (i.e., CFU mL−1) in the bacterial suspension and the injection time (4 min).
Actually, the relationship between number of bacteria nebulized and the number of viable bacteria collected on the petri dishes passes through the deposition losses on the walls of the chamber and through the viability reduction inside the chamber environment. The aim of these bunches of experiments was to find a quantitative and reproducible link between all these quantities. In Figs. 6–8, the slope decreases from the BLAM, to the Collison nebulizer, and finally to the SLAG nebulizer as the nebulization efficiency does (see Figs. 3–5). The concentration of injected bacteria has not been corrected by the nebulization efficiency; this way, values on the x axis are directly and simply determined by the bacteria concentration in the initial solution and the volume or time of injection.
The uncertainty on the slope of the correlation curves always turned out to be < 5 % and the overall standard deviation around the average ratio (collected/injected CFU) was 11 %. This value corresponds to the standard deviation of the results of the entire bunch of experiments around the mean value of the collected to injected CFU ratio (taking into account the results of all three nebulizers). The experimental reproducibility appears to be adequate to design experiments within an ASC; it roughly corresponds to the sensitivity of the whole procedure to changes in the viability, for instance, when bacteria will be exposed to different air quality conditions.
The absolute value of the aerosolization efficiency depends on the pressure at the nebulizer outlet (i.e., inside the atmospheric chamber; Feng et al., 2020). The results presented in this work were performed in a specific pressure regime, i.e., with internal pressure about 2 hPa lower than the ambient pressure. This condition favors the bacteria confinement inside the chamber and was explored in view of experiments with pathogenic strains. With each specific setup (i.e., simulation chamber or other downstream expansion volumes), the actual nebulization efficiency should be determined following the same steps above reported. At ChAMBRe, the internal pressure can be maintained up to ±5 hPa greater or lower than the ambient pressure. At ChAMBRe we could verify that with a 3–5 hPa overpressure and an internal pressure ranging from 1011 to 1026 hPa, the Collison efficiency in nebulizing a physiological solution remains stable within 9 %.
We compared the performance of three commercial nebulizers (BLAM, SLAG, and Collison) in the operative conditions that could be used in experiments in atmospheric simulation chambers: one-shot injection with a high output of viable biological particles. With all the instruments, the nebulization efficiency of E. coli allowed us to reach bacteria concentrations on the order of 105 CFU m−3 in the 2.2 m3 volume of the ChAMBRe ASC after a 4–5 min injection time. However, at fixed upstream air flow, the nebulization efficiency increases by a factor of 2 from the SLAG to Collison nebulizer and from the Collison to BLAM nebulizer. The handling of the devices becomes more laborious moving from the Collison to SLAG and then to the BLAM nebulizer. Nevertheless, a set of baseline experiments at ChAMBRe (i.e., injection and suspension of E. coli in a “clean” atmosphere) revealed a reproducibility of 11 % regardless of the nebulizer used. Such an achievement, not trivial when handling biological systems, put the basis of these systematic studies on the possible correlation between bacteria viability and air quality conditions.
All data and plots used to produce this article are available at the following DOIs: https://doi.org/10.25326/EYEN-W128 (Danelli et al., 2021a), https://doi.org/10.25326/E8HV-3950 (Danelli et al., 2021b), https://doi.org/10.25326/YW3E-A394 (Danelli et al., 2021c), https://doi.org/10.25326/T1PF-T863 (Danelli et al., 2021d), https://doi.org/10.25326/CG6W-YE23 (Danelli et al., 2021e), https://doi.org/10.25326/5RE2-JG98 (Danelli et al., 2021f), https://doi.org/10.25326/FWZZ-2F76 (Danelli et al., 2021g), and https://doi.org/10.25326/RGE1-X868 (Danelli et al., 2021h).
DM, FP, and PP designed and built ChAMBRe; SGD, DM, VV, and PP ran all the injections with bacteria; SGD took care of all the biological issues and measurements; MB designed and implemented the acquisition software; SGD, DM, and PP prepared the manuscript with contributions from all the other authors.
The authors declare that they have no conflict of interest.
This article is part of the special issue “Simulation chambers as tools in atmospheric research (AMT/ACP/GMD inter-journal SI)”. It is not associated with a conference.
The authors are indebted to the technical and administrative staff of INFN Genova for their continuous and effective support of the development of the ChAMBRe facility.
This research has been supported by the European Union's Horizon 2020 research and innovation program through the EUROCHAMP-2020 Infrastructure Activity under grant agreement no. 730997.
This paper was edited by Jean-Francois Doussin and reviewed by Jing Wang, Michel Attoui, and one anonymous referee.
Alsved, M., Bourouiba, L., Duchaine, C., Löndahl, J., Marr, L.C., Parker, S. T., Prussin II, A. J., and Thomas, R. J.: Natural sources and experimental generation of bioaerosols: Challenges and Perspectives, Aerosol Sci. Tech., 54, 547–571, https://doi.org/10.1080/02786826.2019.1682509, 2019.
Amato, P., Joly, M., Schaupp, C., Attard, E., Möhler, O., Morris, C. E., Brunet, Y., and Delort, A.-M.: Survival and ice nucleation activity of bacteria as aerosols in a cloud simulation chamber, Atmos. Chem. Phys., 15, 6455–6465, https://doi.org/10.5194/acp-15-6455-2015, 2015.
Becker, K. H.: Overview on the Development of Chambers for the Study of Atmospheric Chemical Processes, in: Environmental Simulation Chambers: Application to Atmospheric Chemical Processes, edited by: Barnes, I. and Rudzinski, K. J., Springer, Amsterdam, the Netherlands, 1–26, 2016.
Bowers, R. M., McLetchie, S., Knight, R., and Fierer, N.: Spatial variability in airborne bacterial communities across land-use types and their relationship to the bacterial communities of potential source environments, Isme J., 5, 601–612, 2010.
Brotto, P., Repetto, B., Formenti, P., Pangui, E., Livet, A., Bousserrhine, N., Martini, I., Varnier, O., Doussin, J.-F., and Prati, P.: Use of an atmospheric simulation chamber for bioaerosol investigation: a feasibility study, Aerobiologia, 31, 445–455, 2015.
Burrows, S. M., Elbert, W., Lawrence, M. G., and Pöschl, U.: Bacteria in the global atmosphere – Part 1: Review and synthesis of literature data for different ecosystems, Atmos. Chem. Phys., 9, 9263–9280, https://doi.org/10.5194/acp-9-9263-2009, 2009.
Danelli, S., Massabò, D., and Prati, P.: Atmospheric simulation chamber study: escherichia coli – Reference experiment, AERIS [data set], https://doi.org/10.25326/EYEN-W128, 2021a.
Danelli, S., Massabò, D., and Prati, P.: Atmospheric simulation chamber study: escherichia coli – Reference experiment, AERIS [data set], https://doi.org/10.25326/E8HV-3950, 2021b.
Danelli, S., Massabò, D., and Prati, P.: Atmospheric simulation chamber study: escherichia coli – Reference experiment, AERIS [data set], https://doi.org/10.25326/YW3E-A394, 2021c.
Danelli, S., Massabò, D., and Prati, P.: Atmospheric simulation chamber study: escherichia coli – Reference experiment, AERIS [data set], https://doi.org/10.25326/T1PF-T863, 2021d.
Danelli, S., Massabò, D., and Prati, P.: Atmospheric simulation chamber study: escherichia coli – Reference experiment, AERIS [data set], https://doi.org/10.25326/CG6W-YE23, 2021e.
Danelli, S., Massabò, D., and Prati, P.: Atmospheric simulation chamber study: escherichia coli – Reference experiment, AERIS [data set], https://doi.org/10.25326/5RE2-JG98, 2021f.
Danelli, S., Massabò, D., and Prati, P.: Atmospheric simulation chamber study: escherichia coli – Reference experiment, AERIS [data set], https://doi.org/10.25326/FWZZ-2F76, 2021g.
Danelli, S., Massabò, D., and Prati, P.: Atmospheric simulation chamber study: escherichia coli – Reference experiment, AERIS [data set], https://doi.org/10.25326/RGE1-X868, 2021h.
Després, V. R., Huffman, J. A., Burrows, S. M., Hoose, C., Safatov, A. S., Buryak, G., Fröhlich-Nowoisky, J., Elbert, W., Andreae, M. O., Pöschl, U., and Jaenicke, R.: Primary biological aerosol particles in the atmosphere: a review, Tellus B, 64, 15598, https://doi.org/10.3402/tellusb.v64i0.15598, 2012.
Federici, E., Petroselli, C., Montalbani, E., Casagrande, C., Ceci, E., Moroni, B., Porta, G.L., Castellini, S., Selvaggi, R., Sebastiani, B., Crocchianti, S., Gandolfi, I., Franzetti, A., and Cappelletti, D.: Airborne bacteria and persistent organic pollutants associated with an intense Saharan dust event in the Central Mediterranean, Sci. Total Environ., 645, 401–410, 2018.
Finlayson-Pitts, B. J. and Pitts Jr., J. N.: Chemistry of the upper and lower atmosphere: Theory, experiments and applications, Academic Press, San Diego, CA, USA, 2000.
Jang, J., Hur, H., Sadowsky, M., Byappanahalli, M., Yan, T., and Ishii, S.: Environmental Escherichia coli: ecology and public health implications – a review, J. Appl. Microbiol., 123, 570–581, 2017.
Joung, Y., Ge, Z., and Buie, C.: Bioaerosol generation by raindrops on soil, Nat. Commun., 8, 14668, https://doi.org/10.1038/ncomms14668, 2017.
Lee, B. U. and Kim, S. S.: Sampling E. coli and B. subtilis bacteria bioaerosols by a new type of impactor with a cooled impaction plate, J. Aerosol Sci., 34, 1097–1100, 2003.
Lee, B. U., Kim, S. H., and Kim, S. S.: Hygroscopic growth of E. coli and B. subtilis bioaerosols, J. Aerosol Sci., 33, 1721–1723, 2002.
Mainelis, G., Berry, D., An, H. R., Yao, M. S., De Voe, K., Fennell, D. E., and Jaeger, R.: Design and performance of a single pass bubbling bioaerosol generator, Atmos. Environ., 39, 3521–3533, 2005.
Marthi, B., Fieland, V. P., Walter, M., and Seidler, R. J.: Survival of bacteria during aerosolization, Appl. Environ. Microbiol., 56, 3463–3467, 1990.
Massabò, D., Danelli, S. G., Brotto, P., Comite, A., Costa, C., Di Cesare, A., Doussin, J. F., Ferraro, F., Formenti, P., Gatta, E., Negretti, L., Oliva, M., Parodi, F., Vezzulli, L., and Prati, P.: ChAMBRe: a new atmospheric simulation chamber for aerosol modelling and bio-aerosol research, Atmos. Meas. Tech., 11, 5885–5900, https://doi.org/10.5194/amt-11-5885-2018, 2018.
Reponen, T., Willeke, K., Ulevicius, V., Grinshpun, S. A., and Donnelly, J.: Techniques for Dispersion of Microorganisms into Air, Aerosol Sci. Tech., 27, 405–421, 1997.
Simon, X., Duquenne, P., Koehler, V., Piernot, C., Coulais, C., and Faure, M.: Aerosolisation of Escherichia coli and associated endotoxin using an improved bubbling bioaerosol generator, J. Aerosol Sci., 42, 517–531, 2011.
Terzieva, S., Donnelly, J., Ulevicius, V., Grinshpun, S. A., Willeke, K., Stelma, G. N., and Brenner, K. P.: Comparison of methods for detection and enumeration of airborne microorganisms collected by liquid impingement, Appl. Environ. Microbiol., 62, 2264–2272, 1996.
Thomas, R. J., Webber, D., Hopkins, R., Frost, A., Laws, T., Jayasekera, P. N., and Atkins, T.: The cell membrane as a major site of damage during aerosolization of Escherichia coli, Appl. Environ. Microbiol., 77, 920–925, 2011.
Zhen, H., Han, T., Fennell, D. E., and Mainelis, G.: A systematic comparison of four bioaerosol generators: Affect on culturability and cell membrane integrity when aerosolizing Escherichia coli bacteria, J. Aerosol Sci., 70, 67–79, 2014.
Zheng, Y. and Yao, M.: Liquid impinger BioSampler's performance for size-resolved viable bioaerosol particles, J. Aerosol Sci., 106, 34–42, 2017.