the Creative Commons Attribution 4.0 License.
the Creative Commons Attribution 4.0 License.
 | 21 Jun 2021
MicroPulse DIAL (MPD) – a diode-laser-based lidar architecture for quantitative atmospheric profiling
Scott M. Spuler
Matthew Hayman
Robert A. Stillwell
Joshua Carnes
Todd Bernatsky
Kevin S. Repasky
Continuous water vapor and temperature profiles are critically needed for improved understanding of the lower atmosphere and potential advances in weather forecasting skill. Ground-based, national-scale profiling networks are part of a suite of instruments to provide such observations; however, the technological method must be cost-effective and quantitative. We have been developing an active remote sensing technology based on a diode-laser-based lidar technology to address this observational need. Narrowband, high-spectral-fidelity diode lasers enable accurate and calibration-free measurements requiring a minimal set of assumptions based on direct absorption (Beer–Lambert law) and a ratio of two signals. These well-proven quantitative methods are known as differential absorption lidar (DIAL) and high-spectral-resolution lidar (HSRL). This diode-laser-based architecture, characterized by less powerful laser transmitters than those historically used for atmospheric studies, can be made eye-safe and robust. Nevertheless, it also requires solar background suppression techniques such as narrow-field-of-view receivers with an ultra-narrow bandpass to observe individual photons backscattered from the atmosphere. We discuss this diode-laser-based lidar architecture's latest generation and analyze how it addresses a national-scale profiling network's need to provide continuous thermodynamic observations. The work presented focuses on general architecture changes that pertain to both the water vapor and the temperature profiling capabilities of the MicroPulse DIAL (MPD). However, the specific subcomponent testing and instrument validation presented are for the water vapor measurements only. A fiber-coupled seed laser transmitter optimization is performed and shown to meet all of the requirements for the DIAL technique. Further improvements – such as a fiber-coupled near-range receiver, the ability to perform quality control via automatic receiver scanning, advanced multi-channel scalar capabilities, and advanced processing techniques – are discussed. These new developments increase narrowband DIAL technology readiness and are shown to allow higher-quality water vapor measurements closer to the surface via preliminary intercomparisons within the MPD network itself and with radiosondes.
- Article
(7778 KB) - Full-text XML
- BibTeX
- EndNote


The complex interaction of atmospheric water vapor and temperature fields with large-scale circulation patterns makes predicting weather and climate phenomena very challenging (Allen and Ingram, 2002; Held and Soden, 2006; Schneider et al., 2010; Sherwood et al., 2010; Stevens and Bony, 2013a, b; Ralph et al., 2017). Consequently, continuous range-resolved measurements of water vapor and temperature at large scales are critically needed to improve severe weather and precipitation forecasting (Weckwerth et al., 1999; Wulfmeyer et al., 2015; Geerts et al., 2016; Jensen et al., 2016). This enhanced predictive skill is essential to regional and national agencies serving those affected by high-impact weather phenomena. Global- and national-scale observations will require multiple perspectives. Space-based satellite capabilities need to be combined with surface-based, national-scale networks – providing continuous measurements with higher vertical resolutions in the planetary boundary layer – to achieve sufficient observation density required to guide forecasts. Ground-based thermodynamic profiling networks should have a characteristic spacing of ≈125 km but could vary between 50 and 200 km based on regional considerations such as topography (NRC, 2009). A network with such spacing would require several hundred instruments over a land area the size of the contiguous United States.
The profiling instruments must be cost-effective to acquire and maintain to have any hope of meeting this horizontal spacing requirement. Single “hero measurement” instruments that provide exceptional accuracy and performance with associated extraordinary costs do not address the forecasting needs. Neither does a large-scale network of inexpensive devices based on technologies that provide only qualitative information or under-constrained observations. The profiler technology must balance cost and performance, offering data that improve forecasts while being cost-effective to construct and maintain. Such a technology would be required to (1) deliver continuous range-resolved thermodynamic data, (2) operate unattended for long durations, (3) operate without ancillary calibrations to keep operational costs low, and (4) not pose a safety threat to the community (e.g., operate within eye-safety limits).
We have been developing an active remote sensing technology to address this problem through a collaborative research program between the National Center for Atmospheric Research (NCAR) and Montana State University (MSU). The name for our lidar architecture is the MicroPulse DIAL (MPD). The technology's foundation is on cost-effective, narrowband, high-spectral-fidelity diode lasers. These sources allow quantitative atmospheric measurements using techniques that require a minimal set of assumptions based on direct absorption (Beer–Lambert law) and a ratio of two signals. These well-proven quantitative methods are known as differential absorption lidar (DIAL) and the high-spectral-resolution lidar (HSRL) technique within the lidar discipline. The fundamental operation of a photon-counting DIAL and the methods used to develop the technology into an instrument capable of field deployment are described in Spuler et al. (2015). We have since extended the diode-laser-based lidar architecture to other wavelengths allowing for other measurement capabilities. Calibrated aerosol profiling using the HSRL technique was developed by Hayman and Spuler (2017), and temperature profiling using the absorption coefficient of atmospheric oxygen (O2) was demonstrated by Stillwell et al. (2020). The ability to measure water vapor (WV) in the lower troposphere remains the most mature and has been successfully deployed in several field experiments.1
This paper presents the latest details of our diode-laser-based lidar architecture, which is being developed to provide quantitative atmospheric profiling. In Sect. 2 we start with a discussion of active remote sensing approaches that currently seem promising for addressing the need for a ground-based thermodynamic profiling network and highlight where MicroPulse DIAL is a unique approach. In Sect. 3 we provide an overview of the MPD Gen 5 lidar architecture. In Sect. 4 we take a step back to provide some background and history of the MPD development, highlighting some field test results which occurred during the transition from Gen 4 to Gen 5 to provide context for why certain design choices have been made. In Sects. 5 and 6 we delve into the technical details of the Gen 5 transmitter and receiver architecture, respectively. We explain design trade-offs and show laboratory test results validating the design choices. Section 7 provides an overview of the data processing techniques. In Sect. 8 we discuss the validation of the latest instrument design, which includes initial field testing and intercomparisons with radiosondes. We end with a summary and provide conclusions.
The aforementioned diode-laser-based lidar architecture references – Spuler et al. (2015), Hayman and Spuler (2017), and Stillwell et al. (2020) – begin with a comparison of technology approaches for profiling the lower atmosphere, including radiosondes, passive remote sensing (infrared and microwave radiometers), and active remote sensing (elastic backscatter lidar, DIAL, and Raman lidar). A review of atmospheric profiling techniques is also included in the MPD water vapor validation publication by Weckwerth et al. (2016), which further included GPS receivers. We do not repeat that information here and point readers to the extensive review of technologies, including space-borne ones, for profiling atmospheric thermodynamic variables by Wulfmeyer et al. (2015). We will only briefly review the status of active remote sensing technologies that currently show potential to enable “national-scale”, ground-based thermodynamic networks.
Raman lidar is the only active remote sensing technology with a proven ability to provide accurate range-resolved water vapor and temperature profiles. It uses a transmitter with less stringent requirements on the laser than narrowband DIAL. However, arguably the technique is currently not well suited for large-scale networks. The most challenging issue is fundamental to the method – inelastic Raman scattering is several orders of magnitude less efficient than elastic scatter used by the DIAL technique. Therefore a Raman lidar requires significantly higher laser power than a DIAL to achieve similar performance, assuming equal optical efficiency. The high laser power requirement limits the use of fiber optics and diode lasers, which are likely critical steps towards cost-effective and robust commercial units. It also makes achieving the eye-safety classification considerably more difficult. Although not fundamentally necessary, in practice, operational Raman lidar systems use radiosondes as ancillary measurements for calibration, which increase operating costs. This also means they typically agree quite well with the ancillary observations to which they are calibrated and are poorly suited to identifying the biases in those ancillary observations.
Diode-laser-based broadband DIAL has recently developed as a profiling technology to measure water vapor (Newsom et al., 2019; Mariani et al., 2020, 2021). It is an attractive alternative to narrowband DIAL as it is a simpler technological approach with less stringent spectral requirements on the laser source. Technologically, the primary difference is the spectral width of the transmitted laser light. Broadband DIAL emits a band of laser frequencies several tens to hundreds of gigahertz wide (much broader than a single water vapor absorption line), whereas narrowband DIAL emits a band no wider than a few hundred megahertz. Relaxing the spectral requirements of the laser comes at a performance cost along with other design trade-offs. First, the spectrally broadband source restricts using one of the best solar background rejection tools – narrowband filters in the receiver. For narrowband DIAL, filter widths can be reduced to just a few gigahertz without rejecting the desired signal, limited only by the width of the Rayleigh–Brillouin scattered spectrum. With broadband lasers, narrowing the receiver spectrum becomes a zero-sum game, where reducing receiver bandwidth serves to attenuate background and signal equally. The only way to overcome this issue of detectability is to move to higher pulse energies and sacrifice the eye-safe classification. As a result, broadband DIAL will have reduced performance (e.g., reported maximum ranges are typically limited to less than 1.5 km a.g.l.). As currently demonstrated, broadband DIAL also requires calibration. The laser spectral width term is nudged, independently for near and far range channels, to adjust the retrieved WV values to match ancillary measurements. Narrowband DIAL is a unique active remote sensing technique that does not require ancillary calibration and relies only on fundamental theory for its retrievals. A further trade-off is the inability of broadband DIAL to be optimized to the atmospheric conditions. In contrast, one can spectrally tune a narrowband DIAL system to make equally high-quality water vapor measurements over a wide range of atmospheric conditions. Sideline tuning is the most straightforward method. It adjusts the absorption cross section by changing the laser frequency while using accurate knowledge of the absorption line shape from spectral databases (e.g., one may use Voigt profiles to estimate the absorption line shape as a function of altitude). In this manner, one can optimize the measurement for a wide range of moisture conditions. Note that lidar researchers often use a one-way column optical depth of ≈1.1 as a rule of thumb for maximizing resolution in photon-counting DIAL (Remsberg and Gordley, 1978). However, optimal performance depends on several instrument and atmospheric factors. For this reason, we typically determine when to adjust the wavelength of the MPD by monitoring the Cramér–Rao lower bound of the water vapor signal as a function of wavelength. In practice, to optimize a narrowband DIAL, only a small amount of wavelength tuning is required. For example, for the MPD at 828 nm, approximately 5 GHz (or several picometers in the infrared) of sideline tuning adjusts the absorption cross section by 1 order of magnitude.
To provide an overview of the design, we introduce the schematic of the Gen 5 MPD instrument, shown in Fig. 1. Details of the history, design trade-offs, and testing that led to this instrument version are included in later sections of the paper. The schematic is shown in two main parts. The subcomponents shown in blue represent the parts needed to make water vapor measurements, whereas the subcomponents in green are needed to make the temperature measurements. The added temperature profiling components allow for the measurement of differential absorption of oxygen at 770 nm and the simultaneous backscatter ratio (via the HSRL technique) using a potassium vapor cell in the receiver as described in Stillwell et al. (2020). The work presented here focuses on general architecture changes that pertain to both the WV and the temperature profiling capabilities of the MPD. However, the specific subcomponent testing and instrument validation presented are for the water vapor measurements only.
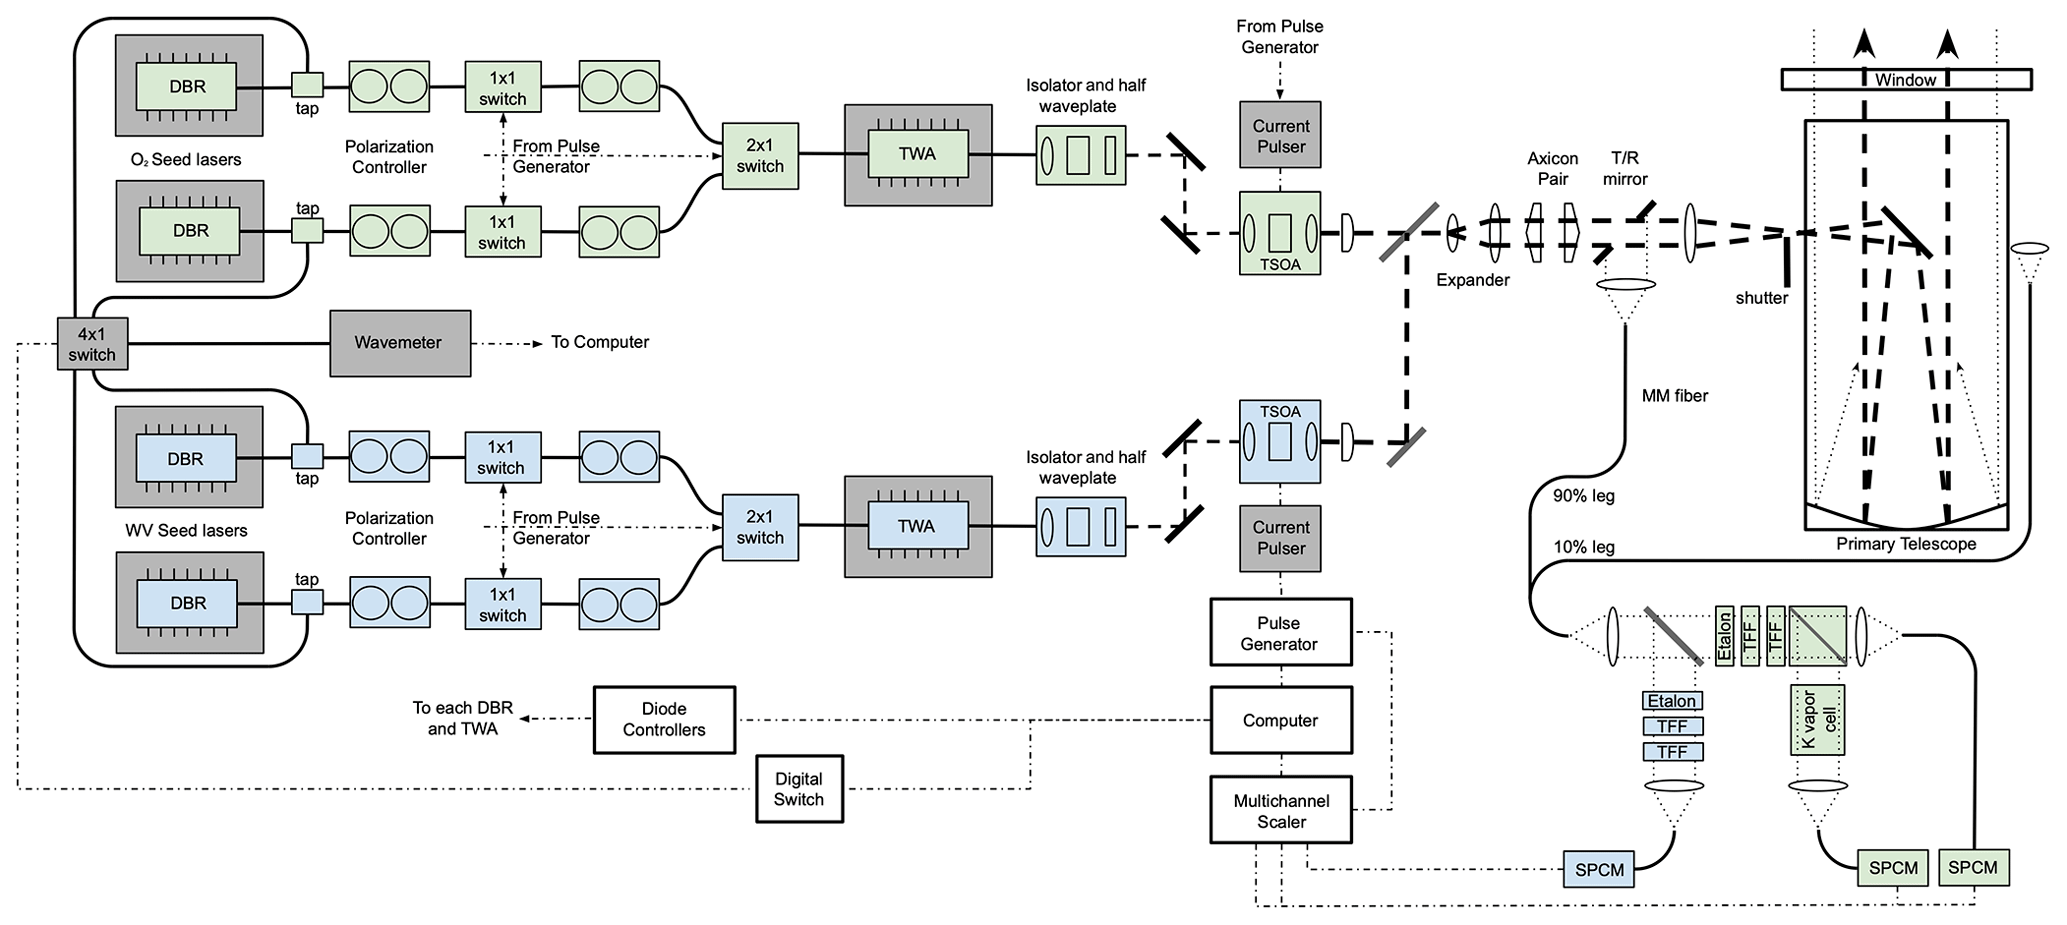
Figure 1The Gen 5 MPD schematic shown configured with water vapor (blue) and temperature (green). Note that power monitoring is not shown in the schematic. Abbreviations used: distributed Bragg reflector (DBR), traveling wave amplifier (TWA), tapered semiconductor optical amplifier (TSOA), transmit/receive mirror (T/R), multimode (MM), thin-film filter (TFF), and single-photon-counting modules (SPCMs).
A few of the key changes from the Gen 4 transmitter design are highlighted here. As is common in DIAL instruments, each transmitter starts by emitting two spectrally narrow seed laser frequencies – one tuned to absorb at the species of interest (online wavelength) and the other tuned to have minimal absorption (offline wavelength). A two-stage fiber-coupled seed laser, which is more robust and provides more power in the amplifier, has been added. The transmitter uses single-mode fiber, and the correct polarization for subsequent components is maintained using paddle-style controllers that use stress-induced birefringence produced by wrapping the fiber around a spool to create half-wave plates. The fiber is secured to the bench to avoid movement and maintain the alignment. The seed light is launched into free space and coupled into a tapered semiconductor optical amplifier (TSOA), which is overdriven in pulsed-current mode operation. Following the TSOA an angled window is placed in the beam path to reflect a small portion of light onto an amplified photodiode used to monitor the relative transmitted power level (note that these components are not shown in the schematic). The transmit path following the TSOA is the same as described in Spuler et al. (2015) – except for the remotely controllable shutter used for receiver scans, described below – and is only briefly reviewed here. The TSOA amplified beam is expanded two times, shaped with an axicon pair, passed through a hole in an elliptical mirror, and expanded an additional 20 times with the transceiver optics (f=60 mm lens; 400 mm diameter, Newtonian telescope). The annular beam is expanded and transmitted to the atmosphere using the inner half of the telescope's diameter.
The receiver has a few significant changes. A multimode (MM) fiber is used as the field stop for the primary telescope, and it is combined with a fiber-coupled wide-field-of-view (WFOV) telescope, which had been added next to the primary telescope. A spool of 5 m fiber, which is not shown in the schematic, is used before the filtering stage to attenuate cladding modes due to overfilling as described later in the paper. The fiber-coupled combined receivers use a shared filtering stage and are fiber-coupled to single-photon-counting modules (SPCMs). The photon counts are summed in a newly designed multi-channel scalar (MCS). As discussed later in the paper, these receiver design changes were made to improve the technology readiness (i.e., make it more robust) and improve the performance closer to the surface.
At the time of this writing, five MPD units have been constructed as a network test bed. One unit of the five units is in the complete configuration shown in Fig. 1. One instrument in the network has added components that use a 780 nm HSRL with a rubidium vapor cell as described in Hayman and Spuler (2017). The remaining three units contain the components required for water vapor profiling only. The MPD architecture is modular by design and can easily accommodate these different configurations. Although they are not highlighted in this paper, we implemented many software and mechanical improvements to increase the functionality, stability, and reliability of the MPD design.
We take a step back here to give a brief history of the MPD development to provide context for why certain design choices have been made. The seminal research for atmospheric water vapor profiling with semiconductor-based lasers was done by Nehrir et al. (2009, 2011, 2012). These papers discuss the early MPD development and span technology generations 1, 2, and 3. These instruments used external cavity diode lasers (ECDLs) to seed a tapered semiconductor optical amplifier. They were “laboratory-only” instruments – primarily due to the temperature sensitivities of ECDLs. A collaboration with MSU and NCAR began in 2011 to enable the technology to move out of the laboratory. The first step was to work with an industry partner to develop a distributed Bragg reflector (DBR) laser at 828 nm wavelength to avoid temperature mode hopping issues with the ECDL lasers. The MSU and NCAR partnership co-developed the Gen 4 MPD, creating an instrument capable of field deployments with significant performance improvements (Spuler et al., 2015). A prototype portable field enclosure () was developed after this publication and integrated with the water vapor MPD instrument for subsequent field studies.
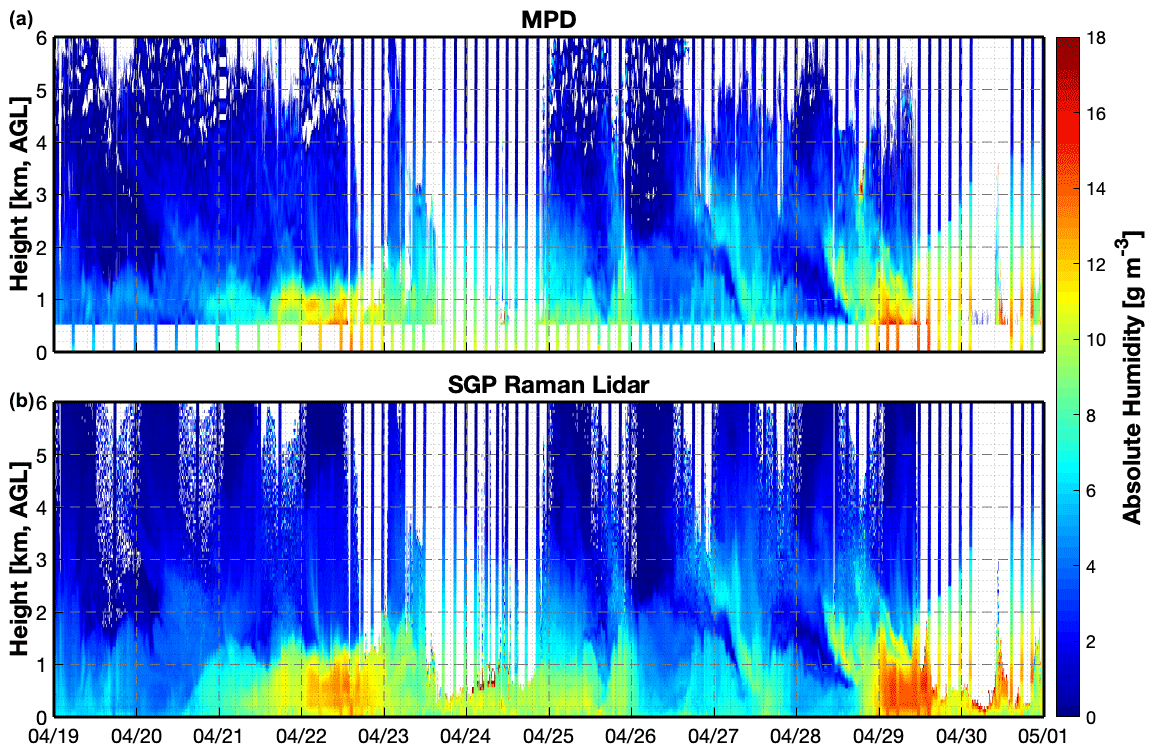
Figure 2Twelve days of data from the MPD Network Demonstration field test. Absolute humidity from 0–6 km a.g.l. as measured by the Gen 4 version (prior to upgrade to Gen 5) of the MPD05 unit without a near-range channel (a) and the SGP Raman lidar (b). Both Raman and MPD data are at 10 min temporal resolution. The radiosonde absolute humidity data are overlaid on both plots.
In 2016, after an extensive validation study of the Gen 4 performance by Weckwerth et al. (2016), NCAR and MSU began constructing five MPD profiling instruments – to make a network test bed available to the science community. The initial field demonstration of the five-unit network occurred in April–July 2019 at the Department of Energy (DOE) Atmospheric Radiation Measurement (ARM) Southern Great Plains (SGP) atmospheric observatory in Oklahoma, USA2. The primary goal was to evaluate the engineering performance of the MPDs in a deployment setting. It also offered the opportunity to validate them against more mature instruments further and investigate atmospheric moisture variability. During this field project, the “MPD05” unit was at the site's central facility, collocated with the SGP Raman lidar and radiosondes that were launched by the ARM staff approximately every 3 h. The other four units were spaced approximately 50 km apart in a box pattern surrounding the center site. The placement of MPD05 provided many independent ancillary water vapor profile measurements. An example of validation against the Raman lidar and radiosondes is shown in Fig. 2. The two plots have time on the x axis (12 d) versus the height above ground level (a.g.l.) on the y axis (from the surface to 6 km). The upper figure shows the absolute humidity measured by the MPD during this time. The 77 radiosondes (Vaisala RS41) launched during this time are overlaid on the figure as vertical color bars. The lower figure shows the absolute humidity measured by the SGP Raman lidar (also with the radiosonde overlays). The most notable difference between the two continuous remote sensing measurements is the white bar on the bottom of the MPD absolute humidity. The lowest ranges were not included since the Gen 4 version of MPD05 did not have a near-range receiver installed during the test. A frequency histogram of this time series is shown in Fig. 3 for each measurement technique. Both active remote sensing techniques agree well with the radiosondes, with least-square linear fit slopes and correlation coefficients close to 1. It is worth noting that the correlation between Raman lidar and radiosondes is expected to be near 1 as the lidar is calibrated from the same sondes while the MPD retrievals never make use of the radiosonde data at any point and are truly an independent measurement. The network field campaign confirmed a very high correlation between the more mature measurement methods when the MPD data were confined to ranges 500 m a.g.l. Furthermore, the field test was a significant milestone as the first demonstration of continuous, high-vertical-resolution water vapor profiles from a DIAL network. However, the testing also revealed that several instrument modifications were needed before the MPD test bed was made available to the larger scientific community and led to the Gen 5 design described below.
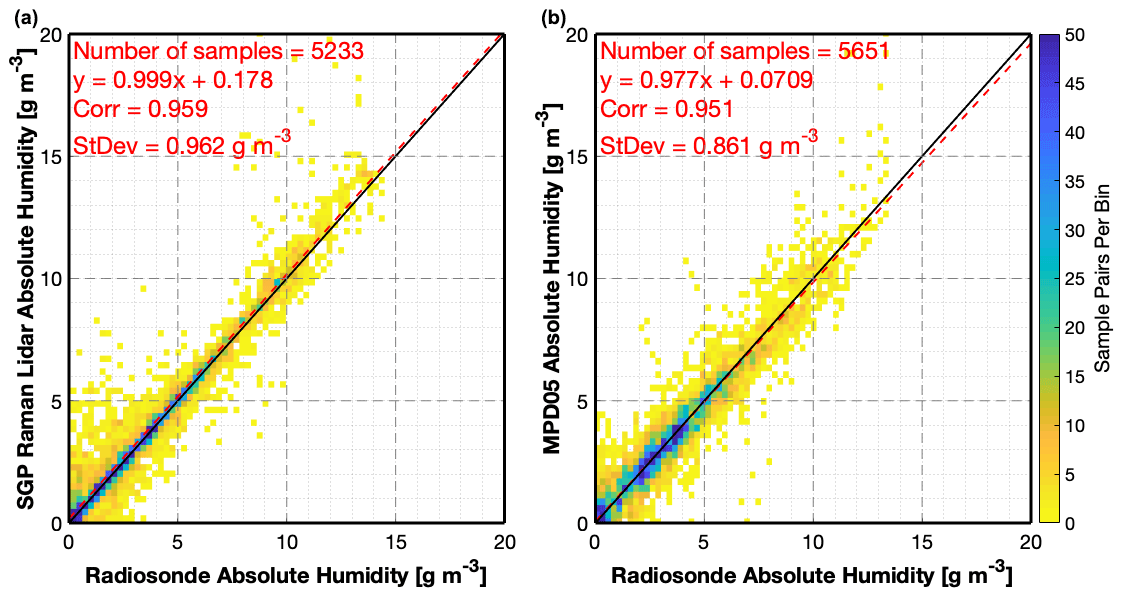
Figure 3Frequency histograms showing the correlation between the SGP Raman lidar (a) and Gen 4 MPD05 (b) with 77 collocated radiosondes between 19 April and 1 May 2019. The colors indicate the number of sample pairs per bin, with 0.1×0.1 g m−3 bin sizes. The correlation between Raman lidar and radiosondes is expected to be near 1 as the lidar is calibrated from the same sondes while the MPD retrievals are run independent of the radiosonde information.
There is scientific value in measuring atmospheric variables throughout the atmosphere. Depending on location (latitude and longitude) and topography, many important processes are confined to or prominently occur at low altitudes, including land–atmospheric feedback, turbulent and latent heat fluxes, convection initiation, and chemical transport. Equally, the upper-tropospheric state is critical to understanding inflow and outflow from mesoscale convective systems, long-range transport of aerosols, and cloud radiative effects. There is, therefore, a desire to measure the whole atmosphere, but a practical limitation is present in the design of all lidar systems. In the case of MPD, expanding scientific utility equated to extending the operational range to lower altitudes. For the last several years – intertwined with the network test bed construction – we have focused on addressing the scientific needs for better accuracy closer to the surface, while also improving the instrument architecture's technological readiness and enabling quantitative measurements of aerosols and temperature. Table 1 shows some of the key parameters of the different generations. The general trend has been to replace free space optics with fiber-coupled components to improve stability and reduce sensitivity to thermal drifts.
Table 1Key parameters of the MPD generations. Distributed Bragg reflector (DBR), external cavity diode laser (ECDL), pulse repetition frequency (PRF), receiver (Rx), thin-film filter (TFF), tapered semiconductor optical amplifier (TSOA), traveling wave amplifier (TWA), transmitter (Tx), water vapor (WV).
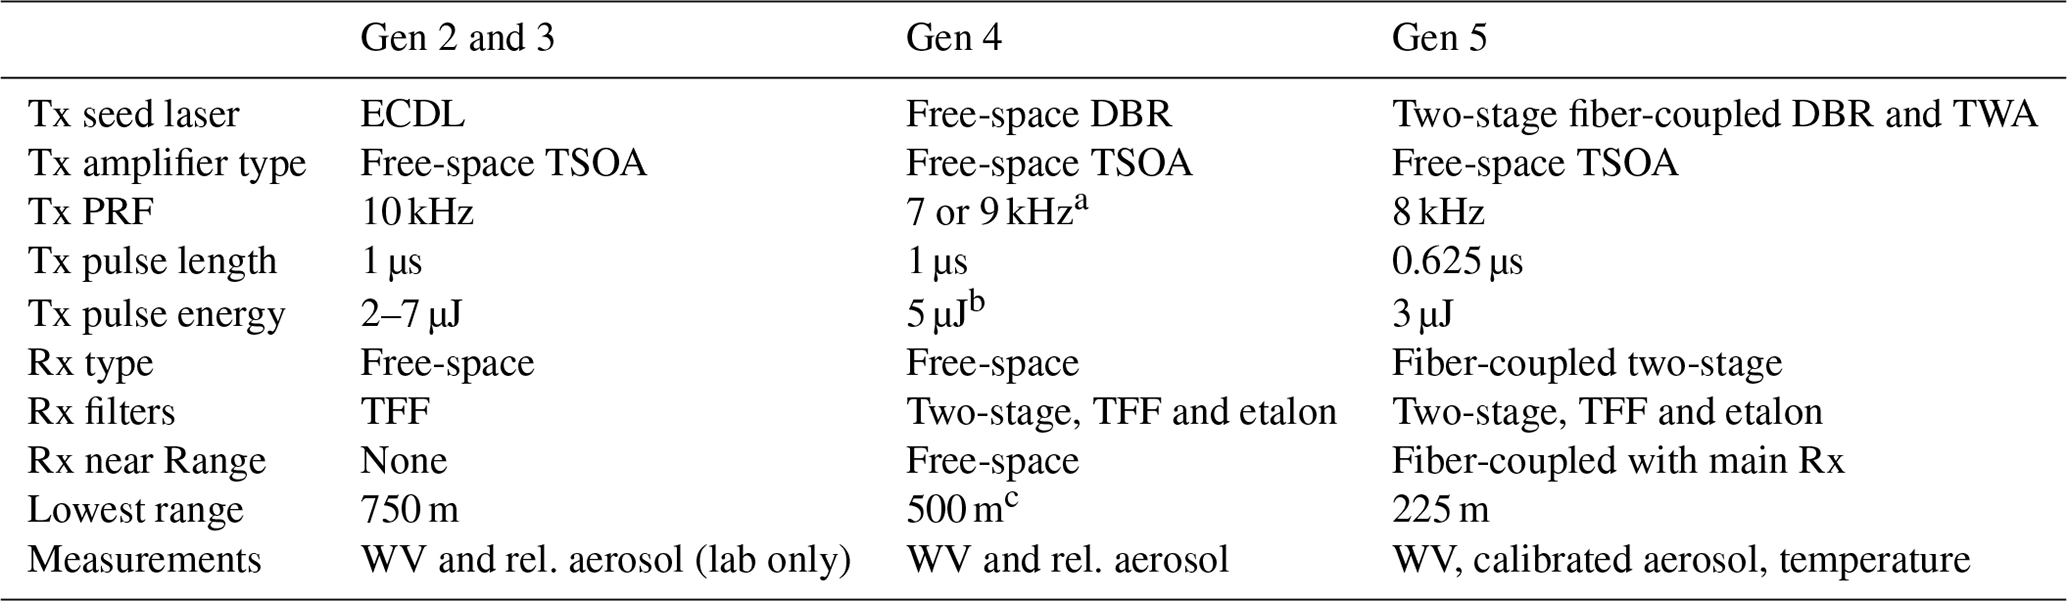
a The Gen 4 MPD ran at 9 kHz for the 2014 FRAPPÉ field campaign but then reduced to 7 kHz starting with the 2015 PECAN field campaign. b The reduction in pulse energy due to design changes to make the transmitted beam eye-safe with increased optomechanical stability. c Gen 4 MPD instruments without the free-space near-range receiver.
The MPD transmitter architecture is founded on single-frequency laser diodes. These devices are much less powerful than narrowband solid-state lasers (crystal/glass media doped with rare-earth or transition metal ions) historically used for quantitative atmospheric lidar methods of DIAL and HSRL (e.g., Piironen and Eloranta, 1994; Wirth et al., 2009; Späth et al., 2016). The reduction in power requires longer averaging times to achieve adequate signal-to-noise ratio (SNR) levels, and therefore lidar instruments based on laser diodes are (currently) only suitable to observe atmospheric phenomena at longer timescales. However, diode lasers have the significant advantage of being lower in cost and more rugged for field operations, especially when fiber-coupled. For this reason, we have incorporated more fiber coupling into the master oscillator power amplifier transmitter architecture used in the MPD. In the previous generation, light emitted from a free-space DBR seed laser was collimated with an aspheric lens, circularized using an anamorphic prism pair, isolated from optical feedback with a Faraday rotator, polarization-controlled with a half-wave plate, and coupled into a single-mode fiber with an aspheric lens. These subcomponents were held in mechanical cage mounts as shown in the solid model in the left panel of Fig. 4. The free-space packaging was very stable in lab conditions and had shown adequate stability in the first-generation MPD field enclosure environment during field tests. However, during field testing all five MPD units in 2019, some of the free-space modules had inadequate stability for multiple-month unattended operations. This instability required highly trained staff to service some of the instruments since aligning the module required a high degree of expertise.

Figure 4Solid model of the free-space seed laser package (left) and the butterfly-packaged seed laser (right). These devices are essentially the same in the sense that they provide several milliwatts of continuous-wave laser light in single-mode fiber; however, the optomechanical stability and the knowledge required to align them are substantially different. The butterfly package's heat sink, which has a footprint of approximately 90 mm × 90 mm, is not shown.
Following the network field demonstration, a newly available butterfly-packaged fiber-coupled DBR seed laser (Photodigm PH828DBR 020 BF-ISO) was tested as a replacement to the free-space packaging (see Fig. 4). The package contains a similar set of optical subcomponents to the free-space version – including an isolator needed for stable single-mode operation. However, the robustly aligned subcomponents inside the sealed package have improved optomechanical stability and reduce the technical skill required to service the instrument. This butterfly-packaged seed laser can provide adequate seed power into the final amplifier stage yet requires a high drive current to do so (due to higher insertion loss of the internal Faraday isolator), which could adversely impact the device lifetimes. Therefore we chose to add a booster stage – a butterfly-packaged traveling wave amplifier (TWA) – to allow the seed laser to operate at a lower drive current. The two-stage fiber-coupled seed laser components are shown in Fig. 1. A fiber tap connected to the DBR laser directs 10 % of the light to a wavelength meter (Bristol 671A-NIR) used to frequency lock the seed laser wavelength. The remaining 90 % passes through a series of 1×1 and 2×1 fiber-coupled electro-optic switches (Agiltron NSSW-11 and NSSW-12, respectively) to interleave and alternate the online and offline lasers while maintaining high isolation from one another. The fiber-coupled TWA (SuperLum SOA-352-830-DBUT-SM) amplifies the interleaved seed laser signals. The TWA output light is launched into free space and coupled into a TSOA (Eagleyard EYP-TPA-0830-01000), which is overdriven in pulsed-current mode operation (Takase et al., 2007; Nehrir et al., 2012)3. We began testing this transmitter configuration in August 2019. Ongoing lifetime tests of these units have demonstrated the ability to operate the DBR seed laser and TWA for >13 000 h and counting. The TSOAs have lifetimes well above this duration, showing multi-year operation and counting.
We tested the new seed laser architecture to ensure it has (1) sufficient power to operate the final amplifier stage in gain saturation and (2) spectral properties – frequency stability, linewidth, and spectral purity – needed for the DIAL technique. As established in the literature, to keep water vapor DIAL systematic errors below 10 %, the transmitted laser must have wavelength stability of MHz; a linewidth of <400 MHz; and a spectral purity – or the fraction of total laser power contained within the “linewidth” – of >99.5 % (Ismail and Browell, 1994). For temperature measurements using the DIAL technique, the transmitter requirements are more stringent – wavelength stability of ±100 MHz, linewidth <250 MHz, and >99.9 % spectral purity (Wulfmeyer, 1998). Throughout this paper, we will adhere to the more stringent spectral requirements for temperature.
5.1 Power output
In the latest transmitter design, the DBR seed lasers are operated just above 5 mW (well below the nominal 25 mW limit imposed by the maximum drive current). Roughly half of the light reaches the booster stage due to insertion losses from the optical switches used to interleave the online and offline seed lasers. The TWA booster stage amplifies the output up to 20 mW – below the manufacturer's recommended 30 mW maximum to avoid optical damage to the fiber end. The typical current required for this amplification level is 50 % of the allowed maximum. Following the 10× gain of the TWA booster stage, the light exits the single-mode fiber. It is collimated with an aspheric lens (f=4.6 mm, NA =0.53), passes through a Faraday isolator, and is polarization-aligned with a half-wave plate. The isolator typically has a 1 dB loss, so approximately 16 mW of optical power can seed the TSOA. A pair of mirrors and an aspheric lens (f=4.5 mm, NA =0.55) couple the light into the 3 µm×3 µm square input aperture of the TSOA. The amplified light, which exits a 3 µm×190 µm output aperture, is astigmatic with a general divergence of . Actual astigmatism and divergence are slightly dependent on the operational parameters due to minor changes in the TSOA substrate index of refraction that depend on the electronic pumping rate. The transmitter is typically operating at a variety of pulse durations (0.5 to 1 µs) and pulse repetition frequencies (7–10 kHz). Therefore, a lens pair – an aspheric (f=4.5 mm, NA =0.55) and a cylindrical (f=50 mm) – are aligned to produce a collimated beam on both axes at these nominal operational conditions. The cylindrical lens is tilted slightly to avoid back reflections to the TSOA.
We measured the input “seed” power versus output power for a range of conditions to map out the TSOA performance. The results are shown in Fig. 5. For the plot shown, the TSOA was driven with 0.625 µs at 8 kHz repetition rate current pulses. However, the general trend was the same when tested at 1 µs and 7 kHz. From these results, we conclude that the final stage amplifier output is well into the saturated gain region at seed input powers exceeding 15 mW for all drive currents. For the range of drive currents tested, 6 to 12 A, there is a nearly linear increase in the TSOA output power with increasing drive current, at roughly 1 W peak power per 1 A drive current when operated in the saturated gain region. In this region, the final stage gain is when using a 10 A drive current.
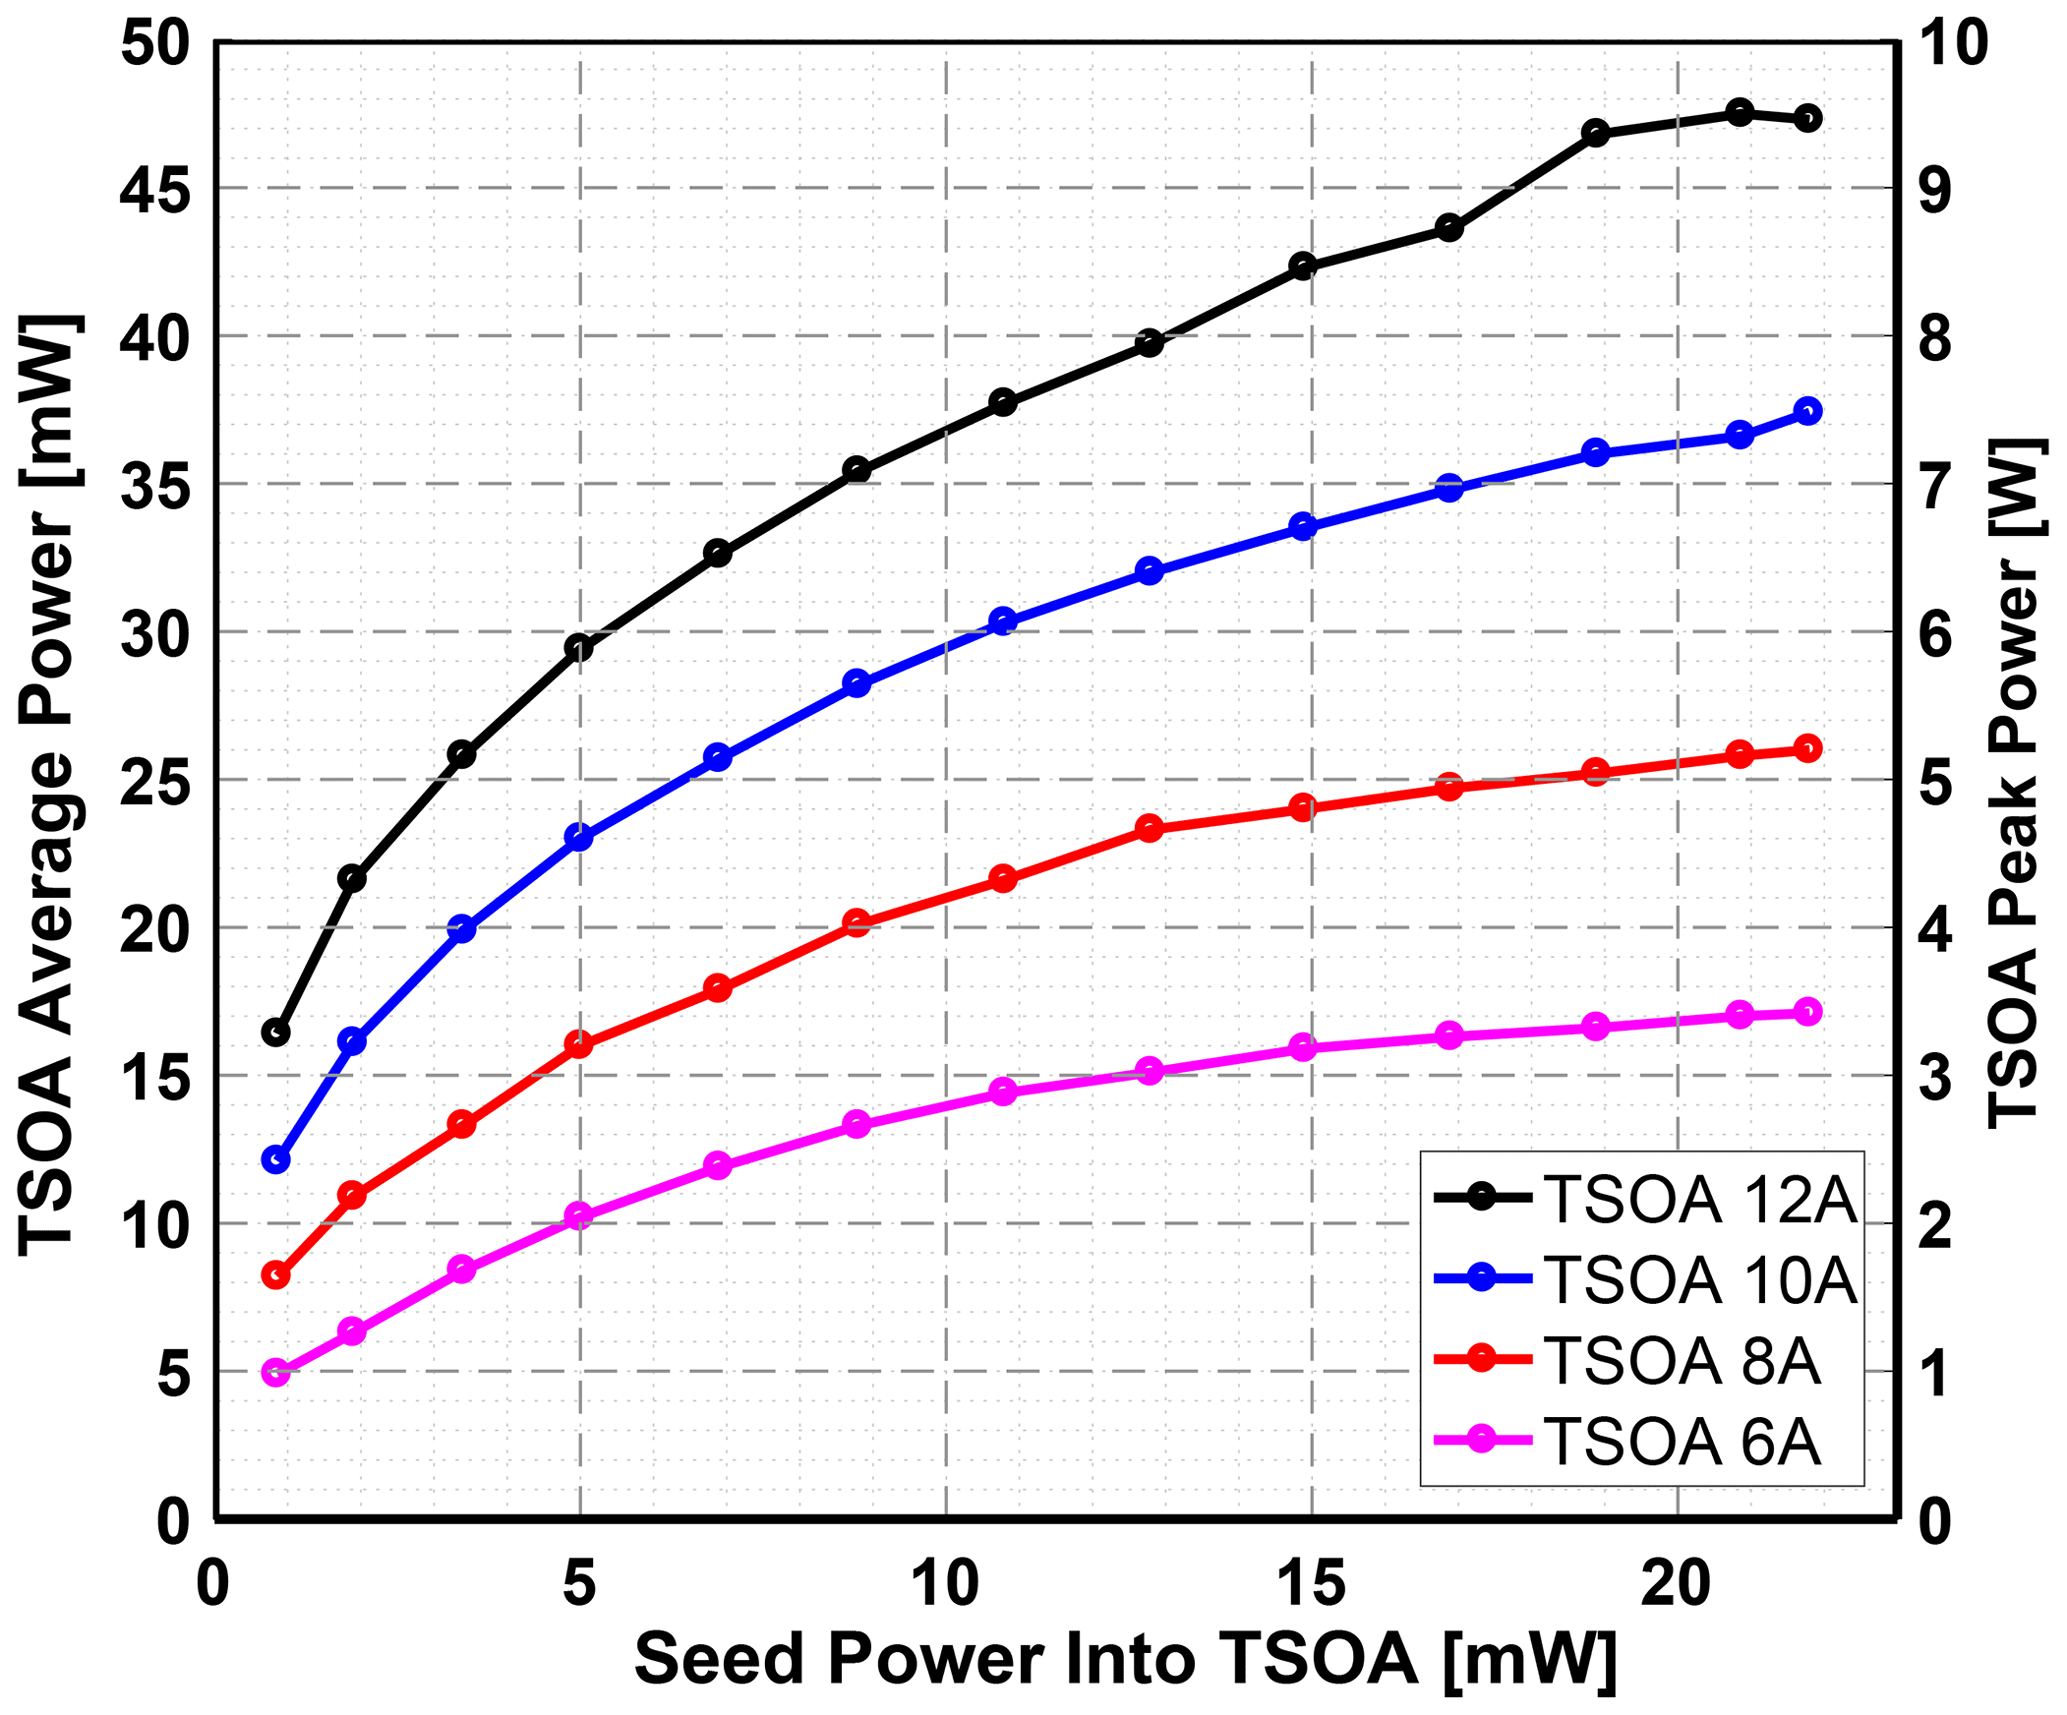
Figure 5Power output of the free-space TSOA seeded with the two-stage butterfly-packaged seed laser module. TSOA operated with 0.625 µs duration 8 kHz pulses at the drive current shown.
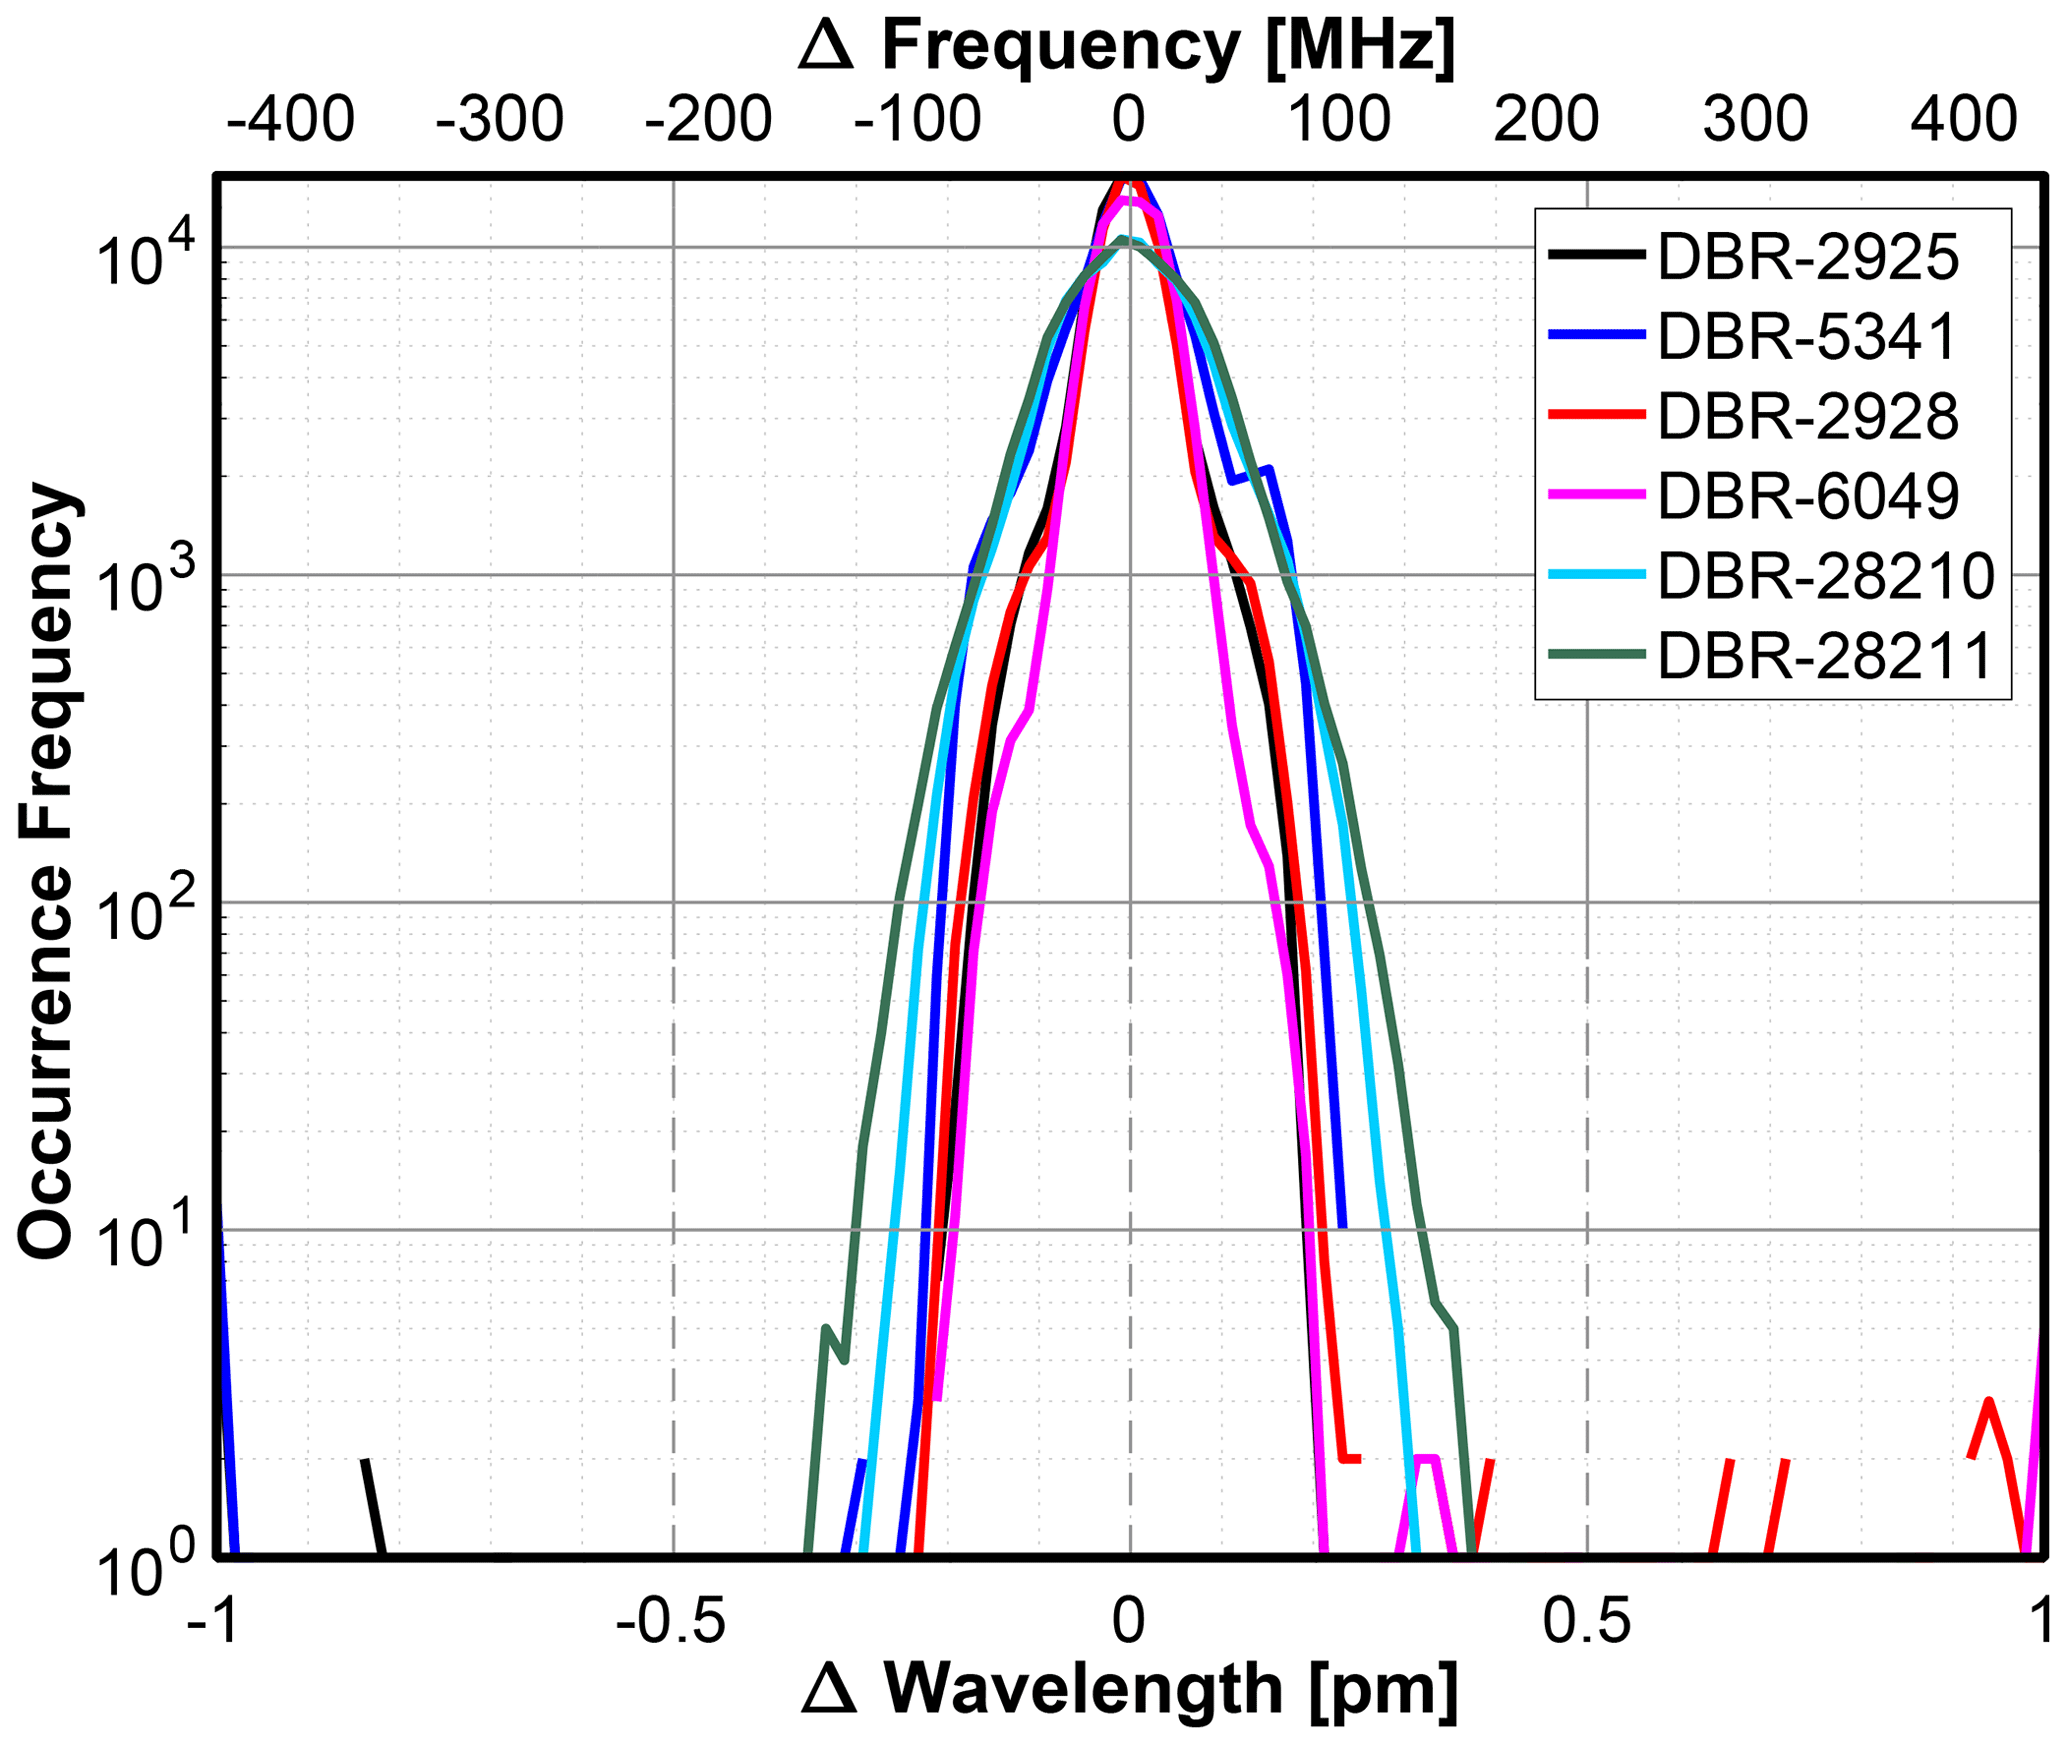
Figure 6Wavelength stability of six different fiber-coupled DBR lasers over a period of 10 d (1 January 2020 at 00:00 UTC to 9 January 2020 at 24:00 UTC). The time period was chosen to represent steady-state operation and contained no user-defined system changes. Data are measured with a wavelength meter from a 10 % tap of the fiber-coupled seed lasers.
5.2 Frequency stability
The stability of the MPD transmitter is driven by the seed lasers, assuming adequate power at each amplifier stage. The seed laser wavelength stability was measured using the operational laser locking routine developed for the MPD instrument. Several fiber-coupled seed lasers have been operated for months to verify stability within the required ±100 MHz. While there are some differences in the characteristics of the fiber-coupled diodes, they all exhibit standard deviations on the order of 20–30 MHz4. Figure 6 illustrates a histogram of data collected over 10 d of continuous measurement from six seed lasers. The best-performing seed laser had a standard deviation of 19 MHz, while the worst case observed was 36 MHz. This frequency stability is sufficient for both water vapor DIAL and temperature DIAL.
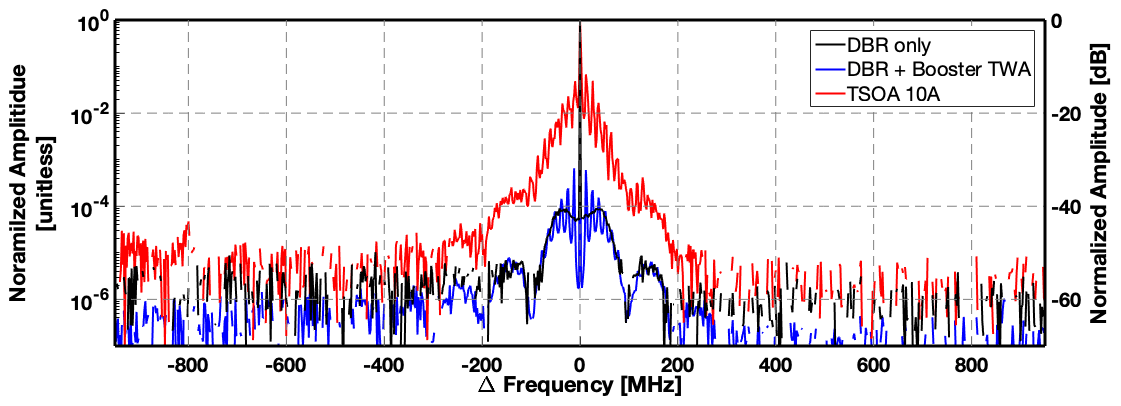
Figure 7Spectra of butterfly-packaged DBR seed laser (black), seed and booster TWA (blue), and final amplifier stage output (red). The DBR seed (5.5 mW) and DBR plus booster amplifier (19.5 mW) are continuous wave. The TSOA output was pulsed (39 mW average power, 7.8 W peak power with 625 ns duration pulses at 8 kHz) and has >99.9 % of the energy contained within the central ±100 MHz spectral region.
5.3 Linewidth and spectral purity
The linewidth – defined as the central mode's spectral width – of the fiber-coupled DBR seed laser was <1 MHz full width at half maximum (FWHM) operating at a nominal wavelength of 828.2 nm and 5 mW. Details of how the spectral purity was measured are included in Appendix A. The spectrum, shown in Fig. 7 as the black trace, has a side mode suppression ratio (SMSR) of >40 dB. With the addition of the booster stage, when operated at a drive current to bring the power up to 20 mW, the linewidth remains the same (albeit with some ripple around −40 dB side mode) shown in the blue trace in Fig. 7. The spectrum of the final amplified beam, via a well-seeded free-space TSOA at nominal operating conditions, is shown as the red trace in Fig. 7. Although the SMSR decreases to 15 dB, it is confined within a narrow region around the central band, so the amplified pulse has suitable spectral width properties for both water vapor DIAL (<400 MHz) and temperature DIAL (<250 MHz).
Spectral purity considers the multimode structure of the laser and is also critical for the DIAL technique. For this work, we define spectral purity as the amount of power in the center ±100 MHz over the remaining 1.8 GHz spectrum. The DBR seed, both alone and when used with the booster stage, was measured to be >99.9 %, which was the resolution limit of the test setup. Figure 8 shows a plot of the pulsed transmitter output's spectral purity as a function of input seed power for a range of operating conditions. The curves (colored black, blue, red, and magenta) are defined by the current applied to the final amplifier stage. As shown in the figure, increased seed power is required to maintain high spectral purity with increasing electrical pumping of the amplifier. So the transmitter spectral purity is a function of the TSOA drive current and the seed power coupled into the amplifier. Although higher drive currents allow for more power amplification (refer to Fig. 5), more seed power is required to maintain a high level of spectral purity. The new two-stage seed laser makes it easier to reach (and exceed) the required power levels. With the extra capacity in the components and current drivers, it is straightforward to remotely increase the power to maintain spectral purity and power during a long deployment (e.g., in the case of component power degradation over its lifetime), enhancing the system's operational reliability and robustness.
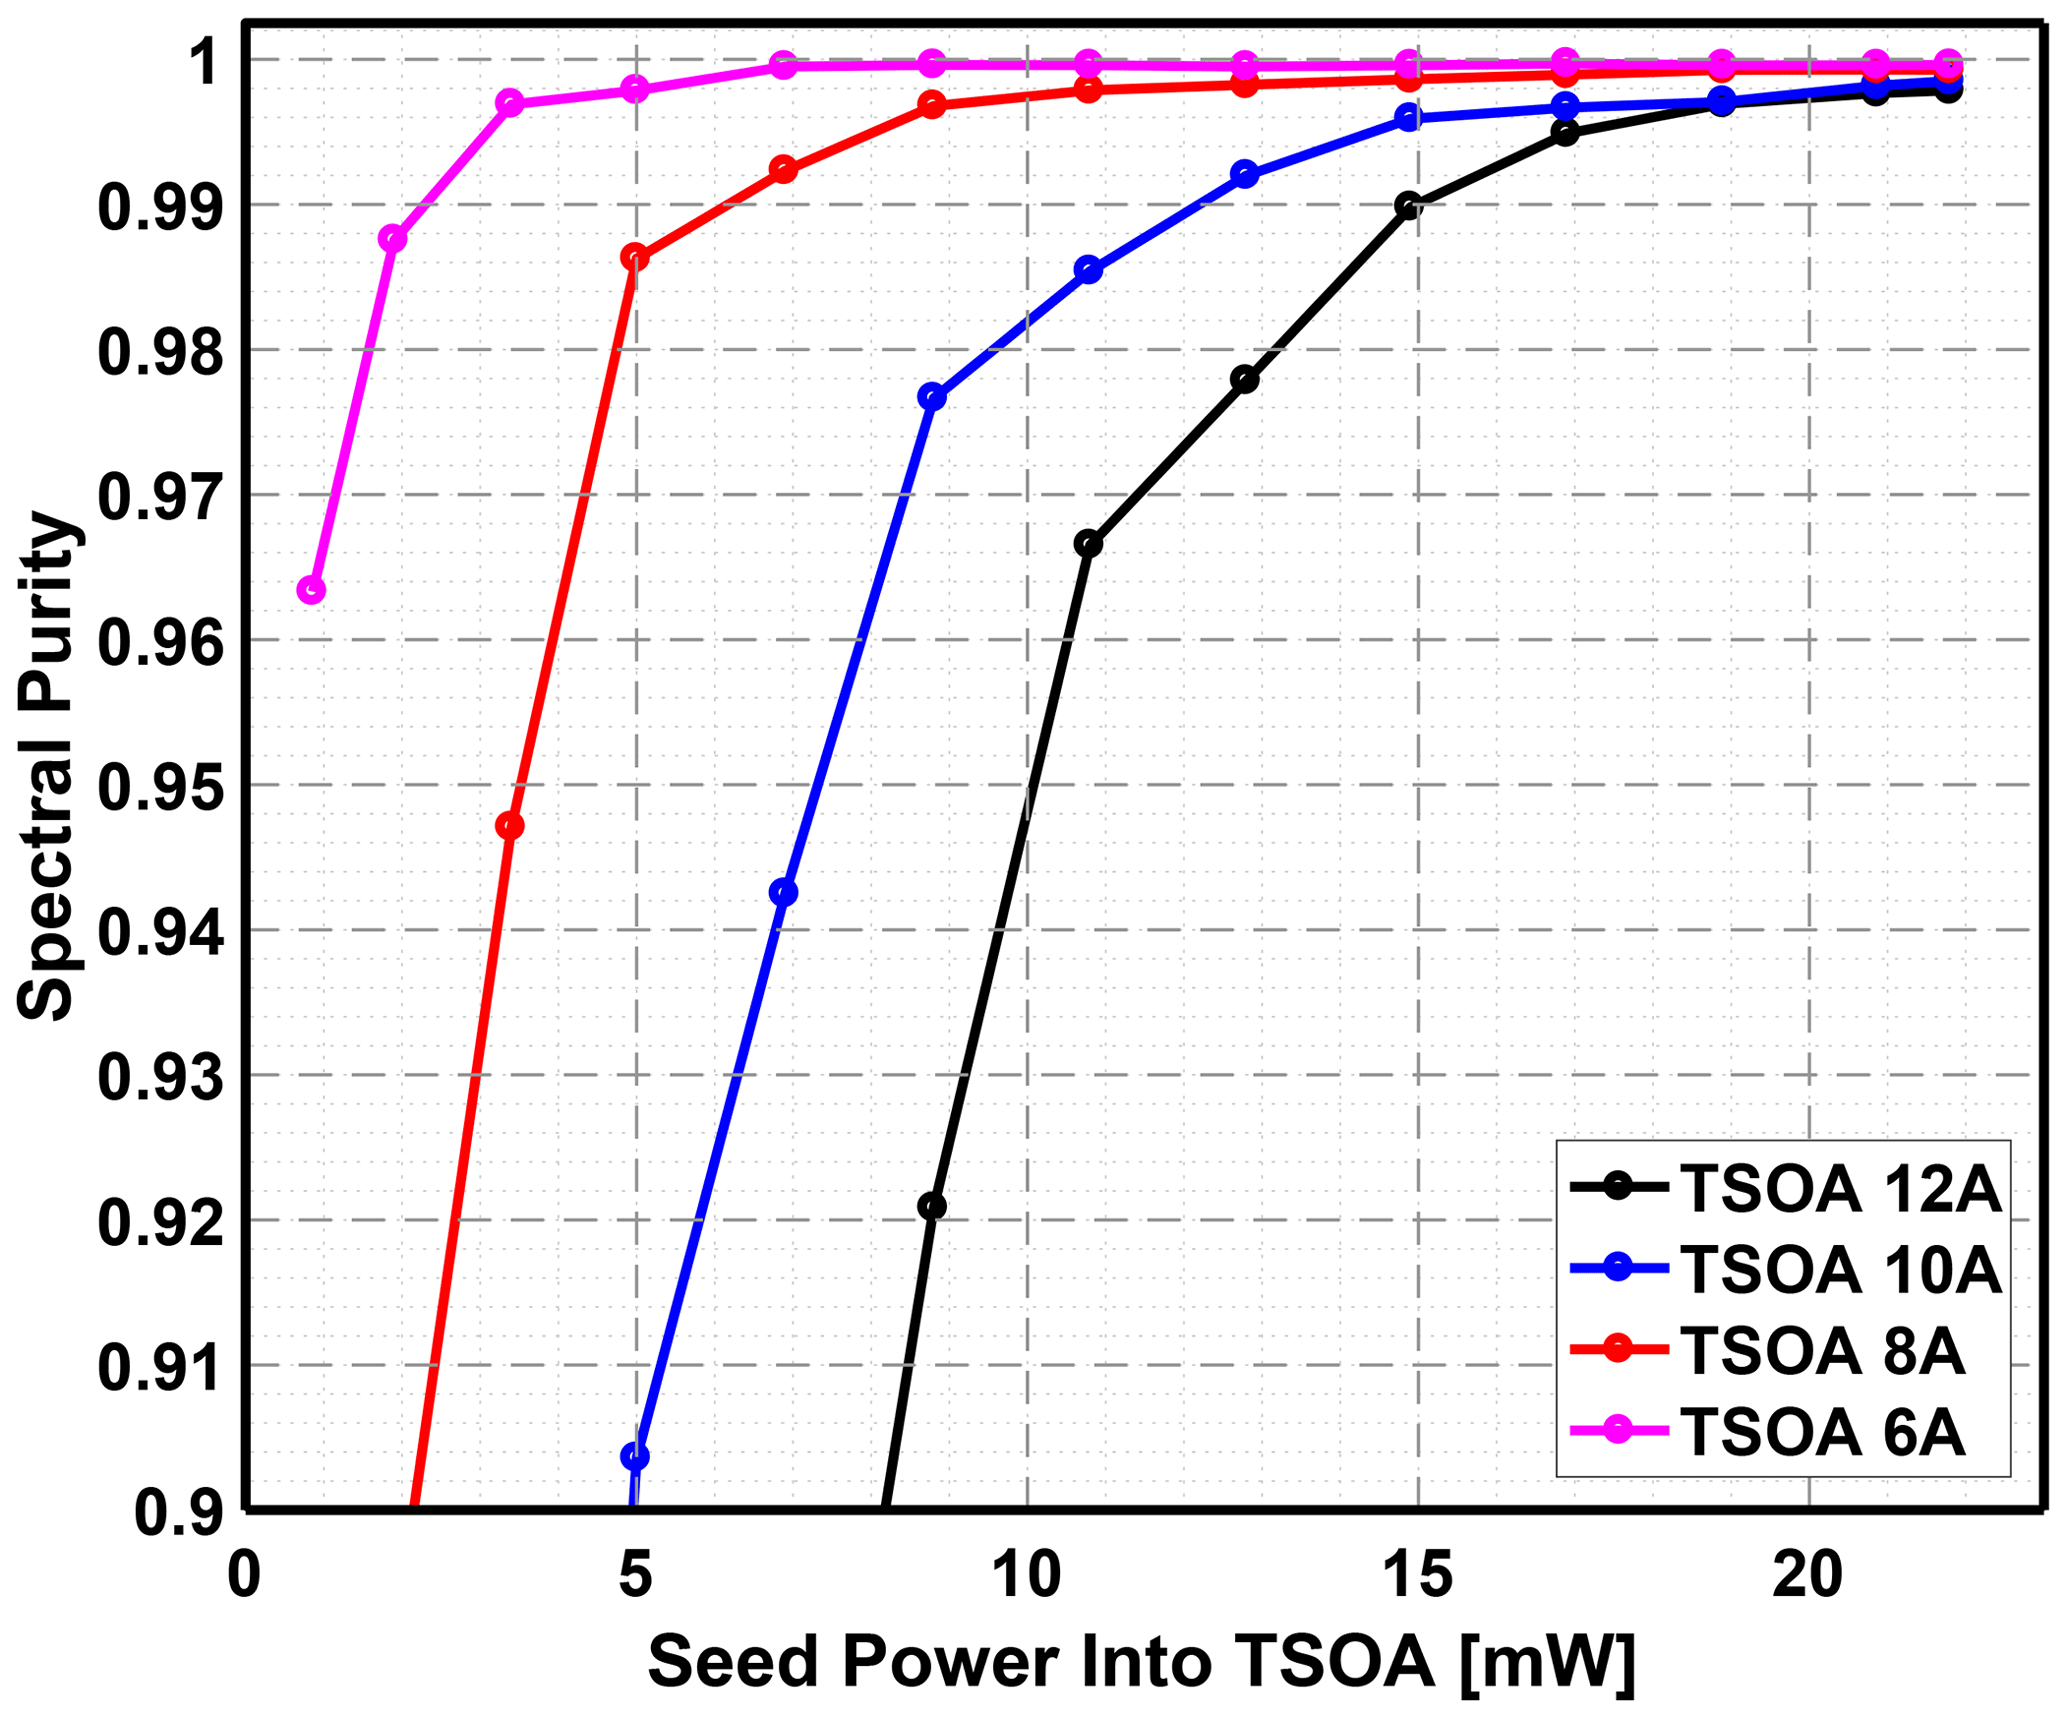
Figure 8Spectral purity of fiber-coupled seed laser and free-space TSOA for a range of drive currents and seed powers. TSOA operated at 8 kHz for a duration of 0.625 µs. The spectral purity was defined as the amount of power in the center ±100 MHz divided by the remaining 1.8 GHz band.
As previously mentioned, to maintain an allowable systematic DIAL error for atmospheric measurements in the lower troposphere, one can use the rule-of-thumb spectral purity requirements (Ismail and Browell, 1994; Wulfmeyer, 1998). However, one can also calculate a direct description of DIAL error based on the measured spectra and the model spectral absorption feature used for the DIAL measurement. The fractional error in absorption is thus the assumed absorption (where the laser spectrum is a delta function) divided by the actual absorption:
where σest is the estimated absorption cross section for an ideal laser, σact is the actual absorption cross section, l(λ) is the normalized laser spectrum such that , σ(λ) is the frequency resolved absorption cross section, and λ0 is the laser line center wavelength.
Figure 9 shows the accuracy in absorption for the two-stage fiber-coupled seed laser package and free-space final amplification stage operated at 10 A. This analysis assumes that the laser transmission wavelength (λ0) is tuned to the center of the absorption line, which is likely to be a worst-case scenario for Rayleigh–Doppler effects (Späth et al., 2020). The accuracy for water vapor and oxygen absorption is >99.99 % and >99.95 %, respectively, for seed powers greater than 15 mW. Therefore, it seems reasonable to conclude that seed powers >15 mW provide more than adequate spectral purity properties for the MPD transmitter for both water vapor and temperature measurements.
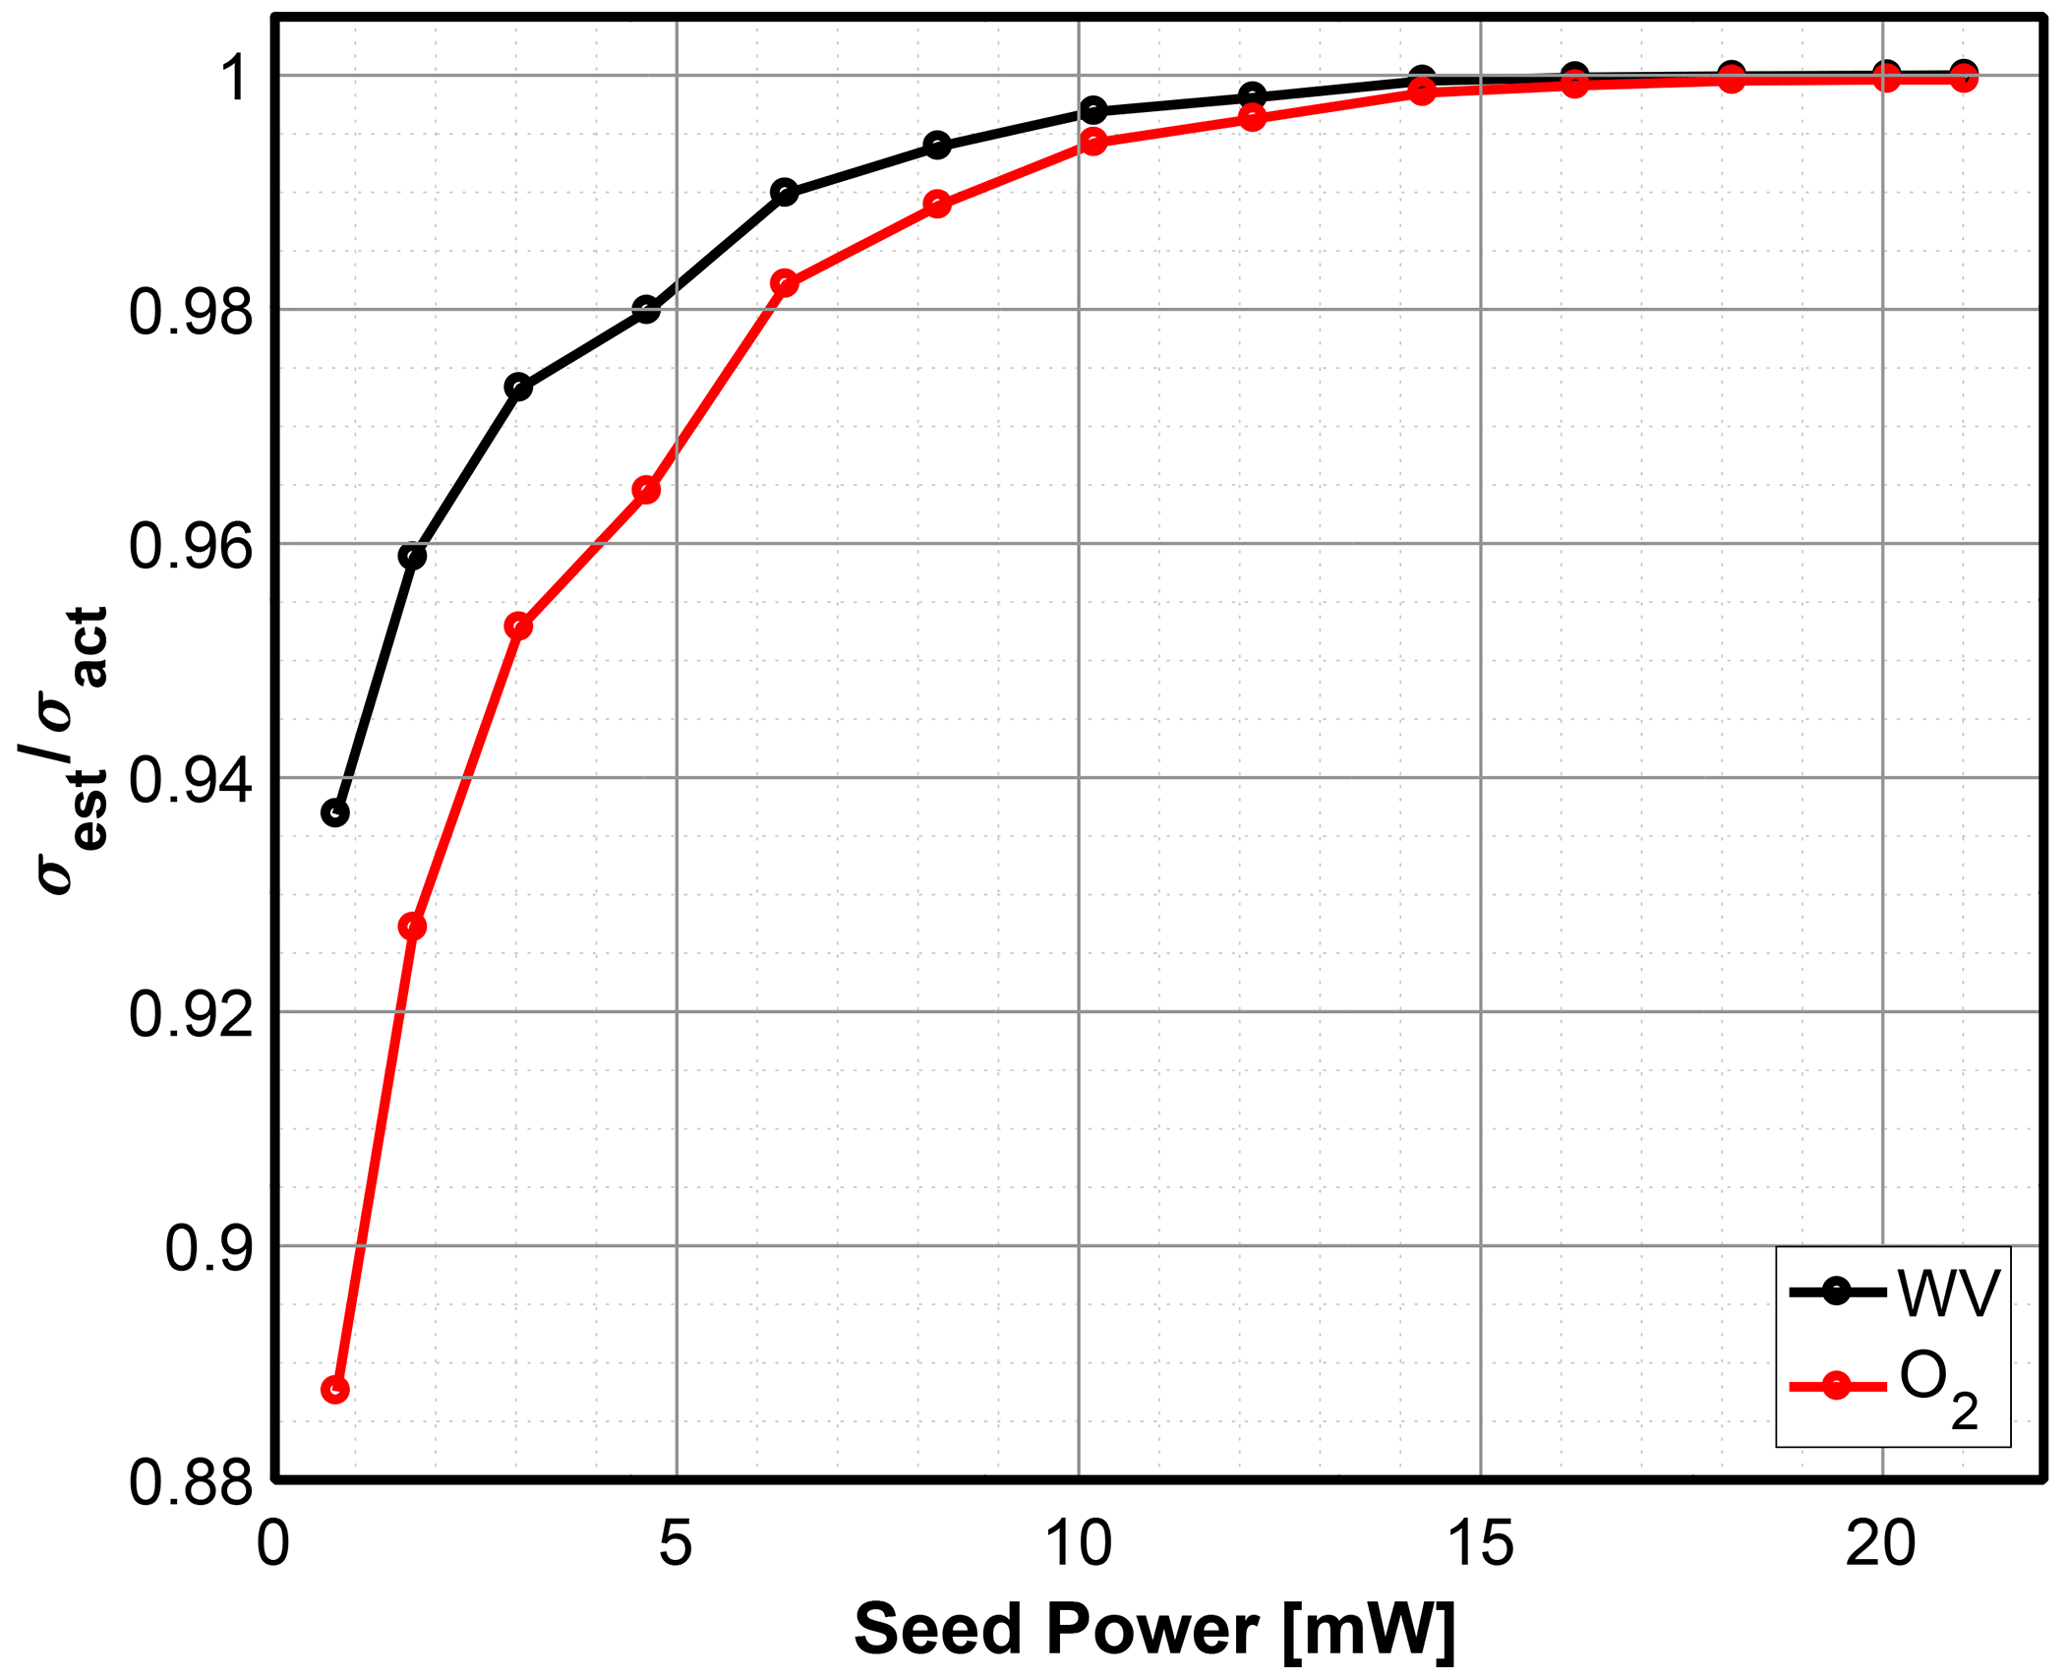
Figure 9Accuracy in absorption cross-section estimate for water vapor (black) and O2 (red) – which is used to measure temperature – for a 10 A TSOA pulse at 8 kHz for a duration of 0.625 µs.
A critical element of the MPD architecture is using the same amplifier for online and offline seed lasers and the same detector to measure both atmospheric profiles for DIAL measurements. Therefore another aspect of spectral purity that is important to the MPD design is measuring leakage in the optical switches used to alternate the online and offline seed lasers. Crosstalk in the switches could result in a bi-modal seed, which would not be noticeable in the test setup described so far; since the receiver bandpass is designed to pass both online and offline wavelengths, it is a possible spectral purity contamination source. So, as described in the receiver section below, the instrument was designed for automatic receiver scans to measure both the receiver bandpass and the isolation between the online and offline wavelengths. To ensure the spectral purity specification of 99.9 % is maintained, isolation greater than 30 dB between online and offline is monitored and verified.
In summary, the fiber-coupled two-stage seed laser package meets the requirements for a DIAL transmitter and is suitable for measuring water vapor and temperature. These fiber-coupled subcomponents replaced the free-space seed laser and significantly progressed the state-of-the-art transmitter regarding ease of fielding and stability. This advancement increases the MPD instrument's overall technology readiness for DIAL (water vapor and temperature) and HSRL measurements.
The MPD receiver uses two solar background reduction techniques – a narrow field of view and narrow bandpass filtering – that enable the observation of individual photons backscattered from the atmosphere during the day and in all weather conditions. There are inherent trade-offs with each of these design features. For example, as will be discussed in more detail later, a narrow-field-of-view receiver is inefficient at capturing light from ranges close to the surface. Some lidar systems avoid this problem with a second receiver or multiple channels to see both low and high or by using beam-scanning units (e.g., Radlach et al., 2008; Reichardt et al., 2012; Newsom et al., 2019). There is a delicate trade-off between observational capability, cost, system complexity, and scientific utility. This trade-off is magnified when developing a lidar system for an eventual large-scale network. As will be described below, improving the instrument collection efficiency at lower ranges while maintaining high solar background suppression is a way to enhance measurements closer to the ground surface. However, pushing the measurement capabilities closer to the ground while keeping instrument costs low requires straightforward methods (i.e., without introducing the complexity and cost of a beam scanner or duplicating filter/detector stages).
6.1 Narrow-field-of-view receiver
A narrow-field-of-view receiver has a design trade-off which makes measurement close to the surface difficult. The range where the “object” (i.e., the footprint of the transmitted beam scattering from the atmosphere) can be imaged onto the receiver without clipping at the field stop is known as the region of “full overlap” in the lidar discipline. The MPD primary receiver does not achieve a full overlap until an approximately 3 km range (see Fig. B1). When ignoring any secondary mirror effects, simple geometrical optics define the range to full overlap. Using the hyperfocal distance , a distance of km is expected.5 Light rays from shorter ranges arrive at steeper angles, which are rejected by a narrow-field-of-view design. For the MPD, this effect results in low collection efficiency, <1 %, at ranges below 500 m. Although the overlap function cancels out in the absorbing species' measurements – the DIAL technique uses a ratio of two signals within a shared receiver field of view – the low receiver efficiency close to the surface increases uncertainty. To improve performance closer to the surface, the instrument designer wants to improve the receiver light collection efficiency at lower ranges without increasing the overall solar background levels.
6.2 Wide-field-of-view receiver
A free-space wide-field-of-view (WFOV) channel was initially part of the Gen 4 MPD design to improve collection efficiency at the lower ranges (Spuler et al., 2015). Although useful for alignment, this configuration was not used for data analysis in practice (Weckwerth et al., 2016). There were several problems with this approach. First, it was not straightforward to combine the two signals. Each dataset had to be processed independently, and the Gen 4 WFOV channel used the same primary receiver telescope and had a significantly higher background rate, which introduced uncertainty and limited the useful daytime range. Second, the additional channel doubled the file size and data transfer needs. Finally, the separate filtering stage module and detector added optomechanical complexity. Overall this approach reduced the instrument technology readiness level with minimal improvements to low-range performance. We needed to reduce the background level introduced by the WFOV channel and develop a more rugged and elegant design.
This balance was achieved in the Gen 5 receiver with the addition of a small-diameter refractor telescope and a multimode fiber coupler. This design allowed the primary receiver to be ruggedly combined with a “near-range” receiver and share the filtering stage and the photon-counting module. The combined primary and WFOV receivers were designed to retain similar light gathering capabilities (i.e., background levels) to the stand-alone primary receiver in order to maintain the same daytime performance. We provide details of these design considerations and plots of the theoretical overlap function and the receiver aperture-normalized signals in Appendix B. The WFOV receiver uses an off-the-shelf 80 mm focal length refractor telescope with a clear aperture of 45 mm (Thorlabs C80FC-B) mounted next to the primary receiver telescope. A 2×1 multimode fiber coupler (Thorlabs TM105R1F1A; 105 µm diameter, 0.22 NA) receives the light from each of the telescope receivers in separate legs before entering a common filtering stage. In order for this to work for a photon-counting application, we added black aluminum tape to the multimode splitter's fiber sections to make them light-tight.6 The primary telescope receiver is connected to the 90 % leg of the fiber splitter, while the 10 % leg connects to the refractor telescope receiver. The combined signal fiber connects to a common path filter stage followed by a fiber-coupled single-photon-counting module. A key feature of the design is that the receiver signals pass through the filters at essentially the same angles and travel the same path since the light launches out of a shared multimode fiber. Furthermore, the design avoids the complexity and expense of adding a second receiver. It is also easier and more repeatable to align and more compact than a purely free-space module.
6.3 Narrowband filtering
The MPD receiver uses a filtering stage constructed from two parts to isolate signal photons from background sunlight. The first stage is a solid fused-silica Fabry–Pérot etalon that transmits several wavelengths, including those centered on the absorption lines of interest. The 25 mm diameter custom etalon (manufactured by Light Machinery) is housed in a temperature-controlled (<0.02 ∘C) mount that allows for rotation (±3∘) in one plane. The second stage is a thin-film interference filter (custom-made by Alluxa with a 0.75 nm nominal FWHM bandpass) that transmits the narrow band around absorption lines of interest while stopping those other wavelengths passed through the etalon. The combination of filters passes an ultra-narrow band (<50 pm) centered on the absorption lines of interest. The physics of the etalon and the thin-film interference filters are essentially the same – relying on constructive/destructive interference of light reflecting between surfaces – and they can be tuned by tilting or changing the temperature (both filter passbands will shift to a shorter wavelength at higher incidence angles, with the etalon passband additionally shifting to shorter wavelengths with decreasing temperature). These high-performance filters are custom-designed for each filtering stage; i.e., the thin-film filters and etalons are created uniquely for the WV receiver and the temperature receiver.
For the MPD receiver, the light enters the filtering stage receiver via a 0.22 NA, 105 µm diameter multimode fiber. The receiver optics – a fiber-port-mounted aspheric lens (f=11 mm) and a 2.25× expander (comprised of a negative 20 mm and positive 45 mm doublet lens pair) – collimate the light exiting the multimode fiber. The multimode fiber diameter is used as the field stop and limits the maximum entrance angle to the filter stage. At the filter, the beam divergence is , where d is the diameter of the fiber, f is the focal length of the collimating lens, and M is the magnification of the expander. Therefore, assuming a 100 % fill condition of the fiber core, the maximum range of angles at the filter is 2.1 mrad. In practice, however, the receiver fiber can have an “overfilled launch condition” when imaging distances close to the instrument. Therefore, it is expected that light backscattered from shorter ranges would more readily travel through the fiber cladding and generate higher-order cladding modes. Increased attenuation of these higher-order modes occurs with increased fiber length, so the MPD uses a 5 m long multimode fiber before the filtering stage to minimize these higher-order cladding modes. An example of an overfilled launch condition, with an effective fiber diameter of 125 µm, increases the maximum angle range to 2.5 mrad. This applies to both telescopes as they use the same receiver optics.
Wulfmeyer and Bösenberg (1998) provided details on how interference filters may be a potential source of accuracy errors in the water vapor DIAL retrieval due to the angle-dependent bandpass as mentioned above. A recent publication by Späth et al. (2020) explicitly calls out the prior MPD lidar architecture, with its use of narrowband filters in the receiver, as having “range-dependent sensitivities due to angle effects in the near range”, citing a derivation in Wulfmeyer and Bösenberg (1998). However, the derivation cited omits the use of a field stop on the receiver system. The standard method to alleviate the concern raised is to simply add the stop. The Gen 5 MPD has the field stop prior to the filtering stage, thereby limiting the angles at the filter to <3 mrad. To experimentally verify that MPD does not have “range-dependent sensitivities”, two sets of tests have been performed. First, we ran tests with fiber lengths up to 10 m and found no evidence of higher-order cladding modes causing changes to the observed WV field. Second, through receiver passband scanning, described below, we found that observed transmission functions of the filters and etalons can be explained with a narrow set of angles, less than approximately 3 mrad, which is consistent with the expected angle limit based on the diameter of light contained within the fiber core. As a result, we found no evidence that the new MPD design has any inherent “range-dependent sensitivities” when properly assembled and aligned.
6.4 Receiver passband scanning
The ability to automatically scan the receiver in frequency, and obtain accurate knowledge of the etalon bandpass, is key to enabling higher-quality water vapor and temperature measurements. We developed a method inspired by the technique developed and employed by the University of Wisconsin for HSRL to inject the seed laser light into the receiver to achieve this capability (Ed Eloranta, personal communication, 2016). The TSOA is turned off for this step (i.e., there is no concern about damaging back reflections or different amplification characteristics), and the small amount of seed laser light that leaks through the TSOA is backscattered from a shutter into the receiver and scanned to map out the receiver passband transmission. The specific software control procedure is to (1) step down the laser power by turning off the TSOA, (2) switch data acquisition to accumulate the continuous-wave seed laser signals, (3) alter the laser locking behavior to scan rather than lock to a single wavelength, (4) control the position of a rotary-solenoid-mounted shutter used to scatter light back into the receiver, and (5) collect data from a frequency scan sequence. This design allows the receiver transmission as a function of wavelength to be mapped in a repeatable fashion without physically modifying the receiver/transmitter optics or overall optical alignment. This ensures that the operational characteristics of the receiver are closely matched to the data acquired during the scan.
An example receiver scan is shown in Fig. 10. During this scan, the offline laser was active, and the online laser was turned off at the controller. Although there is only one laser active, the 1×1 and 2×1 optical switches used to combine online and offline seed lasers are still alternating. Therefore, during this offline scan, any light that ends up being recorded as “online” in the data acquisition system occurs when the switches are set to pass the online laser, and what is being measured is the offline light leaking through the optical switches. The red trace in Fig. 10 is the measurement of the offline-to-online crosstalk.

Figure 10Etalon profile from a receiver scan of MPD02 from 22 September 2020. The measured data points are shown along with a model fit (solid line) to the data. The model reflects the range of angles – up to 3 mrad as expected from the multimode fiber and receiver optics' combined output before the etalon. The scan indicated the etalon bandpass is 1.3 GHz (3 pm) FWHM, and the isolation between online and offline seed lasers is 31.6 dB. The incident angle weights are nonzero between 0 and 3 mrad with a peak at 2 mrad.
The measured data points are shown along with a model fit to the data in Fig. 10. The fit to the scan observations is based on a physical description of the etalon which significantly reduces the effect of noise in the scan. The observed photon count signal is modeled as follows:
where sn(λ) is the mean number of photon counts as a function of wavelength λ and the subscript n is the detector channel designation corresponding to the optical switch state (e.g., when the switches are set to pass the scanned laser, n=1; when the switch states are open to the scanned laser, n=2), gn is a gain term describing the efficiency with which the scanning laser is detected for the designated switch configuration, b is the background common to both channel designations, and the total etalon transmission model is
This transmission model is effectively a weighted sum of a single-mode etalon (perfectly collimated light) based on the distribution of angles incident on the etalon. The term w(x) is a fit term containing the incidence angle weights as a function of x=cos θ, where θ is the angle between the optical wave vector and the etalon normal. The single-mode transmission of the etalon is given by
with additional fit terms F and δ0.
We assume the recorded photon counts are Poisson distributed (this is a valid assumption because the photon arrival rate is low enough to be treated linearly related to the incident photon flux). In order to obtain the maximum likelihood fit, the negative log likelihood of a Poisson distribution is minimized:
where is a set of all the fit terms and yn(λ) are the observed photon counts on the nth detection channel as a function of wavelength.
This scan methodology and the subsequent model fits allow us to verify several performance traits of the system. First, we see that the etalon's exact measured shape can be explained by a limited subset of angles entering the etalon (verifying, among other things, the functionality of the fiber as a field stop). Second, we can verify the isolation of the optoelectronic switches used to interleave the MPD pulses by taking the ratio of the fit gains for the open and closed switch configurations (). Finally, these scans allow us to accurately verify and map the receiver's transmission as a function of wavelength with low statistical error, which is useful for atmospheric retrievals and system diagnostics such as verifying the angle/temperature of the bandpass filters and etalon. One example of this utility is remotely setting the online and offline wavelengths and confirming the receiver's passbands are properly centered on those wavelengths. As described in the Introduction, changing the wavelength is done to alter the MPD's sensitivity to water vapor.
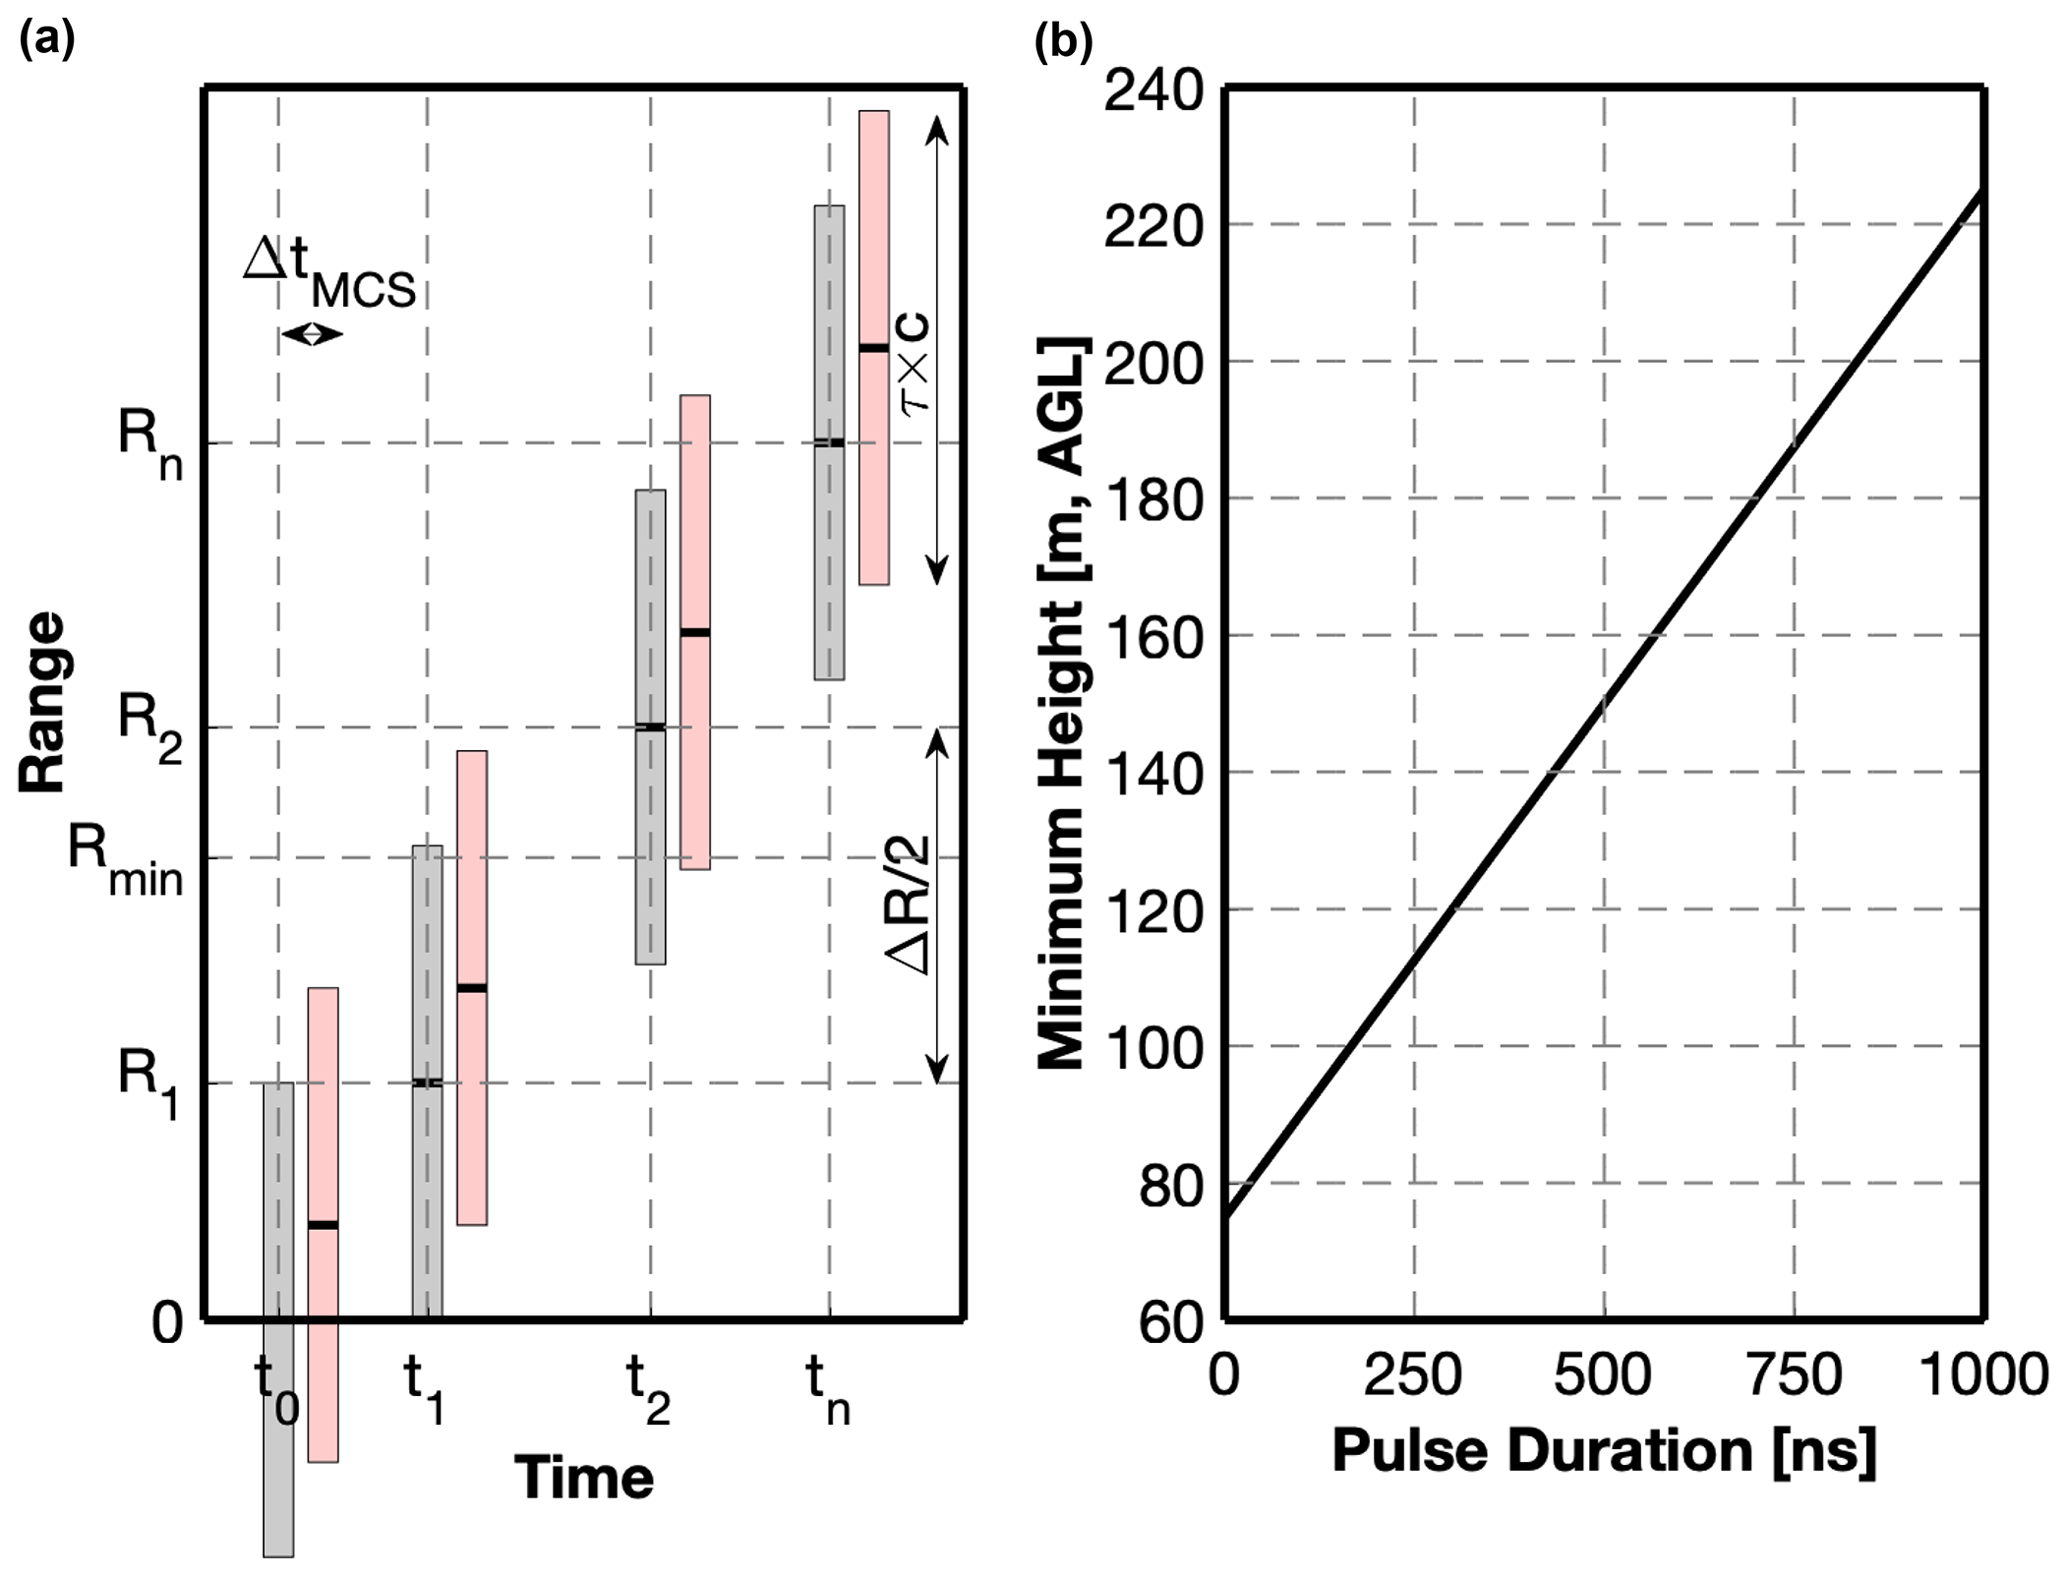
Figure 11The theoretical minimum range of a DIAL system. Panel (a) shows the relationship between time and range. The gray bars' total height represents the laser pulse's length. The adjoining red pulse represents the shift in range during the photon accumulation time. Panel (b) shows the minimum range achievable as a function of pulse length for an MPD operating with 250 ns photon accumulation bin width and ΔR=150 m.
6.5 Detector considerations
The transmitted pulse length and the detector response introduce design trade-offs for the MPD architecture. With the diode-laser-based architecture, we want to use relatively long duration laser pulses to increase the average power (i.e., improve the SNR), but that, in turn, limits how close in range the absorption measurements can be made. A simple model of the shortest observable range can be developed by linking the duration of the laser pulse, τ; the distance needed to make an absorption measurement, ΔR (which is a two-way, out-and-back distance); and the finite duration of the photon accumulation time, ΔtMCS, set in the multi-channel scalar (MCS). This absolute limit is depicted in Fig. 11. If we define the range, R, from the laser pulse center, the first range where the detector is not blind from the outgoing laser pulse is R1, where and c is the speed of light in air. The next range used to make the DIAL measurement occurs at R2, where . The average of the pair of range bins is the DIAL instrument minimum range, when correcting for the finite photon accumulation time, where .
As a balance of performance and file size, the Gen 5 MPD instrument typically uses a differential range, ΔR=150 m, and a 250 ns photon accumulation time, but these values are adjustable. To allow lower ranges to be more accurately measured, the transmitted laser pulse length was reduced from 1 µs to 625 ns in the Gen 5 design (a theoretical lower range improvement of ≈56 m). The peak power was not increased (i.e., the TSOA drive current was not increased), so this pulse duration change results in a ≈37.5 % reduction in pulse energy. The pulse repetition frequency was changed from 7 to 8 kHz to increase the average power and minimize the signal-to-noise impact. Using a shorter differential range would allow measurements closer to the surface. But, as this would increase the absorption measurement uncertainty, it would likely require sophisticated processing techniques such as Poisson total variation (Marais et al., 2016). Another possible solution to push further down in range and reduce the SNR impact is to alternate short and long transmission pulses. But as described above, this would have limitations. We plan to investigate both methods in the future as measurements close to the surface remain a high science priority.
A further limitation for measuring close in range – beyond the pulse duration – is the detector afterpulse probability. The scattering from optical surfaces during the outgoing transmission laser pulse inevitably affects the detector for a short time, creating a small signal-induced bias. The low photon counts in the near-range region can exacerbate this bias. The MPD instruments use a single-photon-counting module, or SPCM (Excelitas, SPCM-800-12-FC or SPCM-850-12-FC). These devices are fiber-coupled to the receiver via a 105 µm diameter, 0.22 NA multimode fiber (with a light-tight armored jacket) following the filter stage. The SPCMs are specified to have a nominal 1 % afterpulsing probability with a maximum of 3 %, although our units range from 0.1 % to 0.9 %. Before the inclusion of the second wide-field-of-view telescope, we investigated correcting for the afterpulse to extend the range closer to the surface while maintaining relatively long pulses (1 µs in our case). We placed a cover over the telescope and collected data to measure the bias baseline – a small number of increased photons immediately after the transmitted pulse ends – and the baselines (for both on- and offline) were subtracted from the average atmospheric data before standard data processing. The results indicated some minor ability to remove a slight wet bias in the lowest bin. Still, the technique was perhaps overcompensating and added as much error as it removed. Currently, no afterpulse corrections are applied to the MPD data. The detector gating function has been found to reduce the effect of afterpulsing slightly. The gate disables the detector output and active quench function (Cova et al., 1996). Based on test results, as discussed below, the signal-induced bias using the gated SPCM (without afterpulse correction) adds ≈50 m beyond the minimum range imposed by the pulse duration.
6.6 Multi-channel scalar
For the Gen 5 MPD instrument, a new multi-channel scalar was developed. It was implemented in a flexible, re-configurable logic that improves system integration and simultaneously increases the system's overall functionality, simplifies the system (i.e., reduces part count), and reduces data latency. The original MCS was a commercially available product. It required a proprietary software package wrapped by another software package (in our case, Labview). The new MCS uses highly standardized Ethernet data communications – specifically user datagram protocol, or UDP – that can be accessed by several programming languages, including Python, C, and Labview. No proprietary software is required.
The new MCS also has advanced features while reducing overall system part counts. First, the new MCS uses software-defined switches local to the system's field-programmable gate array (FPGA) to sort data from the same detector into different buffers (e.g., online and offline transmit lasers). This feature allowed the removal of MPD Gen 4 radio-frequency hardware switches and associated wiring – required to route the signals from the photon-counting module to the MCS. Second, the new MCS has transmitter pulse power monitoring channels. This advanced feature allows for monitoring individual lasers (both online and offline) independently via the same FPGA software-defined switches. This capability was not possible with the original hardware configuration, which required an extra power monitor and proprietary software only capable of monitoring average online and offline lasers power. The MCS change allowed for a simplification by removing the original power monitoring components and the additional software used to communicate with the third-party device. The new MCS system achieves upgraded speed and, by extension, measurement duty cycle by switching from USB 2.0 to UDP over 1 Gb Ethernet. Additional benefits of the USB-to-Ethernet upgrade include (1) improved ruggedness of the Ethernet physical interface over USB, (2) increased system flexibility and remote device accessibility, (3) improved data streaming regularity, (4) ease of software development using sockets programming and in-house API, and (5) increased transparency of data structure and improved diagnostic capability using standard network observation tools. Finally, a noticeable increase in overall system reliability is observed using Ethernet rather than USB communications as third-party installed software drivers can be unstable given differing operating systems and update packages. The protocol speed, simplicity, and reliability constitute a significant increase in technology readiness from the previous system.
The data processing developed for the Gen 5 MPD has been applied to all of the data shown in this paper (including Gen 4 data for consistency). Some of the elements used in this data processing chain have been described in Hayman et al. (2019) and Hayman et al. (2020) and will not be repeated here for brevity. A summary of improvements to the data processing and how these elements are combined is included.
Photon counts are binned on board the MCS at approximately 2 s resolution. Before any processing, a non-paralyzable dead time correction is applied to correct some of the nonlinearity in the captured photon count signal (Müller, 1973). This standard correction assumes that photon counts between range bins are uncorrelated (dead time is much less than range bin width – in this case approximately a factor of 10) and that the photon arrival rate is constant over the bin accumulation interval. It is for the second assumption that the correction is applied at the base acquisition resolution, though it is unlikely this is sufficient to accurately recover photon arrival rates from clouds (where water vapor signals are not retrieved). After binning the dead-time-corrected photon counting data to a 1 min grid resolution, we employ a technique to optimally determine the mean number of photons in the signal through smoothing in time and range with a Gaussian kernel (Hayman et al., 2020). This technique quantitatively finds the balance between error caused by statistical noise (under smoothing) and smearing (over smoothing) and is applied such that each altitude level is optimized independently in time and each minute is optimized independently in range.
After the smoothed counts have been background-subtracted, the water vapor number density, nwv, is calculated using a slightly modified version of the DIAL equation:
where Δσ(R) is the difference in offline and online water vapor absorption; Non(R) is the background-subtracted online photon counts; Noff(R) is the background-subtracted offline photon counts; and the range derivative operations are approximated using a three-point, first-order Savitzky–Golay filter. The reason for moving the derivative operation to the background-subtracted profiles is that this form better accommodates noisy observational data by avoiding negative arguments in the log of the more conventional DIAL equation. In Eq. (6), undefined values only occur when one of the background-subtracted profiles is exactly equal to zero, which is rare. This is, in turn, more accommodating to the uncertainty analysis described below.
The water vapor absorption cross sections are calculated for each pixel in a day using a principal component approximation for the water vapor absorption profile as a function of temperature and pressure (Hayman et al., 2019). The temperature and pressure profiles are obtained from NCAR/NCEP reanalysis (Kalnay et al., 1996) for post-processing or using an assumed lapse rate from surface temperature and pressure data for real-time processing7.
When we calculate the water vapor field, most of the high-frequency structure caused by backscatter is absent from the profile, so a second, larger smoothing operation, for further noise suppression, can be applied without causing significant bias. This second smoothing operation uses a Gaussian kernel where the standard deviation is set to the desired time and range resolution. In the data presented here, the time kernel standard deviation is set to 10 min, and the range kernel standard deviation is set to 170 m.
The MPD lacks the temporal resolution to calculate water vapor uncertainty using the Lenchow method, which is popular in high-power DIAL systems (Lenschow et al., 2000). In photon-counting systems, it is common to use linear propagation of error to estimate the statistical error in water vapor retrievals. We have found, however, that this error estimate rarely encapsulates statistical noise at low SNR, largely because of the highly nonlinear nature of the DIAL equation. Also, the assumption that the observed number of photon counts is an accurate representation of the mean photon counts, and therefore the statistical variance, becomes invalid at low observed counts. We have employed bootstrapping (Hastie et al., 2001; Marais, 2017) for estimating statistical uncertainty numerically, which gives a much more robust error estimate.
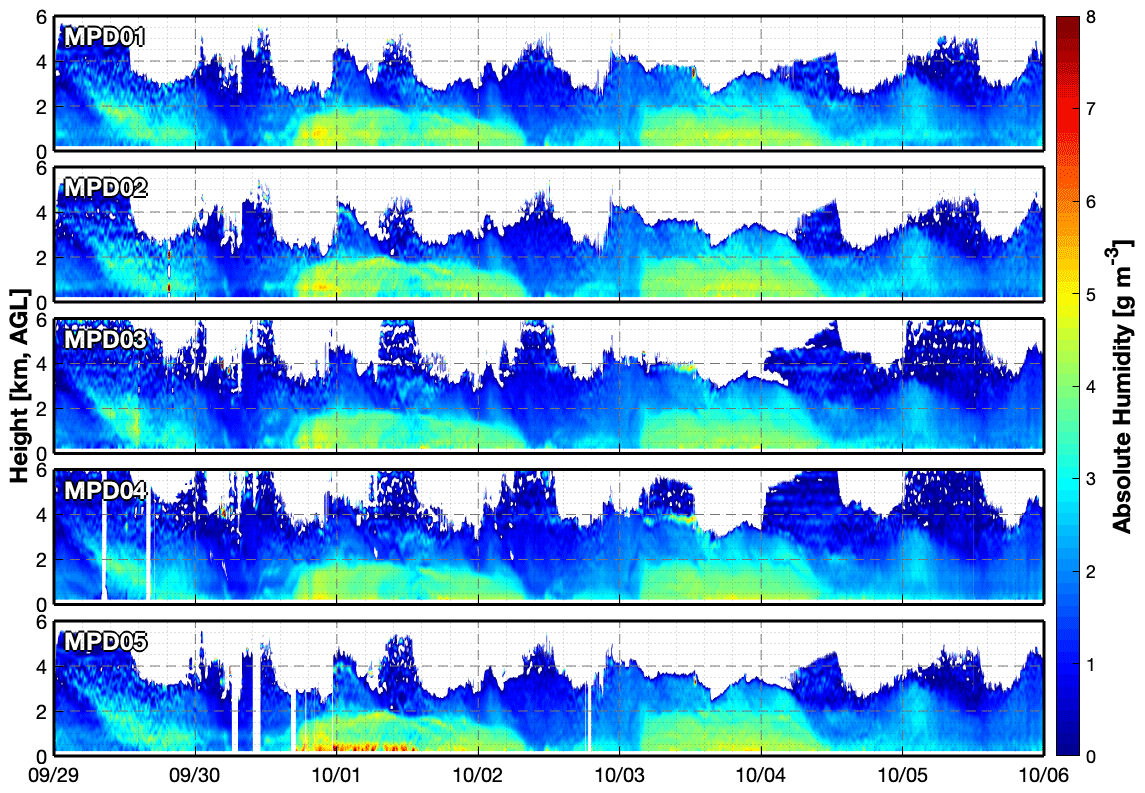
Figure 12Time series for a comparison test with the Gen 5 MPD units from 29 September to 5 October 2020 in Boulder, CO. Data extend down to 225 m a.g.l. Note that from 30 September (23:00 UTC) to 1 October (14:00 UTC) the WFOV receiver of MPD05 was blocked – a wet bias at the lowest ranges appears during this time. The dropouts in the MPD05 data are due to receiver scans for temperature tests. The pair of dropouts in the MPD04 data are from mode hops of the offline laser. We have found the parameters of the DBR laser can be easily tuned to avoid these conditions should they arise.
To implement bootstrapping in the MPD data, we split the photon count profiles into two statistically independent sets with identical mean values using Poisson thinning (for details on the Poisson thinning method see Hayman et al., 2020). We calculate the water vapor number density, as detailed above, for both of the independent photon count sets. We then estimate the statistical variance as half the difference squared of the two statistically independent water vapor profiles. This thinning and processing is repeated so that the final variance is approximated as the average of all the squared-difference results given by
where B is the number of bootstrap iterations. We have found that using B=50 generally provides a reasonable balance between convergence and processing time. We monitor the maximum change in variance (generally corresponding to the noisiest data points) over iterations. This is typically below 20 % after 50 iterations. This bootstrapping method is much more effective at capturing the statistical errors of the final water vapor estimates and includes all processing steps that may be prone to statistical uncertainty (smoothing optimization, background subtraction, etc). Because it is a numerical technique, bootstrapping can capture errors that are otherwise difficult to propagate through an analytical calculation of first-order derivatives.
We performed a series of tests to validate the Gen 5 design, and verifying it enables higher-quality water vapor measurements at lower ranges. A baseline intercomparison of the instruments was conducted from 29 September to 5 October 2020. The range vs. time series for the five collocated units during this period is shown in Fig. 12. This test was done under similar atmospheric conditions (absolute humidities <5 g m−3) to the Gen 4 network intercomparison test from 5–10 April 2019 discussed in Stillwell et al. (2020). The Gen 4 network comparison test – without near-range receivers – showed overall correlation coefficients ranging from 0.90 to 0.95 when the data were truncated below 500 m a.g.l. The Gen 5 test also demonstrated a very high correlation between units (correlation coefficients ranging from 0.90 to 0.93), albeit with the critical distinction that the data extend down to 225 m a.g.l. These tests, and corresponding correlations results, provide a useful check that the MPD network (which includes units with temperature and HSRL capabilities) measures the same WV values.
During the baseline intercomparison test, we removed the near-range receiver's contribution on a single unit for one night to isolate its effect. The MPD05 WFOV telescope was blocked from 30 September (23:00 UTC) to 1 October (14:00 UTC). During this period, a wet bias appears in the data, extending to just above 500 m. When the light received from the WFOV telescope is reintroduced (i.e., the telescope is unblocked), the bias disappears. This effect can be seen in the Fig. 12 time series. Profiles of these two periods, during and after the block, are shown in Fig. 13. This result – where only the WFOV telescope is added/subtracted – is a compelling demonstration that the fiber-coupled near-range receiver is a significant component in improving the measurements close to the surface.
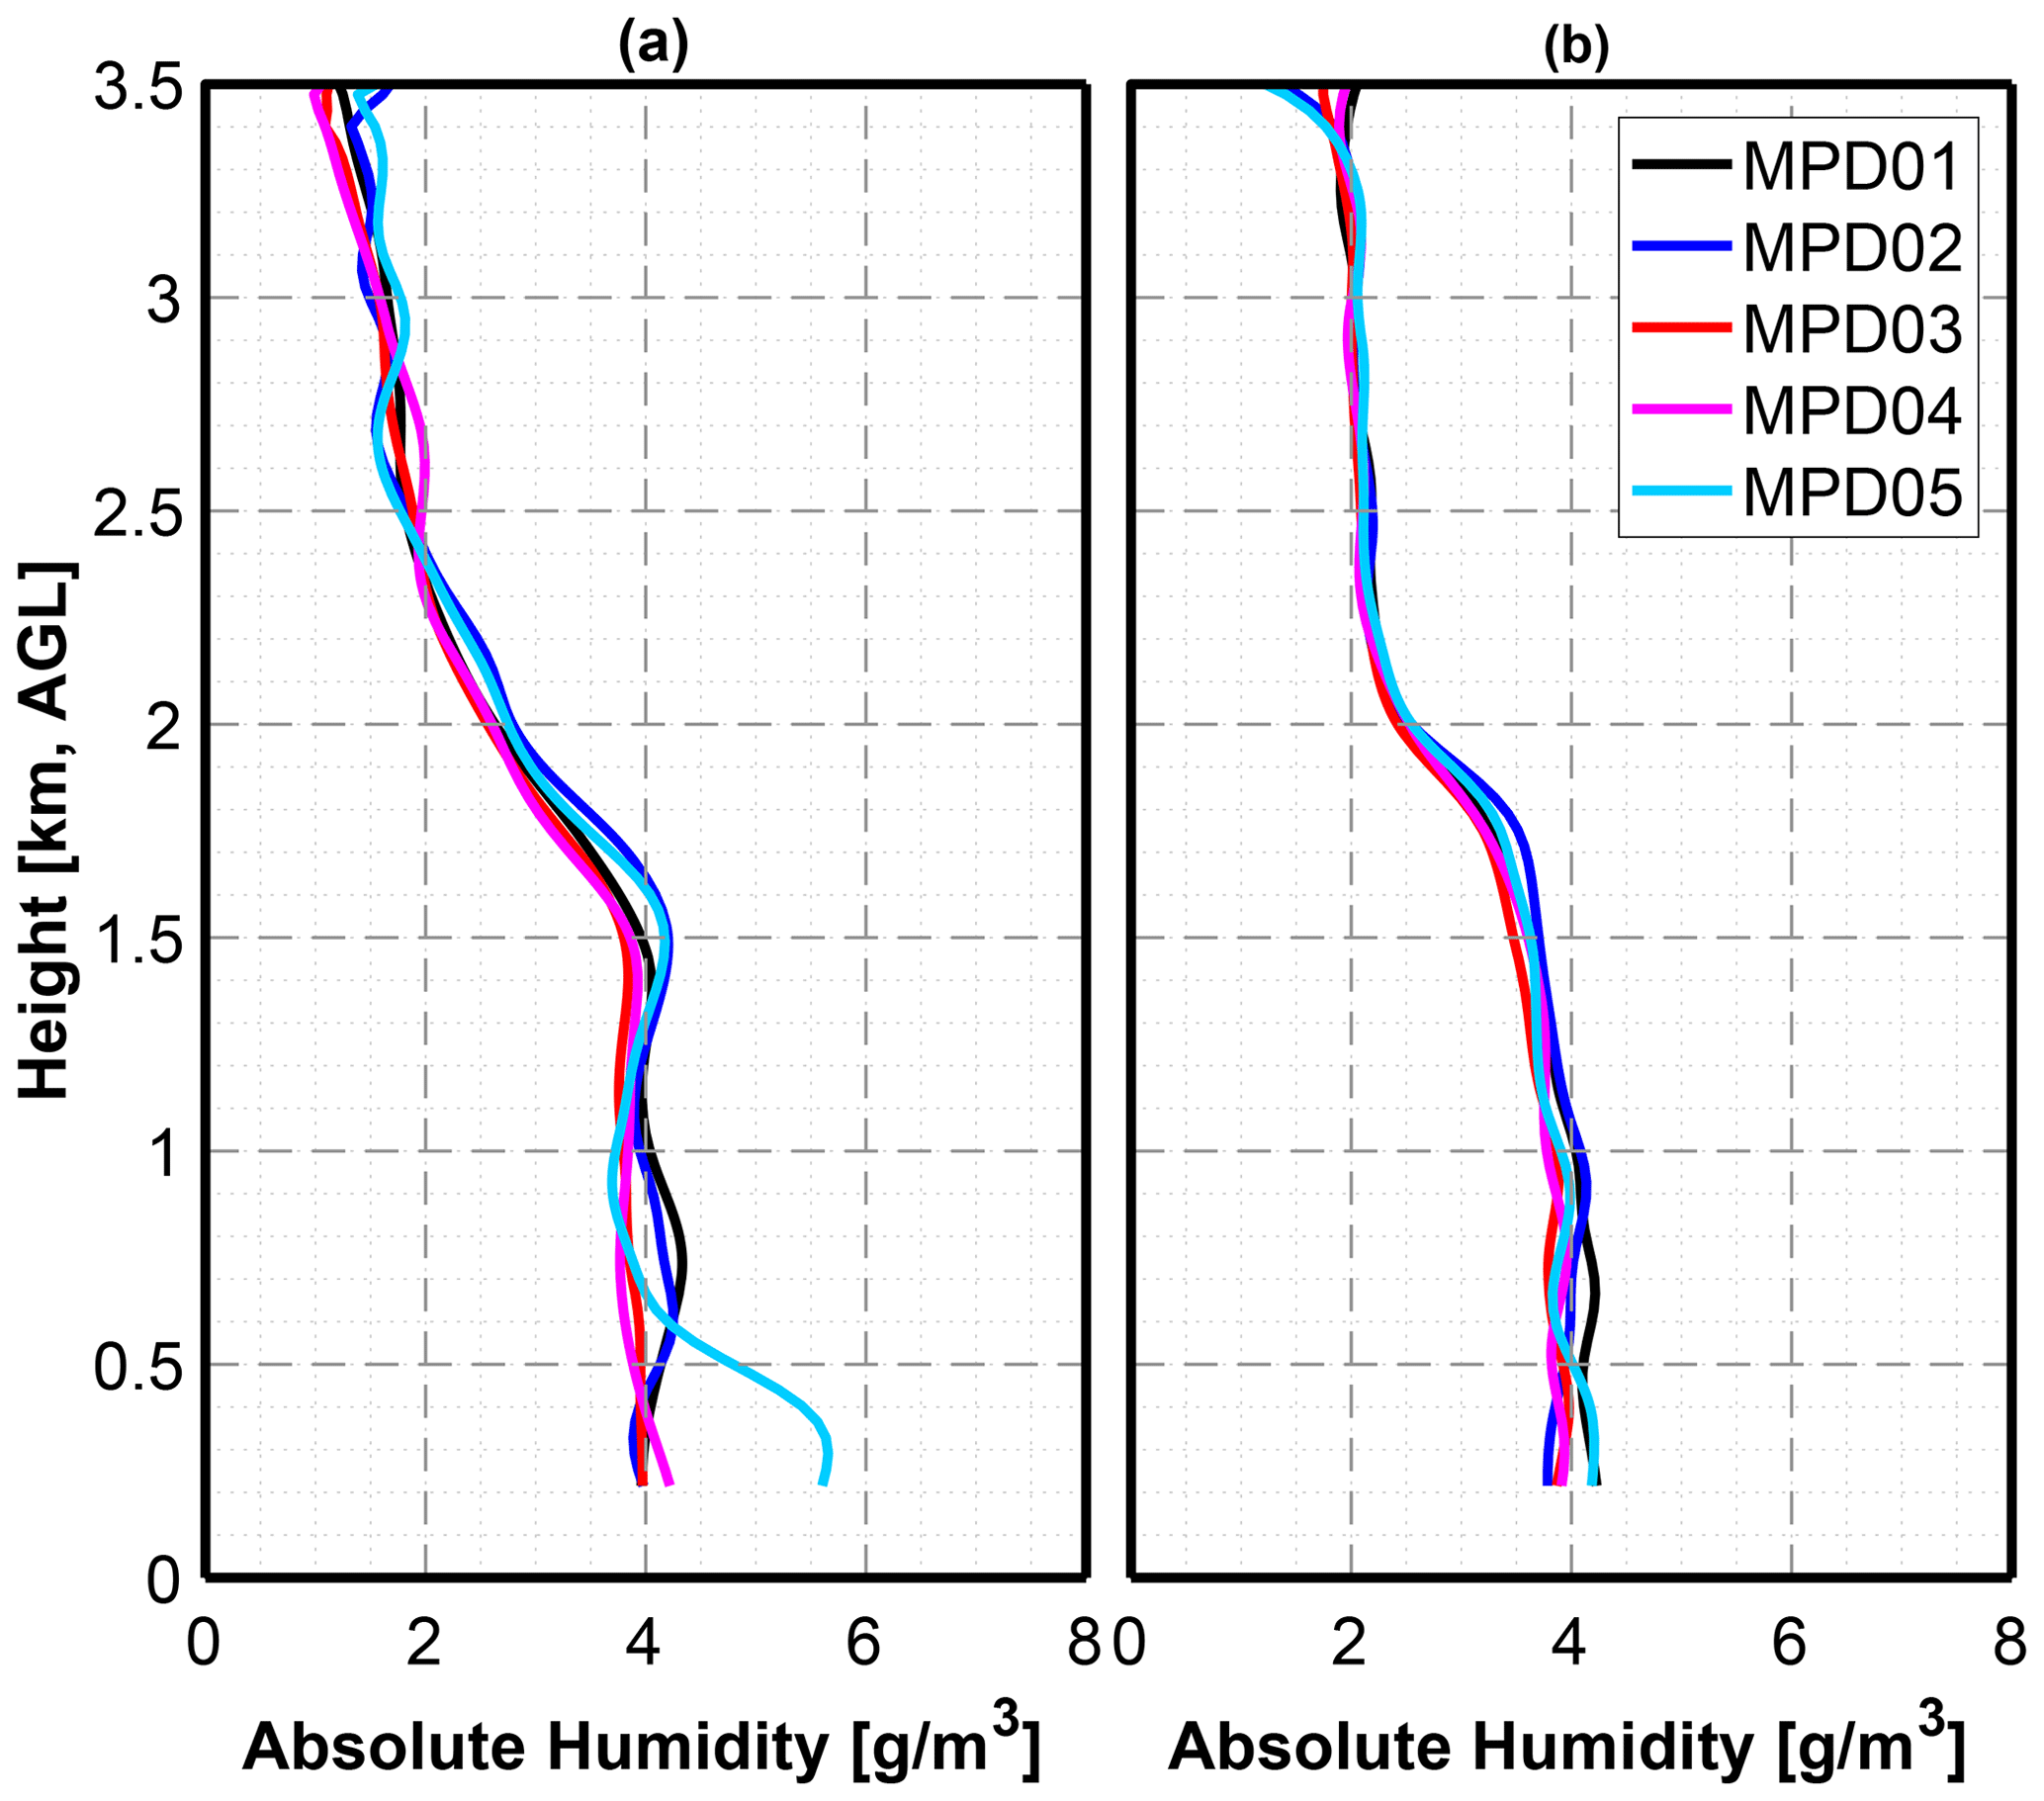
Figure 13Profiles of all five MPD instruments during time when MPD05 WFOV receiver was blocked (a) and after the block was removed (b). An apparent bias in MPD05 below 600 m is evident when the WFOV was blocked.
To further elucidate the performance difference between the 2019 Gen 4 and the 2020 Gen 5 network intercomparison tests, the correlation coefficient as a function of the range was computed and is shown in Fig. 14. Overall there is a clear improvement at low ranges between revisions concerning the instrument agreement with one another. Although we implemented multiple changes between the design stages, two are likely most responsible for this improvement: the WFOV receiver's addition, which increases the overlap function near the surface approximately 100×, and the two-stage seed laser, which provides more power in the amplifier. These improvements may be coupled together. Their contributions are not easily separated since a difference in online and offline beam pointing can be a source of error in a DIAL. Wulfmeyer and Bösenberg (1998) discussed how even slight deviations in the overlap functions between the on- and offline signals could give rise to considerable errors. Like the system described in that work, one would expect the MPD online and offline overlap functions to be equal since a single amplifier generated both beams. Still, Wulfmeyer and Bösenberg (1998) warn that systematic errors may occur in regions of incomplete overlap even with very slight deviations in the direction of the two beams. As shown above, the improved seed power in the Gen 5 MPD more fully saturates the final amplifier stage. This saturation should minimize potential gain guiding in the TSOA, and therefore beam pointing differences would be minimized in the new design. Additionally, since the beam pointing errors occur in incomplete overlap regions, the WFOV receiver would reduce error as it increases the collection efficiency at lower ranges. As discussed previously, the improved collection efficiency also minimizes any signal-induced bias in the detector that affects the lowest ranges. We do not attempt here to deconvolve these factors but theorize that a combination results in improved measurements closer to the surface.
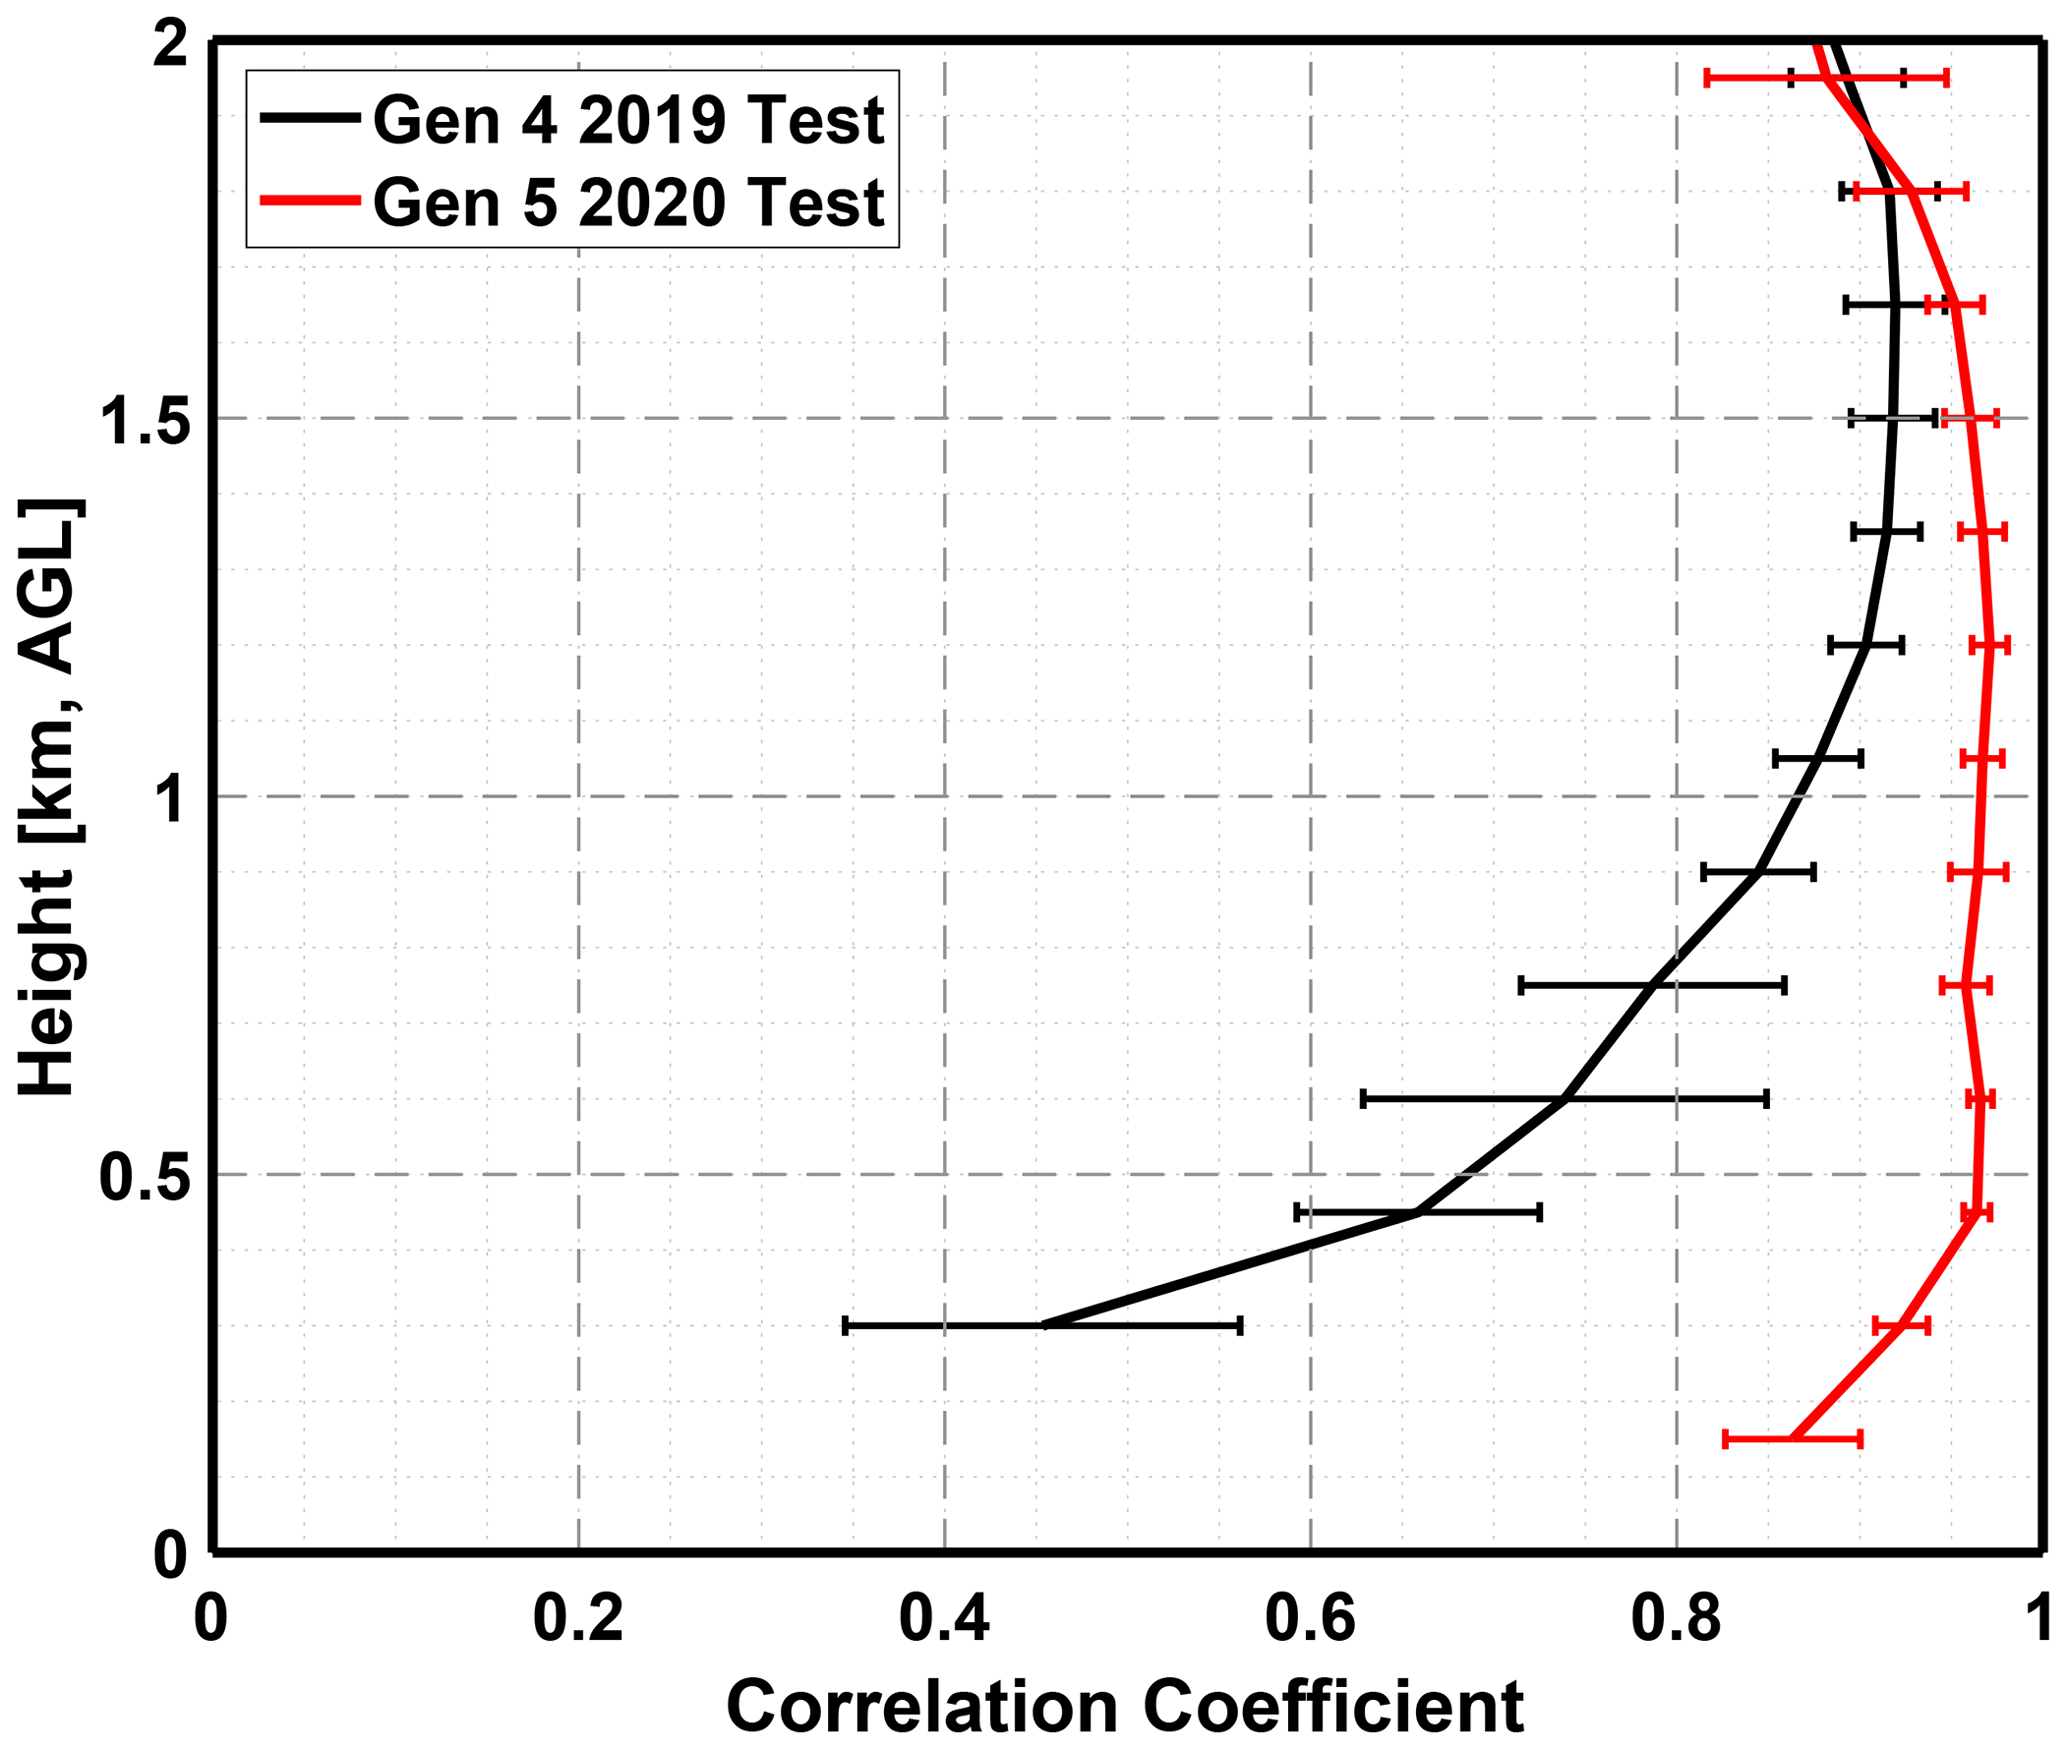
Figure 14Correlation coefficient as a function of range for the MPD network intercomparison tests. The Gen 4 2019 test (black) occurred 5–11 April 2019 (6 d) and the Gen 5 2020 test (red) occurred 29 September to 6 October 2020 (7 d). The correlation coefficient is calculated for 150 m thick layers. The line (error bars) represents the mean (standard deviation) of the 10 intercomparison possibilities (unit 1 to 2, 1 to 3, etc.). Altitude range is capped at 2 km to focus on the low-range performance. For both tests, the network of MPD instruments were collocated in Boulder, CO.
Radiosonde comparisons
Upon completing the Gen 5 network intercomparison test, we moved one MPD unit to the Marshall field site (located about 10 km southeast from Boulder, CO, USA). The NOAA Global Monitoring Laboratory launches radiosondes (Vaisala RS41-SGP) at this location at intervals of approximately once per week as a certified site of the GCOS Reference Upper-Air Network (GRUAN, https://www.gruan.org/, last access: 11 February 2021). These radiosonde data allow for some initial intercomparisons. At the time of this writing, 10 d overlapped between the launches and the collocated MPD unit. The absolute humidity profiles measured by each technique are included in Fig. 15. Theses measurements occurred during wintertime conditions, when the typical absolute humidity is <4 g m−3. The total statistical results have an overall correlation coefficient of 0.94. This result is similar to that of the radiosonde intercomparison conducted in the spring of 2019 with the Gen 4 MPD, as shown in Fig. 3, where the correlation coefficient was 0.94, but in this case the analysis altitude extends down to 225 m.
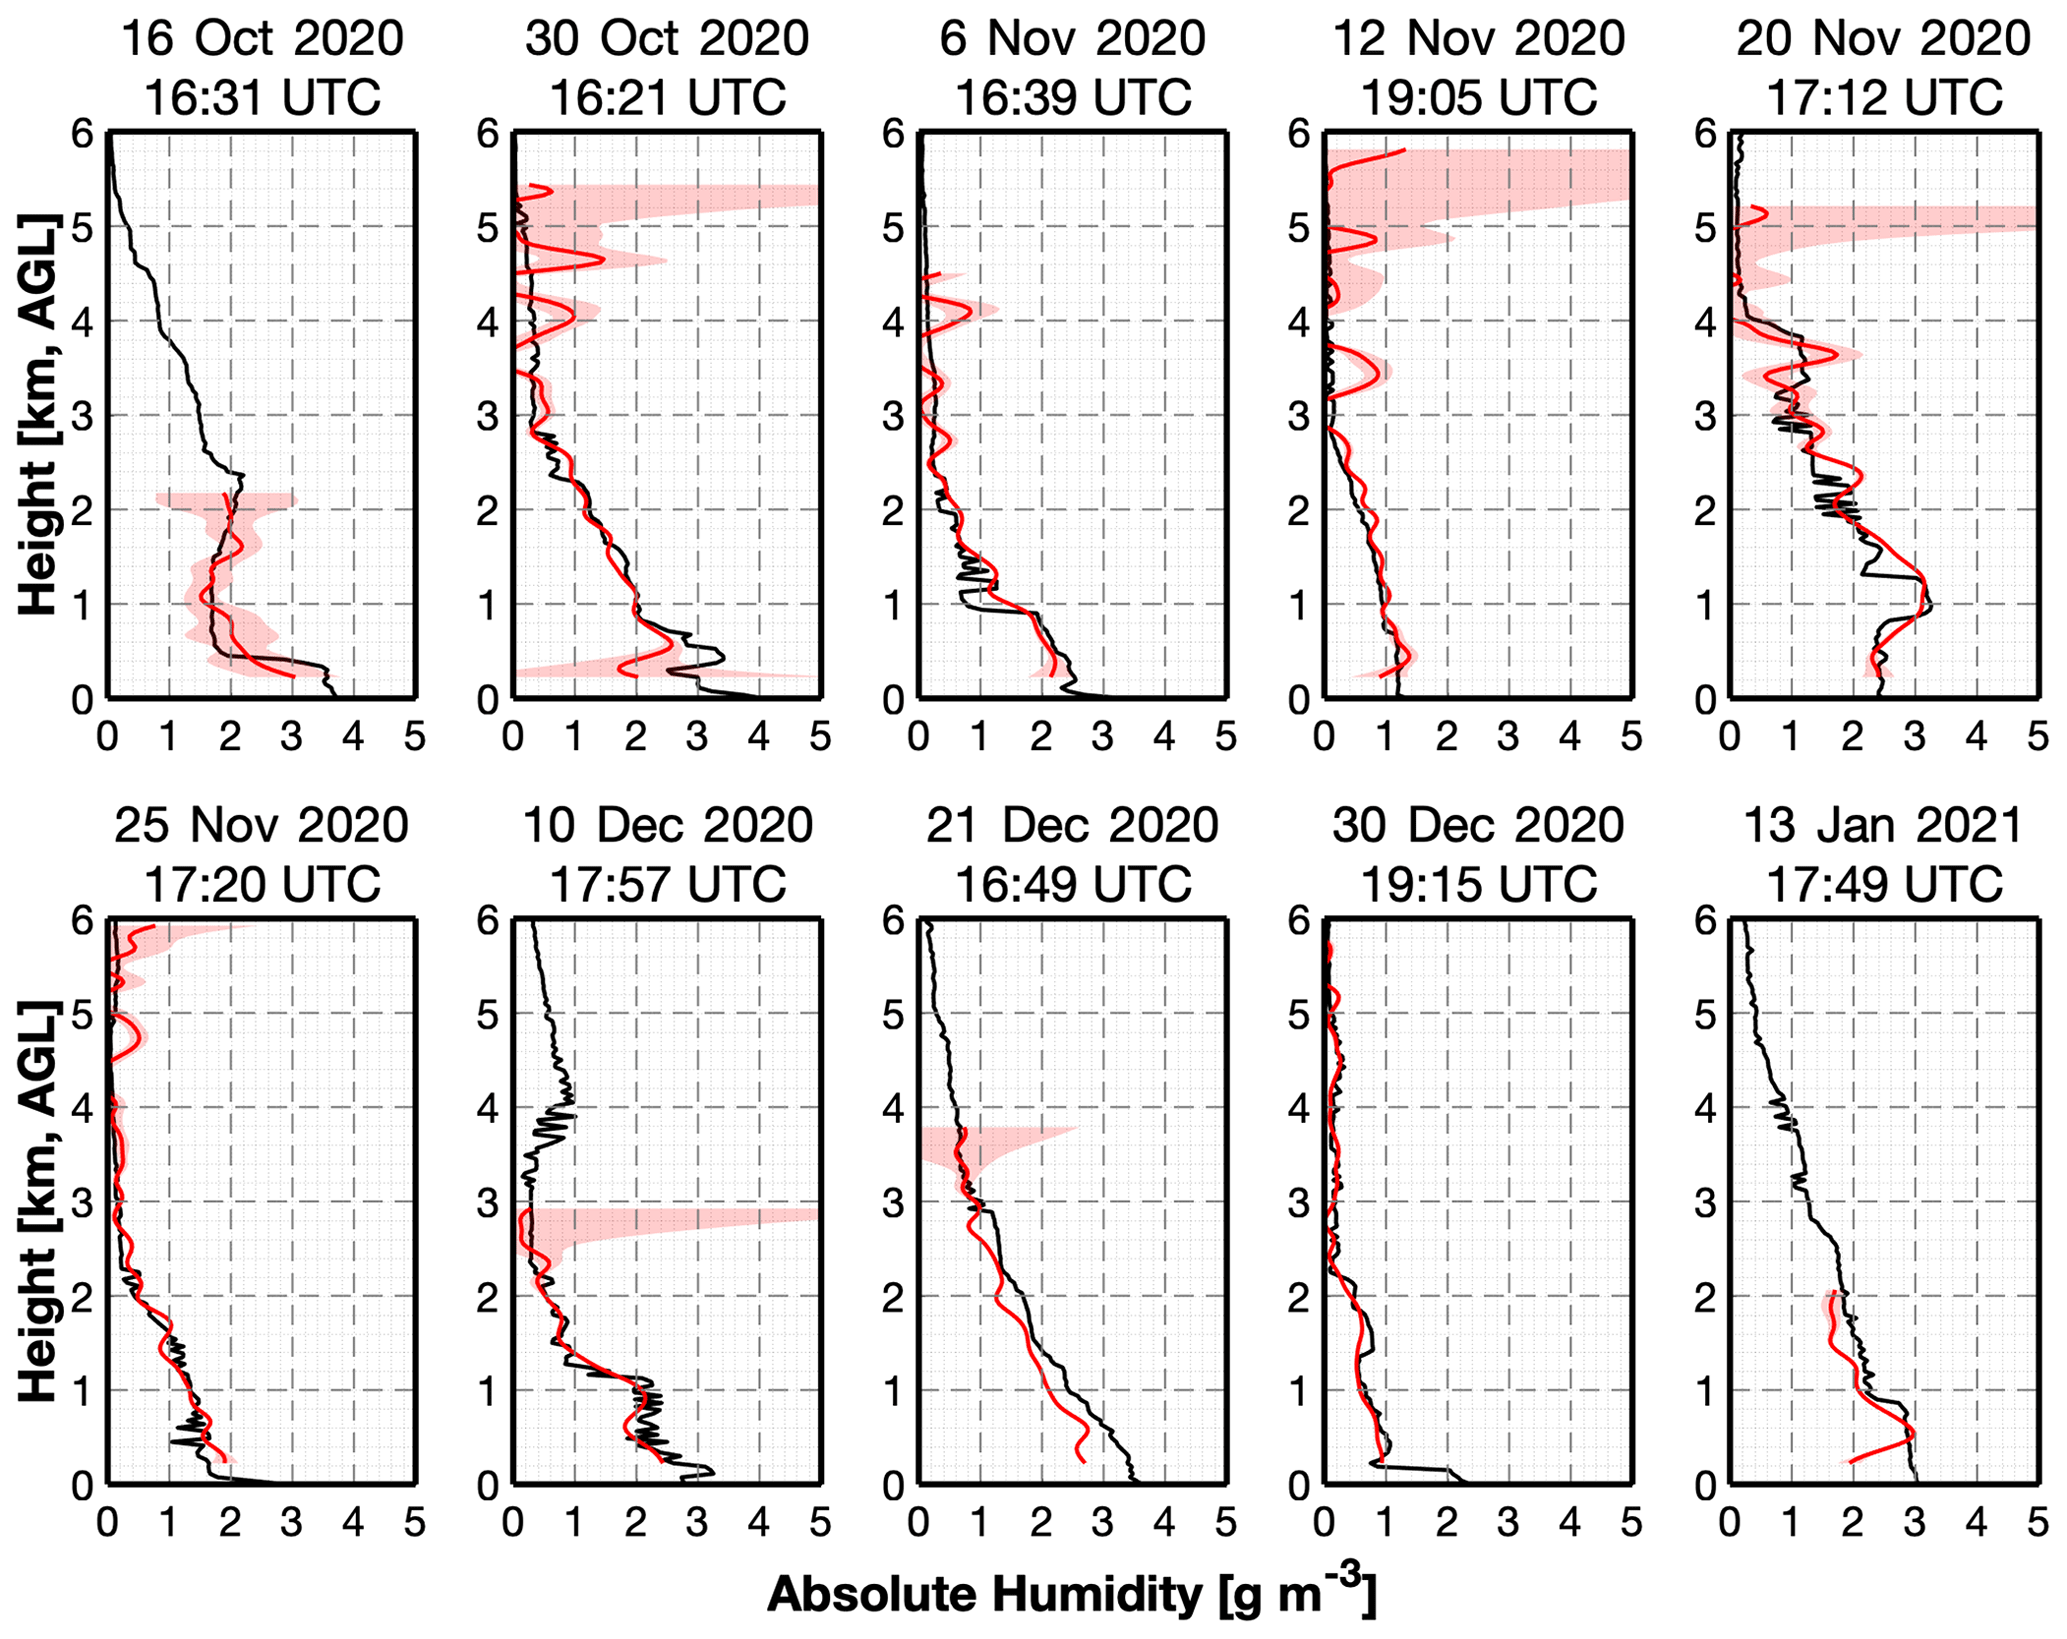
Figure 15Absolute humidity profiles from the Marshall field site. The black lines are measurements from the radiosondes. The red lines are measured by the MPD; the red shading indicates the error estimates from the bootstrapping procedure. The radiosonde data were provided by the NOAA Global Monitoring Laboratory.

Figure 16Plots of the absolute humidity mean error, RMSE, and number of samples used vs. altitude above ground level. The mean error and RMSE were calculated assuming radiosonde data were the truth. Results from a pair of field studies are shown. The plots in black are from the spring/summer field campaign (data from 19 April to 1 May 2019) at SGP with the Gen 4 system, without a near-range channel. The plots in red are from the wintertime test at the Marshall field site with the Gen 5 system (data taken from 16 October 2020 to 14 January 2021).
To highlight the improvement at lower ranges between the MPD Gen 4 and Gen 5 designs, we show a plot of the mean bias error and root mean square error (RMSE) of the absolute humidity as a function of the range above ground level in Fig. 16. The error was calculated taking the radiosondes as “truth”; i.e., error = radiosonde absolute humidity − MPD absolute humidity. The right-hand side of each pair of plots shows the number of samples used to compute the RMSE. The number of samples decreases in range because fewer samples are available due to the MPD noise/cloud masking and indicate data availability as a function of range for the MPD in these particular cases. The plots show the Gen 4 SGP test results (black) and the Gen 5 Marshall field site test (red). The SGP test segment, from 19 April to 1 May 2019, is the same period shown in Fig. 2. As mentioned previously, 77 sondes were released by the DOE SGP staff during those 12 d. During the Oklahoma springtime, the atmospheric conditions had humidity variability in the boundary layer ranging from 2–15 g m−3. As seen on the left side of Fig. 16, the absolute humidity RMSE is around 1 g m−3 from 500 m to 5.75 km. Unlike what was shown earlier in this paper, the low-range masking is now removed. This was done to show the substantial wet bias below 500 m with the Gen 4 dataset that was collected without a near-range channel. The Marshall dataset was collected in the dry Colorado winter. The sample size is considerably smaller; only 10 of the 12 sondes released during the 90 d overlapped with the instrument operation. However, with these caveats, the results show that the Gen 5 instrument provides measurements that agree with the radiosonde's absolute humidity with an RMSE <1 g m−3 extending down to 225 m a.g.l. The individual profiles from the Marshall radiosonde comparisons are shown in Fig. 15. These initial results further validate that the Gen 5 MPD design provides measurements closer to the surface. They also provide a nice example of MPD's ability, employing the narrowband DIAL technique, to accurately measure water vapor over a wide range of atmospheric conditions.
The atmospheric research and operational weather forecasting communities have continued to advocate for a ground-based network of instruments that profile water vapor and temperature at high temporal and vertical resolution in the lower atmosphere. NCAR and MSU have developed an active remote sensing technology to meet this scientific and societal need. Our design approach is founded on the use of cost-effective, narrowband, high-spectral-fidelity diode lasers. These single-frequency laser diodes are much less powerful than those historically used by the community for the quantitative atmospheric lidar methods of DIAL and HSRL. They require receiver designs with a narrow field of view and precise sunlight-blocking filters. However, they have the significant advantage of potentially lower cost and are inherently more rugged for field operations, especially when fiber-coupled.
We have constructed a five-unit MicroPulse DIAL network and performed an initial field demonstration test that allowed evaluation of the engineering performance in a deployment setting. The network, initially built on fourth-generation MPD technology, was validated against more mature instruments. The MPD water vapor measurements were shown to compare very well with Raman lidar and radiosondes. Following the field test, we developed several advancements to the MPD technology for the next generation. These improvements included a robust fiber-coupled seed laser. The transmitter operational parameters were mapped out and shown to meet all of the requirements for the DIAL technique. Further improvements – such as a fiber-coupled near-range receiver, the ability to perform quality control via automatic receiver scanning, advanced multi-channel scalar capabilities, and advanced processing techniques – have been discussed. Throughout we have explained the balance of design trade-offs. The new developments – which increase narrowband DIAL technology readiness – were shown to allow higher-quality water vapor measurements closer to the surface via intercomparisons within the MPD network itself and with radiosondes.
We developed the latest MPD generation in a modular fashion – to allow the straightforward addition of calibrated aerosol and temperature measuring capabilities to the network test bed units in the future. This work demonstrated the advances in water vapor profiling. As they share the same diode-laser-based architecture, the calibrated aerosol and temperature measurements also benefit from these developments. Work is proceeding to improve those advanced measurement techniques. We are also actively investigating new methods and advanced signal processing techniques to measure closer to the surface and extend the range.
Narrowband diode-laser-based lidar technology provides a potential balance of cost and performance. It continues to look like a promising tool for providing the required thermodynamic data to improve forecasts while also being cost-effective to enable large ground-based networks.
The self-heterodyne technique was used to measure the linewidth and spectral purity of the transmitter. As shown in Fig. A1 a “pickoff” optic reflected a small portion of the pulsed output from the transmitter's last amplifier stage into a fiber port that focuses the light into a single-mode fiber. A fiber-coupler split the light into two paths. The 90 % leg passed through a polarization controller and a fiber-coupled acousto-optic modulator (AOM, Brimrose model TEF-1000-100-828-2FP-SM) to shift the frequency 1 GHz. A 50 / 50 splitter combined the frequency-shifted light with the 10 % leg containing the originally sampled beam. One leg of the 50 / 50 splitter connects to a Si PIN amplified detector (ThorLabs FPD310-FC-VIS) with 1 MHz to 1.5 GHz bandwidth. The amplified detector has a 2 mW damage threshold, so the sampled pulse was attenuated so the peak power was below that threshold. An electrical spectrum analyzer – operated at 50 kHz bandwidth resolution, 100 MHz to 1.9 GHz span, 10-shot averaging, and log-power detector – measured the detector output. The optical filters in the MPD receiver limit the bandpass to approximately <1.3 GHz FWHM, so this measured frequency spectrum is sufficient to ensure the instrument's spectral purity.
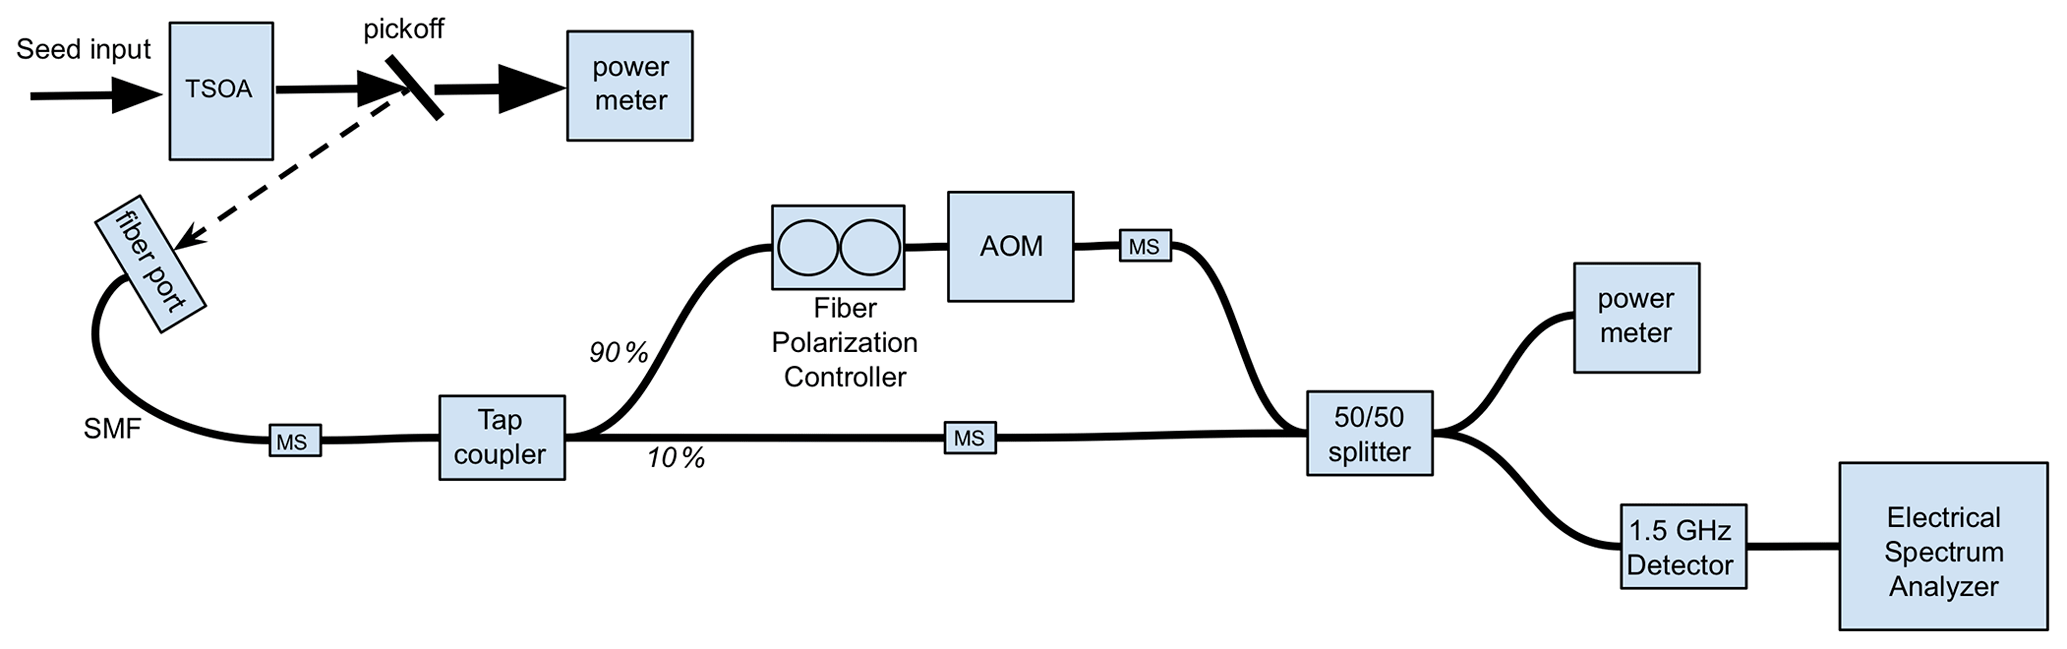
Figure A1Test setup to measure the linewidth and spectral purity. AOM: acousto-optic modulator, MS: mating sleeve, SMF: single-mode fiber, TSOA: tapered semiconductor optical amplifier.
Our design goal was to enhance collection efficiency at close ranges while not degrading the current instrument SNR. To keep costs low, we restricted the design to off-the-shelf components. A simple geometrical optical relationship can be used to approximate the range to full overlap – the hyperfocal distance . This simple relationship makes it easy to see that, to efficiently collect light closer in range (and thereby closer to the surface), one could increase the receiver field of view, FOV, and/or decrease the collection area diameter, D. Increasing the field of view also collects more background light, so the WFOV receiver diameter should be sized to compensate for this effect. To maintain a similar background collection efficiency to the original primary receiver, we select a small-diameter telescope with a wide field of view. We further balance the background levels by selecting how the two receivers are combined.
The background photon count rate, NB, at the receiver is given by
where SB is the background radiance, Ω(FOV) is the receiver solid angle as a function of the full-angle field of view (FOV) and is equal to , Δλ is the spectral bandpass of the receiver, A is the receiver area, η is the receiver efficiency, and is the reciprocal of the energy per photon.
The primary and WFOV telescopes are combined, so the background radiance, bandpass, and receiver efficiency for both receivers are the same. Therefore the difference in relative background collected between the two telescopes is proportional only to the receiver area and field of view:
where A1 is the primary reflector aperture area, A2 is the WFOV refractor aperture area, FOV1 is the field of view of the primary reflector and FOV2 is the field of view of the WFOV refractor, and η1 is the coupling efficiency of the primary reflector telescope into the multimode fiber combiner.
The primary telescope has an effective receiver area of 935 cm2 and a field of view of 115 µrad. A refractor telescope was selected with an area of 14 cm2 and a field of view of 1275 µrad. A multimode fiber coupler was selected with a 90 % leg connected to the primary telescope and the 10 % fiber leg attached to the refractor telescope. The relative solar backgrounds, as shown in the calculations below, are similar for the new combined receiver and the original “primary-only” receiver.
-
Original primary receiver = AU
-
New fiber-coupled combined receiver AU
The theoretical overlap function, O(r), for these two receivers is shown in Fig. B1. We now estimate the signal as a function of range. Since the background levels are matched, an improvement in signal is equivalent to an improvement in SNR.
The relative signal count rate, NS, as a function of range, r, is proportional to receiver area A and the overlap function, O(r), of each receiver, so the total signal, normalized to the original primary reflector aperture, is
where O1(r) is the overlap function of the primary reflector and O2(r) is the overlap function of the WFOV refractor.
The aperture-normalized signal is shown in Fig. B2 for the primary reflector telescope (η1=1), the WFOV refractor telescope (η1=0), and the combined configuration (η1=0.9). From this figure, it is clear that the new combined telescope configuration provides an increased signal below 500 m as compared to the primary receiver alone.
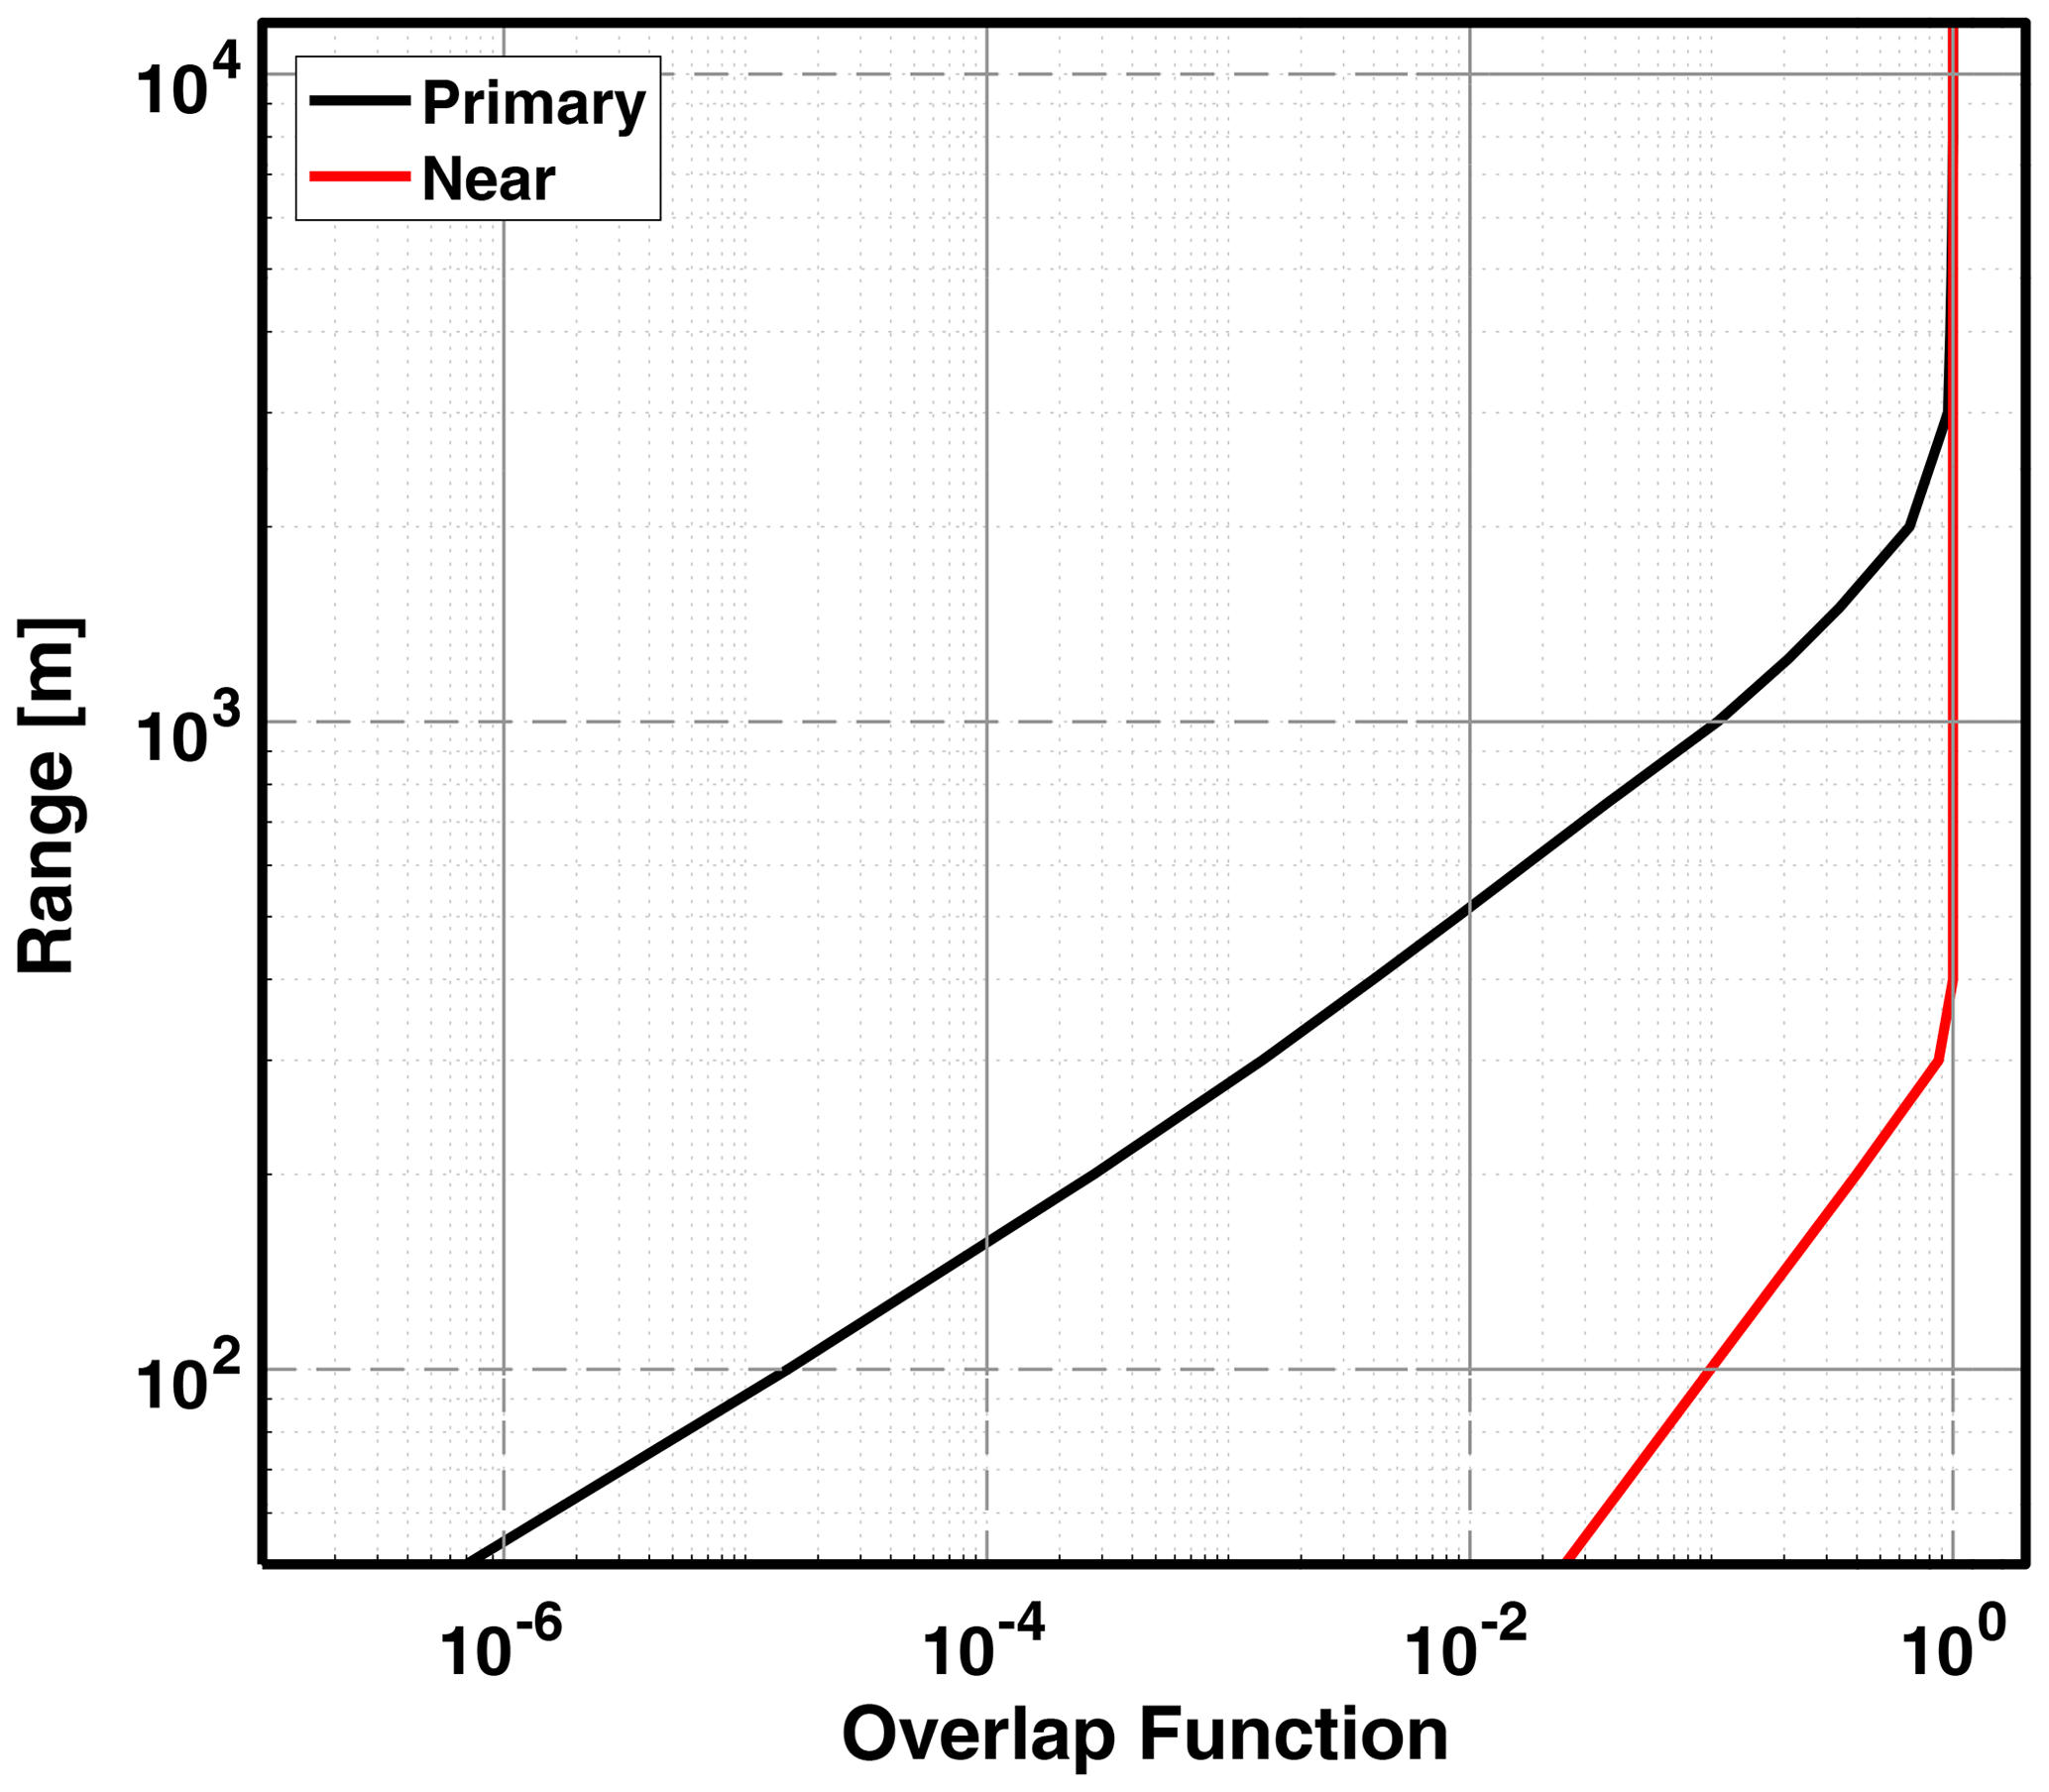
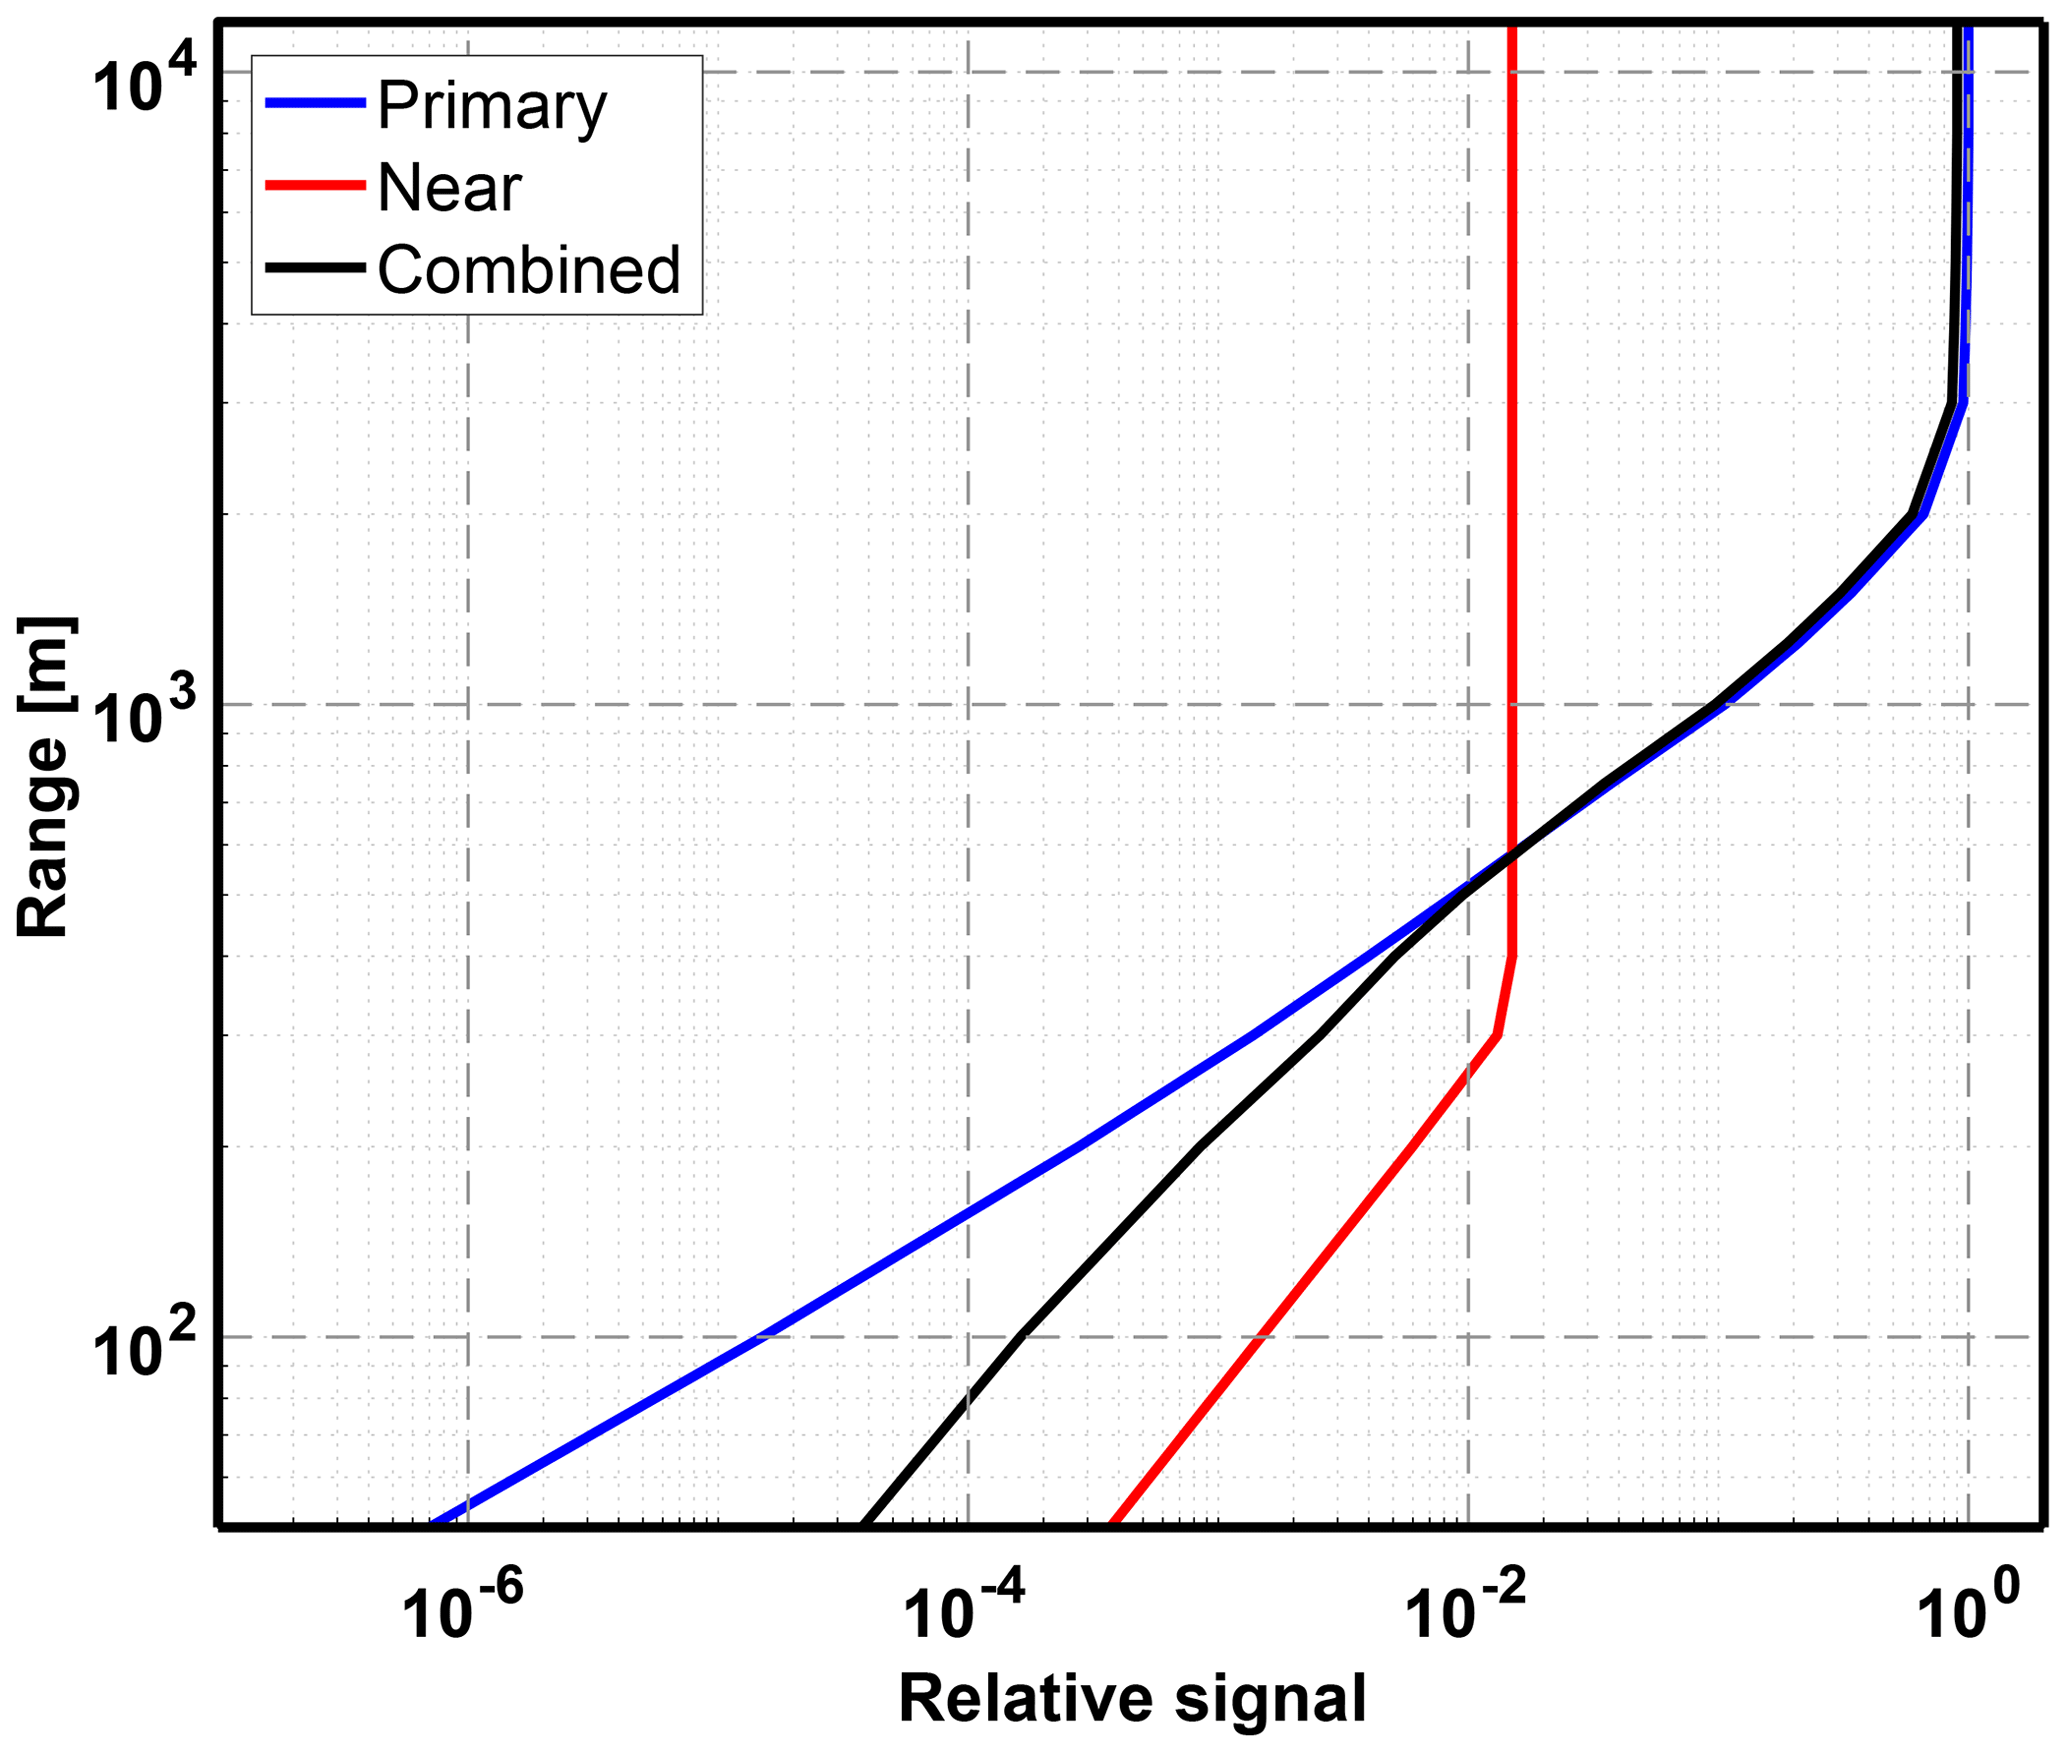
All the MPD data products used in this work were produced by NCAR and are available upon request. The radiosonde and SGP Raman lidar data from the MPD Network Demonstration field campaign are available via https://adc.arm.gov/discovery/ (last access: 11 February 2021, ARM user facility, 2021).
SMS conceptualized the paper. SMS, MH, and RAS performed formal analysis for this work. JC performed electrical engineering design and developed the multi-channel scaler. TB performed the mechanical engineering design and developed multiple optomechanical assemblies and the MPD environmental housing. SMS prepared the manuscript with contributions from MH, RAS, JC, TB, and KSR. All authors are involved with the presented and ongoing MPD developments.
The authors declare that they have no conflict of interest.
Component manufactures are included in this paper to help other researchers reproduce this work but are not an endorsement by the authors.
This material is based upon work supported by the National Center for Atmospheric Research, which is a major facility sponsored by the National Science Foundation under Cooperative Agreement no. 1852977. The work presented was also funded by the National Science Foundation for Major Research Instrumentation grant no. 1624736 and NOAA Office of Weather and Air Quality Research Programs, Next Generation of Mesoscale Weather Observing Platforms Award no. NA19OAR4590324. The MPD Net demo field campaign was supported by the Office of Biological and Environmental Research of the U.S. Department of Energy (under grant no. DOE/SC-ARM-20-002) as part of the Atmospheric Radiation Measurement (ARM) user facility, an Office of Science user facility.
The NCAR authors wish to acknowledge and thank Ben Crane and Kina Smith for technician support, Ed Eloranta and Amin Nehrir for helpful discussions about lidar design, and Tammy Weckwerth and Holger Vömel for useful discussions about the scientific application and internal review of the paper. We thank Dale Hurst, Patrick Cullis, Emrys Hall, and Allen Jordan of the NOAA Global Monitoring Laboratory for providing the sounding data from the Marshall field site.
This research has been supported by the National Science Foundation (grant no. 1624736 and Cooperative Agreement no. 1852977) and NOAA Research (grant no. NA19OAR4590324). The field project was supported by the Office of Biological and Environmental Research of the U.S. Department of Energy (under grant no. DOE/SC-ARM-20-002).
This paper was edited by Simone Lolli and reviewed by two anonymous referees.
Allen, M. R. and Ingram, W. J.: Constraints on future changes in climate and the hydrologic cycle, Nature, 419, 224–232, 2002. a
ARM (Atmospheric Radiation Measurement) user facility: https://adc.arm.gov/discovery/, last access: 11 February 2021. a
Cova, S., Ghioni, M., Lacaita, A., Samori, C., and Zappa, F.: Avalanche photodiodes and quenching circuits for single-photon detection, Appl. Optics, 35, 1956–1976, https://doi.org/10.1364/ao.35.001956, 1996. a
Geerts, B., Parsons, D., Ziegler, C. L., Weckwerth, T. M., Turner, D. D., Wurman, J., Kosiba, K., Rauber, R. M., McFarquhar, G. M., Parker, M. D., Schumacher, R. S., Coniglio, M. C., Haghi, K., Biggerstaff, M. I., Klein, P. M., Jr., W. A. G., Demoz, B. B., Knupp, K. R., Ferrare, R. A., Nehrir, A. R., Clark, R. D., Wang, X., Hanesiak, J. M., Pinto, J. O., and Moore, J. A.: The 2015 Plains Elevated Convection At Night (PECAN) field project, B. Am. Meteorol. Soc., 98, 767–786, https://doi.org/10.1175/BAMS-D-15-00257.1, 2016. a
Hastie, T., Tibshirani, R., and Friedman, J.: The Elements of Statistical Learning: Data Mining, Inference and Prediction, Springer-Verlag New York, 1st edn., https://doi.org/10.1007/978-0-387-21606-5, 2001. a
Hayman, M. and Spuler, S.: Demonstration of a diode-laser-based high spectral resolution lidar (HSRL) for quantitative profiling of clouds and aerosols, Opt. Express, 25, A1096, https://doi.org/10.1364/OE.25.0A1096, 2017. a, b, c
Hayman, M., Stillwell, R. A., and Spuler, S. M.: Fast computation of absorption spectra for lidar data processing using principal component analysis, Opt. Lett., 44, 1900–1903, https://doi.org/10.1364/OL.44.001900, 2019. a, b
Hayman, M., Stillwell, R. A., and Spuler, S. M.: Optimization of linear signal processing in photon counting lidar using Poisson thinning, Opt. Lett., 45, 5213–5216, https://doi.org/10.1364/OL.396498, 2020. a, b, c
Held, I. M. and Soden, B. J.: Robust Responses of the Hydrological Cycle to Global Warming, J. Climate, 19, 5686–5699, https://doi.org/10.1175/JCLI3990.1, 2006. a
Ismail, S. and Browell, E. V.: Recent Lidar Technology Developments and Their Influence on Measurements of Tropospheric Water Vapor, J. Atmos. Ocean. Tech., 11, 76–84, https://doi.org/10.1175/1520-0426(1994)011<0076:RLTDAT>2.0.CO;2, 1994. a, b
Jensen, M. P., Petersen, W. A., Bansemer, A., Bharadwaj, N., Carey, L. D., Cecil, D. J., Collis, S. M., Genio, A. D. D., Dolan, B., Gerlach, J., Giangrande, S. E., Heymsfield, A., Heymsfield, G., Kollias, P., Lang, T. J., Nesbitt, S. W., Neumann, A., Poellot, M., Rutledge, S. A., Schwaller, M., Tokay, A., Williams, C. R., Wolff, D. B., Xie, S., and Zipser, E. J.: The Midlatitude Continental Convective Clouds Experiment (MC3E), B. Am. Meteorol. Soc., 97, 1667–1686, https://doi.org/10.1175/BAMS-D-14-00228.1, 2016. a
Kalnay, E., Kanamitsu, M., Kistler, R., Collins, W., Deaven, D., Gandin, L., Iredell, M., Saha, S., White, G., Woollen, J., Zhu, Y., Chelliah, M., Ebisuzaki, W., Higgins, W., Janowiak, J., Mo, K. C., Ropelewski, C., Wang, J., Leetmaa, A., Reynolds, R., Jenne, R., and Joseph, D.: The NCEP/NCAR 40-year reanalysis project, B. Am. Meteorol. Soc., 77, 437–472, https://doi.org/10.1175/1520-0477(1996)077<0437:TNYRP>2.0.CO;2, 1996. a
Lenschow, D. H., Wulfmeyer, V., and Senff, C.: Measuring second- through fourth-order moments in noisy data, J. Atmos. Ocean. Tech., 17, 1330–1347, https://doi.org/10.1175/1520-0426(2000)017<1330:MSTFOM>2.0.CO;2, 2000. a
Marais, W. J.: Poisson Inverse and Denoising Problems in Atmospheric Lidar Imaging, PhD thesis, The University of Wisconsin, Madison, 2017. a
Marais, W. J., Holz, R. E., Hu, Y. H., Kuehn, R. E., Eloranta, E. E., and Willett, R. M.: Approach to simultaneously denoise and invert backscatter and extinction from photon-limited atmospheric lidar observations, Appl. Optics, 55, 8316–8334, https://doi.org/10.1364/AO.55.008316, 2016. a
Mariani, Z., Stanton, N., Whiteway, J., and Lehtinen, R.: Toronto Water Vapor Lidar Inter-Comparison Campaign, Remote Sens., 12, 3165, https://doi.org/10.3390/rs12193165, 2020. a
Mariani, Z., Hicks-Jalali, S., Strawbridge, K., Gwozdecky, J., Crawford, R. W., Casati, B., Lemay, F., Lehtinen, R., and Tuominen, P.: Evaluation of Arctic Water Vapor Profile Observations from a Differential Absorption Lidar, Remote Sens., 13, 551, https://doi.org/10.3390/rs13040551, 2021. a
Müller, J. W.: Dead-time problems, Nucl. Instrum. Methods, 112, 47–57, https://doi.org/10.1016/0029-554X(73)90773-8, 1973. a
Nehrir, A. R., Repasky, K. S., Carlsten, J. L., Obland, M. D., and Shaw, J. A.: Water Vapor Profiling Using a Widely Tunable, Amplified Diode-Laser-Based Differential Absorption Lidar (DIAL), J. Atmos. Ocean. Tech., 26, 733–745, https://doi.org/10.1175/2008JTECHA1201.1, 2009. a
Nehrir, A. R., Repasky, K. S., and Carlsten, J. L.: Eye-Safe Diode-Laser-Based Micropulse Differential Absorption Lidar (DIAL) for Water Vapor Profiling in the Lower Troposphere, J. Atmos. Ocean. Tech., 28, 131–147, https://doi.org/10.1175/2010JTECHA1452.1, 2011. a
Nehrir, A. R., Repasky, K. S., and Carlsten, J. L.: Micropulse water vapor differential absorption lidar: transmitter design and performance, Opt. Express, 20, 25137–25151, https://doi.org/10.1364/OE.20.025137, 2012. a, b
Newsom, R. K., Turner, D. D., Lehtinen, R., Münkel, C., Kallio, J., and Roininen, R.: Evaluation of a Compact Broadband Differential Absorption Lidar for Routine Water Vapor Profiling in the Atmospheric Boundary layer, J. Atmos. Ocean. Tech., 37, 47–65, https://doi.org/10.1175/jtech-d-18-0102.1, 2019. a, b
NRC: Observing Weather and Climate from the Ground Up, National Academies Press, Washington, D.C., https://doi.org/10.17226/12540, 2009. a
Piironen, P. and Eloranta, E. W.: Demonstration of a high-spectral-resolution lidar based on an iodine absorption filter, Opt. Lett., 19, 234–236, 1994. a
Radlach, M., Behrendt, A., and Wulfmeyer, V.: Scanning rotational Raman lidar at 355 nm for the measurement of tropospheric temperature fields, Atmos. Chem. Phys., 8, 159–169, https://doi.org/10.5194/acp-8-159-2008, 2008. a
Ralph, F. M., Dettinger, M., Lavers, D., Gorodetskaya, I. V., Martin, A., Viale, M., White, A. B., Oakley, N., Rutz, J., Spackman, J. R., Wernli, H., and Cordeira, J.: Atmospheric Rivers Emerge as a Global Science and Applications Focus, B. Am. Meteorol. Soc., 98, 1969–1973, https://doi.org/10.1175/BAMS-D-16-0262.1, 2017. a
Reichardt, J., Wandinger, U., Klein, V., Mattis, I., Hilber, B., and Begbie, R.: RAMSES: German Meteorological Service autonomous Raman lidar for water vapor, temperature, aerosol, and cloud measurements, Appl. Optics, 51, 8111–8131, https://doi.org/10.1364/AO.51.008111, 2012. a
Remsberg, E. E. and Gordley, L. L.: Analysis of differential absorption lidar from the space shuttle, Appl. Optics, 17, 624–30, https://doi.org/10.1364/AO.17.000624, 1978. a
Repasky, K., Moen, D., Spuler, S., Nehrir, A., and Carlsten, J.: Progress towards an Autonomous Field Deployable Diode-Laser-Based Differential Absorption Lidar (DIAL) for Profiling Water Vapor in the Lower Troposphere, Remote Sens., 5, 6241–6259, https://doi.org/10.3390/rs5126241, 2013. a
Schneider, T., O'Gorman, P. A., and Levine, X. J.: Water Vapor and the Dynamics of Climate Changes, Rev. Geophys., 48, RG3001, https://doi.org/10.1029/2009RG000302, 2010. a
Sherwood, S. C., Roca, R., Weckwerth, T. M., and Andronova, N. G.: Tropospheric water vapor, convection, and climate, Rev. Geophys., 48, RG2001, https://doi.org/10.1029/2009RG000301, 2010. a
Späth, F., Behrendt, A., Muppa, S. K., Metzendorf, S., Riede, A., and Wulfmeyer, V.: 3-D water vapor field in the atmospheric boundary layer observed with scanning differential absorption lidar, Atmos. Meas. Tech., 9, 1701–1720, https://doi.org/10.5194/amt-9-1701-2016, 2016. a
Späth, F., Behrendt, A., and Wulfmeyer, V.: Minimization of the Rayleigh-Doppler error of differential absorption lidar by frequency tuning: a simulation study, Opt. Express, 28, 30324–30339, https://doi.org/10.1364/OE.396568, 2020. a, b
Spuler, S. M., Repasky, K. S., Morley, B., Moen, D., Hayman, M., and Nehrir, A. R.: Field-deployable diode-laser-based differential absorption lidar (DIAL) for profiling water vapor, Atmos. Meas. Tech., 8, 1073–1087, https://doi.org/10.5194/amt-8-1073-2015, 2015. a, b, c, d, e
Stevens, B. and Bony, S.: Water in the atmosphere, Phys. Today, 66, 29–34, https://doi.org/10.1063/PT.3.2009, 2013a. a
Stevens, B. and Bony, S.: What Are Climate Models Missing?, Science, 340, 1053–1054, https://doi.org/10.1126/science.1237554, 2013b. a
Stillwell, R. A., Spuler, S. M., Hayman, M., Repasky, K. S., and Bunn, C. E.: Demonstration of a combined differential absorption and high spectral resolution lidar for profiling atmospheric temperature, Opt. Express, 28, 71–93, https://doi.org/10.1364/OE.379804, 2020. a, b, c, d
Takase, K., Stockton, J. K., and Kasevich, M. A.: High-power pulsed-current-mode operation of an overdriven tapered amplifier, Opt. Lett., 32, 2617–2619, https://doi.org/10.1364/OL.32.002617, 2007. a
Weckwerth, T. M., Wulfmeyer, V., Wakimoto, R. M., Hardesty, M. R., Wilson, J. W., and Banta, R. M.: NCAR-NOAA Lower-Tropospheric Water Vapor Workshop, B. Am. Meteorol. Soc., 80, 2339–2357, https://doi.org/10.1175/1520-0477(1999)080<2331:WOTOFE>2.0.CO;2, 1999. a
Weckwerth, T. M., Weber, K. J., Turner, D. D., and Spuler, S. M.: Validation of a Water Vapor Micropulse Differential Absorption Lidar (DIAL), J. Atmos. Ocean. Tech., 33, 2353–2372, https://doi.org/10.1175/JTECH-D-16-0119.1, 2016. a, b, c
Wirth, M., Fix, A., Mahnke, P., Schwarzer, H., Schrandt, F., and Ehret, G.: The airborne multi-wavelength water vapor differential absorption lidar WALES: System design and performance, Appl. Phys. B-Lasers O., 96, 201–213, https://doi.org/10.1007/s00340-009-3365-7, 2009. a
Wulfmeyer, V.: Ground-based differential absorption lidar for water-vapor and temperature profiling: development and specifications of a high-performance laser transmitter, Appl. Optics, 37, 3804–3824, 1998. a, b
Wulfmeyer, V. and Bösenberg, J.: Ground-based differential absorption lidar for water-vapor profiling: assessment of accuracy, resolution, and meteorological applications, Appl. Optics, 37, 3825, https://doi.org/10.1364/AO.37.003825, 1998. a, b, c, d
Wulfmeyer, V., Hardesty, R. M., Turner, D. D., Behrendt, A., Cadeddu, M. P., Di Girolamo, P., Schlüssel, P., Van Baelen, J., and Zus, F.: A review of the remote sensing of lower tropospheric thermodynamic profiles and its indispensable role for the understanding and the simulation of water and energy cycles, Rev. Geophys., 53, 819–895, https://doi.org/10.1002/2014RG000476, 2015. a, b
A list of past field projects is available at https://www.eol.ucar.edu/mpd (last access: 11 February 2021).
Information about the project is available at https://www.arm.gov/research/campaigns/sgp2019mpddemo (last access: 11 February 2021).
Note that we have conducted preliminary tests of fiber-coupled TSOAs. The early results look promising, but more development is needed before a fully fiber-coupled transmitter is ready for routine deployment.
Note here the operational laser locking routine uses a tolerance of ±25 MHz before attempting to recenter the laser frequency.
In practice, as discussed in Repasky et al. (2013), the MPD receiver focus is adjusted to decrease that distance to about 1.5 km.
We have since engaged the manufacturer of this part on the potential of purchasing it in the future with light-tight fibers.
A surface weather station (Lufft WS300) is built into each MPD unit.
- Abstract
- Introduction
- Active remote sensing approaches
- Instrument overview
- MPD development history
- Transmitter
- Receiver
- Data processing
- Instrument validation
- Conclusions
- Appendix A: Measurement of linewidth and spectral purity
- Appendix B: Combined receiver design considerations
- Data availability
- Author contributions
- Competing interests
- Disclaimer
- Acknowledgements
- Financial support
- Review statement
- References