the Creative Commons Attribution 4.0 License.
the Creative Commons Attribution 4.0 License.
 | 02 Jul 2021
Mie–Raman–fluorescence lidar observations of aerosols during pollen season in the north of France
Igor Veselovskii
Qiaoyun Hu
Philippe Goloub
Thierry Podvin
Marie Choël
Nicolas Visez
Mikhail Korenskiy
The multiwavelength Mie–Raman–fluorescence lidar of the University of Lille has the capability to measure three aerosol backscattering coefficients, two extinction coefficients and three linear depolarization ratios, together with fluorescence backscattering at 466 nm. It was used to characterize aerosols during the pollen season in the north of France for the period March–June 2020. The results of observations demonstrate that the presence of pollen grains in aerosol mixture leads to an increase in the depolarization ratio. Moreover, the depolarization ratio exhibits a strong spectral dependence increasing with wavelength, which is expected for the mixture containing fine background aerosols with low depolarization and strongly depolarizing pollen grains. A high depolarization ratio correlates with the enhancement of the fluorescence backscattering, corroborating the presence of pollen grains. Obtained results demonstrate that simultaneous measurements of particle depolarization and fluorescence allows for the separation of dust, smoke particles and aerosol mixtures containing the pollen grains.
- Article
(6465 KB) - Full-text XML
- BibTeX
- EndNote


Pollen grains represent a significant fraction of primary biological particles emitted from the biosphere into the atmosphere in certain seasons and locations (Fröhlich-Nowoisky et al., 2016). There has been a growing interest in pollen study in recent years because they can affect human health by causing allergy-related diseases and contribute to cloud formation by acting as giant cloud condensation nuclei (CCN) (Diehl et al., 2001; Pope, 2010; Griffiths et al., 2012; D'Amato et al., 2014; Steiner et al., 2015; Lake et al., 2017; Mack et al., 2020). To investigate the processes of pollen transport and dispersion, information about the vertical distribution of pollen grains is needed, and this information can be obtained from lidar measurements. Pollen grains are large irregularly shaped particles of complicated morphology (Frenguelli, 2003; Katifori et al., 2010) causing strong depolarization of backscattered laser radiation, which provides a basis for their identification. The first profiling of pollen with depolarization lidar was reported by Sassen (2008, 2011). His measurements over Alaska revealed that the linear depolarization ratio of birch pollen plumes at 694 nm can exceed 30 %. Further studies of pollen with elastic backscatter lidar at 532 nm were reported by Noh et al. (2013a, b) and by Sicard et al. (2016). Their measurements confirmed the high depolarization ratio of pollen grains (particle depolarization ratios as high as 43 % were observed for aerosol mixtures containing Platanus and Pinus pollen). Moreover, pollen grain backscattering demonstrates a strong diurnal cycle, being the highest near noon. The use of multiwavelength observations increases the capability of the lidar technique for aerosol characterization. In recent studies by Bohlmann et al. (2019) and Shang et al. (2020), measurements performed with PollyXT lidar allowed for the estimation of mean values of lidar ratios (about 45 and 55 sr at 355 and 532 nm, respectively, for birch pollen grains). Lidar measurement of the pollen depolarization ratio at 355, 532 and 1565 nm was also reported in the recent work of Bohlmann et al. (2021), revealing a strong decrease in the depolarization ratio at 355 nm.
Atmospheric biological particles efficiently produce wideband fluorescence emissions when exposed to UV radiation (Pöhlker et al., 2012; Pan, 2015; Miyakawa et al., 2015), which offers an opportunity for monitoring them with fluorescence lidars. Nowadays, lidar spectrometers based on multi-anode photomultipliers allow simultaneous detection of fluorescence backscattering in 32 spectral bins (Sugimoto et al., 2012; Reichardt, 2014; Reichardt et al., 2017; Saito et al., 2018; Richardson et al., 2019). In particular, such a lidar spectrometer was used in the recent work of Saito et al. (2018) for remote measurement of the fluorescence spectrum of atmospheric pollen grains. The results demonstrate that, for the 355 nm stimulating wavelength, the fluorescence spectra of different pollen grains have maxima in the 400–600 nm range and a intensity peak at around 460 nm.
To achieve the highest sensitivity of fluorescence detection, in many tasks it is preferable to use single-channel monitoring, whereby a part of the fluorescence spectrum is selected with a wideband interference filter (Immler et al., 2005; Rao et al., 2018; Li et al., 2019). In our recent publication (Veselovskii et al., 2020a) we reported the results obtained from a modified Mie–Raman lidar system at the Laboratoire d'optique Atmosphérique with one additional fluorescence channel at 466 nm. Such an approach has proved high sensitivity, allowing for the detection of fluorescence signals from weak aerosol layers and the calculation of the fluorescence backscattering coefficient from the ratio of fluorescence and nitrogen Raman backscatters, thus making it potentially attractive for pollen monitoring.
In the present research we combine the capability of multiwavelength Mie–Raman lidar for providing three backscattering coefficients, two aerosol extinction coefficients and the linear depolarization ratio at three wavelengths with single-channel fluorescence measurements for characterization of aerosol mixtures containing pollen grains. The measurements reported were performed during the March–June 2020 period at the Lille Atmospheric Observation Platform (https://www-loa.univ-lille1.fr/observations/plateformes.html?p=apropos, last access: 30 June 2021) hosted by the Laboratoire d'Optique Atmospherique, University of Lille, Hauts-de-France region.
2.1 Mie–Raman–fluorescence lidar
The measurements were performed using the LILAS (LIlle Lidar AtmosphereS) system – a multiwavelength Mie–Raman lidar based on a tripled Nd:YAG laser with a 20 Hz repetition rate and pulse energy of 70 mJ at 355 nm. The backscattered light is collected by a 40 cm aperture Newtonian telescope. The full geometrical overlap of the laser beam and the telescope field of view (FOV) is achieved at approximately 1000 m. To obtain the information about particles at lower altitudes, some of the measurements were performed at an angle of 30∘ to the horizon. No overlap correction of lidar signals was performed. The system is designed for simultaneous detection of elastic and Raman backscattering, allowing the so-called data configuration, including three particle backscattering coefficients (β355, β532, β1064), two extinction coefficients (α355, α532) and three particle depolarization ratios (δ355, δ532, δ1064). The particle depolarization ratio δ, determined as the ratio of cross- and co-polarized components of the particle backscattering coefficient, was calculated and calibrated the same way as described in Freudenthaler et al. (2009). The description of the system can be found in the recent publication of Hu et al. (2019).
To perform fluorescence lidar measurements, the water vapor Raman channel at 408 nm was replaced by a fluorescence channel, whose spectrum is captured by a wideband filter centered at 466 nm and of 44 nm width (Veselovskii et al., 2020a). The fluorescence measurements were performed during nighttime only. The aerosol extinction and backscattering coefficients at 355 and 532 nm were calculated from Mie–Raman observations (Ansmann et al., 1992), while β1064 was derived by the Klett method (Klett, 1985). The fluorescence backscattering coefficient βF is calculated from the ratio of fluorescence and nitrogen Raman backscattering, as described in Veselovskii et al. (2020a). This approach allows for the evaluation of the absolute values of βF if the relative sensitivity of the channels is calibrated and the nitrogen Raman scattering cross section is known. We estimate the corresponding uncertainty to be below 50 %. Parameters of detectors were not changed during the campaign, so the uncertainty of relative variations of βF was significantly lower and was determined by the statistical errors of fluorescence measurements.
To characterize the efficiency of the fluorescence with respect to elastic scattering, the fluorescence capacity,
is also used. This parameter depends on the relative humidity (RH), so information about RH is important for data analysis. Radiosonde measurements are used to monitor water vapor, as the water vapor channel is replaced by the fluorescence channel in the current lidar configuration. The closest available radiosonde data are from Herstmonceux (UK) and Beauvecchain (Belgium) stations, located 160 and 80 km away from the observation site, respectively. These radiosonde data are not collocated with the lidar measurements, so only qualitative analysis of humidification effects was possible.
2.2 Pollen in situ sampling
Airborne pollen grains and spores were collected by a Hirst-type volumetric sampler (Lanzoni VPPS 2000). The pollen sampler was located on the campus of the University of Lille (France) on the rooftop of a 20 m high building where the lidar instrument was operated. Ambient air was sampled at a 10 L min−1 flow rate, allowing the impaction of pollen and spores on an adhesive strip mounted on a rotating clockwork-driven drum. The impaction surface moves at 2 mm h−1 behind the entrance slit, allowing a temporal resolution of 2 h. The adhesive strip was substituted every 7 d after a full rotation of the drum, which is split into seven parts, each corresponding to a day of monitoring. And then they are fixed on a microscope glass slide with gelatin and fuchsine dye. Pollen taxa were identified by light microscopy on the basis of their characteristic shape and size. Airborne pollen concentrations were expressed as a daily and dual hourly number of pollen grains per cubic meter of air.
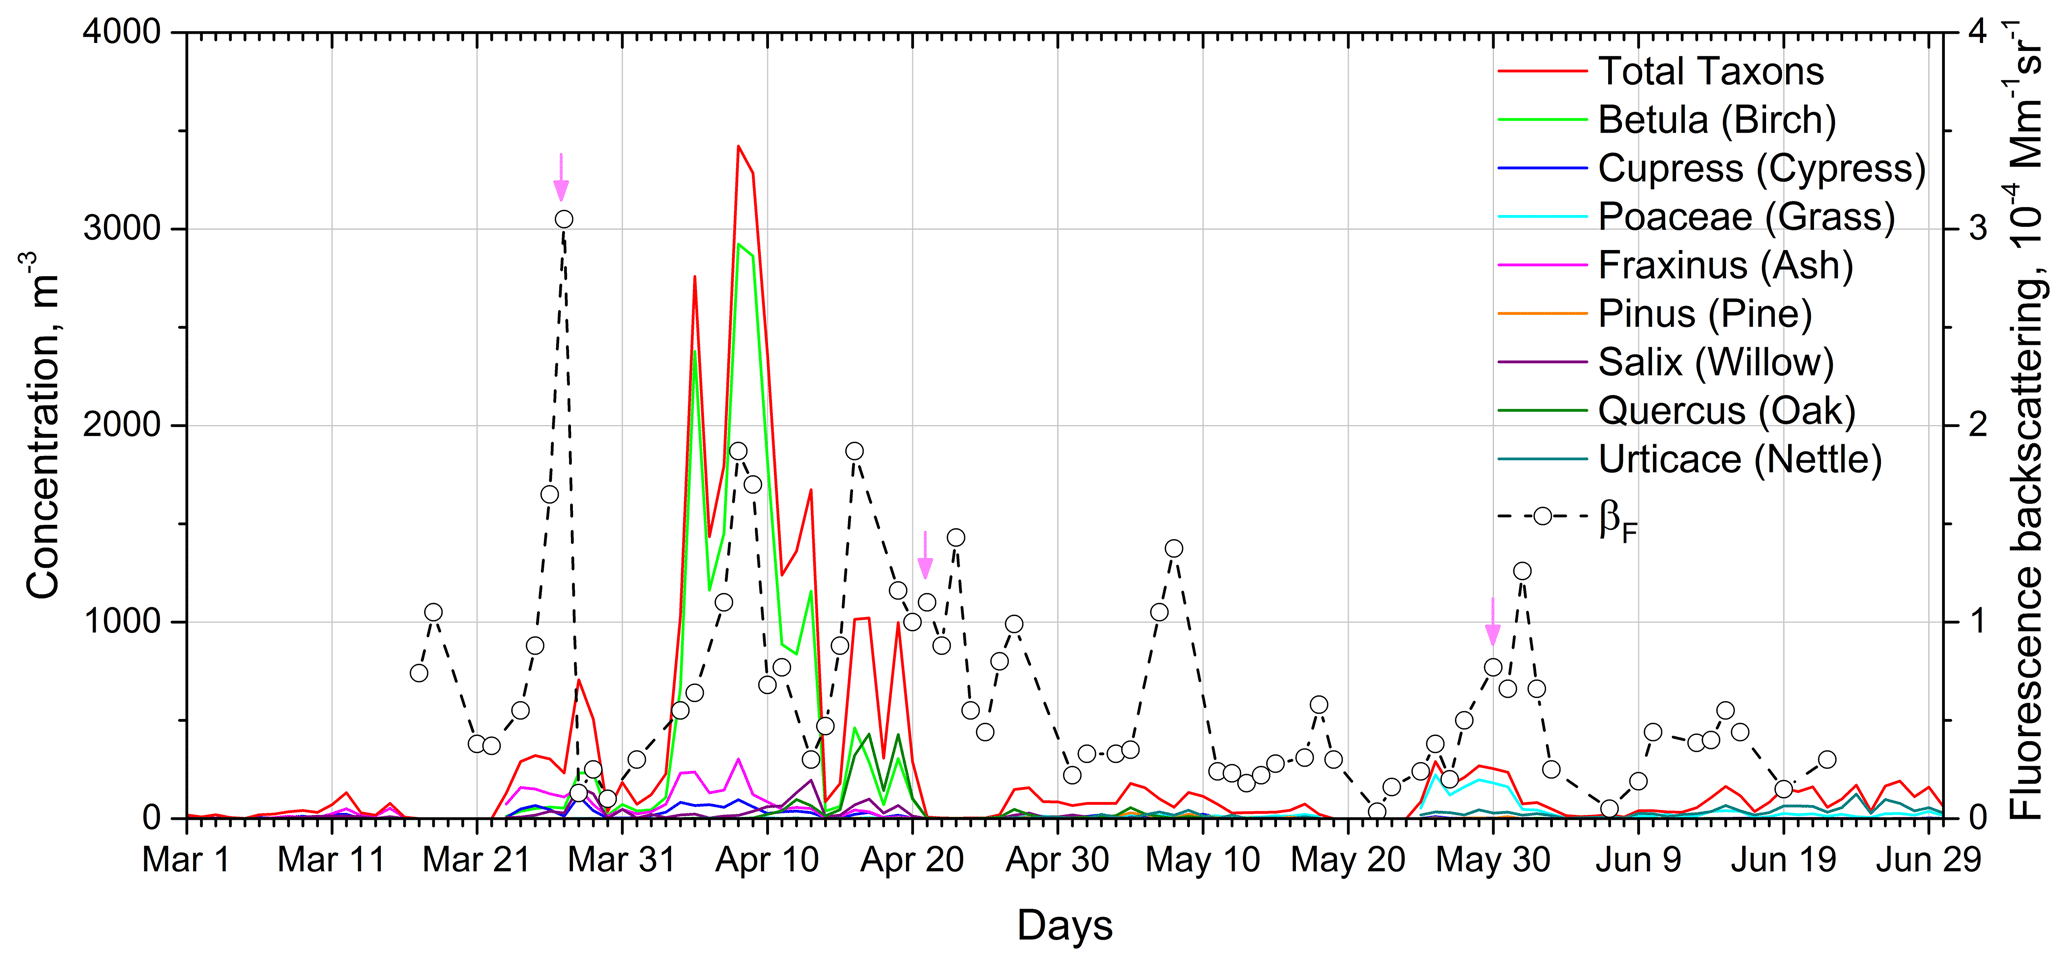
Figure 1Daily concentration of the most abundant pollen taxa for the period March–June 2020 in Lille from in situ measurements on the rooftop. Open symbols show fluorescence backscattering βF measured by lidar. Lidar measurements are averaged overnight, and the maximal value in the 500–1000 m range is shown. Vertical arrows mark the sessions, which are further analyzed in Figs. 8, 10 and 11.
Figure 1 shows the most abundant pollen taxa for the period from March to June 2020 in Lille. These include Betula (54.8 % of total pollen taxa over the period), Fraxinus (8.2 %), Quercus (5.8 %), Urticaceae (4.6 %), Salix (4.5 %) and Cupressaceae (4.1 %). The same figure also shows the fluorescence backscattering βF measured by lidar. The results presented are obtained by averaging all available data during the night, and the maximal values in the 500–1000 m height range are shown. The highest fluorescence was observed at the end of March when ash (Fraxinus) is the main pollinator. The period of intense birch (Betula) pollination (3–15 April 2020) also correlates with high βF. Strong fluorescence observed for the 5–10 May and 28 May–2 June periods can be due to grass (Poaceae) pollen contribution. By the end of June, βF decreases and becomes comparable with the fluorescence backscattering of background aerosol. From Fig. 1, we can conclude that there is no direct correlation between in situ and fluorescence lidar measurements; thus, pollen grains observed in the boundary layer by the lidar are probably transported from other regions. Comparing lidar and in situ observations, we should also keep in mind that maximum of pollen emission occurs near noon, while lidar measurements were performed in the night.
3.1 Specific features of pollen-containing aerosol mixture
In contrast to the observations performed over Alaska (Sassen, 2008, 2011) and in Kuopio, Finland (Bohlmann et al., 2019), where the pollen concentration was high due to boreal forests surrounding, the pollen loading in the north of France is significantly lower. Long-term lidar and sun photometer observations performed at the University of Lille demonstrate that local aerosol is mainly of continental type, with a predominance of fine-mode particles and a low depolarization ratio. The emission of large pollen grains should lead to strong spectral dependence of the depolarization ratio because the backscattering at 1064 nm is less sensitive to fine background particles than at shorter wavelengths; thus, the particle depolarization ratio at 1064 nm (δ1064) should be more sensitive to the presence of pollen grains compared to δ355 and δ532. The particle depolarization ratio δ of the mixture containing background aerosol (b) and pollen (p), with corresponding depolarization ratios δb and δp, can be calculated as
Here total backscattering .
To estimate the dependence of depolarization of the aerosol mixture on the contribution of pollen to the backscattering coefficient at 532 nm, a simplified simulation was performed. Assuming that the depolarization ratios of pollen and background aerosol are spectrally independent and that δp = 30 % when δb = 3 %, the mixture depolarization ratios δ355, δ532 and δ1064 were calculated as a function of using Eq. (2). For pollen the backscattering Ångström exponents (BAE) were used. The backscattering Ångström exponents of background aerosol are assumed to be the same for both wavelength pairs (), and computations were performed for the values of BAE Aβ = 1.0, 1.5 and 2.0. Results of the simulation are shown in Fig. 2. For a low pollen contribution the depolarization ratio δ1064 increases faster with compared to δ532 and δ355, and the slope of this increase depends on the BAE value. Spectral properties of the real mixture can be more complicated due to possible spectral dependence of both δp and δb. Information on laboratory-measured spectral dependence of depolarization ratios of pollen is rare. Cao et al. (2010) measured the linear depolarization ratio of several types of pollen in a chamber at 355, 532 and 1064 nm wavelengths. The results demonstrate strong variation of spectral dependence for different taxa, and for most of the samples δ532 exceeded both δ355 and δ1064. In particular, for birch pollen, depolarization ratios at 355, 532 and 1064 nm are 8 %, 33 % and 28 %. Using the depolarization ratios from Cao et al. (2010) in the analysis, we should also keep in mind that measurements in the chamber were performed at low RH, and depolarization ratios at higher RH may be different.
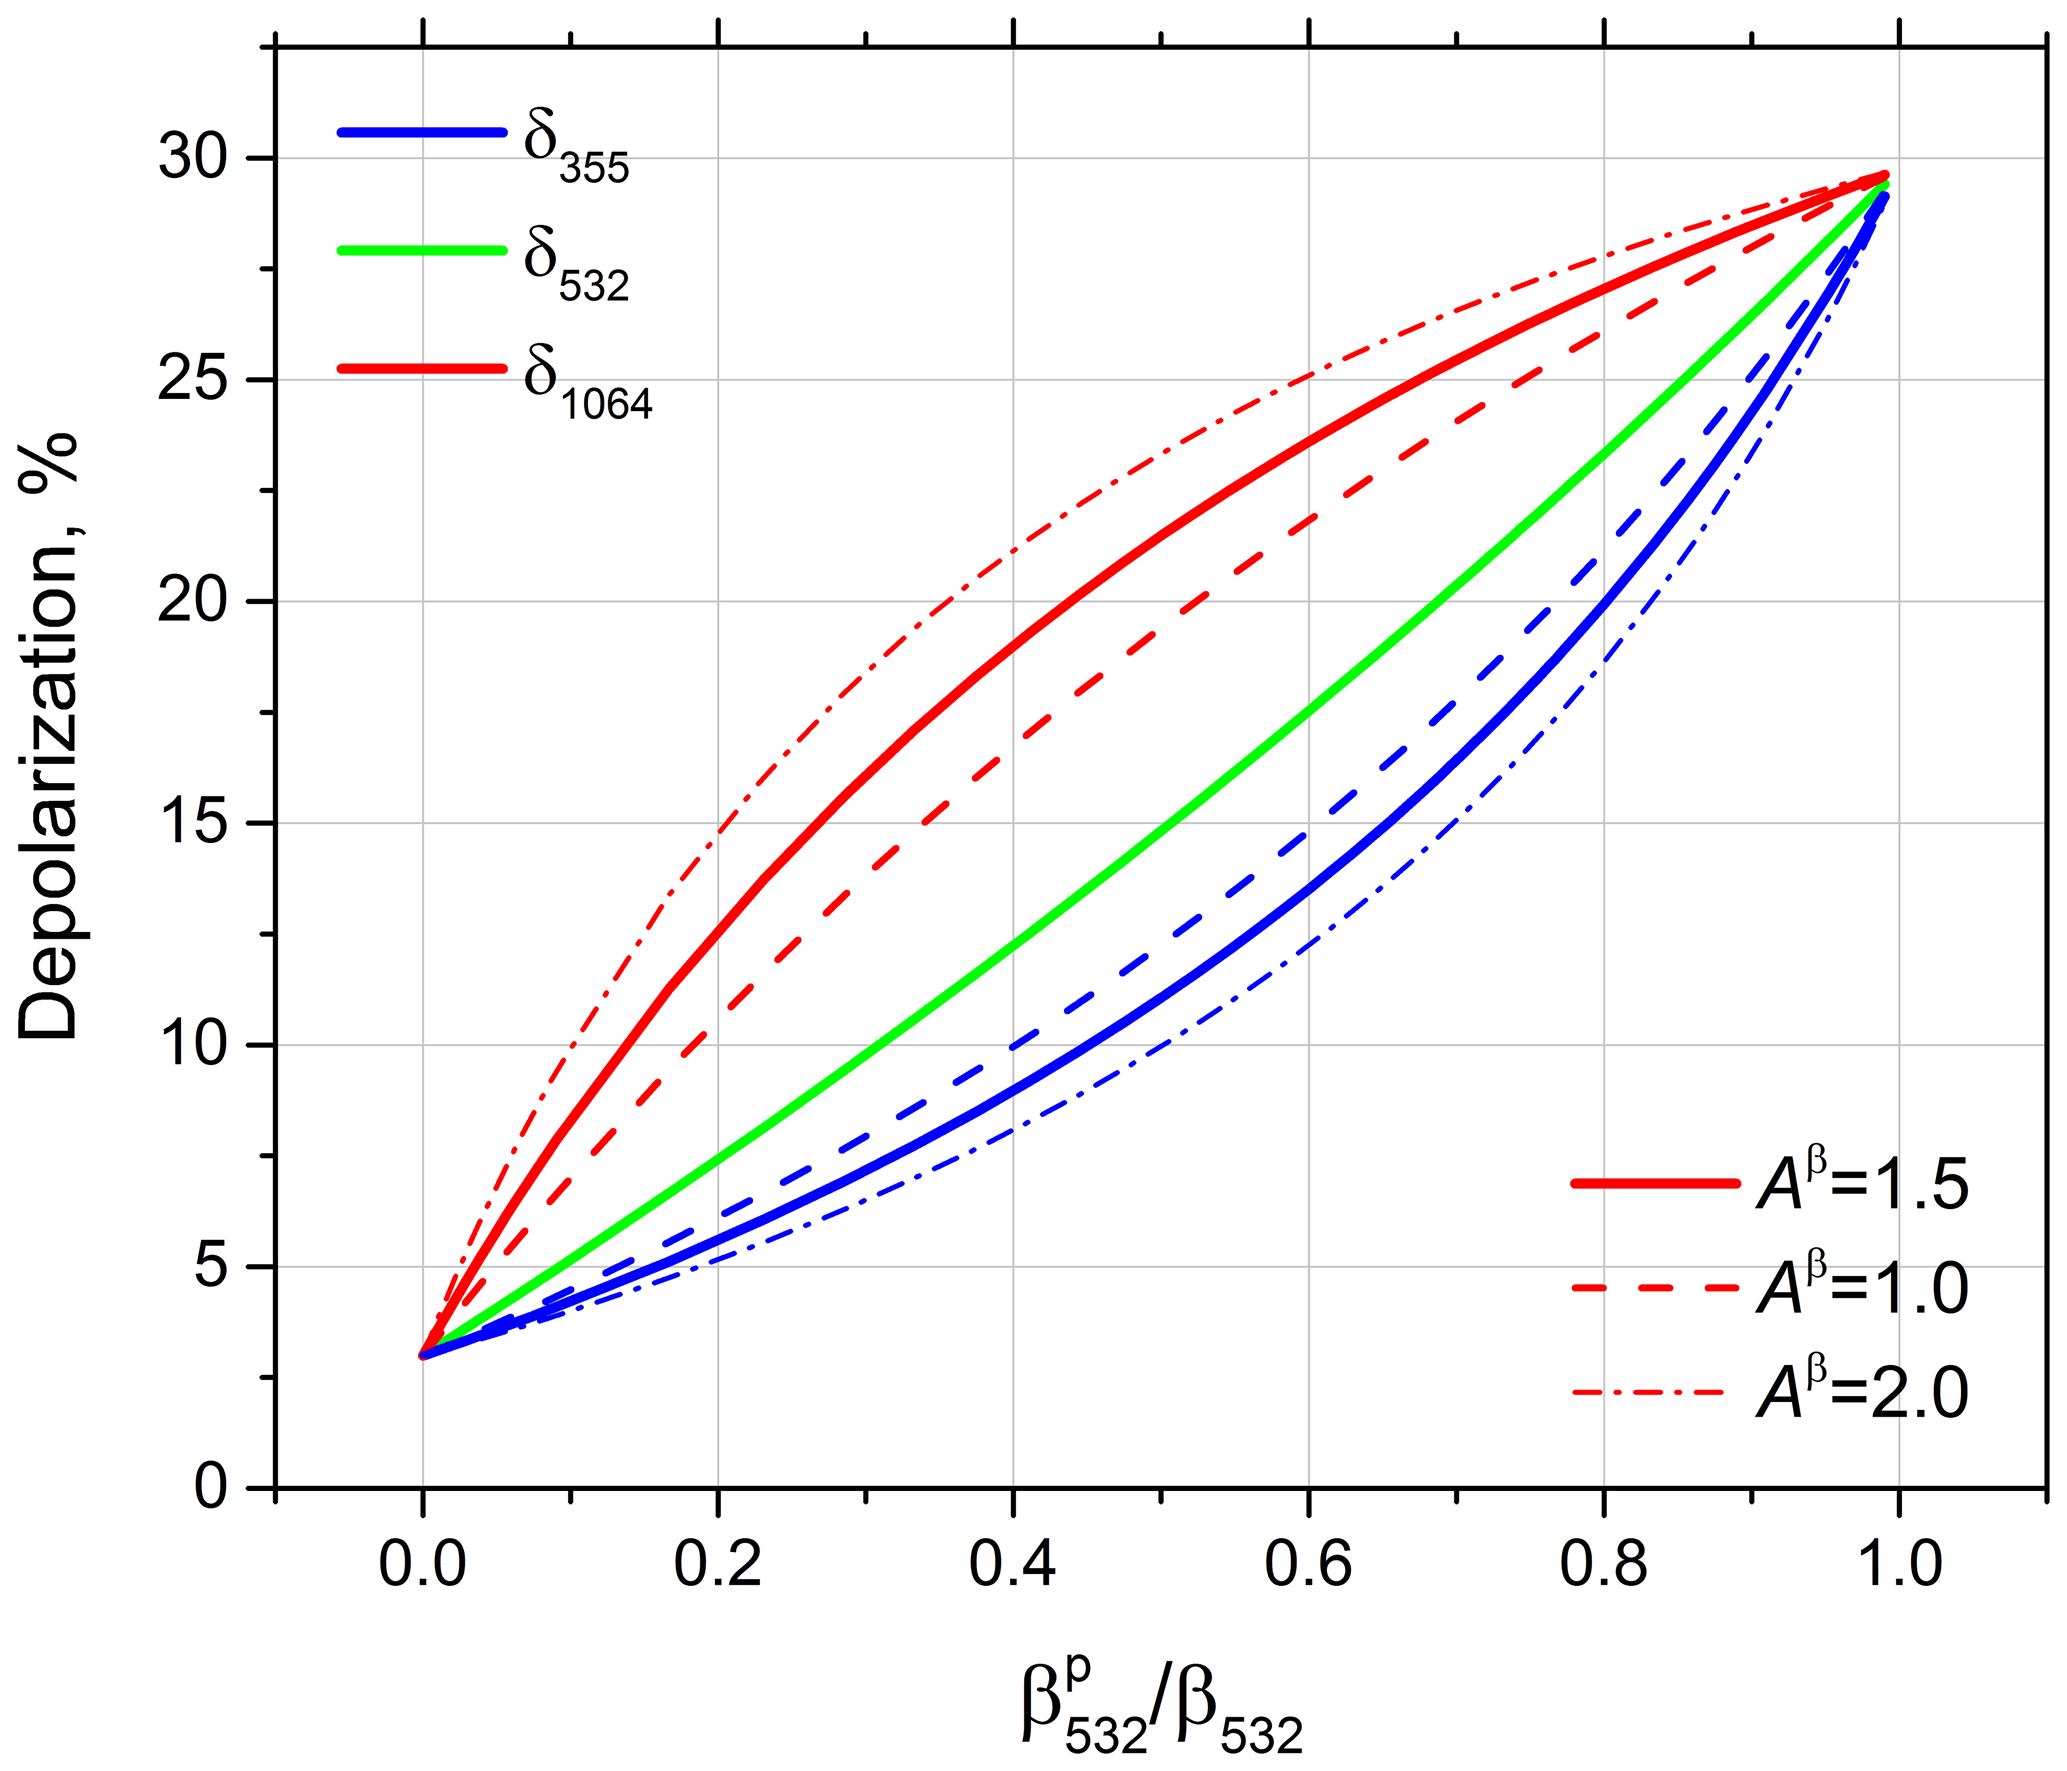
Figure 2Depolarization ratios at 355, 532 and 1064 nm as a function of pollen contribution to the total backscattering coefficient . Depolarization ratios of pollen (δp) and background aerosol (δb) are assumed to be spectrally independent (δp = 30 % and δb = 3 %). The backscattering coefficient of pollen is spectrally independent. The backscattering Ångström exponents of background aerosol were assumed to be the same for both pairs of wavelengths (), and results are shown for the values Aβ = 1.0, 1.5 and 2.0.
The Ångström exponents and depend on the particle size and the refractive index in different ways (Veselovskii et al., 2015), so their values can be different. Thus, spectral dependence of the depolarization ratio of an aerosol–pollen mixture will differ from the simplified modeling shown in Fig. 2. However, for a moderate contribution of pollen to the total backscattering , the depolarization ratio at 1064 nm should be higher than that at shorter wavelengths. Hence, an increase in the particle depolarization ratio with wavelength can be an indication of the presence of large, irregularly shaped pollen grains in an aerosol mixture.
The presence of pollen should also lead to a decrease in the extinction and backscattering Ångström exponents. The extinction Ångström exponent (EAE) depends mainly on particle size, while BAE is also sensitive to the particle complex refractive index and shape; thus, the measured profiles of EAE and BAE can present significant differences (Veselovskii et al., 2015, 2020b). In our study we analyze the EAE and BAE for the wavelength pair 355 nm and 532 nm ( and ) only because the extinction coefficient and backscattering coefficient involved are calculated from Mie–Raman observations.
When analyzing Mie–Raman–fluorescence lidar measurements of pollen-containing aerosol mixtures, numerous factors should be taken into account. These factors include the fluorescence of background aerosol and other non-pollen aerosols that have strong fluorescence capacity: for example, smoke particles. Dust particles can contribute to the increase in the depolarization ratio, and, finally, hygroscopic growth can modify the particle parameters. All these factors will be considered in the following sections.
3.2 Characteristics of background aerosol over the observation site
Long-term observations at the University of Lille demonstrate that aerosol over the observation site is mainly of continental type with a predominance of fine-mode particles. Typical vertical profiles of the background aerosol parameters, observed on 3 June 2020, are given in Fig. 3, showing aerosol elastic and fluorescence backscattering coefficients, lidar ratios, Ångström exponents and depolarization ratios at three wavelengths. The RH from Beauvecchain (Belgium) radiosonde observations was below 50 % in the height range considered. Particle depolarization ratios at all three wavelengths are below 7 %, indicating that the contribution of pollen to the total backscattering was low. This agrees with the low values of pollen concentration provided by in situ measurements (Fig. 1). The lidar ratios at both wavelengths (S355, S532) are close, varying in the 50–60 sr range, and the fluorescence capacity GF is below 0.35 × 10⁻⁴. The EAE and BAE (, ) are in the 1.5–2.0 range. The presence of pollen should lead to a deviation of the particle intensive parameters, such as the fluorescence capacity, depolarization ratio, EAE and BAE, from the typical values of background aerosol.
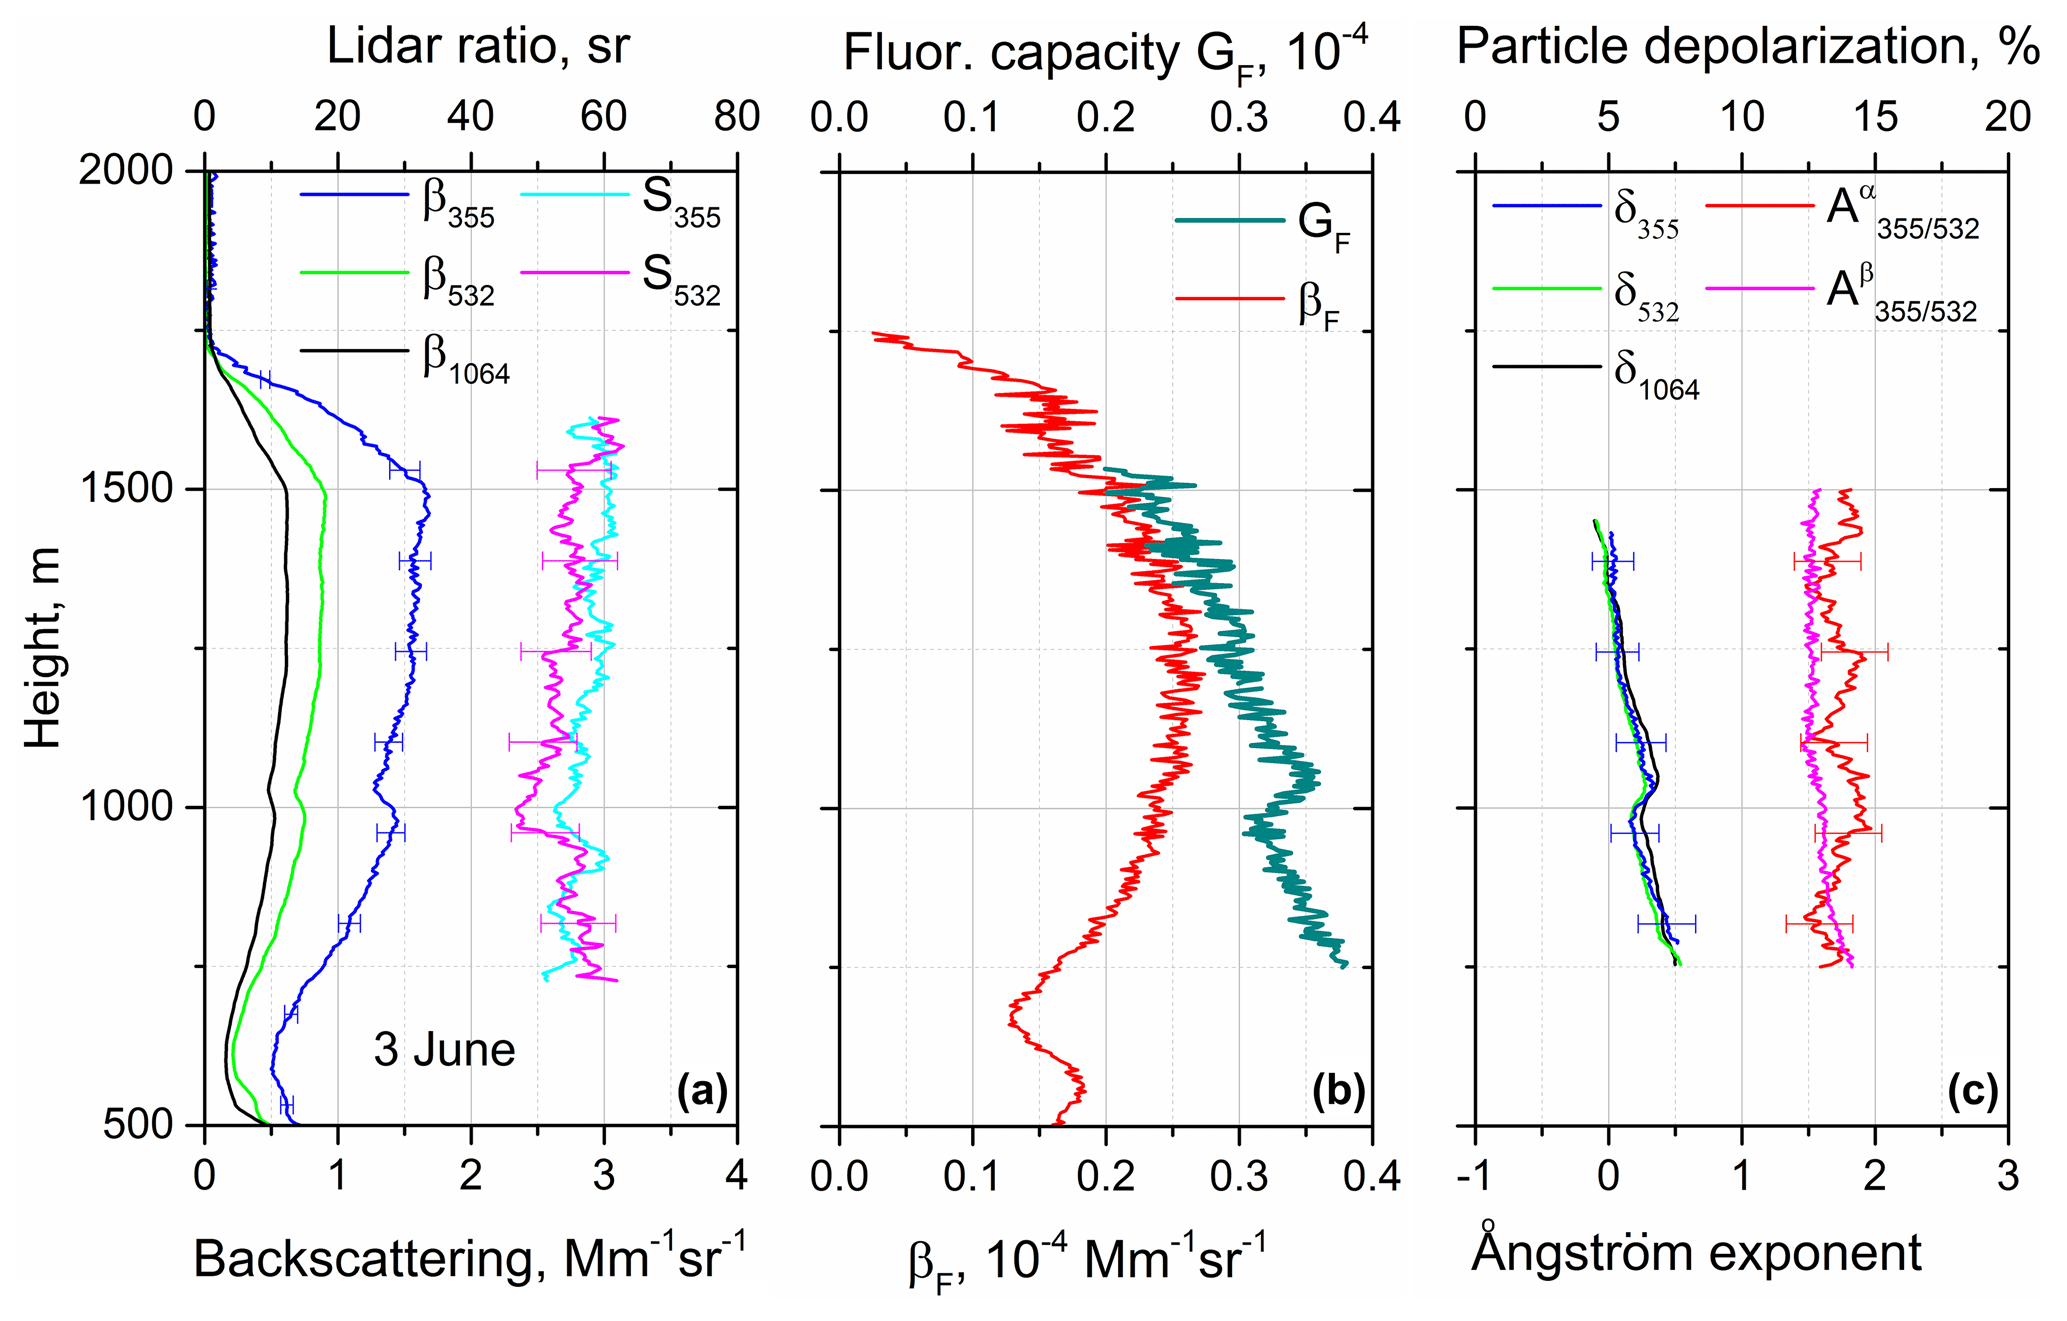
Figure 3Measurements in the condition of background aerosol predominance. Vertical profiles of (a) backscattering coefficients β355, β532 and β1064 as well as lidar ratios S355 and S532. (b) Fluorescence backscattering βF and fluorescence capacity . (c) Particle linear depolarization ratios δ355, δ532 and δ1064 together with extinction and backscattering Ångström exponents and on 3 June 2020 for 20:30–23:00 UTC. Measurements were performed at 30∘ to the horizon.
3.3 Identification of the smoke particles
During the observation period the smoke elevated layers transported over the Atlantic were frequently detected. Smoke particles are characterized by a high fluorescence cross section (Reichardt et al., 2017; Veselovskii et al., 2020a) and can interfere with pollen fluorescence measurements. The temporal evolution of the range-corrected lidar signal, volume depolarization ratio at 1064 nm and fluorescence backscattering for the smoke episode on the night of 23–24 June 2020 are shown in Fig. 4. During the night the smoke layer, with a low depolarization and high fluorescence, is observed at approximately 5000 m of height. Back trajectories (not shown) indicate that the layer is transported from Canada. Vertical profiles of the particle parameters for this episode are shown in Fig. 5. The lidar ratio is about 50 sr at 355 nm, while the lidar ratio at 532 nm increases within the smoke layer from 60 to 80 sr. This increase in S532 occurs simultaneously with decrease in from 1.5 to 0.75, indicating that the particle size inside the layer growths with height. Higher values of S532 with respect to S355 are typical for aged smoke (e.g., Müller et al., 2005; Nicolae et al., 2013; Hu et al., 2019). The depolarization ratio decreases with wavelength from δ355 = 10 % to δ1064 = 1.5 %. A strong spectral dependence of the depolarization ratio and, in particular, low values of δ1064 are the features allowing for the identification of smoke layers. We should also recall that an increase in the particle depolarization ratio at 355 nm is more typical for aged smoke layers in the high troposphere (Haarig et al., 2018), though we observed this increase at lower altitudes over Lille during smoke episodes in summer–autumn 2020.
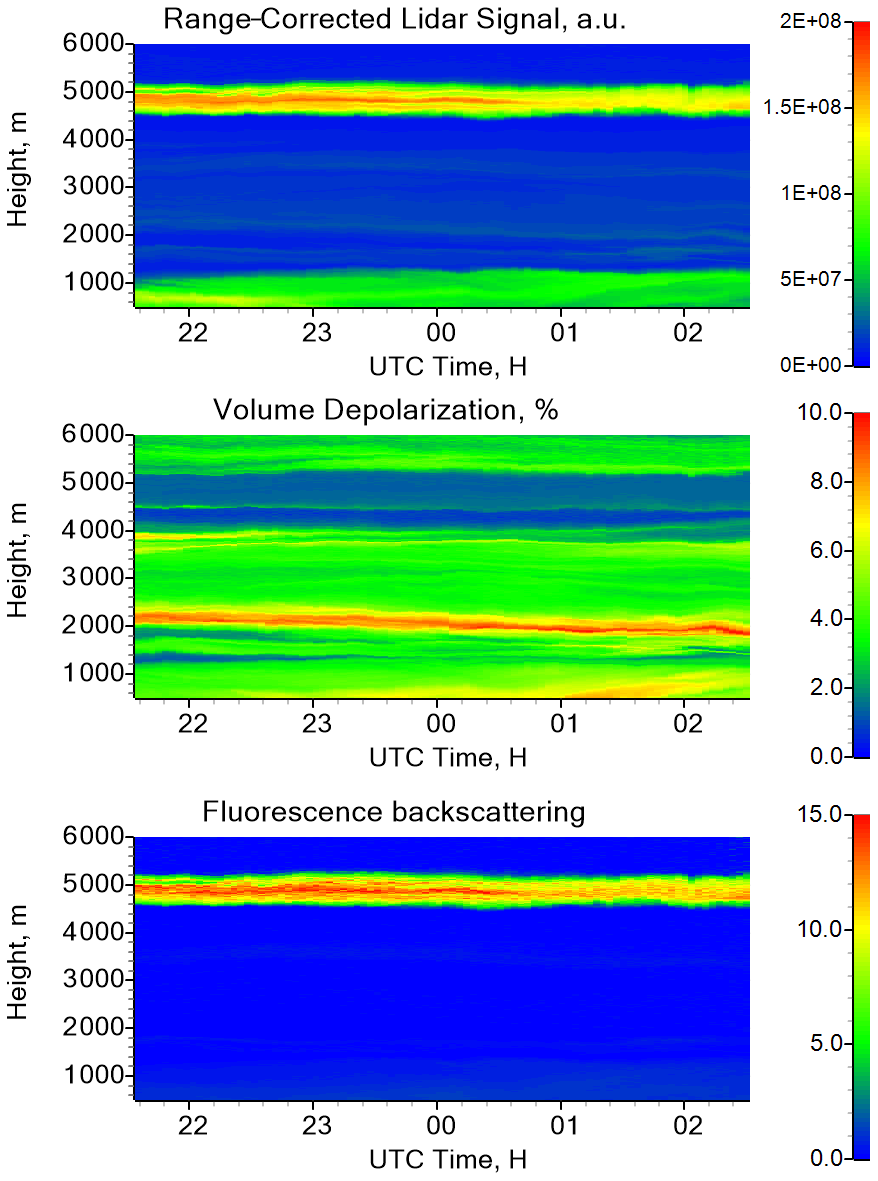
Figure 4Range-corrected lidar signal at 1064 nm, volume depolarization ratio at 1064 nm and fluorescence backscattering coefficient (in 10−4 Mm−1 sr−1) on 23–24 June 2020.
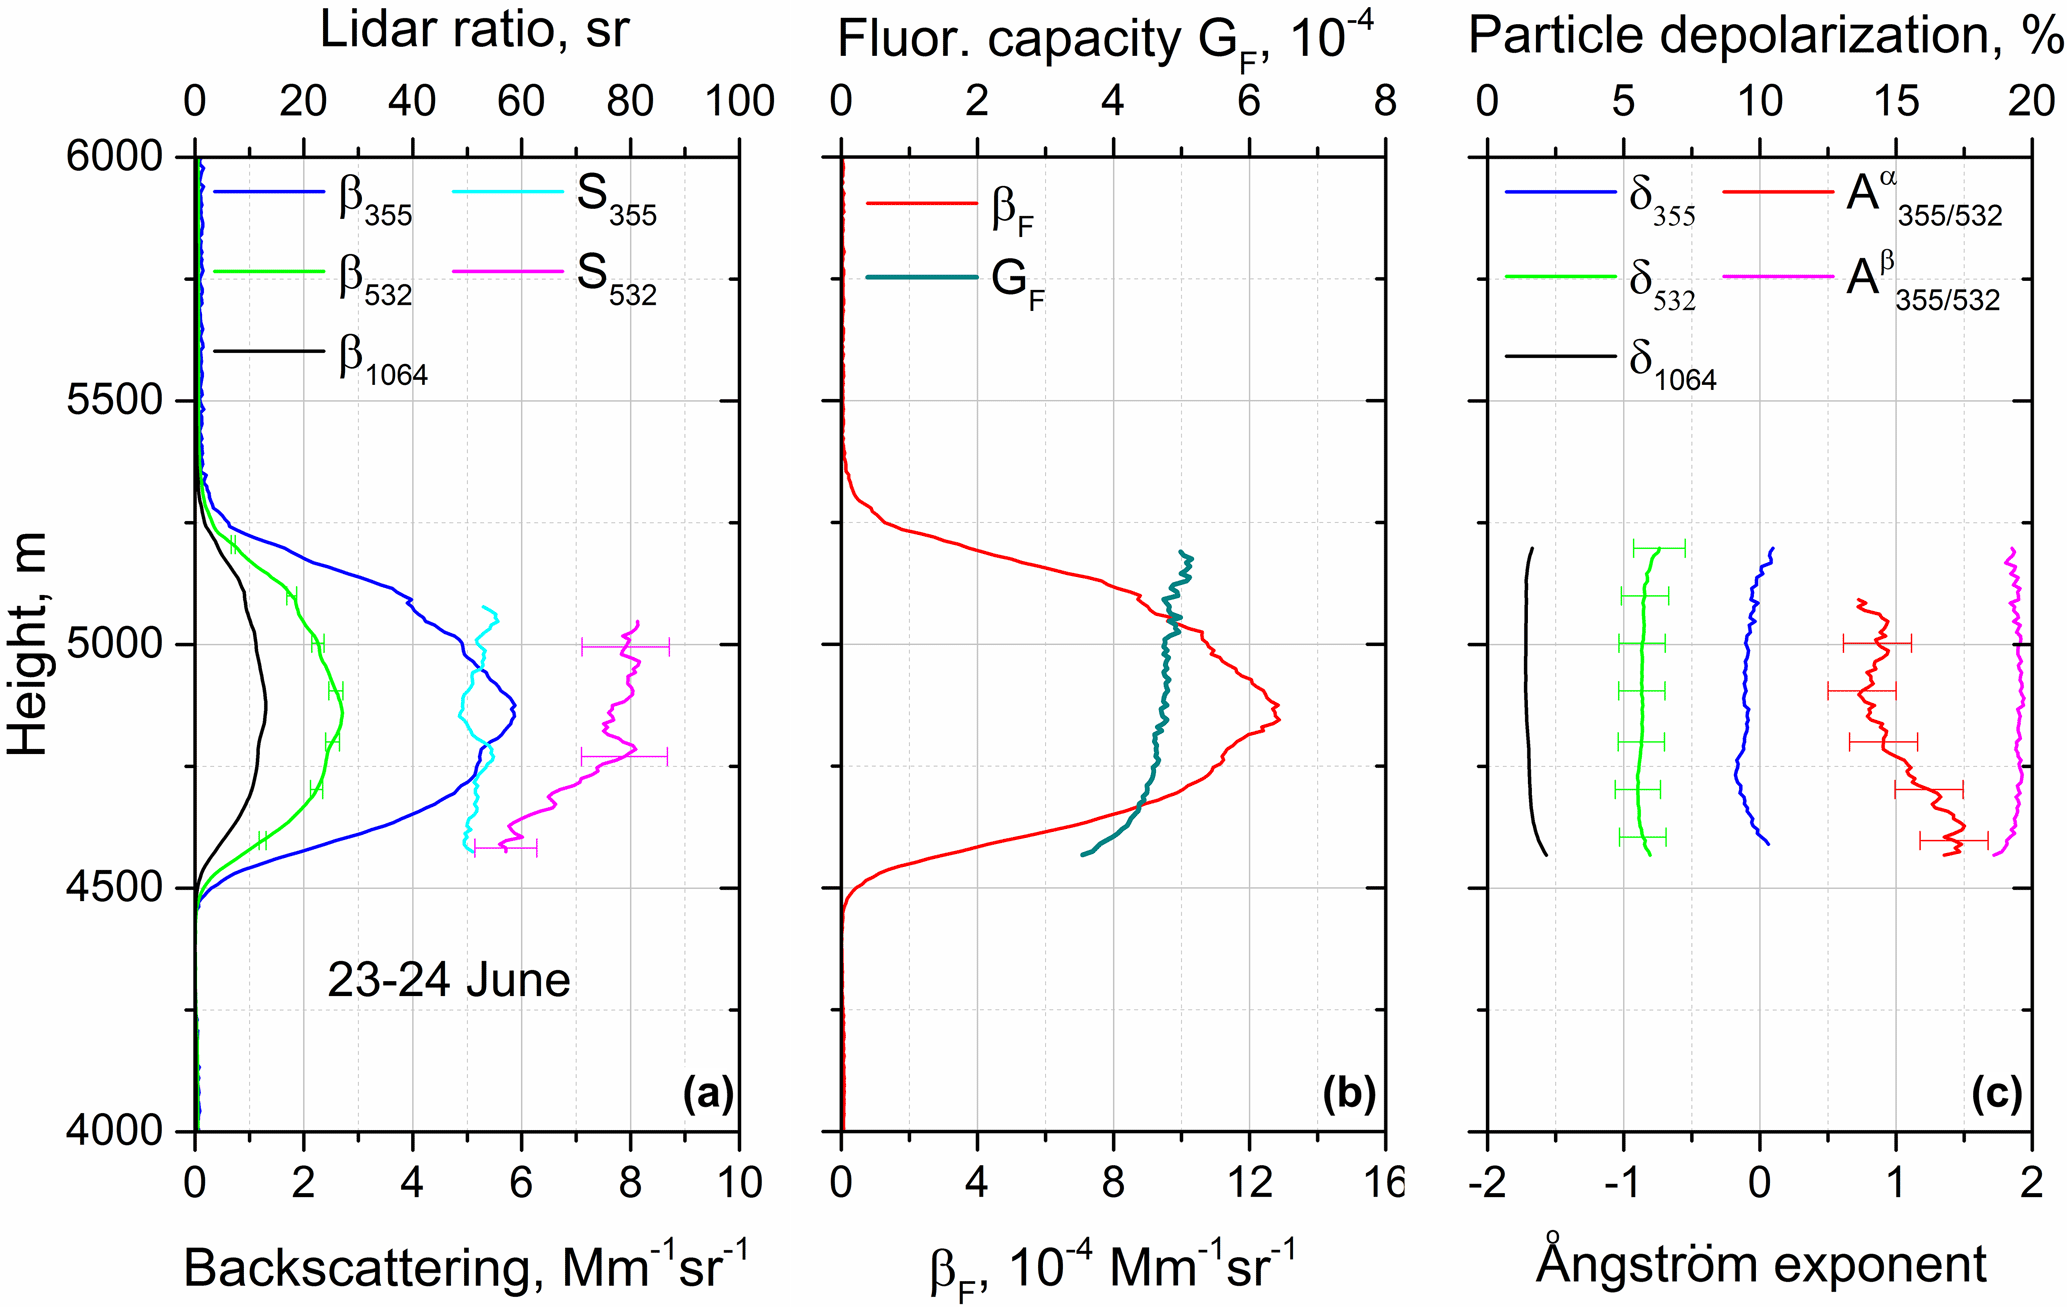
Figure 5Vertical profiles of (a) backscattering coefficients β355, β532 and β1064 as well as lidar ratios S355 and S532. (b) Fluorescence backscattering coefficient βF, fluorescence capacity GF, and (c) particle depolarization ratios δ355, δ532 and δ1064 together with the extinction and backscattering Ångström exponents and on the night of 23–24 June 2020 at 21:30–02:30 UTC.
The extinction Ångström exponent in the center of the layer is about 0.75, while is about 1.9 and shows no significant variation through the layer. High values of compared to represent another feature that will be used for aged smoke discrimination. Smoke fluorescence capacity is high, reaching up to GF = 5 × 10⁻⁴ for the period of observations, and this is one more feature allowing for the separation of smoke from other types of aerosol.
3.4 Identification of the dust particles
The presence of dust particles and pollen in the fine background aerosol leads to some common characteristics in the lidar data, such as decreased Ångström exponents and increased depolarization ratios. However, pollen and dust can be separated by the fluorescence capacity. The vertical profiles of particle parameters during a dust episode on 27 May are shown in Fig. 6. The dust-containing layer extends from 2000 to 7000 m, and the particle depolarization ratios δ1064 and δ532 in this layer are close to 20 %. These values are lower than the depolarization of pure dust. For example, Freudenthaler et al. (2009) for pure dust provide values of 27 % and 31 % at 1064 and 532 nm wavelengths, respectively; thus, in our case transported dust particles may be mixed with local aerosols. The particle depolarization at 355 nm is not shown in the figure because the scattering ratio in the dust layer was too low to compute δ355 reliably. The fluorescence capacity of particles in the dust layer is about 0.1 × 10⁻⁴ at 4000 m, which is a factor of 50 lower than GF of the smoke in Fig. 5. There is also a weak aerosol layer at 1600 m with β532 of about 0.035 Mm−1 sr−1. The fluorescence capacity in this layer is high (GF ≈ 2.0 × 10⁻⁴), suggesting that this layer may contain smoke or pollen particles.
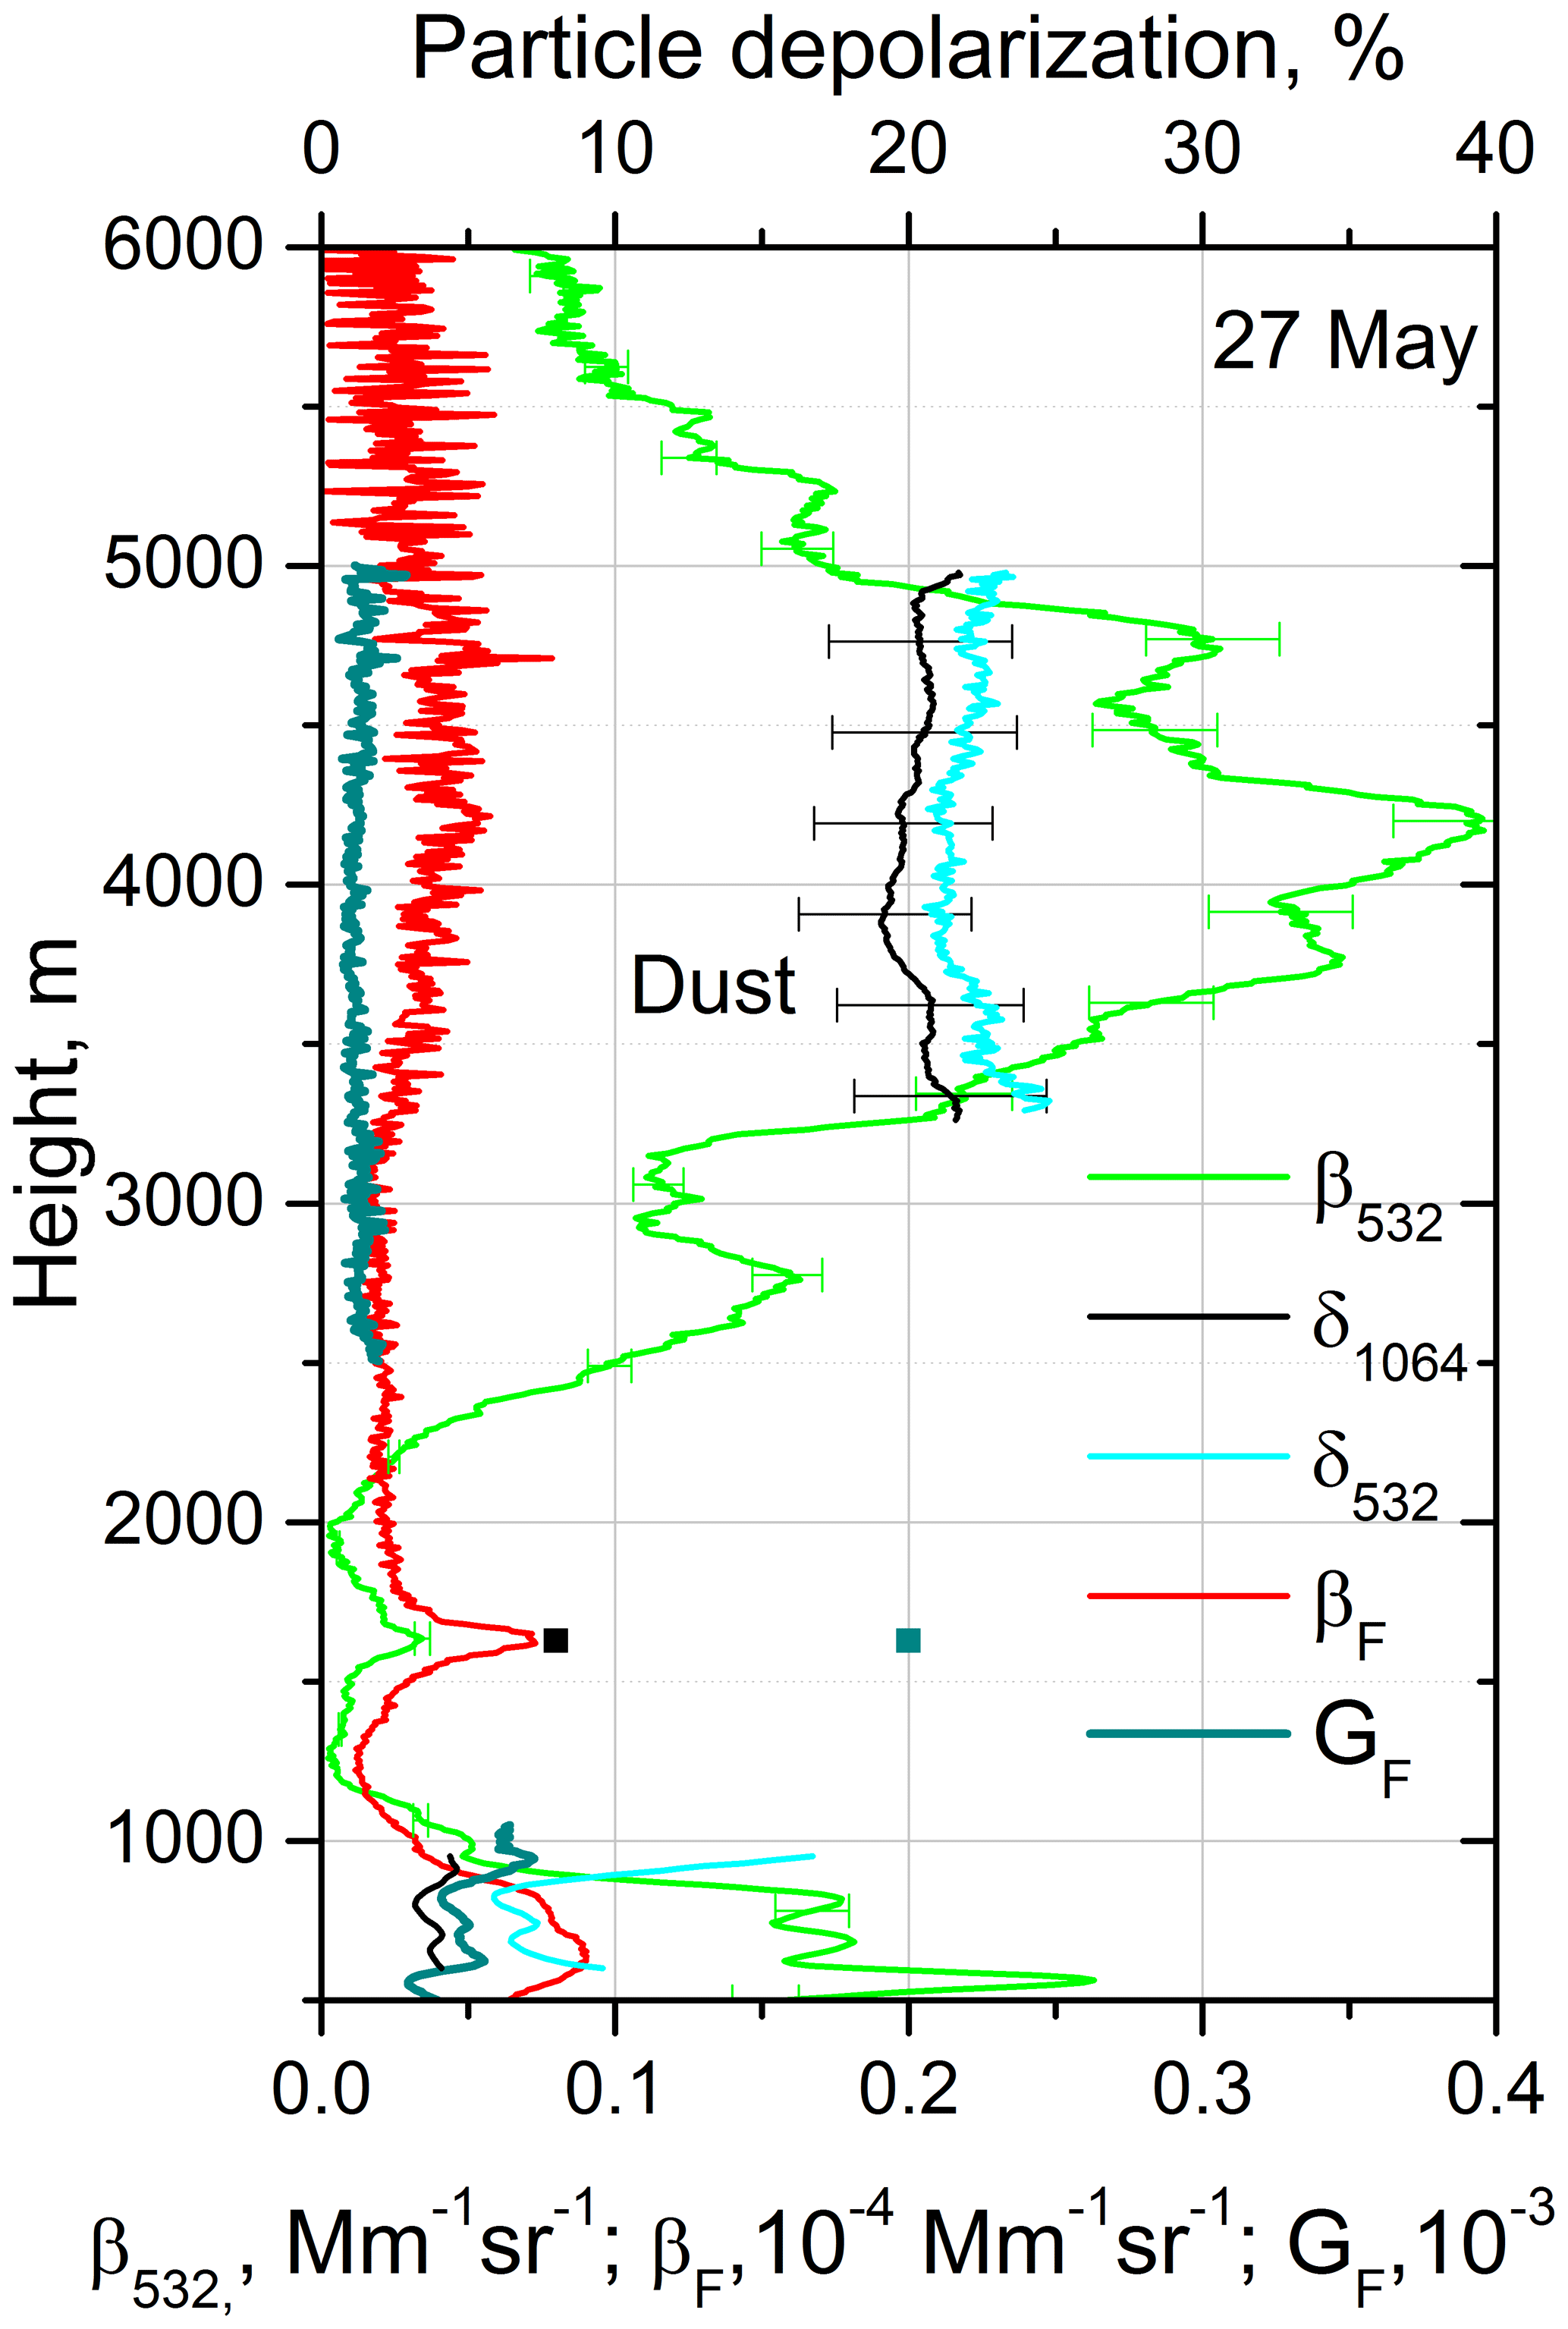
Figure 6Lidar measurements during a dust episode. Vertical profiles of particle β1064 and fluorescence βF backscattering coefficients, fluorescence capacity GF, and particle depolarization ratios δ1064 and δ532 on 27 May 2020 at 21:00–23:00 UTC.
3.5 Impact of particle hygroscopic growth
The vertical variation of observed aerosol properties may be a result of particle water uptake, which should be separated from the features related to pollen presence. Figure 7 shows the profiles of the particle parameters for the episode on 15 June 2020 when aerosol hygroscopic growth took place. In the height range 900–1500 m the fluorescence backscattering βF is stable, while the elastic backscattering β532 increases by a factor of 3. Radiosonde measurements in Herstmonceux (UK) in this height range demonstrate an increase in RH from about 75 % to 85 %, while lidar-measured extinction and backscattering Ångström exponents decrease from 1.5 to 1.3, corroborating the occurrence of particle hygroscopic growth. The depolarization ratio δ1064 at low altitudes exceeds δ355 and δ532, which can be an indication of pollen presence. This is supported by significant fluorescence capacity (GF = 0.9 × 10⁻⁴ at 750 m).
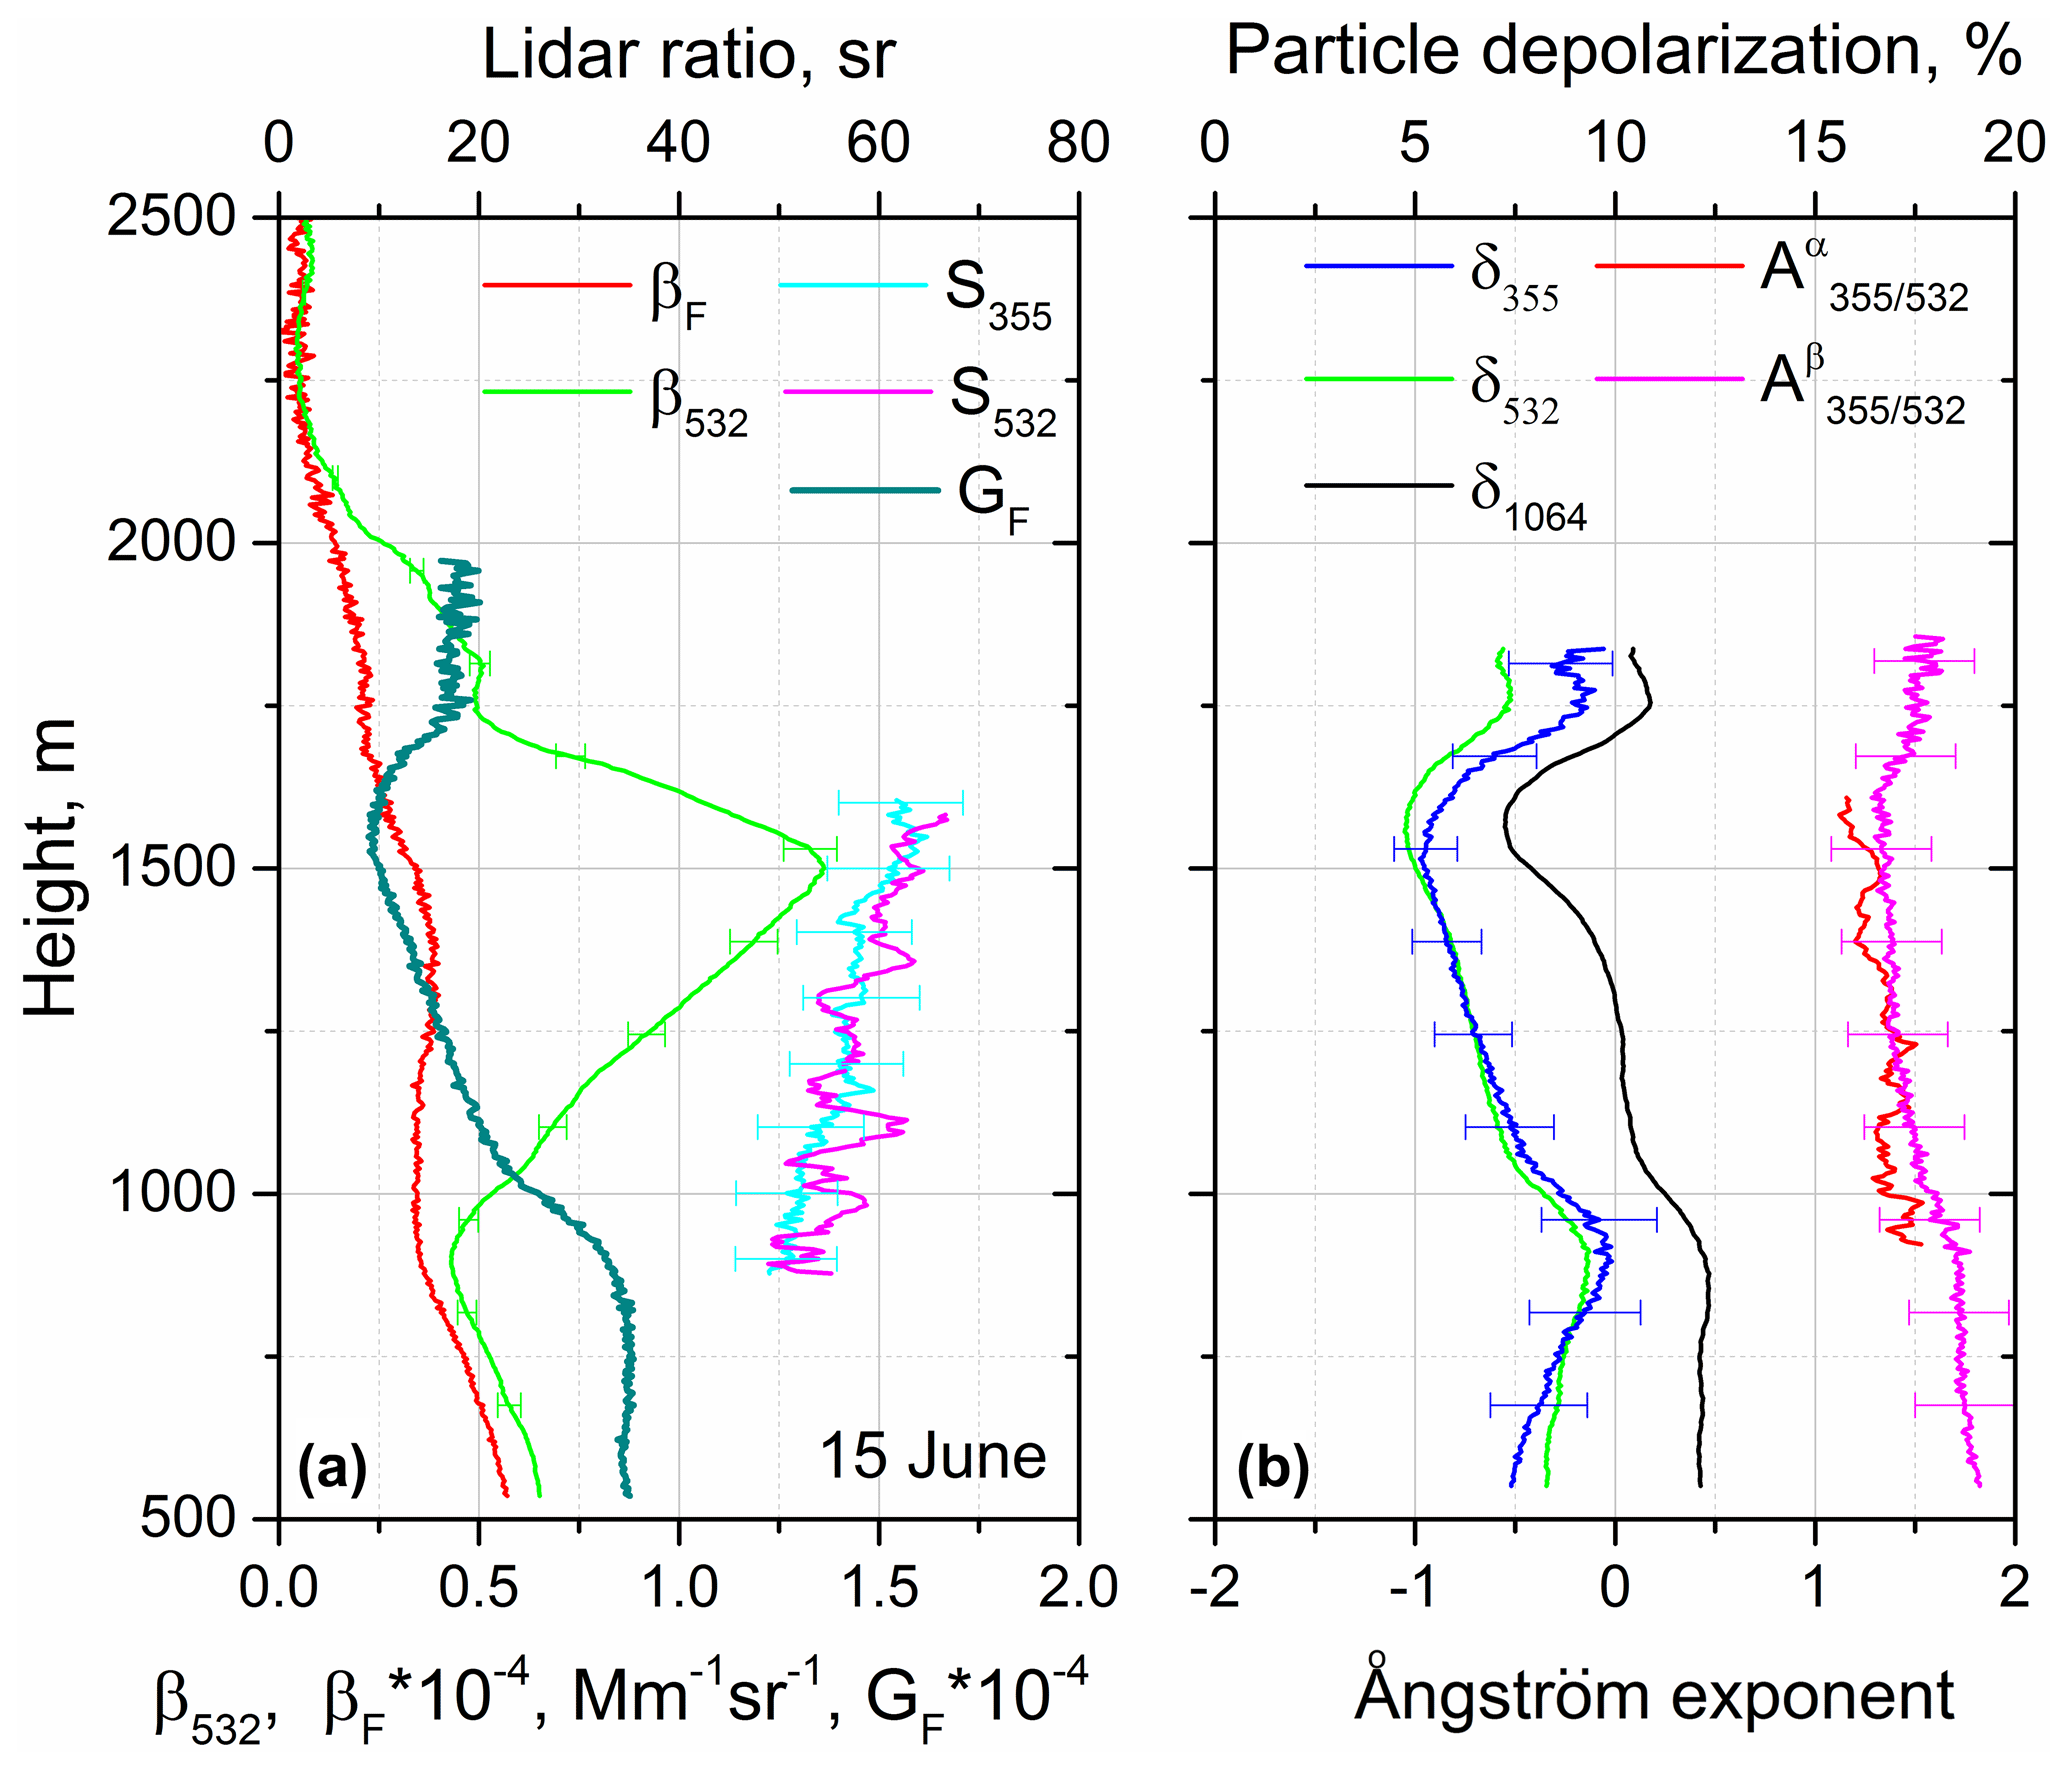
Figure 7Lidar measurements in the condition of aerosol hygroscopic growth in the 900–1500 m height range. Vertical profiles of (a) particle β532 and fluorescence βF backscattering coefficients, fluorescence capacity GF, lidar ratios S355 and S532, and (b) particle depolarization ratios δ355, δ532 and δ1064 together with extinction and backscattering Ångström exponents measured on 15 June 2020 at 22:00–24:00 UTC.
The number of fluorescent particles in the 900–1500 m range does not present significant changes (βF is stable), so observed vertical variations, i.e., the decrease in depolarization ratios at all three wavelengths and the increase in lidar ratios S355 and S532 from 50 to 65 sr, are probably the result of water uptake by the particles. Water uptake does not change the number of fluorescent molecules; however, the fluorescence capacity decreases in the process of hygroscopic growth, so GF can be a representative parameter of aerosol types only in the condition of low RH.
During March–June 2020, we had numerous measurement cases demonstrating features in the profiles of the particle parameters that can be attributed to pollen. For representative cases we have chosen observations with a high depolarization ratio and high fluorescence backscattering. At the same time, we omitted the days with high relative humidity to minimize the impact of hygroscopic growth effects. Below we consider several measurement cases representing different scenarios, in particular the episodes when pollen concentration decreases with height (30–31 May, 1–2 June) and the episodes when pollen grains are well mixed inside the boundary layer (27–28 March and 21 April).
4.1 30–31 May and 1–2 June 2020 observations
The results of lidar measurements during the campaign in many episodes can be interpreted as a decrease in the pollen concentration with height. Vertical profiles of the main particle parameters for two representative cases on the nights of 30–31 May and 1–2 June 2020 are shown in Fig. 8. The atmospheric conditions for these nights were stable, so the profiles presented are averaged over an approximately 5 h interval. The HYSPLIT back-trajectory analysis (Stein et al., 2015) demonstrates that in the 1000–2000 m height range the air masses were transported from northern Europe. At the ground level, grass could be the main pollen contributor for this period, as shown in Fig. 1. On 31 May (at 00:00 UTC) the RH measured by the radiosonde in Herstmonceux (UK) was about 40 % at 500 m, and it increased up to 70 % at 2000 m. On 2 June the RH increased from approximately 40 % to 60 % in the same height range. For both nights the fluorescence backscattering decreases with height, indicating a decrease in the concentration of fluorescent particles (presumably pollen). This decrease in βF correlates with a decrease in the depolarization ratio at all three wavelengths. Particle depolarization δ1064 is the highest (about 15 % at 750 m), while δ355 and δ532 are significantly lower. Such spectral dependence of the depolarization ratio can be partly due to the contribution of the background aerosol, as follows from the model calculation in Fig. 2. The lidar ratios are available above 1250 m, and for both cases, S355 and S532 increase with height. It indicates that the lidar ratios of pollen in the two considered cases can be quite low: below 40 sr at 355 nm and below 30 sr at 532 nm, considering that the pollen concentration decreases with height, which is inferred from the features of the depolarization ratio and fluorescence backscattering

Figure 8Vertical profiles of (a, d) particle backscattering coefficients β355, β532 and β1064 as well as lidar ratios S355 and S532. (b, e) Fluorescence backscattering coefficient βF, fluorescence capacity GF, pollen backscattering coefficient and its contribution to the total backscattering . (c, f) Particle depolarization ratios δ355, δ532 and δ1064 together with extinction and backscattering Ångström exponents on (a–c) 30–31 May 2020 at 21:00–02:00 UTC and on (d–f) 1–2 June 2020 at 21:00–02:30 UTC. Profiles of and were computed with the assumption that %. The depolarization ratios of the background aerosol are measured or assumed to be 3 % on 30 May and 5 % on 1 May.
The EAE for both nights varied in the 1.75–2.0 range and did not show significant changes with height. The BAE is lower (about 1.5 at 1000 m), and for both nights it shows some increase in the 1250–2250 m range. The BAE, in contrast to EAE, depends strongly on the particle refractive index and shape; thus, it may demonstrate higher sensitivity to the changes in aerosol mixture composition. Recall that backscattering and extinction Ångström exponents are related as
Thus, for S355>S532, which has been observed during pollen episodes, the is lower than . This is in contrast with smoke episodes in which S355<S532 and (Fig. 5).
If the depolarization ratios of pollen δp and background aerosol δb are known, the pollen backscattering coefficient βp can be calculated. Such an approach is widely used for the separation of contributions of dust and smoke particles (Sugimoto and Lee, 2006; Tesche et al., 2009), and the same technique was applied to separate pollen and background aerosol (Noh et al., 2013a; Sicard et al., 2016; Shang et al., 2020). For height-independent depolarization ratios of pollen and background aerosol the pollen backscattering coefficient can be calculated as suggested by Tesche et al. (2009):
Here β and δ are the backscattering coefficient and particle depolarization ratio of the mixture. The profiles of and the relative contribution are shown in Fig. 8b and e. Computations were performed assuming that height-independent %. For background aerosol, the values % for 30–31 May and % for 1–2 June were used. On 30–31 May the contribution of pollen at 750 m is estimated as 30 %.
The profiles of βF and in Fig. 8b and e behave similarly, decreasing with height. Above 2000 m the decrease in βF slows down due to the fluorescence of background aerosol. The profiles of the fluorescence capacity GF and relative contribution also demonstrate a good correlation. Thus, both the depolarization and fluorescence techniques lead to the same conclusion: pollen concentration in the boundary layer for the considered episodes decreases with height.
4.2 27–28 March and 21 April 2020 observations
According to the in situ pollen sampling at rooftop level, the maximal pollen content was detected during the birch pollination period on 4–20 April. However, the maximal fluorescence backscattering of lidar data was observed at the end of March when sampling shows an increase in ash (fraxinus) pollen emission. The temporal evolution of the range-corrected lidar signal, volume depolarization ratio at 1064 nm and fluorescence backscattering on the night of 27–28 March is shown in Fig. 9. The main part of the aerosol is localized below 2000 m. The back-trajectory analysis demonstrates that the air masses in this episode were transported from eastern Europe. In contrast with Fig. 8, where fluorescence decreases with height, on 27–28 March the fluorescent particles are rather well mixed inside the PBL (planetary boundary layer). The fluorescence backscattering is high, exceeding 2.5 × 10⁻⁴ Mm−1 sr−1, and the volume depolarization at 1064 nm is about 15 %. The vertical profiles of the particle parameters, averaged for the period 19:20–04:30 UTC, are shown in Fig. 10. In spite of temporal variations of the lidar signal and the fluorescence backscattering inside the PBL (Fig. 9), the averaged overnight profiles of particle parameters are representative. Radiosonde measurements (at both Beauvecchain and Herstmonceux sites) show that RH gradually increased with height from approximately 40 % to 70 % in the 500–1750 m range. The depolarization ratios δ532 and δ1064 inside the PBL are close, which is in contrast with results in Fig. 8, where δ1064 exceeds δ532. This difference can be due to the different types of pollen that were present, which is probably grass in Fig. 8 and birch in Fig. 10. Also, the BAE in Fig. 10 is lower than that in Fig. 8, which decreases the influence of background aerosol on the spectral dependence of the depolarization ratio, as follows from Fig. 2.
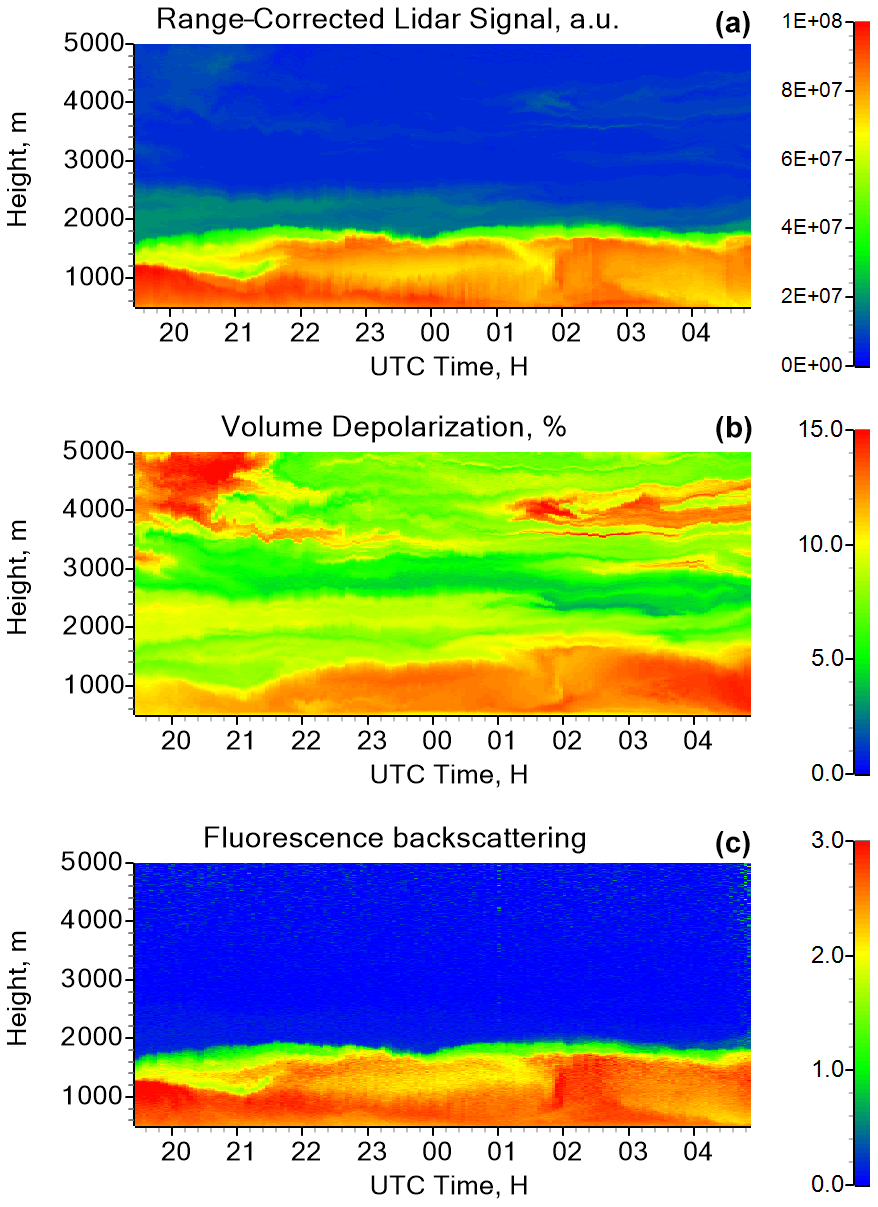
Figure 9Range-corrected lidar signal at 1064 nm (a), volume depolarization ratio at 1064 nm (b) and fluorescence backscattering coefficient (in 10−4 Mm−1 sr−1, c) measured on 27–28 March 2020.
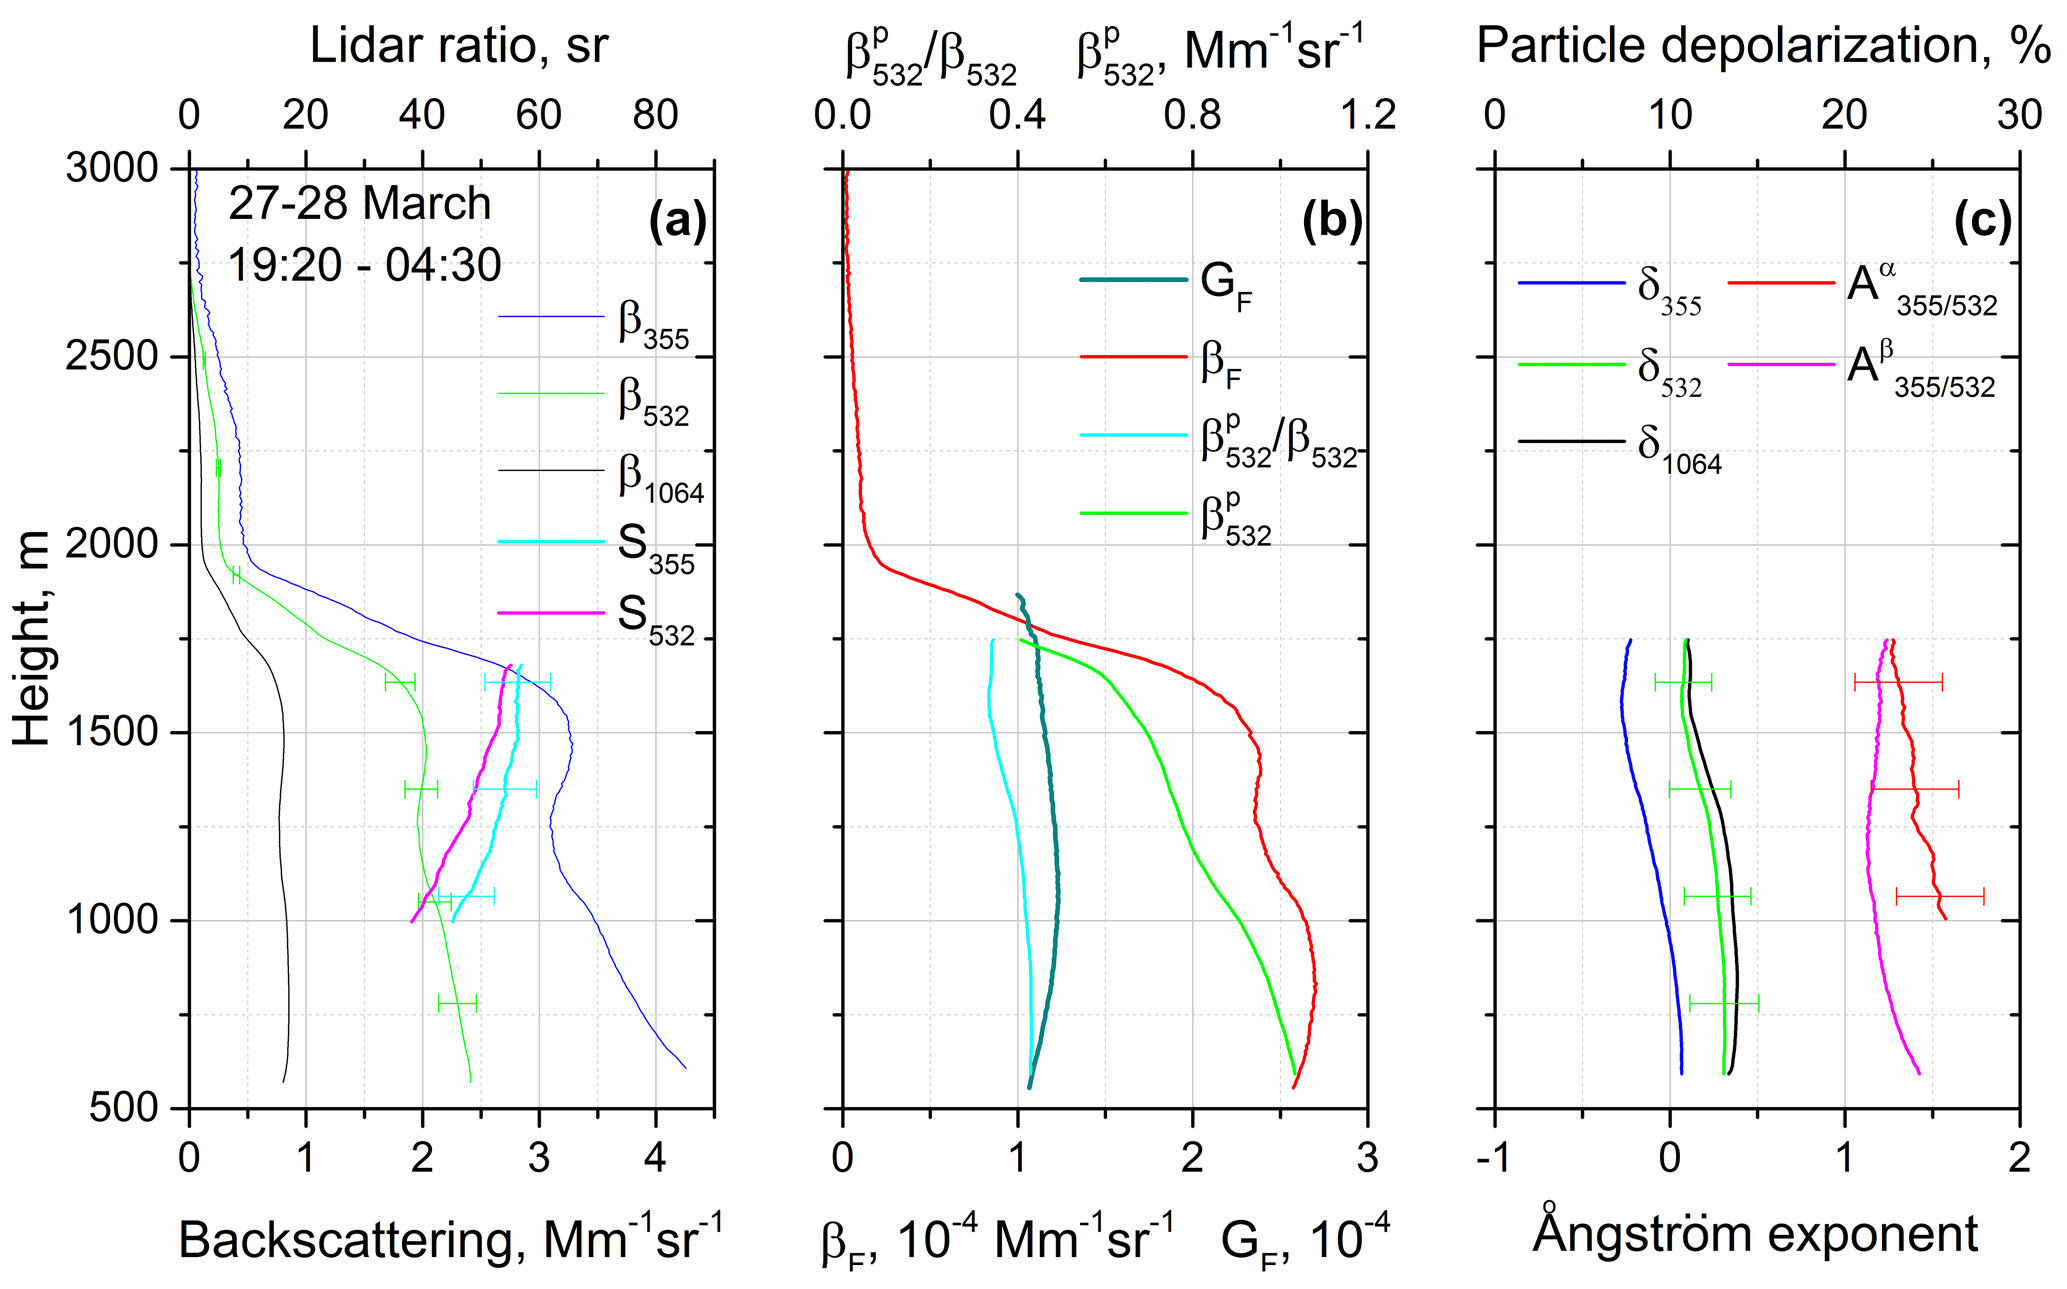
Figure 10Vertical profiles of (a) particle backscattering coefficients β355, β532 and β1064 as well as lidar ratios S355 and S532. (b) Fluorescence backscattering coefficient βF, fluorescence capacity GF, pollen backscattering coefficient and its contribution to the total backscattering . (c) Particle depolarization ratios δ355, δ532 and δ1064 together with extinction and backscattering Ångström exponents measured on 27–28 March 2020 at 19:20–04:30 UTC. Profiles of and were computed with the assumption that % and = 3 %.
Both the fluorescence backscattering and depolarization ratios do not demonstrate strong variations inside the 600–1500 m range. The maximum fluorescence capacity exceeds 1.2 × 10⁻⁴, which is significantly higher than GF for background aerosol in Fig. 3. The profiles of GF and behave reasonably similar, and the slight decrease in with height with respect to GF can be due to dependence of the depolarization ratio of pollen on RH.
Agreement between results obtained from the depolarization and fluorescence techniques in Figs. 8 and 10 corroborates the suggestion that the observed fluorescence is mainly due to the presence of pollen. However, in some episodes the particles with a high fluorescence cross section, other than pollen, could interfere. In particular, such interference occurred in the 20–23 April 2020 period. Figure 11 shows the vertical profiles of particle parameters measured on 21 April. The depolarization ratio δ1064 = 22 % at 750 m was one of the highest during campaign. The RH was low, increasing from 30 % to 45 % in the 800–1500 m range according to Herstmonceux radio sounding. The back-trajectory analysis demonstrates that below 1500 m the air masses are transported from Spain, while at 2000 m the transportation is from northern Europe.
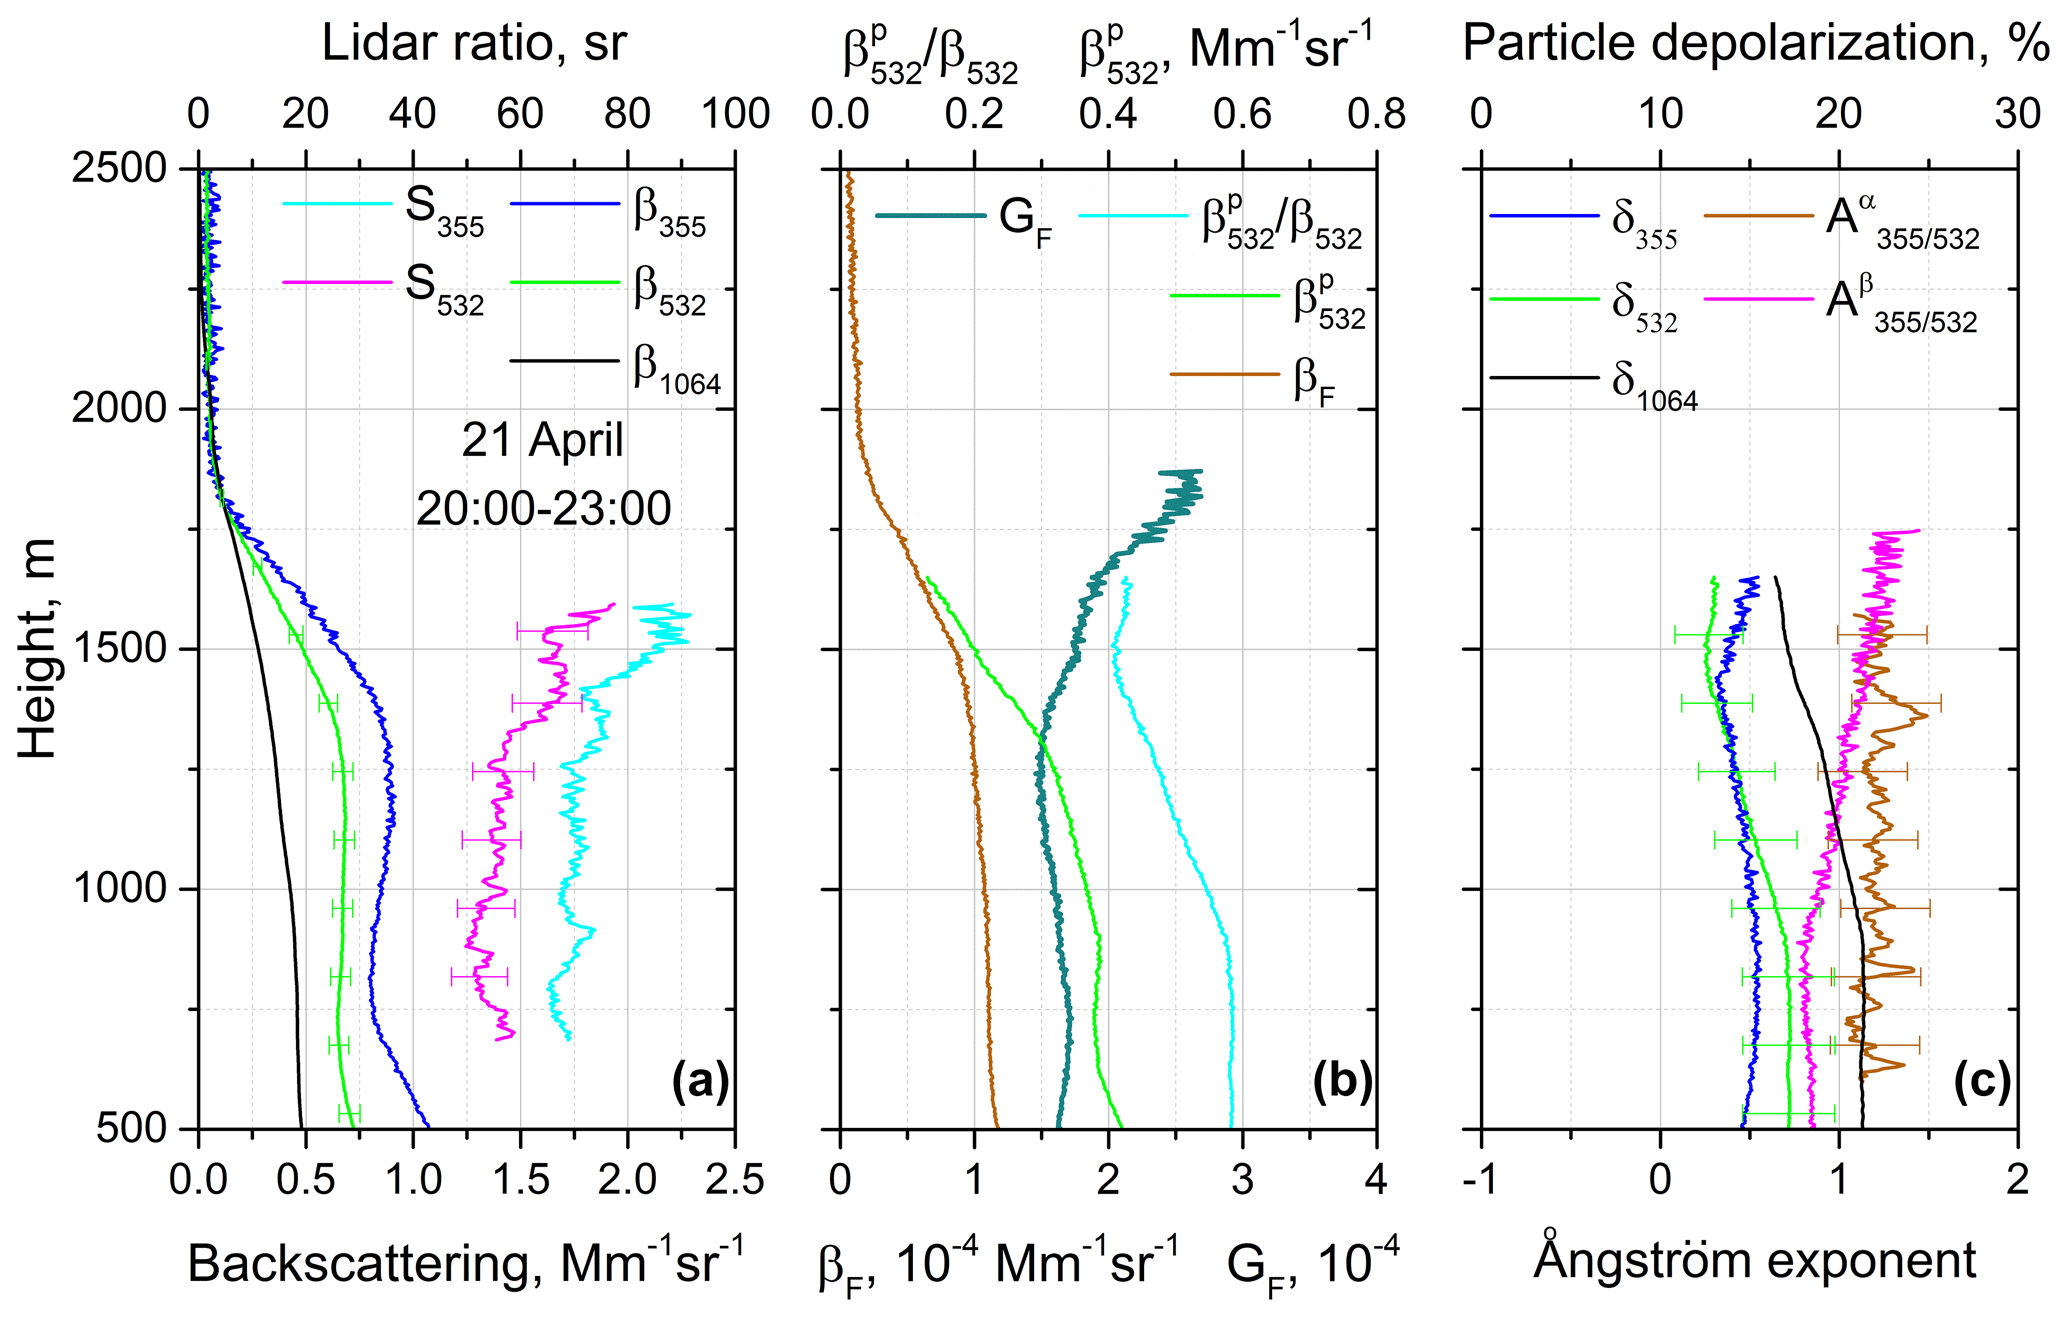
Figure 11The same particle parameters as in Fig. 10 for 21 April 2020, 20:00–23:00 UTC. Measurements were performed at 30∘ to the horizon.
Fluorescence backscattering is stable in the 500–1500 m range, and the fluorescence capacity at 1000 m is about 1.5 × 10⁻⁴, which is a typical value for pollen. However, above 1250 m GF starts to rise, reaching the value of 2.5 × 10⁻⁴ at 1750 m. Such high GF is more typical for smoke particles. The depolarization ratio δ355 is about 15 %, and this is higher than corresponding values shown in Figs. 8 and 10, which again may corroborate the presence of smoke particles. We should recall that smoke particles are small, so, in contrast to pollen, their presence influences δ355 more strongly than δ1064. Enhanced values of δ355 and GF were observed during the 20–23 April period, indicating the possible presence of biomass burning particles in the aerosol mixture.
4.3 Separation of pollen and smoke layers
During the campaign we observed narrow layers with strong fluorescence. Two examples of such observations, on the nights 13–14 April and 16–27 May 2020, are shown in Fig. 12. The white arrows in this figure point to the fluorescent layers. On 13 April, a weak aerosol layer (β532 ≈ 0.6 Mm−1 sr−1 for 23:00–00:00 UTC) is observed at the top of the PBL. This layer demonstrates volume depolarization ratios of about 10 % and high fluorescence backscattering. On 26–27 May a weak layer with high fluorescence backscattering occurs between 3 and 4 km. However, in contrast with the first case, it has a low depolarization ratio, so the layers may have a different nature. Figure 13 shows the vertical profiles of the particle parameters for these two cases. On 13–14 April the fluorescence backscattering below 1000 m is stable, while β532 rises, which can be the result of the particle water uptake. Above 1000 m, the depolarization ratio δ1064 increases up to 8 %. Results in Fig. 13a are averaged over the 21:15–00:40 UTC temporal interval, but peak values of δ1064 between 23:00 and 00:00 UTC exceeded 12 %. Fluorescence backscattering increases simultaneously with the depolarization. The aerosol backscattering coefficient of the fluorescent layer is too low for a reliable calculation of δ355 and δ532, so only the profile of δ1064 is provided.
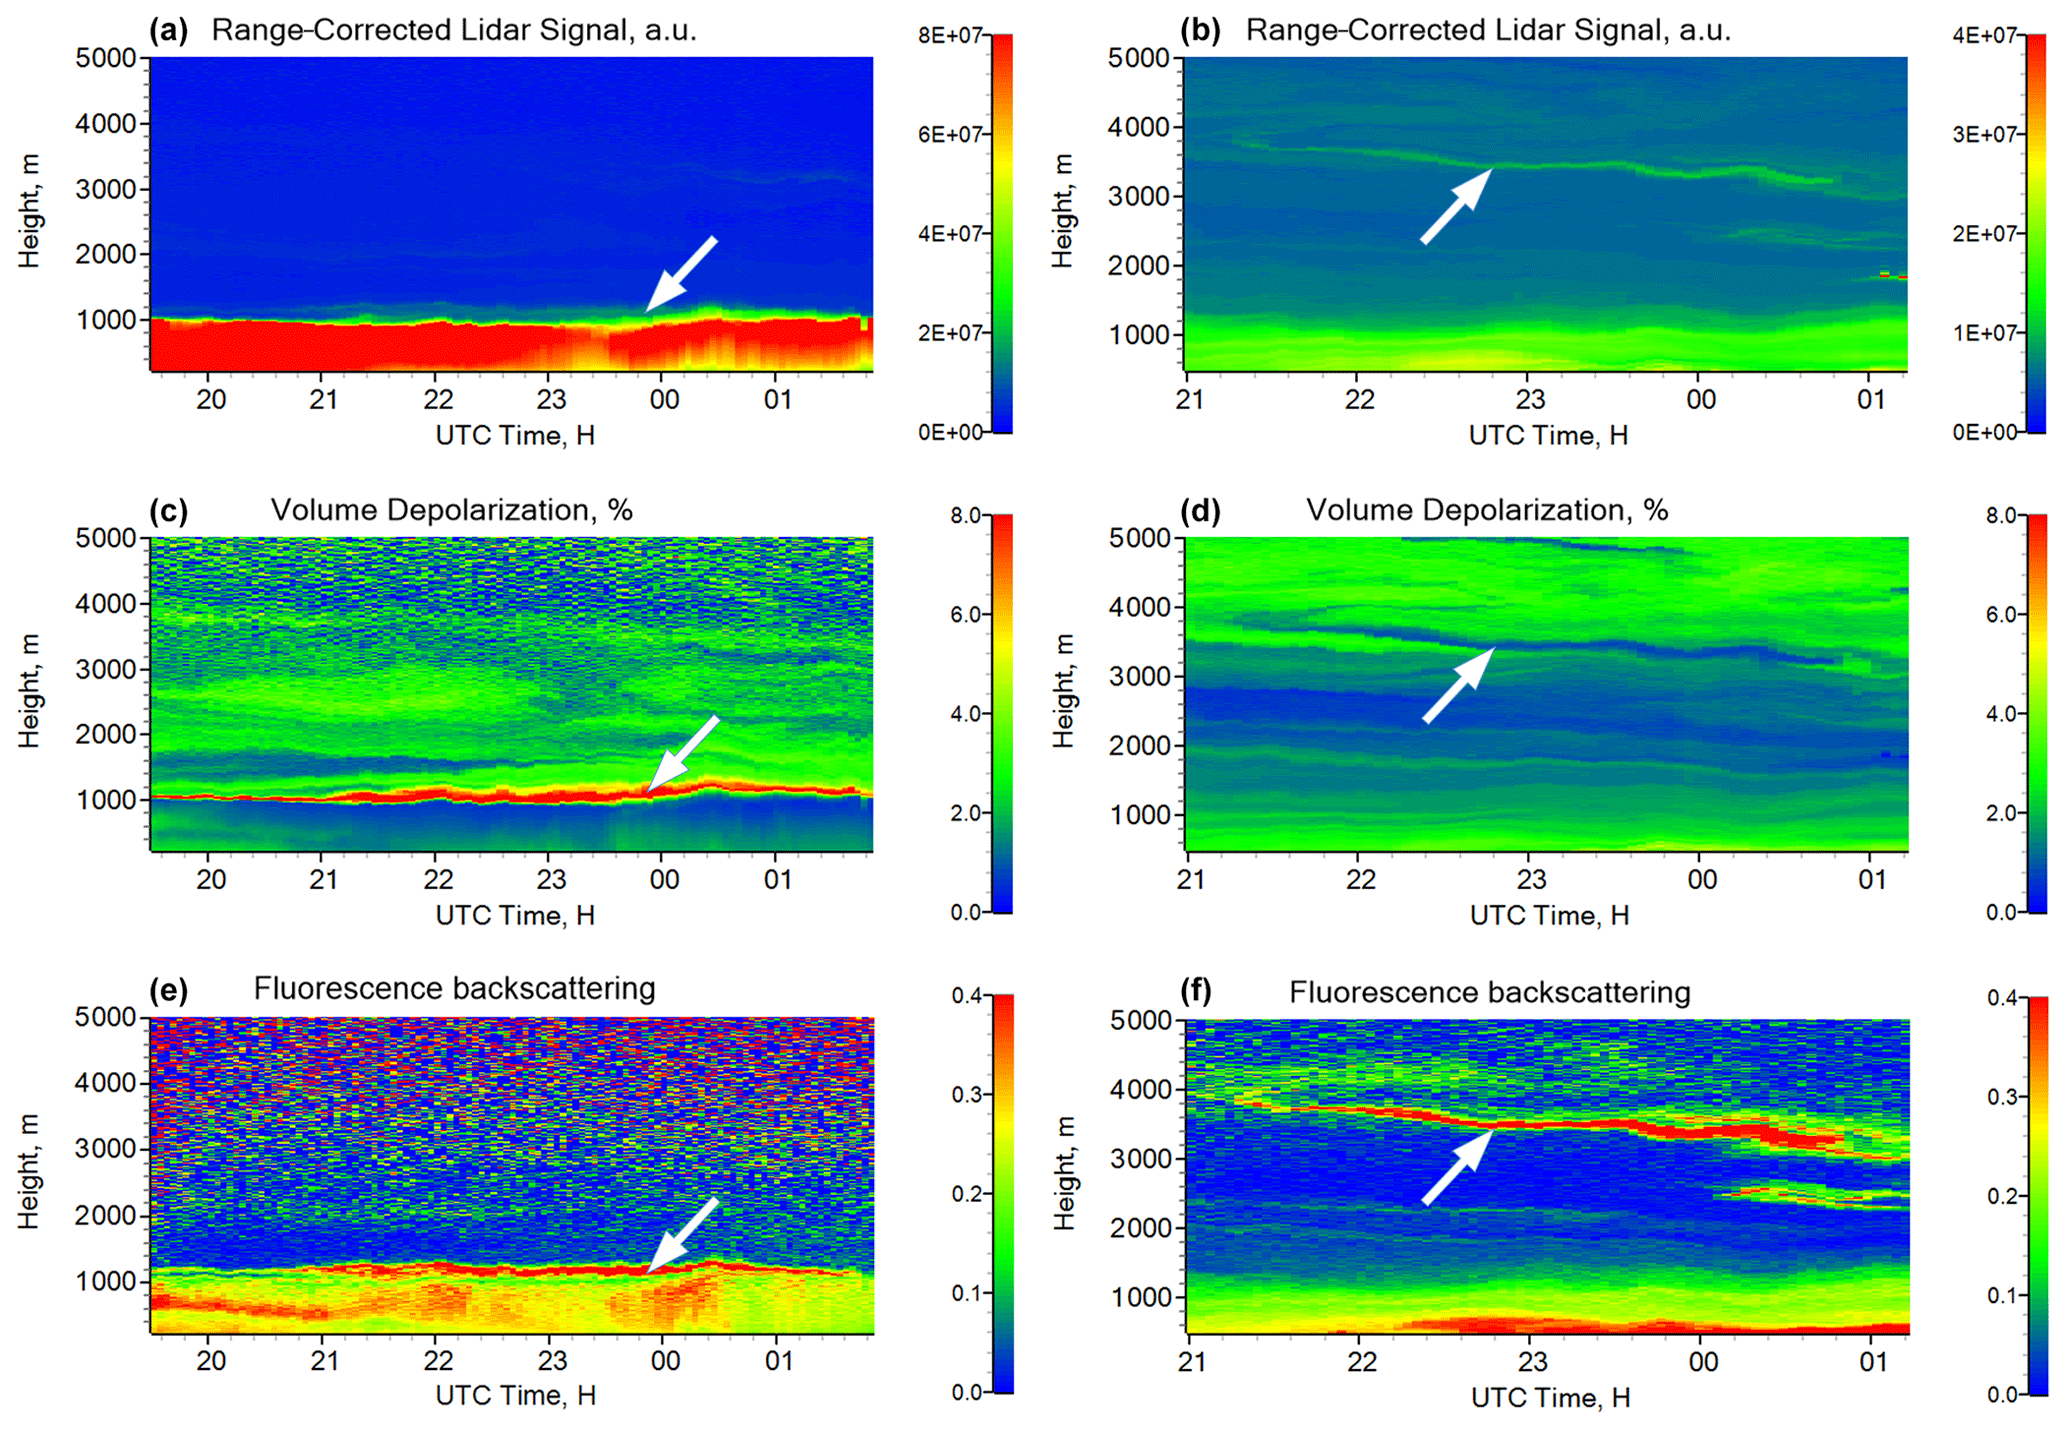
Figure 12Range-corrected lidar signal at 1064 nm, volume depolarization ratio and fluorescence backscattering coefficient (in 10−4 Mm−1 sr−1) measured on 13–14 April (a, c, e) and 26–27 May 2020 (b, d, f). Arrows point to the fluorescent layers.
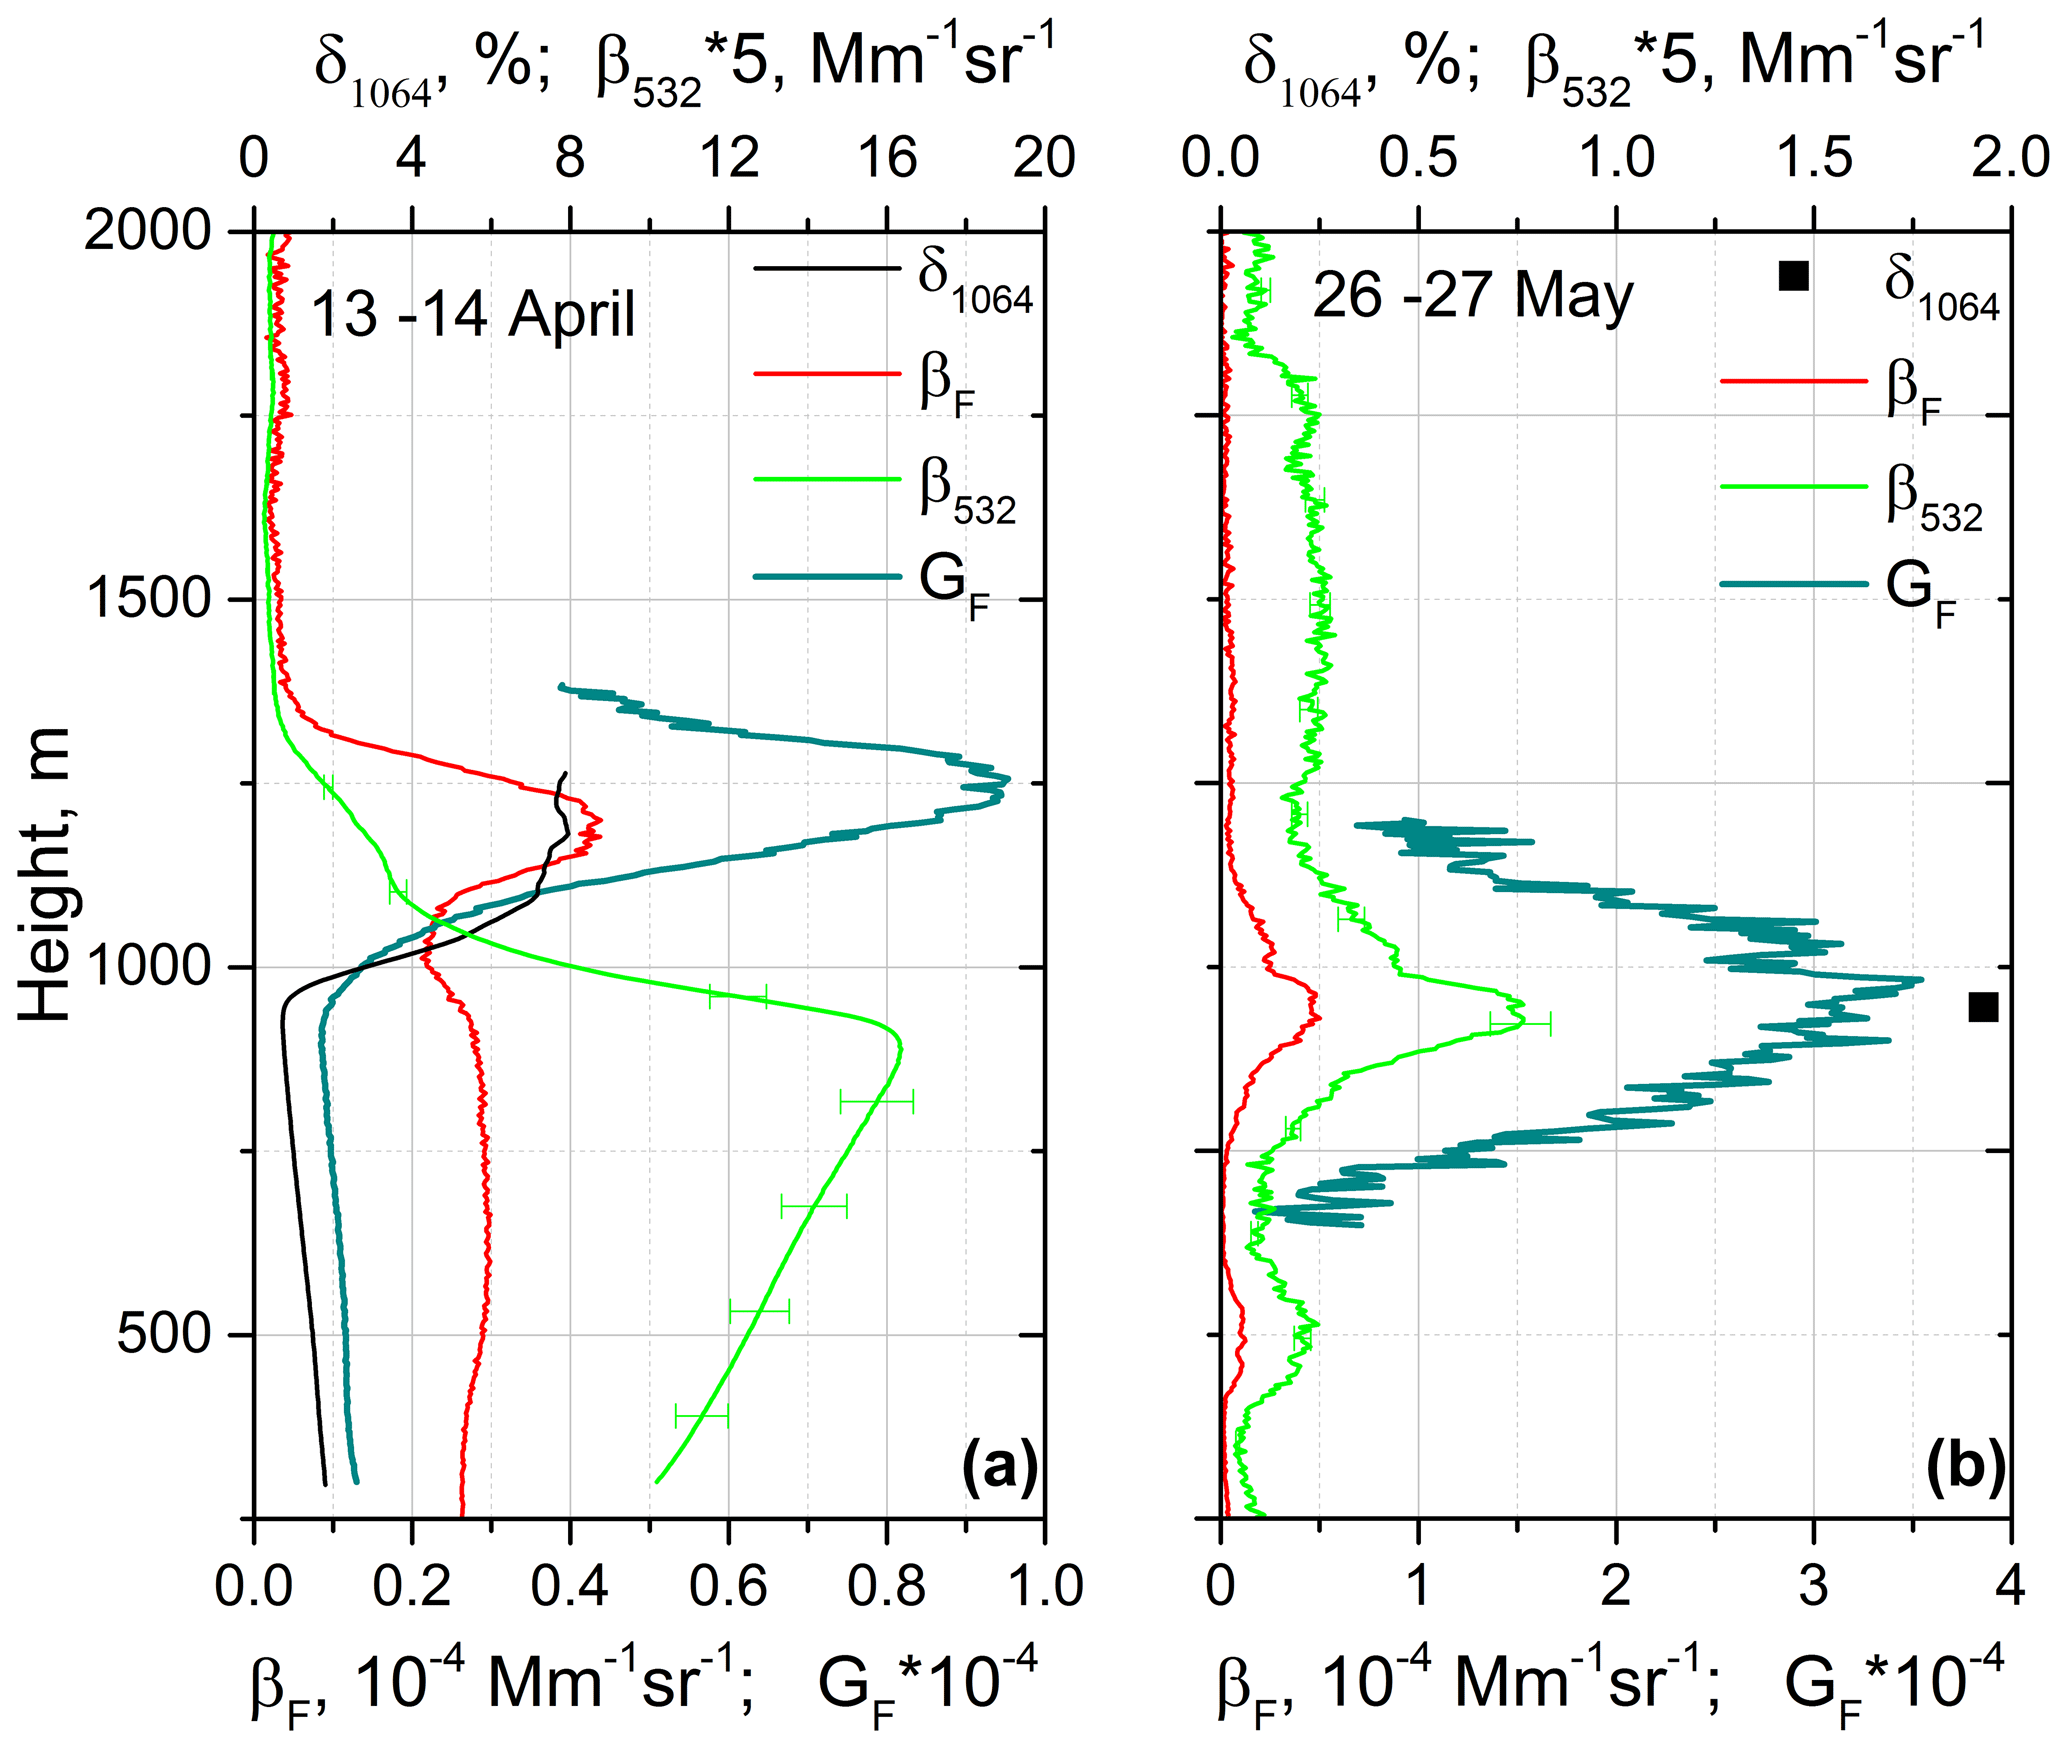
Figure 13Vertical profiles of elastic β532 and fluorescence βF backscattering coefficients, fluorescence capacity GF, and particle depolarization ratio δ1064 measured on (a) 13–14 April at 21:00–01:00 UTC and (b) 26–27 May 2020 at 23:30–00:40 UTC. Values of β532 are multiplied by a factor of 5.
On 26–27 May the backscattering coefficient of the fluorescent layer at 3400 m is lower than in Fig. 13a (β532 ≈ 0.14 Mm−1sr−1), so the depolarization ratio δ1064 can be calculated only in the center of the layer and is about 2 %, which is significantly lower than that on 13–14 April. However, the fluorescence capacity on 26–27 May is up to 3.5 × 10⁻⁴, which is typical for smoke. Thus, we can conclude that the fluorescent layer on 26–27 May contains smoke particles due to high GF and low δ1064. On 13–14 April, the fluorescence capacity is significantly lower (about 0.9 × 10⁻⁴) and the depolarization ratio δ1064 exceeds 10 %, which is more typical for pollen. Due to low backscattering coefficients of the fluorescent layers in Fig. 12, we are not able to provide a complete set of intensive parameters, such as Ångström exponents and particle depolarization ratios at three wavelengths. However, based on the obtained fluorescence capacities and δ1064 values, we conclude that the fluorescent layers probably contain pollen grains in Fig. 12a and smoke particles in Fig. 12b.
4.4 Aerosol classification based on polarization and fluorescence measurements
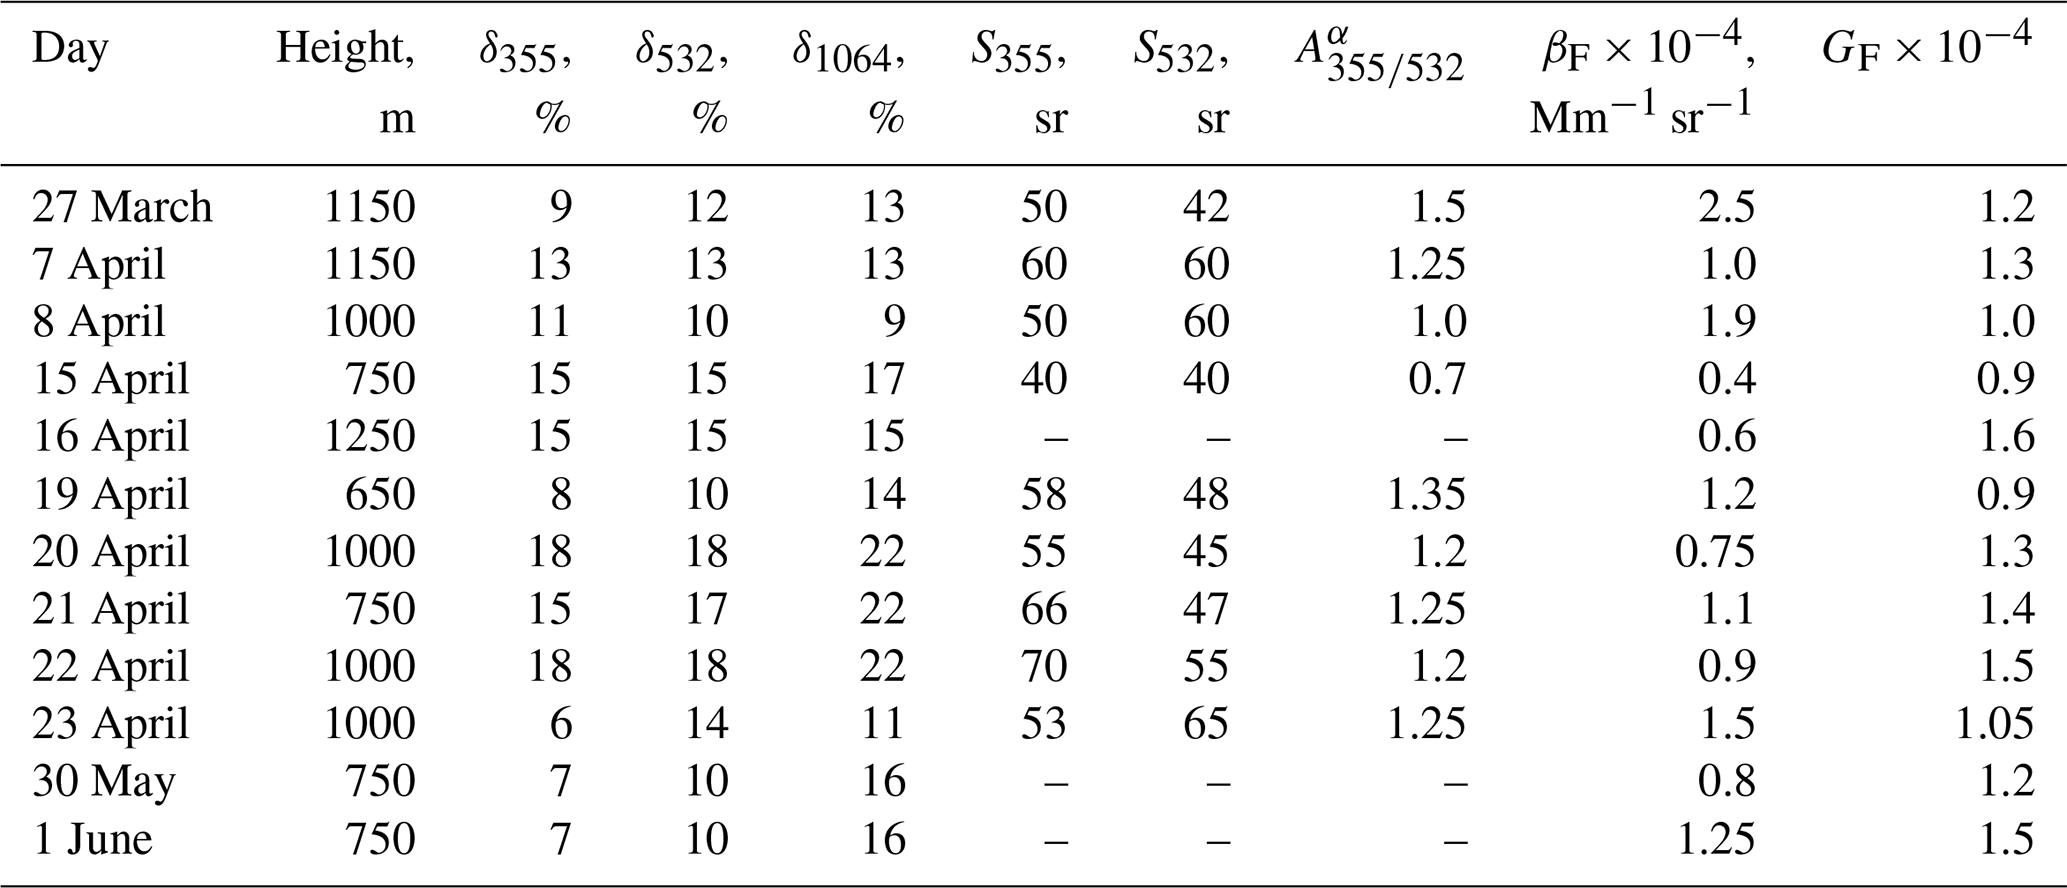
Table 1 summarizes the results in the campaign, showing the aerosol parameters (particle depolarization and lidar ratios, extinction Ångström exponent, fluorescence backscattering, and capacity) for several days in the March–June 2020 observation period when the contribution of pollen to the total particle backscattering was significant. All available night observations were averaged, and results are given for heights with the highest particle depolarization. Lidar ratios varied approximately in the 40–70 sr range, wherein S355 is normally greater than S532. It must be emphasized that pollen lidar ratios may differ for different taxa and that the observed lidar ratios are not attributed to pure pollen but to the aerosol–pollen mixture, so the values provided are influenced by the properties of background aerosol. Moreover, the shape of pollen grains depends on RH (Heidemarie et al., 2018), which may also lead to the variation of pollen lidar ratios. In most of the cases, the depolarization ratio presents strong spectral dependence and increases with wavelength. This spectral dependence is probably the result of mixing of strongly depolarizing pollen grains with fine background aerosol. The maximal value of observed fluorescence capacity of the pollen–aerosol mixture is 1.6 × 10⁻⁴, which is significantly higher than that of background aerosol but lower than the fluorescence capacity of smoke.
Table 1Lidar-measured aerosol parameters, such as particle depolarization ratios (δ355, δ532, δ1064), lidar ratios (S355,S532), extinction Ångström exponent (), fluorescence backscattering coefficient (βF) and fluorescence capacity (GF), for several days during the March–June 2020 period when the contribution of pollen to the total particle backscattering could be significant.
The simultaneous observations of depolarization ratio and fluorescence capacity for different types of aerosol are summarized in Fig. 14. Particle depolarization δ532 is plotted versus GF. The diagram allows for the separation of four types of the particles: (i) dust particles – high δ532 and low GF; (ii) pollen – high δ532 and high GF; (iii) smoke – low δ532 and high GF; and (iv) background aerosol (continental type) – low δ532 and low GF. Points corresponding to the pollen mixture provide an extended pattern because parameters depend on the concentration of pollen in the aerosol mixture. The dust measurements are also scattered because dust over the instrumentation site is transported long-range and mixed with local aerosol. Minimum GF for dust is about 0.1 × 10⁻⁴, while for smoke maximal GF is about a factor of 50 higher. The fluorescence capacity depends on the relative humidity, so strong scattering of measurement points can also be partly due to RH variations. Maximal values of GF for pollen mixture were about 1.5 × 10⁻⁴, and the corresponding depolarization ratios δ532 are about 18 %. Thus, assuming that the depolarization ratio of pure pollen is 30 %, we can expect GF for pure pollen to be about 2.5 × 10⁻⁴, which is comparable with values for smoke.
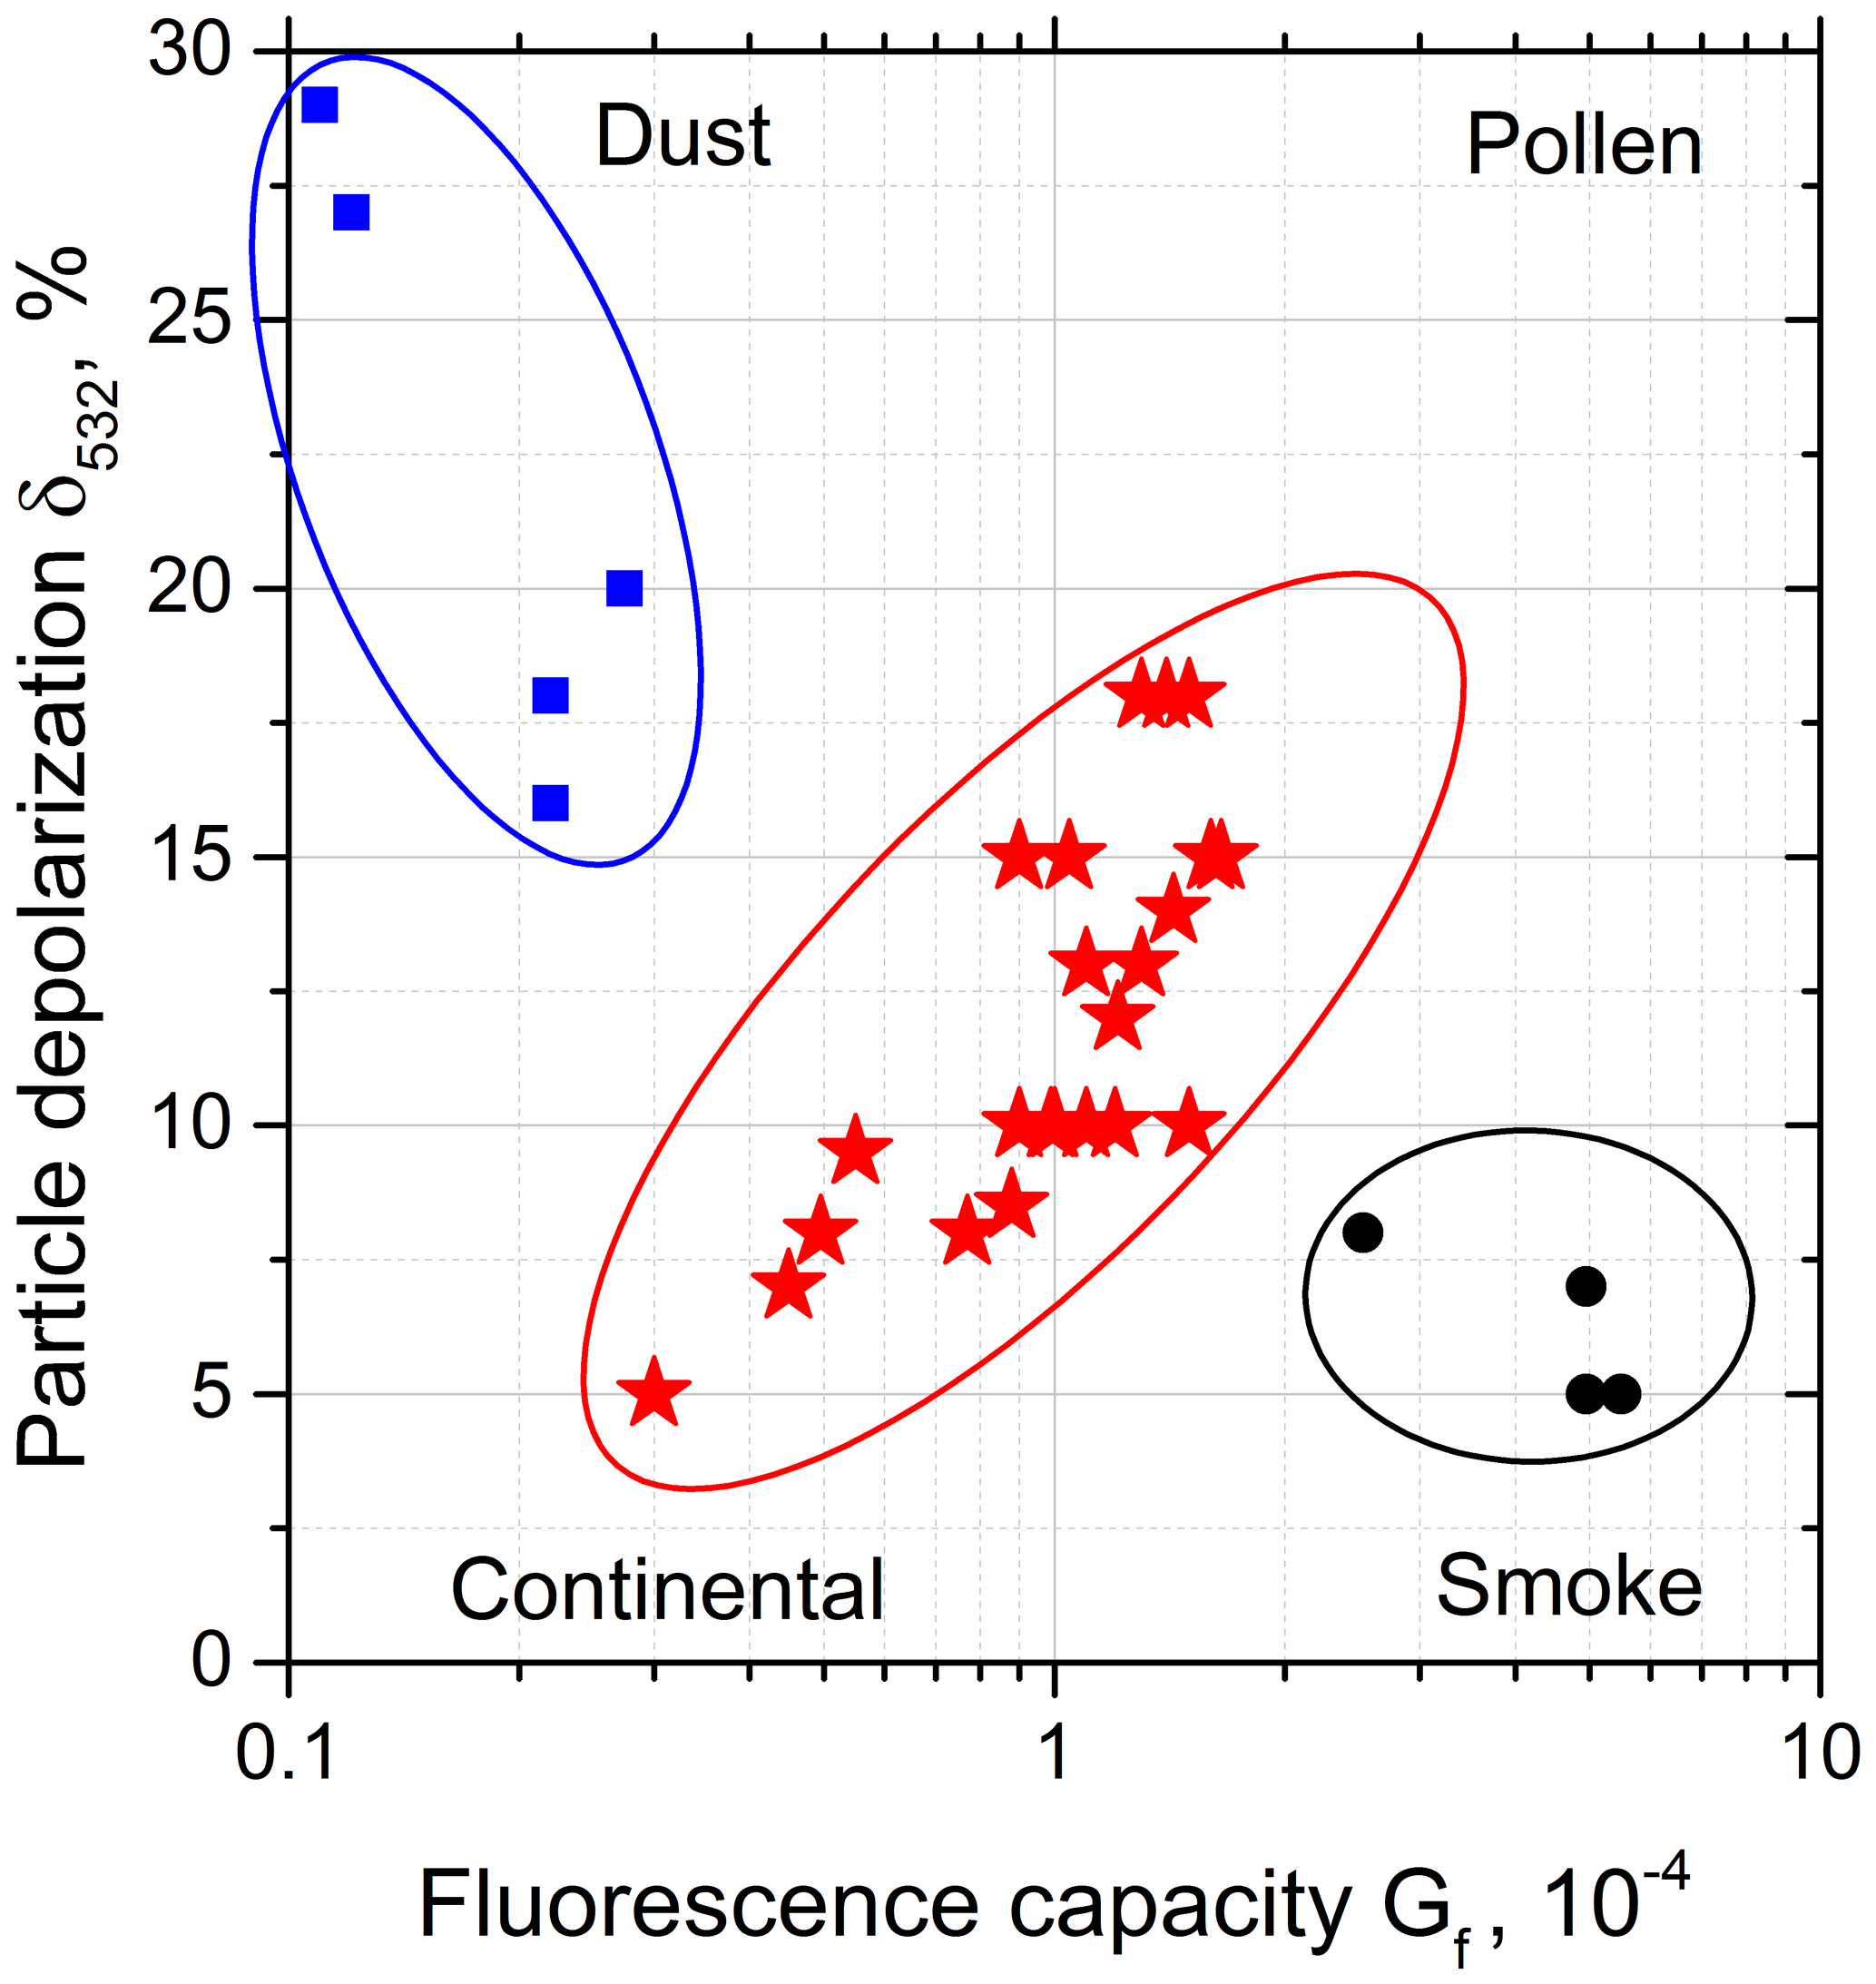
Figure 14Particle depolarization δ532 versus fluorescence capacity GF. This diagram allows for the identification of dust (blue), smoke particles (black) and aerosol mixtures containing pollen (red).
We analyzed the measurements from a multiwavelength Mie–Raman–fluorescence lidar during March–June 2020 in the north of France to reveal the features that can be attributed to pollen grains. The lidar system allowed us to measure depolarization ratios at three wavelengths simultaneously with the fluorescence backscattering at 466 nm. In numerous episodes during the campaign, high values of the particle depolarization ratio at 1064 nm, exceeding 15 %, were observed. Moreover, the depolarization ratio had strong spectral dependence, being the highest at 1064 nm and lowest at 355 nm, which is expected for big particles of irregular shape mixed with fine, low-depolarizing background aerosol. The increase in particle depolarization correlated with enhancement of the fluorescence backscattering, corroborating the fact that in these episodes we observed aerosol mixtures containing pollen.
The lidar ratios of aerosol–pollen mixtures observed during the campaign varied in a wide range. At low altitudes, where particles presented strong depolarization and fluorescence, in many cases we observed lidar ratios below 40 sr at both wavelengths. However, we also had cases when the lidar ratios at both wavelengths were in the 50–60 sr range. Thus, at the moment we are not able to specify lidar ratios for pure pollen, and additional measurement campaigns in locations with high pollen content are strongly desirable.
Obtained results demonstrate that simultaneous measurements of particle depolarization and fluorescence allows for the separation of dust, smoke particles and pollen grains. Moreover, the fluorescence measurements provide additional information that can be used in aerosol classification schemes. However, further studies are needed to make this technique applicable for quantitative pollen characterization. In the data analysis it is important to account for the process of water uptake by the particles because hygroscopic growth increases the backscattering of background aerosol and influences the pollen grain shape. In the presented lidar configuration, the water vapor channel was absent and radiosonde RH data were not collocated with lidar, which prevented us from performing a quantitative analysis of the hygroscopic effects. Since December 2020, we have recovered the water vapor channel in an upgraded configuration of the lidar. Moreover, we added one more fluorescence channel centered at 549 nm, which will be used in the next pollen campaign in 2021. This additional channel should improve the discrimination of pollen from other aerosols. In the coming campaign we will try to correlate our results with pollen concentrations at different locations in Europe by using a transport model, e.g., SILAM (System for Integrated modeLling of Atmospheric coMposition) (Sofiev et al., 2015). The use of this model should help in the identification of pollen type in our observations.
Lidar measurements are available upon request (philippe.goloub@univ-lille.fr).
IV processed the data and wrote the paper. QH and TP performed the measurements. PG supervised the project and helped with paper preparation. MC and NV performed in situ pollen analysis, and MK developed software for data processing.
The authors declare that they have no conflict of interest.
Publisher's note: Copernicus Publications remains neutral with regard to jurisdictional claims in published maps and institutional affiliations.
The Réseau National de Surveillance Aérobiologique (RNSA) and the Association pour la Prévention de la Pollution Atmosphérique (APPA) are gratefully acknowledged for providing Hirst-collected pollen grain identification and for assistance with the pollen data handling. Development of lidar retrieval algorithms was supported by the Russian Science Foundation (projects 16-17-10241 and 21-17-00114).
This research has been supported by the Agence Nationale de la Recherche through the PIA under contract R-LABEX0-20-007-CAPPA, the “Hauts de France” Regional Council and the European Regional Development Fund (FEDER).
This paper was edited by Daniel Perez-Ramirez and reviewed by three anonymous referees.
Ansmann, A., Riebesell, M., Wandinger, U., Weitkamp, C., Voss, E., Lahmann, W., and Michaelis, W.: Combined Raman elastic-backscatter lidar for vertical profiling of moisture, aerosols extinction, backscatter, and lidar ratio, Appl. Phys. B, 55, 18–28, 1992.
Bohlmann, S., Shang, X., Giannakaki, E., Filioglou, M., Saarto, A., Romakkaniemi, S., and Komppula, M.: Detection and characterization of birch pollen in the atmosphere using a multiwavelength Raman polarization lidar and Hirst-type pollen sampler in Finland, Atmos. Chem. Phys., 19, 14559–14569, https://doi.org/10.5194/acp-19-14559-2019, 2019.
Bohlmann, S., Shang, X., Vakkari, V., Giannakaki, E., Leskinen, A., Lehtinen, K. E. J., Pätsi, S., and Komppula, M.: Lidar depolarization ratio of atmospheric pollen at multiple wavelengths, Atmos. Chem. Phys., 21, 7083–7097, https://doi.org/10.5194/acp-21-7083-2021, 2021.
Cao, X., Roy, G., and Bernier, R.: Lidar polarization discrimination of bioaerosols, Opt. Eng., 49, 116201, https://doi.org/10.1117/1.3505877, 2010.
D'Amato, P. G., Bergmann, K.C., Cecchi, L., Annesi-Maesano, I., Sanduzzi, A., Liccardi, G., Vitale, C., Stanziola, A., and D'Amato, M.: Climate change and air pollution: Effects on pollen allergy and other allergic respiratory diseases, Allergo J., 23, 32–38, https://doi.org/10.1007/s15007-014-0484-1, 2014.
Diehl, K., Quick, C., Matthias-Maser, S., Mitra, S., and Jaenicke, R.: The ice nucleating ability of pollen: Part I: Laboratory studies in deposition and condensation freezing modes, Atmos. Res., 58, 75–87, https://doi.org/10.1088/1748-9326/5/4/044015, 2001.
Frenguelli, G.: Pollen structure and morphology, Advances in Dermatology and Allergology, 20, 200–204, 2003.
Freudenthaler,V., Esselborn, M., Wiegner, M.,Heese, B., Tesche, M., and co-authors: Depolarization ratio profiling at severalwavelengths in pure Saharan dust during SAMUM 2006, Tellus, 61B, 165–179, 2009.
Fröhlich-Nowoisky, J., Kampf, C. J., K., Weber, B., Huffman, J. A., Pöhlker, C., Andreae, M. O., Lang-Yona, N., Burrows, S. M., Gunthe, S. S., Elbert, W., Su, H., Hoor, P., Thines, E., Hoffmann, T., Després, V. R., and Pöschl, U.: Bioaerosols in the Earth system: Climate, health, and ecosystem interactions, Atmos. Res., 182, 346–76, https://doi.org/10.1016/j.atmosres.2016.07.018, 2016.
Griffiths, P. T., Borlace, J.-S., Gallimore, P. J., Kalberer, M., Herzog, M., and Pope, F. D.: Hygroscopic growth and cloud activation of pollen: a laboratory and modelling study, Atmos. Sci. Lett., 13, 289–295, https://doi.org/10.1002/asl.397, 2012.
Haarig, M., Ansmann, A., Baars, H., Jimenez, C., Veselovskii, I., Engelmann, R., and Althausen, D.: Depolarization and lidar ratios at 355, 532, and 1064 nm and microphysical properties of aged tropospheric and stratospheric Canadian wildfire smoke, Atmos. Chem. Phys., 18, 11847–11861, https://doi.org/10.5194/acp-18-11847-2018, 2018.
Halbritter, H., Ulrich, S., Grímsson, F., Weber, M., Zetter, R., Hesse, M., Buchner, R., Svojtka, M., and Frosch-Radivo, A.: Illustrated Pollen Terminology, 2nd edn., Springer International Publishing, available at: http://www.springer.com/gp/book/9783319713649 (last access: 30 June 2021), 2018.
Hu, Q., Goloub, P., Veselovskii, I., Bravo-Aranda, J.-A., Popovici, I. E., Podvin, T., Haeffelin, M., Lopatin, A., Dubovik, O., Pietras, C., Huang, X., Torres, B., and Chen, C.: Long-range-transported Canadian smoke plumes in the lower stratosphere over northern France, Atmos. Chem. Phys., 19, 1173–1193, https://doi.org/10.5194/acp-19-1173-2019, 2019.
Immler, F., Engelbart, D., and Schrems, O.: Fluorescence from atmospheric aerosol detected by a lidar indicates biogenic particles in the lowermost stratosphere, Atmos. Chem. Phys., 5, 345–355, https://doi.org/10.5194/acp-5-345-2005, 2005.
Katifori, E., Alben, S., Cerda, E., Nelson, D. R., and Dumais, J.: Foldable structures and the natural design of pollen grains, P. Natl. Acad. Sci. USA, 107, 7635–7639, https://doi.org/10.1073/pnas.0911223107, 2010.
Klett, J. D.: Lidar inversion with variable backscatter/extinction ratios, Appl. Opt., 24, 1638–1643, 1985.
Lake, I. R., Jones, N. R., Agnew, M., Goodess, C. M., Giorgi, F., Hamaoui-Laguel, L., Semenov, M. A., Solomon, F., Storkey, J., Vautard, R., and Epstein, M. M.: Climate Change and Future Pollen Allergy in Europe, Environ. Health Perspect., 125, 385–391, https://doi.org/10.1289/EHP173, 2017.
Li, B., Chen, S., Zhang, Y., Chen, H., and Guo, P.: Fluorescent aerosol observation in the lower atmosphere with an integrated fluorescence-Mie lidar, J. Quant. Spectr. Rad. Transf., 227, 211–218, 2019.
Mack, S. M., Madl, A. K., and Pinkerton, K. E.: Respiratory health effects of exposure to ambient particulate matter and bioaerosols, Compr. Physiol., 10, 1–20, https://doi.org/10.1002/cphy.c180040, 2020.
Miyakawa, T., Kanaya, Y., Taketani, F., Tabaru, M., Sugimoto, N., Ozawa, Y., and Takegawa, N.: Ground-based measurement of fluorescent aerosol particles in Tokyo in the spring of 2013: potential impacts of nonbiological materials on autofluorescence measurements of airborne particles, J. Geophys. Res.-Atmos., 120, 1171–1185, https://doi.org/10.1002/2014JD022189, 2015.
Müller, D., Mattis, I., Wandinger, U., Ansmann, A., Althausen, D., and Stohl, A.: Raman lidar observations of aged Siberian and Canadian forest fire smoke in the free troposphere over Germany in 2003: Microphysical particle characterization, J. Geophys. Res., 110, D17201, https://doi.org/10.1029/2004JD005756, 2005.
Nicolae D., Nemuc, A., Müller, D., Talianu, C., Vasilescu, J., Belegante, L., and Kolgotin, A.: Characterization of fresh and aged biomass burning events using multi-wavelength Raman lidar and mass spectrometry, J. Geophys. Res., 118, 2956–2965, https://doi.org/10.1002/jgrd.50324, 2013.
Noh, M. Y., Müller, D., Lee, H., and Choi, T.: Influence of biogenic pollen on optical properties of atmospheric aerosols observed by lidar over Gwangju, South Korea, Atmos. Environ., 69, 139–147, https://doi.org/10.1016/j.atmosenv.2012.12.018, 2013a.
Noh, Y. M., Lee, H., Mueller, D., Lee, K., Shin, D., Shin, S., Choi, T. J., Choi, Y. J., and Kim, K. R.: Investigation of the diurnal pattern of the vertical distribution of pollen in the lower troposphere using LIDAR, Atmos. Chem. Phys., 13, 7619–7629, https://doi.org/10.5194/acp-13-7619-2013, 2013b.
Pan, Y.-L.: Detection and characterization of biological and other organic-carbon aerosol particles in atmosphere using fluorescence, J. Quant. Spectr. Radiat. Trans. 150, 12–35, 2015.
Pöhlker, C., Huffman, J. A., and Pöschl, U.: Autofluorescence of atmospheric bioaerosols – fluorescent biomolecules and potential interferences, Atmos. Meas. Tech., 5, 37–71, https://doi.org/10.5194/amt-5-37-2012, 2012.
Pope, F. D.: Pollen grains are efficient cloud condensation nuclei, Environ. Res. Lett., 5, 044015, https://doi.org/10.1088/1748-9326/5/4/044015, 2010.
Rao, Z., He, T., Hua D, Wang, Y., Wang, X., Chen, Y., and Le J.: Preliminary measurements of fluorescent aerosol number concentrations using a laser-induced fluorescence lidar, Appl. Opt., 57, 7211–7215, 2018.
Reichardt, J.: Cloud and aerosol spectroscopy with Raman lidar, J. Atm. Ocean. Tech., 31, 1946–1963, 2014.
Reichardt, J., Leinweber, R., and Schwebe, A.: Fluorescing aerosols and clouds: investigations of co-existence, Proceedings of the 28th ILRC, 25–30 June 2017, Bucharest, Romania, 2017.
Richardson, S. C., Mytilinaios, M., Foskinis, R., Kyrou, C., Papayannis, A., Pyrri, I., Giannoutsou, E., and Adamakis, I. D. S.: Bioaerosol detection over Athens, Greece using the laser induced fluorescence technique, Sci. Total Environ., 696, 133906, https://doi.org/10.1016/j.scitotenv.2019.133906, 2019.
Saito, Y., Ichihara, K., Morishita, K., Uchiyama, K., Kobayashi, F., and Tomida, T.: Remote detection of the fluorescence spectrum of natural pollens floating in the atmosphere using a laser-induced-fluorescence spectrum (LIFS) lidar, Remote Sens., 10, 1533, https://doi.org/10.3390/rs10101533, 2018.
Sassen, K.: Boreal tree pollen sensed by polarization lidar: Depolarizing biogenic chaff, Geophys. Res. Lett., 35, L18810, https://doi.org/10.1029/2008GL035085, 2008.
Sassen, K.: Elliptical pollen corona from North American boreal paper birch trees (Betula papyrifera): strong fall orientations for near-spherical particles, Appl. Opt., 50, F1–F5, https://doi.org/10.1364/AO.50.0000F1, 2011.
Shang, X., Giannakaki, E., Bohlmann, S., Filioglou, M., Saarto, A., Ruuskanen, A., Leskinen, A., Romakkaniemi, S., and Komppula, M.: Optical characterization of pure pollen types using a multi-wavelength Raman polarization lidar, Atmos. Chem. Phys., 20, 15323–15339, https://doi.org/10.5194/acp-20-15323-2020, 2020.
Sicard, M., Izquierdo, R., Alarcón, M., Belmonte, J., Comerón, A., and Baldasano, J. M.: Near-surface and columnar measurements with a micro pulse lidar of atmospheric pollen in Barcelona, Spain, Atmos. Chem. Phys., 16, 6805–6821, https://doi.org/10.5194/acp-16-6805-2016, 2016.
Sofiev, M., Vira, J., Kouznetsov, R., Prank, M., Soares, J., and Genikhovich, E.: Construction of the SILAM Eulerian atmospheric dispersion model based on the advection algorithm of Michael Galperin, Geosci. Model Dev., 8, 3497–3522, https://doi.org/10.5194/gmd-8-3497-2015, 2015.
Stein, A. F., Draxler, R. R, Rolph, G. D., Stunder, B. J. B., Cohen, M. D., and Ngan, F.: NOAA's HYSPLIT atmospheric transport and dispersion modeling system, Bull. Amer. Meteor. Soc., 96, 2059-2077, https://doi.org/10.1175/BAMS-D-14-00110.1, 2015.
Steiner, A. L., Brooks, S. D., Deng, C., Thornton, D. C. O., Pendleton, M. W., and Bryant, V:. Pollen as atmospheric cloud condensation nuclei, Geophys. Res. Lett., 42, 3596–3602, https://doi.org/10.1002/2015GL064060, 2015.
Sugimoto, N. and Lee, C. H.: Characteristics of dust aerosols inferred from lidar depolarization measurements at two wavelength, Appl. Opt., 45, 7468–7474, 2006.
Sugimoto, N., Huang, Z., Nishizawa, T., Matsui, I., and Tatarov, B.: Fluorescence from atmospheric aerosols observed with a multichannel lidar spectrometer, Opt. Expr., 20, 20800–20807, 2012.
Tesche, M., Ansmann, A., Müller, D., Althausen, D., Engelmann, R., Freudenthaler, V., and Groß, S.: Vertically resolved separation of dust and smoke over Cape Verde using multiwavelength Raman and polarization lidars during Saharan Mineral Dust Experiment 2008, J. Geophys. Res., 114, D13202, https://doi.org/10.1029/2009JD011862, 2009.
Veselovskii, I., Whiteman, D. N., Korenskiy, M., Suvorina, A., Kolgotin, A., Lyapustin, A., Wang, Y., Chin, M., Bian, H., Kucsera, T. L., Pérez-Ramírez, D., and Holben, B.: Characterization of forest fire smoke event near Washington, DC in summer 2013 with multi-wavelength lidar, Atmos. Chem. Phys., 15, 1647–1660, https://doi.org/10.5194/acp-15-1647-2015, 2015.
Veselovskii, I., Hu, Q., Goloub, P., Podvin, T., Korenskiy, M., Pujol, O., Dubovik, O., and Lopatin, A.: Combined use of Mie–Raman and fluorescence lidar observations for improving aerosol characterization: feasibility experiment, Atmos. Meas. Tech., 13, 6691–6701, https://doi.org/10.5194/amt-13-6691-2020, 2020a.
Veselovskii, I., Hu, Q., Goloub, P., Podvin, T., Korenskiy, M., Derimian, Y., Legrand, M., and Castellanos, P.: Variability in lidar-derived particle properties over West Africa due to changes in absorption: towards an understanding, Atmos. Chem. Phys., 20, 6563–6581, https://doi.org/10.5194/acp-20-6563-2020, 2020b.