the Creative Commons Attribution 4.0 License.
the Creative Commons Attribution 4.0 License.
 | 09 Jul 2021
Intercomparison review of IPWV retrieved from INSAT-3DR sounder, GNSS and CAMS reanalysis data
Ramashray Yadav
Ram Kumar Giri
Virendra Singh
The spatiotemporal variations of integrated precipitable water vapor (IPWV) are very important in understanding the regional variability of water vapor. Traditional in situ measurements of IPWV in the Indian region are limited, and therefore the performance of satellite and Copernicus Atmosphere Meteorological Service (CAMS) retrievals with the Indian Global Navigation Satellite System (GNSS) as reference were analyzed. In this study the CAMS reanalysis data of 1 year (2018) and the Indian GNSS and INSAT-3DR sounder retrieval data for 1.5 years (January 2017 to June 2018) were utilized, and statistics were computed. It is noticed that seasonal correlation coefficient (CC) values between INSAT-3DR and Indian GNSS data mainly lie within the range of 0.50 to 0.98 for all the selected 19 stations except Thiruvananthapuram (0.1), Kanyakumari (0.31) and Karaikal (0.15) during the monsoon season and Panjim (0.2) during the post-monsoon season. The seasonal CC values between CAMS and GNSS IPWV range from 0.73 to .99 except for Jaipur (0.16) and Bhubaneswar (0.29) during the pre-monsoon season, Panjim (0.38) during the monsoon season, Nagpur (0.50) during the post-monsoon season, and Dibrugarh (0.49) Jaipur (0.58) and Bhubaneswar (0.16) during the winter season. The root mean square error (RMSE) values are higher under the wet conditions (pre-monsoon and monsoon season) than under dry conditions (post-monsoon and winter season), and we found differences in magnitude and sign of bias for INSAT-3DR and CAMS with respect to GNSS IPWV from station to station and season to season.
This study will help to improve understanding and utilization of CAMS and INSAT-3DR data more effectively along with GNSS data over land, coastal and desert locations in terms of the seasonal flow of IPWV, which is an essential integrated variable in forecasting applications.
- Article
(5818 KB) - Full-text XML
- BibTeX
- EndNote


Integrated precipitable water vapor (IPWV) is a meteorological factor that shows the amount of water vapor contained in the column of air per unit area of the atmosphere in terms of the depth of liquid (Viswanadham, 1981). This parameter is of great importance in all studies related to the atmosphere and its properties throughout the year and in all seasons. The assessment of IPWV is done in many ways, such as in situ, model based or through remote sensing measurements. The in situ stations have limited coverage, are expensive and require maintenance all the time. Remote sensing instruments, especially absorption in the infrared and microwave region of the solar spectrum, have wide coverage, are cheaper, and are almost maintenance-free but need to validate their retrieval performance and intercomparison before being applied in the operational meteorological service domain. Similarly, model-based data have limitations in capturing the localized features of convection due to sparseness of or very few quality-controlled observational data sets over that region. Water vapor content present in the atmosphere, one of the most influential constituents of the atmosphere, is responsible for determining the amount of precipitation that a region can receive (Trenberth et al., 2003). The absorption of surface radiation depends on wavelength and water vapor content. Each absorbing water vapor molecule emits radiation according to Planck's law, mainly depending on its temperature, and the extent of absorption differs depending on the wavelength – the satellite sees different levels of atmosphere.
The Global Ozone Monitoring Experiment (GOME) and Scanning Imaging Absorption Spectrometer for Atmospheric Chartography (SCIAMACHY) both used the principle of differential optical absorption spectroscopy in the red spectral range of the IPWV retrieval (Beirle et al, 2018). The Atmospheric Infrared Sounder is a hyperspectral instrument which collects radiances in 2378 IR channels with wavelength ranging from 3.7 to 15.4 µm. Cloud-cleared radiances of AIRS were utilized in the retrieval of column-integrated water vapor, which is contributed by a number of channels having different sensitivity towards water vapor content present in the atmosphere (Aumann et al., 2003). The Moderate Resolution Imaging Spectroradiometer (MODIS) infrared algorithm used employs ratios of water vapor absorbing channels at 0.905, 0.936 and 0.940 µm with atmospheric window channels at 0.865 and 1.24 µm estimating the precipitable water vapor (Kaufman and Gao, 1992).
The uncertainties in the retrieval of precipitable water vapor from satellites (like errors of calibration of channels, viewing geometry, radiative transfer in the forward models) have already been addressed by previous studies (Ichoku et al., 2005 for MODIS; Noël et al., 2008 for GOME-2 and SCIAMACHY; Susskind et al., 2003, 2006 for AIRS). Wagner et al. (2006) studied GOME data for the period of 1996–2002 and reported a globally and yearly averaged 2.8 ± 0.8 % increase in total column precipitable water (excluding the ENSO period).
The retrievals from Modern-Era Retrospective Analysis for Research and Applications 2 (MERRA-2) reanalysis data sets (Gelaro et al., 2017) and the Climate Forecast System Reanalysis (CFSR) (Saha, 2010) data archive at https://rda.ucar.edu/pub/cfsr.html (last access: 15 May 2020) utilized 3D-Var data assimilation techniques and captured the interannual variations of precipitable water vapor well in the south of central Asia (Jiang et al., 2019). The study carried out by Berrisford et al. (2011) found that the ERA-Interim data set is superior in quality to that of ERA-40 during the period 1989–2008.
Yadav et al. (2020) carried out the validation of Indian GNSS IPWV with GPS sonde data for the period of June 2017 to May 2018 over the Indian region and found reasonably good agreement with in situ observations. In situ radiosonde observations generally suffer from spatiotemporal inhomogeneity errors and differences in relative humidity measured by different sensors. In this study this resulted in a positive bias less than 4.0 mm for seven stations, a correlation coefficient greater than 0.85 and a RMSE less than 5.0 mm for all nine collocated GPS sonde stations. In this direction the work carried out by Turner et al. (2003) – a 5 % dry bias with a microwave radiometer and Vaisala RS80-H – will be very useful while dealing with such radiosonde observations. Miloshevich et al. (2009) found a similar limitation of relative humidity measurement with a Vaisala RS92 radiosonde and derived an empirical correction to remove the mean bias error, yielding bias uncertainty independent of height.
The study carried out by Falaiye et al. (2018) is very important for considering the conventional data from long-term observing stations of the Indian domain along with the available model to establish the similar empirical relationship of getting the precipitable water vapor. This will also support the generation of an improved climatological mean especially over the remote regions.
Geostationary satellites have higher temporal resolution and continuous coverage and are important for monitoring the extreme weather events. Polar satellites have an advantage due to higher spatial resolution and can operate in both cloudy and non-cloudy conditions more effectively as compared to geostationary satellites. Courcoux and Schroder (2013) worked out the accuracies of the Satellite Application Facility on Climate Monitoring (CMSAF) satellite Advanced Television and Infrared Observation Satellite Operational Vertical Sounder (ATOVS) precipitable water vapor of about 2–4 mm with respect to radiosonde and Atmospheric Infrared Sounder (AIRS) data both over land and ocean with a resolution of 0.5∘ × 0.5∘.
Geostationary Earth orbit (GEO) satellites can produce data more timely and frequently. The retrieved high-temporal-resolution integrated precipitable water vapor (IPWV) from GEO satellite sensor data can be utilized to monitor pre-convective environments and predict heavy rainfall, convective storms and clouds that may cause serious damage to human life and infrastructure (Martinez et al., 2007; Liu et al., 2019; Lee et al., 2015). At present two advanced Indian geostationary meteorological satellites INSAT-3D (launched on 26 July 2013) and INSAT-3DR (launched on 6 September 2016) with similar sensor characteristics are orbiting over the Indian Ocean region and are placed at 82 and 74∘ E respectively. The INSAT-3D and INSAT-3DR satellites are both equipped with the infrared sounders with 19 channels, which are used to provide meteorological parameters like the profiles of temperature, humidity and ozone, atmospheric stability indices, atmospheric water vapor, etc. at 1 h (sector A) and 1.5 h (sector B) intervals (Kishtawal, 2019). The temperature and humidity (T-q profile) is used to retrieve thermodynamic indices, which are useful in analyzing the strength and severity of severe weather events. Therefore, IPWV is one of the critical variables used by forecasters when severe weather conditions are expected (Lee et al., 2016). The latest Copernicus Atmosphere Monitoring Service (CAMS) global reanalysis (EAC4) data set of atmospheric composition was built at approximately 80 km resolution with improved biases and consistent with time (Inness et al., 2019). The concept of GNSS meteorology was first introduced by Bevis et al. (1992, 1994) and Businger et al. (1992), and IPWV data were estimated from Global Navigation Satellite System (GNSS) observations. In this study we have taken 19 Indian GNSS stations (10 inland, 8 coastal and 1 desert) or sites for study. Earlier studies (Jade et al., 2005; Jade and Vijayan, 2008; Puviarasan et al., 2014) of water vapor over the Indian subcontinent and surrounding ocean have shown strong seasonal variations.
The behavior of coastal regions are generally different from inland and desert stations as coastal regions greatly influenced moisture advection from breezing of the seas, which is the cause of the continuous increment of IPWV even after the air temperature decreased (Ortiz de Galisteo et al., 2011).
Perez-Ramirez et al. (2014) compared Aerosol Robotic Network (AERONET) precipitable water vapor retrievals from Sun photometers with radiosondes, ground-based microwave radiometry, and GPS and found a consistent dry bias approximately 5 %–6 % with total uncertainties of 12 %–15 % in the retrievals of precipitable water vapor from AERONET. The study of Perez-Ramirez et al. (2019) clearly highlighted the importance of the Maritime Aerosol Network (MAN) in retrieving the precipitable water vapor over remote oceanic areas. The reanalysis model estimates have very good agreement with MAN, with mean differences of ∼ 5 % and standard deviation of ∼ 15 % under clear-sky conditions. The work done in the past by Smirnov et al. (2004, 2011) in retrieving the precipitable water vapor from aerosol network data especially for marine areas is very helpful in carrying out further studies in the future with INSAT-3DR satellite observations over oceanic areas.
The present study has two objectives: (1) intercomparison of CAMS and INSAT-3DR integrated precipitable water retrievals with Indian GNSS stations by using GNSS as reference and (2) performance in the retrievals CAMS and INSAT-3DR sounder for both land and ocean regions. This analysis will be very useful and increase knowledge of the satellite and reanalysis uncertainties and their improvements from place to place and season to season. It will also further improve and help the forecasters use models as well as INSAT-3DR data sets with confidence as these are available over wide spatial coverage as compared to the low density of GNSS network data over Indian domains.
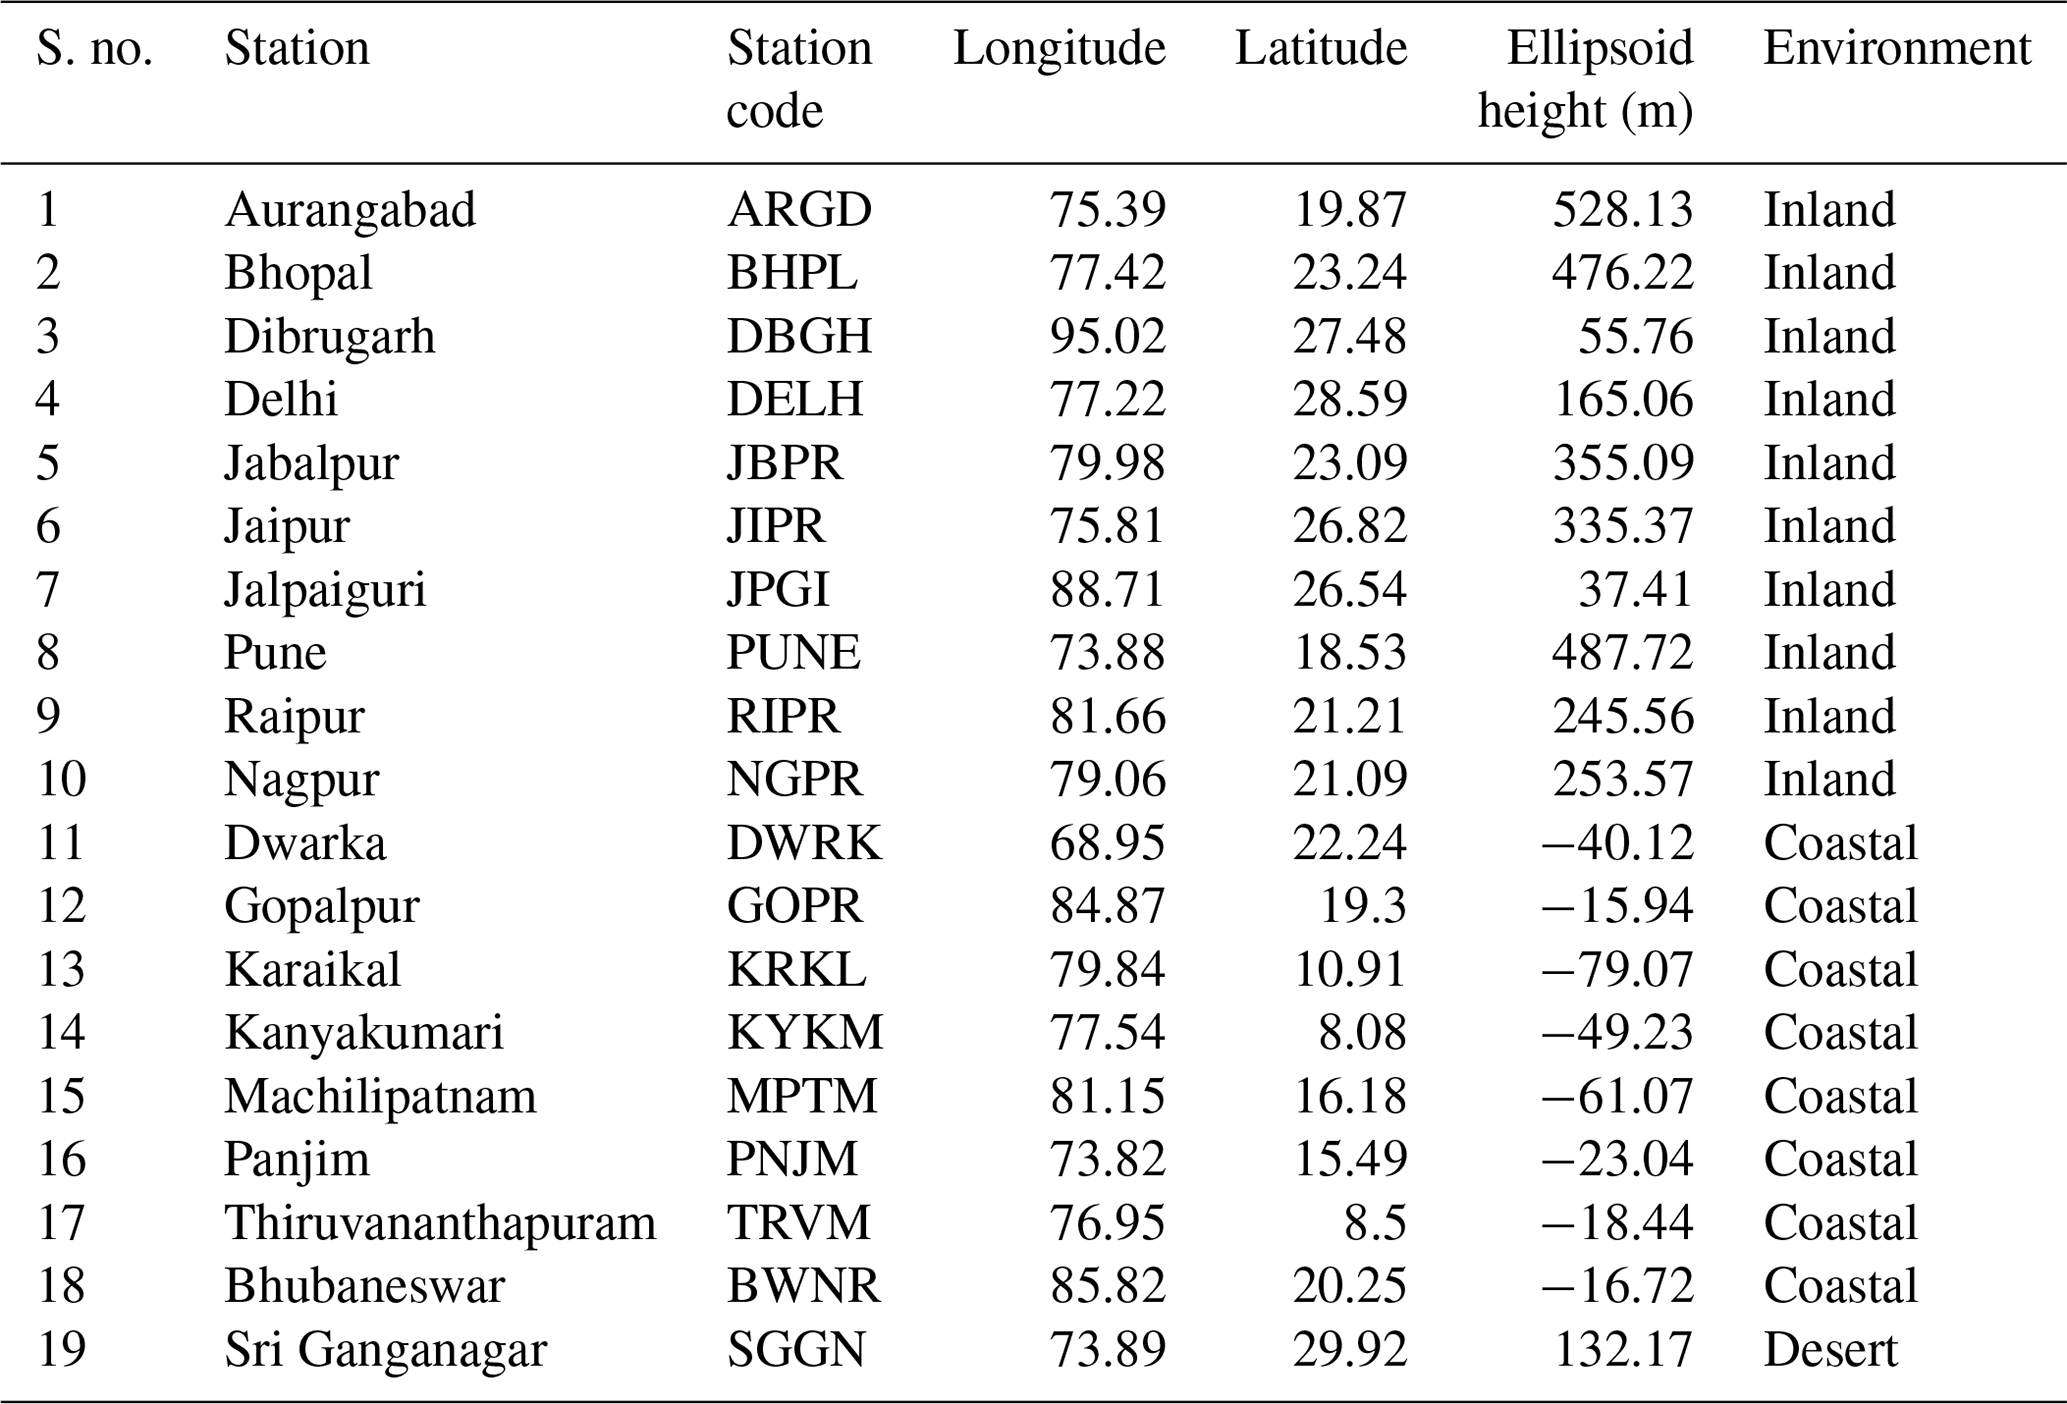
The measured integrated precipitable water vapor (IPWV) measurements from the India Meteorological Department (IMD) GNSS network with 15 min temporal resolution data are used for the comparison of INSAT-3DR geostationary satellite IPWV products and CAMS reanalysis IPWV data. The INSAT-3DR data scans are each of 1 h intervals from January 2017 to June 2018. These measured and derived IPWV products are arranged as a collocation of both temporal and spatial resolution. The spatial views of the observational locations of GNSS and along with INSAT-3DR IPWV annual mean values are shown in Fig. 2. The number of observational points (N) of each GNSS, INSAT-3DR and CAMS reanalysis of each station with its latitude and longitude are shown in Table 2. Here, winter season is considered to be in December, January and February; pre-monsoon season is considered to be in March, April and May; monsoon season season is considered to be in June, July and August; and finally the post-monsoon season is considered to be in September, October and November.
2.1 IMD IPWV observation network
The ground-based GNSS IPWV estimated using high-temporal-sampling (15 min) data (January 2017–June 2018) of the Indian GNSS network is processed at the satellite division of the India Meteorological Department, Lodi Road, New Delhi. The data are processed daily by using the Trimble Pivot Platform (TPP) software.
The data are used operationally and are archived on a daily, weekly, monthly and seasonal basis for future utilization and dissemination to the users and researchers as per the official norms. If we reduce the cutoff angle from 5∘, a multipath effect will occur and introduce inaccuracy in the IPWV estimation. An elevation angle of more than 5∘ is set for all stations to avoid the satellite geometry change and multipath effects. This is an optimal setting as a higher cutoff angle (> 5∘) may introduce dry bias in the IPWV estimation and a notable 0.8 mm error in IPWV (Emardson et al., 1998). The other possible sources of error associated with GNSS data are the mean temperature of the atmosphere, dynamical pressure and isotropic errors. These errors will vary with location and time of observations.
2.2 Integrated precipitable water vapor retrievals from INSAT-3DR sounder data
The sounder payload of the INSAT-3DR satellite has the capability to provide vertical profiles of temperature (40 levels from surface to ∼ 70 km) and humidity (21 levels from surface to ∼ 15 km) from the surface to the top of the atmosphere. The sounder has 18 narrow spectral channels in the shortwave infrared, middle infrared, and longwave infrared regions and one channel in the visible region. The ground resolution at nadir is 10 × 10 km for all 19 channels. Specifications of sounder channels are given in Table 1. Vertical profiles of temperature and moisture can be derived from radiances in these 18 IR channels, using the first guess from numerical weather prediction (NWP) model data. INSAT-3DR sounder channel brightness temperature values are averaged over a number of fields of view (FOVs) prior to the application of retrieval algorithm. Based on this, average vertical profiles are retrieved at 30 × 30 km (3 × 3 pixels) for each cloud-free pixel.
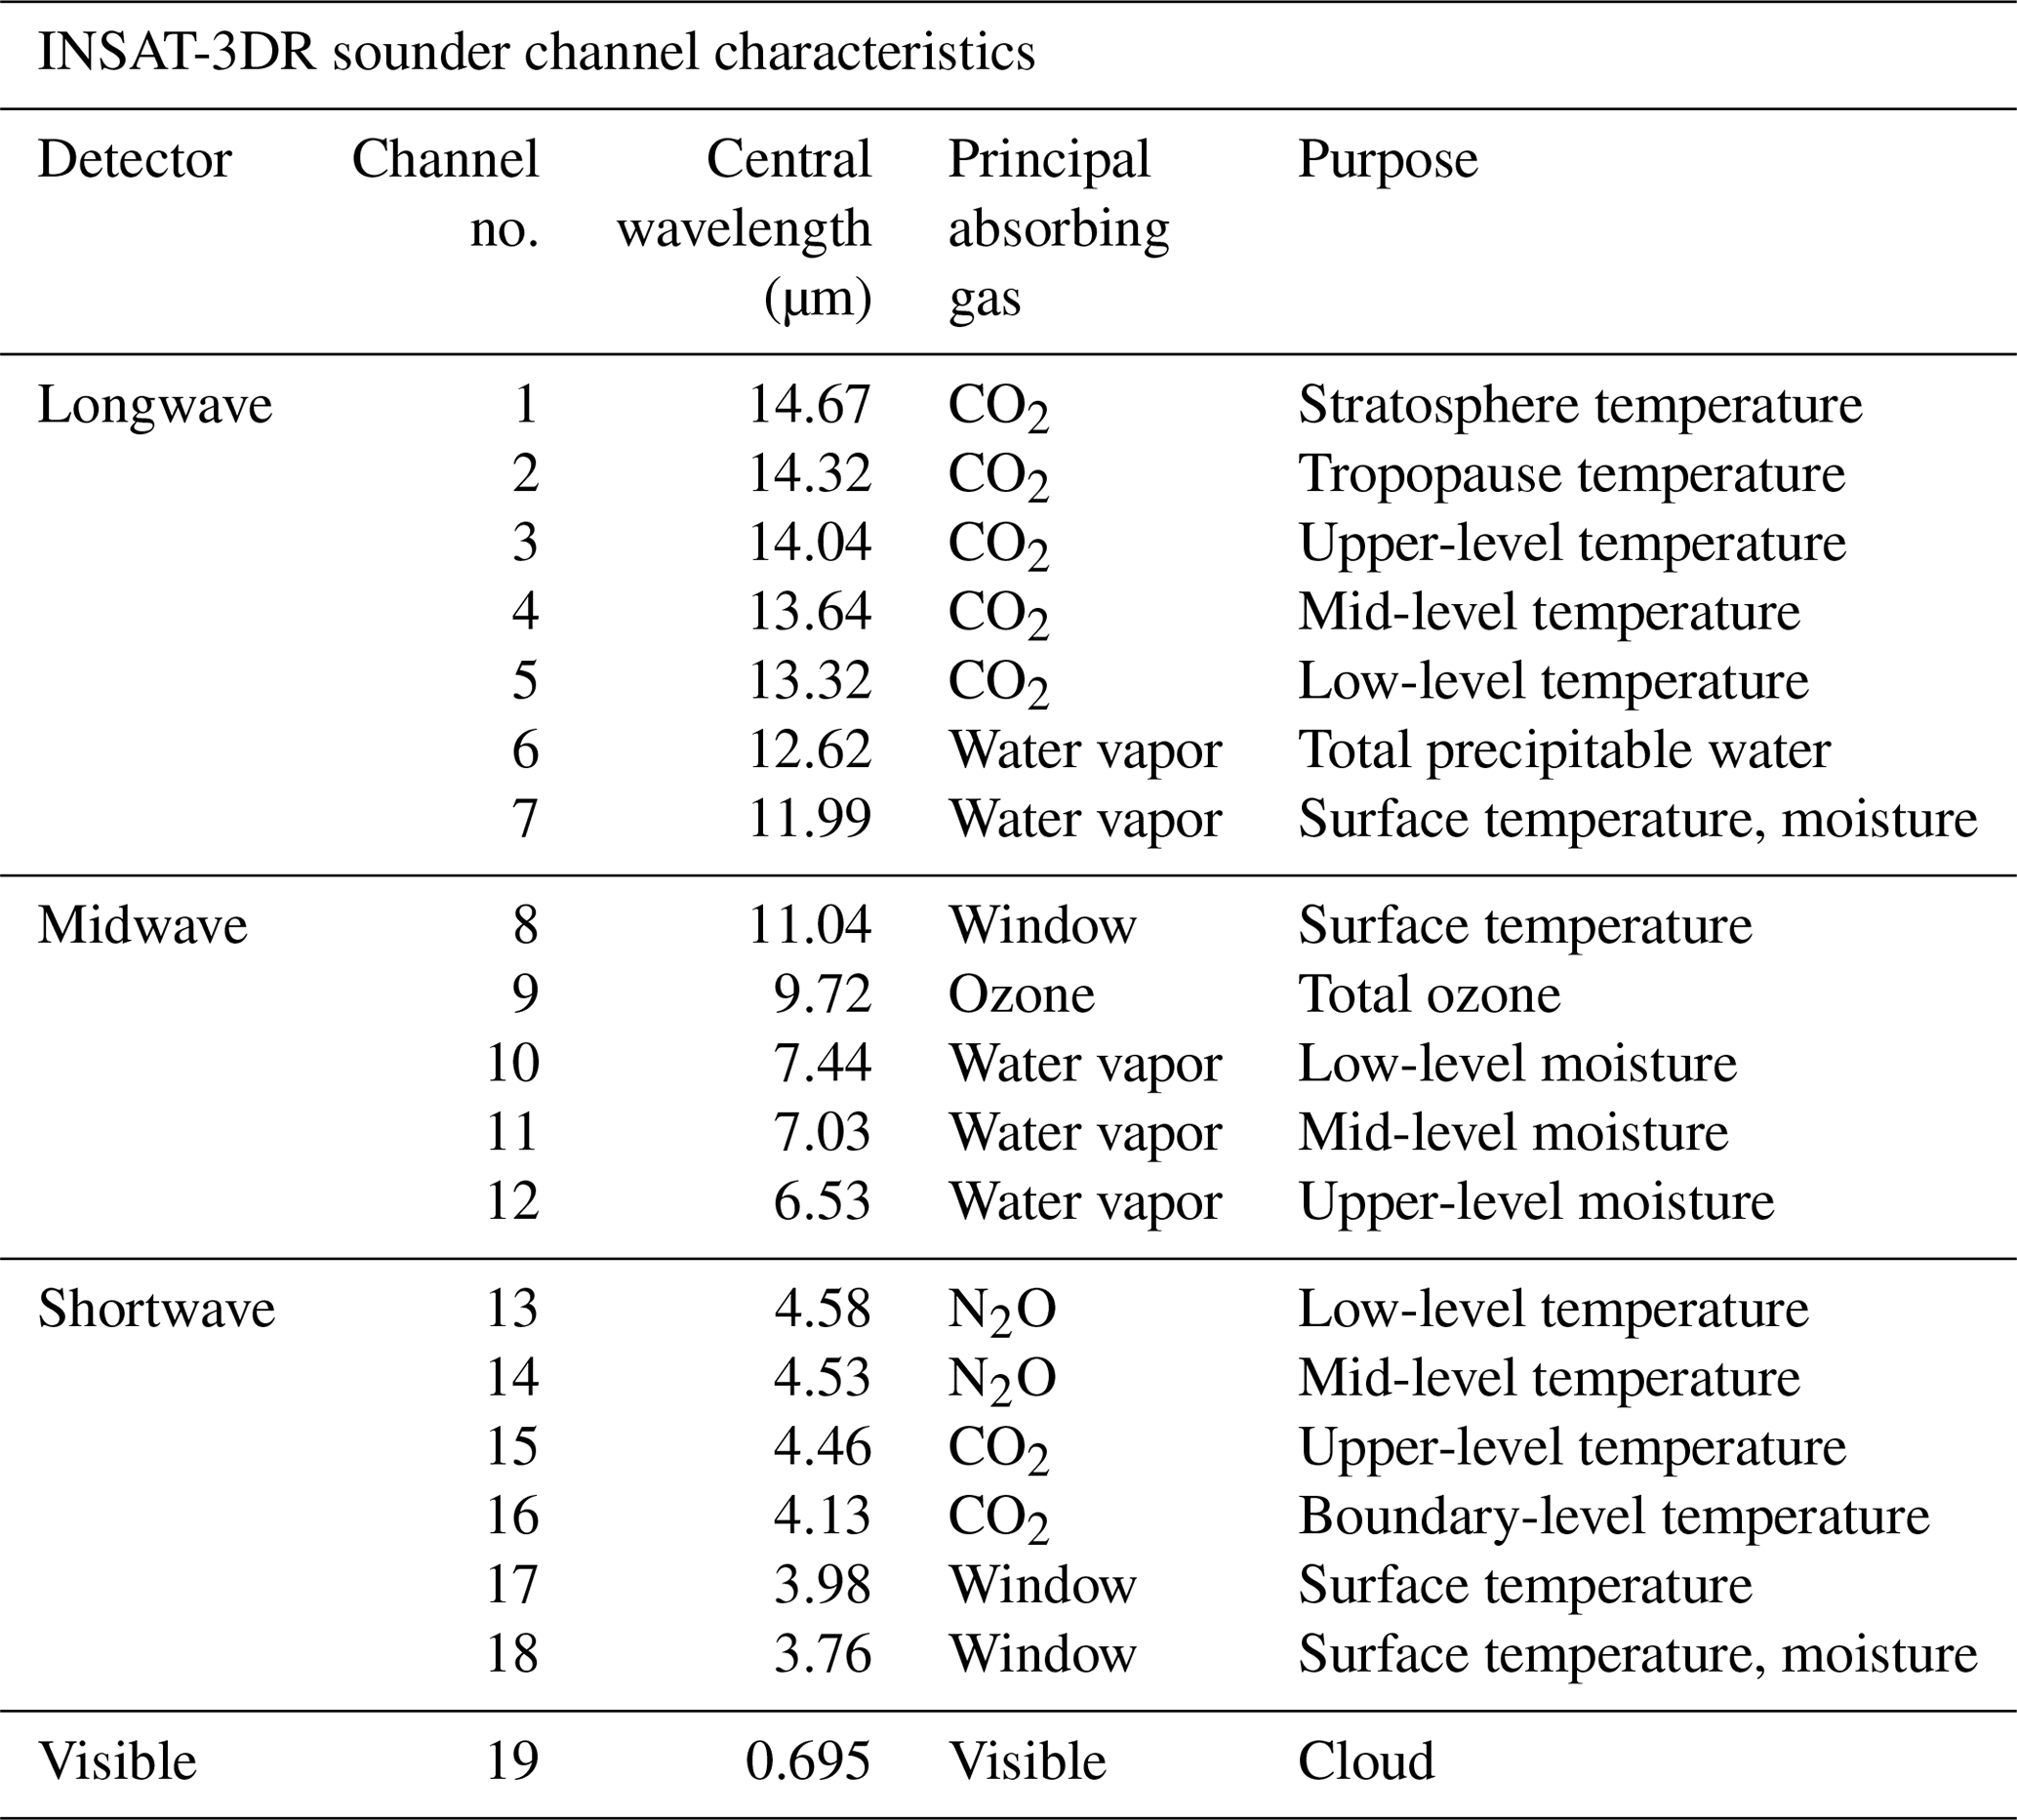
Table 2List of GNSS stations (latitude, longitude, height) and location environment.
As INSAT-3DR IPWV is sensitive to the presence of clouds in the field of view (limitation of infrared sounder sensors), the IPWV values collected under clear-sky conditions were used in this study. The atmospheric profile retrieval algorithm for the INSAT-3DR sounder is a two-step approach. The first step includes generation of accurate hybrid first-guess profiles using a combination of statistical-regression-retrieved profiles and model forecast profiles. The second step is nonlinear physical retrieval to improve the resulting first-guess profile using the Newtonian iterative method. The retrievals are performed using clear-sky radiances measured by the sounder within a 3 × 3 field of view (approximately 30 × 30 km resolution) over land for both day and night (similar to INSAT-3D ATBD, 2015). Four sets of regression coefficients are generated – two sets for land and ocean daytime conditions and the other two sets for land and ocean nighttime conditions – using a training data set comprising historical radiosonde observations representing atmospheric conditions over the INSAT-3DR observation region. Integrated precipitable water vapor in millimeters (mm) can be given as
where g is the acceleration of gravity, p1 is the surface pressure and p2 is the top-of-atmosphere pressure (i.e., about 100 hPa, beyond which water vapor amount is assumed to be negligible). The unit of precipitable water is millimeter (mm) depth of an equal amount of liquid water above a surface of 1 m2. IMD computes IPWV from a 19-channel sounder of INSAT-3DR in three layers, i.e., 1000–900, 900–700, and 700–300 hPa, and total precipitable water vapor (PWV) in the vertical column of atmosphere stretching from the surface to about 100 hPa during cloud-free conditions. Monsoon, severe weather and cloudy conditions limit the sounder profile (Venkat Ratnam et al., 2016). The GNSS- and INSAT-3DR-retrieved IPWV values are matched every hour.
2.3 Scan strategy of INSAT-3DR sounder
The sounder measures radiance in 18 infrared (IR) channels and 1 visible channel simultaneously over an area of area of 10 km × 10 km at nadir every 100 ms. Using a two-axis gimballed scan mirror, this footprint can be positioned anywhere in the field of regard (FOR): 24∘ (E–W) × 19∘ (N–S). To sound the entire globe area of 6400 km × 6400 km in size, it takes almost 3 h. A scan program mode allows sequential sounding of a selected area with periodic space and calibration looks. In this mode, a “frame” consisting of multiple “blocks” of the size 640 km × 640 km can be sounded. The selected frame can be placed anywhere within 24∘ (E–W) × 19∘ (N–S) (similar to INSAT-3D ATBD, 2015). An optimized scan strategy of sounder payload was worked out depending on the operational requirements of users and stakeholders for both land (sector A) and oceanic (sector B) regions with hourly and 1.5-hourly data coverage respectively (Fig. 1). The full-aperture internal black-body calibration is performed every 30 min or on command whenever required. The sounder payload has a provision to be carried out during onboard IR calibration, in which the scan mirror pointed towards space to measure the radiances and then pointed to the internal black body present on the payload to measure its radiances. There is also a provision to measure the temperature of the internal black body. All these data sets are transmitted along with video data of the payload. During the processing on the ground, the data collected during onboard calibration are used to generate the calibration lookup table for each scan. This enables the derivation of vertical profiles of temperature and humidity more accurately. These vertical profiles can then be used to derive various atmospheric stability indices and other parameters such as atmospheric water vapor content and total column ozone amount. The products derived over sector-A data are used for weather forecasting on an operational basis, and products derived over sector B are used for assimilation in the NWP model.

Figure 1Scan strategy and area of coverage of INSAT-3DR sounder payload.
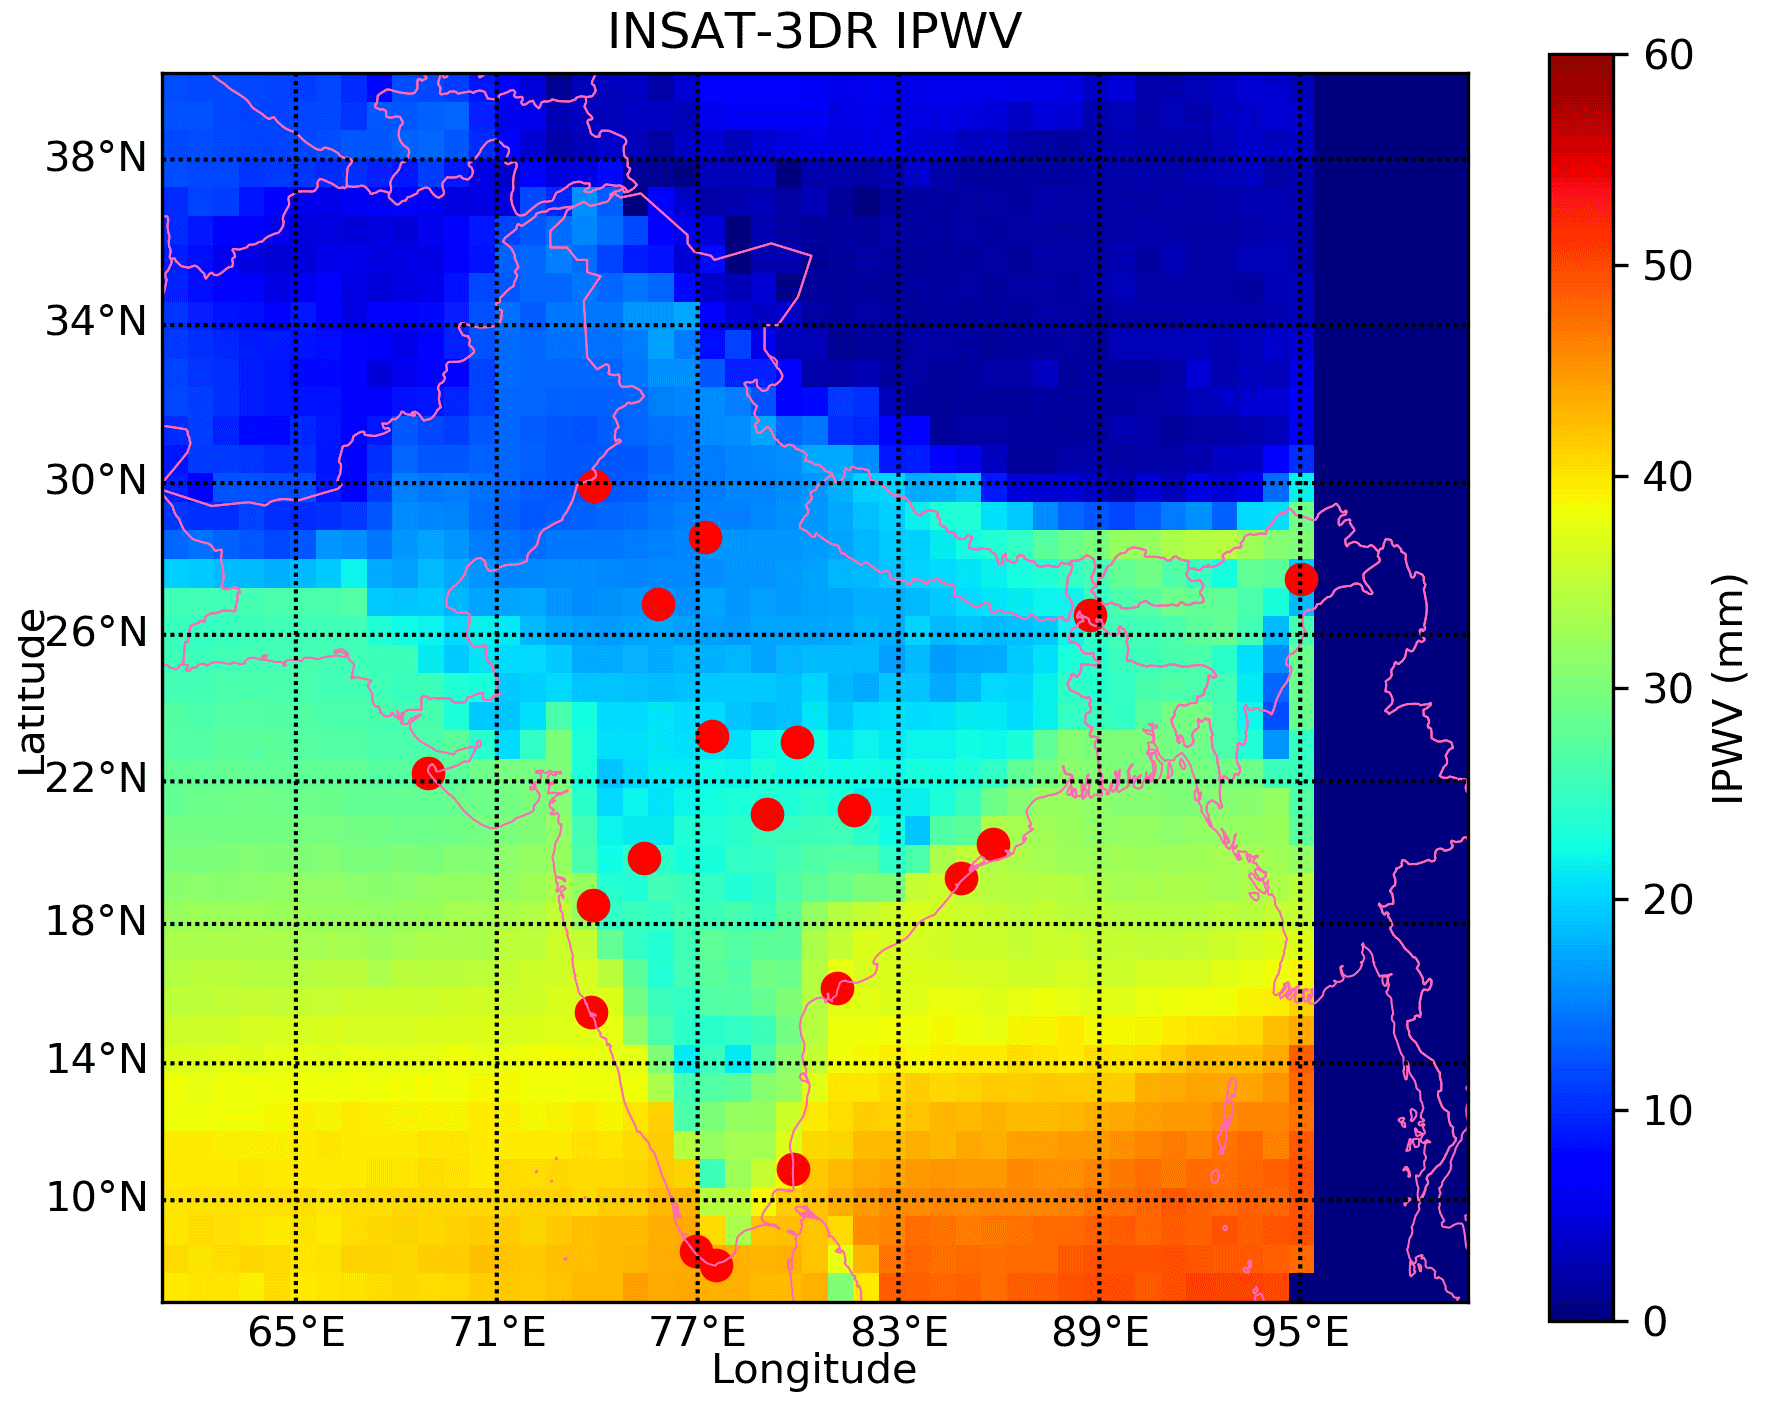
Figure 2The annual mean of IPWV over India retrieved from INSAT-3DR during the year of 2018. The geographical distribution of 19 GNSS stations (filled red color circles).
2.4 Copernicus Atmosphere Monitoring Service (CAMS) reanalysis data
The CAMS reanalysis was produced using 4D-Var data assimilation in the European Centre for Medium-Range Weather Forecasts (ECMWF) Integrated Forecasting System (IFS), with 60 hybrid sigma/pressure (model) levels in the vertical and with the top level at 0.1 hPa (https://ads.atmosphere.copernicus.eu/cdsapp#!/search?type=dataset, last access: 28 May 2020). Atmospheric data are available on these levels, and they are also interpolated to 25 pressure levels, 10 potential temperature levels and 1 potential vorticity level (Inness et al., 2019). This new reanalysis data set has a horizontal resolution of about 80 km (0.75∘ × 0.75∘) and smaller biases for reactive gases and aerosols, which are improved and more consistent with time as compared to earlier versions. The INSAT-3DR data set has a horizontal resolution of 30 × 30 km (3 × 3 pixels) for each cloud-free pixel. The collocation matchup was created at 0.75∘ × 0.75∘ (about 80 km) spatial resolution for comparison and performance analysis of INSAT-3DR data with CAMS reanalysis data using the bilinear interpolation technique. Temporal domains are selected at 00:00, 03:00, 06:00, 09:00, 12:00, 15:00, 18:00 and 21:00 UTC time intervals for the Indian GNSS along with INSAT-3DR at 03:00, 09:00, 15:00 and 21:00 UTC for the performance analysis. The CAMS reanalysis IPWV retrievals are interpolated to different geographical locations of 19 GNSS observations. We have used nearest-neighbor interpolation techniques to interpolate CAMS reanalysis with GNSS data. In this method we evaluate each station to determine the number of neighboring grid cells in a 0.75∘ × 0.75∘ box that surrounds the GNSS station and contains at least one valid CAMS reanalysis data set. CAMS data are capable of capturing large-scale features of moisture flow which help the forecasters in predicting large-scale weather systems such as western disturbances, cyclonic storms, monitoring of monsoon and other associated weather events affecting the Indian domain throughout the year.
2.5 Analysis of statistical skill scores
The collocated comparison statistics with the matchup data set are used to evaluate the statistical performance of retrievals of INSAT-3DR and CAMS with respect to GNSS IPWV over the Indian region.
The statistical metrics used for quantitative evaluation are the linear correlation coefficient (CC), standard deviation (SD), bias and root mean square error (RMSE). The computations of the abovementioned statistical metrics are given below.
Let Oi represents the ith observed value of INSAT-3DR or CAMS reanalysis data and Mi represent the ith GNSS IPWV value for a total of n observations.
The mean bias (MB) is computed as follows:
The root mean square error (RMSE) is computed as follows:
The correlation coefficient (CC) is computed as follows:
The standard deviation (SD) is computed as follows:
2.6 INSAT-3DR and GNSS retrievals matchup criteria
The assessment of accuracy of INSAT-3DR satellite-retrieved IPWV with 19 GNSS stations in different geographical locations which are located in coastal, inland and desert regions over the Indian subcontinent and are shown in Table 2. The GNSS IPWV data sampled every 15 min to maintain consistency with INSAT-3DR retrievals that are available every 1 h interval of time over the Indian region for the period 1 January 2017 to 30 June 2018 were utilized. Matchup data sets were prepared for INSAT-3DR and GNSS IPWV as per the following criteria.
-
To reduce the local horizontal gradient arising in IPWV, the absolute distance between the position of the GNSS station locations is set within the 0.25∘ latitude and longitude of the INSAT-3DR retrievals in the region surrounding the stations.
-
The temporal resolution selected of INSAT-3DR and 19 GNSS observations is within a 30 min time interval depending on retrievals and the location of the GNSS stations.
-
The INSAT-3DR IPWV retrievals are interpolated to different geographical locations of 19 GNSS observations.
3.1 Intercomparison of INSAT-3DR and Indian GNSS IPWV
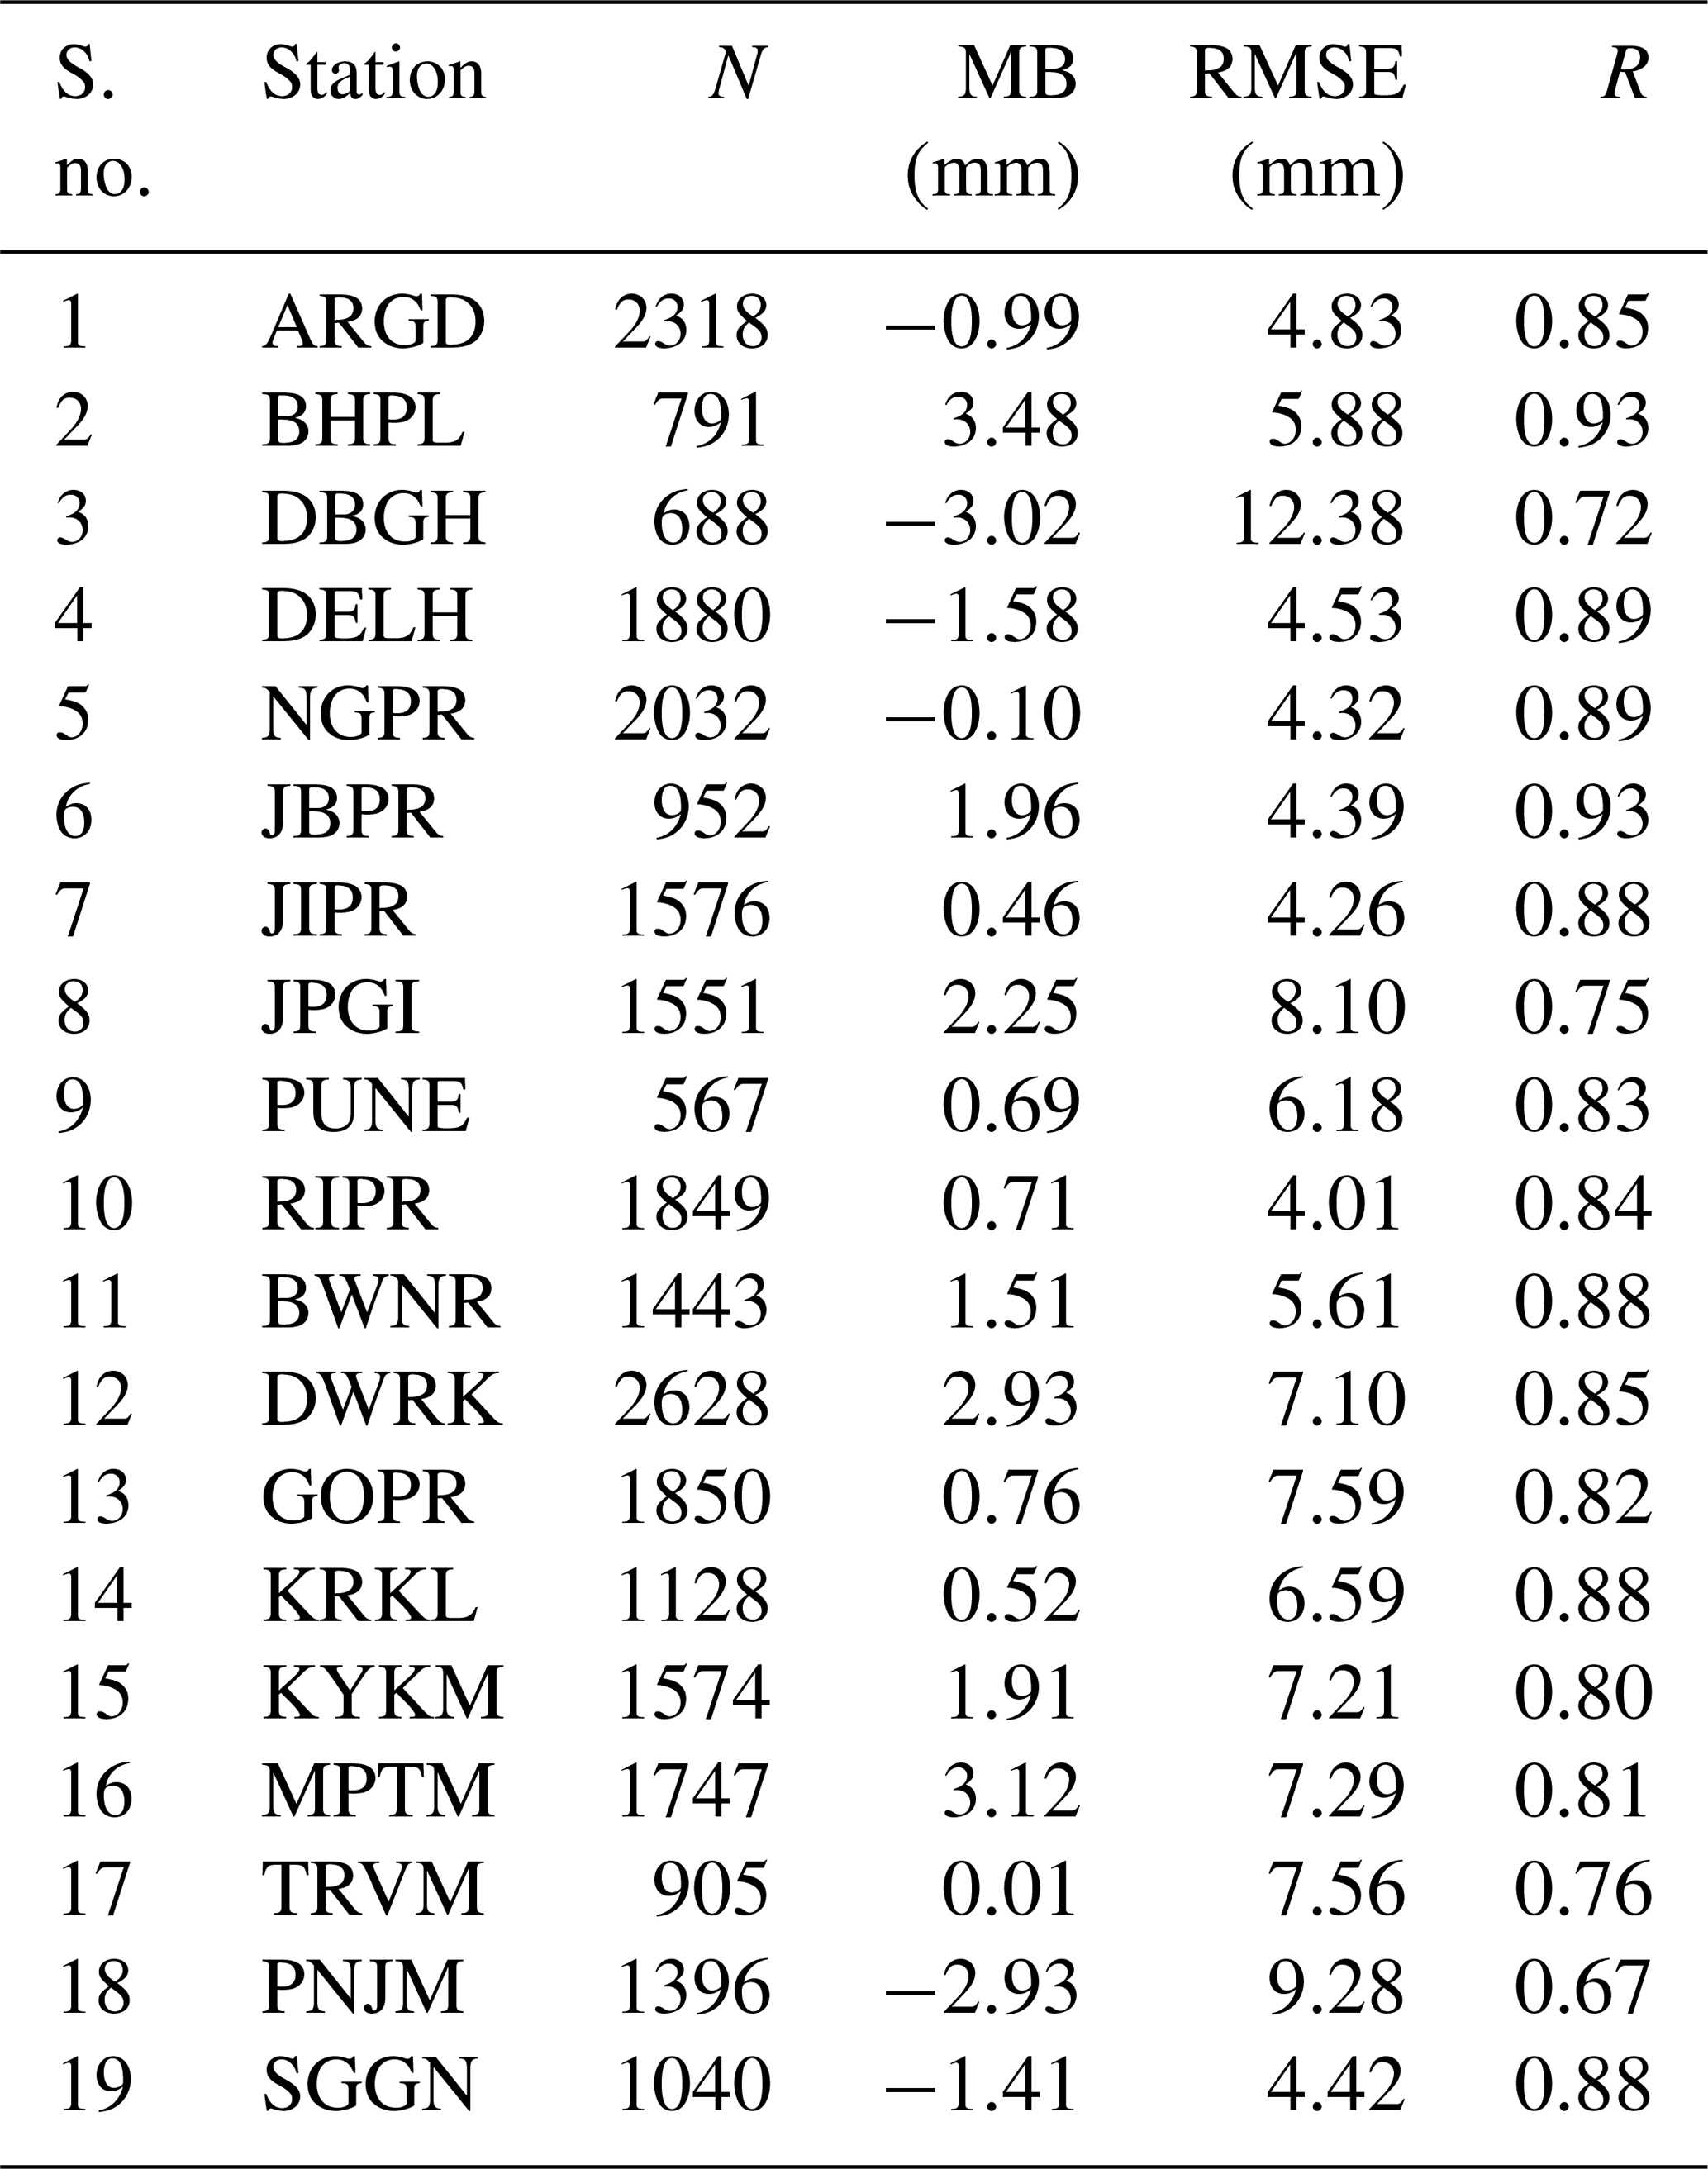
From Fig. 3, the Taylor diagram is used to evaluate the skill characteristics of the annual distribution of IPWV retrieved from the INSAT-3DR satellite with 19 GNSS IPWV stations at different geographical locations (Fig. 2) over the Indian subcontinent during the period of 1 January 2017 to 30 June 2018. Further, the tailor diagram displays three statistical skill metrics: distribution of the correlation coefficient, root mean square error (RMSE) and standard deviation (SD). If an IPWV performs nearly perfectly, its position in the diagram is expected to be very close to the observed point (Fig. 3). An attempt was made to evaluate the IPWV retrieved from the INSAT-3DR satellite, with GNSS observations showing that the root mean square error (RMSE) of 8 inland stations out of 10 stations lies between 4 and 6 mm, but it lies between 8 and 12 mm for Jalpaiguri (JPGI) and Dibrugarh (DBGH) stations. The observation points in the case of Dibrugarh (DBGH) are more symmetrical than Jalpaiguri (JPGI) even RMSE values are higher (Fig. 4). The values of the correlation coefficient (CC) and bias for inland stations lie in the range from 0.72 to 0.93 and from −3.0 to +3.0 mm respectively. Similarly, for all the coastal stations the values of CC and bias lie in the range from 0.67 to 0.88 and from −3.0 to +3.0 mm respectively. RMSE values for seven coastal stations out of eight stations lie between 5 and 7 mm, but it is 9 mm of Panjim. The values of CC, bias and RMSE for the desert station (SGGN) are 0.88, −1.4 and 4.42 mm respectively (Table 3).
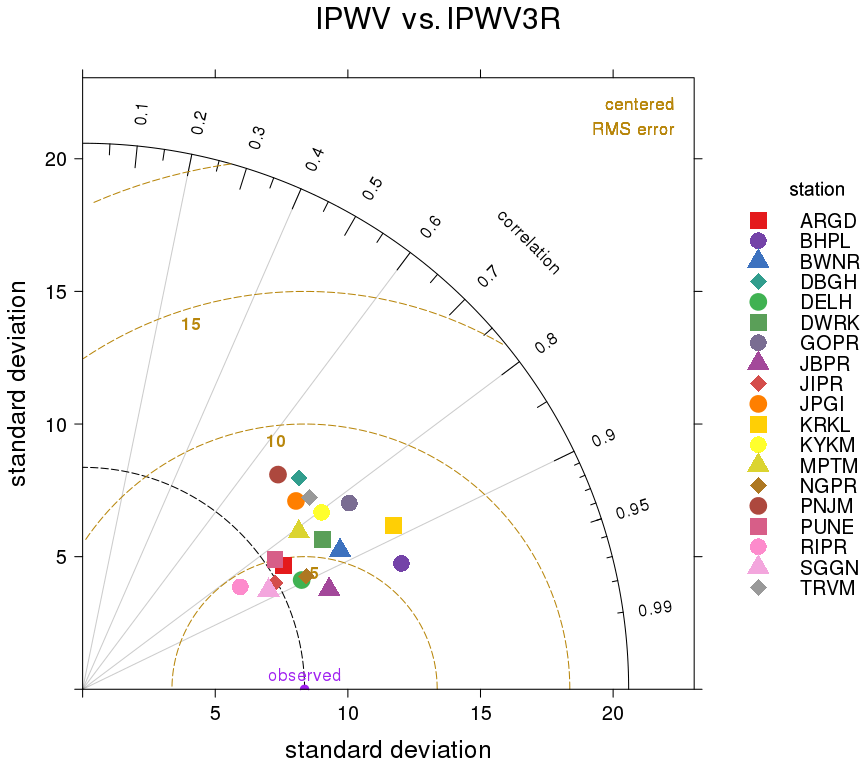
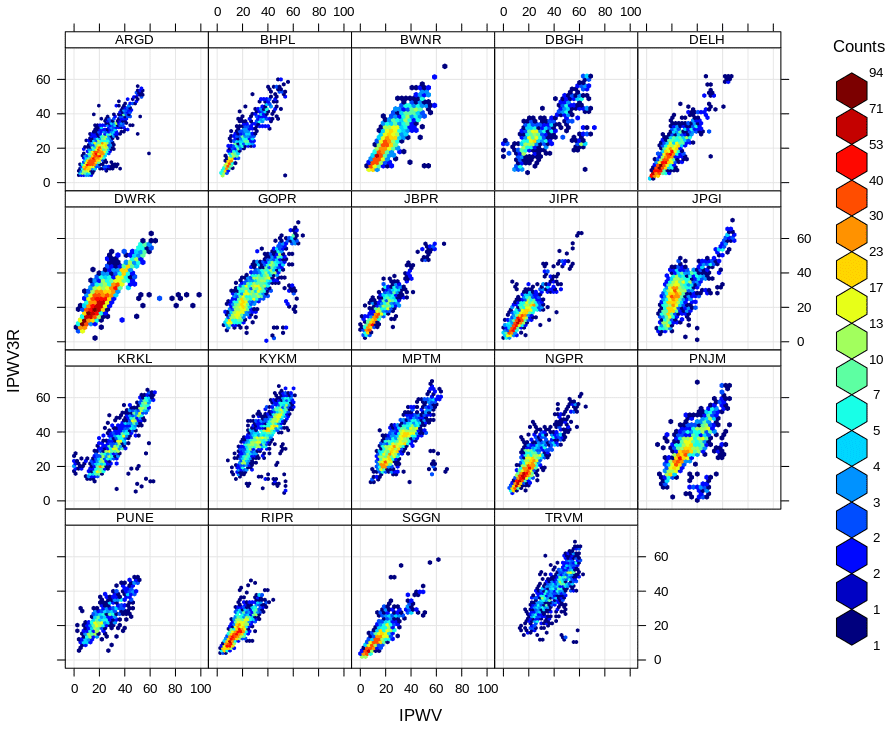
Table 3Statistical analysis of IPWV retrievals from INSAT-3DR and GNSS data (January 2017 and June 2018).
The correlation coefficient of IPWV varies from 0.60 to 0.89 for all the stations for the pre-monsoon season. IPWV retrieved from the INSAT-3DR satellite with respect to GNSS IPWV have negative biases with the range from −6.7 to −0.39 mm, which indicates an underestimation of IPWV at the stations ARGD, DBGH, DELH, NGPR, JIPR, JPGI, RIPR, GOPR, PNJM, TRVM and SGGN. The stations JBPR, PUNE, KRKL, KYKM, MPTM, DWRK and BWNR have the positive bias range from 0.03 to 2.54 mm, which indicates an overestimation of IPWV by INSAT-3DR during the pre-monsoon season. RMSE ranges between 3.5 and 10 mm (Table 4).
Table 4Statistical seasonal analysis of retrievals of IPWV from INSAT-3DR and GNSS data. NaN indicates no availability of observational data.
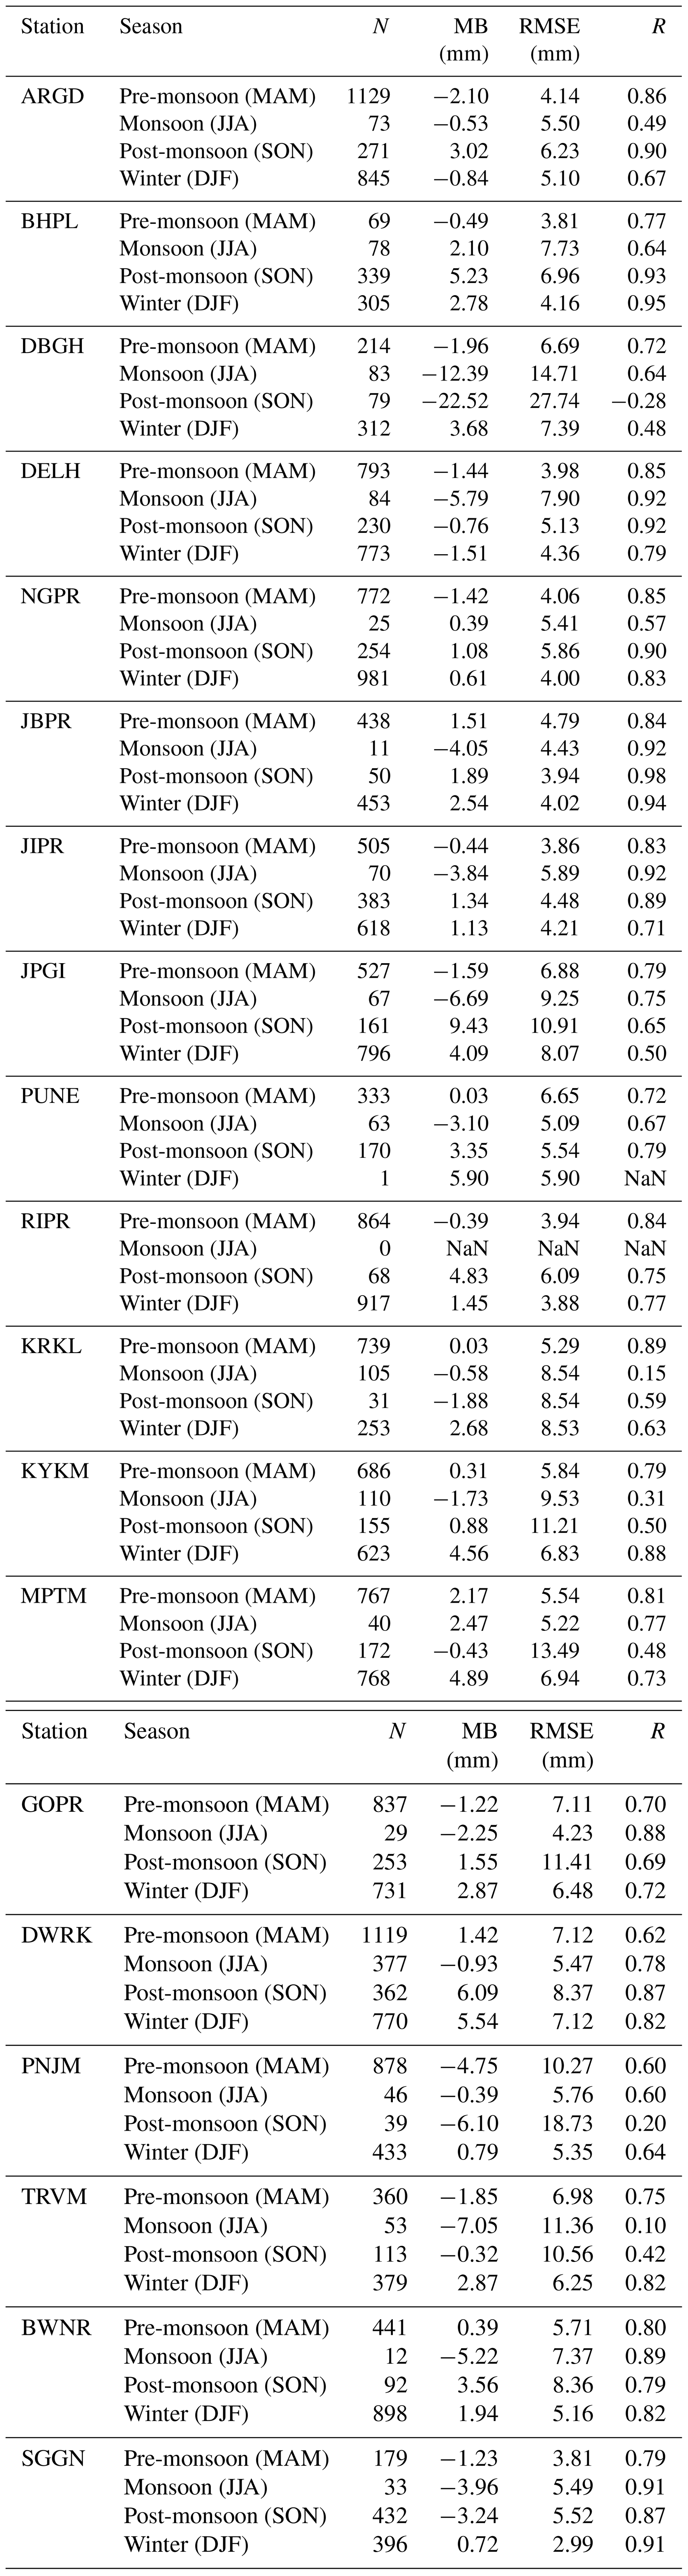
The correlation coefficient of IPWV varies from 0.60 to 0.90 for all the stations during the monsoon season except TRVM (0.1), KYKM (0.31) and KRKL (0.15). The stations ARGD, DBGH, DELH, JBPR, JIPR, JPGI, PUNE, KRKL, KYKM, GOPR, BWNR, PNJM, TRVM and SGGN have the negative bias range from −0.39 to −12.39 mm, which indicates the underestimation of IPWV by INSAT-3DR as compared to MPTM, NGPR and BHPL, which have the positive bias range from 0.39 to 2.47 mm during the monsoon season. RMSE range from 4.23 to 14.71 mm (Table 4).
The correlation coefficient of IPWV varies from 0.60 to 0.98 for all the stations during the post-monsoon season except TRVM (0.42), PNJM (0.2), MPTM (0.48), KYKM (0.50) and DBGH (−0.28). The stations DELH, KRKL, MPTM, PNJM, TRVM and SGGN have the negative bias range from −0.32 to −6.10 mm, except for DBGH (−22.52 mm), which indicates the underestimation of IPWV by INSAT-3DR as compared to ARGD, BHPL, NGPR, JBPR, JIPR, JPGI, PUNE, RIPR, KYKM, GOPR, DWRK and BWNR, which have the positive bias range from 0.88 to 9.43 mm during the post-monsoon season. RMSE ranges from 3.94 to 13.49 mm except for PNJM (18.73 mm) and DBGH (27.74 mm) (Table 4).
The correlation coefficient of IPWV varies from 0.64 to 0.95 for all the stations during the winter season except DBGH (0.48) and JPGI (0.50). The stations BHPL, DBGH NGPR, JBPR, JIPR, JPGI, PUNE, RIPR, KRKL, KYKM, MPTM, GOPR, DWRK, PNJM, TRVM, BWNR and SGGN have the positive bias range from 0.61 to 5.90 mm, which indicates the overestimation of IPWV by INSAT-3DR as compared to ARGD (−0.84 mm) and DELH (−1.51 mm) during the winter season. RMSE ranges from 2.99 to 8.53 mm (Table 4).
Scatter plot of hourly INSAT-3DR IPWV and GNSS IPWV plotted in Fig. 4 using hexagonal binning. The number of occurrences in each bin is color coded (not on a linear scale). It is now possible to see where most of the data lie, and a better indication of the relationship between GNSS IPWV and INSAT-3DR IPWV is revealed.
Stations TRVM, KYKM, KRKL, PNJM, MPTM, JPGI and DBGH are poorly correlated (INSAT-3DR vs. GNSS), and averaging of INSAT-3DR pixels in gridded data contains both sea and mountainous land together along with topographically diverse terrains around these stations. Similar behavior is also seen in annual analysis of IPWV in coastal stations with the abovementioned reasons.
It is seen that discrepancies arise because the wet mapping functions that are used to map the wet delay at any angle to the zenith do not represent the localized atmospheric condition particularly for narrow towering thunder clouds and because of the non-availability of GPS satellites in the zenith direction (Puviarasan et al., 2020).
Large or small bias between IPWV retrieved from INSAT-3DR and GNSS exists due to limitations of the INSAT-3DR retrievals and calibration uncertainties in the radiance measured by INSAT-3DR. Another possibility of operation differences in IPWV measurements was adopted in GNSS/INSAT-3DR with respect to mapping function/weighting function contributions.
The results indicate that the RMSE values increase significantly under the wet conditions (pre-monsoon and monsoon season) compared to under dry conditions (post-monsoon and winter season) (Table 4). The study showed differences in the magnitude and sign of bias of INSAT-3DR with respect to GNSS IPWV from station to station and season to season. The data quality of INSAT-3DR IPWV may be improved due to proper bias correction coefficient application before physical retrievals of IPWV during clear-sky pixels.
3.2 Intercomparison of CAMS reanalysis and Indian GNSS IPWV
From Fig. 5, the Taylor diagram evaluates the skill characteristics in terms of RMSE, correlation coefficient and standard deviation of the annual distribution of IPWV retrieved from CAMS with 19 GNSS IPWV stations at different geographical locations (Fig. 5) over the Indian subcontinent during the period of 1 January 2018 to 31 December 2018. The root mean square error (RMSE) between CAMS reanalysis and GNSS data retrievals of 9 inland stations out of 10 stations lies between 3 and 7 mm, except for Nagpur (NGPR) station where it is 9 mm. The values of the correlation coefficient (CC) and bias for inland stations lie in the range from 0.88 to 0.99 and from −3.0 to +3.0 mm, except Pune, which is −6.69 mm (Table 5).
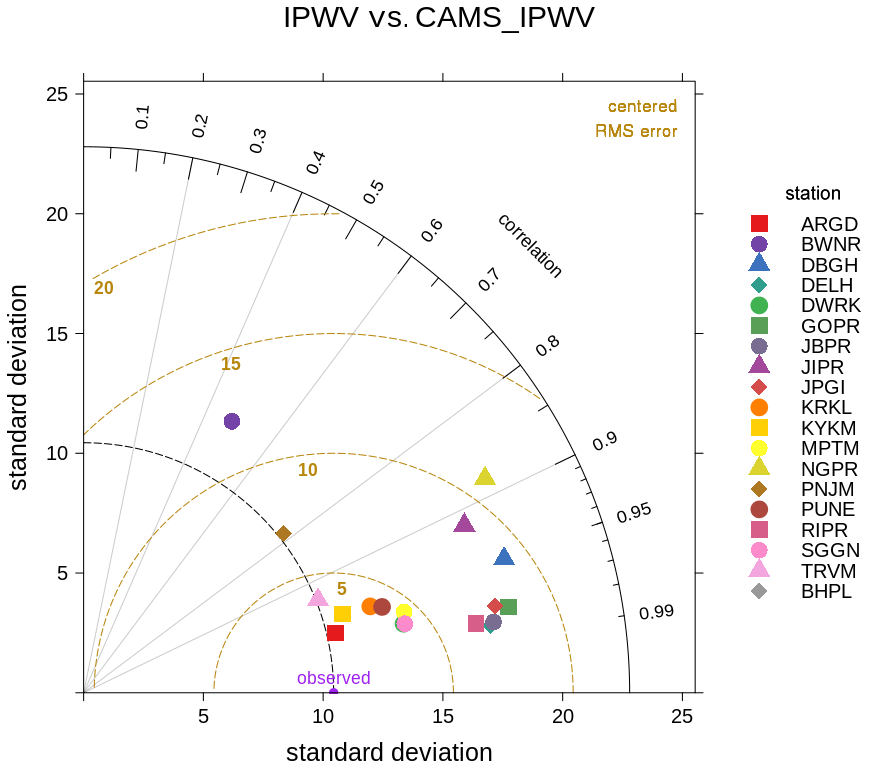
Table 5Statistical analysis of IPWV retrievals from CAMS and GNSS data (January to December 2018). NaN indicates no availability of observational data.

The root mean square error (RMSE) for seven coastal stations out of eight stations lies between 3 and 7 mm, except for Bhubaneswar (BWNR) where it is 14.0 mm. The values of CC and bias lie in the range from 0.78 to 0.98, except for BWNR, which is 0.48, and from −2.0 to +2.0 mm, except for BWNR, which is +7.5 mm. The values of CC and bias for the desert station (SGGN) are 0.88 and −1.4 mm respectively. The desert station RMSE, CC and bias are 3.37 mm, 0.98 and −1.74 mm respectively (Table 5).
The correlation coefficient of IPWV varies from 0.74 to 0.97 for all the stations except JIPR (0.16) and BWNR (0.29) for the pre-monsoon season. IPWV retrieved from CAMS reanalysis with respect to GNSS IPWV has the negative bias range from −7.28 to −0.28 mm, which indicates an underestimation of IPWV at the stations of ARGD, DELH, NGPR, PUNE, RIPR, KRKL, MPTM, DWRK, GOPR, TRVM and SGGN. The stations DBGH, JBPR, JIPR, JPGI, KYKM, PNJM and BWNR have the positive bias range from 0.61 to 13.88 mm, which indicates an overestimation of IPWV by CAMS during the pre-monsoon season. RMSE ranges between 2.27 and 8.28 mm except for BWNR (16.50 mm) (Table 6).
Table 6Statistical seasonal analysis of retrievals of IPWV from CAMS and GNSS data. NaN indicates no availability of observational data.

The correlation coefficient of IPWV varies from 0.73 to 0.96 for all the stations during the monsoon season except PNJM (0.38). The stations ARJD, JPGI, PUNE, RIPR, TRVM and SGGN have the negative bias range from −0.51 to −7.28 mm, which indicates the underestimation of IPWV by CAMS reanalysis as compared to DBGH, DELH, NGPR, JBPR, JIPR, KRKL, KYKM, MPTM, DWRK, GOPR and PNJM, which have the positive bias range from 0.03 to 6.60 mm during the monsoon season. RMSE ranges from 2.30 to 11.41 mm. Data are not available at the stations of BHPL and BWNR (Table 6).
The correlation coefficient of IPWV varies from 0.86 to 0.99 for all the stations during the post-monsoon season except NGPR (0.50). The stations ARJD, DELH, JBPR, JIPR, JPGI, PUNE, RIPR, KRKL, MPTM, DWRK, TRVM and SGGN have the negative bias range from −0.47 to −6.32 mm, which indicates the underestimation of IPWV by CAMS reanalysis as compared to DBGH, NGPR, KYKM, GOPR and PNJM, which have the positive bias range from 0.01 to 7.23 mm during the post-monsoon season. RMSE ranges from 3.35 to 8.05 mm except for NGPR (16.06 mm) (Table 6). During this transition time most parts of the Indian region remain gradually dry and decrease in water content as compared to the northeast and southern parts of India. It was observed in this analysis during the post-monsoon season that for stations located in dry/wet regions of India the CAMS data under-/overestimate IPWV with respect to GNSS.
The correlation coefficient of IPWV varies from 0.87 to 0.97 for all the stations during the winter season except DBGH (0.49), JIPR (0.58) and BWNR (0.16). The stations ARJD, DBGH, DELH, NGPR, JBPR, JIPR, JPGI, PUNE, RIPR, KRKL, KYKM, MPTM, DWRK, GOPR, TRVM and SGGN have the negative bias range from −0.03 to −4.10 mm, which indicates the underestimation of IPWV by CAMS reanalysis as compared to BWNR, which has a positive bias of 0.60 mm during the winter season. RMSE ranges from 1.74 to 9.48 mm (Table 6).
During the winter season over the Indian region, local effects which play an important role moisture development are suppressed from their importance due to sparse observation network data and optimization of random and systematic errors, which are further utilized for effective improvement in model predictions (Inness et al., 2019).
CAMS data used in this study have consistent and homogeneous spatial resolution with reduced bias, with better performance of model physics and dynamics due to assimilation of new data sets (Inness et al., 2019). However, over Indian domains during the pre-monsoon season, land stations are mainly affected by local convective developments of a shorter timescale of a few hours, which is not captured by the CAMS data, and a dry bias prevails in most of the stations mentioned above.
Few GNSS data are assimilated for the Indian region in the latest CAMS data sets. During the monsoon season six stations mentioned above underestimate IPWV with CAMS data due to complex and rugged topographic terrains which are not well captured in CAMS data due to very few observations being available in these locations. In almost all other stations IPWV values are overestimated as the global features of monsoon flow are well captured by the CAMS data. The similar findings (overestimate or underestimate) are also observed with GNSS data for the abovementioned stations except for PNJM and BWNR, where the meteorological sensor gets replaced 2 to 3 times during the year of 2018. The standard deviation (SD) between CAMS reanalysis and Indian GNSS retrievals is more dispersed from their mean values (Fig. 5).
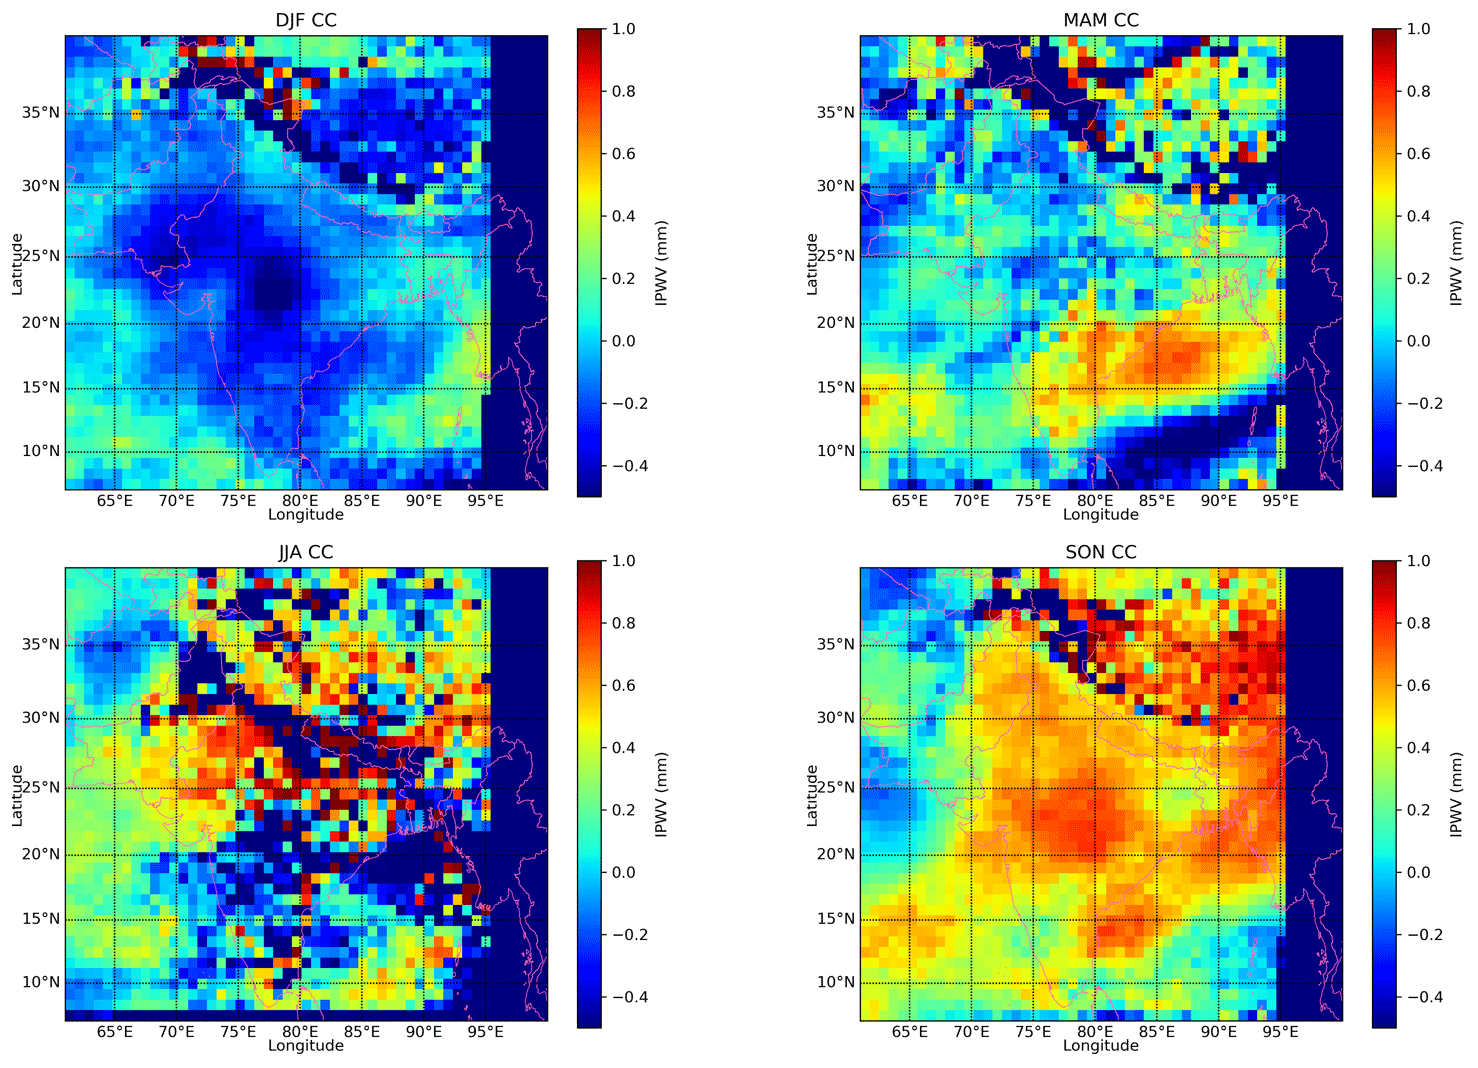
Figure 6Seasonal correlation coefficient of CAMS and INSAT-3DR data.
3.3 Intercomparison of CAMS reanalysis and INSAT-3DR IPWV
The correlation coefficient (CC) is computed between INSAT-3DR and CAMS reanalysis, and IPWV retrievals are negatively correlated in almost entire the land area, except for pockets of the Indo-Gangetic Plain (IGP) of the Indian region for winter months. The computed value of CC lies within the range from 0.2 to −0.5 in the land area. Over ocean retrievals the values of CC are slightly positive (0.0 to 0.5) in the entire area of the Bay of Bengal and the Arabian Sea except for the offshore area on both the east and west side in winter months (Fig. 6). This poor resemblance between the results (INSAT-3DR and CAMS) may be due to the interpolated values of coarser-resolution CAMS data. INSAT-3DR satellite-based data have diverse, covariant information content, different temporal coverage and lower ability with respect to representative observations in CAMS.
In the pre-monsoon season the value of CC between INSAT-3DR and CAMS reanalysis retrievals is positive (0.0 to 0.6) over the entire oceanic areas of the Bay of Bengal and the Arabian Sea except for a few patches in the Arabian Sea. Over land the values are slightly positive (0.0 to 0.2) in many areas and slightly negative (0.0 to −0.3) for pockets of the northwest and central India region (Fig. 6).
During the monsoon month the value of CC over the land area is mostly positively correlated (0.0 to 0.7) except for the belt of the monsoon trough and south India, which have shown an appreciably low value of CC (−0.3 to −0.5). This might be due to the presence of clouds on both sides of the monsoon trough and the southern belt of India during the monsoon season (Fig. 6).
In post-monsoon season months the value of CC between INSAT-3DR and CAMS reanalysis retrievals is positive (0.0 to 0.7) for both land and oceanic areas almost entirely except for some areas of north of the Bay of Bengal and the southeast Arabian Sea (Fig. 6).

Figure 7Seasonal bias of IPWV between CAMS and INSAT-3DR.
The differences in the magnitude and sign of CC of INSAT-3DR with respect to CAMS reanalysis IPWV may be due to a lack of assimilation of quality-controlled data over the Indian domain. This may be due to limitations of the design of the instrument/sensor on board INSAT-3DR or the retrieval algorithm of IPWV. Therefore, it will affect the overall collocations in matchup data sets.
During the winter season, positive biases ranges from 0.0 to 5.0 mm as observed between the CAMS reanalysis and INSAT-3DR IPWV, which indicate an overestimation of CAMS IPWV over the land and oceanic region, except for the east and west coast of India including the Arabian Sea (12 to 28∘ N), some pockets of the southeast Bay of Bengal (BoB) and the Himalayan region that range from −2.5 to −5.0 mm, which indicates an underestimation of CAMS IPWV (Fig. 7).
During the pre-monsoon season, positive biases range from 0.0 to 10.0 mm, observed between CAMS reanalysis and INSAT-3DR IPWV, which indicates an overestimation of CAMS IPWV over the land and oceanic region, except for some parts of the northwest of the Arabian Sea and the Himalayan region that range from −0.0 to −3.0 mm, which indicates an underestimation of CAMS IPWV (Fig. 7).
During the monsoon season, positive biases range from 2.5 to 10.0 mm, observed between CAMS reanalysis and INSAT-3DR IPWV, which indicates an overestimation of CAMS IPWV over the land and oceanic region, except for the Himalayan region that ranges from −2.5 to −5.0 mm, which indicates an underestimation of CAMS IPWV (Fig. 7).
During the post-monsoon season, positive biases range from 0.0 to 6.0 mm, observed between CAMS reanalysis and INSAT-3DR IPWV, which indicates an overestimation of CAMS IPWV over the land and oceanic region, except for the Arabian Sea (19 to 29∘ N) and Himalayan regions that range from −2.5 to −6.0 mm, which indicates an underestimation of CAMS IPWV (Fig. 7).

Figure 8Seasonal RMSE between CAMS and INSAT-3DR.
The IPWV retrieved from CAMS reanalysis overestimated with respect to INSAT-3DR IPWV over the land and oceanic regions for all the seasons except the Himalayan region and some parts of Arabian Sea and BoB. This occurred because the infrared and microwave radiometer observations of land and oceans had been assimilated into the model, which has the higher systematic humidity when compared with radiosonde data (Andersson et al., 2007). Underestimation of CAMS IPWV compared with INSAT-3DR over the Himalayan region may be due to presence of rugged terrain/orographic features in the retrieval of IPWV.
RMSE values during the winter season range from 7.5 to 13.0 mm over the land region (20 to 35∘ N) and the entire Arabian Sea. Above 35∘ N latitude including Himalayan region, RMSE values are less than 7.5 mm. RMSE values observed over the southern peninsula of India and BoB region range from 13 to 20 mm (Fig. 8).
RMSE values during the pre-monsoon season range from 2.5 to 13.0 mm over the land region (18 to 40∘ N), the Arabian Sea and the Himalayan region observed. RMSE values range from 13 to 20 mm over the southern peninsula of India, the Indo-Gangetic Plain (IGP) and the BoB region (Fig. 8).
RMSE values during the monsoon season range from 14.0 to 20.0 mm over the land region (20 to 35∘ N) including the northwest of the Arabian Sea and northeast of BoB. Above 35∘ N latitude, southwest and southeast of the Arabian Sea including the southeast of BoB and the Himalayan region, RMSE values are less than 8.0 mm (Fig. 8).
RMSE values during the post-monsoon season were less than 7.5 mm as observed over the land region including both the Arabian Sea and BoB region, except for the Indo-Gangetic Plain (IGP) and northeast of the BoB range, which range from 13 to 17 mm (Fig. 8).
Seasonal RMSE values between CAMS reanalysis and INSAT-3DR (CAMS-INSAT) retrievals are higher (> 15 mm) over the Bay of Bengal and pockets of the Indo-Gangetic Plain (IGP), northeast (NE) India, southern parts of India, the North Indian Ocean and the Arabian Sea during the pre-monsoon, monsoon, and post-monsoon season and (< 15 mm) during the winter season. Higher values of RMSE prevail over the regions of higher moisture availability or water content in the atmosphere (Fig. 8).
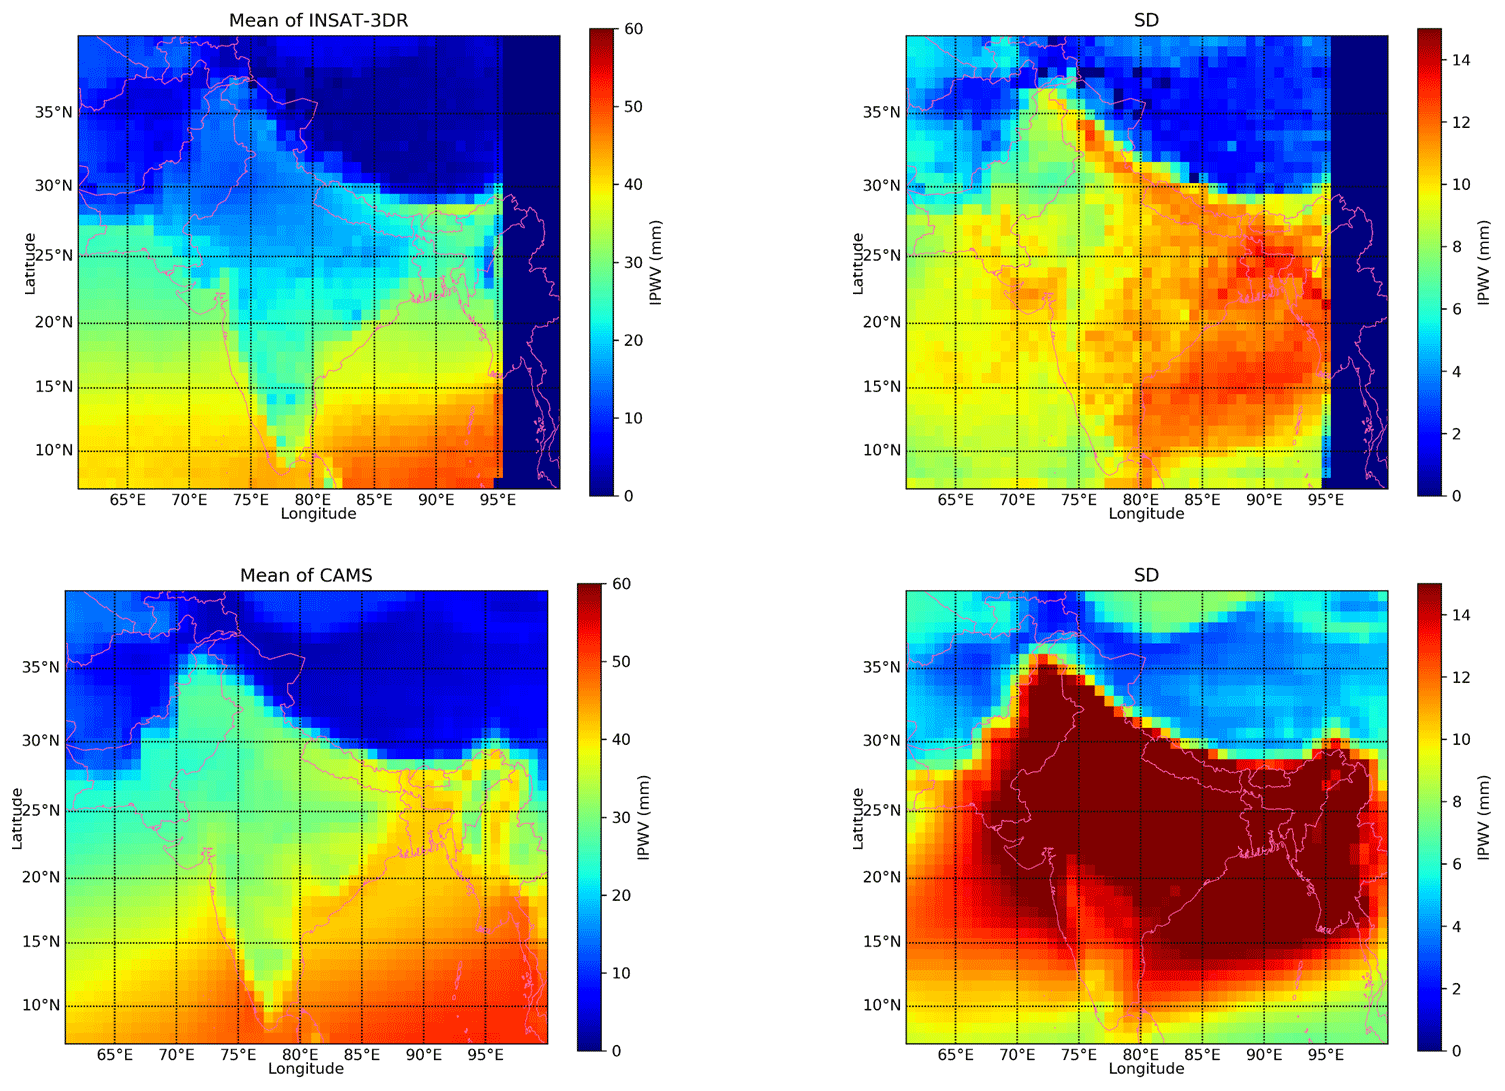
Figure 9Means and SD of INSAT-3DR and CAMS IPWV for the year 2018.
3.4 Distribution and variability of IPWV retrieved from INSAT-3DR and CAMS reanalysis
The annual mean value and standard deviation of both the retrievals INSAT-3DR sounder and CAMS reanalysis data sets are presented in Fig. 9. The standard deviations of CAMS reanalysis retrieval data set are appreciably high (0.0 to 14 mm) in both land and ocean areas as compared to INSAT-3DR retrievals. This variation of higher spread from mean values may be due to the drier bias present in the CAMS reanalysis data sets (Inness et al., 2019) with coarser resolution as compared to INSAT-3DR retrievals.
The mean IPWV values vary in the range of 0–50 mm depending upon the region and prevailing weather system affected throughout the year. Larger mean IPWVs occur in the coastal regions of Indian Ocean regions compared to inland and desert regions due to warm air conditions as compared to inland and ocean. The south foothill of the Himalayas has the largest IPWV variation with a SD ∼ 16 mm (Fig. 9). This is attributed to the monsoon season that results in large changes in precipitation at different seasons in these regions. The seasonal distribution of mean IPWV and standard deviation of CAMS and INSAT-3DR for monsoon and post-monsoon increased in CAMS data as compared to INSAT-3DR retrievals due to wet bias present in the CAMS data sets (Fig. 10).

Figure 10Seasonal means and SDs of INSAT-3DR and CAMS-retrieved IPWV for the year 2018.
Over the oceanic region, the seasonal mean IPWV of INSAT-3DR and CAMS ranges from 25 to 40 mm (with standard deviation 6–15 mm) and from 20 to 45 mm (SD 6–16 mm), and it is less than 25 mm with a SD of less than 6 mm for both INSAT-3DR and CAMS IPWV over the land region during the winter season (Fig. 10).
Over the oceanic region, the seasonal mean IPWV of INSAT-3DR and CAMS ranges from 30 to 45 mm (with standard deviation 7–12 mm) and from 35 to 55 mm (SD 10–16 mm). Over the land region, the seasonal mean IPWV of INSAT-3DR and CAMS data ranges from 15 to 38 mm with a SD of 2–10 and from 20 to 40 mm with SD of 5–12 mm respectively during the pre-monsoon season (Fig. 10).
Seasonal mean IPWV of INSAT-3DR ranges from 30 to more than 60 mm with a SD of 2–14 mm and from 50 to more than 60 mm with a SD of 4–16 mm for CAMS IPWV observed for both land and ocean regions during the monsoon season (Fig. 10).
Over the oceanic region, the seasonal mean IPWV of INSAT-3DR and CAMS ranges from 35 to 55 mm (with SD of 6–10 mm) and from 38 to 55 mm (SD of 6–14 mm), and over the land region the mean IPWV of INSAT-3DR and CAMS data ranges from 15 to 35 mm with SD of 5–12 and from 20 to 40 mm with SD of 10–16 mm during the post-monsoon season (Fig. 10).
The standard deviations values are higher over ocean as compared to land areas in every season except the post-monsoon season (Fig. 10).
It is noticed that seasonal correlation coefficient (CC) values between INSAT-3DR and Indian GNSS data mainly lie within the range of 0.50 to 0.98 for all the selected 19 stations except Thiruvananthapuram (0.1), Kanyakumari (0.31) and Karaikal (0.15) during the monsoon season and Panjim (0.2) during the post-monsoon season. The seasonal CC values between CAMS and GNSS IPWV range from 0.73 to 0.99, except for Jaipur (0.16) and Bhubaneswar (0.29) during the pre-monsoon season, Panjim (0.38) during the monsoon season, Nagpur (0.50) during the post-monsoon season, and Dibrugarh (0.49), Jaipur (0.58) and Bhubaneswar (0.16) during the winter season.
The RMSE values increase significantly under the wet conditions (pre-monsoon and monsoon season) than under dry conditions (post-monsoon and winter season), and we found differences in the magnitude and sign of the bias of INSAT-3DR and CAMS with respect to GNSS IPWV from station to station and season to season.
Large-scale features of moisture flow are generally captured in CAMS reanalysis data, except for localized features due to sparseness or very few number of the quality-controlled ground and satellite data sets assimilated in the CAMS data over the Indian region.
The differences in the magnitude and sign of CC of INSAT-3DR with respect to CAMS reanalysis IPWV may be due to a lack of assimilation of quality-controlled data over the Indian domain. This may be due to limitations of the design of the instrument/sensor on board INSAT-3DR or retrieval algorithm of IPWV. Therefore, it will affect the overall collocations in matchup data sets.
The IPWV retrieved from CAMS reanalysis overestimated with respect to INSAT-3DR IPWV over the land and oceanic region for all the seasons except the Himalayan region and some parts of the Arabian Sea and BoB. This occurred because the infrared and microwave radiometer observations of land and oceans had been assimilated into the model, which has the higher systematic humidity when it was compared with radiosonde data (Andersson et al., 2007). Underestimation of CAMS IPWV compared with INSAT-3DR over the Himalayan region may be due to the presence of rugged terrain/orographic features in the retrieval of IPWV.
Seasonal RMSE values between CAMS reanalysis and INSAT-3DR (CAMS-INSAT) retrievals are higher (> 15 mm) over the Bay of Bengal and pockets of the Indo-Gangetic Plain (IGP), northeast (NE) India, southern parts of India, the North Indian Ocean and the Arabian Sea during the pre-monsoon, monsoon, and post-monsoon season and (< 15 mm) during the winter season. Higher values of RMSE prevail over the regions of higher moisture availability or water content in the atmosphere.
The mean IPWV values vary in the range of 0–50 mm depending upon the region and prevailing weather system affected throughout the year. Larger mean IPWVs occur in the coastal regions of the Indian Ocean compared to inland and desert regions due to warm air conditions as compared to inland and ocean. The south foothill of the Himalayas has the largest PWV variation with a SD ∼ 16 mm.
This study will help to improve understanding regarding the representation of uncertainties associated with land, coastal and desert locations in terms of the seasonal flow of IPWV, which is an essential integrated variable in forecasting applications.
The code was developed and customized by Trimble Europe B.V. and is not publicly available.
The data supply portal of INSAT as well as GNSS data is under the final phase of its development and will be available to the public soon. The data will be available as per the data policy.
RY was responsible for the conceptualization, methodology, formal analysis, visualization, software, and data curation. RKG was responsible for writing the original draft, supervision, and review and editing. VS was responsible for supervision and review and editing.
The authors declare that they have no conflict of interest.
Publisher's note: Copernicus Publications remains neutral with regard to jurisdictional claims in published maps and institutional affiliations.
This article is part of the special issue “Analysis of atmospheric water vapour observations and their uncertainties for climate applications (ACP/AMT/ESSD/HESS inter-journal SI)”. It is not associated with a conference.
Authors are grateful to Mrutyunjay Mohapatra (Director General of Meteorology) for providing data and support to accomplish this work, and the authors are also thankful to the CAMS global website data store (https://ads.atmosphere.copernicus.eu, last access: 28 May 2020) for providing the data for this study.
This paper was edited by Daniel Perez-Ramirez and reviewed by four anonymous referees.
Andersson, E., Holm, E., Bauer, P., Beljaars, S., Kelly, G. A., McNally, A. P., Simmons, A. J., Thepaut, J. N., and Tompkins, A. M.: Analysis and forecast impact of the main humidity observing systems, Q. J. R. Meterol. Soc., 133, 1473–1485, 2007.
Aumann, H. H., Chahine, M. T., Gautier, C., Goldberg, M. D., Kalnay, E., McMillin, L. M., and Revercomb, H.: AIRS/AMSU/HSB on the Aqua mission: Design, science objectives, data products, and processing systems, IEEE Trans. Geosci. Remote Sens., 41, 253–264, 2003.
Beirle, S., Lampel, J., Wang, Y., Mies, K., Dörner, S., Grossi, M., Loyola, D., Dehn, A., Danielczok, A., Schröder, M., and Wagner, T.: The ESA GOME-Evolution “Climate” water vapor product: a homogenized time series of H2O columns from GOME, SCIAMACHY, and GOME-2, Earth Syst. Sci. Data, 10, 449–468, https://doi.org/10.5194/essd-10-449-2018, 2018.
Berrisford, p., Kallberg, P., Kobayashi, S., Dee, D., Uppala S., Simmons, A. J., Poli, P., and Sato, H.: Atmospheric conservation properties in ERA-Interim, Q. J. R. Meterol. Soc., 137, 1381–1399, 2011.
Bevis, M., Businger, S., Herring, T. A., Rocken, C., Anthes, R. A., and Ware, R.: GPS Meteorology: remote sensing of atmospheric water vapor using the Global Positioning System, J. Geophys. Res., 97, 15787–15801, 1992.
Bevis, M., Businger, S., and Chiswell, S.: GPS meteorology: Mapping zenith wet delays on to precipitable water, J. Appl. Meteorol., 33, 379–386, 1994.
Businger, T., Herring, A., Rocken, C., Anthes, R. A., and Ware, R. H.: GPS Meteorology: Remote Sensing of Atmospheric Water Vapor Using the Global Positioning System, J. Geophys. Res., 97, 15787, https://doi.org/10.1029/92JD01517, 1992.
Courcoux, N. and Schröder, M.: Vertically integrated water vapour, humidity and temperature at pressures levels and layers from ATOVS-daily means/monthly means, Satellite Application Facility on Climate Monitoring, https://doi.org/10.5676/EUM_SAF_CM/WVT_ATOVS/V001, 2013.
Emardson, T. R., Elgered, G., and Johansson, J. M.: Three months of continuous monitoring of atmospheric water vapor with a network of global positioning system receivers, J. Geophys. Res., 103, 1807, https://doi.org/10.1029/97JD03015, 1998.
Falaiye, O. A., Abimbola, O. J., Pinker, R. T., Perez-Ramirez, D., and Willoughby, A. A.: Multi-technique analysis of precipitable water vapor estimates in the sub-Sahel West Africa, Heliyon, 4, e00765, https://doi.org/10.1016/j.heliyon.2018.e00765, 2018.
Gelaro, R., McCarty, W., Suarez, M. J., Todling, R., Molod, A., Takacs, L., Randles, C. A., Darmenov, A., Bosilovich, M. G., Reichle, R., Wargan, K., Coy, L., Cullather, R., Draper, C., Akella, S., Buchard, V., Conaty, A., Da Silva, A. M., Gu, W., Kim, G.-K., Koster, R., Lucchesi, R., Merkova, D., Nielsen, J. E., Partyka, G., Pawson, S., Putman, W., Rienecker, M., Schubert, S. D., Sienkiewicz, M., and Zhao, B.: The Modern-Era Retrospective Analysis for Research and applications, Version 2 (MERRA-2), J. Climate, 30, 5419–5454, 2017.
Ichoku, C., Remer, L. A., and Eck, T. F.: Quantitative evaluation and intercomparison of morning and afternoon Moderate Resolution Imaging Spectroradiometer (MODIS) aerosol measurements from Terra and Aqua, J. Geophys. Res., 110, D10S03, https://doi.org/10.1029/2004JD004987, 2005.
Inness, A., Ades, M., Agustí-Panareda, A., Barré, J., Benedictow, A., Blechschmidt, A.-M., Dominguez, J. J., Engelen, R., Eskes, H., Flemming, J., Huijnen, V., Jones, L., Kipling, Z., Massart, S., Parrington, M., Peuch, V.-H., Razinger, M., Remy, S., Schulz, M., and Suttie, M.: The CAMS reanalysis of atmospheric composition, Atmos. Chem. Phys., 19, 3515–3556, https://doi.org/10.5194/acp-19-3515-2019, 2019.
INSAT-3D ATBD: Algorithm Theoretical Basis Development Document, available at: https://mosdac.gov.in/data/doc/INSAT_3D_ATBD_MAY_2015.pdf (last access: 20 May 2020), 2015.
Jade, S. and Vijayan, M. S. M.: GPS-Based Atmospheric Precipitable Water Vapor Estimation Using Meteorological Parameters Interpolated from NCEP Global Reanalysis Data, J. Geophys. Res.-Atmos., 113, 1–12, https://doi.org/10.1029/2007JD008758, 2008.
Jade, S., Vijayan, M. S. M., Gaur, V. K., Prabhu, T. P., and Sahu, S. C.: Estimates of Precipitable Water Vapour from GPS Data over the Indian Subcontinent, J. Atmos. Sol.-Terr. Phy., 67, 623–635, https://doi.org/10.1016/j.jastp.2004.12.010, 2005.
Jiang, J., Zhou, T., and Zhang, W.: Evaluation of satellite and reanalysis precipitable water vapor data sets against radiosonde observations in central Asia, Earth and Space Science, 6, 1129–1148, https://doi.org/10.1029/2019EA000654, 2019.
Kaufman, Y. J. and Gao, B.-C.: Remote sensing of water vapor in the near IR from EOS/MODIS, IEEE T. Geosci. Remote, 30, 871–884, 1992.
Kishtawal, C. M.: Use of satellite observations for weather prediction, Mausam, 70, 709–724, 2019.
Lee, S. J., Ahn, M. H., and Lee, Y.: Application of an artificial neural network for a direct estimation of atmospheric instability from a next-generation imager, Adv. Atmos. Sci., 33, 221–232, 2016.
Lee, Y. K., Li, J., Li, Z., and Schmit, T.: Atmospheric temporal variations in the pre-landfall environment of typhoon Nangka observed by the Himawari-8 AHI, Asia-Pac. J. Atmos. Sci., 53, 431–443, 2015.
Liu, Z., Min, M., Li, J., Sun, F., Di, D., Ai, Y., Li, Z., Qin, D., Li, G., and Lin, Y.: Local Severe Storm Tracking and Warning in Pre-Convection Stage from the New Generation Geostationary Weather Satellite Measurements, Remote Sens., 11, 383, https://doi.org/10.3390/rs11040383, 2019.
Martinez, M. A., Velazquez, M., Manso, M., and Mas, I.: Application of LPW and SAI SAFNWC/MSG satellite products in pre-convective environments, Atmos. Res., 83, 366–379, 2007.
Miloshevich, L. M., Vömel, H., Whiteman, D. N., and Leblanc, T.: Accuracy assessment and correction of Vaisala RS92 radiosonde water vapor measurements, J. Geophys. Res., 114, D11305, https://doi.org/10.1029/2008JD011565, 2009.
Noël, S., Mieruch, S., Bovensmann, H., and Burrows, J. P.: Preliminary results of GOME-2 water vapour retrievals and first applications in polar regions, Atmos. Chem. Phys., 8, 1519–1529, https://doi.org/10.5194/acp-8-1519-2008, 2008.
Ortiz de Galisteo, J. P., Cachorro, V., Toledano, C., Torres, B., Laulainen, N., Bennouna, Y., and de Frutos, A.: Diurnal Cycle of Precipitable Water Vapor over Spain, Q. J. R. Meteorol. Soc., 137, 948–958, https://doi.org/10.1002/qj.811, 2011.
Pérez-Ramírez, D., Whiteman, D. N., Smirnov, A., Lyamani, H., Holben, B. N., Pinker, R., Andrade, M., and Alados-Arboledas, L.: Evaluation of AERONET precipitable water vapor versus microwave radiometry, GPS, and radiosondes at ARM sites, J. Geophys. Res.-Atmos., 119, 9596–9613, 2014.
Perez Ramirez, D., Smirnov, A., Pinker, R. T., Petrenko, M., Roman, R., Chen, W., Ichoku, C., Noël, S., Gonzalez Abad, G., Lyamani, H., and Holben, B.: Precipitable water vapor over oceans from the Maritime Aerosol Network: Evaluation of global models and satellite products under clear sky conditions, Atmos. Res., 215, 294–304, 2019.
Puviarasan, N., Sharma, A. K., Ranalkar, M., and Giri, R. K.: Onset, advance and withdrawal of southwest monsoon over Indian subcontinent: A study from precipitable water measurement using ground based GPS Receivers, J. Atmos. Sol.-Terr. Phy., 122, 45–57, https://doi.org/10.1016/j.jastp.2014.10.010, 2014.
Puviarasan, N., Yadav, R., Giri, R. K., and Singh, V.: GPS Meteorology: Error in the estimation of precipitable water by ground based GPS system in some meso-scale thunderstorms – A case study, Mausam, 71, 175–186, 2020.
Saha, S.: The NCEP climate forecast system reanalysis, Bull. Am. Meteorol. Soc., 91, 1015–1057, 2010.
Smirnov, A., Holben, B. N., Lyapustin, A., Slutsker, I., and Eck, T. F.: AERONET processing algorithms refinement, Proceedings of AERONET workshop, 10–14 May 2004, El Arenosillo, Spain, NASA/GSFC Aeronet project, 2004.
Smirnov, A., Holben, B. N., Giles, D. M., Slutsker, I., O'Neill, N. T., Eck, T. F., Macke, A., Croot, P., Courcoux, Y., Sakerin, S. M., Smyth, T. J., Zielinski, T., Zibordi, G., Goes, J. I., Harvey, M. J., Quinn, P. K., Nelson, N. B., Radionov, V. F., Duarte, C. M., Losno, R., Sciare, J., Voss, K. J., Kinne, S., Nalli, N. R., Joseph, E., Krishna Moorthy, K., Covert, D. S., Gulev, S. K., Milinevsky, G., Larouche, P., Belanger, S., Horne, E., Chin, M., Remer, L. A., Kahn, R. A., Reid, J. S., Schulz, M., Heald, C. L., Zhang, J., Lapina, K., Kleidman, R. G., Griesfeller, J., Gaitley, B. J., Tan, Q., and Diehl, T. L.: Maritime aerosol network as a component of AERONET – first results and comparison with global aerosol models and satellite retrievals, Atmos. Meas. Tech., 4, 583–597, https://doi.org/10.5194/amt-4-583-2011, 2011.
Susskind, J., Barnet, C. D., and Blaisdell, J. M.: Retrival of atmospheric and surface parameters from AIRS/AMSU/HSB data in the presense of clouds, IEEE Trans. Geosci. Remote Sens., 41, 390–409, 2003.
Susskind, J., Barnet, C., blaisdell, J., Iredell, L., Keita, F., Kouvaris, L., Molnar, G., and Chahinnes, M.: Accuracy of geophysical parameters derived atmospheric Infrared Sounder/ Advanced Microwave Sounding Unit as a function of fraction cloud cover, J. Geophys. Res., 111, D09S17, https://doi.org/10.1029/2005JD006272, 2006.
Trenberth, K. E., Dai, A., Rasmussen, R. M., and Parsons, D. B.: The changing character of precipitation, Bull. Am. Meteorol. Soc., 84, 1205–1218, 2003.
Turner, D. D., Lesht, B. M., Clough, S. A., Liljegren, J. C., Revercomb, H. E., and Tobin, D. C.: Dry bias and variability in Vaisala RS80-H radiosondes: The ARM experience, J. Atmos. Ocean. Tech., 20, 117–132, 2003.
Venkat Ratnam, M., Hemanth Kumar, A., and Jayaraman, A.: Validation of INSAT-3D sounder data with in situ measurements and other similar satellite observations over India, Atmos. Meas. Tech., 9, 5735–5745, https://doi.org/10.5194/amt-9-5735-2016, 2016.
Viswanadham, Y.: The relationship between total precipitable water and surface dew point, J. Appl. Meteorol, 20, 3–8, 1981.
Wagner, T., Beirle, S., Grzegorski, M., and Platt, U.: Global trends (1996–2003) of total coloumn precipitable water observed by Global azone monitoring Experiment (GOME) on ERS-2 and their relation to near-surface temperature, J. Geophys. Res., 111, D12102, https://doi.org/10.1029/2005JD006523, 2006.
Yadav, R., Puviarasan, N., Giri, R. K., Tomar, C. S., and Singh, V.: Comparison of GNSS and INSAT-3D sounder retrieved precipitable water vapour and validation with the GPS Sonde data over Indian Subcontinent, MAUSAM, 71, 1–10, available at: https://mausamjournal.imd.gov.in/index.php/MAUSAM/article/view/1, last access: 20 May 2020.