the Creative Commons Attribution 4.0 License.
the Creative Commons Attribution 4.0 License.
 | 04 Jan 2021
The development of rainfall retrievals from radar at Darwin
Scott Collis
Valentin Louf
Alain Protat
Scott Giangrande
Elizabeth J. Thompson
Brenda Dolan
Scott W. Powell
The U.S. Department of Energy Atmospheric Radiation Measurement program Tropical Western Pacific site hosted a C-band polarization (CPOL) radar in Darwin, Australia. It provides 2 decades of tropical rainfall characteristics useful for validating global circulation models. Rainfall retrievals from radar assume characteristics about the droplet size distribution (DSD) that vary significantly. To minimize the uncertainty associated with DSD variability, new radar rainfall techniques use dual polarization and specific attenuation estimates. This study challenges the applicability of several specific attenuation and dual-polarization-based rainfall estimators in tropical settings using a 4-year archive of Darwin disdrometer datasets in conjunction with CPOL observations. This assessment is based on three metrics: statistical uncertainty estimates, principal component analysis (PCA), and comparisons of various retrievals from CPOL data.
The PCA shows that the variability in R can be consistently attributed to reflectivity, but dependence on dual-polarization quantities was wavelength dependent for . These rates primarily originate from stratiform clouds and weak convection (median drop diameters less than 1.5 mm). The dual-polarization specific differential phase and differential reflectivity increase in usefulness for rainfall estimators in times with . Rainfall estimates during these conditions primarily originate from deep convective clouds with median drop diameters greater than 1.5 mm. An uncertainty analysis and intercomparison with CPOL show that a Colorado State University blended technique for tropical oceans, with modified estimators developed from video disdrometer observations, is most appropriate for use in all cases, such as when (stratiform rain) and when (deeper convective rain).
- Article
(2861 KB) - Full-text XML
- BibTeX
- EndNote


Robert Jackson and Scott Collis' copyright for this publication is transferred to the Argonne National Laboratory.
Accurate rainfall accumulation and rate estimates are crucial for validating global circulation model (GCM) simulations of precipitation and for nowcasting, severe weather alert issuing, and climatology. A known problem of many GCMs, including the U.S. Department of Energy's Earth Energy Exascale System Model (E3SM), is that GCMs do not adequately resolve the phase and magnitude of the diurnal cycle of precipitation (Golaz et al., 2019). This is due to the fact that GCMs parameterize convection rather than explicitly resolve it (Del Genio, 2012). Multidecadal datasets, such as those recorded at the U.S. Department of Energy's Atmospheric Radiation Measurement (ARM) program's Tropical Western Pacific (TWP) site in Darwin, Australia (Keenan et al., 1998; Mather et al., 2016; Long et al., 2016), provide unique opportunities to develop climatologies and process-level parameterization constraints for GCM simulations. For example, Kumar et al. (2013), Rauniyar and Walsh (2016), and Jackson et al. (2018) have previously developed climatologies of radar-estimated cloud top heights from 17 years of C-band polarization (CPOL) data at the ARM TWP site to be used for validation of E3SM. Dolan et al. (2013) also identified the hydrometeor types present in the clouds and precipitation sampled by CPOL over seven seasons.
In addition to cloud-top height and hydrometeor type datasets, long-term datasets of accurate rainfall accumulations and rates are also useful for evaluating or improving convective parameterizations in E3SM and other GCMs (Tang et al., 2019). The aforementioned CPOL dataset provides 17 wet seasons of precipitation characteristics in tropical convection, so developing rainfall estimates from ARM radars in TWP aids model validation. However, developing a suitable rainfall rate (R) climatology or similar rain accumulation statistics from a single radar dataset is a nontrivial task. Several different methodologies exist for measuring or estimating rainfall accumulations and/or instantaneous rainfall rates. For instance, at the ARM TWP site, rain gauges and disdrometers provide estimates of rainfall rate and collect individual particle statistics. Even if a perfect rainfall estimation method is determined, using such data for climatological-scale analysis is complicated by the fact that the rainfall experienced at TWP is not representative of the spatial variability in rainfall rate over GCM-scale domains O([20–100 km]). In contrast, scanning radars such as the CPOL may estimate rainfall accumulations over a wider spatial domain O([100–150 km]) with a horizontal resolution of O([100 m]) (e.g., Keenan et al., 1998).
However, scanning radars typically retrieve R using empirical power-law relationships between R and the radar observables, which may be subject to uncertainty contingent on the representativeness of these fits. These relations often utilize conventional radar quantities such as the radar reflectivity factor Zh and dual-polarization radar quantities such as specific differential phase Kdp and differential reflectivity Zdr. Single-moment and blended empirical relationships are commonplace in the literature (i.e., Marshall and Palmer, 1948; Aydin and Giridhar, 1992; Ryzhkov and Zrnić, 1995; Matrosov, 2005; Matrosov et al., 2006; Wang et al., 2013; Ryzhkov et al., 2014; Thompson et al., 2015, 2018; Wang et al., 2018; Giangrande et al., 2019) and typically developed from simulated radar moments informed by the drop size distributions (DSDs) sampled by disdrometers at various global locations. Recently, studies have attempted to combine the advantageous dual-polarization radar measurement properties more seamlessly into a single radar quantity by estimating the specific attenuation Ah for similar empirical rainfall applications (e.g., Ryzhkov et al., 2014; Giangrande et al., 2014b). Dual-polarization relationships have traditionally been the preferable option for radar rainfall rate estimates, as these have been found less sensitive to potential biases owing to DSD variability, radar miscalibration, partial beam blockage, and/or attenuation in rain (Doviak and Zrnić, 1993; Bringi and Chandrasekar, 2001; Ryzhkov et al., 2005). Nevertheless, single- and/or dual-polarization power-law relationships are often sensitive to the underlying differences in DSD observations used to develop those relationships, which vary over different regions of the globe due to the changing nature for dominant cloud dynamical–microphysical processes (Bringi et al., 2003, 2009; Dolan et al., 2018). Similar issues are also anticipated for newer radar rainfall algorithm concepts such as machine learning efforts using neural network or Gaussian mixture concepts (e.g., Vulpiani et al., 2009; Li et al., 2012) that are trained and/or validated with DSD observations subject to comparable limitations.
An important consideration for applying radar rainfall methods to different regions across the globe is that the majority of the aforementioned rainfall studies have emphasized the properties of midlatitude continental clouds and often over relatively modest data records (i.e., tens of events). For many practical hydrological applications, the best references are those for NOAA’s S-band (10 cm wavelength) Next Generation Weather Radar (NEXRAD), with most operational relations weighted towards Oklahoma, Florida, Colorado, and/or deeper convective cloud conditions (Ryzhkov et al., 2005). The relative absence of extended, ground-based rainfall retrieval validation datasets outside of midlatitude regions poses several challenges for potential global rainfall applications and possible model evaluation. The Department of Energy (DOE) Atmospheric Radiation Measurement (ARM) facility operates multiple fixed sites in distinct global regimes, including the Darwin TWP site, Oklahoma Southern Great Plains (SGP) site (Sisterson et al., 2016), and Eastern North Atlantic (ENA) site in the Azores (Giangrande et al., 2019). Prior studies that focused on Darwin (Keenan et al., 1998; Bringi et al., 2003, 2009; Thurai et al., 2010) indicate that midlatitude R estimators and DSD variability are less applicable outside of the midlatitudes.
Therefore, as a vital step in providing improved rainfall statistics for model validation, this study focuses on developing R estimators at the C-band and X-band over Darwin, Australia, for the purpose of developing long-term statistics of rainfall estimates from C- and X-band (5 cm/3 cm wavelength) scanning ARM precipitation radars (C/XSAPRs) and CPOL radar at the ARM TWP site (Keenan et al., 1998). Recently, Giangrande et al. (2014b) found that for the ARM SGP site CSAPR during the Midlatitude Continental Convective Clouds Experiment, Kdp-based retrievals generally provide an optimal estimate of rainfall for accumulations greater than 10 mm when compared to Ah-based retrievals. For the tropical oceans, Thompson et al. (2018) showed that the root-mean-square error (RMSE) between the disdrometer- and radar-estimated R at the C-band and X-band was lowest when the Colorado State University (CSU) blended technique for tropical oceans was used with relations formed from tropical DSD measurements. The algorithm, originally developed by Cifelli et al. (2011), uses Zh, Zdr, and/or Kdp as input depending on whether values of these fields are significantly above noise thresholds. In the same study, RMSE was slightly higher for R estimated by Ah at these wavelengths. However, these retrievals were developed using data over Manus and Gan islands. These small atolls experience open-ocean conditions, such that large raindrops from melted hail were rare, even in strong convection (Thompson et al., 2015). For the ARM TWP site in Darwin, deep mixed-phase convection, formed by sea breeze convergence, is common (Rutledge et al., 1992; Williams et al., 1992; May and Rajopadhyaya, 1999; Kumar et al., 2013; May and Ballinger, 2007; Jackson et al., 2018). Therefore, there is greater potential for the impact of cold rain processes (melted hail or graupel that forms large droplets) on determining the surface DSD in Darwin compared to Manus and Gan islands.
Creating accurate multidecadal, climate-research-quality rainfall rate datasets at TWP Darwin at the C- and X-band, as mentioned previously, is useful for evaluating and improving model predictions. Lately, more radar rainfall estimators at shorter wavelengths have been developed. However, these estimators use data from relatively short field campaigns or a handful of case studies of extreme events. In this regard, these efforts are valuable but potentially not well-matched to the challenges of creating multidecadal datasets at TWP Darwin with a mixture of typical and extreme rainfall events. This therefore stresses the importance of further assessing R retrievals for CPOL and other ARM radars at the ARM TWP site for developing such long-term datasets. To accomplish this task, this study uses 4 years of co-located two-dimensional video disdrometer (VDIS) and CPOL data at the ARM TWP site, providing a longer and therefore hopefully more representative dataset than used in prior Darwin-based studies.
This study is organized as follows. In order to provide improved R estimates from ARM radars for Darwin, this study uses simulated radar observables and specific attenuation Ah generated from the VDIS observations collected during tropical convective events over the ARM TWP site. Data and methods are introduced in Sect. 2. Observational results from these data are shown in Sect. 3. Section 4 assesses the importance of Zh, Zdr, Kdp, and Ah, in determining or informing the rainfall rate estimates over this dataset using principal component analysis (PCA). These analyses are performed at the C- and X-band radar wavelengths utilized by the ARM program. To evaluate the C-band-radar-based R estimates, Sect. 4 also compares VDIS rainfall rates against R estimates from CPOL data at the ARM Darwin TWP site. Section 5 includes the main conclusions of this study.
2.1 CPOL
The C-band polarization radar (CPOL) (Keenan et al., 1998) provided plan position indicator (PPI) scans of Z, Zdr, and differential phase ϕdp at elevations of 0.5, 0.9, 1.3, 1.8, 2.4, 3.1, 4.2, 5.6, 7.4, 10.0, 13.3, 17.9, 23.9, 32.0, and 43.1∘ every 10 min from 1998 until 2017 except during 2008 and 2009. Figure 1 shows the location of CPOL and the 2D video disdrometer (VDIS, also referred to as 2DVD). The maximum unambiguous range of CPOL is 150 km. The Python ARM Radar Toolkit (Py-ART) was used to process and visualize the CPOL data (Helmus and Collis, 2016). Clutter and second trip echoes were removed using a technique based on the texture of the Doppler velocity field previously applied to CPOL data by Jackson et al. (2018).
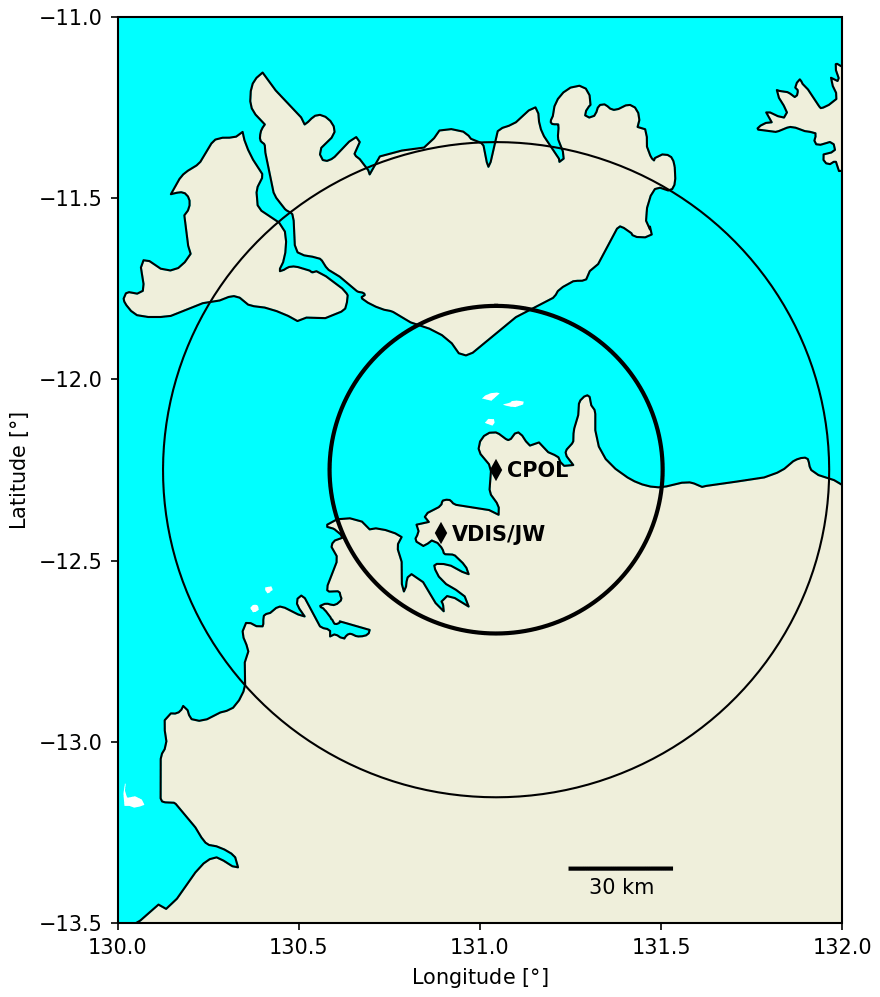
Figure 1Map of CPOL and JW/VDIS locations. Range rings represent distances 50 and 100 km from the radar.
Data from the 2011 to 2015 seasons are used in this study, which correspond to the times VDIS observations were available at the ARM TWP site in Darwin 30 km from CPOL. In total, these datasets correspond to a window in time over which the Darwin location recorded 4884 mm of rainfall. CPOL provides radar variables at 250 m along-gate resolution and 1∘ azimuthal resolution. At 30 km range, the gate dimensions are 250 m by 260 m, much smaller than a convective cell so the effects of nonuniform beam filling should be minimal. In addition, R estimation errors at the C-band due to beam broadening are on the order of 0.2 mm h−1 at a 30 km range (Gorgucci and Baldini, 2015). The comparisons in this paper define the point as the average of the data in radial coordinates from the 0.5∘ PPI scan from the four gates closest to the VDIS. This covers a horizontal distance of 0.5–1 km from the VDIS and is about 0.56 km above the VDIS at ground level and 30 km away from CPOL. This definition is chosen as it is consistent with the scales considered in past comparisons by Ryzhkov et al. (2005) and Giangrande et al. (2014a).
For rainfall retrievals, a robust calibration and attenuation correction of Zh and Zdr are paramount. Therefore, in this study, Zh was calibrated using the relative calibration adjustment (RCA) technique (Wolff et al., 2015), previously applied to CPOL data, that integrates the use of ground clutter with spaceborne radar observations and the self consistency of the polarimetric radar moments to monitor for changes in the radar calibration (as for Darwin CPOL; see Louf et al., 2019). The RCA technique calibrated Zh to 1 dBZ accuracy and for Zdr to 0.2 dB accuracy (Louf et al., 2019). In addition, Zh and Zdr at the C-band are prone to (differential) attenuation from heavy rainfall which may bias (overestimate) R. The Z-PHI approach provides an estimate of the specific (differential) attenuation (Adr) Ah as a linear function of ϕdp that varies depending on the presence of convective ”hot spots” (Gu et al., 2011). The Adr and Ah are then integrated along the ray to provide the (differential) attenuation-corrected Zh and Zdr. The ϕdp was dealiased in order to ensure that it monotonically increases with range. We then applied a linear programming (LP) phase processing technique of Giangrande et al. (2013) to estimate the Kdp from these dealiased ϕdp profiles.
2.2 Disdrometers
Disdrometers are the primary method by which rainfall rates and DSD parameters are recorded in this study. Previous disdrometer efforts at the ARM TWP Darwin site have explored the extended Darwin Joss–Waldvogel (J–W) disdrometer record (e.g., Giangrande et al., 2014a). However, J–W disdrometers are potentially less optimal for calculating dual-polarization radar quantities in lighter rain and/or small-drop conditions than in heavier rain. Recently, ARM ENA disdrometer comparisons suggested that the VDIS provided improved estimates of the DSD in light rain (Giangrande et al., 2019) compared to the J–W disdrometer. Therefore, we opt to explore the VDIS record to characterize the DSDs and perform subsequent dual-polarization radar quantity calculations from them. In order to ensure quality DSDs, artifacts that are due to splashing or other causes need to be removed. Following the analysis of Wang et al. (2018) and Giangrande et al. (2019) of VDIS DSDs, thresholds that check drop fall speed and particle diameter were applied to filter out splashing. After the application of these thresholds, the DSDs were averaged to 1 min to reduce noise and then fitted to a normalized gamma distribution of the form determined by two parameters Nw and D0 (Testud et al., 2001). These fits were produced using the method of moments technique in PyDSD (Ulbrich and Atlas, 1998; Hardin and Guy, 2017) utilized in past ARM efforts analyzing VDIS and J–W DSDs (Giangrande et al., 2014a, 2019; Wang et al., 2018). In order to ensure a statistically significant sample required to calculate the gamma distribution parameters, only DSDs with greater than 100 drops and rainfall rates greater than 0.5 mm h−1 were included. After these thresholds, 35 211 raining minutes of rain rate and DSD data remained available for use in this study. Changing the drop number threshold to 50, 200, and 500 did not significantly impact the results that follow.
2.3 Radar moment simulations from DSD
For each of the 1 min DSDs in the VDIS dataset shown in Fig. 2, the simulated observables Zh,s, Zdr,s, Kdp,s, and Ah,s were calculated by performing T-matrix scattering simulations (Mishchenko et al., 1996) at the C- and X-band using Py-TMatrix and PyDSD (Leinonen, 2014; Hardin and Guy, 2017) that has been utilized in past ARM efforts (Wang et al., 2018; Giangrande et al., 2019). A drop shape model is required for these simulations. We used the drop size model of Brandes et al. (2002) and a standard deviation of the canting angle of 12∘, following the CPOL Zh calibration of Louf et al. (2019). The air temperature was assumed to be 20 ∘C for all of the simulations similar to tropical surface air conditions at Darwin. Ah estimates appeared physically consistent with measurements of liquid water content W, which are related to either nearly or exactly the third moment of the DSD, respectively.
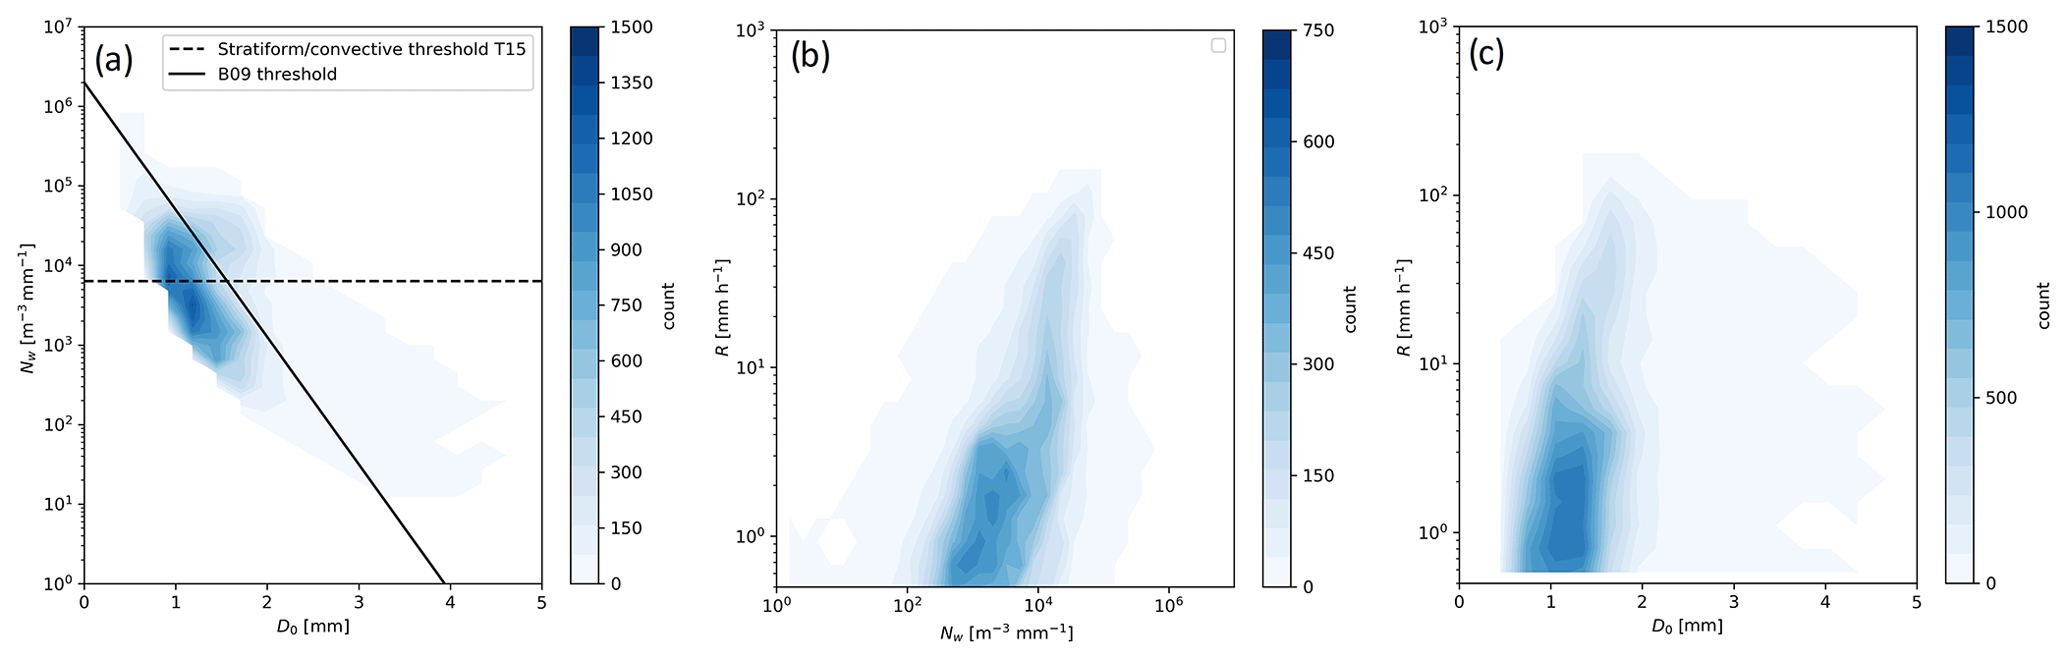
Figure 2Frequency histogram of (a) Nw and D0, (b) R and Nw, and (c) R and D0 from the VDIS for all of the DSDs containing more than 100 drops in each sample. The criteria used to classify stratiform and convective DSDs from Bringi et al. (2009) (BR09) and Thompson et al. (2015) (T15) are shown by the lines.
3.1 DSD parameters
Figure 2 shows Nw, D0, and R estimated from the VDIS for all DSDs considered. The D0 distribution is right-tailed and spans values from 0.5 mm up to 4.5 mm. A total of 90 % of the D0 values are less than 1.8 mm. The Nw spans 5 orders of magnitude and R reached up to 150 mm h−1. Much of this DSD variability is typically attributable to differences in whether the precipitation originates from stratiform or convective clouds and how great of a role is played by ice-based or mixed-phase precipitation (i.e., Tokay and Short, 1996; Bringi et al., 2003, 2009; Thompson et al., 2015; Dolan et al., 2018). Therefore, it is important to divide the DSD data by whether they were produced by stratiform and convective clouds. However, different studies have defined stratiform and convective clouds using different thresholds for classification depending on cloud conditions. Bringi et al. (2003), Bringi et al. (2009), and Giangrande et al. (2014a) applied a two-moment DSD-based classification to Darwin datasets such that any DSD having is labeled as convective, whereas remaining DSDs are marked as stratiform. This relationship, shown by the solid line in Fig. 2a, (herein, BR09) was developed using disdrometer data in Darwin, Colorado, and other land locations, enabling deep convective rainfall to be distinguished from widespread stratiform precipitation.
More recently, Thompson et al. (2015) (T15) proposed a definition for Manus and Gan islands that classifies all DSDs with log 10Nw>3.8, as convective, which was consistent with prior work by Bringi et al. (2003, 2009) and Thurai et al. (2010). The T15 relationship is shown as the dashed line in Fig. 2a. The T15 definition separated the full range of tropical oceanic convection (weak to strong) from stratiform precipitation. Confirmation for these T15 DSD separations have been subsequently reported by Giangrande et al. (2019) using disdrometers coupled with cloud radar over the ARM oceanic-mid-latitude ENA facility and by Dolan et al. (2018). Nevertheless, both the oceanic dataset and recent ENA findings of Thompson et al. (2015) do not cover continental-based, deep-ice-based convection with hail. Such mixed-phase deep convection and organized convective systems are common over the Darwin region (Williams et al., 1992; Rutledge et al., 1992; May and Rajopadhyaya, 1999; May and Ballinger, 2007; Bringi et al., 2009; Thurai et al., 2010; Jackson et al., 2018). Prior studies find that both tropical-oceanic cloud and continental cloud behaviors drive surface rainfall here. These considerations may be analogous to other displays for tropical-continental conditions (Tokay and Short, 1996; Wang et al., 2018), wherein BR09 is typically sufficient to distinguish deeper convective cores from other forms of precipitation. Therefore, this study applies the BR09 convective-stratiform classification to distinguish between the strong convective DSDs and other rain types. We isolate and focus on deep convection in order to study the phenomena most likely to contribute to strong magnitude variability in R. As shown by Thompson et al. (2015) and Dolan et al. (2018), DSDs not classified as convection by BR09 could include contributions from both weak ocean-based convection and stratiform clouds. Here, we simply refer to all non-convective rain classified by BR09 as stratiform.
Figure 3 shows normalized frequency histograms of Nw, D0, and liquid water content W, separated by the B09 classification. In addition, summary statistics of these variables are given in Table 1. There are 35 211 DSDs in total that fit the filtering criteria used to generate Fig. 2. The BR09 classification indicated that 26 131 of these DSDs were not convection. In total, 750 mm, or 21 % of the total rainfall accumulation, originated from stratiform rain (Table 1). Past studies in Darwin by Tokay and Short (1996) and Giangrande et al. (2014b) reported that about 30 % of the total rainfall accumulation originated from stratiform clouds. Their data and the data here are consistent with the notion that rainfall in Darwin primarily originates from convection. For these stratiform DSDs, W is generally less than 1 g m−3 (Fig. 3 and Table 1), from which less attenuation of the radar beam by liquid water is expected and quantified by T15. The W and D0 values in Table 1 are lower in stratiform DSDs compared to convective DSDs. The smaller drops in stratiform DSDs for a given R shows that these DSDs more likely originated from crystal aggregation aloft in stratiform rain devoid of melting hail (Thurai et al., 2010; Dolan et al., 2018). These relative differences in W, D0, and N0 have been shown in Darwin previously (Thurai et al., 2010; Giangrande et al., 2014a).
Table 1Mean DSD parameters for given R ranges and BR09 convective-stratiform classification.

n/a: not applicable.

Figure 3Normalized frequency histograms of (a) Nw, (b) D0, (c) W, and (d) R separated by the BR09 stratiform-convective classification.
Convective DSDs exhibited right-tailed distributions of D0 and left-tailed distributions of N0 and W (Fig. 3). In Fig. 2, the right tail of D0 is associated with lower N0 and W, consistent with fewer and larger drops. This tail has been observed in previous studies in Darwin (Giangrande et al., 2014a) as well as in other regions such as the Amazon (Wang et al., 2018) and the ARM ENA site (Giangrande et al., 2019). This tail is likely caused by different stages of deep convection being sampled. Large hail grown by accretion that then melts and falls to the ground has very low N0 and very high D0 (Bringi et al., 2003, 2009). At the edges of deep convective clouds, size sorting favors fewer but much larger drops hitting the ground before the more numerous smaller drops do (Gunn and Marshall, 1955; Thompson et al., 2015). In addition, for given ranges of R, there are lower values of Nw and higher values of D0 in Table 1 for convective DSDs compared to stratiform DSDs. This is consistent with land-based convective-stratiform classification proposed by BR09 using data from Darwin and also other mid-latitude regions such as Colorado.
When looking at histograms of R in Fig. 3, it is clear that there is some overlap between convective and stratiform rain DSDs (the stratiform category of BR09 could also include weak oceanic convection, T15). We find that 95.7 % of the DSDs with are classified as convective, while 9.7 % of the DSDs with are convective. This is consistent with prior studies of tropical rain (T15; Rutledge et al., 2019). Therefore, these Darwin data show that the majority of cases with are likely produced by stratiform rain and weak convection while the cases are likely the result of deep convection. Therefore, the DSDs collected here are the result of different modes of raindrop formation. Warm rain processes in narrower DSDs are more likely present when (T15). Meanwhile, deeper convection where cold rain processes (melting hail) occur is more likely to be present during times when . Past studies have used as a threshold for separating convective and stratiform DSDs (Tokay and Short, 1996; Nzeukou et al., 2004), so this separation threshold is consistent with past literature examining DSDs in Darwin. However, as shown here and in Giangrande et al. (2014a), thresholds based on R exclude some weak convective events and the lateral edges of strong convection when number concentration is still low.
3.2 Simulated radar moments from DSD
Figure 4 shows scatter plots of R as a function of simulated Zh, Kdp, and Ah at the C- and X-band from the VDIS DSDs in Fig. 2. The different color lines represent the best fits of R to each Zh, Kdp, and Ah. In addition, consistent with what has been done in many past studies (i.e., Marshall and Palmer (1948); Aydin and Giridhar (1992); Matrosov (2005); Matrosov et al. (2006); Wang et al. (2013); Ryzhkov et al. (2014); Thompson et al. (2015, 2018); Wang et al. (2018); Giangrande et al. (2019)), Fig. 4 and Table 2 show power-law fit relationships in the form of R=aXb or R=aXbYc. The fits in Table 2 take the linear forms of Zh, Zdr, and Ah as inputs, denoted as zh, zdr, and ah respectively. Following Wang et al. (2018), Table 2 shows confidence intervals calculated from 1000 fits from 10 000 randomly chosen DSDs, with replacement, from the VDIS dataset. The fit curves from each of the 1000 fits are plotted in Fig. 4 as black lines. The width of the 95 % confidence intervals (O([10−4–10−3])) of a, b, and c of each fit (Table 2) are less than 5 % of the mean a, b, and c (O(1)) for each randomly generated fit. Furthermore, the randomly generated fits, shown by the black lines in Fig. 4, are overlapping in Fig. 4, with differences in R less than 10 %. This therefore shows that the generated fits are robust.
Table 2The 95 % confidence intervals of the generated fit parameters, RMSE, and correlation coefficient for each fit.
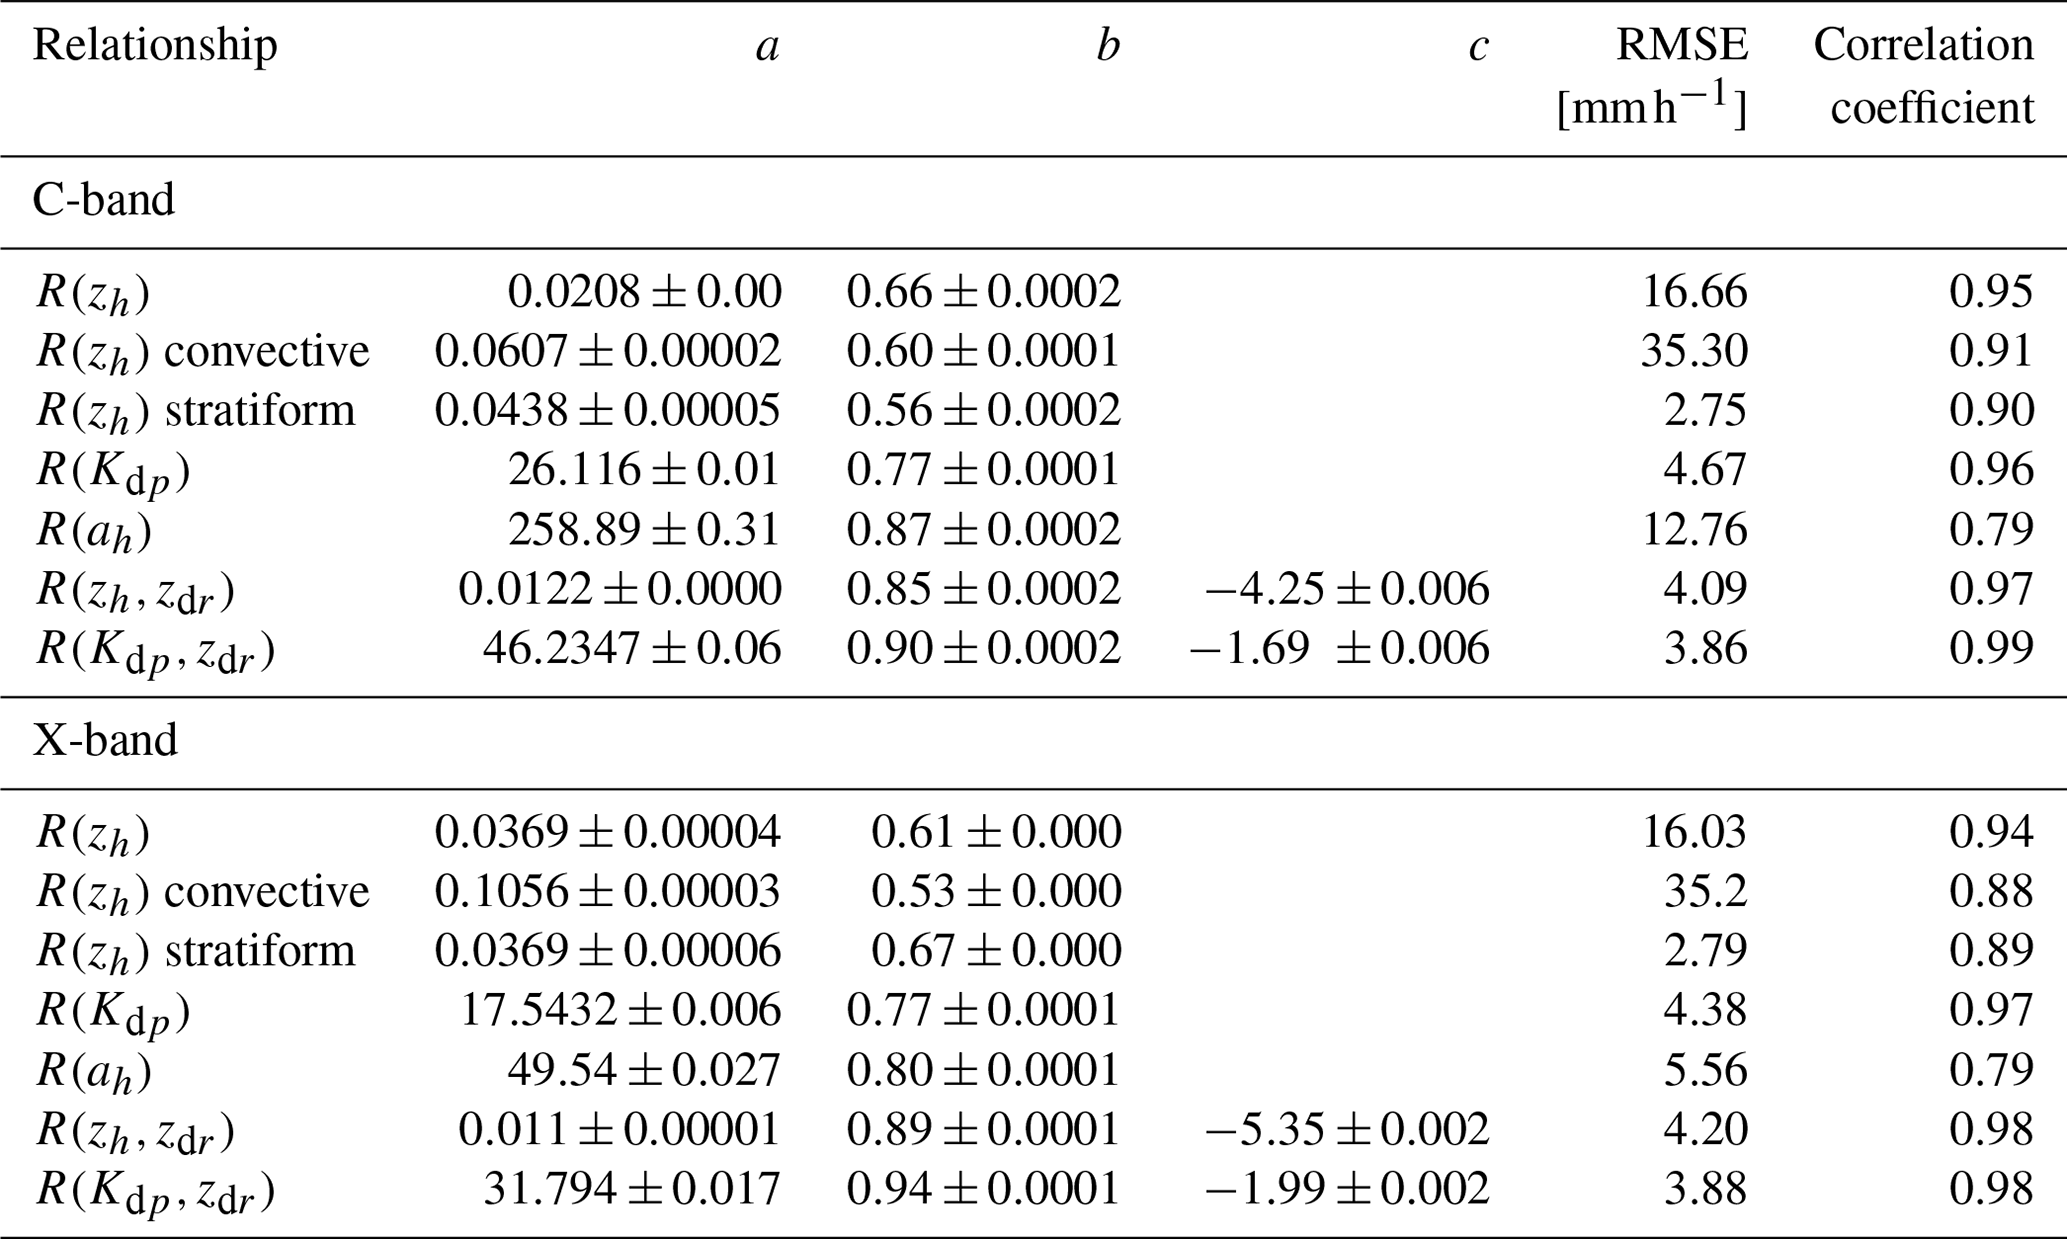
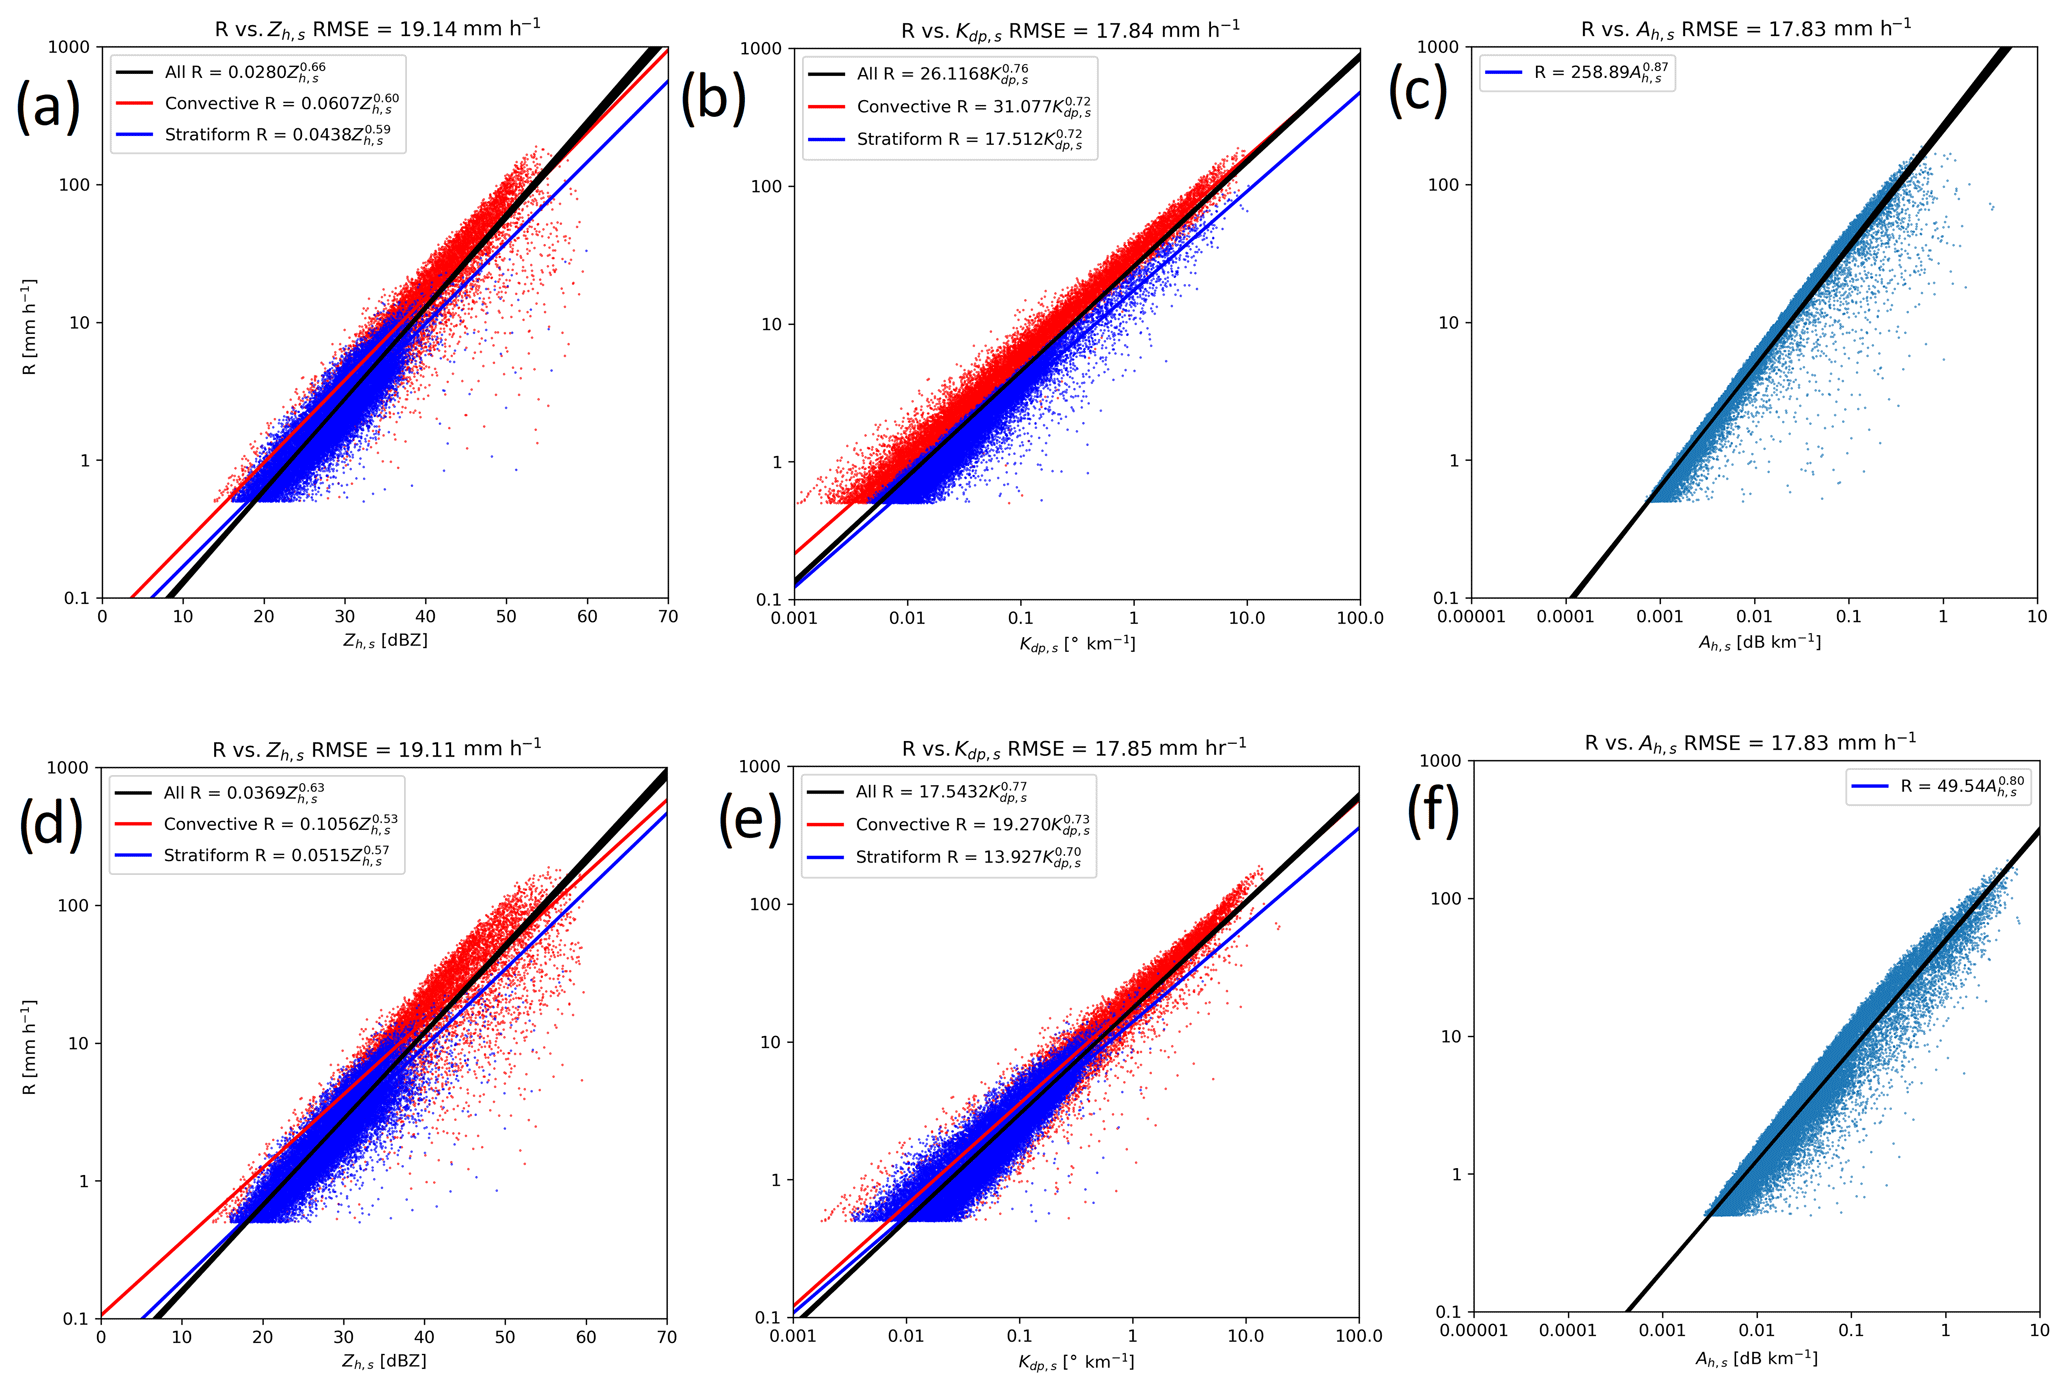
Figure 4R from VDIS as a function of (a) Zh, (b) Ah, and (c) Kdp, for the simulated radar moments from VDIS at the C-band. Panels (d–f) are as in (a–c) but for the X-band. Each colored line represents a power-law best fit of the variables. Each black line represents a fit produced by the bootstrap technique applied to the data in each panel.
Using the 4-year Darwin dataset of DSDs, R, and simulated radar moment data shown in Sect. 3.2, this section assesses the applicability of dual-polarization moments and specific attenuation for R estimation in Darwin. Three criteria will be examined. Firstly, this study estimates the parametric uncertainty in R using the spread in the probability distribution function of R for given ranges of radar observables. Secondly, we use principal component analysis to determine whether dual-polarization quantities or specific attenuation best contribute to the variability in R. This exercise is designed to guide R retrieval development. Finally, the R estimators developed in Sect. 3.2 are applied to the CPOL dataset and compared against VDIS-observed R in order to test the performance of these retrievals with observed C-band radar data.
4.1 Parametric uncertainty
One metric by which the applicability of given radar retrievals can be assessed is by examining the parametric uncertainty of R. While in Sect. 3.2 the bootstrap approach showed that there is little difference in the power-law fits due simply to random sampling, there can be an order of magnitude variability in the distribution of R for a given Zh,s, Kdp,s, Zdr,s, or Ah,s, showing the potential for large parametric uncertainty. This is why many studies used multiple linear regression, with multiple input variables, to form more constrained power-law R estimators. This study therefore calculates the parametric uncertainty of R for a given radar observable by subtracting the first quartile of R from the third quartile of R taken over 40 log-uniformly spaced bins of the given radar observable (Kirstetter et al., 2015). The ranges of these bins are 0 to 70 dBZ for Zh,s, to 100 dB km−1 for Ah,s, to for Kdp,s, and 0 to 10 dB for Zdr,s. The results of these parametric uncertainty calculations as a function of the mean R over each radar observable bin are shown in Fig. 5 for the C- and-X band simulated radar quantities.

Figure 5The parametric uncertainty of R estimated using the methodology of Kirstetter et al. (2015) as a function of mean R for given ranges of radar moments at the C-band (a) and X-band (b).
In Fig. 5a, b, the Ah-based estimators give the lowest parametric uncertainty, followed by Kdp – then Zh-based estimators for time periods when when only a single radar observable is considered. However, it is important to note that, at these , the noisier nature of Kdp and hence Ah makes the applicability of these quantities to R estimators questionable. Zdr from CPOL is questionable to use for times when as it needs to be accurate within 0.1 dB, less than the quoted 0.2 dB accuracy, for providing reasonable estimates of R in light rain (Ryzhkov et al., 2005). In addition, numerous past studies using CSAPR and XSAPR have found the use of Kdp- and Ah-based estimators to be only applicable or preferable for conditions with Zh>35–40 dBZ, present at rainfall rates greater than roughly 10 mm h−1 (Park et al., 2005b, a; Ryzhkov et al., 2005; Giangrande et al., 2014b). Algorithms by Cifelli et al. (2011) and Thompson et al. (2018) use data quality thresholds to avoid noisy input data in R estimators. Given that Table 1 shows that the mean Zh,s is under 40 dBZ for , this suggests that using the Zh-based estimators is the most viable option when , similar to results using the CSU blended algorithm in Cifelli et al. (2011), Thompson et al. (2018), and Rutledge et al. (2019). However, these Zh-based estimators produced the highest parametric uncertainty, shown in Fig. 5 and also quantified by Thompson et al. (2018). The current analysis and these prior studies highlight limitations in estimating light rainfall rates from scanning radars, since they must rely on Zh in .
Looking at , the parametric uncertainty of R from Kdp-based estimators is lowest at both the C- and X-band in Fig. 5 when only a single radar observable is considered. In the blended algorithm used by Cifelli et al. (2011), Thompson et al. (2018), and Rutledge et al. (2019), Kdp is used much more frequently for R estimation at because it exceeds necessary data quality thresholds. The D0 was higher in convective DSDs with (Table 1), meaning the drop populations were more oblate, produced more total liquid water and rain, and therefore produced significant Kdp (Bringi and Chandrasekar, 2001). For instance, in Table 1, D0 increases from 1.54 to 1.77 mm with increasing R when for the convective DSDs, also shown by Thompson et al. (2018). By definition, Kdp becomes proportional to W and R once drops are large enough to be oblate (Bringi and Chandrasekar, 2001). This is consistent with results that show Kdp,s is highly correlated with R when large, oblate drops are present when . The parametric uncertainty in the relationship is lower for ranges of compared to the other observables at the ARM TWP Darwin site when a single radar observable is considered.
Figure 5 shows that the parametric uncertainty is lower when multiple radar observables are considered over the entire range of R compared to when a single observable is used. In particular, the parametric uncertainty of R is lowest when Kdp,s and Zdr,s are constrained for time periods when . Even the use of Zh,s, and Zdr,s as constraints lowers the parametric uncertainty of R compared to using a single radar observable. (Kdp, Zdr)-based estimators are used to estimate R when in the blended algorithm used by Cifelli et al. (2011), Thompson et al. (2018), and Rutledge et al. (2019). In addition, the 0.2 dB accuracy of Zdr from CPOL is adequate for R estimation in heavier rainfall (Ryzhkov et al., 2005). Therefore, similar to past studies in Colorado, Oklahoma, and Manus and Gan islands, this shows that using multiple linear regression reduces the uncertainty in R due to the use of fits for the CPOL data in Darwin.
4.2 Principal component analysis
The previous subsection revealed which rainfall rate estimators most minimize the parametric error in R for these Darwin datasets. Now, this section explores the utility of using Zh,s, Zdr,s, Kdp,s, or Ah,s to estimate R. To do this, principal component analysis (PCA) reduces the dimensionality of the feature space by factoring in potential correlations between the variables Zh,s, Zdr,s, Kdp,s, and Ah,s and creating a new phase space of uncorrelated features. This PCA is conducted on the simulated VDIS radar moments and Ah,s. For PCA, we define a vector for each DSD sampled by the VDIS. All such x values are then the columns of a matrix X. The first n principal components (PCs) of XTX are then defined to be the first n normal eigenvectors of XTX. The normal eigenvalues λn of these eigenvectors show how the variability in the phase space of X is determined by each PC of X. Since the PCs can be affected by the scale of each row of X, each row of X is standardized before conducting the PCA. Each column of X is then projected into a new coordinate system whose basis vectors are each PC and stored into a matrix Xp. From this information, the variable importance matrix , or the absolute value of the cross-covariance matrix between X and Xp. We then standardize each column of I to have unit variance so that the values in I are the absolute values of z scores. The resulting I values for the simulated radar variables are shown in Figs. 6 and 7. Three PCs were chosen as over 95 % of the variance in X is explained using three PCs. Finally, in order to determine which PCs contribute to variability in R, we compute the correlation coefficient of the logarithm of R with each row of Xp, as shown in Table 3.
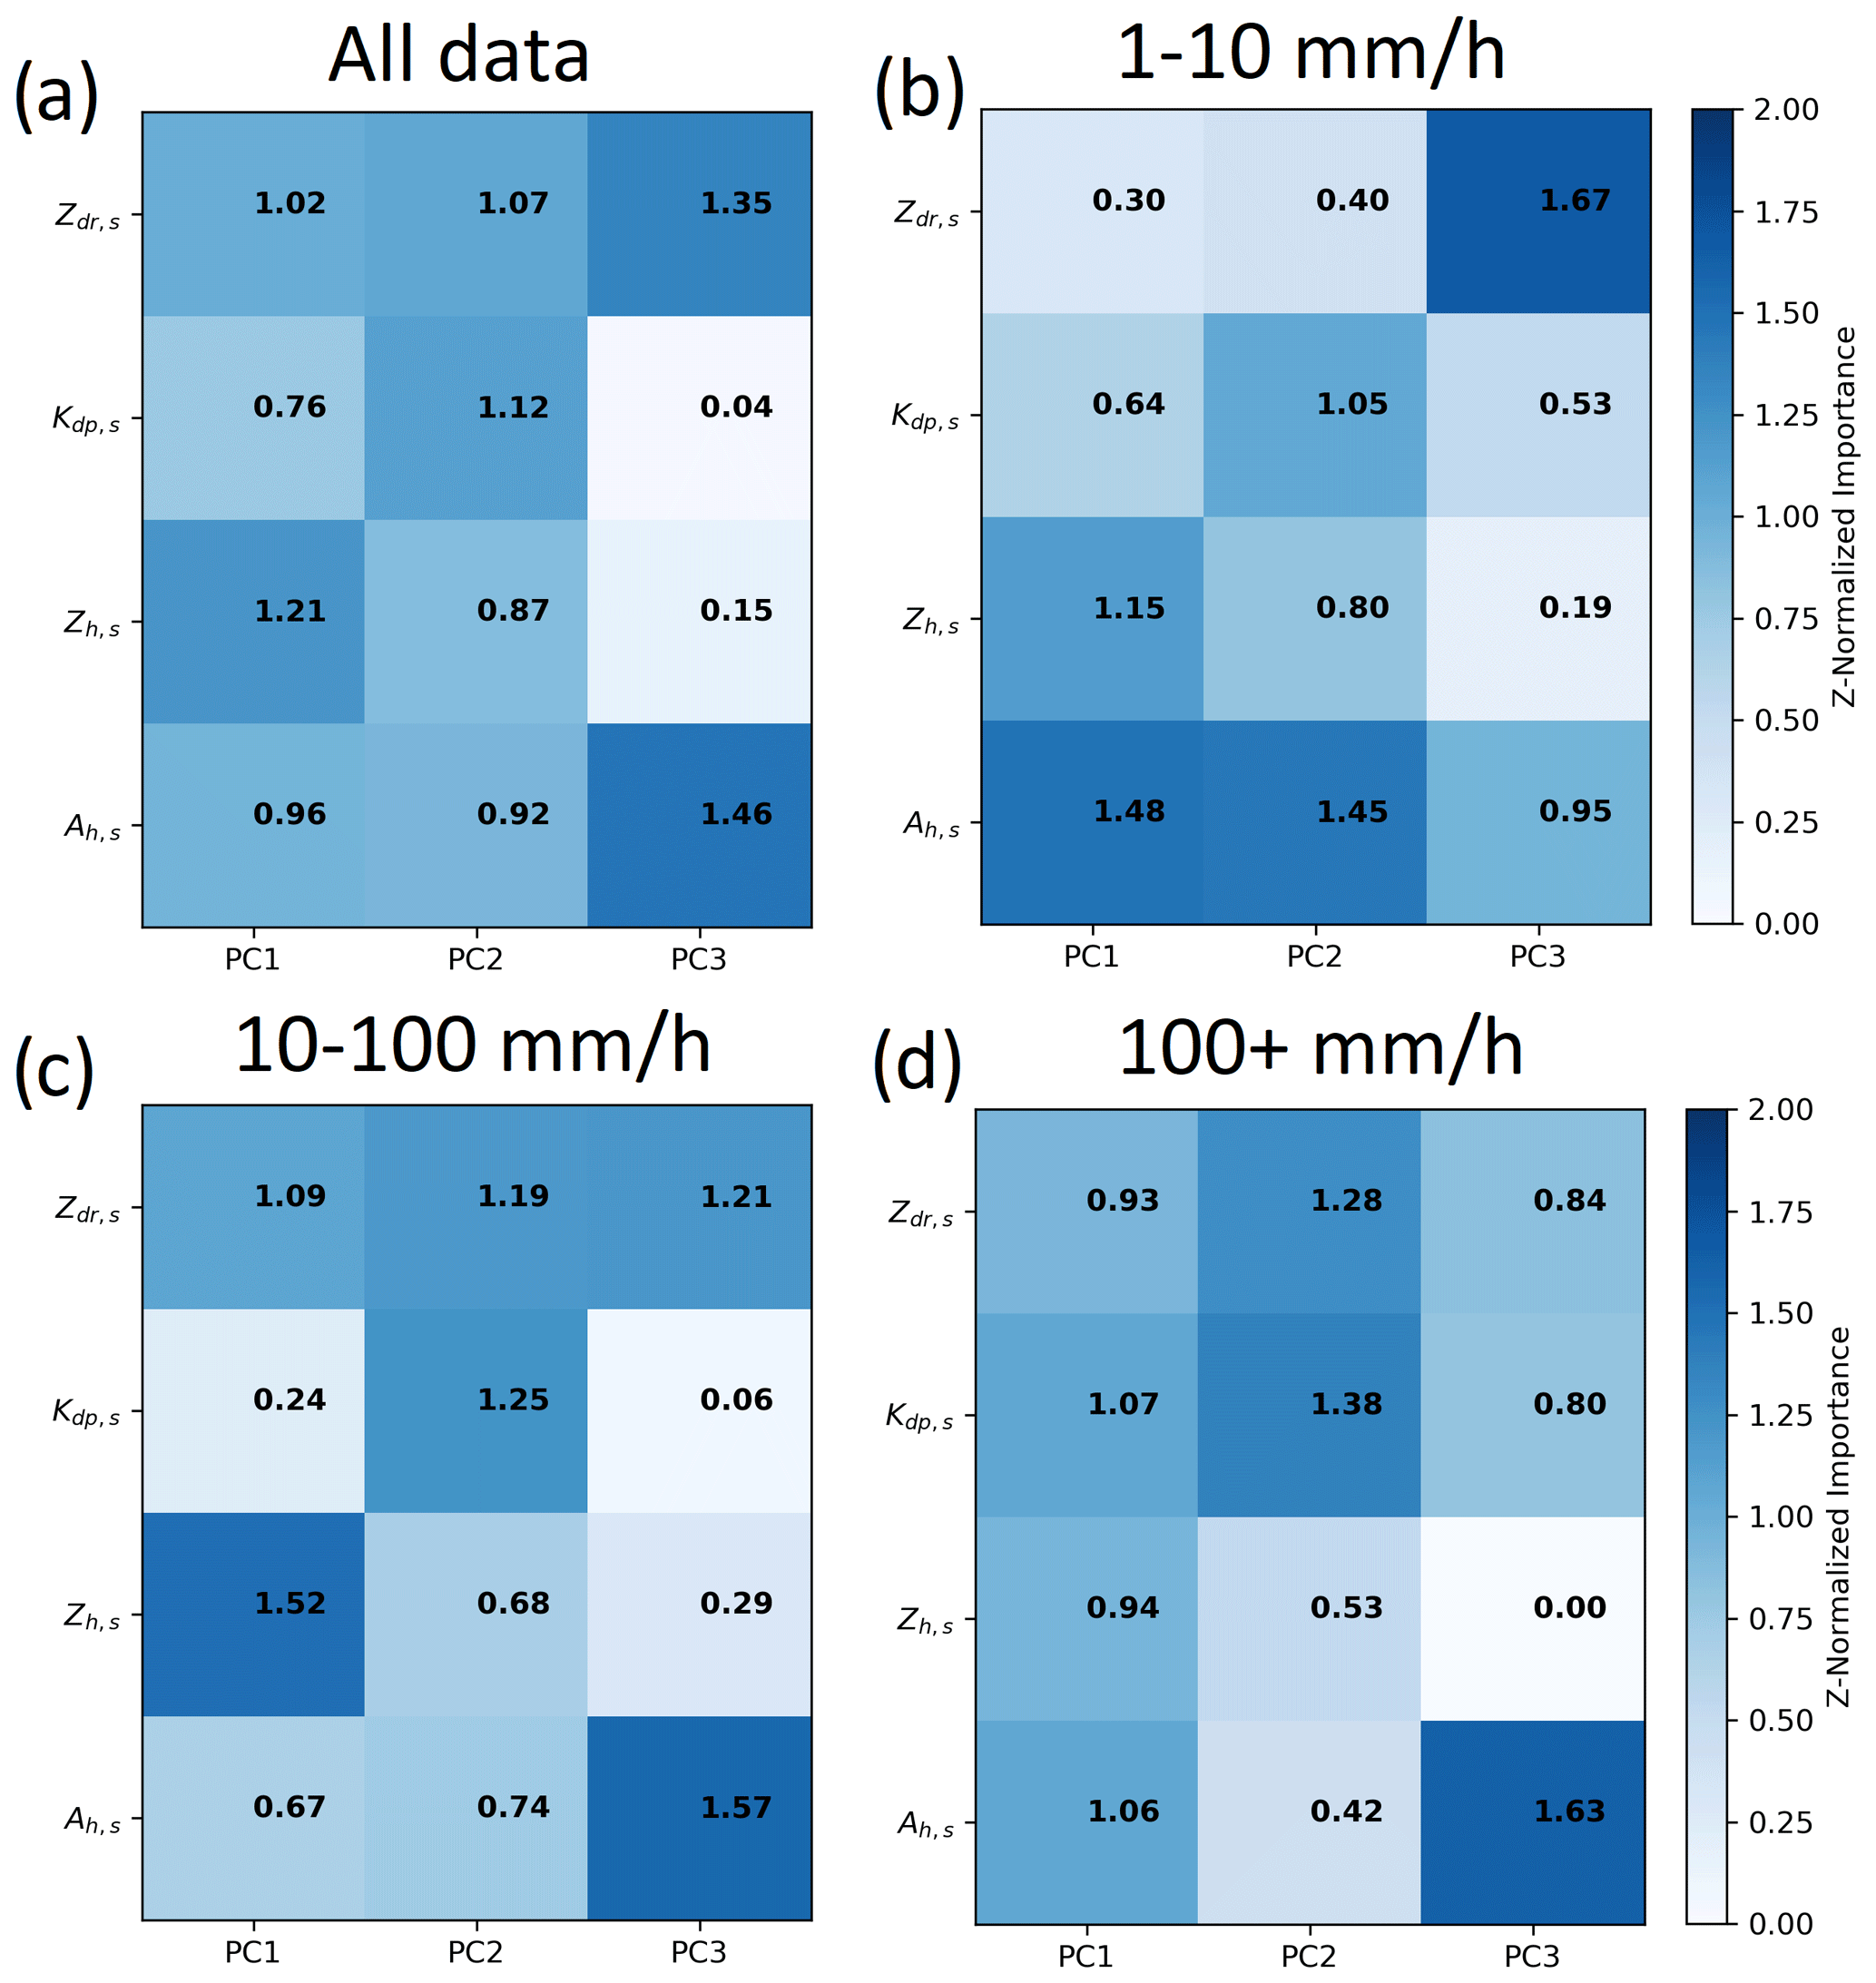
Figure 6The variable importance matrix for the three principal components of X (a) when all data are considered, (b) when R is 1 to 10 mm h−1, (c) 10 to 100 mm h−1, and (d) more than 100 mm h−1.
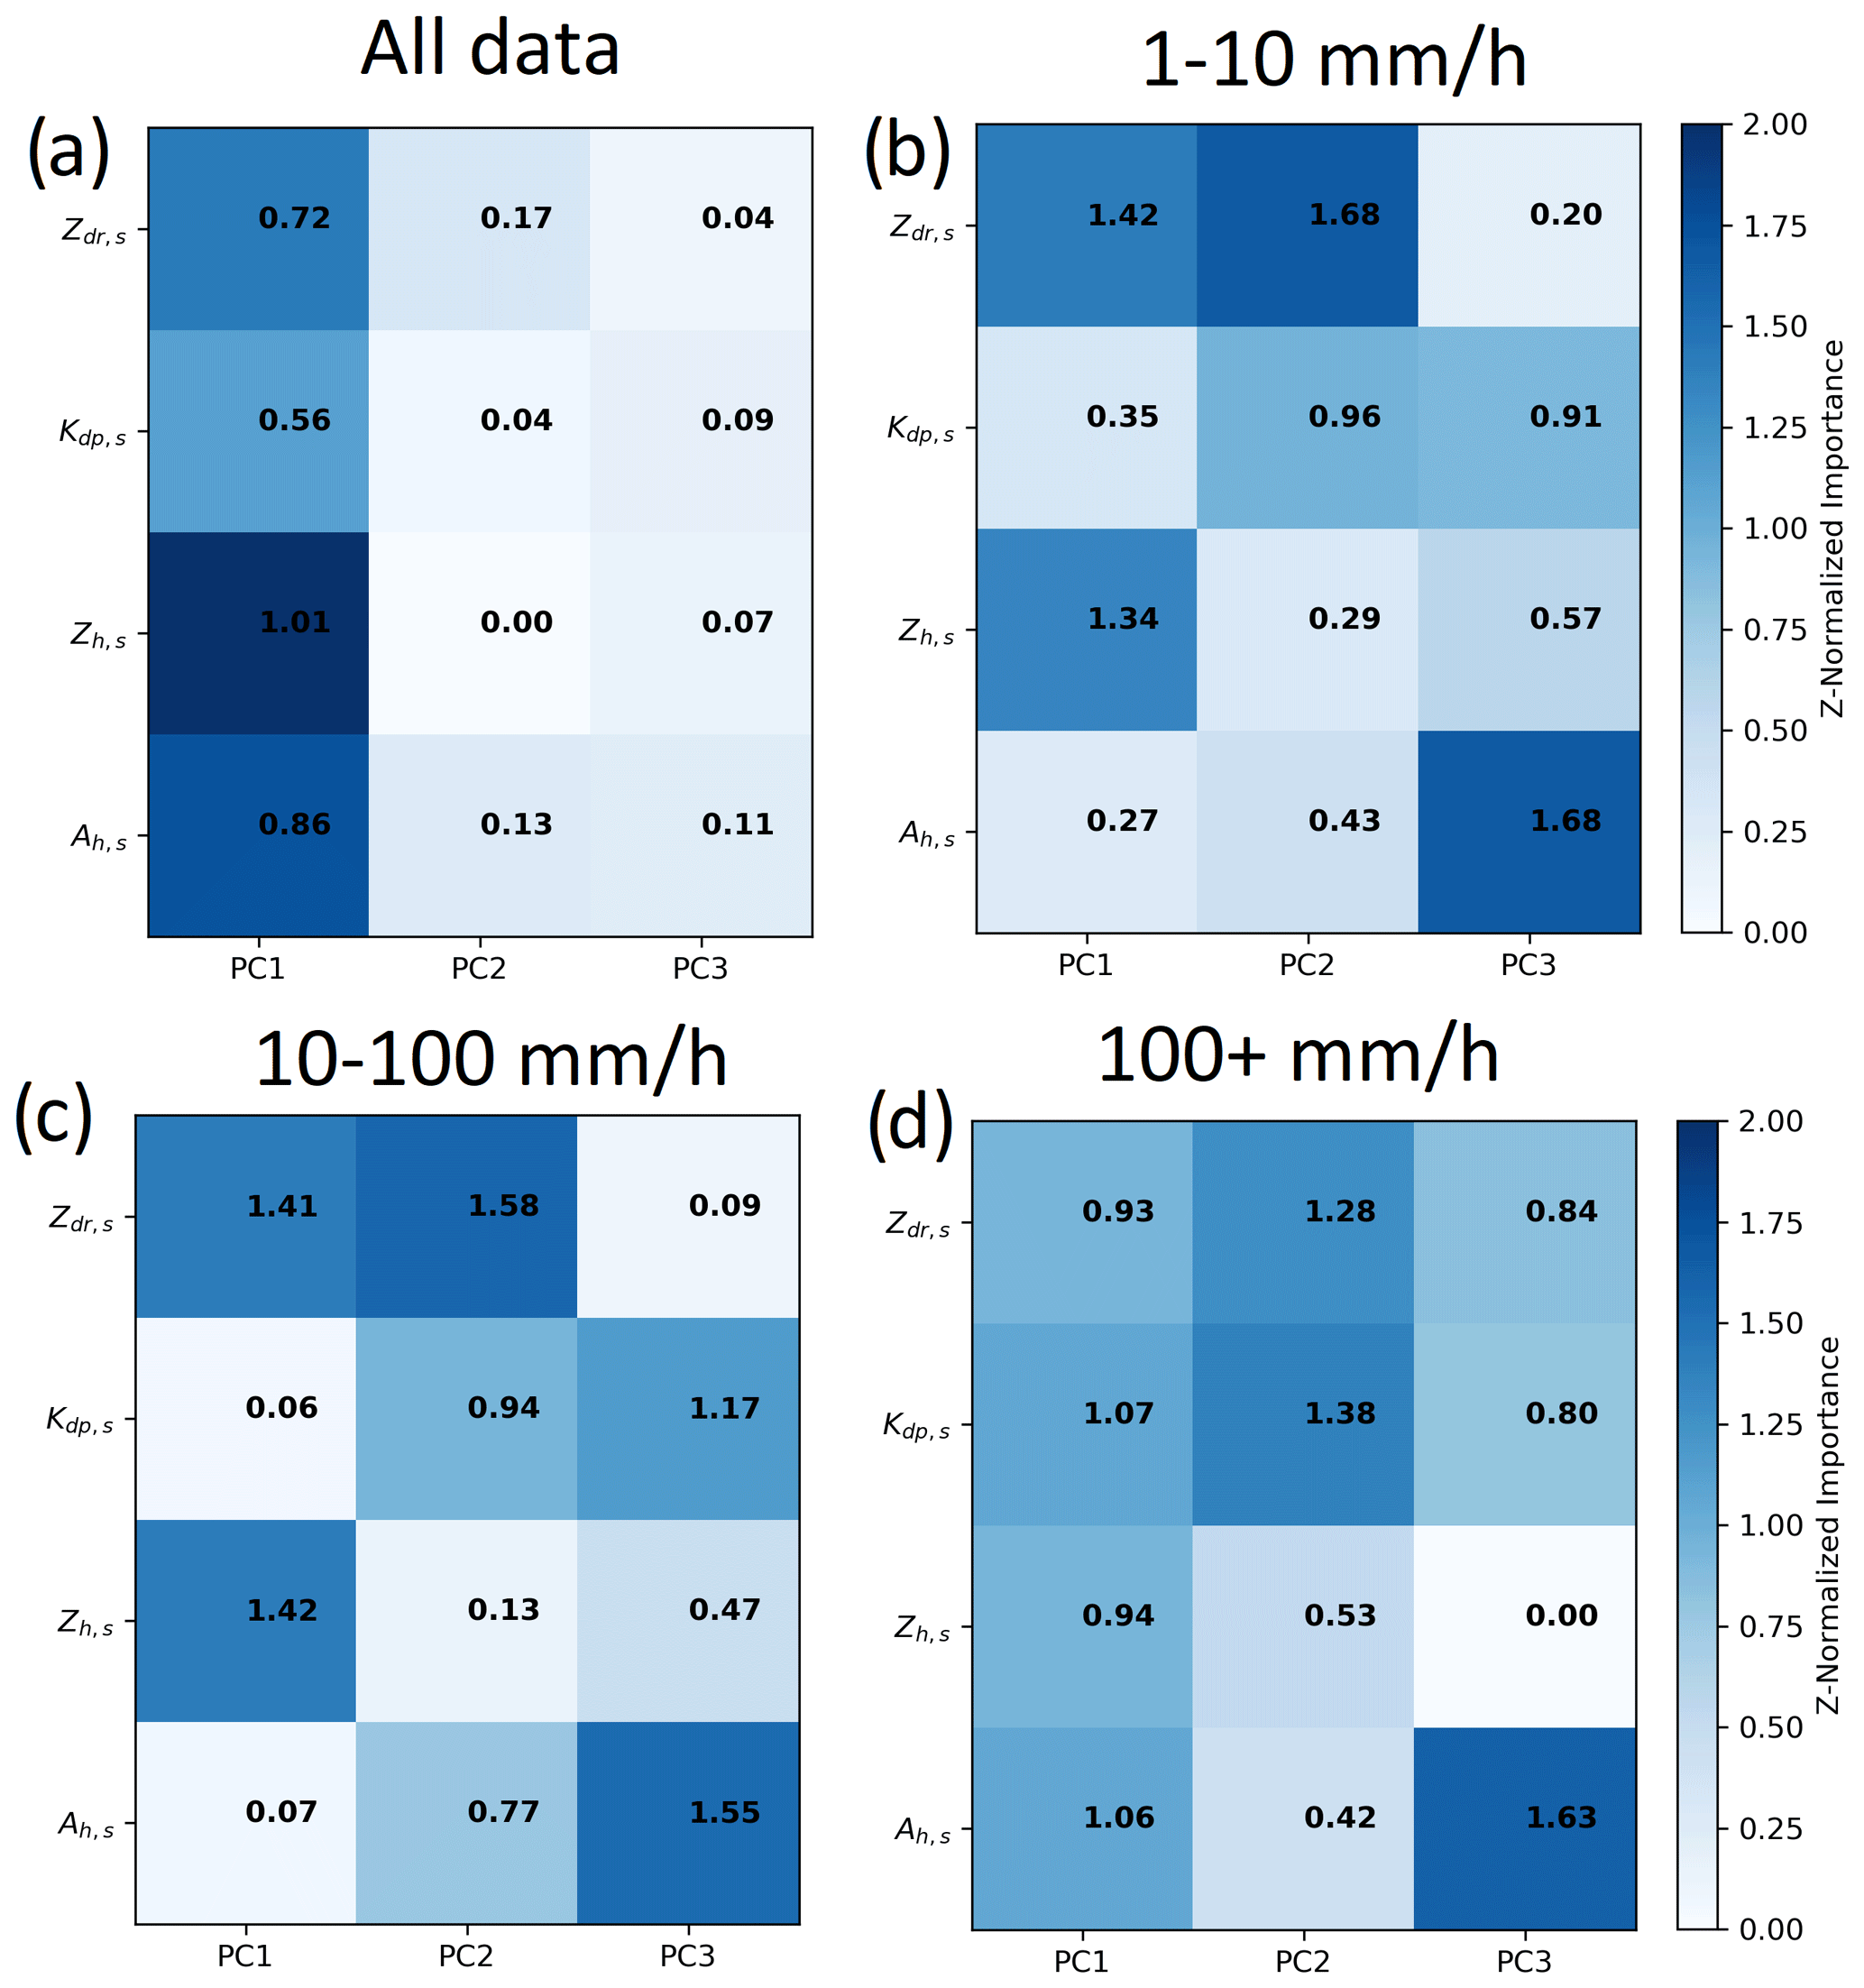

Table 1 and Fig. 3 show that stratiform and possibly weak convective clouds primarily contribute to rainfall for times when while stronger convective rain classified by BR98 had higher R. Since we expect rainfall from stratiform and convective clouds to have DSDs with different characteristics for a given R, and was a suitable threshold to distinguish deep convection from weaker convection and stratiform rain, the PCAs in Figs. 6 and 7 are further stratified by R in order to account for this DSD variability. When restricting the PCA to , we see that R has a stronger correlation (>0.65) with PC1 than with PC2 and PC3 in Tables 6b and 7b. Zh,s and Ah,s have the greatest contribution to PC1 at the C-band, but Zh,s and Zdr,s do at the X-band. Therefore, the importance of dual-polarization radar quantities and Ah to the variability R for these weaker rainfall conditions is dependent on radar wavelength, but the high importance of Zh for determining R is consistent across wavelengths. Zh from CPOL is accurate to within 1 dB (Louf et al., 2019), adequate for R estimation in light rain (Ryzhkov et al., 2005), but the calibration of Zdr is not adequate. This is consistent with past efforts that have preferred Zh estimators for estimating these lighter rainfall rates from scanning radars (Cifelli et al., 2011; Park et al., 2005b; Ryzhkov et al., 2005; Giangrande et al., 2014a, 2019; Thompson et al., 2018; Wang et al., 2018; Rutledge et al., 2019).
For , the correlation with R with PC1 is still higher (>0.7) than with PC2 and PC3. However, at , the correlation of R with PC2 is higher () compared to PC1 and PC3 in Table 3. Zh,s and Zdr,s are the two variables contributing most to the variability in PC1 in Figs. 6c and 7c. This relationship is consistent across wavelengths. Kdp,s and Zdr,s contribute most to the variability to PC2 in Figs. 6c, d and 7c, d. Therefore, as R increases, Kdp,s and Zdr,s become better predictors of R. This further confirms and quantifies prior studies that showed Kdp-based estimators for R are successful at higher rain rates (Sachidananda and Zrnić, 1985, 1987). This is also consistent with previous studies recommending the use of Kdp-based estimators over Ah-based estimators for CSAPR and XSAPR at the ARM SGP site to sample deep convection (Giangrande et al., 2014b). Finally, this is also consistent with the use of R−(Zdr, Kdp) estimators in the CSU blended techniques by Cifelli et al. (2011) and Thompson et al. (2015) for these rainfall rates.
In this analysis, Ah,s is shown to have lower importance to PC1 and PC2 for in Figs. 6b, c, d and 7b, c, d compared to Kdp,s and Zdr,s. While Ryzhkov et al. (2014) demonstrated that, R−Ah are appropriate for use in convection sampled by NEXRAD in Oklahoma, past ARM efforts at SGP have shown that, for XSAPR radars, severe attenuation prohibited accurate rainfall estimation for this range of R (Giangrande et al., 2014b). Therefore, this and the PCA shows that using multiple radar observables in these coastal tropical regions will provide better predictive capability than using Ah alone.
As a final metric for evaluating the applicability of various radar quantities to the development of R estimators for ARM radars deployed at the TWP ARM site, the R estimators for C-band radars in Sect. 2.2 were applied to the point above the VDIS as defined in Sect. 2.1. First, in order to compare the estimators, Fig. 8 shows scatter plots of R observed from VDIS compared to observed Zh, Kdp, and Ah from CPOL with the R estimator developed from the VDIS data overlaid as a dashed line on the scatter plot. It is apparent that there is 1 to 2 orders of magnitude of scatter in R, and , in all panels of Fig. 8. For Fig. 8a, c, the Zh values are generally lower than the fit-produced values for . While the Zh values are, to the best of possible efforts, adjusted for attenuation, there is still the possibility that Zh remains affected by attenuation at these high R values that was uncorrectable. In addition, factors including the horizontal advection and breakup of drops as they travel from the CPOL sample gate to the VDIS, as well as noise in the Kdp and Ah fields at , likely induce scatter. Figure 8 therefore shows that a single radar observable does not adequately describe the full variability of R. As shown in many prior studies, R estimation could be improved by applying a blend of R estimators depending on rain conditions or radar multivariable conditions, or by employing multiple linear regression with more variables in each R estimator.
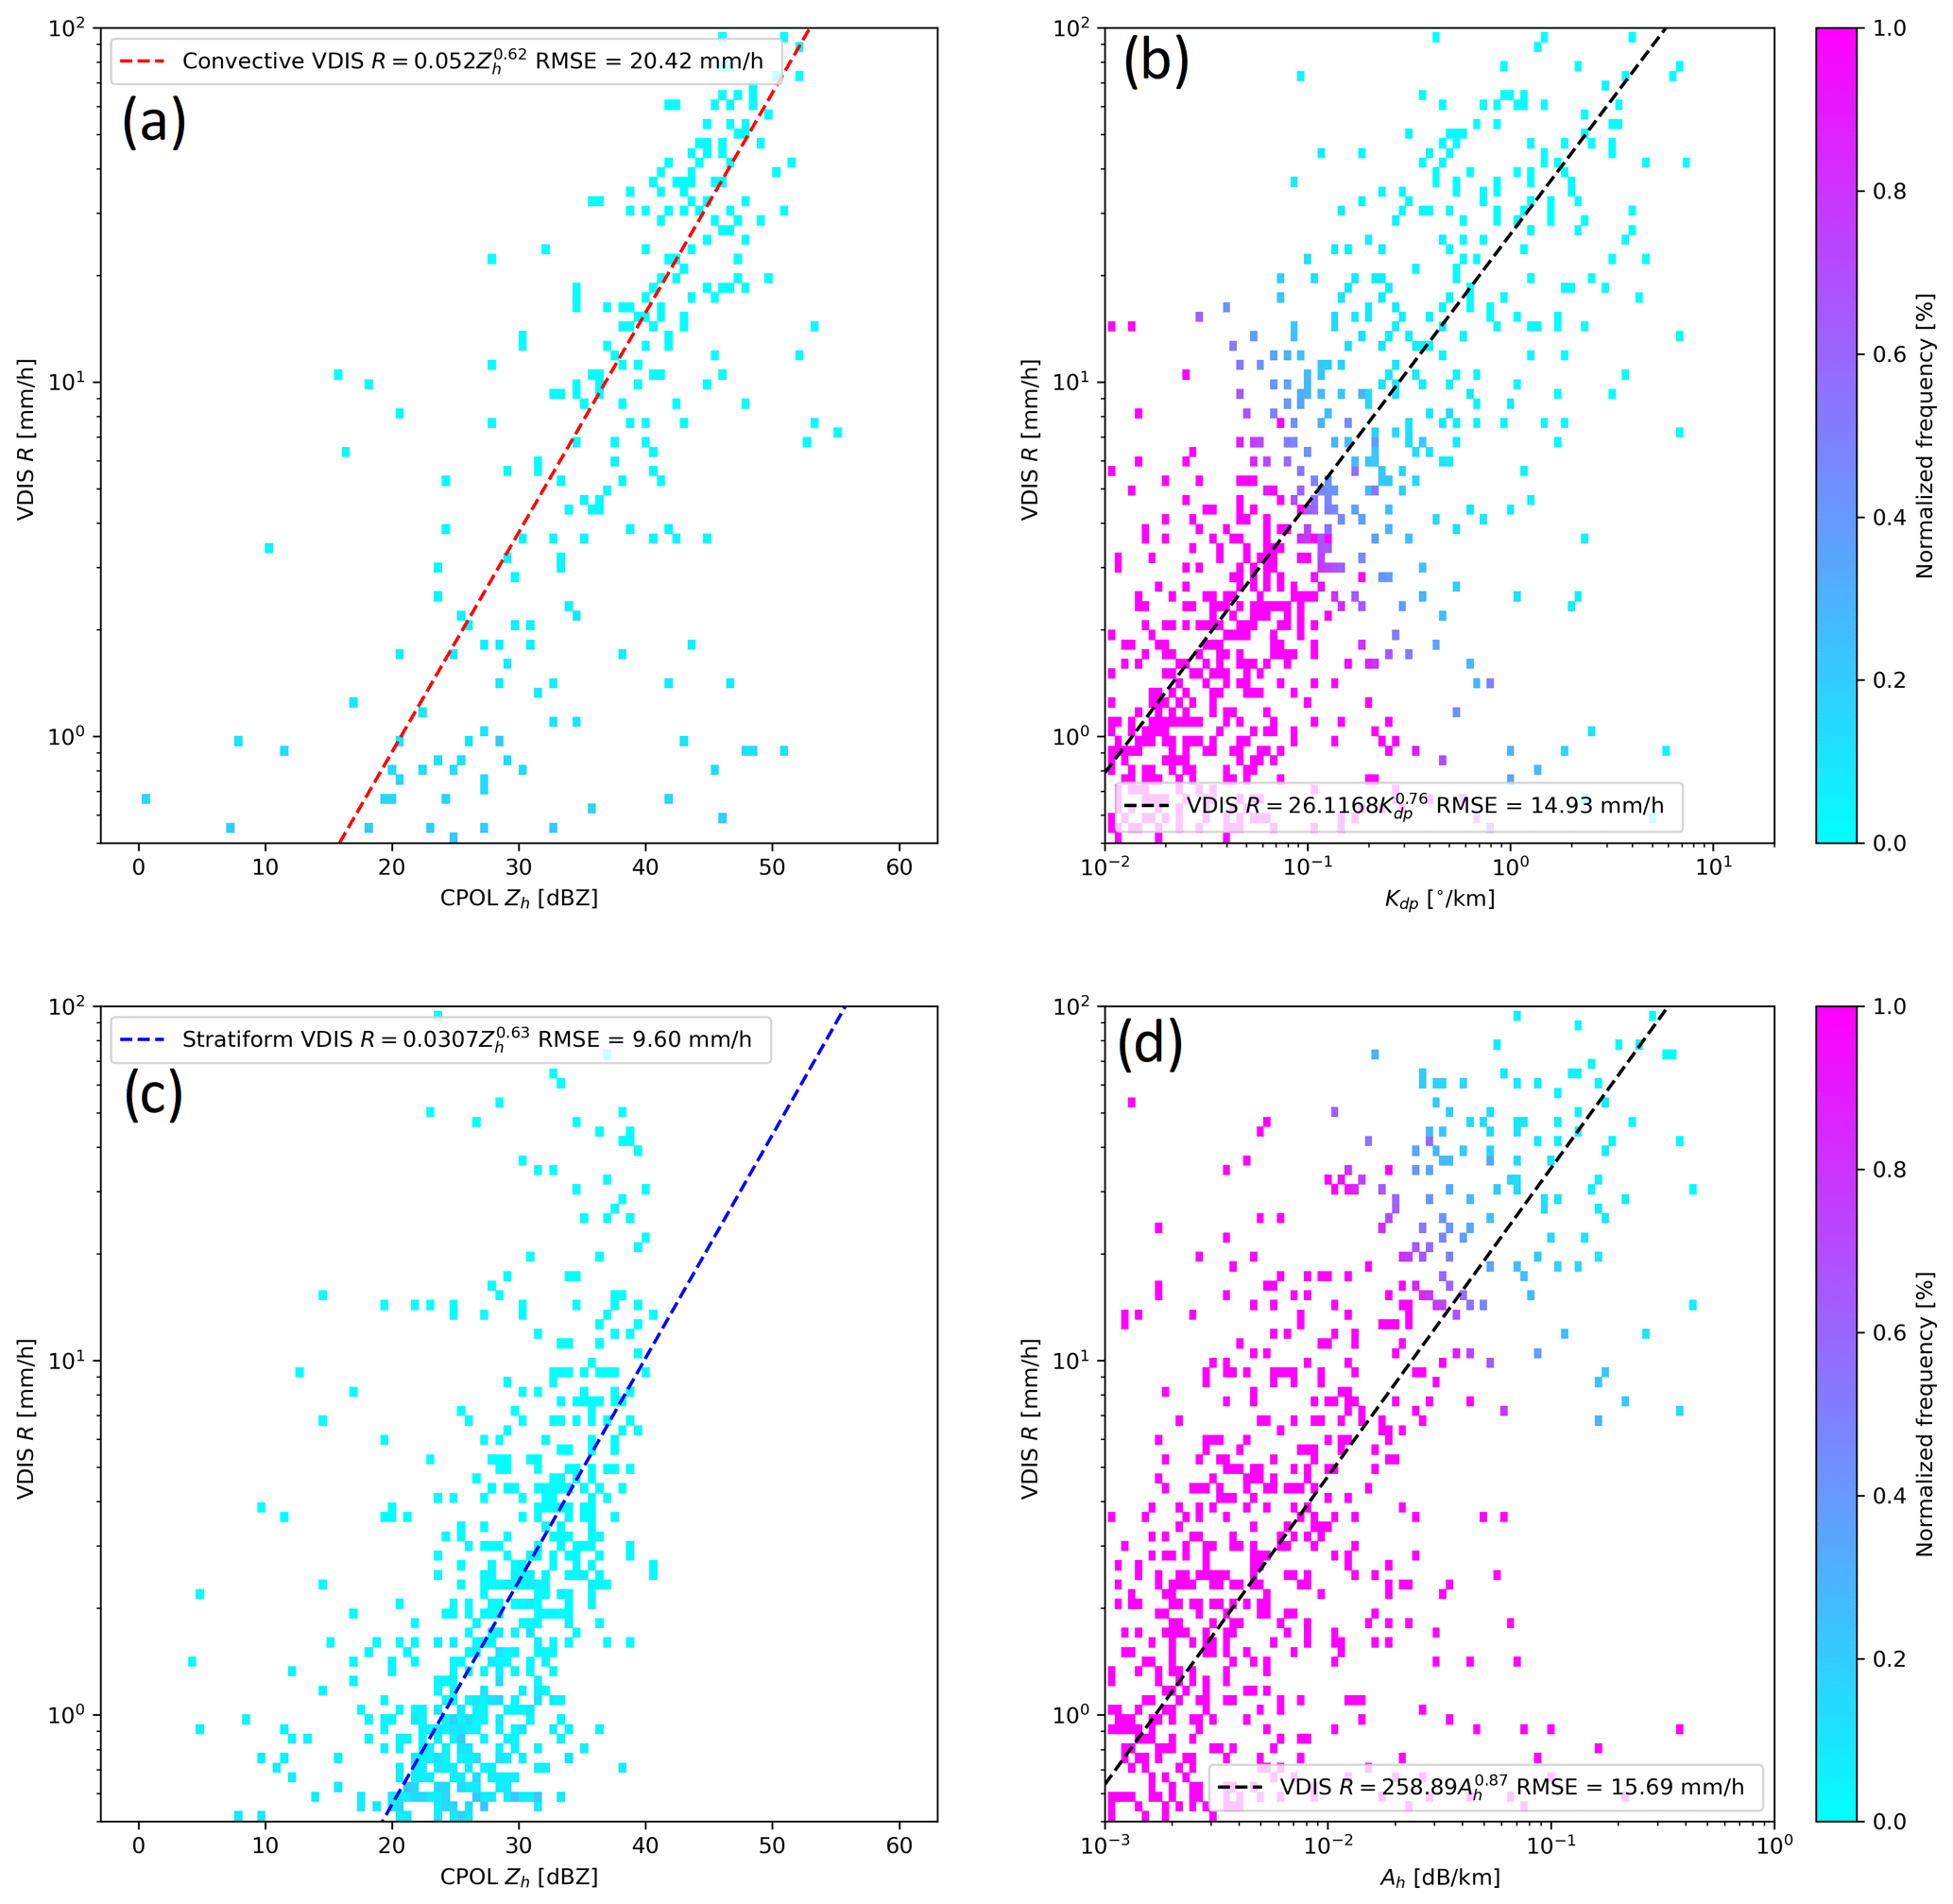
Figure 8R from the VDIS as a function of (a) Zh for convective DSDs, (b) Kdp, (c) Zh for stratiform DSDs, and (d) Ah from CPOL. Solid lines are the R estimators in Fig. 4.
In order to determine the blend, or set of R estimators based on rain conditions, that can provide the best agreement with VDIS observations, Fig. 9 shows comparisons of 10 min averages of R estimated from CPOL Zh, Ah, and Kdp. The input data to the R estimators are from the CPOL gate immediately over VDIS. The rain branch of the CSU blended technique, originally developed for Colorado by Cifelli et al. (2011), and then subsequently modified for the tropical oceans by Thompson et al. (2018), is also included in Fig. 9. The CSU blended technique uses a decision tree based on data quality thresholds for Zh, Kdp, and Zdr to select an R estimator. The modifications by Thompson et al. (2018) were developed for conditions in Manus and Gan islands where stronger convection that produces hail that can further melt into large surface raindrops is not common. Therefore, since such convection is common in Darwin, the estimators used by the CSU blended technique to generate Fig. 9 were changed to those in Table 2 in order to more accurately represent the local DSDs sampled in Darwin over several years. The data quality thresholds used by Thompson et al. (2018) for tropical oceans were also used here, so only the coefficients of the R estimators were changed.
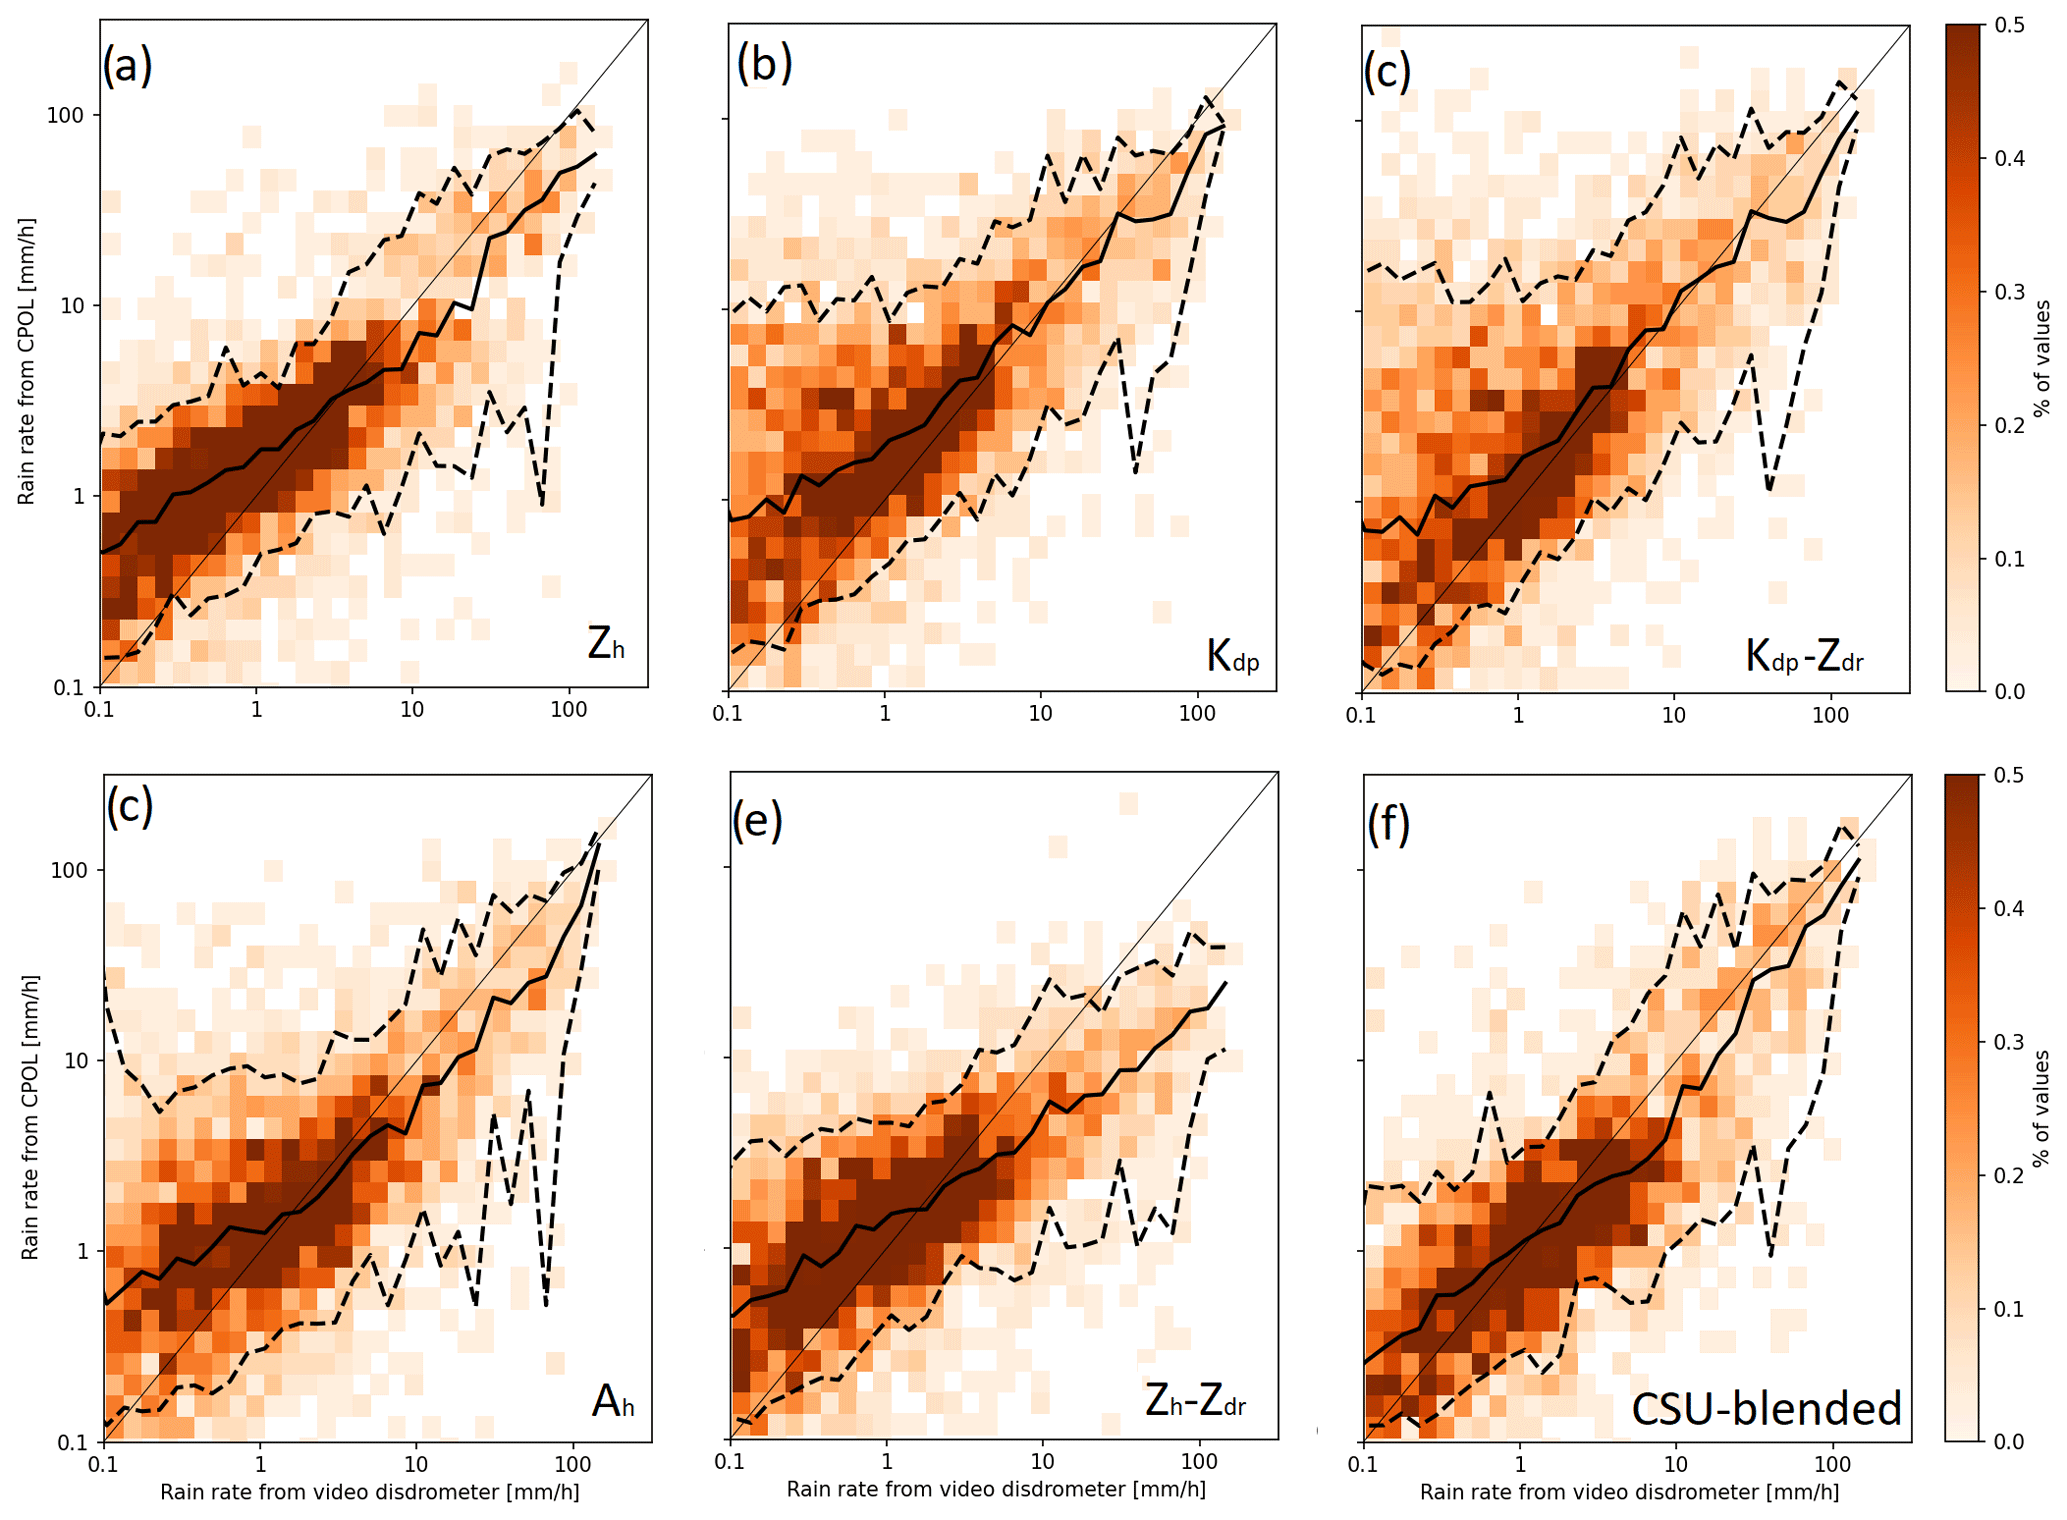
Figure 9Normalized frequency distribution 10 min averages of R estimated from the lowest gate from CPOL over VDIS using given estimators in Fig. 4 as a function of 10 min averages of R recorded by the VDIS. Estimators used to estimate R from CPOL are shown in each panel. Solid lines denote medians, and dashed lines are the 5th and 95th percentiles of the estimated R from CPOL.
The analysis, here, and in previous studies, shows that different microphysical processes likely occur at different ranges of R. Namely, raindrops forming from melting hail are unlikely at but more likely during times when . Therefore, in order to analyze how the agreement between estimated R and VDIS-observed R changes for these different conditions, the mean, and 5th and 95th percentiles of the CPOL estimated R for log-uniformly spaced intervals of VDIS-observed R are shown in Fig. 9. The first focus is on time periods with where stratiform rain and weaker convection are more likely present. While the Kdp-, (Kdp,Zdr)-, and Ah-based estimators are within a factor of 2 of VDIS-observed R (Fig. 9b, c, e), there is greater spread in Fig. 9b, c, d compared to Fig. 9a, e, f. However, the mean R from both the CSU blended technique and the Zh-based estimators is on average 12 % higher than the mean VDIS-observed R (Fig. 9a, f). Consistent with the previous analysis, this again supports the notion that Zh-based estimators, and the modified CSU blended technique, are most appropriate for use in these conditions characterized by stratiform and weak convective rainfall.
Switching focus to analyzing conditions of , in which strong convection that is capable of forming hail that melts into raindrops is much more likely, R values from CPOL calculated from Zh- and (Zh,Zdr)-based estimators underestimate the VDIS-observed R (Fig. 8a, e). On average, the mean estimated R from the modified CSU blended technique is 40 % lower than the mean observed R (Fig. 9f), while the Kdp-estimated R is 28 % lower (Fig. 9c), Ah-estimated R is 52 % lower (Fig. 9d), and Kdp,Zdr-estimated R is 78 % lower (Fig. 9d) for these time periods. However, the spread in Fig. 9f is lower than in Fig. 9c, showing better correlation between the R estimated from the CSU blended technique than R from a single estimator. This therefore demonstrates that R estimated from the CSU blended technique, on average, provides the best agreement with VDIS-observed R for these time periods dominated by stronger convection. The CSU blended technique also gave estimates of R in best agreement with VDIS-observed R for the time periods dominated by stratiform rain and weaker convection. Therefore, this demonstrates that the use of the CSU blended technique, with modifications to the coefficients of the R estimators for Darwin DSDs, provides the optimal estimate of R for the CPOL data in Darwin.
The C-band polarization (CPOL) radar at the U.S. Department of Energy Atmospheric Radiation Measurement (ARM) Tropical Western Pacific (TWP) site in Darwin has been operating for over a decade and thus provides an ample dataset for developing essential rainfall climatologies. These long-term datasets are useful for understanding rainfall variability and for validation of global climate models as well as severe weather forecasts. A crucial quantity in this dataset includes the rainfall rate R. R is not detected directly by radars but is retrieved from radar observables such as radar reflectivity factor Zh, differential reflectivity Zdr, specific differential phase Kdp, and specific horizontal attenuation Ah. R−Ah estimators at the S-band have been successful for the NOAA NEXRAD radars, but studies utilizing ARM C- and X-band scanning radars at the ARM Southern Great Plains site have shown that retrievals using Kdp without Zdr are most successful. Most prior studies are based on limited data compared to the 4-year dataset available from the ARM TWP Darwin site. This, therefore, motivated a study to determine which of these radar observables are most applicable for retrieving rainfall estimates for the CPOL and ARM radars in Darwin. We used a much larger dataset than previous efforts. We first developed R estimators from simulated Zh,s, Zdr,s, Kdp,s, and Ah,s from video disdrometer (VDIS) data in Darwin for C- and X-band radar wavelengths. The VDIS observations generally showed that Darwin rainfall is typically stratiform (in terms of frequency), having median drop diameters D0 less than 1.5 mm at . Rainfall here contributed by convection had D0>1.5 mm for , consistent with past observations in Darwin.
Using the simulated data, we examined which radar quantities would likely provide the most utility in developing rainfall estimates from ARM radars in Darwin using a three-step approach. First, we assessed the parametric uncertainty of each R estimator produced from the VDIS data. We found that estimators that used multiple observables at once, namely (Zh,Zdr) and (Kdp,Zdr), had the lowest parametric uncertainty. Considering constraining rainfall rates by parameters that are related to both the shape of the raindrops (Kdp, Zdr) and the size and number (Zh), it is not surprising that the parametric error in R is lower when multiple radar observables are considered. This result is similar to those obtained from previous studies. Therefore, multiple radar observables are required to develop quality rainfall statistics from ARM radars in Darwin.
Secondly, a principal component analysis (PCA) was conducted on Zh,s, Zdr,s, Kdp,s, and Ah,s from the VDIS DSDs as another metric for determining which quantities had the greatest utility in estimating R. While the importance of Zdr,s and Ah,s was not consistent across wavelengths when , Zh,s was a consistent predictor of R for . Generally, there was a higher number of smaller drops with increasing R in stratiform rain, consistent with crystal aggregation aloft in stratiform rain devoid of melting hail (Thurai et al., 2010; Dolan et al., 2018). Kdp,s and Zdr,s become increasingly important for explaining R variability at . Generally, higher median drop sizes were observed in this regime with mostly convective rainfall where melting hail aloft is more likely to be present (Thurai et al., 2010; Dolan et al., 2018). Therefore, since raindrops become more oblate as they increase in size, the increasing importance of Zdr,s and Kdp,s in determining R is consistent with the presence of larger drops at higher R. In general, the PCA shows that estimators using multiple radar quantities best characterize the variability observed in R in the simulated VDIS data.
For the third step of this assessment, these different R estimators (formed from simulated VDIS radar variables) were tested on point CPOL observations co-located with the VDIS. Each R estimator was tested individually and also in the rain-based branch of the CSU blended algorithm that chooses between estimators based on data quality thresholds (Cifelli et al., 2011; Thompson et al., 2018; Rutledge et al., 2019). Considering single estimators, R estimated from Zh was in best agreement with the VDIS when and R estimated from Kdp and Zdr was when , similar to the choices of estimators used in the CSU blended algorithm. Not surprisingly, from this, the highest-performing estimation techniques for X- and C-band at Darwin were the CSU blended technique for rainfall rates of as well as when . This demonstrates that the CSU blended technique is best for stratiform and weak convective rain as well as strong convection in Darwin. Local R estimators were used in the blended algorithm to more accurately represent DSDs in Darwin. The three steps of this methodology arrive at a consistent conclusion: blended techniques using multiple radar quantities provide the most optimal estimates of R in Darwin due to the wide variability of DSDs observed in Darwin. The methodology used in this study could be used in future studies to quantify uncertainty in R estimation methods.
The code used for the analysis of the CPOL data is available at http://www.github.com/EVS-ATMOS/cmdv-rrm-anl/ (EVS-ATMOS, 2016). The CPOL data can be downloaded from the Atmospheric Radiation Measurement Facility archive at https://www.archive.arm.gov/discovery/ ARM Data Center, 2019. All further datasets are currently available from the authors upon request.
RJ conducted most of the data analysis and contributed greatly to the writing of the manuscript. SC, ET, BD, SG, and DW contributed to many of the research ideas and writing in this paper. VL and AP processed the CPOL data and provided feedback on the writing of the manuscript. SWP provided feedback on the writing of the manuscript.
The authors declare that they have no conflict of interest.
Argonne National Laboratory's work was supported by the U.S. Department of Energy, Office of Science, Office of Biological and Environmental Research, under contract DE-AC02-06CH11357. This work has been supported by the Office of Biological and Environmental Research (OBER) of the U.S. Department of Energy (DOE) as part of the Climate Model Development and Validation activity. NOAA PSL contributes effort with funding from the Weather Program Office's Precipitation Prediction Grand Challenge. The development of the Python ARM radar toolkit was funded by the ARM program part of the Office of Biological and Environmental Research (OBER) of the U.S. Department of Energy (DOE). The work from Monash University and the Bureau of Meteorology was partly supported by the U.S. Department of Energy Atmospheric Systems Research Program through the grant DE-SC0014063. We gratefully acknowledge use of the Bebop cluster in the Laboratory Computing Resource Center at Argonne National Laboratory. The bulk of the code has been written using the open-source NumPy, SciPy, Matplotlib, Jupyter and Dask projects, and the authors are grateful to the authors of these projects. BD contributions are supported by the U.S. Department of Energy Atmospheric Systems Research Program through the grant DE-SC0017977.
This paper was edited by Gianfranco Vulpiani and reviewed by three anonymous referees.
Aydin, K. and Giridhar, V.: C-Band Dual-Polarization Radar Observables in Rain, J. Atmos. Ocean. Tech., 9, 383–390, https://doi.org/10.1175/1520-0426(1992)009<0383:CBDPRO>2.0.CO;2, 1992. a, b
ARM Data Center: https://www.archive.arm.gov/discovery/, last access: December 2019. a
Brandes, E. A., Zhang, G., and Vivekanandan, J.: Experiments in Rainfall Estimation with a Polarimetric Radar in a Subtropical Environment, J. Appl. Meteorol., 41, 674–685, https://doi.org/10.1175/1520-0450(2002)041<0674:EIREWA>2.0.CO;2, 2002. a
Bringi, V. N. and Chandrasekar, V.: Radar rainfall estimation, in: Polarimetric Doppler Weather Radar, Cambridge University Press, Cambridge, UK, 534–569, https://doi.org/10.1017/CBO9780511541094.010, 2001. a, b, c
Bringi, V. N., Chandrasekar, V., Hubbert, J., Gorgucci, E., Randeu, W. L., and Schoenhuber, M.: Raindrop Size Distribution in Different Climatic Regimes from Disdrometer and Dual-Polarized Radar Analysis, J. Atmos. Sci., 60, 354–365, https://doi.org/10.1175/1520-0469(2003)060<0354:RSDIDC>2.0.CO;2, 2003. a, b, c, d, e, f
Bringi, V. N., Williams, C. R., Thurai, M., and May, P. T.: Using Dual-Polarized Radar and Dual-Frequency Profiler for DSD Characterization: A Case Study from Darwin, Australia, J. Atmos. Ocean. Tech., 26, 2107–2122, https://doi.org/10.1175/2009JTECHA1258.1, 2009. a, b, c, d, e, f, g, h
Cifelli, R., Chandrasekar, V., Lim, S., Kennedy, P. C., Wang, Y., and Rutledge, S. A.: A New Dual-Polarization Radar Rainfall Algorithm: Application in Colorado Precipitation Events, J. Atmos. Ocean. Tech., 28, 352–364, https://doi.org/10.1175/2010JTECHA1488.1, 2011. a, b, c, d, e, f, g, h, i
Del Genio, A. D.: Representing the Sensitivity of Convective Cloud Systems to Tropospheric Humidity in General Circulation Models, Surv. Geophys., 33, 637–656, https://doi.org/10.1007/s10712-011-9148-9, 2012. a
Dolan, B., Rutledge, S. A., Lim, S., Chandrasekar, V., and Thurai, M.: A Robust C-Band Hydrometeor Identification Algorithm and Application to a Long-Term Polarimetric Radar Dataset, J. Appl. Meteorol. Clim., 52, 2162–2186, https://doi.org/10.1175/JAMC-D-12-0275.1, 2013. a
Dolan, B., Fuchs, B., Rutledge, S. A., Barnes, E. A., and Thompson, E. J.: Primary Modes of Global Drop Size Distributions, J. Atmos. Sci., 75, 1453–1476, https://doi.org/10.1175/JAS-D-17-0242.1, 2018. a, b, c, d, e, f, g
Doviak, R. J. and Zrnić, D. S.: Precipitation Measurements, in: Doppler Radar and Weather Observations (Second Edition), edited by: Doviak, R. J. and Zrnić, D. S., Academic Press, San Diego, USA, 209–279, https://doi.org/10.1016/B978-0-12-221422-6.50013-9, 1993. a
EVS-ATMOS: cmdv-rrm-anl, GitHub, available at: http://www.github.com/EVS-ATMOS/cmdv-rrm-anl/ (last access: 15 December 2019), 2016. a
Giangrande, S. E., McGraw, R., and Lei, L.: An Application of Linear Programming to Polarimetric Radar Differential Phase Processing, J. Atmos. Ocean. Tech., 30, 1716–1729, https://doi.org/10.1175/JTECH-D-12-00147.1, 2013. a
Giangrande, S. E., Bartholomew, M. J., Pope, M., Collis, S., and Jensen, M. P.: A Summary of Precipitation Characteristics from the 2006–11 Northern Australian Wet Seasons as Revealed by ARM Disdrometer Research Facilities (Darwin, Australia), J. Appl. Meteorol. Clim., 53, 1213–1231, https://doi.org/10.1175/JAMC-D-13-0222.1, 2014a. a, b, c, d, e, f, g, h
Giangrande, S. E., Collis, S., Theisen, A. K., and Tokay, A.: Precipitation Estimation from the ARM Distributed Radar Network during the MC3E Campaign, J. Appl. Meteorol. Clim., 53, 2130–2147, https://doi.org/10.1175/JAMC-D-13-0321.1, 2014b. a, b, c, d, e, f
Giangrande, S. E., Wang, D., Bartholomew, M. J., Jensen, M. P., Mechem, D. B., Hardin, J. C., and Wood, R.: Midlatitude Oceanic Cloud and Precipitation Properties as Sampled by the ARM Eastern North Atlantic Observatory, J. Geophys. Res.-Atmos., 124, 4741–4760, https://doi.org/10.1029/2018JD029667, 2019. a, b, c, d, e, f, g, h, i, j
Golaz, J.-C., Caldwell, P. M., Van Roekel, L. P., Petersen, M. R., Tang, Q., Wolfe, J. D., Abeshu, G., Anantharaj, V., Asay-Davis, X. S., Bader, D. C., Baldwin, S. A., Bisht, G., Bogenschutz, P. A., Branstetter, M., Brunke, M. A., Brus, S. R., Burrows, S. M., Cameron-Smith, P. J., Donahue, A. S., Deakin, M., Easter, R. C., Evans, K. J., Feng, Y., Flanner, M., Foucar, J. G., Fyke, J. G., Griffin, B. M., Hannay, C., Harrop, B. E., Hunke, E. C., Jacob, R. L., Jacobsen, D. W., Jeffery, N., Jones, P. W., Keen, N. D., Klein, S. A., Larson, V. E., Leung, L. R., Li, H.-Y., Lin, W., Lipscomb, W. H., Ma, P.-L., Mahajan, S., Maltrud, M. E., Mametjanov, A., McClean, J. L., McCoy, R. B., Neale, R. B., Price, S. F., Qian, Y., Rasch, P. J., Reeves Eyre, J. J., Riley, W. J., Ringler, T. D., Roberts, A. F., Roesler, E. L., Salinger, A. G., Shaheen, Z., Shi, X., Singh, B., Tang, J., Taylor, M. A., Thornton, P. E., Turner, A. K., Veneziani, M., Wan, H., Wang, H., Wang, S., Williams, D. N., Wolfram, P. J., Worley, P. H., Xie, S., Yang, Y., Yoon, J.-H., Zelinka, M. D., Zender, C. S., Zeng, X., Zhang, C., Zhang, K., Zhang, Y., Zheng, X., Zhou, T., and Zhu, Q.: The DOE E3SM coupled model version 1: Overview and evaluation at standard resolution, J. Adv. Model. Earth Sy., 11, 2089–2129, https://doi.org/10.1029/2018MS001603, 2019. a
Gorgucci, E. and Baldini, L.: Influence of Beam Broadening on the Accuracy of Radar Polarimetric Rainfall Estimation, J. Hydrometeorol., 16, 1356–1371, https://doi.org/10.1175/JHM-D-14-0084.1, 2015. a
Gu, J.-Y., Ryzhkov, A., Zhang, P., Neilley, P., Knight, M., Wolf, B., and Lee, D.-I.: Polarimetric Attenuation Correction in Heavy Rain at C Band, J. Appl. Meteorol. Clim., 50, 39–58, https://doi.org/10.1175/2010JAMC2258.1, 2011. a
Gunn, K. L. S. and Marshall, J. S.: THE EFFECT OF WIND SHEAR ON FALLING PRECIPITATION, J. Meteorol., 12, 339–349, https://doi.org/10.1175/1520-0469(1955)012<0339:TEOWSO>2.0.CO;2, 1955. a
Hardin, J. and Guy, N.: PyDisdrometer v1.0, Zenodo, https://doi.org/10.5281/zenodo.9991, 2017. a, b
Helmus, J. and Collis, S.: The Python ARM Radar Toolkit (Py-ART), a Library for Working with Weather Radar Data in the Python Programming Language, Journal of Open Research Software, 4, e25, https://doi.org/10.5334/jors.119, 2016. a
Jackson, R. C., Collis, S. M., Louf, V., Protat, A., and Majewski, L.: A 17 year climatology of the macrophysical properties of convection in Darwin, Atmos. Chem. Phys., 18, 17687–17704, https://doi.org/10.5194/acp-18-17687-2018, 2018. a, b, c, d
Keenan, T., Glasson, K., Cummings, F., Bird, T. S., Keeler, J., and Lutz, J.: The BMRC/NCAR C-Band Polarimetric (C-POL) Radar System, J. Atmos. Ocean. Tech., 15, 871–886, https://doi.org/10.1175/1520-0426(1998)015<0871:TBNCBP>2.0.CO;2, 1998. a, b, c, d, e
Kirstetter, P.-E., Gourley, J. J., Hong, Y., Zhang, J., Moazamigoodarzi, S., Langston, C., and Arthur, A.: Probabilistic precipitation rate estimates with ground-based radar networks, Water Res. Res., 51, 1422–1442, https://doi.org/10.1002/2014WR015672, 2015. a, b
Kumar, V. V., Protat, A., May, P. T., Jakob, C., Penide, G., Kumar, S., and Davies, L.: On the Effects of Large-Scale Environment and Surface Types on Convective Cloud Characteristics over Darwin, Australia, Mon. Weather Rev., 141, 1358–1374, https://doi.org/10.1175/MWR-D-12-00160.1, 2013. a, b
Leinonen, J.: High-level interface to T-matrix scattering calculations: architecture, capabilities and limitations, Opt. Express, 22, 1655–1660, https://doi.org/10.1364/OE.22.001655, 2014. a
Li, Z., Zhang, Y., and Giangrande, S. E.: Rainfall-Rate Estimation Using Gaussian Mixture Parameter Estimator: Training and Validation, J. Atmos. Ocean. Tech., 29, 731–744, https://doi.org/10.1175/JTECH-D-11-00122.1, 2012. a
Long, C. N., Mather, J. H., and Ackerman, T. P.: The ARM Tropical Western Pacific (TWP) Sites, in: The Atmospheric Radiation Measurement (ARM) Program, edited by: Turner, D. D. and Ellingson, R. G., American Meteorological Society, Boston, MA, 1–7, https://doi.org/10.1175/AMSMONOGRAPHS-D-15-0024.1, 2016. a
Louf, V., Protat, A., Warren, R. A., Collis, S. M., Wolff, D. B., Raunyiar, S., Jakob, C., and Petersen, W. A.: An Integrated Approach to Weather Radar Calibration and Monitoring Using Ground Clutter and Satellite Comparisons, J. Atmos. Ocean. Tech., 36, 17–39, https://doi.org/10.1175/JTECH-D-18-0007.1, 2019. a, b, c, d
Marshall, J. S. and Palmer, W. M. K.: THE DISTRIBUTION OF RAINDROPS WITH SIZE, J. Meteorol., 5, 165–166, https://doi.org/10.1175/1520-0469(1948)005<0165:TDORWS>2.0.CO;2, 1948. a, b
Mather, J. H., Turner, D. D., and Ackerman, T. P.: Scientific Maturation of the ARM Program, in: The Atmospheric Radiation Measurement (ARM) Program, edited by: Turner, D. D. and Ellingson, R. G., American Meteorological Society, Boston, MA, 1–19, https://doi.org/10.1175/AMSMONOGRAPHS-D-15-0053.1, 2016. a
Matrosov, S. Y.: Attenuation-Based Estimates of Rainfall Rates Aloft with Vertically Pointing Ka-Band Radars, J. Atmos. Ocean. Tech., 22, 43–54, https://doi.org/10.1175/JTECH-1677.1, 2005. a, b
Matrosov, S. Y., Cifelli, R., Kennedy, P. C., Nesbitt, S. W., Rutledge, S. A., Bringi, V. N., and Martner, B. E.: A Comparative Study of Rainfall Retrievals Based on Specific Differential Phase Shifts at X- and S-Band Radar Frequencies, J. Atmos. Ocean. Tech., 23, 952–963, https://doi.org/10.1175/JTECH1887.1, 2006. a, b
May, P. T. and Ballinger, A.: The Statistical Characteristics of Convective Cells in a Monsoon Regime (Darwin, Northern Australia), Mon. Weather Rev., 135, 82–92, https://doi.org/10.1175/MWR3273.1, 2007. a, b
May, P. T. and Rajopadhyaya, D. K.: Vertical Velocity Characteristics of Deep Convection over Darwin, Australia, Mon. Weather Rev., 127, 1056–1071, https://doi.org/10.1175/1520-0493(1999)127<1056:VVCODC>2.0.CO;2, 1999. a, b
Mishchenko, M. I., Travis, L. D., and Mackowski, D. W.: T-matrix computations of light scattering by nonspherical particles: A review, J. Quant. Spectrosc. Ra., 55, 535–575, https://doi.org/10.1016/0022-4073(96)00002-7, 1996. a
Nzeukou, A., Sauvageot, H., Ochou, A. D., and Kebe, C. M. F.: Raindrop Size Distribution and Radar Parameters at Cape Verde, J. Appl. Meteorol., 43, 90–105, https://doi.org/10.1175/1520-0450(2004)043<0090:RSDARP>2.0.CO;2, 2004. a
Park, S.-G., Bringi, V. N., Chandrasekar, V., Maki, M., and Iwanami, K.: Correction of Radar Reflectivity and Differential Reflectivity for Rain Attenuation at X Band, Part I: Theoretical and Empirical Basis, J. Atmos. Ocean. Tech., 22, 1621–1632, https://doi.org/10.1175/JTECH1803.1, 2005a. a
Park, S.-G., Maki, M., Iwanami, K., Bringi, V. N., and Chandrasekar, V.: Correction of Radar Reflectivity and Differential Reflectivity for Rain Attenuation at X Band, Part II: Evaluation and Application, J. Atmos. Ocean. Tech., 22, 1633–1655, https://doi.org/10.1175/JTECH1804.1, 2005b. a, b
Rauniyar, S. and Walsh, K.: Spatial and temporal variations in rainfall over Darwin and its vicinity during different large-scale environments, Clim. Dynam., 46, 671–691, https://doi.org/10.1007/s00382-015-2606-1, 2016. a
Rutledge, S. A., Williams, E. R., and Keenan, T. D.: The Down Under Doppler and Electricity Experiment (DUNDEE): Overview and Preliminary Results, B. Am. Meteorol. Soc., 73, 3–16, https://doi.org/10.1175/1520-0477(1992)073<0003:TDUDAE>2.0.CO;2, 1992. a, b
Rutledge, S. A., Chandrasekar, V., Fuchs, B., George, J., Junyent, F., Dolan, B., Kennedy, P. C., and Drushka, K.: SEA-POL Goes to Sea, B. Am. Meteorol. Soc., 100, 2285–2301, https://doi.org/10.1175/BAMS-D-18-0233.1, 2019. a, b, c, d, e, f
Ryzhkov, A. V. and Zrnić, D. S.: Comparison of Dual-Polarization Radar Estimators of Rain, J. Atmos. Ocean. Tech., 12, 249–256, https://doi.org/10.1175/1520-0426(1995)012<0249:CODPRE>2.0.CO;2, 1995. a
Ryzhkov, A. V., Giangrande, S. E., Melnikov, V. M., and Schuur, T. J.: Calibration Issues of Dual-Polarization Radar Measurements, J. Atmos. Ocean. Tech., 22, 1138–1155, https://doi.org/10.1175/JTECH1772.1, 2005. a, b, c, d, e, f, g, h
Ryzhkov, A., Diederich, M., Zhang, P., and Simmer, C.: Potential Utilization of Specific Attenuation for Rainfall Estimation, Mitigation of Partial Beam Blockage, and Radar Networking, J. Atmos. Ocean. Tech., 31, 599–619, https://doi.org/10.1175/JTECH-D-13-00038.1, 2014. a, b, c, d
Sachidananda, M. and Zrnić, D. S.: ZDR measurement considerations for a fast scan capability radar, Radio Sci., 20, 907–922, https://doi.org/10.1029/RS020i004p00907, 1985. a
Sachidananda, M. and Zrnić, D. S.: Rain Rate Estimates from Differential Polarization Measurements, J. Atmos. Ocean. Tech., 4, 588–598, https://doi.org/10.1175/1520-0426(1987)004<0588:RREFDP>2.0.CO;2, 1987. a
Sisterson, D. L., Peppler, R. A., Cress, T. S., Lamb, P. J., and Turner, D. D.: The ARM Southern Great Plains (SGP) Site, in: The Atmospheric Radiation Measurement (ARM) Program, edited by: Turner, D. D. and Ellingson, R. G., American Meteorological Society, Boston, MA, 1–14, https://doi.org/10.1175/AMSMONOGRAPHS-D-16-0004.1, 2016. a
Tang, Q., Klein, S. A., Xie, S., Lin, W., Golaz, J.-C., Roesler, E. L., Taylor, M. A., Rasch, P. J., Bader, D. C., Berg, L. K., Caldwell, P., Giangrande, S. E., Neale, R. B., Qian, Y., Riihimaki, L. D., Zender, C. S., Zhang, Y., and Zheng, X.: Regionally refined test bed in E3SM atmosphere model version 1 (EAMv1) and applications for high-resolution modeling, Geosci. Model Dev., 12, 2679–2706, https://doi.org/10.5194/gmd-12-2679-2019, 2019. a
Testud, J., Oury, S., Black, R. A., Amayenc, P., and Dou, X.: The Concept of “Normalized” Distribution to Describe Raindrop Spectra: A Tool for Cloud Physics and Cloud Remote Sensing, J. Appl. Meteorol., 40, 1118–1140, https://doi.org/10.1175/1520-0450(2001)040<1118:TCONDT>2.0.CO;2, 2001. a
Thompson, E. J., Rutledge, S. A., Dolan, B., and Thurai, M.: Drop Size Distributions and Radar Observations of Convective and Stratiform Rain over the Equatorial Indian and West Pacific Oceans, J. Atmos. Sci., 72, 4091–4125, https://doi.org/10.1175/JAS-D-14-0206.1, 2015. a, b, c, d, e, f, g, h, i, j
Thompson, E. J., Rutledge, S. A., Dolan, B., Thurai, M., and Chandrasekar, V.: Dual-Polarization Radar Rainfall Estimation over Tropical Oceans, J. Appl. Meteorol. Clim., 57, 755–775, https://doi.org/10.1175/JAMC-D-17-0160.1, 2018. a, b, c, d, e, f, g, h, i, j, k, l, m, n
Thurai, M., Bringi, V. N., and May, P. T.: CPOL Radar-Derived Drop Size Distribution Statistics of Stratiform and Convective Rain for Two Regimes in Darwin, Australia, J. Atmos. Ocean. Tech., 27, 932–942, https://doi.org/10.1175/2010JTECHA1349.1, 2010. a, b, c, d, e, f, g
Tokay, A. and Short, D. A.: Evidence from Tropical Raindrop Spectra of the Origin of Rain from Stratiform versus Convective Clouds, J. Appl. Meteorol., 35, 355–371, https://doi.org/10.1175/1520-0450(1996)035<0355:EFTRSO>2.0.CO;2, 1996. a, b, c, d
Ulbrich, C. W. and Atlas, D.: Rainfall Microphysics and Radar Properties: Analysis Methods for Drop Size Spectra, J. Appl. Meteorol., 37, 912–923, https://doi.org/10.1175/1520-0450(1998)037<0912:RMARPA>2.0.CO;2, 1998. a
Vulpiani, G., Giangrande, S., and Marzano, F. S.: Rainfall Estimation from Polarimetric S-Band Radar Measurements: Validation of a Neural Network Approach, J. Appl. Meteorol. Clim., 48, 2022–2036, https://doi.org/10.1175/2009JAMC2172.1, 2009. a
Wang, D., Giangrande, S. E., Bartholomew, M. J., Hardin, J., Feng, Z., Thalman, R., and Machado, L. A. T.: The Green Ocean: precipitation insights from the GoAmazon2014/5 experiment, Atmos. Chem. Phys., 18, 9121–9145, https://doi.org/10.5194/acp-18-9121-2018, 2018. a, b, c, d, e, f, g, h, i
Wang, H., Easter, R. C., Rasch, P. J., Wang, M., Liu, X., Ghan, S. J., Qian, Y., Yoon, J.-H., Ma, P.-L., and Vinoj, V.: Sensitivity of remote aerosol distributions to representation of cloud–aerosol interactions in a global climate model, Geosci. Model Dev., 6, 765–782, https://doi.org/10.5194/gmd-6-765-2013, 2013. a, b
Williams, E. R., Geotis, S. G., Renno, N., Rutledge, S. A., Rasmussen, E., and Rickenbach, T.: A Radar and Electrical Study of Tropical “Hot Towers”, J. Atmos. Sci., 49, 1386–1395, https://doi.org/10.1175/1520-0469(1992)049<1386:ARAESO>2.0.CO;2, 1992. a, b
Wolff, D. B., Marks, D. A., and Petersen, W. A.: General Application of the Relative Calibration Adjustment (RCA) Technique for Monitoring and Correcting Radar Reflectivity Calibration, J. Atmos. Ocean. Tech., 32, 496–506, https://doi.org/10.1175/JTECH-D-13-00185.1, 2015. a
- Abstract
- Copyright statement
- Introduction
- Datasets
- DSD observations and simulated radar variables from DSD
- Assessment of applicability of different power-law retrievals
- Comparisons of CPOL retrievals with VDIS
- Conclusions
- Code and data availability
- Author contributions
- Competing interests
- Financial support
- Review statement
- References